Article

Small-Signal Modeling and Stability Analysis of a Grid-Following Inverter with Inertia Emulation

by
Matheus Schramm Dall’Asta
* and
Telles Brunelli Lazzarin
Department of Electrical and Electronic Engineering, Federal University of Santa Catarina, Florianópolis 88040-900, Brazil
*
Author to whom correspondence should be addressed.
Energies 2023, 16(16), 5894; https://doi.org/10.3390/en16165894
Submission received: 30 June 2023 / Revised: 28 July 2023 / Accepted: 2 August 2023 / Published: 9 August 2023

Abstract

:
Power-converter-based energy-harvesting and storage systems are becoming more prevalent in the electrical grid, replacing conventional synchronous generators. Consequently, grid inertia is diminishing, and to address this, inverter-based energy conversion systems are required by grid codes to provide frequency control support to the main grid. This is undertaken to increase the equivalent inertia of the system and reduce frequency variations. This type of control is necessary and designed for handling large system transients. However, it also impacts the small-signal stability of the grid-connected converters. To investigate this issue, this paper addresses the influence of synthetic inertia control on the output admittance of a grid-following inverter and its interaction with the grid equivalent impedance. A synchronous reference frame dynamic model of the grid-following inverter closed-loop system is obtained and linearized at an operating point to analyze the small-signal stability of the low-switching frequency inverter. The models are validated through numerical simulations. The analysis verifies the interactions of the internal control loops, such as the AC current control with voltage feedforward, DC-link voltage control with power-feedforward, phase-locked loop, and AC voltage control with inertial control. Additionally, the interactions between the output admittance of the inverter and the grid impedance are verified using the generalized Nyquist criterion. The stability regions are validated through simulations, and the results show that the system gain margin is reduced for increasing values of synthetic inertia gain and lower grid short-circuit ratios. Furthermore, there is a limit in the voltage and power-feedforward bandwidth to avoid degrading the system stability when utilizing the synthetic inertia control.

1. Introduction

New energy-harvesting and processing schemes are reshaping the electrical grid, with grid-connected inverters now serving as essential interfaces between renewable energy sources (RES) [1,2] or energy storage systems (ESS) [3] and the grid, replacing conventional synchronous generators [4]. An electrical grid composed of direct connected synchronous generators is referred to as “conventional” and offers a natural and instantaneous response against power imbalances [5]. The kinetic energy stored in the generators’ rotors acts as a fast energy buffer, absorbing or supplying energy in response to frequency changes. This property is referred to as the system’s inertia [5]. However, when power-electronics-interfaced generation is integrated into the grid, energy buffers, such as wind turbine rotors, DC-link capacitors, and batteries, do not naturally release or absorb energy by facing grid frequency variations. Due to this behavior, the system’s inertia is reduced, resulting in increased frequency excursions [6]. Consequently, this situation can lead to problems related to the rate of change of frequency (ROCOF), in which high values threaten the security of synchronous generators and may trigger load-shedding schemes [7]. This highlights the importance of considering the inertia capability of grid-connected converters to maintain grid frequency stability [8].
Power converters may incorporate a non-natural inertia response called inertia emulation, synthetic inertia, or virtual inertia [9]. This approach mimics the natural behavior of a synchronous generator by employing a control law with various solutions based on the power-electronics system’s characteristics [10]. One common control mode sets an additional power reference proportional to the ROCOF at the point of connection, emulating the natural response of a synchronous generator [11]. Other solutions involve adjusting the power reference based on frequency deviation [12,13] and implementing additional or reduced constant power control following under/overfrequency events [10]. To enable these capabilities, these methods require an energy buffer or power deloading operation, allowing for flexible power exchange between the converter and the grid. The energy stored in DC-link capacitors, wind turbine rotors, battery energy storage systems (BESS), and other similar energy buffers facilitates this adaptability. Additionally, power deloading can also be achieved in wind and photovoltaic generation systems [14].
The frequency response of power converter-based systems does not accurately mirror that of a synchronous generator due to limited rate of change of power (ROCOP) [15], control loops computation delay, and size of energy buffer [16]. Transient analyses of non-linear systems are typically conducted during significant system perturbations, focusing on wind energy conversion systems, BESS, and photovoltaic generation [4]. However, these analyses often overlook the fast dynamics of the converters and emphasize the impact of power and speed controllers [17,18]. As an additional controller within the converter structure, the analysis of inverter internal small-signal stability with synthetic inertia capability is a relatively new and emerging area for stability studies [14,19,20,21,22,23].
The commonly used control approaches in grid-connected inverters are the grid-following (GFL) and the grid-forming (GFM), whose operation modes are dual seeing by the grid [24]. The GFL determines the output current angle reference of the inverter based on the angle estimation by a synchronism loop at the point of connection voltage. The GFM generates the angle internally and synchronizes with the grid through a power loop control [25]. Typically, renewable energy conversion systems operate either in the maximum power point tracking (MPPT) operation or in the power saturation region, and the GFL is employed in these cases.
Small-signal stability analysis of GFL inverters is a significant focus of research in power converters systems [26,27,28,29,30,31]. Studies cover dynamics modeling and stability analysis of various aspects, including the impact of the harmonic filter, current control, DC-link voltage control, AC amplitude voltage control, power control, and grid-angle synchronism, as outlined in Table 1. These analyses typically represent the models in the synchronous reference frame using the Park transformation (DQ-frame). Two techniques are commonly applied to assess the small-signal stability of a grid-connected converter: eigenvalues and impedance-based methods [32]. The first technique is based on the analysis of a space-state representation, which requires complete knowledge of the system and grid characteristics, then stability is guaranteed if there are no poles in the right half-plane. The impedance technique requires the output characteristic of the inverter and the grid, which can be obtained analytically or by measurements, which is more accessible for unknown grid conditions. Therefore, the stability can be assessed by either analyzing the output impedance/admittance bode diagrams with a passivity-based criterion [26] or by employing the Nyquist criterion [33].
In a grid-following inverter, the current control is the inner control loop, which has a fast dynamic with a cut-off frequency much higher than the fundamental frequency. Traditionally, a proportional-integral (PI) controller with decoupling terms is used, though some converters may also include a voltage feedforward controller [27]. As power converters for renewable applications have reached the power of MW [1], the power converters should operate at lower switching frequencies to reduce switching losses. Therefore, due to the low sampling frequency and digital control, there is a time-delay in the current-control loop that cannot be overlooked. It has been reported that the computational delay affects the system dynamics in the DQ-frame, which can be reduced by including a decoupling loop [34,35]. The time delay mainly influences the fast dynamics, as the output inductance decoupling matrix [36], the current-control loop [31] and the operation of interleaved converters [37].
In the grid-following converter control system, the angle reference is obtained through a synchronism algorithm, playing a significant role in the instability issues [28,38]. The most common synchronism technique is the phase-locked loop (PLL) algorithm [39], which estimates the grid’s angle from the point-of-common-coupling (PCC) voltage. Other techniques have been considered in small-signal analysis, such as the power synchronization (PS) [30] and the frequency-locked loop (FLL) [14].
In renewable energy-based systems aiming for the maximum power point, the system might assume two outer control loops: (i) the inverter controls the DC-link and the first stage controls the power or (ii) the inverter controls the MPPT and the first stage controls the DC-link voltage [29]. Power-feedforward controllers may be employed to avoid DC-link overvoltages during large transients [28].
It should be highlighted that the synthetic inertia control adds an extra layer to the system, combining the MPPT power reference with a term proportional to the grid frequency derivative (ROCOF). However, this modifies the closed-loop small-signal model of the system. Although a few research studies have explored the implications of this control approach [14,19,20,21,22,23], there is a lack of analysis on how synthetic inertia impacts the small-signal stability of an inverter when the reference power is added to the DC-bus input power. Table 1 shows an overview of the primary references for small-signal stability analysis of a grid-following inverter and what control and plant models each one approaches. It should be noted a lack of analysis on how synthetic inertia impacts small-signal stability considering all levels of control loops. Therefore, this research explores an alternative small-signal stability analysis of a grid-following inverter with synthetic inertia capability. It focuses on answering the following questions:
  • How does the synthetic inertia control interact with other control loops in small-signal dynamics?
  • How can the inverter-grid stability be guaranteed by understanding the relation between the synthetic inertia control and grid characteristics?
The analysis in this research stands out from other studies [14,19,20,21,22,23] by taking into account the variation of synthetic-inertia-based power in the input of the DC-bus. This power can be provided from various sources, such as a rectifier stage of a wind turbine conversion system (WECS), a DC-DC stage from an ESS, or a photovoltaic system with deloading operation. Additionally, the study goes further by evaluating the impact of feedforward controllers in combination with synthetic inertia, an aspect that has not been addressed by previous studies, and by analyzing the system stability through the generalized Nyquist criterion [33] in the continuous frequency domain.
The sections are organized as follows: Section 2 presents the system modeling and controllers in the synchronous reference frame, including the linearization around an operating point and the corresponding transfer functions. Section 3 analyzes the control loops and the influence of parameters on system stability and time-domain responses. Section 4 assesses the stability of the grid-connected inverter using the generalized Nyquist criterion. Finally, Section 5 provides the main conclusions of the study.

2. System Modeling

The inverter-based system under study is presented in Figure 1. The topology is composed of a three-phase, three-level neutral-point-clamped voltage source converter, a DC-link capacitor, a constant power source that models the generated power, and an output filter. The control diagram is composed of an inner current-control loop, the DC-side and AC-side amplitude outer voltage control loops, the PLL, and the inertia emulator.
The following subsections present the models of each subsystem and the respective linearized models around an operating point. The considerations taken into account are: the inductor and capacitors are chosen so that the current and voltage ripple can be neglected; the switches are ideal, no dissipative, and switch instantly; and the modulator and control are modeled considering a time delay of  T d . The model is obtained in the synchronous reference frame through the Park transformation, whose matrix  T  is defined as [40]:
T ( θ ) = 2 3 cos ( θ ) cos θ 2 π 3 cos θ + 2 π 3 sin ( θ ) sin θ 2 π 3 sin θ + 2 π 3 1 2 1 2 1 2 ,
in which  θ  is the transform reference angle. The relation between a vector of variables  x  represented in the stationary ( x abc ) and in the synchronous reference frames ( x dq 0 ) are given by
x dq 0 = T ( θ ) · x abc .
For the analysis, the system variables in DQ-frame are referenced to the grid angle  θ s  and identified by a superscript “s” ( x s ). The control variables are referred to as the PLL angle  θ c  and identified by a superscript “c” ( x c ), whereas the reference control variables are identified by a superscript “r” ( x r ). The variables  x a , x b , x c  in the abc-frame are represented by a vector  x abc = x a x b x c T  and the variables  x d , x q , x 0  in the dq0-frame are represented by a vector  x = x d x q x 0 T . For the control-oriented modeling, the zero component is often overlooked; therefore, the representation is given in the DQ-frame as  x = x d x q T .

2.1. Inverter

The inverter is analyzed considering that the output inductances and resistances are balanced among all the phases. From Figure 1, the dynamic equations for the output currents in the stationary reference frame are written as:
L d d t i abc = v i , abc R i abc v abc v g m u ,
where  i abc  is the vector with the three-phase currents, L is the output inductance and R is its equivalent series resistance,  v i , abc  is the inverter voltage vector referred to the DC-link middle point,  v abc  is the PCC voltage vector,  v g m  is the ground-middle point voltage and  u = 1 1 1 T  is a unitary vector. Using (2) in (3) and multiplying both left sides of the equation by  T  results in:
L T d d t T 1 i dq 0 = v i , dq 0 R i dq 0 v dq 0 v g m T u .
The left side of (4) is solved considering the fact that the transformation matrix  T  is time-varying because of the reference angle  θ = ω t , and the obtained result is
L T d d t T 1 i dq 0 = ω L i qd 0 + L d d t i dq 0 ,
where the vector  i qd 0  is defined as  i qd 0 = i q i d i 0 T . The last term of the right side of (4) results in  v g m T u = 0 0 v g m T . Considering a control-oriented analysis, the zero-component will be neglected and the dynamic equations that describe the average values of the direct and quadrature currents through the output inductors in the synchronous reference frame (DQ-frame) are obtained by applying (5) in (4):
L d d t i d = v i d + ω L i q R i d v d L d d t i q = v i q ω L i d R i q v q ,
where  i d  and  i q  are the direct and quadrature output currents and  ω  is the system angular frequency. As this is a three-phase three-wire system, there are no zero-sequence currents; therefore, the zero sequence is neglected in the synchronous reference frame representation. As these equations are non-linear, the Laplace transform is applied in the linearized equations around an operating point using Taylor’s series ( ω = Ω i d = I d i q = I q v i d = V i d v i q = V i q v d = V d  and  v q = V q ) and neglecting constant and second-order or higher terms, which results in the transfer function model:
i s = G iv i v i s + G iv v s .
Here the variations of the output frequency  ω  are neglected. As the variables  i v i  and  v  are all two-element vectors, the matrices  G iv i  and  G iv  are 2 × 2 and composed by four transfer functions each:
G iv i = G iv = 1 ( s L + R ) 2 + ( Ω L ) 2 s L + R Ω L Ω L s L + R .
The equations in (8) show the coupling between direct and quadrature components in the synchronous reference frame. The coupling terms depend mainly on the inductance and on the grid frequency values. Therefore, whenever the output frequency is non-null there is a coupling term between direct and quadrature variables.

2.2. Modulation and Delay

A pulse-width-modulation is applied to the voltage source converter. Considering a digital implementation, there is a delay associated with the computational time and modulation update, whose maximum value is considered to be 1.5 times the sampling period ( T s ) [41]. Therefore, the equation that describes the inverter voltage as a function of the modulating signal and the DC-link voltage is
v i , abc = v d c 2 m abc ( t T d ) ,
where  T d = 1.5 T s  is the computational delay and  v d c = v p + v n  is the DC-link voltage. By applying (2) in (9) and multiplying both left sides by  T ( θ ( t ) ) , it results in the equivalent equation in the synchronous reference frame:
v i s = v d c 2 T ( θ ( t ) ) T ( θ ( t T d ) ) 1 R ( θ θ ( t T d ) ) m ( t T d ) ,
where  θ  is the reference angle and  R  is a rotating matrix that is a consequence of the time delay  T d  from  m a b c . This matrix is obtained as
R ( θ ) = cos ( θ ) sin ( θ ) sin ( θ ) cos ( θ ) .
In steady-state operation, the angle is defined as  θ ( t ) = Ω t ; therefore,  θ ( t ) θ ( t T d ) = Ω T d . Applying a first-order linearization in (10) around an operating point ( m d = M d m q = M q v d c = V d c  and  ω = Ω ), considering that  θ ( t ) = Ω t  and then applying the Laplace transform, the frequency-domain equation is obtained:
v i s = 1 2 R ( Ω T d ) M G v i v dc v d c + V d c 2 e s T d R ( Ω T d ) G v i m m .
As expected, (12) shows that the inverter voltage depends on the DC-link voltage and on the modulation index. Furthermore, (12) contains a time-delay related coupling ( R ( Ω T d ) ), which means the digital modulation and control delay also contribute to additional coupling in the synchronous reference frame. Please note that the transfer function  G v i m  also contains the term  e s T d , which is associated with the delay in the time-domain.

2.3. Phase-Locked Loop

The grid-following operation mode requires the inverter to synchronize with the grid. This is achieved using a synchronous reference frame phase-locked loop (SRF-PLL) algorithm [39]. The equation that describes the relation between the voltage vector in the control frame and in the system frame is
v c = R ( Δ θ ) v s ,
where  Δ θ  is the difference between the estimated grid angle by the PLL ( θ c ) and the system reference angle ( θ s ). The linearized version of (13) around an operating point ( v d = V d v q = V q  and  Δ θ = Δ Θ ) is given as follows:
v c = R ( Δ Θ ) v s + R Δ Θ + π 2 V s Δ θ .
It should be noted from (14) that small variations in the grid angle also affect the estimated voltage  v c , especially in the quadrature axis. The estimated angle error is written as a function of the input quadrature voltage and the proportional-integral controller:
Δ θ = K p p + K i p s P I p 1 s · v q c ,
where  P I p  is the transfer function of a proportional-integral controller. By applying (15) in (14), the following equation is obtained:
Δ θ = P I p s + P I p · cos ( Δ Θ ) V d s + sin ( Δ Θ ) V q s ) · sin ( Δ Θ ) cos ( Δ Θ ) G PLL v s ,
which represents the small-signal relation between the PCC voltage  v s  and the estimated angle  Δ θ . By substituting (16) in (14) results in
v c = R [ Δ Θ ] + R Δ Θ + π 2 V · G PLL G PLL v v s ,
which establishes the relation between the voltage vector in the system frame and in the control frame. It should be noted that the estimated voltage variations occur only for voltage variations on the PCC. Similar analyses can be performed to obtain the relations for the current and modulating signals, whose results are given as follows:
m s = R ( Δ Θ ) m c + R Δ Θ π 2 M c G PLL G PLL d v s
and
i c = R ( Δ Θ ) i s + R Δ Θ + π 2 I s · G PLL G PLL i v s .
Equations (17)–(19) represent the small-signal dynamics among system and control variables. Please note that both the current and the modulating function also depend on the PCC voltage and the direct and quadrature coordinates are cross-coupled.

2.4. Current Control

The output current-control loop employs proportional-integral-derivative (PID) and feedforward controllers. From (6) and (10), the steady-state value for the modulating signal is
m ( t T d ) = 2 V d c R ( Ω T d ) v s + R Ω L Ω L R i s .
Based on this relation, the open-loop values of the modulation signals in the control frame are obtained from the feedforward control given as
m ff = 2 V d c R ( Ω T d ) G iff w f f w f f ω f f s + ω f f 1 0 0 1 G vff v c + R Ω L Ω L R G dec i c w f f w f f ,
in which  G vff  corresponds to a low-pass filter for the voltage feedforward,  G dec  is the current decoupling matrix and  G iff  contains the time-delay decoupling term and the DC-link voltage normalization. As shown in (21), the feedforward control uses both the output current as well as the output voltage to generate the modulation reference. Both decoupling terms would ideally eliminate the cross-coupling between the direct and quadrature axis if the modulation time delay were null. However, as the digital control is always delayed, the feedforward control produces a reference error. The effects from the time delay, non-idealities, and modeling mismatches are addressed using an output current feedback control, which is given as:
m fb = K p i + K i i s + s K d i 1 + s T d i 0 0 K p i + K i i s + s K d i 1 + s T d i G ifb i r i c ,
in which  i r  is the reference current vector in control frame and  K p i , K i i  and  K d i  are the gain values of a proportional-integral-derivative (PID) controller. The resulting modulation index in the control frame is given by summing the output from both feedforward and feedback controllers:
m c = m ff + m fb .
The current control is defined as the inner control loop, whose dynamics do not depend on the DC-link voltage. Moreover, it is designed with a wider frequency band; therefore, its response is faster than the voltage controllers.

2.5. DC-Link Dynamic Modeling

The dynamic equation for the DC-link voltage considers the left side of the DC-link as a controlled power source and that the DC-bus capacitors have capacitance values equal to C. Therefore, the voltage dynamic equations are written as:
C d d t v p = i d c i p C d d t v n = i d c + i n .
The sum of both equations in (24) results in the equivalent dynamic model for the total DC-link voltage:
C d d t v d c = C d d t v p + C d d t v n = 2 i d c ( i p i n ) ,
where the currents difference  i p i n  is obtained by
i p i n = m abc ( t T d ) T i abc .
Thus, by substituting the positive and negative DC-link currents (26) in the dynamic equation for the DC-link voltage (25) results in
C 2 d d t v d c = i d c 1 2 m abc ( t T d ) T i abc .
Applying the Park transformation (2) in the last term of (27) and considering the time-delay effect results in:
C 2 d d t v d c = p d c v d c 3 4 m ( t T d ) T R 1 ( θ ( t ) θ ( t T d ) ) i s .
It should be noted that there is a delay between the modulation signal and the actual gates signals to switch the semiconductor devices, which results in the rotatory matrix  R  in (28). Linearizing the equation around an operating point by taking only the first-order terms from Taylor’s series and applying the Laplace transform results in
v d c = G v dc 2 V d c G v dc p p d c G v dc 3 2 I s T R ( Ω T d ) e s T d G v dc m m s G v dc 3 2 M T R ( Ω T d ) G v dc i i s ,
where  G v dc = s C + 2 P d c V d c 2 1 . It should be noticed the influence of the time-delay on the transfer functions relating to the modulation signal. Furthermore, the delay effects also add a coupling between direct and quadrature currents on the DC-link voltage. It is shown in (29) that the DC-link voltage small-signal variation is a function of the input power, the output current, and the modulators.

2.6. Voltage Control

The inverter also controls the DC-link voltage, assuming that an MPPT-based rectifier provides energy to the DC-bus. The voltage error is compensated for by a proportional-integral (PI) controller and the result is added to the rectifier estimated active power to generate the inverter active power reference, as follows:
p r = K p v + K i v s P I v v d c v d c r + ω p s + ω p p d c .
The reference voltage is given by  v d c r v d c  is the measured voltage,  p d c  is the rectifier power and  ω p  is the cut-off angular frequency of the feedforward controller. Thus, the active reference power is generated by the DC-link voltage control.
An AC-side voltage control is also used to generate the reactive power reference for the inverter through a voltage/reactive power droop control, which is given as
q r = Q 0 3 2 | v c | V 0 R q ,
where  R q  is the droop constant, given by the ratio between the maximum line voltage and reactive power variations.  Q 0  and  V 0  represent the center values of the reactive power and the output line voltage. The power references are written as a vector from the linearization of (30) and (31) around an operating point:
pq r = ω p s + ω p 0 G p r p p d c + P I v 0 G p r v dc v d c v d c r + 0 0 1 R q 3 2 V d c | V c | 1 R q 3 2 V q c | V c | G p r v v c .
After obtaining the active and reactive power references, the current references are computed using the estimated voltage values and the instantaneous active and reactive power references, as follows:
i r = 2 3 1 | v c | 2 v d c v q c v q c v d c · p r q r .
The linearization of (33) gives the following expression, which is used for the stability analysis:
i r = 2 3 1 | V c | 2 V d c V q c V q c V d c G i r p pq r + 2 3 1 | V c | 2 2 V d c V q c ( V d c ) 2 ( V q c ) 2 ( V d c ) 2 ( V q c ) 2 2 V d c V q c Q r P r P r Q r G i r v v c .
The expression (34) shows the small-signal relation between the estimated PCC voltage, the active and reactive power references, and the reference currents.

2.7. Frequency Control Support

As the system might process the power generated from an intermittent energy resource, the input stage operates with an MPPT control. However, it can still provide some frequency control support by emulating the dynamic response of a classic synchronous generator. It is necessary to estimate the grid frequency, which is given as follows [23]:
ω c = K i p v q c d t ,
and the inertia emulation is provided by the following controller represented in the frequency domain:
p i = K i s 1 + s T f ω c ,
where  K i  is the emulated inertia gain and  T f  is the low-pass filter time constant. By applying the Laplace transform in (35) and substituting in (36), the relation between the estimated frequency and the emulated power for the inertial response is given by
p i = K i K i p 1 1 + s T f G pv v q c ,
which means that the power variation given by the inertial control is, in fact, proportional to the quadrature voltage variation in the control frame.

2.8. Model Validation

The small-signal model was validated through simulation in MATLAB-Simulink, comparing the switched model and both non-linear and linearized average models. The inverter output current  i d  is depicted in Figure 2 for step variations on the inverter voltage of +0.025 pu for both direct ( v d ) and quadrature ( v q ) components. It is observed that, despite the high-frequency oscillations, the average models follow the response of the switched model. Therefore, the obtained linearized model is used to analyze the small-signal stability around an operating point.

3. Control Design

The grid-following inverter operates by controlling the output current, the DC-link voltage, and the output voltage amplitude. As an addition, the DC-link input power also includes the reference from the synthetic inertia. The next subsections show some aspects to assess the stability and the impact of each part of the controllers.

3.1. Current Control

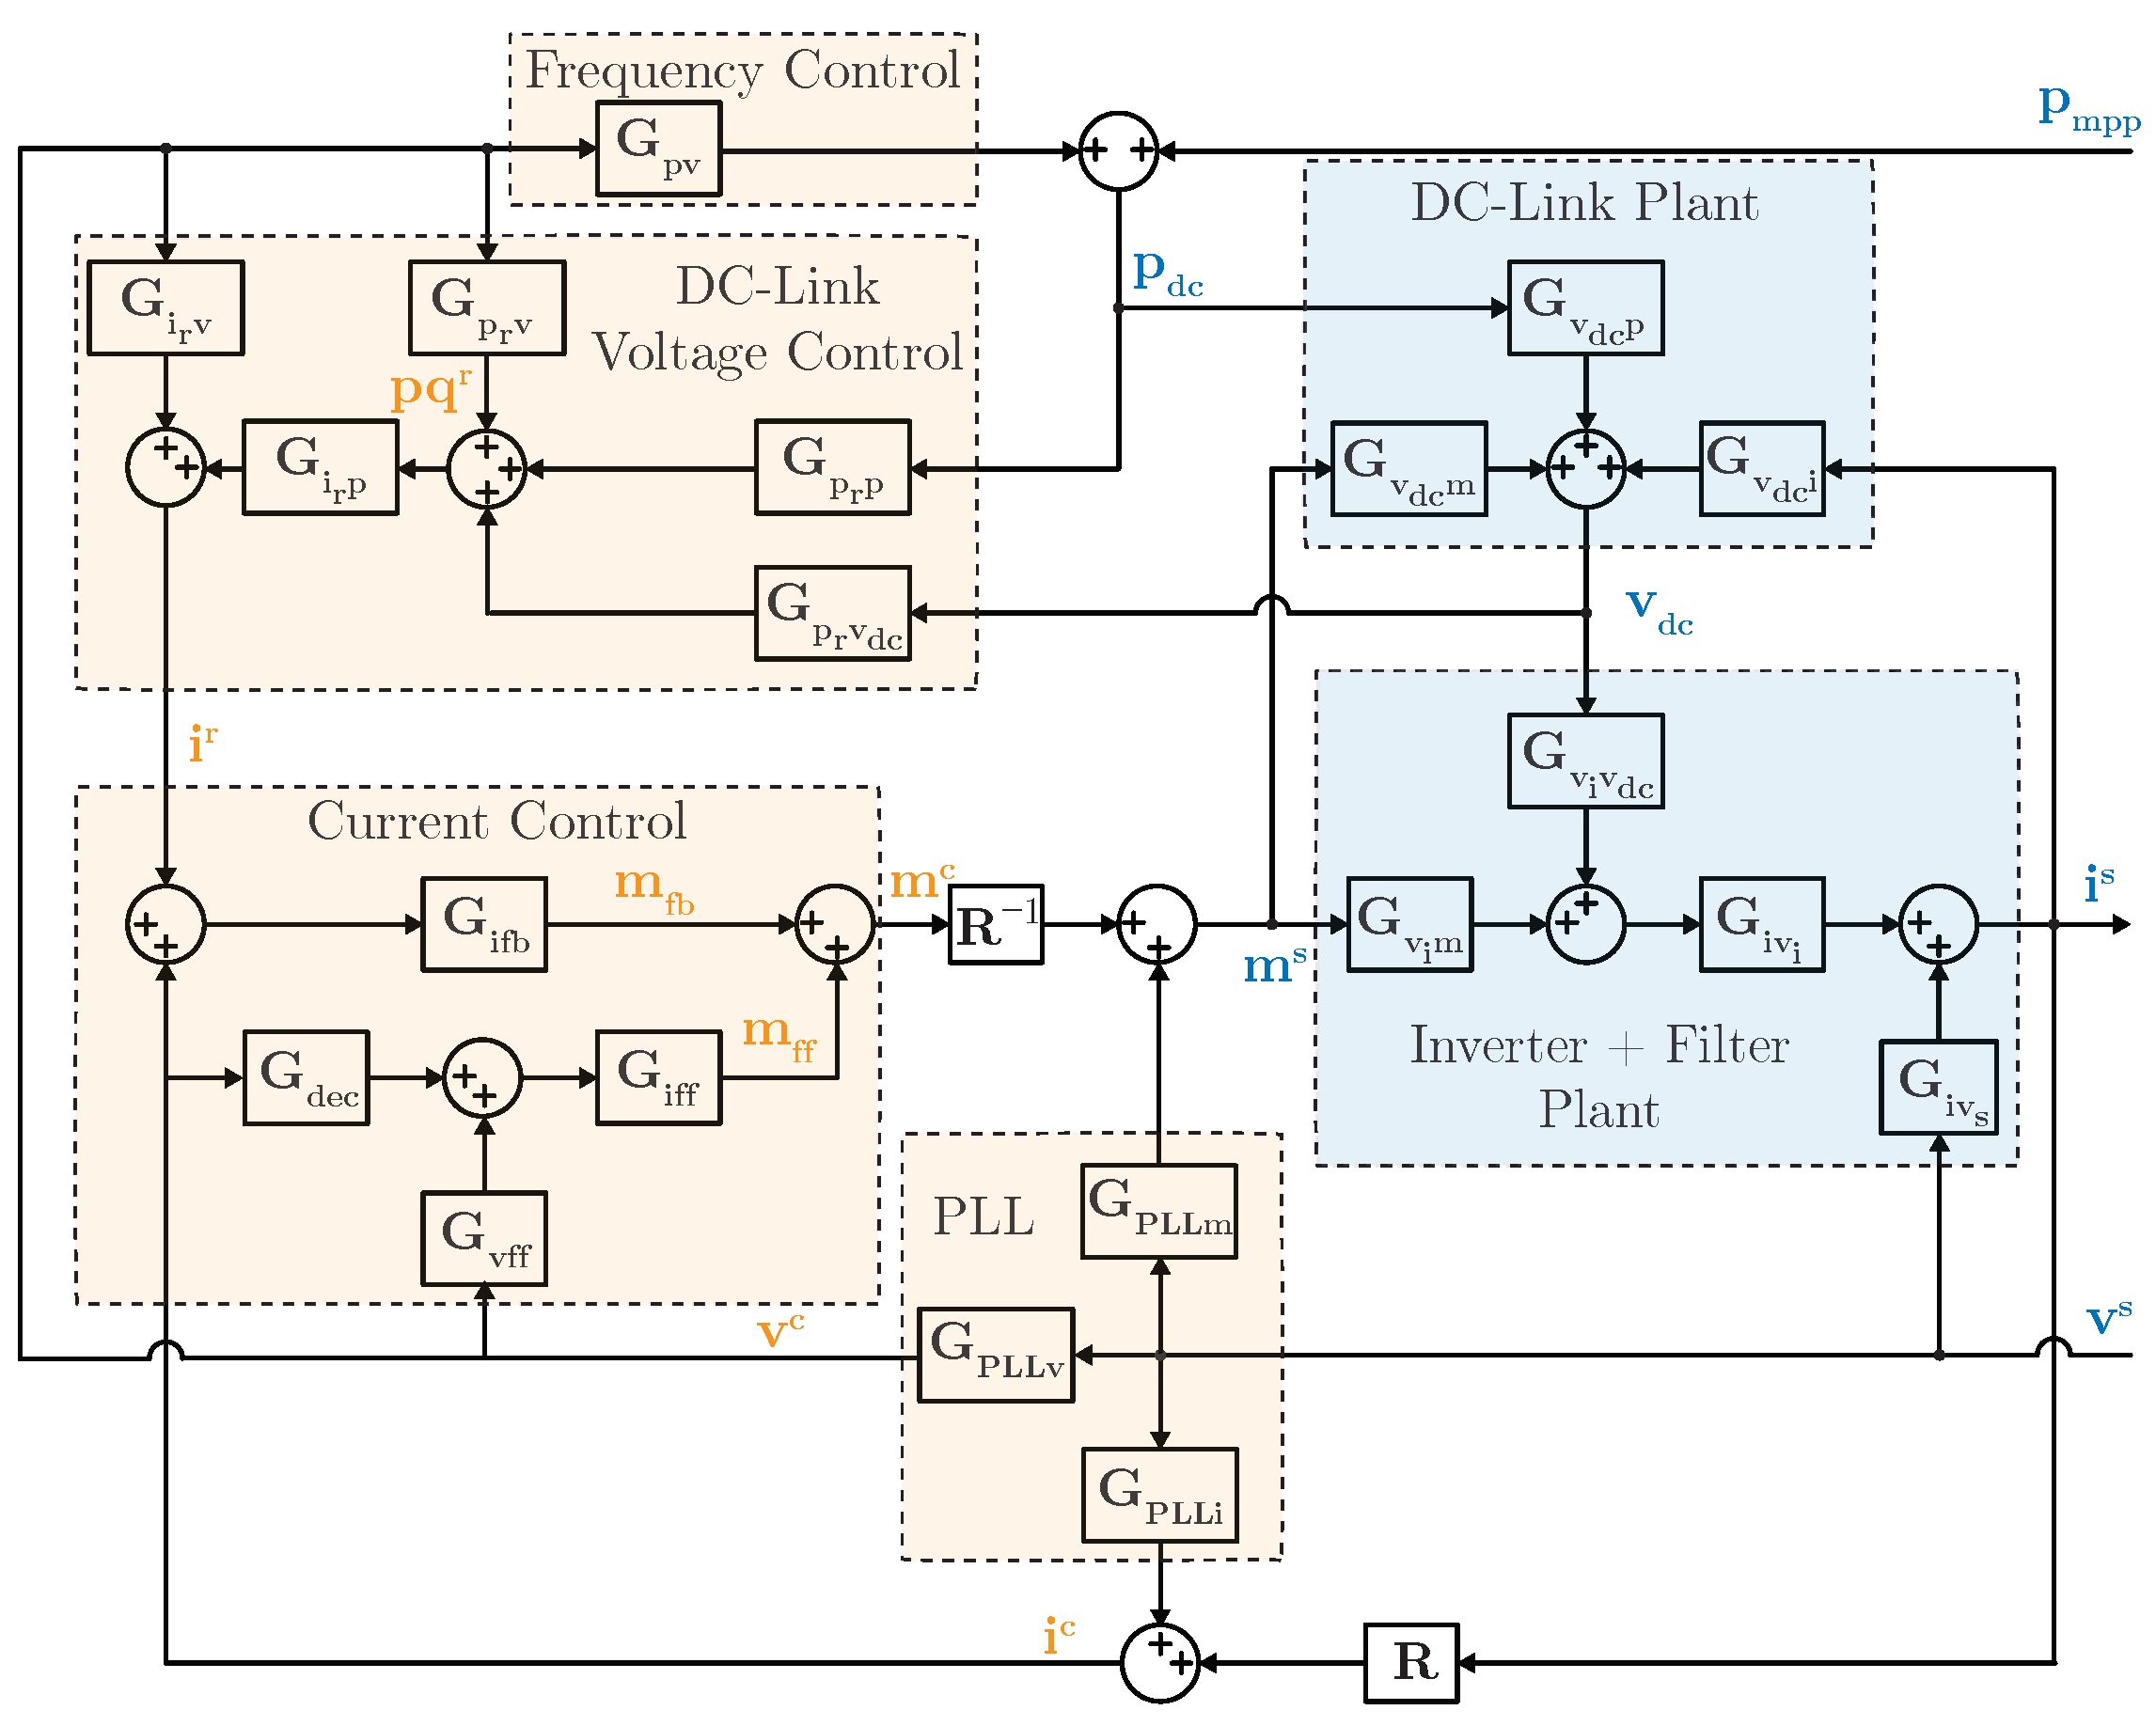
The block diagram for the current control is given in Figure 3, where the only input variable is the reference current  i r  and the linear model of the system is represented in the frequency domain. The control output consists of a feedback ( m fb ) and a feedforward ( m ff ) signal. The outer control loops are neglected because they do not interfere with the inner control loop stability.
By applying matrix and block diagram algebra, the equation that relates the output current vector  i s  with the reference current  i r  is obtained as
i s = ( I 2 + G iv i G v i m R 1 G ifb G iff G dec R G iol ) 1 G iv i G v i m R 1 G ifb i r ,
where  I 2  is a 2 × 2 identity matrix and  R = R ( Δ Θ pll )  is the rotation matrix given by the difference between the control and the system reference angles. Therefore, the open-loop matrix of transfer functions
G iol = G iv i G v i m R 1 G ifb G iff G dec R
should satisfy the generalized Nyquist criterion to guarantee system stability.
The parameters for the current-control loop are listed in Table 2 in per unit values. The base values for voltages and currents are equal to the AC-side rated values in the synchronous reference frame. The parameter values were chosen to guarantee stability margins and provide fast and low overshoot responses for a reference step.
Figure 4, Figure 5 and Figure 6 summarize the effects of the parameters for a step of +0.01 pu on the direct current reference. Figure 4 presents the comparison with and without the  ω L  decoupling matrix ( G dec ) for the feedforward control. With the decoupling matrix, the direct and quadrature current settling time is under 0.05 s and the direct current overshoot is about 25%, which is caused by the computation delay. For the case without the decoupling control, a slower response and a higher cross-coupling is verified, with settling times of about 0.25 s for both current components. Therefore, the decoupling term improves the time-response speed even with the consideration of a time delay.
Figure 5 shows the results with and without the decoupling correction term for steady-state time-delay cross-coupling ( G iff ). The response without the correction is slower, and the overshoots are higher, thus there is an improvement in the dynamic performance. This effect should be even higher for lower sampling frequencies. Compared to the  Ω L  decoupling, the time-decoupling effects are smaller.
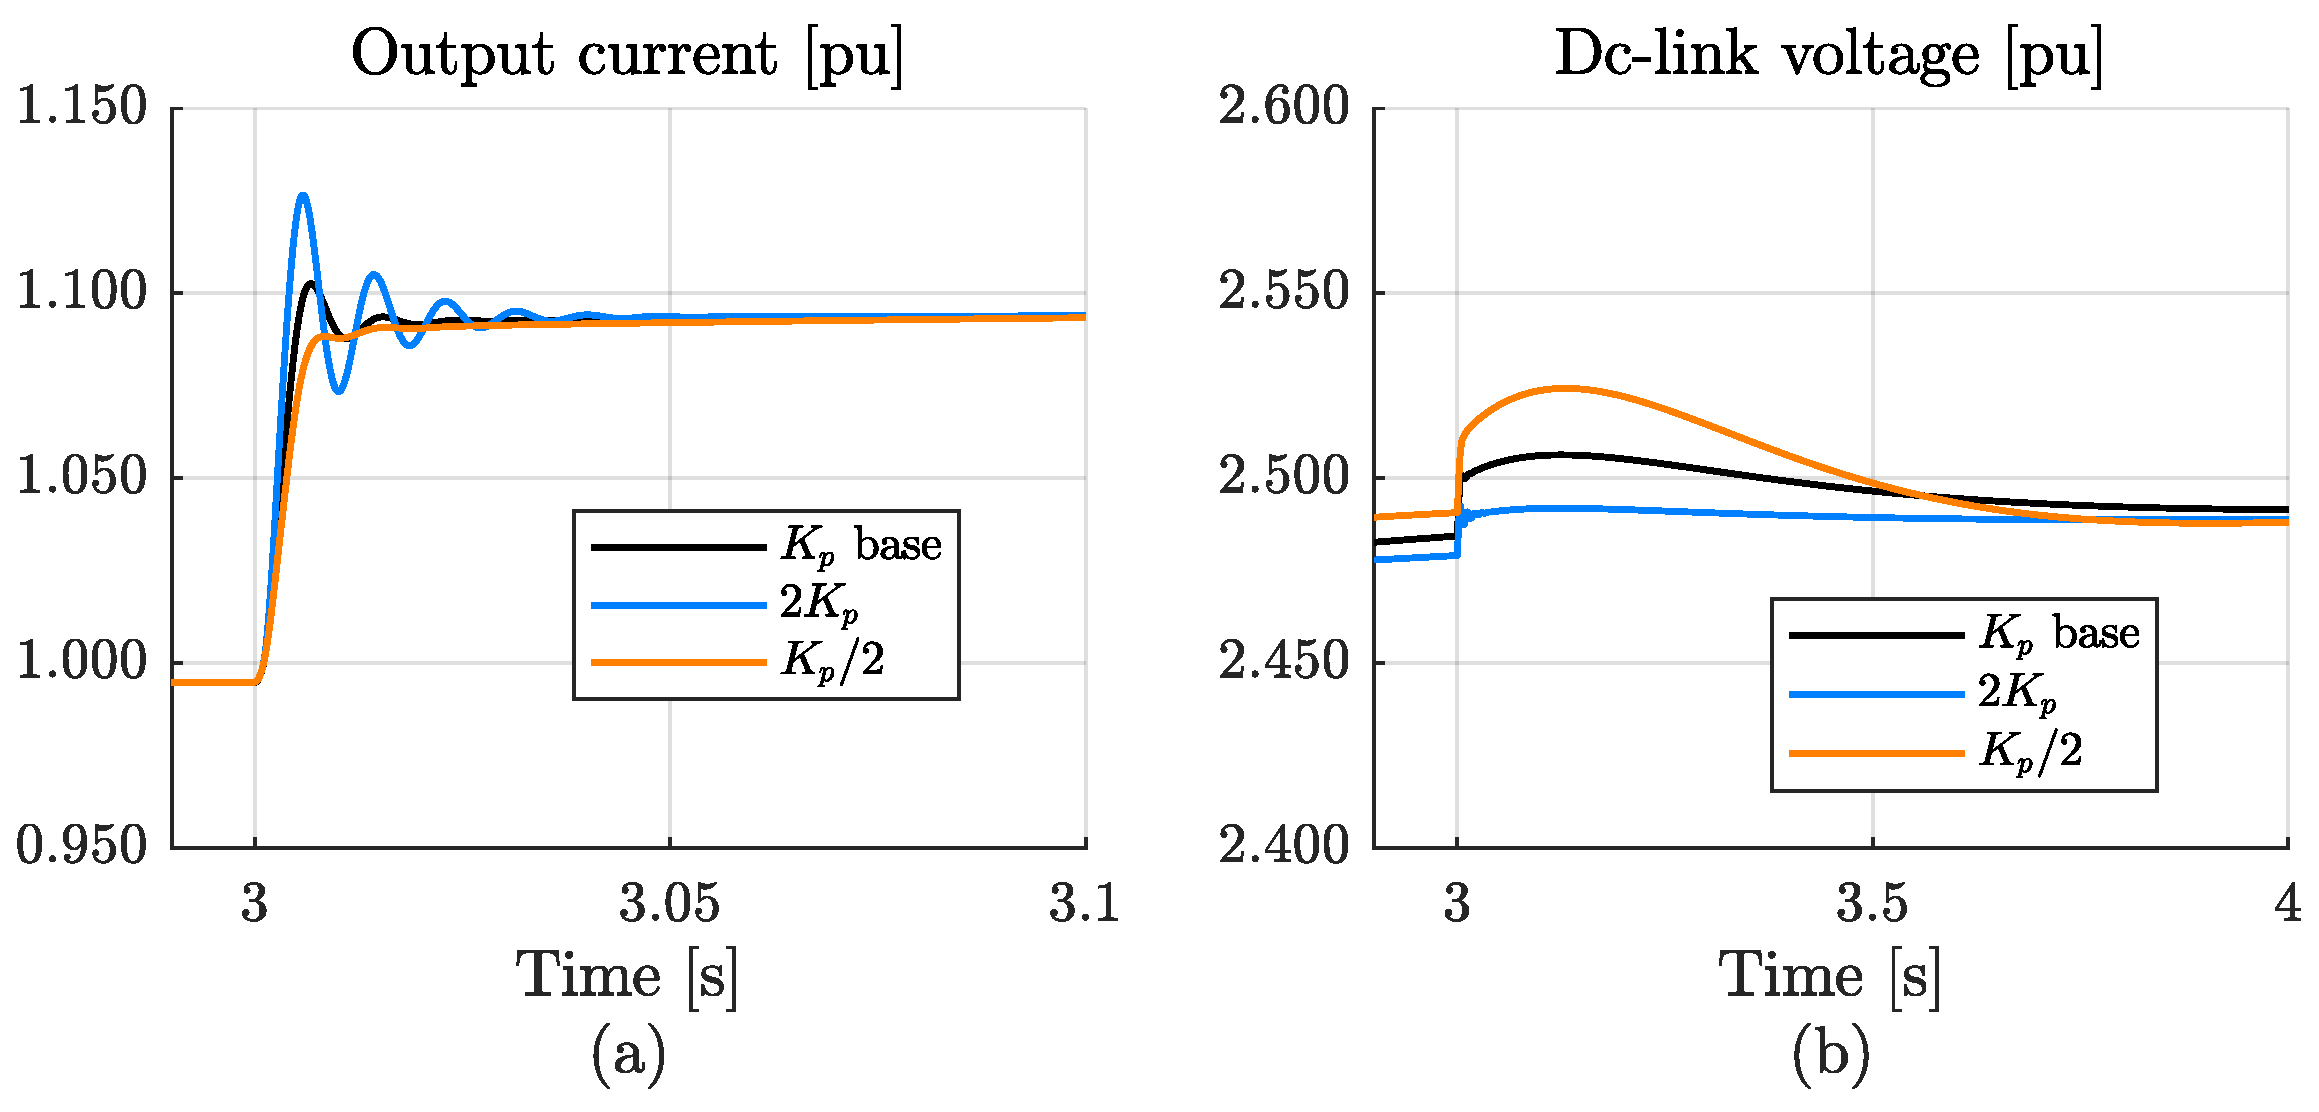
As seen in Figure 4 and Figure 5, the decoupling loops attenuate the effect of the cross-couplings between direct and quadrature axis caused by both output impedance and digital control time delay. Therefore, the use of the decoupling matrices is justified even when there is a significant control delay. The performance of the controller is further assessed by varying the proportional and integral gains. Figure 6 shows a comparison among three values for the proportional gain. As expected, a higher gain value makes the system faster, more oscillatory and with higher overshoot. On the contrary, lower gain values damp the system and make the response slower. The effects of the integral gain were also verified and show just small variations in the overshoot values.
The impact of the control parameters was identified and the resulting Nyquist plot for the eigenvalues of the matrix  G iol  are depicted in Figure 7. This case results in a 29  phase margin and a 9.2 dB gain margin, which means that the system is stable.

3.2. DC Voltage Control

The DC-link voltage is controlled by a proportional-integral controller and a power-feedforward control. The control output is the active power reference, which is used to compute the direct and quadrature reference currents along the reactive power reference and the estimated output voltage. The small-signal block diagram used for the DC-link voltage control design is presented in Figure 8. Four groups of transfer functions are considered: current control, DC-link voltage control, inverter + filter plant, and DC-link plant. First, the grid is considered ideal with constant voltage and zero equivalent impedance. Therefore, the PLL and reactive power control loops are neglected in the following analysis.
From the block diagram in Figure 8, the relation between the DC-link voltage and its reference value is given by:
v d c = 1 + F 1 G v r ,
where the transfer functions  F  and  G  are given by
D = I 2 + G iv i G v i m R 1 G ifb G iff G dec R 1 G iv i G v i v dc + G v i m R 1 G ifb G i r p G p r v dc E = I 2 + G iv i G v i m R 1 G ifb G iff G dec R 1 G iv i G v i m R 1 G ifb G i r p G p r v dc F = G v dc i + G v dc m R 1 G iff G dec G ifb R D G v dc m R 1 G ifb G i r p G p r v dc G = G v dc i + G v dc m R 1 G iff G dec G ifb R E G v dc m R 1 G ifb G i r p G p r v dc .
From (40), the closed-loop stability analysis can be guaranteed if the transfer function  G  is stable (does not present poles on the right half-plane) and  F  satisfies the Nyquist criterion. The voltage control should guarantee the DC-link constant voltage value during steady-state operation given input power variations, which is addressed in the analysis. The values for the current-control parameters are kept constant. Thus, the effects of the feedback and feedforward voltage controllers on the system dynamics are verified. The control values are given in Table 3 and are valid for the following results unless otherwise specified.
As the DC-link voltage reference is kept constant, the control action is verified through the output current amplitude and the DC-link voltage considering a step variation of +0.1 pu on the injected power in the DC-link. Figure 9 compares the effects of the proportional gain on the voltage control dynamics. It is verified that higher gains lead to more oscillatory output current responses and lower DC-link overvoltages.
The effect of the low pass filter on the feedforward control if shown in Figure 10. Three values of cut-off frequencies are simulated, and it is verified that higher frequency bands lead to higher overcurrents. However, the duration of the overvoltage across the DC-link is reduced.
The effects of the operating point were also analyzed for different active and reactive powers. The results show minimal differences and are not presented here. The Nyquist plot of the transfer function  F  from (41) is depicted in Figure 11. It is observed that the plot does not encircle the point (0,−1), which shows that the system is stable. For this parameter combination, the phase margin is 66  and the margin gain is 11 dB.

4. Grid-Connection Stability Analysis

This section presents the small-signal stability analysis of the grid-following inverter when connected to a grid. Discussions follow the obtained results to present more insights about the use in practical applications.

4.1. Inverter and Grid Equivalent Models

The connection between the inverter and a non-ideal grid is depicted in Figure 12. The small-signal representation is based on linearized equations, which are valid for an operating point. The inverter is modeled as a Norton equivalent circuit and the grid is modeled as a Thevenin circuit, where  Y o  and  Z g  are the output admittance of the inverter and output impedance of the grid, respectively. The small-signal stability analysis is performed based on the following considerations: the inverter is stable under an output short-circuit and the grid is stable when operating as an open circuit. Considering these requisites, global stability can be verified.
From the circuit shown in Figure 12 and considering the variables as vectors in the synchronous reference frame and  Y o  and  Z g  as admittance and impedance matrices, the output current of the converter is obtained as:
i o = I + Y o Z g 1 i c I + Y o Z g 1 Y o v g .
From (42), the stability is guaranteed if the output admittance matrix  Y o  is stable (no right half-plane poles) and the product  Y o Z g  satisfies the generalized Nyquist criterion. It should be noted that this condition is valid only for the connection of two equivalent circuits. Therefore, for a more complex system with more inverters, the stability should be assessed by obtaining the equivalent circuits seen by each node and applying the generalized Nyquist criterion. The following sections present the analyses of the converter output admittance and the equivalent grid impedance.

4.2. Inverter Output Admittance

The inverter output admittance is obtained from the small-signal block diagram shown in Figure 13. For this analysis, the desired matrix of transfer functions relates the PCC voltage  v s  and the PCC current  i s . In this case, it should be noted that the PLL, the reactive power control, and the frequency control support also affect the output admittance matrix.
From the block diagram presented in Figure 13, the output admittance of the converter is given as:
Y = I 2 + L 1 M ,
where  I 2  is a 2 × 2 identity matrix and  L  and  M  are given by:
C = G i r v G pll v + G i r p G p r p G pv + G p r v G pll v I = G pll d + R 1 G ifb C + G iff G dec G ifb G pll i + G iff G vff G pll v J = 1 G v dc m R 1 G ifb G i r p G p r v dc 1 G v dc i + G v dc m R 1 G iff G dec G ifb R K = 1 G v dc m R 1 G ifb G i r p G p r v dc 1 G v dc p G pv G pll v + G v dc m I L = G iv i G v i m R 1 G iff G dec G ifb R + R 1 G ifb G i r p G p r v dc J + G v i v dc J M = G iv + G iv i G v i m I + R 1 G ifb G i r p G p r v dc K + G v i v dc K .
From (43), the inverter inner admittance stability is guaranteed if  L  satisfies the generalized Nyquist criterion and  M  has only right half-plane poles. The stability of the grid-connected inverter for a non-ideal grid also depends on the converter output impedance and on the grid equivalent impedance, as seen in (42). The Nyquist plot of the eigenvalues of the transfer function  L  in (44) is presented in Figure 14 for the parameters shown in Table 4. This parameter combination results in a phase margin of 17.5  and a margin gain of 2.7 dB.

4.3. Connection to an RL Grid

The analysis considers an equivalent grid Thevenin model with an impedance modeled by a series RL circuit and an ideal voltage source. The grid dynamic equations in the synchronous reference frame are written as:
v d = ω L g i q + L g d d t i d + R g i d + v g d v q = ω L g i d + L g d d t i q + R g i q + v g q .
By linearizing (45) around an operating point and applying the Laplace transform results in:
v s = v g s + s L g + R g Ω L g Ω L g s L g + R g Z g i s .
The equivalent output impedance is a function of the Short-Circuit Ratio (SCR), defined as the inverse of the absolute value of the grid impedance at the rated frequency:
SCR = 1 | Z g | = 1 R g 2 + ( Ω L g ) 2 ,
and the line is also characterized by its  R g / ( Ω L g )  value.
To assess the impact of the control parameters on the system stability, simulation results are presented for different control values for a +0.01 pu step on the grid equivalent voltage for an impedance with a 0.1 R/ X L  ratio and a SCR of 20. Figure 15 presents the absolute value of the output current for different values of the PLL gain. It is verified that decreasing gain values lead to higher oscillations; therefore, the system tends to be less damped and closer to the instability boundary.
The simulation results for different values of the emulated inertia gain are shown in Figure 16. It is verified that increasing values of either inertia constant as well as integrator gain of the PLL increase oscillations after a step on the grid voltage. This could be explained as follows: the inertia control uses the estimated frequency value to generate the reference of fast power variation. However, this value is obtained at the output of the PLL integrator; therefore, the integrator gain  K i p  has the same impact as the emulated inertia value  K i  on the grid-connection stability. This also means that the stability is related to the quadrature voltage oscillations, cross-coupling, and reactive power injection.
As the inertia constant modifies the injected power in the DC-link, then the active power-feedforward control low-pass filter also affects the system stability. Figure 17 shows the amplitude of the output current for a step on the grid voltage for different filter cut-off frequencies. It is verified that higher cut-off frequencies lead to higher oscillations as a result of output voltage variations.
This oscillatory mode is also presented when considering different values of synthetic inertia and grid SCR. Figure 18 presents the level curves of the maximum power-feedforward cut-off frequency for different values of SCR and synthetic inertia. The curves show that, for a given grid short circuit ratio, there exists a limit on the allowable cut-off frequency  ω p  as a function of the synthetic inertia gain. Therefore, the higher the inertia gain, the lower should be the power-feedforward cut-off frequency to maintain the system stability. For example, for a grid SCR of 2.5 and a synthetic inertia gain of 1 s, the maximum cut-off frequency for the power feedforward loop is 10 Hz; otherwise, the system becomes unstable. The constraints are tighter for weaker grids (lower SCRs) and greater synthetic inertia values.
The plot of the eigenvalues of the matrix  Y o Z g  is shown in Figure 19 and Figure 20, in which the dotted and the continuous line represent both eigenvalues for each case. The plots in Figure 19 show the variations in the inertia constant gain  K i  and in the PLL integral gain  K i p . It should be noted that increasing both gains approximates the plot to encircle the point (0,−1). This is verified also in the time-simulation results shown in Figure 16, where higher gain values lead to a more oscillatory response. Comparing the  K i  and  K i p  gains, it is observed that both have almost the same effect on stability. The plot in Figure 20 shows that higher cut-off frequencies for the power feedforward tend to approximate the eigenvalues to encircle the (0,−1) point, which would destabilize the system. This result is in accord with the time-response seen in Figure 17, where higher cut-off frequencies show a more oscillatory response.
Figure 21 presents the results for different values for the cut-off frequency of the voltage feedforward controller. The cut-off frequency variations show that the system becomes more stable as the frequency decreases. The smoother result for lower cut-off frequencies could be explained by the fact that fast current variations would imply fast voltage variations, which leads to higher estimated frequency derivatives. The stability is assessed through the Nyquist plot presented in Figure 22 for different values of voltage feedforward cut-off frequencies. As time-simulation results show, higher cut-off frequencies approximate the system to the instability. This can be seen in Figure 22, where the Nyquist plot becomes closer to the point (0,−1) as the filter band is widened.
Another way to investigate the interaction between the voltage feedforward and the synthetic inertia control is through the level curves as shown in Figure 23. The stable and unstable regions as functions of the SCR and the synthetic inertia gain are depicted for the feedforward frequencies of 10 and 20 Hz, where the higher frequencies result in a smaller region of stability. For example, for a grid SCR of 4.5 and a synthetic inertia of 2 s, the maximum allowable cut-off frequency for the voltage feedforward is 10 Hz; otherwise, the system becomes unstable.
Figure 24 shows the inverter response for different values of the voltage-reactive power droop gain. The system seems to be more oscillatory both when the gain increases as well as when it decreases. High gain values mean higher AC voltage errors and slightly higher oscillations, but the system remains stable. On the other hand, small droop gain values mean that the AC voltage is more compensated by the reactive power; therefore, the system is more prone to instability. The Nyquist plots are shown in Figure 25, in which it shows that both small and high values of the droop gain lead the curve closer to the point (0,−1). However, smaller gain values tend to destabilize the system, whereas higher gains make the system still stable.
Figure 26 presents the boundary SCRs values for the stability as a function of the grid impedance ratio and the emulated inertia. It should be noted that the system is stable for lower SCRs for a grid with higher R/L characteristics and lower inertia emulation constants. It can be seen that, for low inertia values, the stability is augmented for higher R/L ratios. The values presented in Figure 26 show that there is a trade-off between the inertia emulation and the system stability. The inverter can operate with a high inertia emulation capacity only when connected to strong grids (high SCR), whereas for weak grids (low SCR) the power-frequency response leads to instabilities even for small gain values.
An investigation of the stability is performed based on the conditions of  R / X L = 0.6  and  K i = 2  s. As shown in Figure 26, these conditions lead to a stability limit of SCR = 3. Therefore, the Nyquist plots for these conditions and SCR = 2, 3, and 4 are plotted in Figure 27. The curve of one of the eigenvalues encircles the point (0,−1) as the short circuit ratio decreases. Therefore, the characteristic remains the same as if there was no inertia control; however, the stability boundary occurs for higher values of SCR with the inertia control. The comparison for different values of grid impedance ratio  R / X L  is verified in Figure 28 for the values of  R / X L = 0.6 R / X L = 0.1  and SCR = 4. It is verified that a lower impedance ratio destabilizes the system.

5. Conclusions

This article presents the small-signal stability analysis of a grid-following inverter with frequency control support. The derived models demonstrate the impacts of time delays and cross-couplings on the system dynamics. On addressing the output impedance and time-delay cross-coupling effects in the inner control loop, a decoupling feedforward control may be added, effectively reducing the overshoots and settling time of the current control. Regarding the DC-link voltage control, it is verified that higher gain values result in a faster DC-link voltage response, but the output current becomes more oscillatory. Additionally, it is essential to set a low cut-off frequency for the power-feedforward control to avoid high current overshoots.
The stability of the connection to a grid with non-zero series impedance is assessed using the generalized Nyquist criterion. It is shown that the stability depends on the control loops, as well as on the PLL and the inertia emulation control. It should be highlighted that it is fundamental to keep the gains of these controls relatively low to prevent the system from becoming oscillatory. Furthermore, it has been demonstrated that the cut-off frequencies of both the output voltage and DC-link power-feedforward controllers should be maintained at a low level to enhance stability. This happens due to the inertia emulation relying on the output voltage measurement to generate a power reference, which can lead to instability in fast dynamics scenarios.
Finally, the relationship among the grid short-circuit ratio, R/L ratio, and synthetic inertia reveal that, for weak grids, the inertia gain should be kept low. The SCR is a significant factor when determining the appropriate inertia emulation gain, with the R/L ratio only slightly influencing the stability. As a result, a trade-off exists between grid strength and the inertia capability of the grid-following inverter. These findings have practical applications for systems exhibiting characteristics of a constant power source on the DC-link combined with inertia emulation control, such as wind energy conversion systems (WECS) and energy storage systems (ESS). The article presents the following findings:
  • An increase in the synthetic inertia control gain leads to an overall degradation of small-signal stability.
  • Power and voltage feedforward loops should have limited bandwidth to avoid interference with the effects of the synthetic inertia control.
  • The bandwidth of the PLL should be restricted since it is cascaded in the synthetic inertia control loop.
  • The maximum value for the synthetic inertia is inversely proportional to the grid equivalent short circuit ratio.
As the synthetic inertia is mainly designed for grid frequency stability on transient events, the obtained results can help to establish a constraint for the maximum allowable synthetic inertia based on the small-signal stability of the connection between the inverter and the grid. As an extension of the results, the limits for the cut-off frequencies of the voltage and DC-link power feedforward controllers can be defined based on the synthetic inertia gain and grid SCR.

Author Contributions

Conceptualization, M.S.D. and T.B.L.; methodology, M.S.D.; software, M.S.D.; validation, M.S.D.; formal analysis, M.S.D.; investigation, M.S.D.; original draft preparation, M.S.D.; review and editing, M.S.D. and T.B.L.; supervision, T.B.L. All authors have read and agreed to the published version of the manuscript.

Funding

This research and the APC were funded by the Brazilian National Council for Scientific and Technological Development—CNPq (Process No. 161738/2019-2).

Data Availability Statement

The data presented in this study are available on request from the corresponding author.

Conflicts of Interest

The authors declare no conflict of interest. The funders had no role in the design of the study; in the collection, analyses, or interpretation of data; in the writing of the manuscript; or in the decision to publish the results.

Abbreviations and Symbols

The following abbreviations and symbols are used in this manuscript:
AbbreviationDescription 
BESSBattery Energy Storage System 
ESSEnergy Storage System 
FLLFrequency-Locked Loop 
GFLGrid-Following 
GFMGrid-Forming 
MPPTMaximum Power Point Tracking 
PCCPoint of Common Coupling 
PIProportional-Integral 
PIDProportional-Integral-Derivative 
PLLPhase-Locked Loop 
PSPower Synchronization 
RESRenewable Energy Source 
ROCOFRate of Change of Frequency 
ROCOPRate Of Change of Power 
SCRShort-Circuit Ratio 
SRFSynchronous Reference Frame 
WECSWind Energy Conversion System 
SymbolDescriptionUnit
CDC-Link capacitanceF
  Δ θ Difference between PLL and system anglesrad
iOutput currentA
  i d c DC-link current delivered by the input stageA
  i n Negative DC-link current drained from the inverter stageA
  i p Positive DC-link current drained from the inverter stageA
  K d i Derivative gain of the current controllers/A
  K i Synthetic inertia gains
  K i i Integral gain of the current controller1/As
  K i p Integral gain of the PLL controller1/Vs 2
  K i v Integral gain of the voltage controllerW/Vs
  K p i Proportional gain of the current controller1/A
  K p p Proportional gain of the PLL controller1/Vs
  K p v Proportional gain of the voltage controllerW/V
LOutput filter inductanceH
  L g Equivalent grid inductanceH
mModulation function-
  m f b Modulation function reference from the feedback control-
  m f f Modulation function reference from the feedforward control-
  p d c Power delivered by the DC-link input stageW
  p i Synthetic inertia control power referenceW
  p r Inverter active power referenceW
  P I p Transfer function of the PI controller of the PLL1/Vs
  P I v Proportional-integral DC-link voltage controllerW/V
  pq r Vector of active and reactive power referencesVA
  P I D Proportional-integral-derivative current controller1/A
  q r Inverter reactive power referencevar
  Q 0 Center value of the reactive power referencevar
ROutput filter resistance   Ω
  R Rotating matrix-
  R g Equivalent grid resistance   Ω
  R q Inverter droop gainV/var
  T Park transformation matrix-
  T d Digital control time delays
  T d i Time constant of the derivative current controllers
  T f Cut-off frequency of the synthetic inertia controls
  T s Sampling periods
  θ Park transformation anglerad
  u Unitary vector-
vPoint-of-Common-Coupling voltageV
  v d c DC-link voltageV
  v g Grid voltageV
  v g m Voltage between common ground and DC-link middle pointV
  v i Inverter output voltage referred to the DC-link middle pointV
  v n Voltage across the DC-link lower capacitorV
  V 0 Inverter rated output line voltageV
  v p Voltage across the DC-link upper capacitorV
  ω Angular frequencyrad/s
  ω f f Voltage feedforward cut-off frequencyrad/s
  ω p Power feedforward cut-off frequencyrad/s
  x s Vector of variables in the DQ system frame-
  x c Vector of variables in the DQ control frame-
  x r Vector of reference variables in the DQ control frame-
  x dq 0 Vector of variables in synchronous reference frame-
  x abc Vector of variables in stationary reference frame-
  Y o Inverter admittance matrixS
  Z g Grid impedance matrix   Ω

References

  1. Yaramasu, V.; Wu, B.; Sen, P.C.; Kouro, S.; Narimani, M. High-power wind energy conversion systems: State-of-the-art and emerging technologies. Proc. IEEE 2015, 103, 740–788. [Google Scholar] [CrossRef]
  2. Carrasco, J.; Franquelo, L.; Bialasiewicz, J.; Galvan, E.; PortilloGuisado, R.; Prats, M.; Leon, J.; Moreno-Alfonso, N. Power-Electronic Systems for the Grid Integration of Renewable Energy Sources: A Survey. IEEE Trans. Ind. Electron. 2006, 53, 1002–1016. [Google Scholar] [CrossRef]
  3. Vazquez, S.; Lukic, S.M.; Galvan, E.; Franquelo, L.G.; Carrasco, J.M. Energy Storage Systems for Transport and Grid Applications. IEEE Trans. Ind. Electron. 2010, 57, 3881–3895. [Google Scholar] [CrossRef] [Green Version]
  4. Alam, M.; Chowdhury, T.A.; Dhar, A.; Al-Ismail, F.S.; Choudhury, M.; Shafiullah, M.; Hossain, M.; Ullah, A.; Rahman, S.M.; Hossain, A. Solar and Wind Energy Integrated System Frequency Control: A Critical Review on Recent Developments. Energies 2023, 16, 812. [Google Scholar] [CrossRef]
  5. Tielens, P.; Hertem, D.V. The relevance of inertia in power systems. Renew. Sustain. Energy Rev. 2016, 55, 999–1009. [Google Scholar] [CrossRef]
  6. Fang, J.; Li, H.; Tang, Y.; Blaabjerg, F. On the Inertia of Future More-Electronics Power Systems. IEEE J. Emerg. Sel. Top. Power Electron. 2019, 7, 2130–2146. [Google Scholar] [CrossRef]
  7. Kundur, P. Power System Stability and Control; McGraw Hill: New York, NY, USA, 1994. [Google Scholar]
  8. Kundur, P.; Paserba, J.; Ajjarapu, V.; Andersson, G.; Bose, A.; Canizares, C.; Hatziargyriou, N.; Hill, D.; Stankovic, A.; Taylor, C.; et al. Definition and classification of power system stability. IEEE Trans. Power Syst. 2004, 19, 1387–1401. [Google Scholar] [CrossRef]
  9. Tamrakar, U.; Shrestha, D.; Maharjan, M.; Bhattarai, B.P.; Hansen, T.M.; Tonkoski, R. Virtual inertia: Current trends and future directions. Appl. Sci. 2017, 7, 654. [Google Scholar] [CrossRef] [Green Version]
  10. Eriksson, R.; Modig, N.; Elkington, K. Synthetic inertia versus fast frequency response: A definition. Inst. Eng. Technol. 2018, 12, 507–514. [Google Scholar] [CrossRef]
  11. Morren, J.; de Haan, S.W.; Kling, W.L.; Ferreira, J.A. Wind turbines emulating inertia and supporting primary frequency control. IEEE Trans. Power Syst. 2006, 21, 433–434. [Google Scholar] [CrossRef]
  12. Mauricio, J.M.; Marano, A.; Gomez-Exposito, A.; Martinez Ramos, J.L. Frequency Regulation Contribution Through Variable-Speed Wind Energy Conversion Systems. IEEE Trans. Power Syst. 2009, 24, 173–180. [Google Scholar] [CrossRef]
  13. Van de Vyver, J.; De Kooning, J.D.M.; Meersman, B.; Vandevelde, L.; Vandoorn, T.L. Droop Control as an Alternative Inertial Response Strategy for the Synthetic Inertia on Wind Turbines. IEEE Trans. Power Syst. 2016, 31, 1129–1138. [Google Scholar] [CrossRef]
  14. Bolzoni, A.; Perini, R. Feedback Couplings Evaluation on Synthetic Inertia Provision for Grid Frequency Support. IEEE Trans. Energy Convers. 2021, 36, 863–873. [Google Scholar] [CrossRef]
  15. Arani, M.F.M.; Mohamed, Y.A.R.I. Analysis and mitigation of undesirable impacts of implementing frequency support controllers in wind power generation. IEEE Trans. Energy Convers. 2016, 31, 174–186. [Google Scholar] [CrossRef]
  16. Fini, M.H.; Golshan, M.E.H.; Marti, J.R.; Ketabi, A. Determining the Required Frequency Control Reserve and Capacity and Location of Synchronous and Virtual Inertial Resources. IEEE Trans. Sustain. Energy 2023, 14, 27–38. [Google Scholar] [CrossRef]
  17. Alsharafi, A.S.; Besheer, A.H.; Emara, H.M. Primary Frequency Response Enhancement for Future Low Inertia Power Systems Using Hybrid Control Technique. Energies 2018, 11, 699. [Google Scholar] [CrossRef] [Green Version]
  18. Ochoa, D.; Martinez, S. Analytical Approach to Understanding the Effects of Implementing Fast-Frequency Response by Wind Turbines on the Short-Term Operation of Power Systems. Energies 2021, 14, 3660. [Google Scholar] [CrossRef]
  19. Duckwitz, D.; Fischer, B. Modeling and Design of df/dt -Based Inertia Control for Power Converters. IEEE J. Emerg. Sel. Top. Power Electron. 2017, 5, 1553–1564. [Google Scholar] [CrossRef]
  20. Fang, J.; Deng, H.; Tashakor, N.; Blaabjerg, F.; Goetz, S.M. State-Space Modeling and Control of Grid-Tied Power Converters with Capacitive/Battery Energy Storage and Grid-Supportive Services. IEEE J. Emerg. Sel. Top. Power Electron. 2023, 11, 234–250. [Google Scholar] [CrossRef]
  21. Fu, R.; Wang, X.; Zhang, Y.; Li, L. Inertial and Primary Frequency Response of PLL Synchronized VSC Interfaced Energy Resources. IEEE Trans. Power Syst. 2022, 37, 2998–3013. [Google Scholar] [CrossRef]
  22. Khazaei, J.; Tu, Z.; Liu, W. Small-Signal Modeling and Analysis of Virtual Inertia-Based PV Systems. IEEE Trans. Energy Convers. 2020, 35, 1129–1138. [Google Scholar] [CrossRef]
  23. Fang, J.; Lin, P.; Li, H.; Yang, Y.; Tang, Y. An improved virtual inertia control for three-phase voltage source converters connected to a weak grid. IEEE Trans. Power Electron. 2019, 34, 8660–8670. [Google Scholar] [CrossRef] [Green Version]
  24. Li, Y.; Gu, Y.; Green, T.C. Revisiting Grid-Forming and Grid-Following Inverters: A Duality Theory. IEEE Trans. Power Syst. 2022, 37, 4541–4554. [Google Scholar] [CrossRef]
  25. Du, W.; Tuffner, F.K.; Schneider, K.P.; Lasseter, R.H.; Xie, J.; Chen, Z.; Bhattarai, B. Modeling of Grid-Forming and Grid-Following Inverters for Dynamic Simulation of Large-Scale Distribution Systems. IEEE Trans. Power Deliv. 2021, 36, 2035–2045. [Google Scholar] [CrossRef]
  26. Wen, B.; Boroyevich, D.; Burgos, R.; Mattavelli, P.; Shen, Z. Analysis of D-Q Small-Signal Impedance of Grid-Tied Inverters. IEEE Trans. Power Electron. 2016, 31, 675–687. [Google Scholar] [CrossRef]
  27. Gong, H.; Wang, X.; Harnefors, L. Rethinking Current Controller Design for PLL-Synchronized VSCs in Weak Grids. IEEE Trans. Power Electron. 2022, 37, 1369–1381. [Google Scholar] [CrossRef]
  28. Harnefors, L.; Bongiorno, M.; Lundberg, S. Input-admittance calculation and shaping for controlled voltage-source converters. IEEE Trans. Ind. Electron. 2007, 54, 3323–3334. [Google Scholar] [CrossRef]
  29. Alawasa, K.M.; Mohamed, Y.A.R.I.; Xu, W. Modeling, analysis, and suppression of the impact of full-scale wind-power converters on subsynchronous damping. IEEE Syst. J. 2013, 7, 700–712. [Google Scholar] [CrossRef]
  30. Mansour, M.Z.; Mohammed, N.; Ravanji, M.H.; Bahrani, B. Output Impedance Derivation and Small-Signal Stability Analysis of a Power-Synchronized Grid Following Inverter. IEEE Trans. Energy Convers. 2022, 37, 2696–2707. [Google Scholar] [CrossRef]
  31. Tu, Y.; Liu, J.; Liu, Z.; Xue, D.; Cheng, L. Impedance-Based Analysis of Digital Control Delay in Grid-Tied Voltage Source Inverters. IEEE Trans. Power Electron. 2020, 35, 11666–11681. [Google Scholar] [CrossRef]
  32. Amin, M.; Molinas, M. Small-Signal Stability Assessment of Power Electronics Based Power Systems: A Discussion of Impedance-and Eigenvalue-Based Methods. IEEE Trans. Ind. Appl. 2017, 53, 5014–5030. [Google Scholar] [CrossRef]
  33. Sun, J. Impedance-based stability criterion for grid-connected inverters. IEEE Trans. Power Electron. 2011, 26, 3075–3078. [Google Scholar] [CrossRef]
  34. Hoffmann, N.; Fuchs, F.W.; Kazmierkowski, M.P.; Schroder, D. Digital Current Control in a Rotating Reference Frame—Part I: System Modeling and the Discrete Time-Domain Current Controller with Improved Decoupling Capabilities. IEEE Trans. Power Electron. 2016, 31, 5290–5305. [Google Scholar] [CrossRef]
  35. Busada, C.A.; Jorge, S.G.; Solsona, J.A. Comments on ‘Digital Current Control in a Rotating Reference Frame—Part I: System Modeling and the Discrete Time-Domain Current Controller with Improved Decoupling Capabilities’. IEEE Trans. Power Electron. 2019, 34, 2980–2984. [Google Scholar] [CrossRef]
  36. Zhou, S.; Liu, J.; Zhou, L.; Zhang, Y. DQ Current Control of Voltage Source Converters with a Decoupling Method Based on Preprocessed Reference Current Feed-forward. IEEE Trans. Power Electron. 2017, 32, 8904–8921. [Google Scholar] [CrossRef]
  37. Cvetanovic, R.; Petric, I.Z.; Mattavelli, P.; Buso, S. Small-Signal Modeling of Phase-Shifted Digital PWM in Interleaved and Multilevel Converters. IEEE Trans. Power Electron. 2023, 38, 3057–3068. [Google Scholar] [CrossRef]
  38. Jeong, S.; Jang, G. Stability Analysis of a Weak-Grid-Connected Voltage-Sourced Rectifier Considering the Phase-Locked Loop Dynamics. IEEE Trans. Power Syst. 2023, 38, 436–446. [Google Scholar] [CrossRef]
  39. Chung, S.K. A Phase Tracking System for Three Phase Utility Interface Inverters. IEEE Trans. Power Electron. 2000, 15, 431. [Google Scholar] [CrossRef] [Green Version]
  40. Park, R.H. Two-reaction theory of synchronous machines generalized method of analysis—Part I. Trans. Am. Inst. Electr. Eng. 1929, 48, 716–727. [Google Scholar] [CrossRef]
  41. Zhang, X.; Spencer, J.W.; Guerrero, J.M. Small-Signal Modeling of Digitally Controlled Grid-Connected Inverters with LCL Filters. IEEE Trans. Ind. Electron. 2013, 60, 3752–3765. [Google Scholar] [CrossRef] [Green Version]
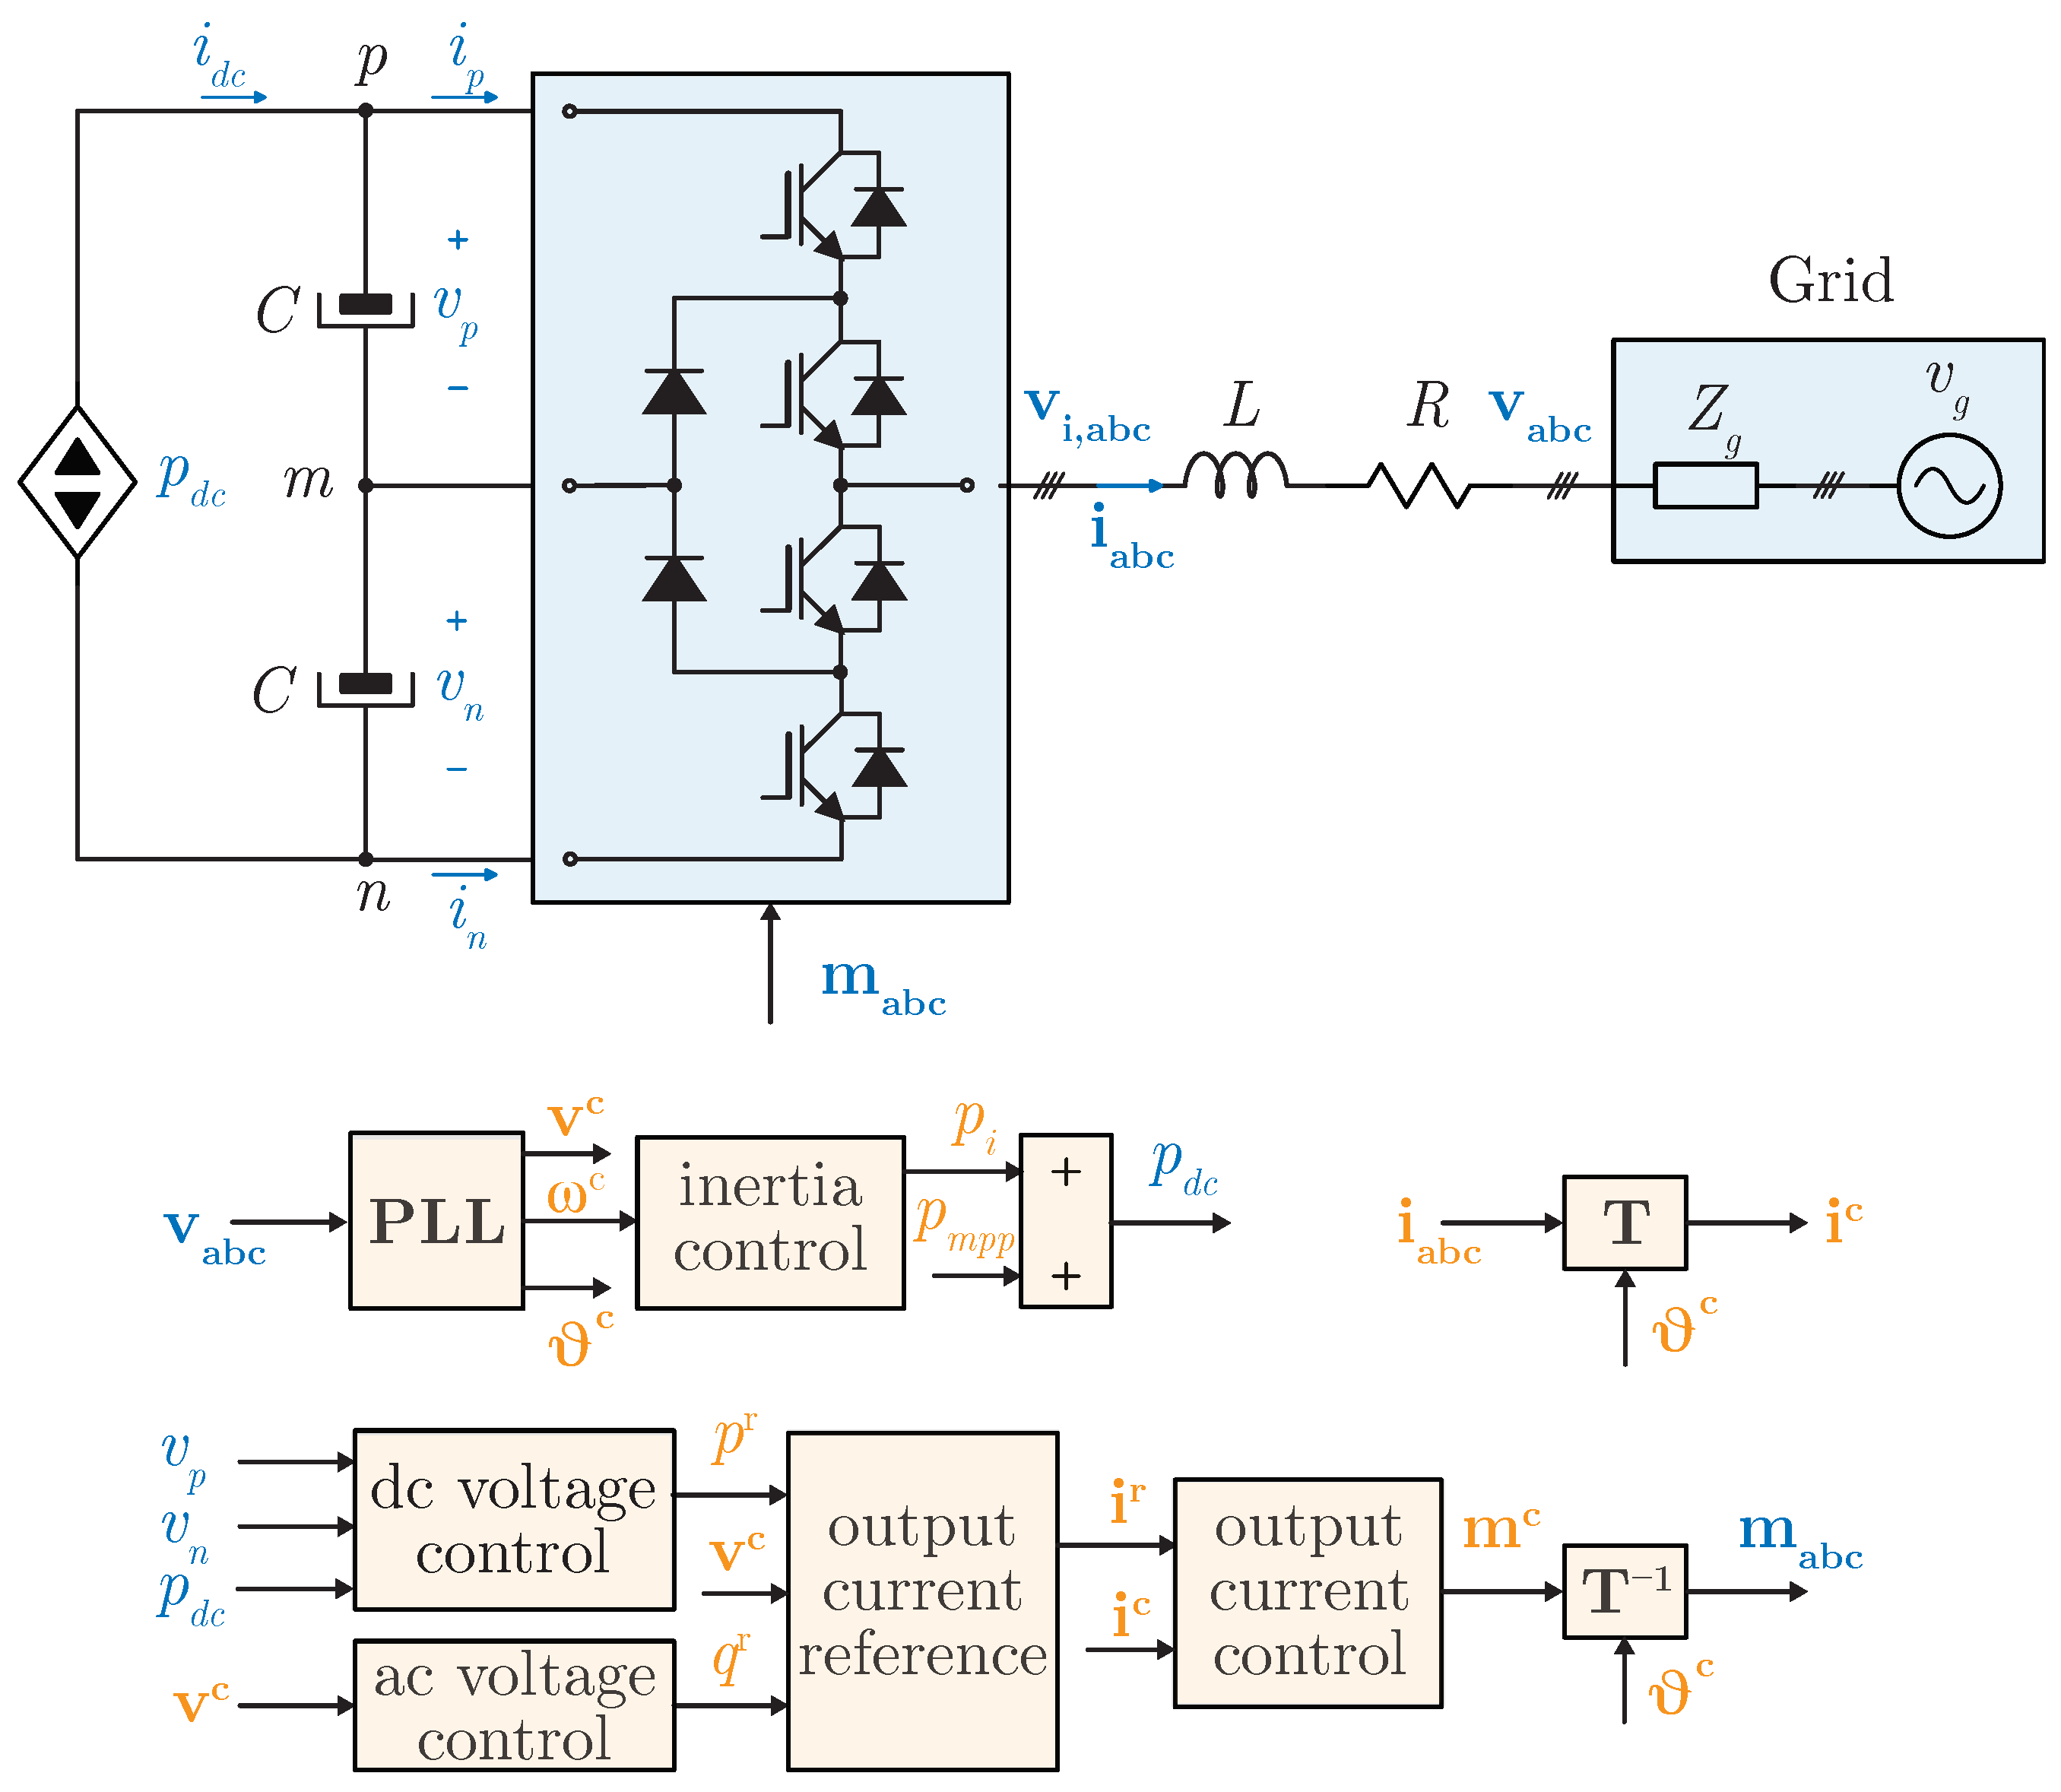
Figure 1. Single-line diagram of a three-phase grid-following inverter with inner, outer, and synchronization control loops.
Energies 16 05894 g001
Figure 2. Model validation by comparing output direct current for the switched model (orange), average model (blue), and linear model (black) after a step of +0.025 pu on the grid voltage.
Energies 16 05894 g002
Figure 3. Small-signal block diagram of the linearized system with current control.
Energies 16 05894 g003
Figure 4. Comparison of current responses after a direct current reference step of +0.1 pu with and without decoupling of output impedance  Ω L . (a) Direct current. (b) Quadrature current.
Energies 16 05894 g004
Figure 5. Comparison of current responses after a direct current reference step of 0.1 pu with and without decoupling of time-delay steady-state effects. (a) Direct current. (b) Quadrature current.
Energies 16 05894 g005
Figure 6. Comparison of current responses after a direct current reference step of 0.1 pu for different values of proportional gain. (a) Direct current. (b) Quadrature current.
Energies 16 05894 g006
Figure 7. Nyquist diagram of the open-loop transfer function matrix  G iol  for the current control (dashed lines: negative frequencies, solid lines: positive frequencies). Each color represents a different eigenvalue.
Energies 16 05894 g007
Figure 8. Small-signal block diagram of the linearized system considering the DC-link voltage and current-control loops.
Energies 16 05894 g008
Figure 9. DC-link voltage response for a step of +0.1 pu on the injected power for different values of the voltage controller proportional gain. (a) Output current amplitude. (b) DC-link voltage.
Energies 16 05894 g009
Figure 10. DC-link voltage response for a step of +0.1 pu on the injected power for different values of the power-feedforward cut-off frequency. (a) Output current amplitude. (b) DC-link voltage.
Energies 16 05894 g010
Figure 11. Nyquist diagram of the transfer function  F  from (41) (dashed lines: negative frequencies, solid lines: positive frequencies).
Energies 16 05894 g011
Figure 12. Norton and Thevenin equivalent circuits of the inverter and the grid.
Energies 16 05894 g012
Figure 13. Block diagram of the linearized system considering all control loops and system dynamics.
Energies 16 05894 g013
Figure 14. Nyquist diagram of the transfer function  L  from (44) (dashed lines: negative frequencies, solid lines: positive frequencies). Each color represents a different eigenvalue.
Energies 16 05894 g014
Figure 15. Output current amplitude for a grid voltage variation for different values of PLL proportional gain.
Energies 16 05894 g015
Figure 16. Output current amplitude for a grid voltage variation for different values of PLL integral gain and inertia emulation gain.
Energies 16 05894 g016
Figure 17. Output current amplitude for a grid voltage variation for different values of cut-off frequencies ( ω p ).
Energies 16 05894 g017
Figure 18. Stability boundary level curves for the power-feedforward cut-off frequency (blue: 10 Hz, orange: 50 Hz) as a function of the grid SCR and synthetic inertia gain.
Energies 16 05894 g018
Figure 19. Nyquist plot of the matrix  Y o Z g  for different values of inertia control gain and PLL integral gain (black:  K i = 0 , blue:  K i = 1 , orange:  K i = 4 , green:  K i = 1 K i p · 4 ).
Energies 16 05894 g019
Figure 20. Nyquist plot of the matrix  Y o Z g  for different power-feedforward cut-off frequencies  ω p . ( ω p  =  2 π · 2  rad/s (black),  2 π · 20  rad/s (blue),  2 π · 80  rad/s (orange)).
Energies 16 05894 g020
Figure 21. Output current amplitude for a grid voltage variation for different values of voltage feedforward cut-off frequencies  ω f f .
Energies 16 05894 g021
Figure 22. Nyquist plot of the matrix  Y o Z g  for different values of voltage feedforward cut-off frequency ( ω f f  =  2 π · 3  rad/s (black),  2 π · 30  rad/s (blue),  2 π · 120  rad/s (orange)).
Energies 16 05894 g022
Figure 23. Stability boundary level curves for the voltage feedforward cut-off frequency (blue: 10 Hz, orange: 20 Hz) as a function of the grid SCR and synthetic inertia gain.
Energies 16 05894 g023
Figure 24. Output current amplitude for a grid voltage variation for different values reactive power control gain  R q .
Energies 16 05894 g024
Figure 25. Nyquist plot of the matrix  Y o Z g  for different reactive power/voltage droop gains (black:  R q = 0.1 , blue:  R q = 0.2 , orange:  R q = 0.08 , green:  R q = 1  ).
Energies 16 05894 g025
Figure 26. SCR limits for stability for a connection with an RL line. Area to the left of the curve: stable operation; area to the right of the curve: unstable operation.
Energies 16 05894 g026
Figure 27. Nyquist plot of the matrix  Y o Z g  for different values of SCR (blue: SCR = 2, black: SCR = 3, orange: SCR = 4).
Energies 16 05894 g027
Figure 28. Nyquist plot of the matrix  Y o Z g  for different grid impedance ratios and SCR = 4 (black:  R / X L = 0.6 , blue:  R / X L = 0.1 ).
Energies 16 05894 g028
Table 1. Characteristics of previous studies on small-signal stability analysis of grid-following inverters. Checkmarks correspond to inclusion in the stability analysis, and X corresponds to non-inclusion.
Ref.Analysis MethodOutput FilterSync.Digital Control DelayVoltage FeedforwardDC Voltage ControlPower FeedforwardAC Voltage ControlPower ControlSynthetic Inertia
ProposedImpedanceLPLL
[19]EigenvalueLCLPLL
[20 ( 1 ) EigenvalueLCLPLL
[14]EigenvalueLCLFLL
[21 ( 2 ) PhasorLPLL
[22]EigenvalueLPLL
[23]EigenvalueLPLL
[26]ImpedanceLPLL
[27]ImpedanceLPLL
[28]ImpedanceLPLL
[29]ImpedanceLPLL
[30]ImpedanceLPS
[31]ImpedanceLCLPLL
(1) The GFM models are also included. (2) The current-control loop dynamics are not considered.
Table 2. Inverter and current-control parameters.
ParameterSymbolValue
Output inductanceL0.1 pu
Output resistanceR0.005 pu
Proportional gain   K p i 0.1 pu
Integrator gain   K i i 2.0 pu
Derivative gain   K d i 0.0001 pu
Derivative time constant   T d i 0.0015 s
Direct current reference   I d r 1.0 pu
Quadrature current reference   I q r 0.0 pu
Computational time delay   T d 0.001 s
Dc-link voltage   V d c 2.5 pu
Table 3. System parameters for the voltage control loop analysis.
ParameterSymbolValue
DC-link capacitanceC7.7 pu
Proportional gain   K p v 3.3 pu
Integral gain   K i v 5.5 pu
Active power reference   P r 1.0 pu
Reactive power reference   Q r 0.0 pu
Cut-off frequency of power feedforward   ω p 2 π · 2  rad/s
Table 4. System parameters for the grid synchronization and AC amplitude voltage control.
ParameterSymbolValue
PLL proportional gain   K p p 377 pu/s
PLL integral gain   K i p 71,060 s 2
Reactive power reference   Q 0 0 pu
Output voltage amplitude   V 0 1 pu
Droop gain   R q 0.1 pu
Inertia control gain   K i 1 s
Inertia control time constant   T f 0.1 s
Short-Circuit RatioSCR20 pu
Line R/L ratioR/L0.1 pu
Output voltage feedforward cut-off frequency   ω f f 2 π · 3  rad/s
Disclaimer/Publisher’s Note: The statements, opinions and data contained in all publications are solely those of the individual author(s) and contributor(s) and not of MDPI and/or the editor(s). MDPI and/or the editor(s) disclaim responsibility for any injury to people or property resulting from any ideas, methods, instructions or products referred to in the content.