Article

Liquid Water Transport Characteristics and Droplet Dynamics of Proton Exchange Membrane Fuel Cells with 3D Wave Channel

1
School of Naval Architecture and Maritime, Zhejiang Ocean University, Zhoushan 316022, China
2
Sany Heavy Industry Co., Ltd., Changsha 430100, China
3
Institute of Nuclear and New Energy Technology, Tsinghua University, Beijing 100084, China
4
China Institute of Ocean Engineering (TsingTao), Qingdao 266555, China
*
Authors to whom correspondence should be addressed.
Energies 2023, 16(16), 5892; https://doi.org/10.3390/en16165892
Submission received: 4 July 2023 / Revised: 2 August 2023 / Accepted: 5 August 2023 / Published: 9 August 2023

Abstract

:
Water management is a crucial aspect in the efficient functioning of proton exchange membrane fuel cells (PEMFCs). The presence of a two-phase flow, consisting of water and reactive gas, in the channel of the PEMFC is of utmost importance for effective water management. This study focuses on investigating the removal of liquid water in 3D wave channels and 2D straight channels using the volume of fluid method. The study analyzes the dynamic behavior of droplets emerging from the gas diffusion layer (GDL) into the channel under the influence of gas flow. The study also explores the effects of droplet growth, deformation, detachment, force, and pore size on critical water behavior and water content in the channel. The results indicate that the 3D wave channel is more effective in removing liquid water compared to the 2D straight channel. It is observed that increasing the velocity facilitates the discharge of liquid water. However, excessively high velocities lead to parasitic power losses. Furthermore, while larger pore sizes in the GDL are not advantageous for PEMFC performance, a moderate increase in pore size aids in the discharge of liquid water. The knowledge gained through this study deepens the understanding of droplet dynamics in PEMFC gas channels and assists in optimizing the design and operational conditions of these channels.

1. Introduction

Proton exchange membrane fuel cells (PEMFCs) directly convert chemical energy into electrical energy without the need for heat conversion, resulting in high efficiency [1]. In a PEMFC, hydrogen (H2) serves as the reductant and oxygen (O2) as the oxidant, producing water through electrochemical reactions [2]. This reaction principle ensures that PEMFCs have zero carbon dioxide emissions and are environmentally friendly. Furthermore, PEMFCs have solid mechanical structures and do not contain any moving parts, making them highly reliable power generation devices [3]. PEMFCs allow for arbitrary scaling between power and capacity, easily ranging from watt to megawatt levels. In comparison to conventional batteries, PEMFCs have the potential to provide high energy density [4].
Proton exchange membranes are composed of perfluorosulfonic acid ionomer (PSA). Dry PEMs absorb a portion of water, which combines with protons to form H3O+ ions, while another portion dissolves sulfonic acid groups, establishing water-sulfonic acid hydrogen bonds. With increasing absorbed liquid water, reverse micelles are formed within the polymer matrix. As more water is absorbed, these clusters become larger and eventually connect with each other, forming a transport channel through which protons are transferred as H3O+ ions to the other side of the membrane. On the other hand, the generated water can block the pores in the porous media (catalyst and gas diffusion layers) as well as the internal flow channels, preventing the efficient transportation of the reactant gas to the reaction interface. Therefore, water management plays a crucial role in ensuring the stability, durability, and high efficiency of PEMFCs [5]. The presence of liquid water in the cathode is mainly caused by the electrochemical reactions occurring in the cathode catalytic layer. This liquid water emerges from the porous catalytic layer and gas diffusion layer and travels into the flow channel. Some of the liquid water remains in the porous medium and is transported to the anode with protons. On the other hand, liquid water in the anode mainly permeates from the cathode. The uneven distribution of temperature in the PEMFC results in the condensation of water vapor on the hydrophilic surface of the channel wall. Water in PEMFCs plays a dual role—it facilitates proton transfer but hinders reactant mass transfer. Thus, maintaining a proper balance of water is essential to achieve stable performance in PEMFCs.
When the liquid water in the cathode is excessive, the GDL of PEMFC may lose efficacy, which will greatly influence the performance and durability of PEMFC. Mustaphanajjari et al. established a two-dimensional model based on diffusion equation analysis to study the effect of water accumulation in GDL on PEMFC. The results show that the liquid water will accumulate in the pores of GDL, which can reduce the porosity of GDL, and the function of the gas diffusion layer to transport gas is invalid [6]. The proton exchange membrane plays an important role in isolating the anode and cathode of PEMFC, which avoid the internal short circuit of PEMFC and prevents direct contact between hydrogen and oxygen. In contrast, the protons need to be accompanied by the migration of water through the proton exchange membrane. If the water in the proton exchange membrane is insufficient, the efficiency of proton transmission will be greatly reduced. On the contrary, when too much water in the proton exchange leads to saturation, the pore of the catalytic layer on the cathode side will be blocked. The interface between the catalyst and proton exchange membrane is the place where the electrochemical reaction occurs, and the cathodic catalyst is more prone to flooding. Nara et al. carried out electrochemical impedance spectroscopy (EIS) analysis on the immersion effect of the cathode catalyst layer of PEMFC by using the transmission line model (TLM) and determined the distribution of the catalytic reaction in the primary and secondary pores. The results show that water flooding occurs in the primary porosity, and water production reduces the active sites [7].
The gas can not reach the catalytic layer smoothly and decompose into protons and electrons when the water content in the channel is abnormal. The experimental results show that water flooding will lead to a partial discharge of PEMFC, resulting in uneven gas distribution, pressure loss, and poor performance of PEMFC. Endoh et al. studied the degradation process of membrane electrode assembly (MEA) under low humidity conditions. The proton exchange membrane was dehydrated due to water shortage. With time increasing, MEA showed obvious degradation [8]. Healy and Knights also observed that the proton exchange membrane under low humidity is easy to enter a dehydration state, and the degradation rate will be significantly accelerated [9,10]. When the proton exchange membrane is in a dehydration state, the crystal structure of the proton exchange membrane will be damaged to a certain extent, and the electrochemical activity of the proton exchange membrane itself will be affected, which seriously affects the performance of PEMFC.
The movement of liquid water and the formation of a two-phase flow in the cathode channel are of great significance to the water management of PEMFC. Transparent PEMFC has become a mature technology and has been used to study the water management of PEMFC. It has the advantage of directly observing the formation and movement of a two-phase flow. The research mainly includes an in situ and ex situ study, in which the ex situ study includes whether there is a gas diffusion layer. At the same time, through the transparent window to monitor the GDL surface liquid water coverage and PEMFC inlet and outlet pressure drop, effective information can be obtained to prevent flooding. Hasheminasab et al. found that when the liquid water coverage is greater than or equal to three and less than or equal to four, the flooding of PEMFC can be effectively prevented [11]. In order to ensure the effective removal of liquid water, Ma et al. found that for the current density of 0.6, 1, 1.2 A/cm2 of PEMFC, the gas flow rate should not be less than 2, 3, and 5 m/s, respectively [12]. The condensation degree of liquid water in the flow field decreases with the increase in PEMFC temperature. Increasing the reaction gas flow rate can effectively remove the liquid water in the cathode flow field and improve the performance of PEMFC [13]. At a low gas flow rate, slug flow or semi-slug flow is easy to appear in the channel, which leads to uneven distribution of two-phase flow and fluctuation of pressure drop. At a high gas flow rate, it is easy to form water film in the channel, and the gas–liquid distribution is more uniform. If the gas flow rate increases further, the accumulated water will become mist flow and decrease greatly [14,15]. The liquid water in the parallel flow field is mainly concentrated in the middle flow channel, and the serpentine flow field with filleted corners is not easy to form droplets at the bend of the flow channel [16]. Compared with the parallel flow field and serpentine flow field, grid (mesh, superparallel) flow field [17], interdigital flow field, and cascade flow field [18] can enhance the transmission of water and gas, making it easier to remove liquid water, and have better water management performance. When too much liquid water is generated on the surface of the catalytic layer, and the water vapor is saturated, droplets appear on the surface, which emerge from the GDL. However, due to the compression of the gas diffusion layer during assembly, the preferential path of liquid water is formed [19], and the water droplets are firmly fixed on the GDL surface by the surface tension [20]. As the droplets grow, they contact the two sides of the flow channel and then are limited by three walls. Finally, the droplet forms a slug in the cross-section of the channel and contacts the four walls of the flow channel [20]. There are three main ways to remove the liquid water from the GDL surface: the first way is to make the droplets separate and move forward through the shear force of the airflow. The second form is the influence of temperature. The increase in temperature leads to a decrease in surface tension, which leads to a decrease in adhesion and the easier deformation of the droplet surface. The third form is that under the action of strong surface tension, the droplets grow large enough and then adsorb to the side wall to form annular membrane flow or slug flow, which makes the flow channel blocked and instantly removes the liquid water under the pressure of continuous gas inflow The transient variation of voltage with dynamic water behavior is used to detect water flooding [21]. This method can help to improve the understanding of the dynamic behavior of water inside fuel cells. However, it is unable to observe the internal water distribution. Therefore, Cho et al. used transparent PEMFC to observe the water vapor distribution during dynamic response [22]. The results show that the concentration of water vapor appeared after loading for 2 s. Kim et al. found that it took about 7–10 s to change the water vapor distribution in the channel after dynamic loading voltage [23]. This technique facilitates visual observation of water behavior inside PEMFC. It is effective even in situations with low humidity [24]. The combination of voltage following and transparent PEMFC can prevent small changes in internal water behavior under low humidity from being observed. This article adopts a transparent PEMFC to observe the dynamic behavior of liquid droplets and combines simulation results to more accurately observe the dynamic behavior of liquid water under different operating conditions.
To address the issue of liquid water obstructing the reaction rate of the reactive gas in a PEMFC, Sugiura et al. implemented a water-absorbing layer (WAL) and investigated its effectiveness using visualization techniques. The findings demonstrated that the installed WAL successfully absorbed the condensed liquid water in the flow channel [25]. Similarly, Chen et al. incorporated a porous medium flow channel in a PEMFC and established its effectiveness in optimizing water management [26].
Numerous studies have demonstrated that three-dimensional channels offer superior water and gas management compared to conventional channels. Forced convection in these channels enhances oxygen supply to the catalytic layer, resulting in increased local concentration and decreased concentration polarization. Furthermore, the narrow regions of the channel experience increased velocity and an eddy current effect, effectively removing liquid water accumulated in the gas diffusion layer and catalytic layer. Building upon previous research [27], an investigation into the optimal design of three-dimensional wave channels was conducted. The findings indicate that the minimum water depth and wavelength should be 0.45 mm and 2 mm, respectively. At an output voltage of 0.4 V, the current density was found to increase by 23.8% compared to the traditional channel. Toyota has developed a more intricate bipolar plate flow field, utilizing a three-dimensional fine-grid flow field. However, this design requires more complex processing technology [28,29]. The optimal operating temperature for PEMFCs is typically 60–70 °C. It is worth noting that liquid water can be present not only in the porous layer but also in the flow channel. While direct observation of liquid water flow is possible, it proves to be costly and complex due to the experimental device’s high cost and complexity. Therefore, optimizing water management strategies in PEMFCs remains of paramount importance.
The volume of fluid (VOF) model is a reliable method for interface reconstruction, ensuring strict mass conservation. This model allows for the simulation of immiscible fluids by solving a series of momentum equations and accurately tracking the volume fraction of each fluid throughout the entire region. Furthermore, the VOF model takes into account the impact of surface tension and wall adhesion. Zhu et al. applied the VOF model to investigate the dynamic characteristics of liquid water breakthrough in the gas diffusion layer (GDL) into the channel [30]. Following the breakthrough, the droplets exhibited a range of complex behaviors such as growth, deformation, collapse, wall adhesion, fracture, recoil, and final film formation. Their study revealed that the wettability of the channel surface significantly influenced the dynamics of water droplets [31]. On hydrophobic surfaces, water droplets tended to split and rapidly convect, while on hydrophilic surfaces, they tended to diffuse and form a film flow. Le et al. examined the dynamic behavior of liquid water in a serpentine channel. They observed that the air velocity at the corners was insufficient to move small droplets, resulting in droplet accumulation at these corners [32]. The accumulation of droplets in the corners led to increased pressure drop at the inlet and outlet of the flow channels. Additionally, it becomes more challenging to remove water since its viscosity causes a portion of the water that should be discharged directly to gather in the corners, leading to blockage of the flow channels.
The flow mode of fluid within the flow field significantly influences the water management in fuel cells. Various studies have demonstrated the numerous advantages of counterflow and crossflow configurations. It has also been observed that PEMFC operate effectively in counterflow mode without the need for external humidification [33]. This allows for efficient internal humidification of dry reaction gases, resulting in sustained high battery performance. Most of the research on the removal of liquid water in three-dimensional wave channels are focused on the removal of liquid water in porous structure [34,35]. The introduction of forced convection is an effective method for optimizing the internal water management of the flow field. Numerous researchers have explored different shapes of blocked elements (such as rectangles [36,37], semicircles [38,39], trapezoids [40,41], and parallelograms [42]). However, these blocks’ edges and corners result in greater pressure loss. In order to mitigate this issue, this study proposes a streamlined design for the windward and leeward sides of the block. This design shape influences the formation of vortices in the flow channel, inheriting the advantages of rectangular baffle flow channels in terms of reducing flow resistance and eddy currents [43].
Furthermore, there has been limited research conducted on the formation and movement of liquid water in wave channels. Our own research has shown that proton exchange membrane fuel cells (PEMFC) with wave channels and forced convection effect exhibit superior performance and improved water management [44,45]. In order to gain a deeper understanding of the dynamic behavior of water in these channels, it is important to uncover the mechanism behind the enhanced drainage performance caused by the forced convection effect.

2. Materials and Methods

2.1. Materials

In this study, the size of the flow channel is consistent with the flow channel used in our previous research. The 2D straight channel and 3D wave channel models are established, as shown in Figure 1. The length of channel is 10 mm, the width W is 0.8 mm, the height H is 1 mm, and a water inlet is set at 0.4 mm away from the inlet. According to the literature, the diameter of the holes range of SGL25 series carbon paper is 84.2–170.5 μm [46,47], so the water inlet diameter is set to 100 μm. The phenomenon of liquid water overflowing from the surface of gas diffusion layer is simulated, and the dynamic behavior of liquid water in 2D straight channel and 3D wave channel is analyzed. The height h of the narrowest part of 3D wave channel is 0.4 mm, and the height of the highest part is H, which is 1 mm. The curve of flow channel is cosine as follows:
y = 0.3 cos ( 2 x )
The VOF model is utilized to examine the behavior of liquid water in the two channels after it emerges from the gas diffusion layer into the channel. Mesh generation has a great influence on the calculation results. The surface tension effect of tetrahedral mesh is less accurate than that of hexahedral mesh, so hexahedral mesh should be used in the most important area of surface tension effect. In order to verify the rationality of the meshing strategy, an ex situ transparent device is designed to study the shape of droplet that emerged from GDL, as shown in Figure 2. It is composed of transparent acrylic end-plate, gasket, graphite plate, end-plate, and clamp. A channel is hollowed out in the transparent end-plate, and the side wall of channel is polished. GDL (SGL25AA) is placed between the transparent end plate and the graphite plate and sealed with a gasket to prevent gas leakage. The thickness of the gasket is 0.2 mm. The deionized water is pumped into the air inlet of the graphite plate by the water pump, and the air outlet is sealed. When the deionized water is under a certain pressure, it will break through the gas diffusion layer and enter the transparent channel. The air is transported to the transparent channel through the mass flow controller located on one side of the transparent end plate, which is the simulation of PEMFC in the operation of the liquid water breakthrough GDL into the flow channel in the process of airflow under the condition of the movement state. Industrial high-speed camera (Work Power, WP-UT130/M, Shenzhen, China) is used to capture the movement of droplets.
The meshing strategy is illustrated in Figure 3. The hexahedral mesh is used for the mesh, the regular rectangular part is regular hexahedron, and the circular part at the liquid water inlet is divided into two O-type divisions, one outside the circular inlet and the second inside the circular inlet. The partition method is shown in Figure 3a. The effect of mesh generation is shown in Figure 3b. The same boundary conditions were used in the experiment and simulation. The actual current density of 0.52 A/cm2 was selected as the velocity boundary of liquid water inlet. The calculated liquid water inlet velocity was 0.5 m/s, the gas inlet velocity was 10 m/s (stoichiometric ratio was 2.85), and the outlet was atmospheric pressure. The experimental and simulation results are shown in Figure 4. From the experiment results, we can observe the morphology change in the droplet after breaking through the GDL surface under the action of inlet gas. With the increase in pressure, the breakthrough droplet increases slowly. As the size of the droplet increases, the forward angle also increases while the backward angle decreases. This trend is observed both in the simulation results and the experimental results, indicating that the meshing strategy is reliable. Furthermore, the change in shape of the droplet in the simulations closely resembles that observed in experiments, further supporting the reliability of the meshing strategy.
During the calculation process, explicit formulas were utilized for calculation. The gas–liquid surface tension coefficient was 0.072 N/s, the working pressure was 101,325 Pa, the inlet was the velocity boundary, and the transient calculation time step was 10−6 s. The solver used a simple separation algorithm based on pressure, and the gradient calculation was based on the least squares unit. For pressure interpolation, PRESTO was selected, and the spatial discretization method of momentum was the second-order upwind method.

2.2. Numerical Models

Assumptions:
  • The simulation does not take into account the isothermal condition of temperature change.
  • Detailed electrochemical mechanisms were not taken into consideration.
  • The GDL is modeled as a homogeneous porous medium without considering the specific pore structure.
  • Due to the low velocity of gas flow and the small size of the channel and manifold, the fluid flow in the channel is assumed to be laminar.
The volume of fluid method (VOF) in commercial CFD software FLUENT was used to simulate the two-phase flow in channel. VOF model can simulate two or more immiscible fluids by solving a set of momentum equations and tracking the volume fraction of each fluid in the whole region.
The initial phase volume fraction will be calculated according to the following constraints:
α g + α l = 1
where αi is the volume fraction, i represents the subscript of α corresponding fluid type i. αi is solved by conservation equation of mass:
t α i ρ + α i ρ u = 0
The density of two-phase flow is given by the following formula:
ρ = α g ρ g + ( 1 α l ) ρ l
where g and l are gas and liquid, respectively.
Momentum conservation equation:
t ρ u + ρ u u ) = p + μ u + u T + ρ g + F
u and μ represents the velocity and viscosity, respectively. Considering the surface tension due to intermolecular attraction in the fluid, continuous surface force (CSF) is used to explain the continuous three-dimensional effect across the interface. The surface tension effect is simulated by adding a source term to the momentum equation. The surface tension is constant along the surface, in which only the force perpendicular to the interface is considered. The surface tension can be expressed by the pressure jump on the surface, and the force on the surface can be expressed as the volume force by the divergence theorem. It is this volume force that is the source term added to the momentum equation. Its form is as follows:
F = σ ρ κ α i 0.5 ρ l + ρ g
n = α i
κ = n ^
n ^ = n n
In the interface of the channel wall and water, the surface curvature is determined by the contact angle θw
n ^ = n ^ w cos θ w + t ^ w sin θ w
where n ^ w , t ^ w are the unit vectors normal and tangential to the wall, respectively.

2.3. Computational Domain and Grid Independency Test

Due to the shape of the 3D wave channel is more complex than that of the 2D straight channel, it is necessary to check the grid independence of the 3D wave channel. In this study, three kinds of grid numbers were calculated, including 1,158,912 grids, 965,760 grids, and 772,608 grids. The time step of the transient calculation was set to 10−6. The position and shape of droplets in the channel at different times were selected as the evaluation index. The results show that, as shown in Figure 5, there is no significant difference in the change in droplet size with time under three different grid sizes, which indicates that the water droplets have undergone almost the same transmission process. Considering the compromise of calculation cost, the 965,760 grid system is selected to study the dynamic behavior of water droplets in this study.

3. Results

3.1. Dynamic Behavior of Droplets in 3D Wave and 2D Straight Channels

The time evolution of the dynamic behavior of liquid water spilling from the GDL surface, exiting the pores, and progressing toward the outlet of the flow channel is analyzed, as depicted in Figure 6. The pore diameter of GDL is 0.1 mm, the liquid water inlet velocity is 0.5 m/s, the gas inlet velocity is 6 m/s, and the contact angle of walls in the channel is 120°. During the period of time before the droplets are divorced from the pores (0–9.0 ms), the shape and size of the droplet in the two kinds of channels are basically similar. At 9.2 ms, the droplet in the 3D wave channel leaves the pore and continues to move downstream under the action of pressure. The droplet moves to the position about to enter the narrow area of the flow channel at 11.2 ms, which is 0.9 mm away from the initial position. In contrast, the droplets in the 2D straight channel are still in the initial position and are not divorced from the pore. At 14.4 ms, the droplet in the 3D wave channel has moved to the position of 5.3 cm away from the initial position, and the droplet in the water inlet is also increasing, which is 0.25 mm larger in diameter and 0.2 mm larger in height than when the droplet just peeled off. At this time, the droplet in the 2D straight channel breaks away from the aperture and starts to move forward. Because of the delay of the droplet leaving the GDL aperture, the height of the droplet in the 2D straight channel is 0.08 mm higher than that in the 3D channel. The previous study has shown that the droplet diameter is larger, and the deformation degree of the droplet is larger [48]. This is the reason why the gas viscous force is the dominant force when the droplet diameter is very small. However, when the droplet height is larger, the hydraulic diameter of the channel becomes smaller, and the pressure force is the main guiding force and greater than the viscous force, which is more conducive to the forward movement of the droplet from the channel. In the same time period of 2 ms (9.2–11.2 ms for 3D wave channel/14.4–16.4 ms for 2D straight channel), the droplet in the 2D straight channel moves forward by 0.5 mm, while the droplet in the 3D wave channel moves forward by 0.7 mm. This shows that although the height of the droplet is small, there is still a large deformation and faster movement speed in the 3D wave channel. The droplet motion in the two kinds of channels presents a continuously increasing acceleration mode. When the droplets in the 3D wave channel move to the outlet of the flow channel at 16.4 ms, the droplets in the 2D straight channel move to 0.5 mm away from the initial position, so it can be found that the 3D wave channel is more conducive to the discharge of liquid water than the 2D straight channel.
Previous studies have demonstrated that the separation of liquid water from the pores of a GDL is quicker in 3D wave channels compared to 2D straight channels [14]. This advantage is crucial in preventing the accumulation and subsequent connection of droplets, which can lead to flooding in PEMFC. As a result, it is essential to investigate the evolution of droplet shapes over time during their separation from the pores.
Figure 7 shows the time evolution of the interface during droplet detachment from the pore. In the whole stage, the behavior characteristics of liquid water can be divided into three stages: the droplet breaks through the pore in Figure 7a–c, the liquid separates from the pore in Figure 7d, and the droplet moves downstream in Figure 7e. When the water enters the gas channel from the GDL hole, a droplet forms on the surface of GDL, and the flow of air prevents the liquid water from diffusing upstream under the action of inertial force. Under the action of surface tension, the droplet keeps smooth and spherical (t = 0.6 ms). After 5.4 ms, the shear force of the gas is greater than the surface tension of the droplet and less than the adhesion force of the droplet on the water delivery surface, so the contact angle of the droplet lags behind. The shape of the droplet in the two channels is similar, which indicates that the force is basically the same (t = 6 ms). When the height of the droplet increases, the decrease in the hydraulic diameter of the flow passage leads to an increase in the velocity of the gas above and the shear force, which pushes the droplet downstream. However, due to the intermolecular force of water, the adhesion force on the GDL surface, and the low momentum of the liquid water at the inlet, the droplet appears as a neck (9.0 ms for 3D wave channel, 14.2 ms for 2D straight channel). As time goes on, the droplet size continues to increase, and the inertia force increases until the surface tension is overcome and the wall adhesion force is finally separated (9.2 ms for 3D wave channel, 14.4 ms for 2D straight channel). The time of droplet separation in the 3D wave channel is much shorter than that in the 2D straight channel. When the distance from the initial position to the same position is 1.45 mm, the time of droplet separation in the 3D wave channel is 5.6 ms less than that in the 2D straight channel, which indicates that the 3D wave channel is beneficial to overcome the surface tension and wall adhesion of droplets. It also has a great advantage in promoting the droplet to move downstream.
Figure 8 shows the change in droplet length L, width W, and height H with time from the time when the droplet protrudes from the pore to the time when the first droplet leaves the flow channel. There are three characteristic stages: growth, vibration, and equilibrium. The growth stage is the process of the droplet leaving the water inlet. In the vibration stage, the droplet moves forward, and the boundary layer develops at the entrance length. Due to momentum diffusion, the boundary layer will grow and finally converge at the center line. During this period, the velocity gradient on the droplet surface is constantly changing, and the deformation of large droplets is mainly affected by force, which is the integral of the velocity. Therefore, oscillation occurs at the vibration stage. During the vibration period, the droplet moves faster. When the boundary layer no longer changes, it reaches the stable stage, and the change in L, W, and h of the droplet is small. The results show that there is no equilibrium phase, only a growth and vibration phase in the 3D wave channel, as shown in Figure 8a. This is also because the cross-sectional area of the channel changes periodically, which leads to more obvious gas velocity mutation and increases the degree of droplet deformation until the droplet is discharged. The deformation of droplets in the narrow region of the 3D wave channel is greater than that in the 2D straight channel because the gas velocity increases, and the force is greater in the narrow region.
To further observe the forces exerted by the two flow channels on the discharge of liquid water, the shear forces of gas on the surface of droplets at different positions in the two flow channels were plotted. Figure 9 shows the force of the flowing gas on the surface of the droplet. The force on the droplet in the growth region of the 2D straight channel is relatively stable, but when it reaches the vibration region, the force on the droplet begins to increase. This is also because the force on the droplet in the stable region begins to stabilize with the increase in the velocity boundary layer. The force of droplets in the inner growth region of the 3D wave channel is similar to that of the 2D channel, but the force of droplets in the vibration region will change greatly due to the sudden change in velocity, which is conducive to the discharge of droplets.

3.2. Effect of Velocity on Liquid Water Behavior in the 3D Channel

PEMFC needs to constantly switch between a certain power range when supplying electricity; the gas supply also needs to change with the power generation at this time. Sometimes, it also uses rapid gas injection for blowing to alleviate water flooding. Under high-speed airflow, liquid droplets grow due to wall adhesion after breaking through GDL, resulting in an increasing area of liquid water covering GDL and affecting gas transmission. Therefore, studying the effect of gas velocity on the size of the droplet detachment aperture and the time of the droplet detachment aperture is of great significance. Figure 10 shows the critical separation diameter and critical separation time of water droplets leaving the aperture in the 3D flow passage as a function of gas flow velocity. With the increase in gas velocity, the critical separation diameter and critical separation time decrease, which is because the force on the droplet increases with the increase in gas velocity. However, when the gas velocity increases to more than 7 m/s, the critical separation time and critical separation time do not increase, which indicates that the infinite increase in gas velocity is not necessarily conducive to the removal of droplets but consumes more additional power. The time for the first droplet to leave the water hole completely decreases with the increase in velocity, and the time from the beginning of droplet leaving the water hole to the exit channel also decreases with the increase in velocity, but the slope is far less than the time of droplet leaving. This is because once the droplet starts to move, the adhesion will be reduced, and the friction will be the minimum when the droplet moves. It shows that the increase in velocity reduces the discharge time of droplets, mainly the critical separation time.
To further understand the impact of gas velocity on droplet shape changes in the 3D wave channel. As shown in Figure 11, the shape distribution of droplets at the same position in a 3D wave flow channel was studied under different velocities. It can be observed that in the first half of the flow channel, the droplet exhibits both forward and backward angles under the action of the gas. While in the second half of the flow channel, the moving droplets exhibit a drag phenomenon, and a neck appears between the head and tail. This phenomenon becomes more pronounced with increasing velocity. The size of the droplets on the head decreases with increasing velocity, and the length of the neck also increases with increasing velocity, which is similar to the results of reference [49]. The time for the droplet to completely leave the flow channel decreases with the increase in velocity. When the gas velocity is 4 m/s, the time required for the droplet’s head to cross the outlet of the flow channel is 26.4 ms. When the velocity is increased to 6 m/s, 8 m/s, and 10 m/s, the required time decreases by 37.87%, 57.58%, and 65.15%, respectively. When the gas velocity is 4 m/s, 6 m/s, 8 m/s, and 10 m/s, the time required for the liquid droplet to reach the outlet from below the first narrow area is 5.2 ms, 4.4 ms, 3.6 ms, and 3.2 ms, respectively. It can be observed that once the water droplet begins to move, the adhesion will decrease, and the friction force when the water droplet moves is the smallest. This indicates that the increase in velocity reduces the discharge time of the liquid droplet, mainly by reducing the critical detachment time.
Figure 11a–c show the variation of droplet length L, width W, and height H over time in a 3D wave flow channel. The results showed that under different flow rates, the droplets in the 3D wave flow channel only have growth and vibration stages, without an equilibrium stage, indicating that the 3D wave flow channel still has good drainage capacity under low-speed airflow. At different gas velocities, all droplet deformations can be described as stretching droplets with large heads on the upstream side, and such droplet morphology corresponds to the relaxation stage of droplet shape characteristics. According to previous analysis, it can be seen that when the gas velocities are 8 m/s and 10 m/s, the size of the droplets when they detach from the pores is similar. Compared to the gas velocity of 8 m/s, when the gas velocity is 10 m/s, the length L of the droplet rapidly increases in the flow channel and the second half, while the width H changes relatively small. This may lead to an excessive area of liquid water covering the surface of GDL, affecting the gas mass transfer. Therefore, the next study will investigate the changes in liquid water coverage on the surface of GDL at different velocities.
Figure 12 shows the variation of liquid water coverage on the GDL surface over time in 3D wave channels under different gas velocities. Aw is the surface coverage of liquid water on GDL, defined as the ratio of the surface water area of GDL to the GDL area. When the droplet has not yet left the aperture, the liquid water coverage Aw shows a linear increase over time. When the droplet leaves the aperture, the liquid water coverage begins to oscillate to a certain extent, but it shows an upward trend overall. This is because when the droplet leaves the aperture, new droplets begin to enter again, and the droplets that begin to move will undergo a certain degree of deformation under the action of the gas. According to the previous analysis, increasing the gas velocity at 7 m/s does not reduce the time for the droplets to leave the pore size, so the droplet sizes of 8 m/s and 10 m/s are similar. It can be seen that the surface coverage rate decreases rapidly as it increases to a certain level from Figure 12. This is because the liquid droplet leaves the flow channel. When the gas velocity is 10 m/s and 8 m/s, the time for the liquid droplet to leave the flow channel is 9.2 ms and 11.5 ms, respectively. Although the increase in velocity reduces the time for the liquid droplet to stay in the flow channel, compared to the liquid droplet with a gas velocity of 8 m/s, the surface coverage rate is the highest at this stage, increasing by 35%.

3.3. Effect of Hole Diameter of GDL on Liquid Water Behavior in the 3D Channel

Many researchers have proposed that laser drilling of gas diffusion layer can promote the discharge of liquid water, so it is of certain significance to study the influence of water pore size on liquid hydrodynamic behavior. Sw is defined as the ratio of the volume of water in the microchannel to the volume of the microchannel. Figure 13a shows the effect of pore size on Sw. When the pore size is 100 μm, 150 μm, and 200 μm, the time for liquid water to discharge from the flow channel is 7.5 ms, 8 ms, and 9 ms, respectively. The larger the pore size is, the easier the liquid water is to break through the gas diffusion layer from the catalytic layer through the microporous layer and enter the channel. However, it is not that the larger the aperture, the better. When too much liquid water covers the surface of the gas diffusion layer and cannot be discharged, the diffusivity of air in liquid water is far less than that in air, which will lead to more serious concentration polarization of reactants in the high current density region and the performance of the PEMFC will be degraded. Aw is defined as the ratio of the surface coverage of water on the GDL. Figure 13b shows the change in surface coverage with time under different pore sizes and purging speeds. When the aperture is 200 μm, it indicates that the coverage rate of liquid water on GDL has reached a maximum of 10%, which will hinder the mass transfer of the reaction gas. Therefore, with the increase in pore size, the surface coverage increases, which indicates that a larger pore size is not conducive to the operation of PEMFC [50].
Previous analysis showed that an increase in pore size would increase the surface coverage of liquid water on GDL. Therefore, we specifically investigated how the change in droplet shape in the 3D wave channel increases the surface coverage of GDL, as shown in Figure 14. The shape changes in liquid water in the flow channel under different pore sizes and velocities was studied. The research results indicated that at the same speed, the deformation of droplets becomes more pronounced as the pore size increases. When the droplet L is longer, the pore size is 200 μm and speeds of 4 m/s, 6 m/s, 8 m/s, and 10 m/s, the maximum distance of droplet L as a percentage of the channel length is 21.05%, 22.63%, 23%, and 25.13%, respectively. It can be seen from the result that the increase in pore size has a greater impact on the shape of liquid water. As the droplet becomes closer to the outlet, the drag phenomenon becomes more obvious. When the purging speed is higher, the wave phenomenon also appears (as shown in the black wireframe) [49], which means that the droplet is about to break.
The above research has observed that as the pore size increases, the time for the droplet to reach the outlet gradually decreases. However, the longer the drag length of the droplet, the longer the time for complete discharge of the droplet. Only when the droplet is completely discharged can it indicate its high drainage capacity. Therefore, the next step is to investigate the trend of the critical time for droplet detachment from the pore size and the time for droplet complete discharge from the flow channel at different gas velocities and pore sizes. Figure 15a is the curve of spalling time versus velocity under different pore sizes. Under different pore sizes, the law is the same as in Figure 10. The time of droplets leaving the flow channel decreases with the increase in velocity. At lower velocities, the increase in pore size is beneficial to the spalling of droplets, but with the increase in pore size, the discharge time tends to be stable. This is because when the pore size is smaller, the protruding droplet volume is smaller, the velocity ratio is smaller, and the force on droplets is smaller. However, with the increase in droplet size, the force on the droplet will also increase. Figure 15b is the curve of the critical time of droplets leaving the channel with the pore size at different velocities. When the velocities are 8 m/s and 10 m/s, the droplet discharge time does not change with the increase in the pore size. When the velocities are 4 m/s and 6 m/s, the droplet discharge time decreases with the increase in the pore size. When the pore size is less than 1.2 mm, the drop discharge time decreases obviously, and when the pore size is larger than 1.2 mm, the drop discharge time decreases rapidly. From the point of view of liquid water coverage and droplet discharge time, the increase in pore size is not conducive to the discharge of liquid water, but the appropriate increase in pore size is beneficial.

4. Conclusions

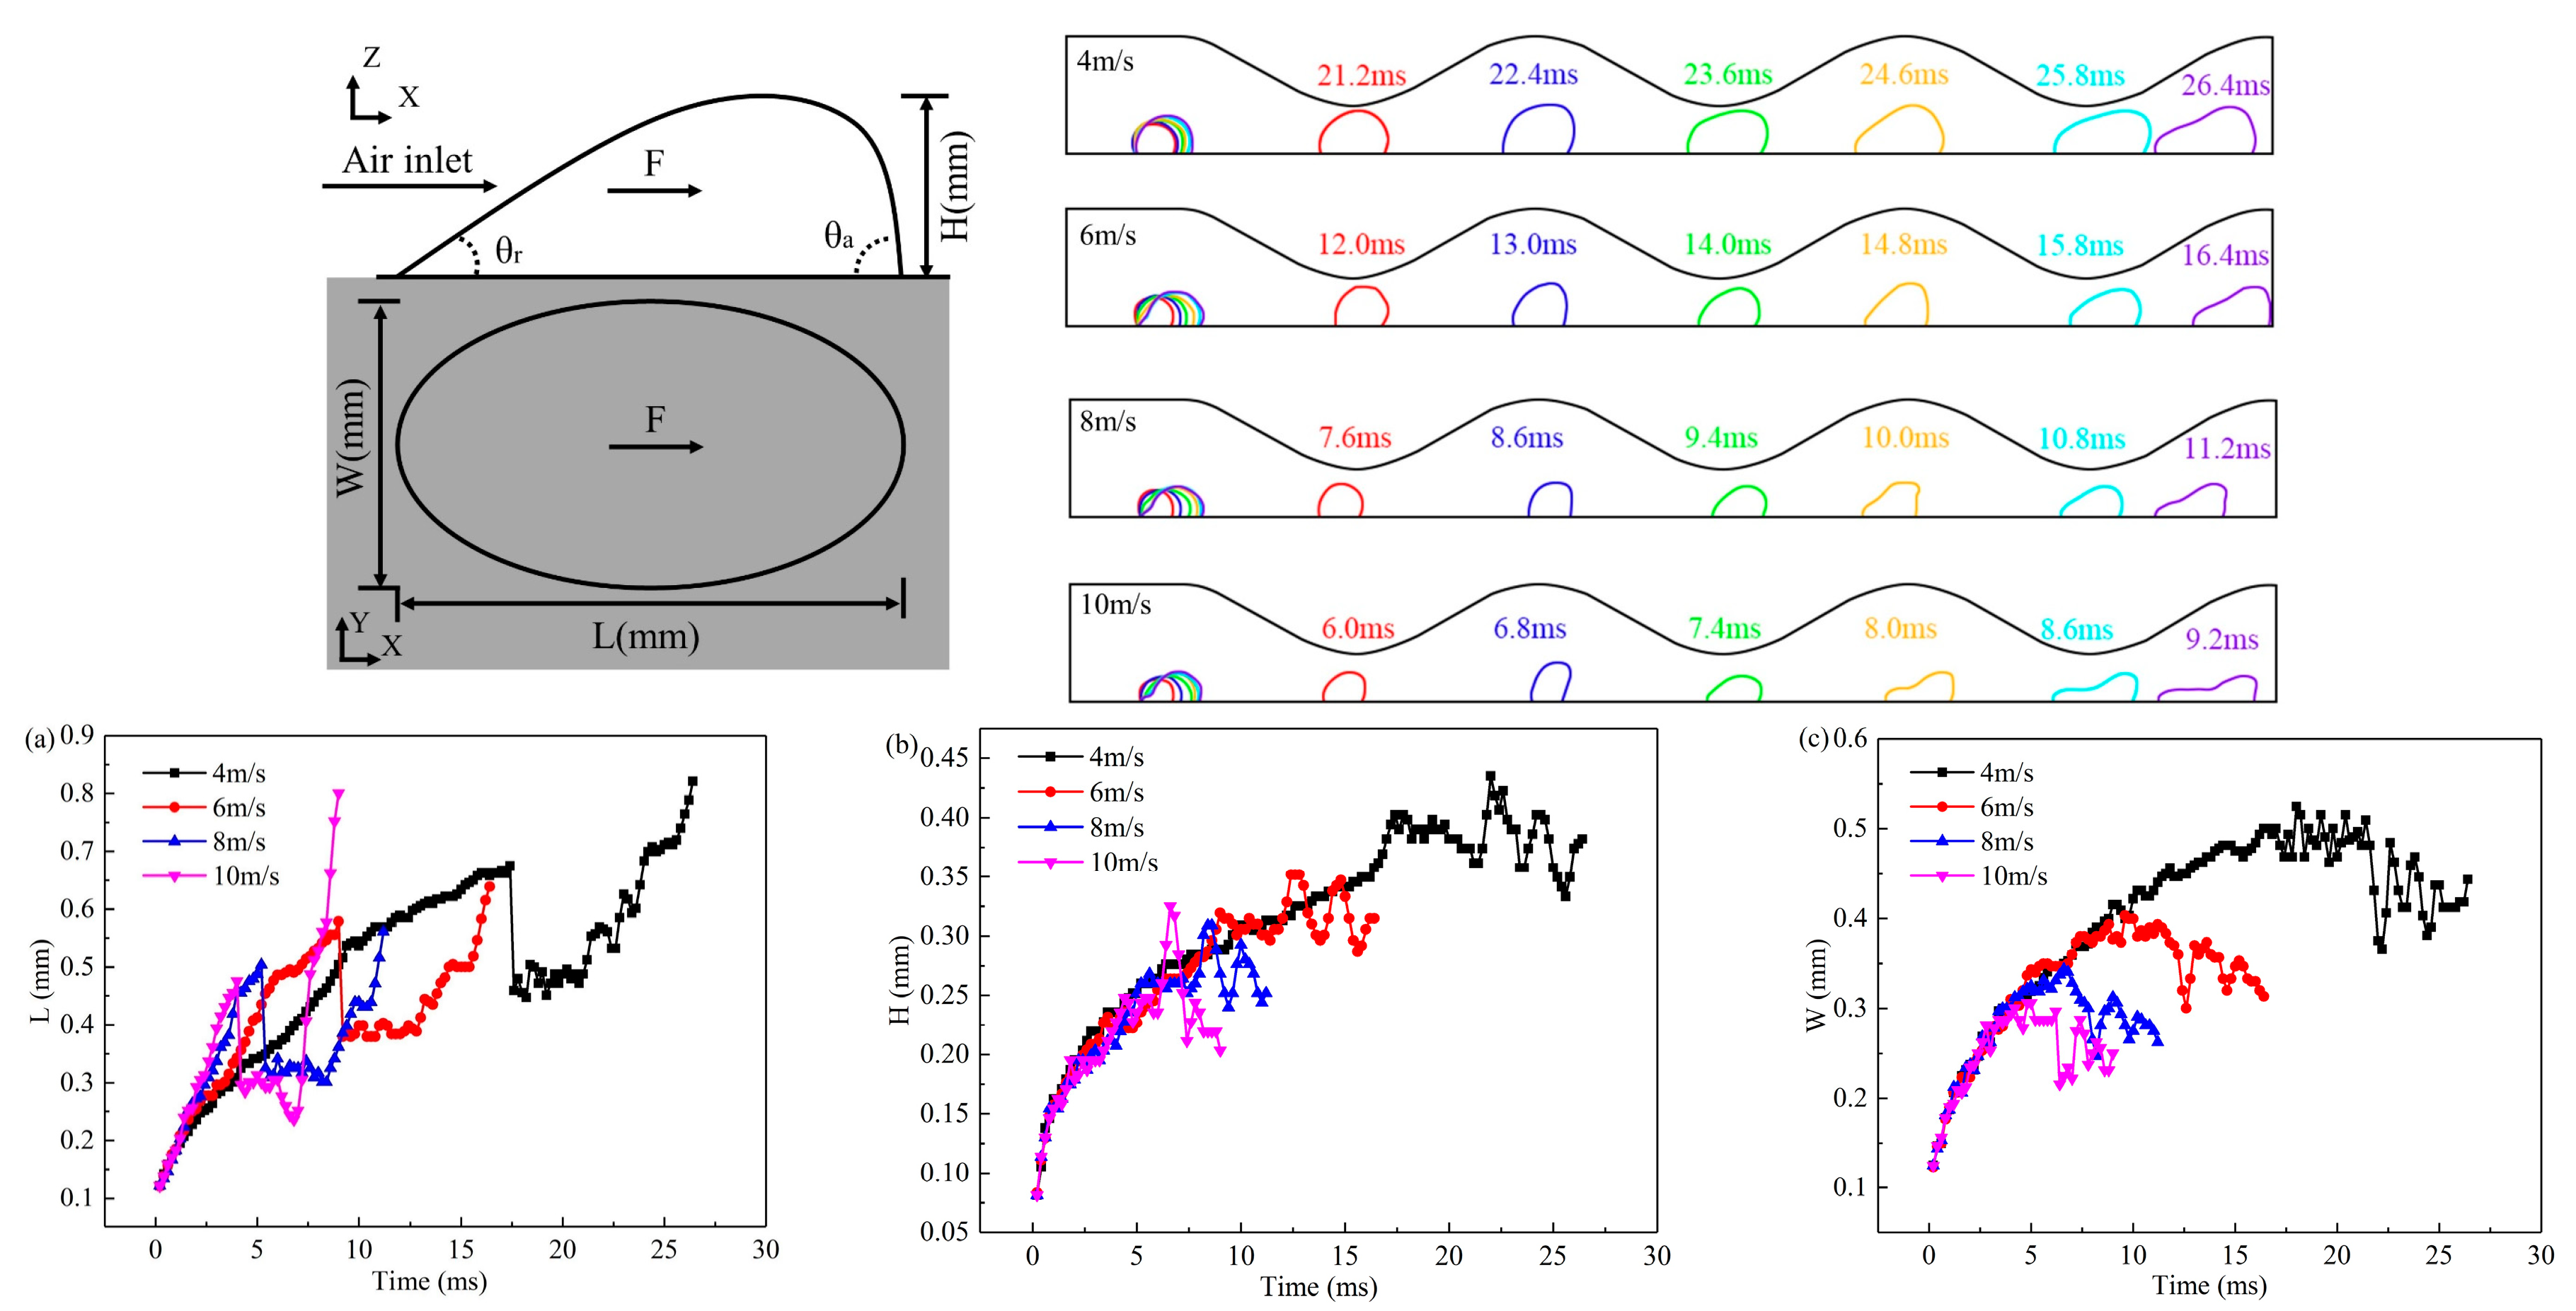
  • As the electrochemical reaction progresses, liquid water in the catalyst layer is pushed through the GDL pores under pressure, forming droplets in the flow channel. These droplets continue to grow and eventually leave the pores when they reach a certain volume, influenced by the shear force of the gas. Increasing gas velocity reduces the critical diameter and separation time for droplets to leave the pore size, but this effect stabilizes as gas velocity further increases.
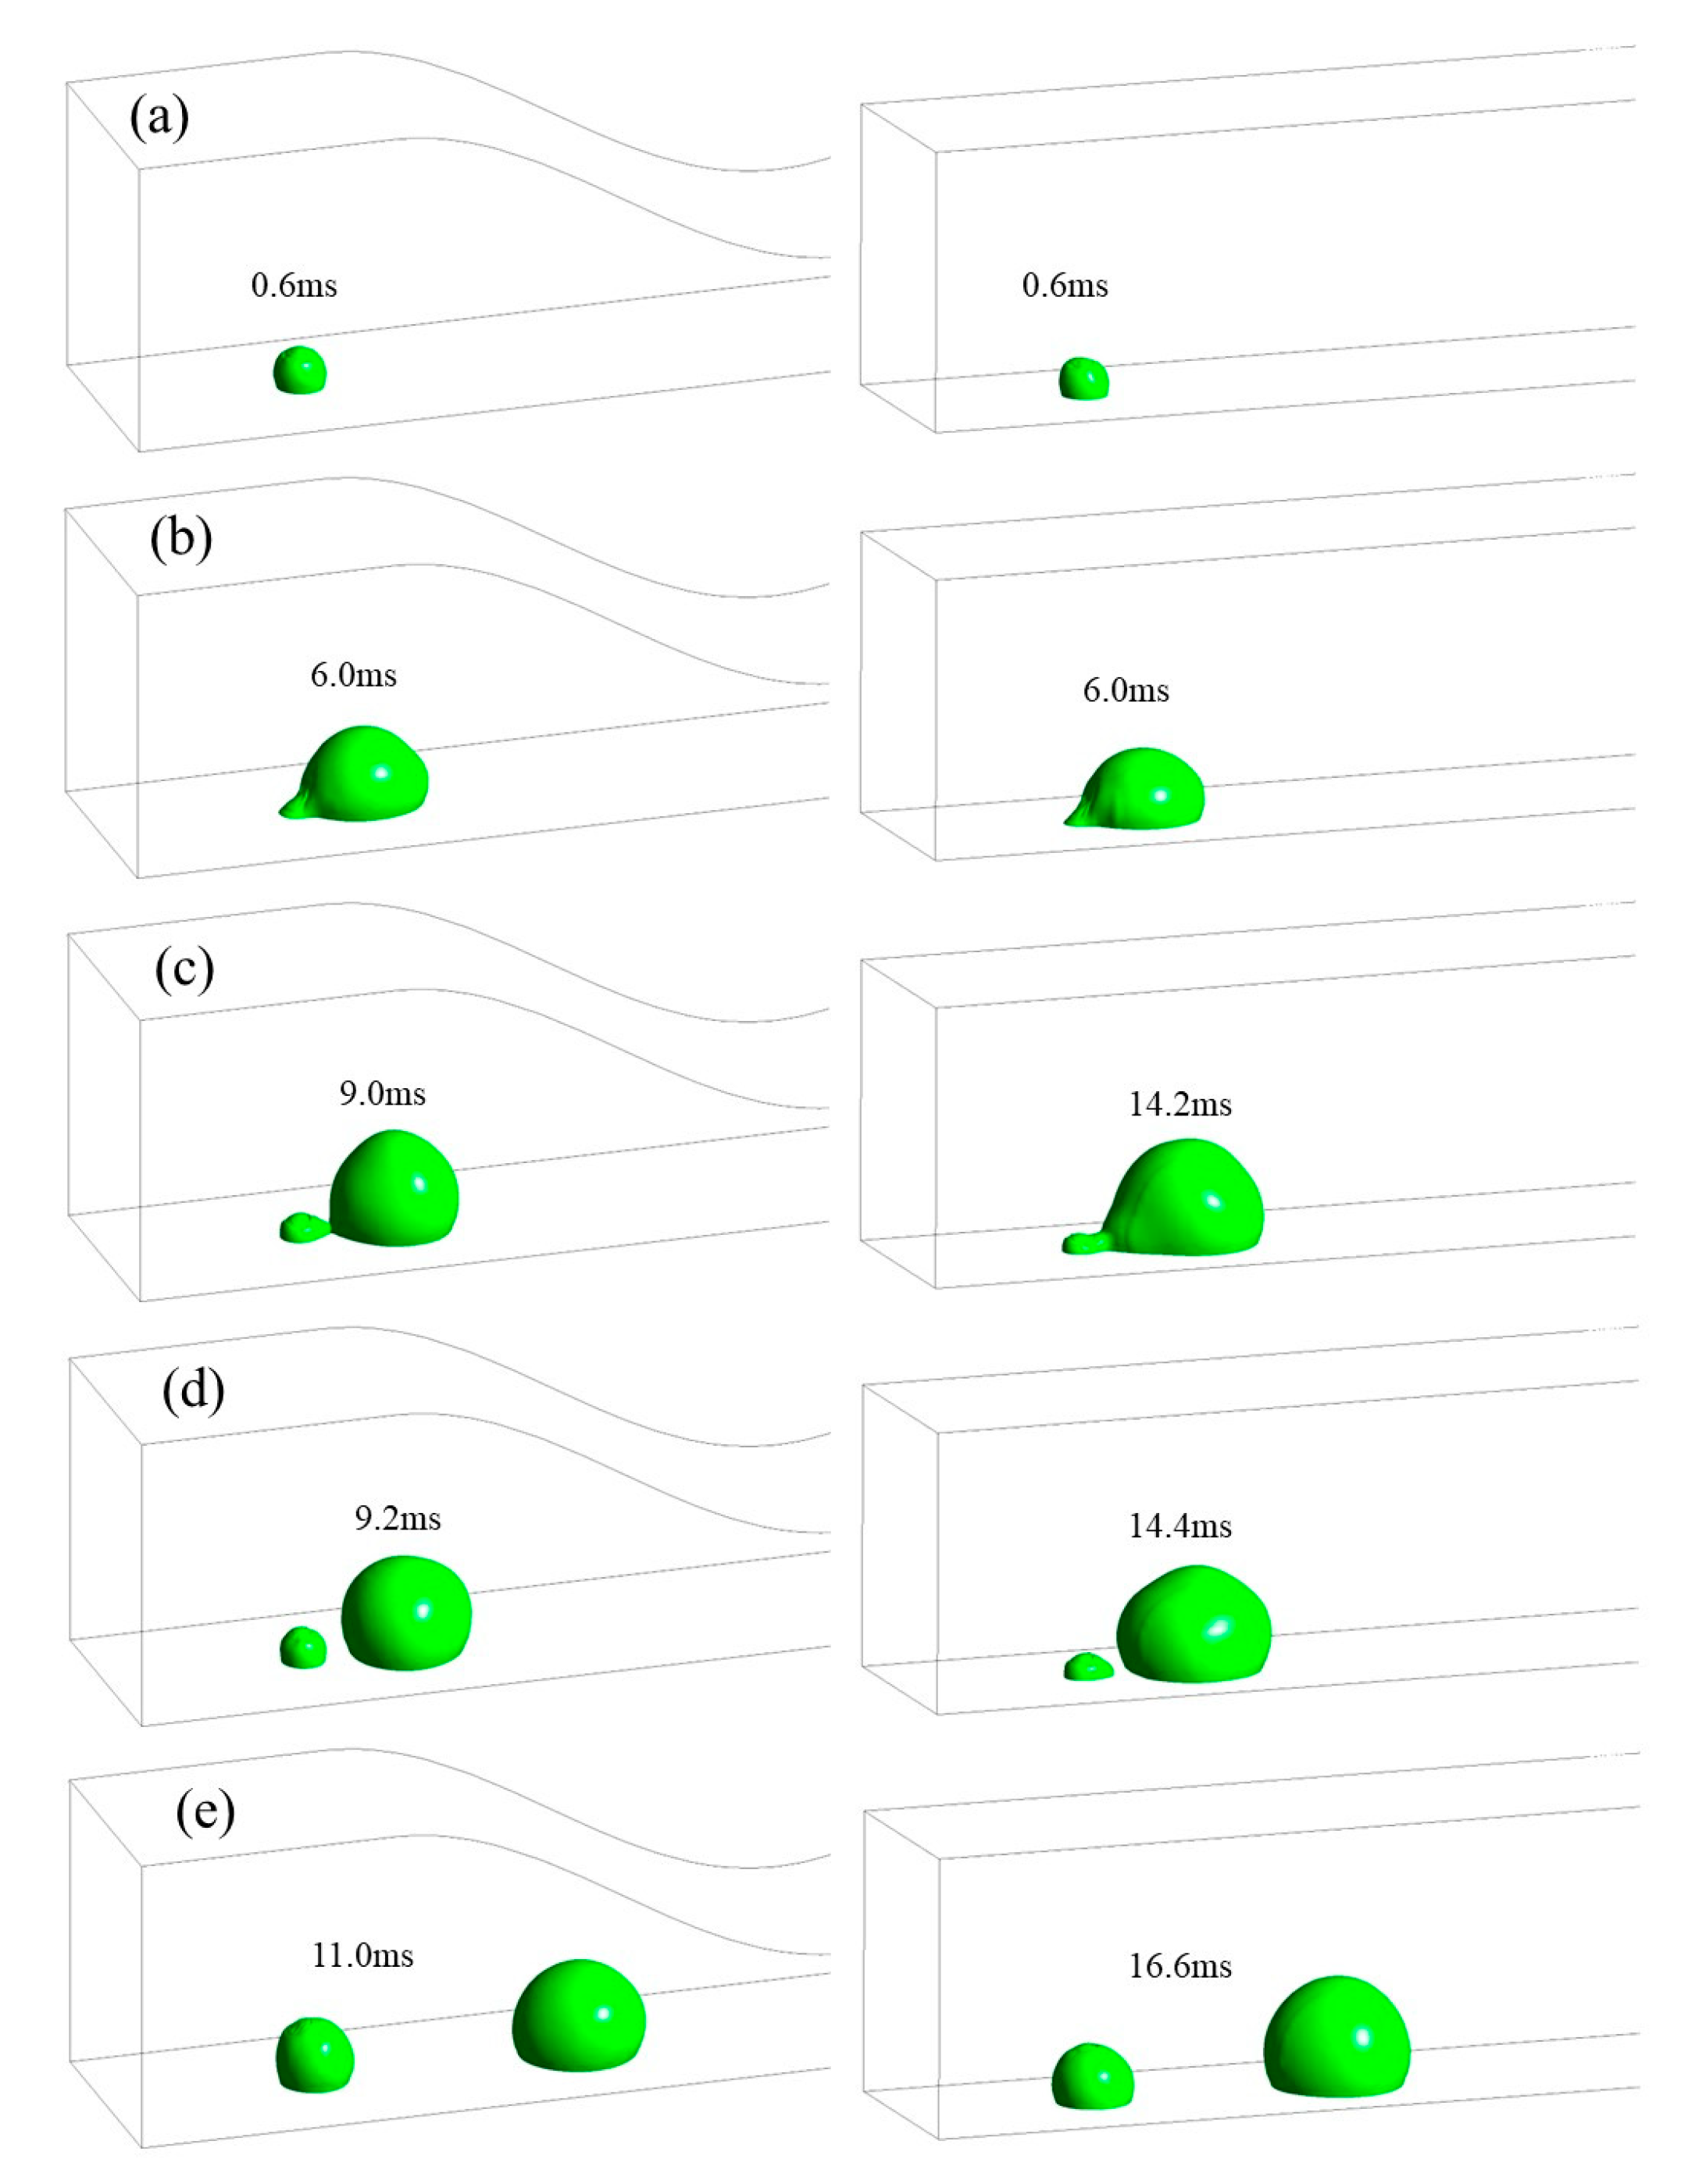
  • In the 2D channel, liquid water goes through three stages—growth, vibration, and balance—from the moment it breaks through the GDL pores until it is discharged from the channel. In contrast, the 3D channel only experiences the growth and vibration stages. Additionally, the force fluctuation during the vibration stage is greater in a wave channel compared to a straight flow channel.
  • At various velocities, a wave channel can effectively eliminate droplets of varying sizes and water films while also reducing the critical time it takes for liquid water to exit the pore size. The movement of droplets required 28.8 ms to reach the exit of the 2D channel, which is 12.6 ms longer compared to the time taken in the 3D channel. This discrepancy can be attributed to the periodic fluctuation in the cross-sectional area of the optimized flow channel, which imparts a greater shear force on the gas and consequently leads to greater deformation of liquid water.
  • Increasing the GDL pore size and gas velocity appropriately can aid in the discharge of liquid water. However, if the pore size becomes excessively large, it can lead to increased water flooding. The optimal GDL aperture size is typically between 1.0–1.2 mm, while the recommended gas velocity range is 6–8 m/s.
  • Smaller droplets experience smaller gas shear forces, making it more difficult for them to exit the flow channel. In comparison to the 2D channel, the 3D channel is more effective at removing smaller droplets and mitigating the issue of liquid water blocking the flow channel.

Author Contributions

Conceptualization, Z.L.; Methodology, Z.L. and S.W.; Software, Z.L. and J.W.; Validation, Z.L. and J.W.; Formal analysis, Z.L.; Data curation, S.W.; Writing—original draft, W.L. and X.X.; Writing—review & editing, W.L.; Visualization, X.X.; Funding acquisition, X.X. All authors have read and agreed to the published version of the manuscript.

Funding

This research received no external funding.

Data Availability Statement

Not applicable.

Acknowledgments

This work was supported by the Financially supported by Laoshan Laboratory (LSKJ202204503).

Conflicts of Interest

The authors declare no conflict of interest.

References

  1. Bhogilla, S.S.; Muthukumar, P. Thermal integration of Proton Exchange Membrane Fuel Cell with recuperative organic rankine cycle. Int. J. Hydrogen Energy 2021, 46, 14748–14756. [Google Scholar] [CrossRef]
  2. Zhao, J.; Guo, H.; Ping, S.; Guo, Z.; Lin, W.; Yang, Y.; Shi, W.; Wang, Z.; Ma, T. Research on Design and Optimization of Large Metal Bipolar Plate Sealing for Proton Exchange Membrane Fuel Cells. Sustainability 2023, 15, 12002. [Google Scholar] [CrossRef]
  3. Wu, C.; Zhang, W.; Han, X.; Zhang, Y.; Ma, G. A systematic review for structure optimization and clamping load design of large proton exchange membrane fuel cell stack. J. Power Sources 2020, 476, 228724. [Google Scholar] [CrossRef]
  4. Chu, T.; Zhang, R.; Wang, Y.; Ou, M.; Xie, M.; Shao, H.; Yang, D.; Li, B.; Ming, P.; Zhang, C. Performance degradation and process engineering of the 10 kW proton exchange membrane fuel cell stack. Energy 2021, 219, 119623. [Google Scholar] [CrossRef]
  5. Poulsen, M.; Larsen, M.; Andersen, S. Improved durability of proton exchange membrane fuel cells by introducing Sn (IV) oxide into electrodes using an ion exchange method. J. Power Sources 2017, 343, 174–182. [Google Scholar] [CrossRef]
  6. Najjari, M.; Khemili, F.; Ben Nasrallah, S. The effects of the cathode flooding on the transient responses of a PEM fuel cell. Renew. Energy 2008, 33, 1824–1831. [Google Scholar] [CrossRef]
  7. Nara, H.; Momma, T.; Osaka, T. Impedance analysis of the effect of flooding in the cathode catalyst layer of the polymer electrolyte fuel cell. Electrochim. Acta 2013, 113, 720–729. [Google Scholar] [CrossRef]
  8. Endoh, E.; Terazono, S.; Widjaja, H.; Takimoto, Y. Degradation study of MEA for PEMFCs under low humidity conditions. Electrochem. Solid-State Lett. 2004, 7, A209–A211. [Google Scholar] [CrossRef]
  9. Healy, J.; Hayden, C.; Xie, T.; Olson, K.; Waldo, R.; Brundage, M.; Gasteiger, H.; Abbott, J. Aspects of the chemical degradation of PFSA ionomers used in PEM fuel cells. Fuel Cell 2005, 5, 302–308. [Google Scholar] [CrossRef]
  10. Knights, S.D.; Colbow, K.M.; St-Pierre, J.; Wilkinson, D.P. Aging mechanisms and lifetime of PEFC and DMFC. J. Power Sources 2004, 127, 127–134. [Google Scholar] [CrossRef]
  11. Hasheminasab, M.; Kermani, M.; Nourazar, S.; Khodsiani, M. A novel experimental based statistical study for water management in proton exchange membrane fuel cells. Appl. Energy 2020, 264, 114713. [Google Scholar] [CrossRef]
  12. Ma, H.; Zhang, H.; Hu, J.; Cai, Y.; Yi, B. Diagnostic tool to detect liquid water removal in the cathode channels of proton exchange membrane fuel cells. J. Power Sources 2006, 162, 469–473. [Google Scholar] [CrossRef]
  13. Liu, X.; Guo, H.; Ye, F.; Ma, C.F. Flow dynamic characteristics in flow field of proton exchange membrane fuel cells. Int. J. Hydrogen Energy 2008, 33, 1040–1051. [Google Scholar] [CrossRef]
  14. Zhang, L.; Bi, H.T.; Wilkinson, D.P.; Stumper, J.; Wang, H. Gas–liquid two-phase flow patterns in parallel channels for fuel cells. J. Power Sources 2008, 183, 643–650. [Google Scholar] [CrossRef]
  15. Lu, Z.; Kandlikar, S.; Rath, C.; Grimm, M.; Domigan, W.; White, A.; Hardbarger, M.; Owejan, J.; Trabold, T. Water management studies in PEM fuel cells, Part II: Ex situ investigation of flow maldistribution, pressure drop and two-phase flow pattern in gas channels. Int. J. Hydrogen Energy 2009, 34, 3445–3456. [Google Scholar] [CrossRef]
  16. Kim, H.-I.; Nam, J.H.; Shin, D.; Chung, T.-Y.; Kim, Y.-G. A numerical study on liquid water exhaust capabilities of flow channels in polymer electrolyte membrane fuel cells. Curr. Appl. Phys. 2010, 10, S91–S96. [Google Scholar] [CrossRef]
  17. Arvay, A.; French, J.; Wang, J.-C.; Peng, X.-H.; Kannan, A. Nature inspired flow field designs for proton exchange membrane fuel cell. Int. J. Hydrogen Energy 2013, 38, 3717–3726. [Google Scholar] [CrossRef]
  18. Liu, X.; Guo, H.; Ma, C. Water flooding and two-phase flow in cathode channels of proton exchange membrane fuel cells. J. Power Sources 2006, 156, 267–280. [Google Scholar] [CrossRef]
  19. Bazylak, A.; Sinton, D.; Liu, Z.-S.; Djilali, N. Effect of compression on liquid water transport and microstructure of PEMFC gas diffusion layers. J. Power Sources 2007, 163, 784–792. [Google Scholar] [CrossRef]
  20. Cheah, M.J.; Kevrekidis, I.G.; Benziger, J.B. Water Slug Formation and Motion in Gas Flow Channels: The Effects of Geometry, Surface Wettability, And Gravity. Langmuir 2013, 29, 9918–9934. [Google Scholar] [CrossRef]
  21. Song, M.; Pei, P.; Zha, H.; Xu, H. Water management of proton exchange membrane fuel cell based on control of hydrogen pressure drop. J. Power Sources 2014, 267, 655–663. [Google Scholar] [CrossRef]
  22. Cho, J.; Kim, H.-S.; Min, K. Transient response of a unit proton-exchange membrane fuel cell under various operating conditions. J. Power Sources 2008, 185, 118–128. [Google Scholar] [CrossRef]
  23. Kim, H.-S.; Min, K. Experimental investigation of dynamic responses of a transparent PEM fuel cell to step changes in cell current density with operating temperature. J. Mech. Sci. Technol. 2008, 22, 2274–2285. [Google Scholar] [CrossRef]
  24. Hussaini, I.S.; Wang, C.-Y. Visualization and quantification of cathode channel flooding in PEM fuel cells. J. Power Sources 2009, 187, 444–451. [Google Scholar] [CrossRef]
  25. Sugiura, K.; Nakata, M.; Yodo, T.; Nishiguchi, Y.; Yamauchi, M.; Itoh, Y. Evaluation of a cathode gas channel with a water absorption layer/waste channel in a PEFC by using visualization technique. J. Power Sources 2005, 145, 526–533. [Google Scholar] [CrossRef]
  26. Chen, J. Experimental study on the two phase flow behavior in PEM fuel cell parallel channels with porous media inserts. J. Power Sources 2010, 195, 1122–1129. [Google Scholar] [CrossRef]
  27. Chen, X.; Yu, Z.; Yang, C.; Chen, Y.; Jin, C.; Ding, Y.; Li, W.; Wan, Z. Performance investigation on a novel 3D wave flow channel design for PEMFC. Int. J. Hydrogen Energy 2021, 46, 11127–11139. [Google Scholar] [CrossRef]
  28. Konno, N.; Mizuno, S.; Nakaji, H.; Ishikawa, Y. Development of Compact and High-Performance Fuel Cell Stack. SAE Int. J. Alt. Power. 2015, 4, 123–129. [Google Scholar] [CrossRef]
  29. Nonobe, Y. Development of the Fuel Cell Vehicle Mirai. IEEJ Trans. 2017, 12, 5–9. [Google Scholar] [CrossRef] [Green Version]
  30. Zhu, X.; Sui, P.; Djilali, N. Dynamic behaviour of liquid water emerging from a GDL pore into a PEMFC gas flow channel. J. Power Sources 2007, 172, 287–295. [Google Scholar] [CrossRef]
  31. Zhu, X.; Sui, P.; Djilali, N. Three-dimensional numerical simulations of water droplet dynamics in a PEMFC gas channel. J. Power Sources 2008, 181, 101–115. [Google Scholar] [CrossRef]
  32. Le, A.D.; Zhou, B. Fundamental understanding of liquid water effects on the performance of a PEMFC with serpentine-parallel channels. Electrochim. Acta 2009, 54, 2137–2154. [Google Scholar] [CrossRef]
  33. Manso, A.P.; Marzo, F.F.; Barranco, J.; Garikano, X.; Mujika, M.G. Influence of geometric parameters of the flow fields on the performance of a PEM fuel cell. A review. Int. J. Hydrogen Energy 2012, 37, 15256–15287. [Google Scholar] [CrossRef]
  34. Kim, J.; Luo, G.; Wang, C.-Y. Modeling two-phase flow in three-dimensional complex flow-fields of proton exchange membrane fuel cells. J. Power Sources 2017, 365, 419–429. [Google Scholar] [CrossRef]
  35. Li, W.; Zhang, Q.; Wang, C.; Yan, X.; Shen, S.; Xia, G.; Zhu, F.; Zhang, J. Experimental and numerical analysis of a three-dimensional flow field for PEMFCs. Appl. Energy 2017, 195, 278–288. [Google Scholar] [CrossRef]
  36. Perng, S.-W.; Wu, H.-W. Heat transfer in a PEMFC flow channel. Appl. Therm. Eng. 2009, 29, 3579–3594. [Google Scholar] [CrossRef]
  37. Bilgili, M.; Bosomoiu, M.; Tsotridis, G. Gas flow field with obstacles for PEM fuel cells at different operating conditions. Int. J. Hydrogen Energy 2015, 40, 2303–2311. [Google Scholar] [CrossRef]
  38. Kuo, J.-K.; Yen, T.-S.; Chen, C.-K. Improvement of performance of gas flow channel in PEM fuel cells. Energ. Convers. Manag. 2008, 49, 2776–2787. [Google Scholar] [CrossRef]
  39. Kuo, J.K.; Yen, T.H. Three-dimensional numerical analysis of PEM fuel cells with straight and wave-like gas flow fields channels. J. Power Sources 2008, 177, 96–103. [Google Scholar] [CrossRef]
  40. Perng, S.-W.; Wu, H.-W. A three-dimensional numerical investigation of trapezoid baffles effect on non-isothermal reactant transport and cell net power in a PEMFC. Appl. Energy 2015, 143, 81–95. [Google Scholar] [CrossRef]
  41. Ghanbarian, A.; Kermani, M. Enhancement of PEM fuel cell performance by flow channel indentation. Energ. Convers. Manag. 2016, 110, 356–366. [Google Scholar] [CrossRef]
  42. Wang, B.; Chen, W.; Pan, F.; Wu, S.; Zhang, G.; Park, J.W.; Xie, B.; Yin, Y.; Jiao, K. A dot matrix and sloping baffle cathode flow field of proton exchange membrane fuel cell. J. Power Sources 2019, 434, 226741. [Google Scholar] [CrossRef]
  43. Guo, H.; Chen, H.; Ye, F.; Ma, C.F. Baffle shape effects on mass transfer and power loss of proton exchange membrane fuel cells with different baffled flow channels. Int. J. Energy Res. 2019, 43, 2737–2755. [Google Scholar] [CrossRef]
  44. Li, Z.; Wang, S.; Li, W.; Zhu, T.; Fan, Z.; Xie, X. Droplet dynamics in a proton exchange membrane fuel cell flow field design with 3D geometry. Int. J. Hydrogen Energy 2021, 46, 16693–16707. [Google Scholar] [CrossRef]
  45. Li, Z.; Wang, S.; Yao, S.; Wang, X.; Li, W.; Zhu, T.; Xie, X. Experimental and numerical study on improvement performance by wave parallel flow field in a proton exchange membrane fuel cell. Chin. J. Chem. Eng. 2022, 45, 90–102. [Google Scholar] [CrossRef]
  46. El-Kharouf, A.; Mason, T.J.; Brett, D.J.; Pollet, B.G. Ex-situ characterisation of gas diffusion layers for proton exchange membrane fuel cells. J. Power Sources 2012, 218, 393–404. [Google Scholar] [CrossRef] [Green Version]
  47. Zenyuk, I.V.; Parkinson, D.Y.; Connolly, L.G.; Weber, A.Z. Gas-diffusion-layer structural properties under compression via X-ray tomography. J. Power Sources 2016, 328, 364–376. [Google Scholar] [CrossRef] [Green Version]
  48. Ous, T.; Arcoumanis, C. Visualisation of water droplets during the operation of PEM fuel cells. J. Power Sources 2007, 173, 137–148. [Google Scholar] [CrossRef]
  49. Yang, J.; Ma, X.; Fei, L.; Zhang, X.; Luo, K.H.; Shuai, S. Effects of hysteresis window on contact angle hysteresis behaviour at large Bond number. J. Colloid Interface Sci. 2020, 566, 327–337. [Google Scholar] [CrossRef]
  50. Wang, X.; Chen, S.; Fan, Z.; Li, W.; Wang, S.; Li, X.; Zhao, Y.; Zhu, T.; Xie, X. Laser-perforated gas diffusion layer for promoting liquid water transport in a proton exchange membrane fuel cell. Int. J. Hydrogen Energy 2017, 42, 29995–30003. [Google Scholar] [CrossRef]
Figure 1. Computational domain of 2D straight channel and 3D wave channel.
Energies 16 05892 g001
Figure 2. Schematic diagram of PEMFC experimental device.
Energies 16 05892 g002
Figure 3. Schematic diagram of grid generation strategy. Diagram (a) is the block structure. Diagram (b) is the grid generation diagram.
Energies 16 05892 g003
Figure 4. Comparison of experimental and simulation results.
Energies 16 05892 g004
Figure 5. Numerical results for grid independency test of 3D wave channel.
Energies 16 05892 g005
Figure 6. Evolution of droplet motion distance from initial position with time.
Energies 16 05892 g006
Figure 7. Time evolution of interface during droplet detachment from pore. (ae) The time of droplets changing into the same morphology in two different channels. Based on the aforementioned analysis, the dynamic behavior of water droplets can be summarized as follows: the droplets enter the gas channels from the GDL pores and commence their growth. After reaching a certain volume, they detach from the pore size under external force and then move towards the outlet of the flow channel until they exit the flow channel. However, the shape change characteristics of droplets under gas action are not clear, so it is necessary to study the changes in droplet length L, width W, and height H over time from the time the droplet protrudes from the pore until the first droplet leaves the flow channel.
Energies 16 05892 g007
Figure 8. Dynamic behavior of water droplets in channel. Diagram (a) is the outline of the droplet moving in the flow channel. Diagrams (ac) are the change in L, H and W for droplet with time.
Energies 16 05892 g008
Figure 9. Force on droplet surface.
Energies 16 05892 g009
Figure 10. The critical separation diameter and critical separation time of droplets in 3D flow passage vary with the flow velocity.
Energies 16 05892 g010
Figure 11. Effect of gas velocity on dynamic behavior of water droplets in 3D wave channel. Diagrams (ac) are the change in L, H and W for droplet with time.
Energies 16 05892 g011
Figure 12. Surface coverage of liquid water in 3D channel.
Energies 16 05892 g012
Figure 13. Saturation and surface coverage of liquid water in 3D channel for different water inlet diameter. Diagram (a) is the change in saturation of liquid water in the channel with time. Diagram (b) is the change in the coverage of liquid water on GDL with time.
Energies 16 05892 g013
Figure 14. Droplet motion shape in 3D channel with different water inlet diameters and velocity; Diagrams (ad) are the gas velocity which are 4 m/s, 6 m/s, 8 m/s, 10 m/s, respectively.
Energies 16 05892 g014
Figure 15. Time of droplet leaving 3D wave channel. Diagram (a) is the influence of gas velocity for droplet totally leave channel. Diagram (b) is the influence of hole diameter of GDL for droplet to totally leave channel.
Energies 16 05892 g015
Disclaimer/Publisher’s Note: The statements, opinions and data contained in all publications are solely those of the individual author(s) and contributor(s) and not of MDPI and/or the editor(s). MDPI and/or the editor(s) disclaim responsibility for any injury to people or property resulting from any ideas, methods, instructions or products referred to in the content.

