
Robust Electro-Thermal Modeling of Lithium-Ion Batteries for Electrified Vehicles Applications
1
Department of Electrical and Computer Engineering, McMaster University, Hamilton, ON L8S 4L8, Canada
2
Department of Mechanical Engineering, McMaster University, Hamilton, ON L8S 4L8, Canada
*
Author to whom correspondence should be addressed.
Energies 2023, 16(16), 5887; https://doi.org/10.3390/en16165887
Submission received: 7 July 2023
/
Revised: 31 July 2023
/
Accepted: 5 August 2023
/
Published: 9 August 2023
(This article belongs to the Special Issue State-of-the-Art in Electric Vehicle Battery State of Charge, Health and Power Estimation)
Abstract
:Lithium-ion battery (LIBs) packs represent the most expensive and safety-critical components in any electric vehicle, requiring accurate real-time thermal management. This task falls under the battery management system (BMS), which plays a crucial role in ensuring the longevity, safety, and optimal performance of batteries. The BMS accurately monitors cell temperatures and prevents thermal runaway by leveraging multiple temperature sensors; however, adding a temperature sensor to each individual cell is not practical and increases the total cost of the EV. This paper provides three key original contributions: (1) the development and optimization of a new efficient electro-thermal battery model that accurately estimates the LIB voltage and temperature, which reduces the required number of temperature sensors; (2) the investigation of the ECM parameters’ dependency on the state of charge (SOC) at a wide range of ambient temperatures, including cold temperatures; (3) the testing and validation of the proposed electro-thermal model using real-world dynamic drive cycles and temperature ranges from −20 to 25 °C. Results indicate the effectiveness of the proposed electro-thermal model, which shows good estimation accuracy with an average error of 50 mV and 0.5 °C for the battery voltage and surface temperature estimation, respectively.
1. Introduction
Recently, lithium-ion batteries (LIBs) have been considered the most industry-preferred batteries when it comes to the application of hybrid and electric vehicles [1]. This is because of their high energy density, durability, and low self-discharge rates [2]. With electrified vehicle (EV) applications, battery management systems (BMSs) are being developed and continuously improved to monitor and control the battery states, including the state of charge [3], state of health [4], and battery temperature [5]. A robust BMS should accurately track the battery behavior and characteristics, which is critical for safe battery pack operation. The LIBs’ real-time performance varies drastically with temperature variations [5], where they function best at room temperature, and their nominal performance is generally determined at this temperature. LIBs’ operation at elevated temperatures improves their performance momentarily; however, prolonged exposure to high temperatures will significantly reduce the battery capacity and cause permanent damage to the battery pack [2]. On the other hand, operating LIBs at lower temperatures increases the internal resistance, and hence the battery performance starts to deteriorate as the rate of chemical reactions inside the battery is reduced [6]. Therefore, LIB models should be tested and validated at a wide range of operating temperatures before deployment to the BMS to accurately track a battery’s electrical and thermal behavior.
LIBs are configured in series and parallel combinations in the pack to provide sufficient power and energy for the vehicle. The cells in the pack experience significant temperature differences during operation; hence, the cells’ temperature should be monitored onboard. Failure of the BMS to measure or adequately estimate a battery temperature rise could result in thermal runaway and potentially destroy the battery pack [7]. Temperature sensors are widely used to measure the temperatures of LIBs; however, due to costs, it is often impractical to sense the temperature of every cell. Moreover, the reliability and accuracy of the temperature sensors may also be another limitation [3]. Hence, accurate battery temperature estimation models could be used as an efficient alternative to monitor the cells’ temperatures, helping in battery pack thermal management system design and thus enhancing the reliability and safety of the battery pack during design and operation [1]. To do so, thermal models are developed better to mimic the LIB temperature under different operating conditions.
LIB modeling methods can be broadly categorized into three groups, namely physics-based methods [8,9,10,11,12,13,14], data-driven methods [15,16,17,18,19,20], and equivalent circuit model (ECM)-based methods [21,22,23,24,25,26,27]. The physics-based methods aim to model the battery’s internal physical and chemical dynamics. The charge, the mass transfer between the porous electrodes and the electrolyte, and solid particle diffusion are considered in these models [8,9,10,11,12,13,14]. These methods show high accuracy in simulating the battery’s electrical and thermal behavior. However, physics-based methods are incredibly complex due to the involvement of several partial differential equations, which are highly computationally expensive [24]. This challenges the ability to run these models onboard the BMS in EV applications. Data-driven methods are empirical methods that are used to mimic the battery’s main characteristics, including the voltage [15], state of charge (SOC) [16], and core and surface temperature distribution [17,18,19,20], by constructing complex input–output relationships. Data-driven methods aim to limit the sensors’ use and can be efficient alternatives to sensors; however, they are dependent on the training data and the optimization algorithms used. ECM-based methods utilize electrical active and passive components such as resistors, capacitors [21,22,23,24,25,26,27], and electrochemical impedance spectroscopy [24] to model the discharging and charging processes of the LIBs. The advantages of ECM-based methods include simplicity in implementation, a low computational load, and parameter identification simplicity [22]. This makes ECM-based methods an optimal choice when it comes to real-time use in EVs. However, enhancing the fidelity of the ECM models is always required to be able to model the dynamic battery performance at different thermal conditions.
Generally, the generated heat from electrical battery models is coupled with battery thermal equations to model the temperature distribution over the cell. The thermal models can be categorized into lumped parameters or multi-dimensional models, based on the temperature distribution considered in the study, where these models utilize the thermal properties of the LIBs to mimic the temperature distribution over the cell dimensions. The lumped thermal models are well-known and extensively studied techniques. These models assume a homogenous temperature distribution over the cell and approximate the temperature distribution to certain states [10,22,25,28,29,30,31,32,33,34]. Although modeling temperature gradients across different flux directions is possible utilizing energy balance equations, it increases the number of parameters and the complexity of the thermal model. The multi-dimensional models include one-dimensional (1D) [35,36], two-dimensional (2D) [37,38], and three-dimensional (3D) [39,40] thermal models. The multi-dimensional thermal models simulate the temperature gradient over the cell dimensions, considering the charge conservation, kinetic equations, and boundary conditions. These models have demonstrated their efficiency in modeling the temperature gradient, especially in pouch cells. However, due to the high nonlinearity of the governing equations of these models, they require high processing and memory capabilities [40].
Hence, the ECM coupled with the lumped parameter thermal model can be considered a less computationally expensive choice that can mimic the LIBs’ electrical and thermal behavior with reasonable accuracy. This model can also be implemented onboard due to the reduced number of equations and parameters utilized. Different studies have addressed the ECM coupled with the lumped parameter thermal model [10,25,28,29,30,31,32,33,34]. The study in [25] tested an electro-thermal model of a pouch cell in hardware in the loop (HIL) to ensure the feasibility of deploying this model in an automotive microprocessor. The study also investigated the dependency of the ECM parameters on the SOC and ambient temperature. Moreover, the study considered both reversible and irreversible heat sources in the energy balance equation. On the other hand, the study considered the heat propagation delay, heat radiation, and cell radial non-homogeneity when developing the thermal model. The proposed model in [28] was able to estimate the battery temperature for a range of ambient temperatures with an error range from 0.06 to 0.66 °C. Increasing the number of heat sources in the energy balance equation enhanced the fidelity of the model; however, it resulted in utilizing a larger number of electrical and thermal parameters, which needed to be previously known or estimated onboard. The study in [29] proposed a resistive-only ECM (R-ECM) coupled with a lumped model. The model was validated using various charge current profiles at a range of positive ambient temperatures. However, the study in [30] expanded the studied ambient temperature range to include colder situations, where the battery behavior tends to be nonlinear. In the aforementioned studies, the models were validated using standard or pulsating charge and discharge profiles; however, other studies have considered realistic dynamic drive cycles when testing their models [10,22,31,32,33,34].
In [10], the authors utilized a physics-based equivalent circuit model (PB-ECM) with one RC parallel pair and one state-lumped thermal model to model the cell voltage and surface temperature. This was coupled with an ensemble Kalman filter (EnKF) to capture the battery SOC, which led to a significant improvement in the SOC estimation accuracy. Moreover, the studies in [22,31] investigated the impact of the different dynamic power profiles and ambient temperatures on the cell heat generated and the thermal aspects of a first-order ECM (1RC-ECM) coupled with a lumped thermal model. In addition, the study in [32] utilized a recursive least squares filter (RLS) and a dual extended Kalman filter (DKF) to estimate the parameters of a lumped thermal model onboard. This model was able to model the battery core and surface temperature at room temperature with an error of 0.4 and 0.3 °C, respectively. Moreover, the study in [33] investigated the different depths of discharge of dynamic power profiles on the temperature estimation capability of an R-ECM and lumped thermal model. The study showed the proposed model’s ability to capture the battery’s thermal behavior with an error of less than 2.5 °C at a maximum current rate (C-rate) of 1.5C. In comparison, the study in [34] expanded the maximum C-rate to 22C. The proposed model in [34] was able to simulate the electrical and thermal behavior of the battery with an error of 20.3 mV and 0.65 °C, respectively, for the current sustaining cycle. Table 1 summarizes the relevant studies in the literature and the corresponding battery type, parameter estimation algorithm, validation dataset, studied ambient temperatures, and depth of discharge. The studies in the literature show that coupling the ECM with a lumped thermal parameter model can achieve several benefits, including accuracy, low complexity, and the ability to model the LIB temperature at different dynamic and ambient conditions.
While previous studies focused on model voltage and temperature validation with constant charge and discharge profiles, and some studies explored the cold temperature performance of models, this research stands out by combining these elements and pushing the boundaries further. This work fills a critical gap in the existing literature by investigating the highly nonlinear behavior of LIBs at low temperatures and validating the electro-thermal model with diverse dynamic drive cycles. This study also sheds light on both the strengths and weaknesses of the electro-thermal model, assessing its potential suitability for real-world applications in electric vehicles operating under diverse climatic conditions. Hence, the main contributions of this paper can be summarized as follows: (1) introducing an accurate ECM integrated with a lumped parameter thermal model, enabling a more comprehensive representation of battery behavior under various conditions; (2) investigating the ECM parameters’ dependency on the SOC at different ambient temperatures, particularly in cold environments, significantly impacting the heat generation modeling accuracy; (3) proposing a robust parameter estimation method, enhancing the model reliability by addressing uncertainties in battery characteristics; (4) showcasing real-time model predictions, crucial for applications such as EVs and other automotive applications; (5) model validation using extensive field data from real-world EVs, which enhances the credibility and practical applicability.
The rest of the paper is organized as follows. Section 2 introduces the proposed ECM and the lumped thermal battery models. Section 3 describes the electrical and thermal parameter estimation process. Section 4 presents the results and discussion of the proposed electro-thermal model. Finally, in Section 5, conclusions are presented.
2. The Proposed Electro-Thermal Model
In this study, the proposed electro-thermal model consists of a combination of a second-order ECM (2RC-ECM) and a lumped parameter thermal model, as shown in Figure 1. The model parameters are obtained offline using characterization and sample experimental tests. Then, the estimated model parameters are validated using different dynamic drive cycles at different ambient temperatures on a real-time basis. The details of each model configuration are outlined in this section.
2.1. Equivalent Circuit Model Configuration
The ECM usually consists of an open-circuit voltage (OCV) along with resistance in series with a different number of parallel RC pairs. The series resistance represents the polarization voltage, while the RC pairs represent the diffusion voltage effects of the LIBs. Although increasing the number of these pairs increases the accuracy of the model, it leads to the additional computational complexity of the model and may lead to the overfitting of the model with the proposed characterization test data. The 2RC-ECM utilized in this work shows a reasonable trade-off between complexity and accuracy [41]. This model consists of an OCV in series with two parallel RC pairs, as shown in Figure 2. Hence, the model parameters are R0, R1, R2, C1, C2, along with OCV.
This model is fit to a series of five pairs of discharged current pulses of varying magnitude from a hybrid power pulse characterization test (HPPC) [42]. Figure 3 shows the battery voltage response from one current pulse and how the proposed 2RC-ECM fits these data. The series resistance (R0) is responsible for the immediate increase or decrease in the voltage. Moreover, the parallel RC pairs capture the time-dependent dynamics of the voltage response.
The model equations are described in (1)–(3) and were implemented in the MATLAB (version 2020b) environment.
where is the change in time, and , are the corresponding resistances and capacitances of branch I and are functions of the SOC and the ambient temperature. The model uses the current each time step k to calculate the corresponding currents , of both RC branches. The simulated terminal voltage is then obtained using the OCV along with the resistances and parallel branches’ currents. After constructing the model equations, genetic algorithm (GA) [43] optimization is used to obtain the ECM parameters for each SOC level and ambient temperature. The fitting process is repeated at 14 SOC levels and five ambient temperatures, and a table of parameters is constructed, including the full range of the SOC and temperature.
2.2. Thermal Model Configuration
Thermal management is a critical aspect in developing the BMS as it significantly affects the battery’s performance. The model proposed in this study is a two-state lumped parameter thermal model where classical heat transfer equations are utilized [44], as shown in Figure 4. The lumped parameter model is built based on the assumption that the heat is generated at the core, along with a zero-heat flux [45]. The heat generation due to a change in entropy in the cell is ignored in this formulation, and only the irreversible losses are considered. Hence, the model equations can be summarized as follows:
where and denote the surface and the core temperature, respectively; is the ambient temperature. The heat generated at the center is given by , and represent the thermal conduction resistance of the core of the battery and the convection thermal resistance between the battery surface and the ambient environment, respectively. is the heat capacity of the core of the battery and is the heat capacity for the casing of the battery.
The heat generation in the battery can be modeled by summing the losses of each individual resistance in the ECM. Therefore, it can be written as
A state-space model with the governing equations was formed to model the thermal behavior of the battery as follows:
where the state vector (x) contains the core and the surface temperatures of the battery, while the control vector (u) contains the input currents to the ECM and the ambient temperature. Hence, the matrices are given as follows:
In this study, the chamber cooling rate, coolant properties, and battery health are kept the same for all test cases. The details of the parameter estimation process are explained in Section 3.
3. Electro-Thermal Model Parameter Estimation
The accuracy of the parameters’ estimation method for the ECM and the thermal model is essential to mimic the LIB behavior at various conditions. An offline GA is utilized in this study to obtain the parameters of the proposed electro-thermal model in the MATLAB environment, as shown in Figure 5. An HPPC test is used to obtain the ECM parameters at each temperature. Moreover, a sample drive cycle test is used to obtain the thermal parameters of the battery. A cylindrical Panasonic 18650PF battery with 2.9 Ah and 3.6 V nominal capacity and voltage, respectively, was used in this study [46].
The specifications of the battery and battery cycler test setup are adopted from [15,47] and outlined in Table 2 and Table 3. To generate the data for the model, the battery was tested using standard characterization and drive cycle tests at five different ambient temperatures.
These tests include characterization and drive cycles, where each test is separated by a 1C-rate charge profile. The chamber temperature airflow is controlled to maintain the ambient temperature at a fixed value during each of the drive cycles. The ambient temperatures included in these tests are −20, −10, 0, 10, and 25 °C.
The drive cycles’ powers are calculated for a Ford F150 electric truck. This truck contains a battery pack consisting of 3680 cells and is scaled for a single cell to generate the cell power profiles. The combination of a heavy vehicle with a small battery pack of 36 kWh produces power profiles that stress the battery, resulting in peak currents as high as 16 amps (>5C-rate). The drive cycle power profiles consist of the common UDDS, LA92, HWFET, and US06 standard drive cycles. The drive cycles have average power ranging from 1.45 to 7.25 W. The full details of the drive cycles’ power are presented in Table 4.
For each drive cycle test, the battery starts fully charged at 100% SOC, and the drive cycle is repeated until the amp-hours are equal to the measured 1C-rate discharge capacity at the respective temperature. This range of drive cycles is utilized to evaluate the proposed model’s performance because each cycle has quite different characteristics, which challenge the model in different ways. The generated data set contains the battery’s voltage, current, capacity, power, battery temperature, and chamber temperature. The test setup and battery chamber configuration are shown in Figure 6.
3.1. ECM Parameter Estimation
In this study, the proposed second-order ECM parameters’ dependency on the SOC and the temperature is investigated. The ECM parameters are fit to the HPPC test data at each ambient temperature. The HPPC test includes a series of ten-second-long discharge current pulses ranging from 0.5C-rate to 6C-rate, with a pause interval of twenty minutes between each discharge pulse. This process is repeated for each 5% SOC step from 0% to 20% and 80% to 100% SOC and each 10% SOC step from 20% to 80% SOC. As a result, 14 ECM parameters are obtained at each SOC breakpoint for the temperature. The measured battery surface temperature is used during the parameters’ identification process, while the thermal model’s simulated temperature is used in the validation stage, as shown in Figure 5. For each temperature, the optimal resistances and capacitances are estimated using the GA at each SOC breakpoint by minimizing the root mean square error ( between the actual and estimated terminal voltage, as given in (10) and (11). The GA parameters are tuned to 1000 populations with 100 generations each. Table 5 presents the initial and boundary values for each parameter of the ECM and thermal model.
where
where N is the total number of data points at each SOC interval, and is the measured voltage.
Figure 7 shows the model fit to the HPPC at the two extreme ambient temperatures, i.e., −20 °C and 25 °C, while Figure 8 summarizes the voltage estimation root mean square error for the ECM voltage fitting to the HPPC at the whole range of the studied ambient temperatures. The figures show the ability of the ECM to fit the HPPC test data at different temperatures with a reasonable error, where the model voltage estimation RMSE is almost identical for all temperatures that are below 15 mV. The fitting results show the robustness of the GA in its ability to extract the ECM parameters at all temperatures and SOC levels. Moreover, Figure 9 shows the fitted cell parameters and the open-circuit voltage extracted from the GA at each SOC level and ambient temperature ranging from −20 to 25 °C. Figure 9 shows how the ECM parameters vary over the ambient temperature and SOC ranges. Overall, the model shows higher resistance at lower temperatures, especially at −20 °C. Hence, approximating the ECM parameters for all SOC and ambient temperature ranges leads to inaccuracy in the modeling and the heat generation calculation processes.
3.2. Thermal Model Parameter Estimation
The thermal parameters of the battery are not easy to obtain as they are dependent on many operating conditions. Several studies have addressed online or offline thermal parameter estimation methods. The offline parameter estimation method has the advantage of being less complex and is more accurate if the ECM parameters’ dependency on the temperature and SOC is considered before they are fed to the thermal model. In this study, as with the ECM parameter estimation, an offline GA optimization method is utilized. Table 2 and Table 3 and Figure 6 describe the battery specifications and test setup used to run the tests and obtain the thermal model parameters. To ensure the fidelity of the proposed thermal model, a sample mixed cycle consisting of a random combination of the standard drive cycles is used to obtain the thermal model parameters, as described in Figure 5. This cycle includes portions of the UDDS, LA92, HWFET, and US06 drive cycles at a 25 °C ambient temperature. In contrast, the standard drive cycles are kept hidden from the parameter estimation process and are used to validate the model at a range of ambient temperatures.
The GA is utilized to obtain the thermal parameters that minimize the RMSE between the estimated and the measured battery surface temperature of the mixed drive cycle (), as described in Equations (12) and (13).
where
where is the actual measured surface temperature, and P is the total length of the mixed drive cycle.
The GA population size was set as 3000, with a generation limit of 20 generations each. The initial value and the boundaries of each parameter are mentioned in Table 5. Table 6 summarizes the optimal thermal parameters obtained from the GA using the drive cycle, while Figure 10 shows the estimated temperature of the proposed thermal model and the corresponding error when for the sample mixed drive cycle used in the parameter estimation process. The offline battery thermal parameters obtained from GA can mimic this mixed drive cycle with a maximum error of less than one °C.
The chamber cooling rate, coolant properties, and battery health are kept fixed in all tests. Hence, the variation in the thermal model parameters with the ambient temperature change can be neglected in this study. In the next section, both the ECM and the thermal model are validated using dynamic drive cycles at different ambient conditions.
4. Results and Discussion
In this section, the proposed electro-thermal model is validated using four different standard dynamic drive cycles. These drive cycles are UDDS, LA92, HWFET, and US06. The proposed model is also tested and validated at five different ambient temperatures, namely −20, −10, 0, 10, and 25 °C. For each drive cycle, the ambient temperature is kept constant by controlling the cooling system of the thermal chamber. Both model parts share the parameters when tested using the aforementioned drive cycles and ambient temperatures, as shown in Figure 5. The ECM voltage estimation capability results are presented first. Then, the thermal model surface temperature estimation is validated using the same cycles that were used to test the performance of the ECM.
4.1. ECM Validation Results
To validate the obtained ECM parameters, the second-order ECM model voltage estimation is benchmarked using the actual measured voltage. Four automotive standard drive cycles are used to test and validate the proposed model. The ECM inputs are the drive cycle measured current, the battery surface temperature, and the SOC, which is calculated through the coulomb counting method. The input current and the corresponding SOC are fed into the ECM model while the temperatures are estimated using the coupled thermal model. The ECM parameters are calculated at each time step by interpolating between the parameters obtained offline using the GA based on the cell surface temperature and SOC input values. The cell voltage is usually measured using voltage sensors installed on each cell; however, the accuracy of the voltage estimation is essential to ensure the fidelity of the coupled thermal model.
Figure 11 summarizes the RMSE of the voltage estimation at the mentioned drive cycles and ambient temperatures. From −20 to 25 °C, the ECM can capture the battery dynamics with reasonable RMSE ranges from 15 to 129 mV for all drive cycles and ambient temperatures. The less dynamic UDDS drive cycle has the best results, with the lowest RMSE of 15 mV, while the US06, which is the most aggressive drive cycle, has the worst testing results, with an RMSE of 129 mV. Overall, the ECM can capture the dynamics of less aggressive drive cycles such as UDDS, LA92, and HWFET with a reasonable error at all temperatures. However, for the US06 drive cycle, the ECM shows more than double the error of the remaining drive cycles at almost 75% of the studied ambient temperatures. Figure 12 shows the estimated voltage, measured voltage, and the corresponding error for the UDDS at 25 °C, i.e., the best case, and US06 at −20 °C, i.e., the worst case.
Generally, the figures demonstrate the ability of the ECM to fit a range of dynamic drive cycles with a maximum error (MAXE) generally less than 300 mV for a range of temperatures. The results also demonstrate that the temperature-dependent ECM parameters are sufficient to capture the dynamic behavior of the LIB with good accuracy at different ambient conditions.
To better illustrate the error trend for the ECM versus the operating temperature, the average error for the four tested cycles at each temperature is presented as a function of the ambient temperature in Figure 13. Overall, the performance of the ECM starts to diverge at lower temperatures, i.e., −10 and −20 °C.
In summary, the proposed model performs well in the 0 and 25 °C ambient temperature cases. However, at negative temperatures, it shows a relatively higher error as the battery dynamics tend to have nonlinear behavior, which is not easy to model [6].
4.2. Thermal Model Validation Results
In this subsection, the battery thermal parameters obtained from the GA using the mixed drive cycle are validated. The thermal model inputs are the resistive losses from the ECM and the ambient temperature, and the output is the cell-simulated core and surface temperatures. Due to the unavailability of the cell core temperature, only the battery surface temperature is benchmarked using the actual measured surface temperature.
Figure 14 shows a summary of the RMSE values obtained for the surface temperature estimation of the aforementioned drive cycles and ambient temperatures. It can be clearly seen that the obtained battery thermal parameters are able to accurately capture the surface temperature of the LIB under study at a wide range of temperatures and dynamic conditions. The US06, being the most aggressive drive cycle, shows an RMSE of 1.1 °C. This is due to the large temperature rise involved in such aggressive drive cycles, which challenges the thermal model’s performance. The model is able to estimate the surface temperature of the battery with an RMSE less than 0.77 °C for the remaining, less dynamic drive cycles. It is also noted that the RMSE of the surface temperature estimation of the thermal model is aligned exactly with the ECM’s ability to model the LIB electrical performance. Hence, the performance of the thermal model can always be enhanced by improving the ECM performance.
Figure 15 shows the estimated and measured surface temperatures along with the corresponding errors for the best and worst cases of the thermal model estimation. One of the best thermal model performance cases is the UDDS drive cycle at 25 °C, where the RMSE of the surface temperature estimation is 0.13 °C. However, the wort testing case is shown for the US06 drive cycle when operated at a −20 °C ambient temperature, with an error of 1.1 °C. The MAXE of the proposed thermal model is less than 2.3 °C for the worst and most challenging test case.
It should be noted that the maximum temperature rises of the best and the worst cycles are approximately 2 and 20 °C, respectively. Hence, the RMSE achieved for the best case represents 6.5% of the maximum temperature rise of this drive cycle. Moreover, the temperature estimation RMSE of the worst drive cycle represents 5.5% of the maximum temperature of this drive cycle. Hence, the proposed model presents a reasonable and uniform temperature estimation capability for different temperature rise conditions.
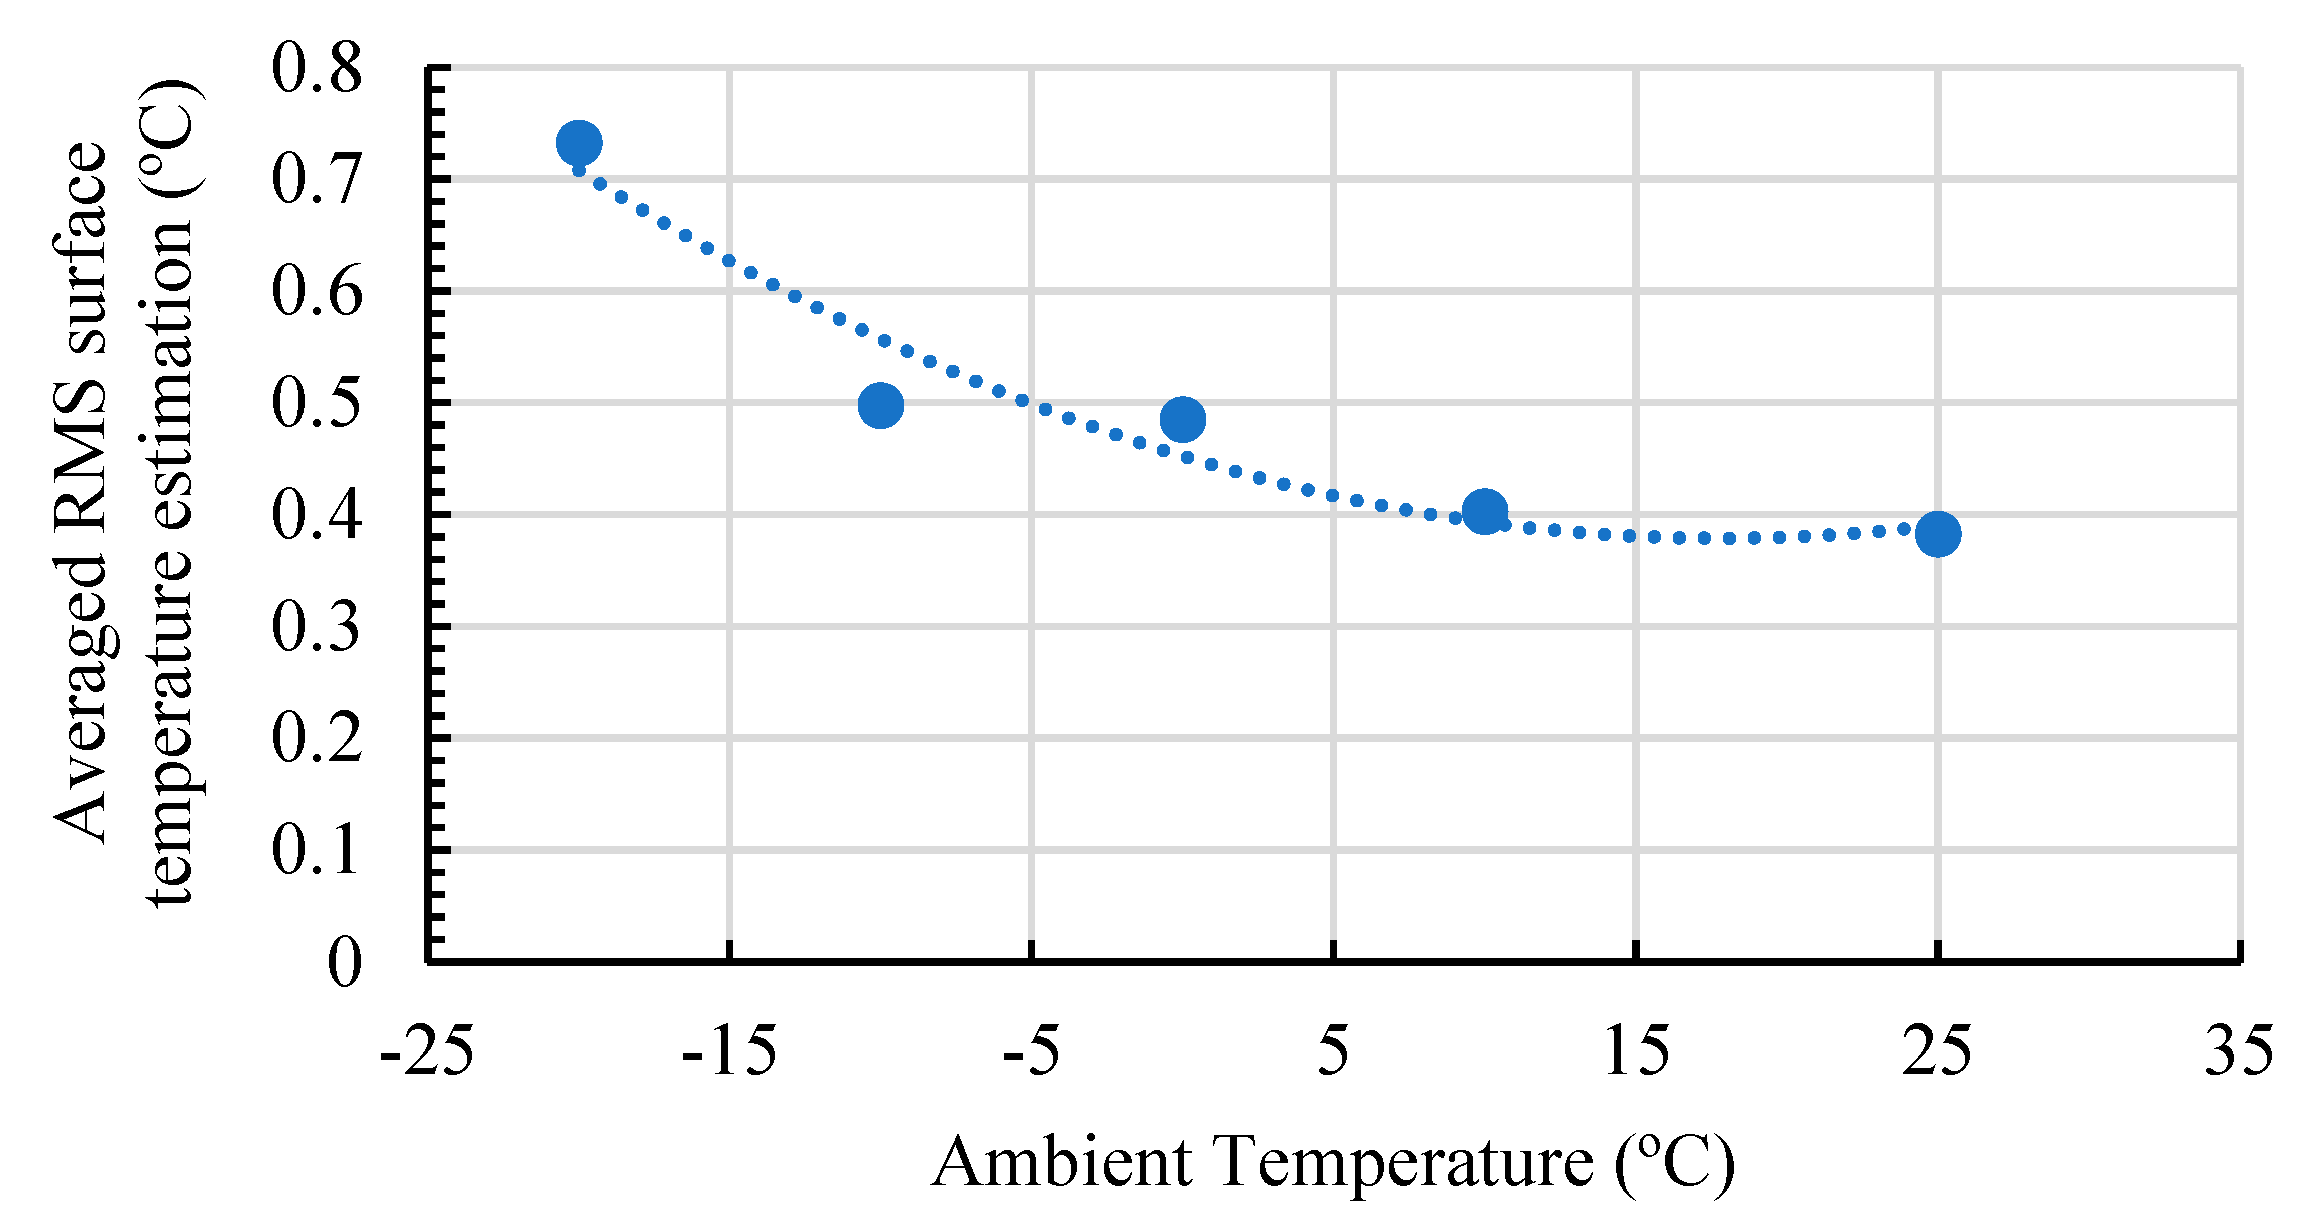
Figure 16 illustrates the impact of the ambient temperature variation on the battery surface temperature estimation capability by showing the average temperature estimation RMSE values for the four dynamic drive cycles versus the ambient temperature. A similar trend in the ECM error as in Figure 13 can be observed for all the drive cycles with the ambient temperature variation, which justifies the higher RMSE at lower temperatures.
4.3. The Proposed Model’s Benchmarking Results
It is challenging to benchmark the proposed model with similar studies in the literature due to the variations in the validation datasets and studied ambient temperatures. Hence, only studies with dynamic validation datasets and a reasonable variation in the temperature and SOC are selected to benchmark the proposed model. Table 7 shows the voltage, temperature estimation errors, testing cycle, cycle temperature range, and SOC variation.
The surface temperature estimation RMSE and MAXE in the studies range between 0.3 and 0.65 °C and between 1 and 8 °C, respectively. However, the proposed model shows an overall averaged RMSE and MAXE surface temperature estimation of 0.5 and 2.3 °C, respectively, when tested using different behavior drive cycles with large temperature and SOC variations, as mentioned in Section 4.1 and Section 4.2. This degree of error can be seen in a low-cost temperature sensor, so the performance of the proposed model is acceptable.
In addition, the proposed 2RC-ECM shows a smaller maximum and a reasonable RMSE for the voltage estimation capability at a wide range of dynamic power conditions. The proposed model also has the advantage of using the simulated cell surface as one of its inputs to the ECM. Moreover, the model is validated using different cycles at negative temperature conditions, unlike the studies in the literature.
Finally, the advantages and disadvantages of the proposed method are summarized in Table 8. The proposed electro-thermal model offers several advantages and applications while also presenting certain challenges. On the positive side, the parameter estimation process is simple and robust, ensuring an accurate representation of the battery’s behavior. Additionally, the model’s parameters hold physical meaning, providing valuable insights into the internal dynamics of the battery. Moreover, the model imposes a lesser computational load compared to other thermal models, making it computationally efficient. In terms of applications, the electro-thermal model proves beneficial in various aspects of battery technology. It finds utility in battery pack design, facilitating the optimization of battery performance and safety. Furthermore, the model helps in the design of effective thermal management systems, crucial for regulating battery temperatures. Additionally, the model can compensate for the limited number of temperature sensors in EVs, enhancing the temperature monitoring capabilities. However, there are certain disadvantages to consider. The parameter estimation process requires characterization tests, which may entail additional efforts and resources. Additionally, the model’s parameters need offline parametrization, which may necessitate updates and adjustments as the battery ages. Despite these challenges, the proposed electro-thermal model proves to be a valuable tool in improving battery performance, safety, and thermal management in various real-world applications.
5. Conclusions
This paper outlined an electro-thermal model for lithium-ion batteries (LIBs). This model combined a second-order equivalent circuit model (ECM) with a lumped parameter thermal model. Additionally, the battery’s electrical and thermal parameter estimation methods were discussed. The parameters were obtained using the genetic algorithm (GA). Moreover, the dependency of the model parameters on the SOC and temperature was investigated.
Overall, the model was able to capture the battery’s dynamic voltages and surface temperatures at a wide range of drive cycle power profiles and ambient temperatures, namely from −20 to 25 °C. The results also showed that the temperature-dependent ECM parameters were sufficient to capture the dynamic behavior of the LIB with reasonable accuracy. The proposed ECM was able to simulate the battery voltage with an averaged error of 50 mV. Specifically, the ECM performed well for ambient temperatures from 0 to 25 °C. However, at negative temperatures, the ECM’s capability decreased as the battery’s chemical reactions tended to be slower, which challenged the modeling process. Moreover, the proposed thermal model parameters were obtained offline at one temperature and tested at different dynamic and ambient conditions. The model showed an average temperature estimation error of 0.5 °C for the studied cases. In addition, the errors in the surface temperature estimation of the thermal model were aligned exactly with the ECM’s ability to model the LIB performance.
Finally, the proposed electro-thermal model based on the second-order ECM and lumped parameter thermal model can help in reducing the number of temperature sensors in multi-cell battery packs. In future work, the model’s fidelity can be enhanced by adding additional filters to estimate the battery parameters onboard, especially under LIB ageing. In addition, a quantitative analysis of the proposed model’s performance will be conducted with respect to various SOC levels and higher ambient temperatures than 25 °C. This analysis will provide valuable insights into how well the model adapts to different SOC ranges and its predictive accuracy across higher-temperature conditions.
Author Contributions
Conceptualization, M.N. and N.E.; software, M.N.; validation, S.G. and A.R.; writing—original draft preparation, M.N.; writing—review and editing, R.A. and N.E.; supervision, R.A.; project administration, R.A. All authors have read and agreed to the published version of the manuscript.
Funding
This research received no external funding.
Data Availability Statement
Not applicable.
Conflicts of Interest
The authors declare no conflict of interest.
References
- Bisht, A.S.; Bisht, V.S.; Bhandari, P.; Rawat, K.S.; Alam, T.; Blecich, P. The Use of a Vortex Generator for the Efficient Cooling of Lithium-Ion Batteries in Hybrid Electric Vehicles. Processes 2023, 11, 500. [Google Scholar] [CrossRef]
- Hannan, M.A.; Hoque, M.D.M.; Hussain, A.; Yusof, Y.; Ker, A.P.J. State-of-the-Art and Energy Management System of Lithium-Ion Batteries in Electric Vehicle Applications: Issues and Recommendations. IEEE Access 2018, 6, 19362–19378. [Google Scholar] [CrossRef]
- Naguib, M.; Kollmeyer, P.; Emadi, A. Lithium-Ion Battery Pack Robust State of Charge Estimation, Cell Inconsistency, and Balancing: Review. IEEE Access 2021, 9, 50570–50582. [Google Scholar] [CrossRef]
- Vidal, C.; Malysz, P.; Kollmeyer, P.; Emadi, A. Machine Learning Applied to Electrified Vehicle Battery State of Charge and State of Health Estimation: State-of-the-Art. IEEE Access 2020, 8, 52796–52814. [Google Scholar] [CrossRef]
- Ma, S.; Jiang, M.; Tao, P.; Song, C.; Wu, J.; Wang, J.; Deng, T.; Shang, W. Temperature effect and thermal impact in lithium-ion batteries: A review. Prog. Nat. Sci. Mater. Int. 2018, 28, 653–666. [Google Scholar] [CrossRef]
- Vidal, C.; Gross, O.; Gu, R.; Kollmeyer, P.; Emadi, A. xEV Li-Ion Battery Low-Temperature Effects—Review. IEEE Trans. Veh. Technol. 2019, 68, 4560–4572. [Google Scholar] [CrossRef]
- Xie, Y.; Li, W.; Hu, X.; Lin, X.; Zhang, Y.; Dan, D.; Feng, F.; Liu, B.; Li, K. An Enhanced Online Temperature Estimation for Lithium-Ion Batteries. IEEE Trans. Transp. Electrif. 2020, 6, 375–390. [Google Scholar] [CrossRef]
- Li, G.; Li, S. Physics-Based CFD Simulation of Lithium-Ion Battery under the FUDS Driving Cycle. ECS Trans. 2015, 64, 1–14. [Google Scholar] [CrossRef]
- Bonkile, M.P.; Ramadesigan, V. Power management control strategy using physics-based battery models in standalone PV-battery hybrid systems. J. Energy Storage 2019, 23, 258–268. [Google Scholar] [CrossRef]
- Li, Y.; Xiong, B.; Vilathgamuwa, D.M.; Wei, Z.; Xie, C.; Zou, C. Constrained Ensemble Kalman Filter for Distributed Electrochemical State Estimation of Lithium-Ion Batteries. IEEE Trans. Ind. Inform. 2020, 17, 240–250. [Google Scholar] [CrossRef]
- Lashway, C.R.; Mohammed, O.A. Adaptive Battery Management and Parameter Estimation Through Physics-Based Modeling and Experimental Verification. IEEE Trans. Transp. Electrif. 2016, 2, 454–464. [Google Scholar] [CrossRef]
- Guo, D.; Yang, G.; Feng, X.; Han, X.; Lu, L.; Ouyang, M. Physics-based fractional-order model with simplified solid phase diffusion of lithium-ion battery. J. Energy Storage 2020, 30, 101404. [Google Scholar] [CrossRef]
- Zou, C.; Manzie, C.; Nesic, D. A Framework for Simplification of PDE-Based Lithium-Ion Battery Models. IEEE Trans. Control Syst. Technol. 2015, 24, 1594–1609. [Google Scholar] [CrossRef]
- Yang, X.; Chen, L.; Xu, X.; Wang, W.; Xu, Q.; Lin, Y.; Zhou, Z. Parameter Identification of Electrochemical Model for Vehicular Lithium-Ion Battery Based on Particle Swarm Optimization. Energies 2017, 10, 1811. [Google Scholar] [CrossRef] [Green Version]
- Naguib, M.; Vidal, C.; Kollmeyer, P.; Malysz, P.; Gross, O.; Emadi, A. Comparative Study between Equivalent Circuit and Recurrent Neural Network Battery Voltage Models; SAE Technical Paper Series; SAE International: Warrendale, PA, USA, 2021. [Google Scholar] [CrossRef]
- Chemali, E.; Kollmeyer, P.J.; Preindl, M.; Ahmed, R.; Emadi, A.; Kollmeyer, P. Long Short-Term Memory Networks for Accurate State-of-Charge Estimation of Li-ion Batteries. IEEE Trans. Ind. Electron. 2018, 65, 6730–6739. [Google Scholar] [CrossRef]
- Hussein, A.A.; Chehade, A.A. Robust Artificial Neural Network-Based Models for Accurate Surface Temperature Estimation of Batteries. IEEE Trans. Ind. Appl. 2020, 56, 5269–5278. [Google Scholar] [CrossRef]
- Feng, F.; Teng, S.; Liu, K.; Xie, J.; Xie, Y.; Liu, B.; Li, K. Co-estimation of lithium-ion battery state of charge and state of temperature based on a hybrid electrochemical-thermal-neural-network model. J. Power Sources 2020, 455, 227935. [Google Scholar] [CrossRef]
- Wang, Q.-K.; He, Y.-J.; Shen, J.-N.; Ma, Z.-F.; Zhong, G.-B. A unified modeling framework for lithium-ion batteries: An artificial neural network based thermal coupled equivalent circuit model approach. Energy 2017, 138, 118–132. [Google Scholar] [CrossRef]
- Panchal, S.; Dincer, I.; Agelin-Chaab, M.; Fraser, R.; Fowler, M. Experimental and theoretical investigation of temperature distributions in a prismatic lithium-ion battery. Int. J. Therm. Sci. 2016, 99, 204–212. [Google Scholar] [CrossRef]
- Huria, T.; Ceraolo, M.; Gazzarri, J.; Jackey, R. High fidelity electrical model with thermal dependence for characterization and simulation of high-power lithium battery cells. In Proceedings of the 2012 IEEE International Electric Vehicle Conference, Greenville, SC, USA, 4–8 March 2012. [Google Scholar]
- Yang, Z.; Patil, D.; Fahimi, B. Electrothermal Modeling of Lithium-Ion Batteries for Electric Vehicles. IEEE Trans. Veh. Technol. 2018, 68, 170–179. [Google Scholar] [CrossRef]
- Baghdadi, I.; Briat, O.; Eddahech, A.; Vinassa, J.; Gyan, P. Electro-thermal model of lithium-ion batteries for electrified vehicles applications. In Proceedings of the 2015 IEEE 24th International Symposium on Industrial Electronics (ISIE), Buzios, Brazil, 3–5 June 2015. [Google Scholar] [CrossRef]
- Wang, X.; Wei, X.; Chen, Q.; Zhu, J.; Dai, H. Lithium-ion battery temperature on-line estimation based on fast impedance calculation. J. Energy Storage 2019, 26, 100952. [Google Scholar] [CrossRef]
- Makinejad, K.; Arunachala, R.; Arnold, S.; Ennifar, H.; Zhou, H.; Jossen, A.; Changyun, W. A Lumped Electro-Thermal Model for Li-Ion Cells in Electric Vehicle Application. World Electr. Veh. J. 2015, 7, 1–13. [Google Scholar] [CrossRef] [Green Version]
- Zhu, J.; Knapp, M.; Darma, M.S.D.; Fang, Q.; Wang, X.; Dai, H.; Wei, X.; Ehrenberg, H. An improved electro-thermal battery model complemented by current dependent parameters for vehicular low temperature application. Appl. Energy 2019, 248, 149–161. [Google Scholar] [CrossRef]
- Gao, Z.; Chin, C.S.; Woo, W.L.; Jia, J. Integrated Equivalent Circuit and Thermal Model for Simulation of Temperature-Dependent LiFePO4 Battery in Actual Embedded Application. Energies 2017, 10, 85. [Google Scholar] [CrossRef] [Green Version]
- Xie, J.; Li, Z.; Jiao, J.; Li, X. Lumped-parameter temperature evolution model for cylindrical Li-ion batteries considering reversible heat and propagation delay. Measurement 2021, 173, 108567. [Google Scholar] [CrossRef]
- Xie, Y.; Zheng, J.; Hu, X.; Lin, X.; Liu, K.; Sun, J.; Zhang, Y.; Dan, D.; Xi, D.; Feng, F. An improved resistance-based thermal model for prismatic lithium-ion battery charging. Appl. Therm. Eng. 2020, 180, 115794. [Google Scholar] [CrossRef]
- Wu, H.; Zhang, X.; Cao, R.; Yang, C. An investigation on electrical and thermal characteristics of cylindrical lithium-ion batteries at low temperatures. Energy 2021, 225, 120223. [Google Scholar] [CrossRef]
- Estevez, M.A.P.; Calligaro, S.; Bottesi, O.; Caligiuri, C.; Renzi, M. An electro-thermal model and its electrical parameters estimation procedure in a lithium-ion battery cell. Energy 2021, 234, 121296. [Google Scholar] [CrossRef]
- Kim, Y.; Mohan, S.; Siegel, J.B.; Stefanopoulou, A.G.; Ding, Y. The Estimation of Temperature Distribution in Cylindrical Battery Cells Under Unknown Cooling Conditions. IEEE Trans. Control Syst. Technol. 2014, 22, 2277–2286. [Google Scholar] [CrossRef]
- Amini, A.; Özdemir, T.; Ekici, Ö.; Başlamışlı, S.; Köksal, M. A thermal model for Li-ion batteries operating under dynamic conditions. Appl. Therm. Eng. 2021, 185, 116338. [Google Scholar] [CrossRef]
- Lin, X.; Perez, H.E.; Mohan, S.; Siegel, J.B.; Stefanopoulou, A.G.; Ding, Y.; Castanier, M.P. A lumped-parameter electro-thermal model for cylindrical batteries. J. Power Sources 2014, 257, 1–11. [Google Scholar] [CrossRef]
- Cheng, X.; Shi, N.; Li, Y.; Wang, S. Engineering-Oriented Modeling for Thermal Behaviors of 18650 Li-ion Batteries. Energy Procedia 2017, 105, 4757–4762. [Google Scholar] [CrossRef]
- Chiew, J.; Chin, C.; Toh, W.; Gao, Z.; Jia, J.; Zhang, C. A pseudo three-dimensional electrochemical-thermal model of a cylindrical LiFePO4/graphite battery. Appl. Therm. Eng. 2019, 147, 450–463. [Google Scholar] [CrossRef] [Green Version]
- Mastali, M.; Foreman, E.; Modjtahedi, A.; Samadani, E.; Amirfazli, A.; Farhad, S.; Fraser, R.A.; Fowler, M. Electrochemical-thermal modeling and experimental validation of commercial graphite/LiFePO4 pouch lithium-ion batteries. Int. J. Therm. Sci. 2018, 129, 218–230. [Google Scholar] [CrossRef]
- Samba, A.; Omar, N.; Gualous, H.; Firouz, Y.; Bossche, P.V.D.; Van Mierlo, J.; Boubekeur, T.I. Development of an Advanced Two-Dimensional Thermal Model for Large size Lithium-ion Pouch Cells. Electrochim. Acta 2014, 117, 246–254. [Google Scholar] [CrossRef]
- Wang, Z.; Ma, J.; Zhang, L. Finite Element Thermal Model and Simulation for a Cylindrical Li-Ion Battery. IEEE Access 2017, 5, 15372–15379. [Google Scholar] [CrossRef]
- Panchal, S.; Mathew, M.; Fraser, R.; Fowler, M. Electrochemical thermal modeling and experimental measurements of 18650 cylindrical lithium-ion battery during discharge cycle for an EV. Appl. Therm. Eng. 2018, 135, 123–132. [Google Scholar] [CrossRef]
- Farmann, A.; Sauer, D.U. Comparative study of reduced order equivalent circuit models for on-board state-of-available-power prediction of lithium-ion batteries in electric vehicles. Appl. Energy 2018, 225, 1102–1122. [Google Scholar] [CrossRef]
- Battery Test Manual for Plug-in Hybrid Electric Vehicles. Available online: https://inldigitallibrary.inl.gov/sites/sti/sti/4814126.pdf (accessed on 27 July 2023).
- Chen, Z.; Mi, C.C.; Fu, Y.; Xu, J.; Gong, X. Online battery state of health estimation based on Genetic Algorithm for electric and hybrid vehicle applications. J. Power Sources 2013, 240, 184–192. [Google Scholar] [CrossRef]
- Forgez, C.; Do, D.V.; Friedrich, G.; Morcrette, M.; Delacourt, C. Thermal modeling of a cylindrical LiFePO4/graphite lithium-ion battery. J. Power Sources 2010, 195, 2961–2968. [Google Scholar] [CrossRef]
- Arasaratnam, I.; Tjong, J.; Ahmed, R.; El-Sayed, M.; Habibi, S. Adaptive temperature monitoring for battery thermal management. In Proceedings of the 2013 IEEE Transportation Electrification Conference and Expo (ITEC), Detroit, MI, USA, 16–19 June 2013. [Google Scholar] [CrossRef]
- Kollmeyer, P. Panasonic 18650PF Li-Ion Battery Data. Mendeley Data, 21 June 2018. [Google Scholar] [CrossRef]
- Naguib, M.; Kollmeyer, P.; Vidal, C.; Duque, J.; Gross, O.; Emadi, A. Microprocessor Execution Time and Memory Use for Battery State of Charge Estimation Algorithms; SAE Technical Paper Series; SAE International: Warrendale, PA, USA, 2022. [Google Scholar] [CrossRef]
Figure 1.
The proposed combined electro-thermal model.

Figure 2.
Second-order equivalent circuit model.

Figure 3.
ECM fit one pulse of the HPPC test.
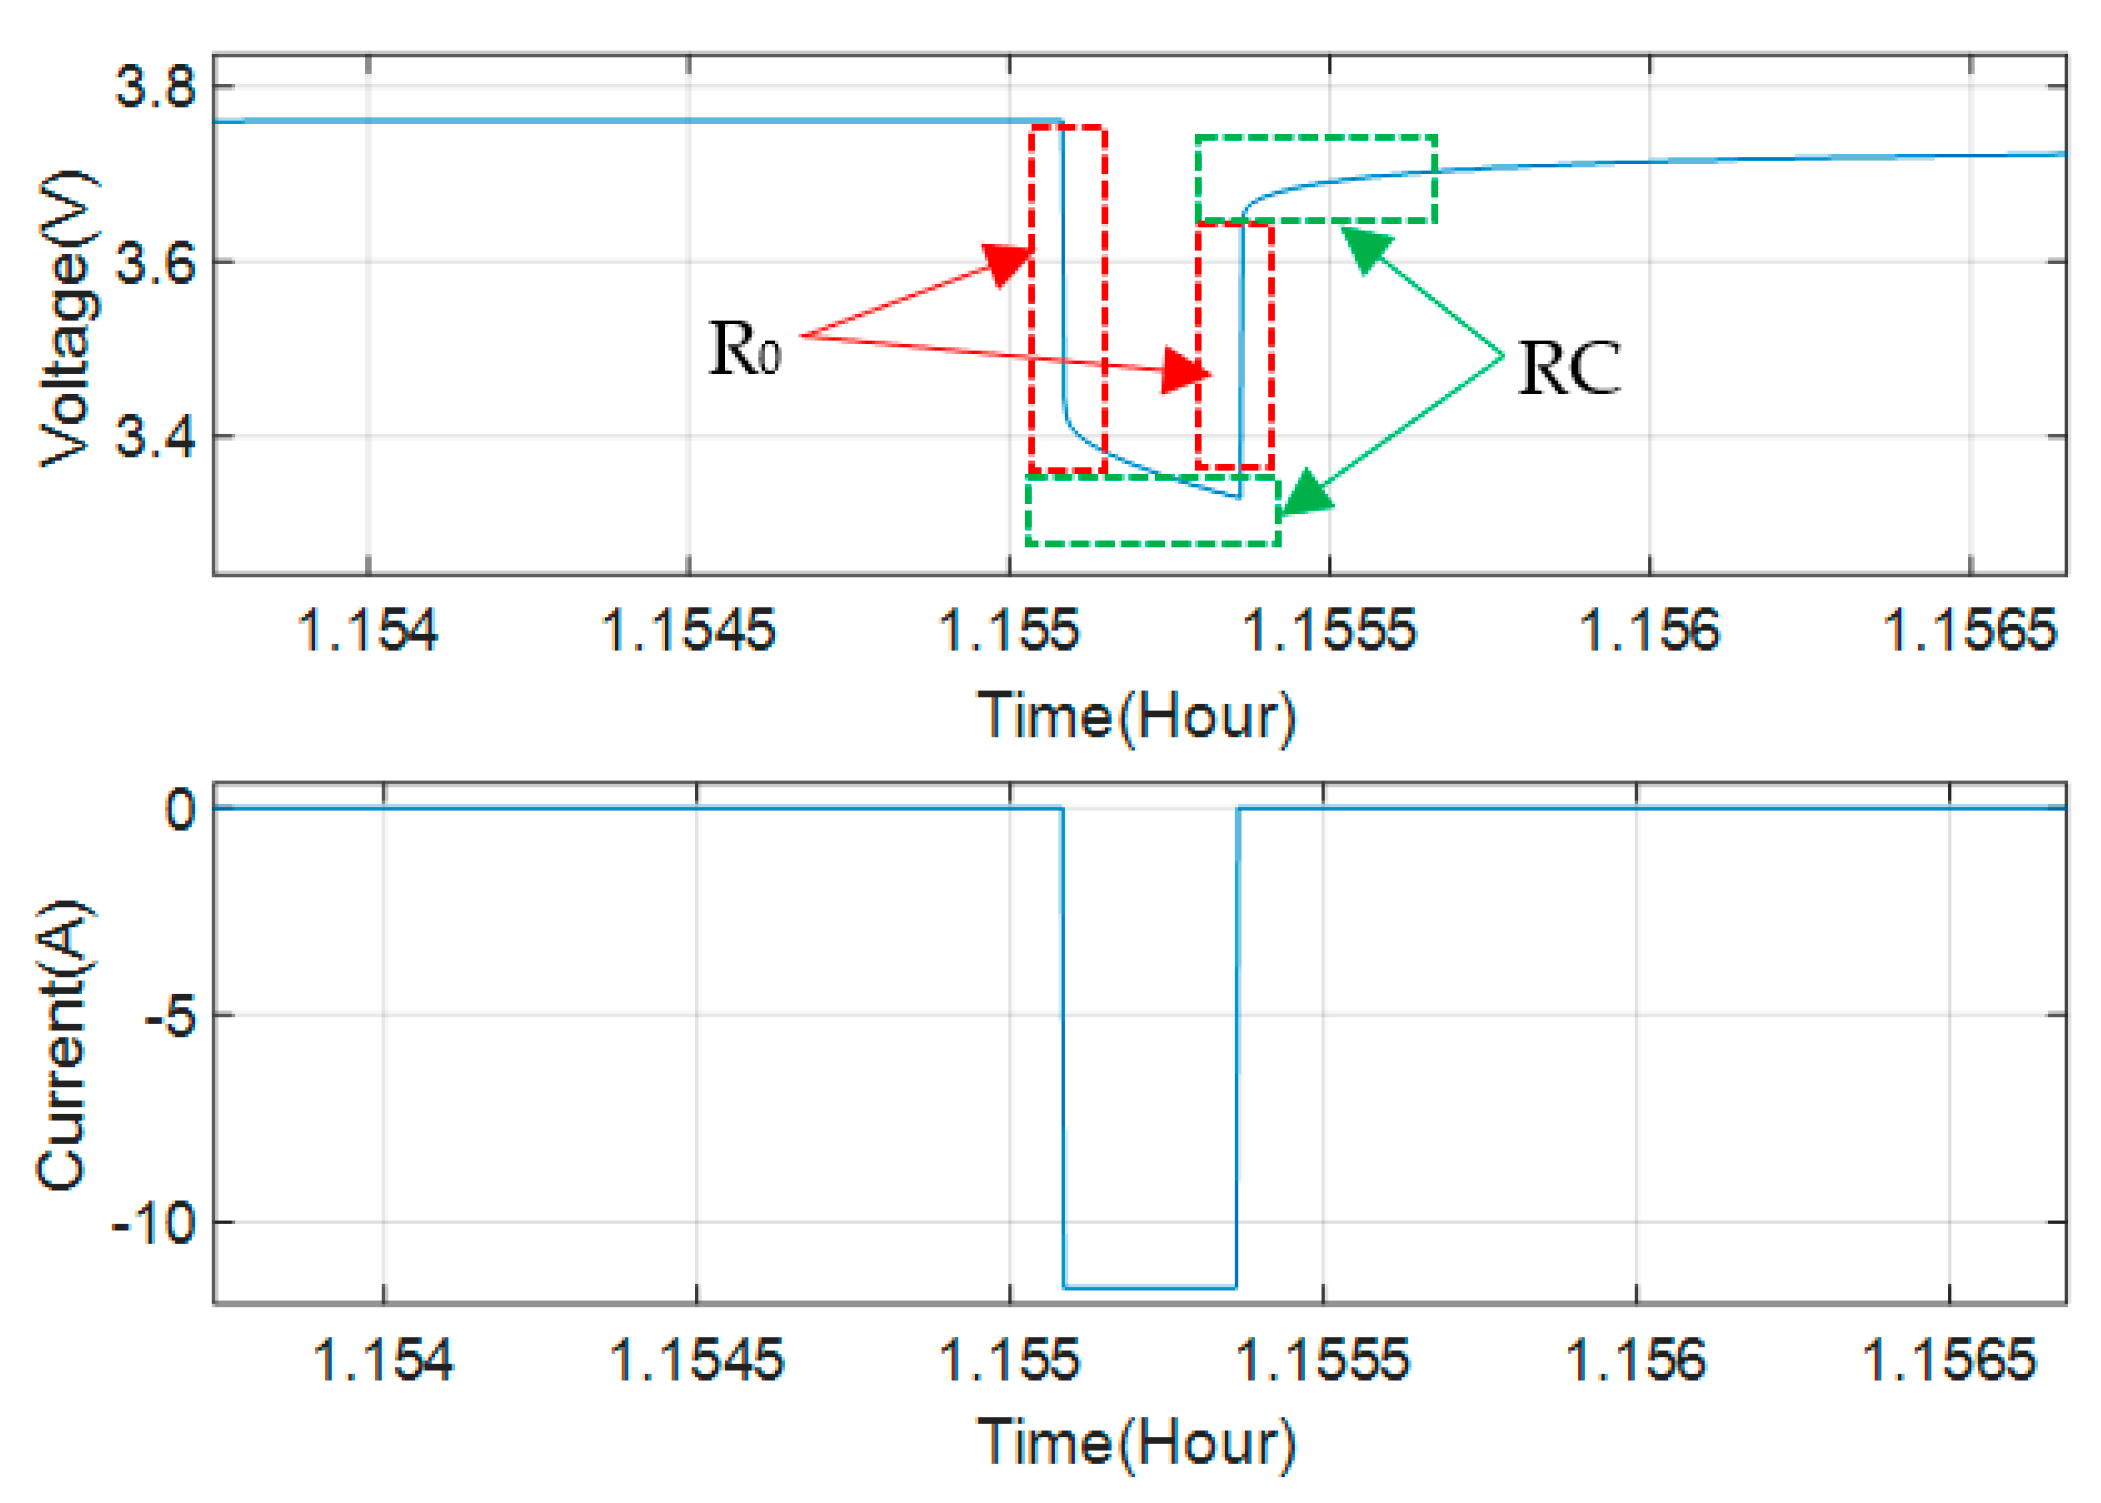
Figure 4.
Two-state lumped parameter thermal model.

Figure 5.
The proposed model design and validation processes.
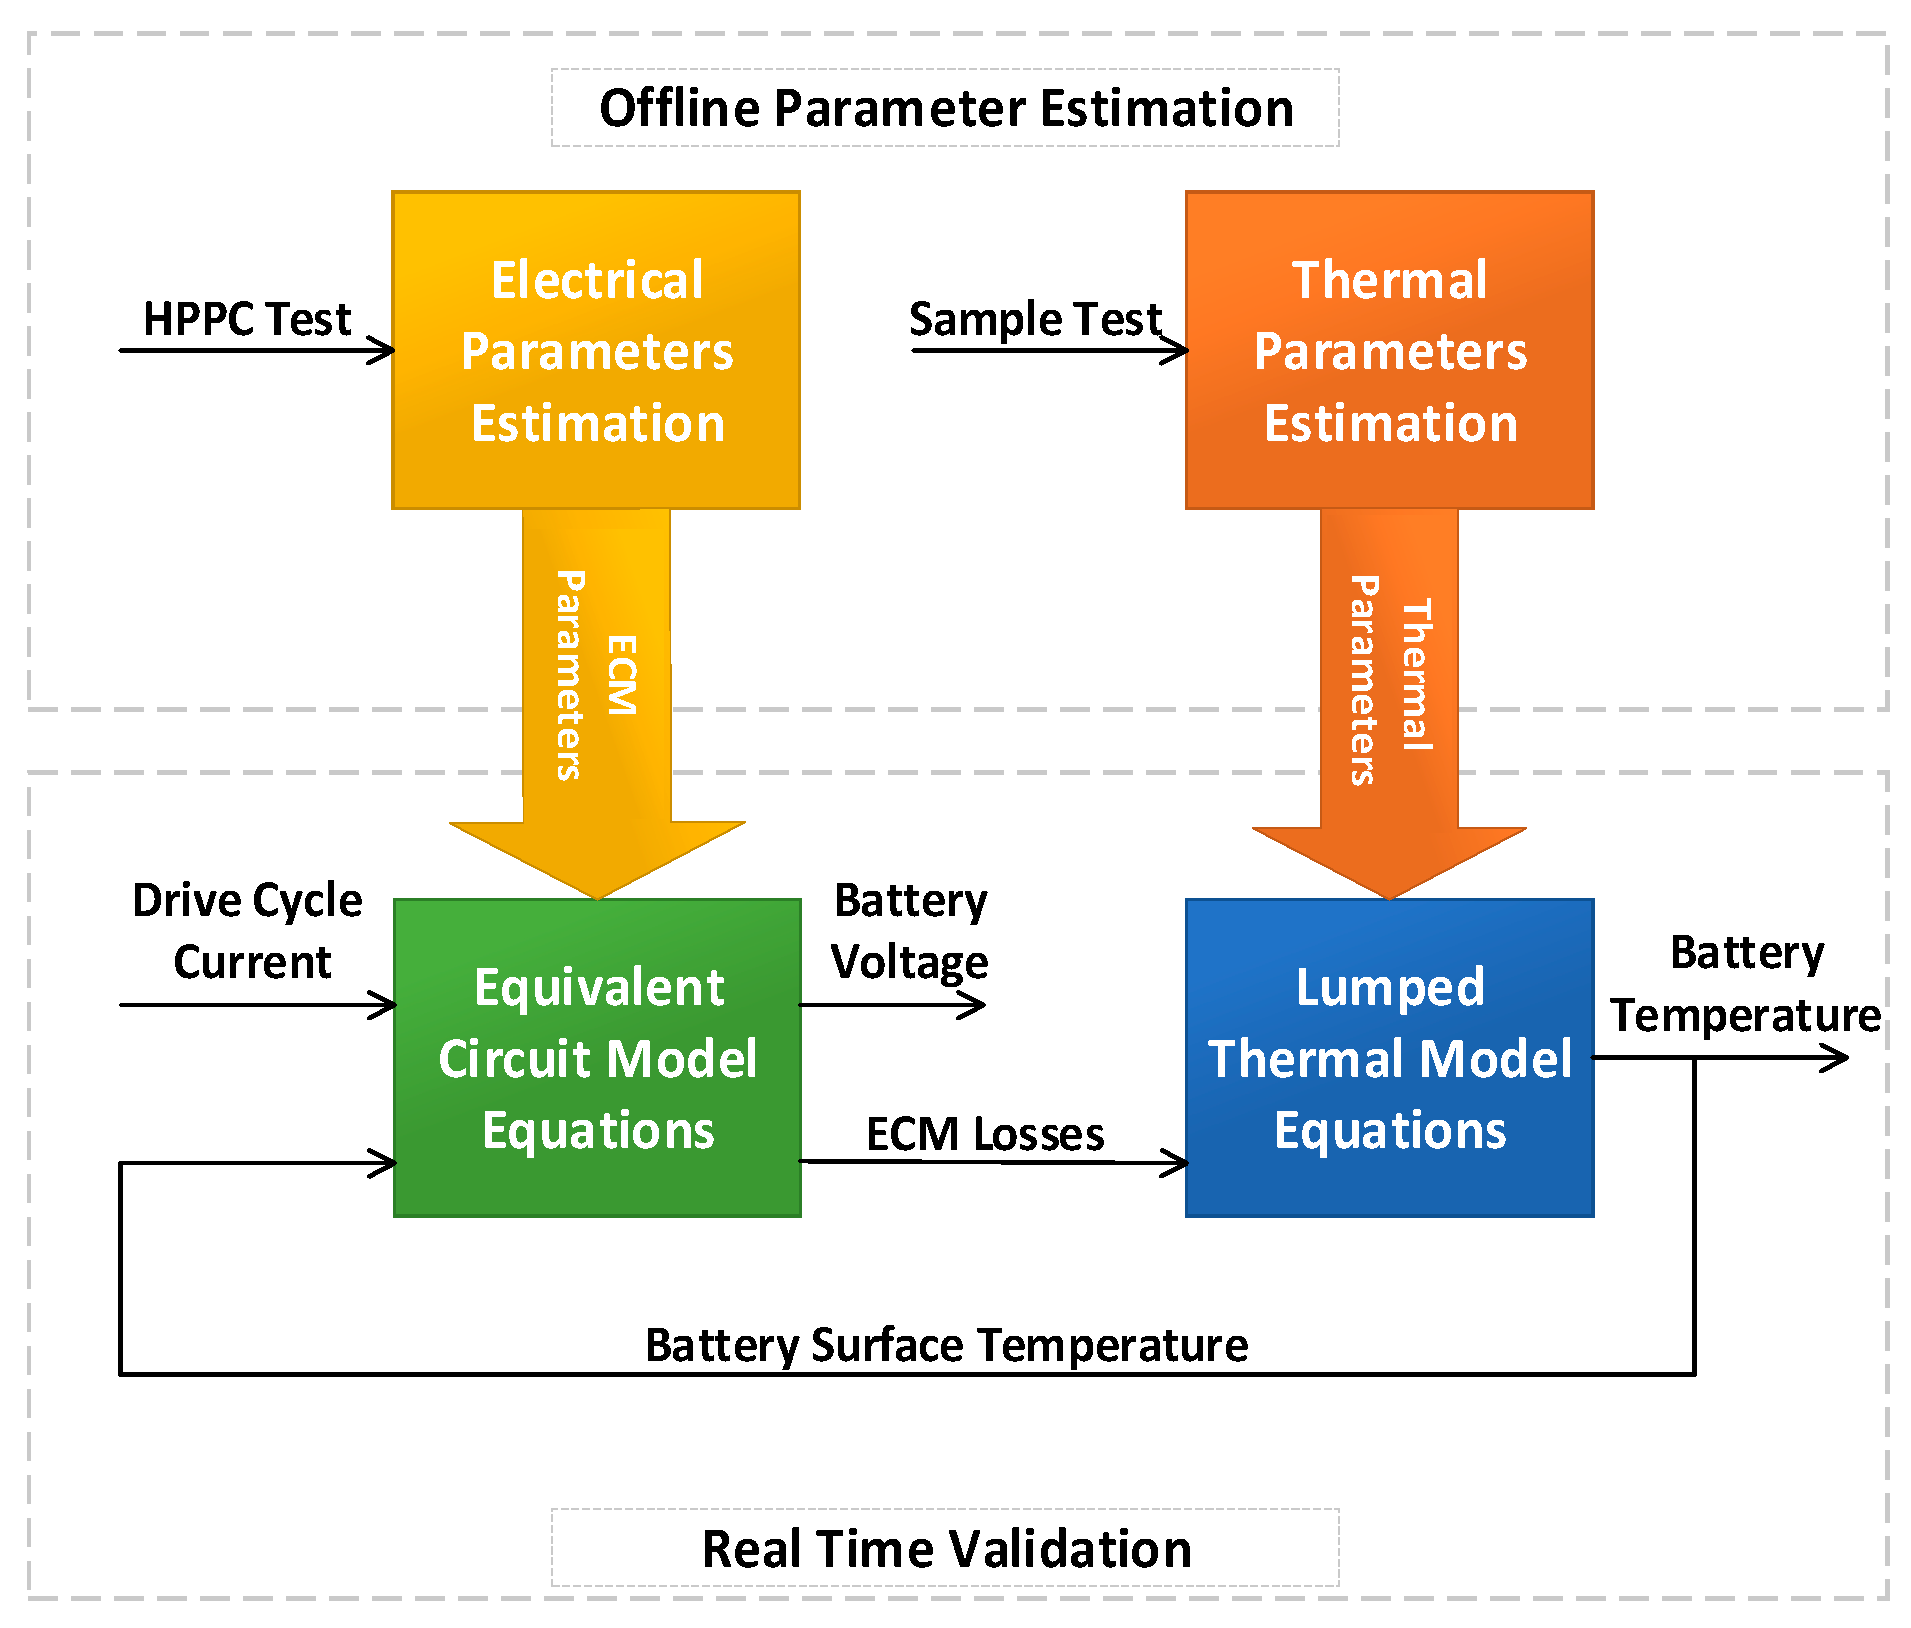
Figure 6.
Battery test setup and data logging system.
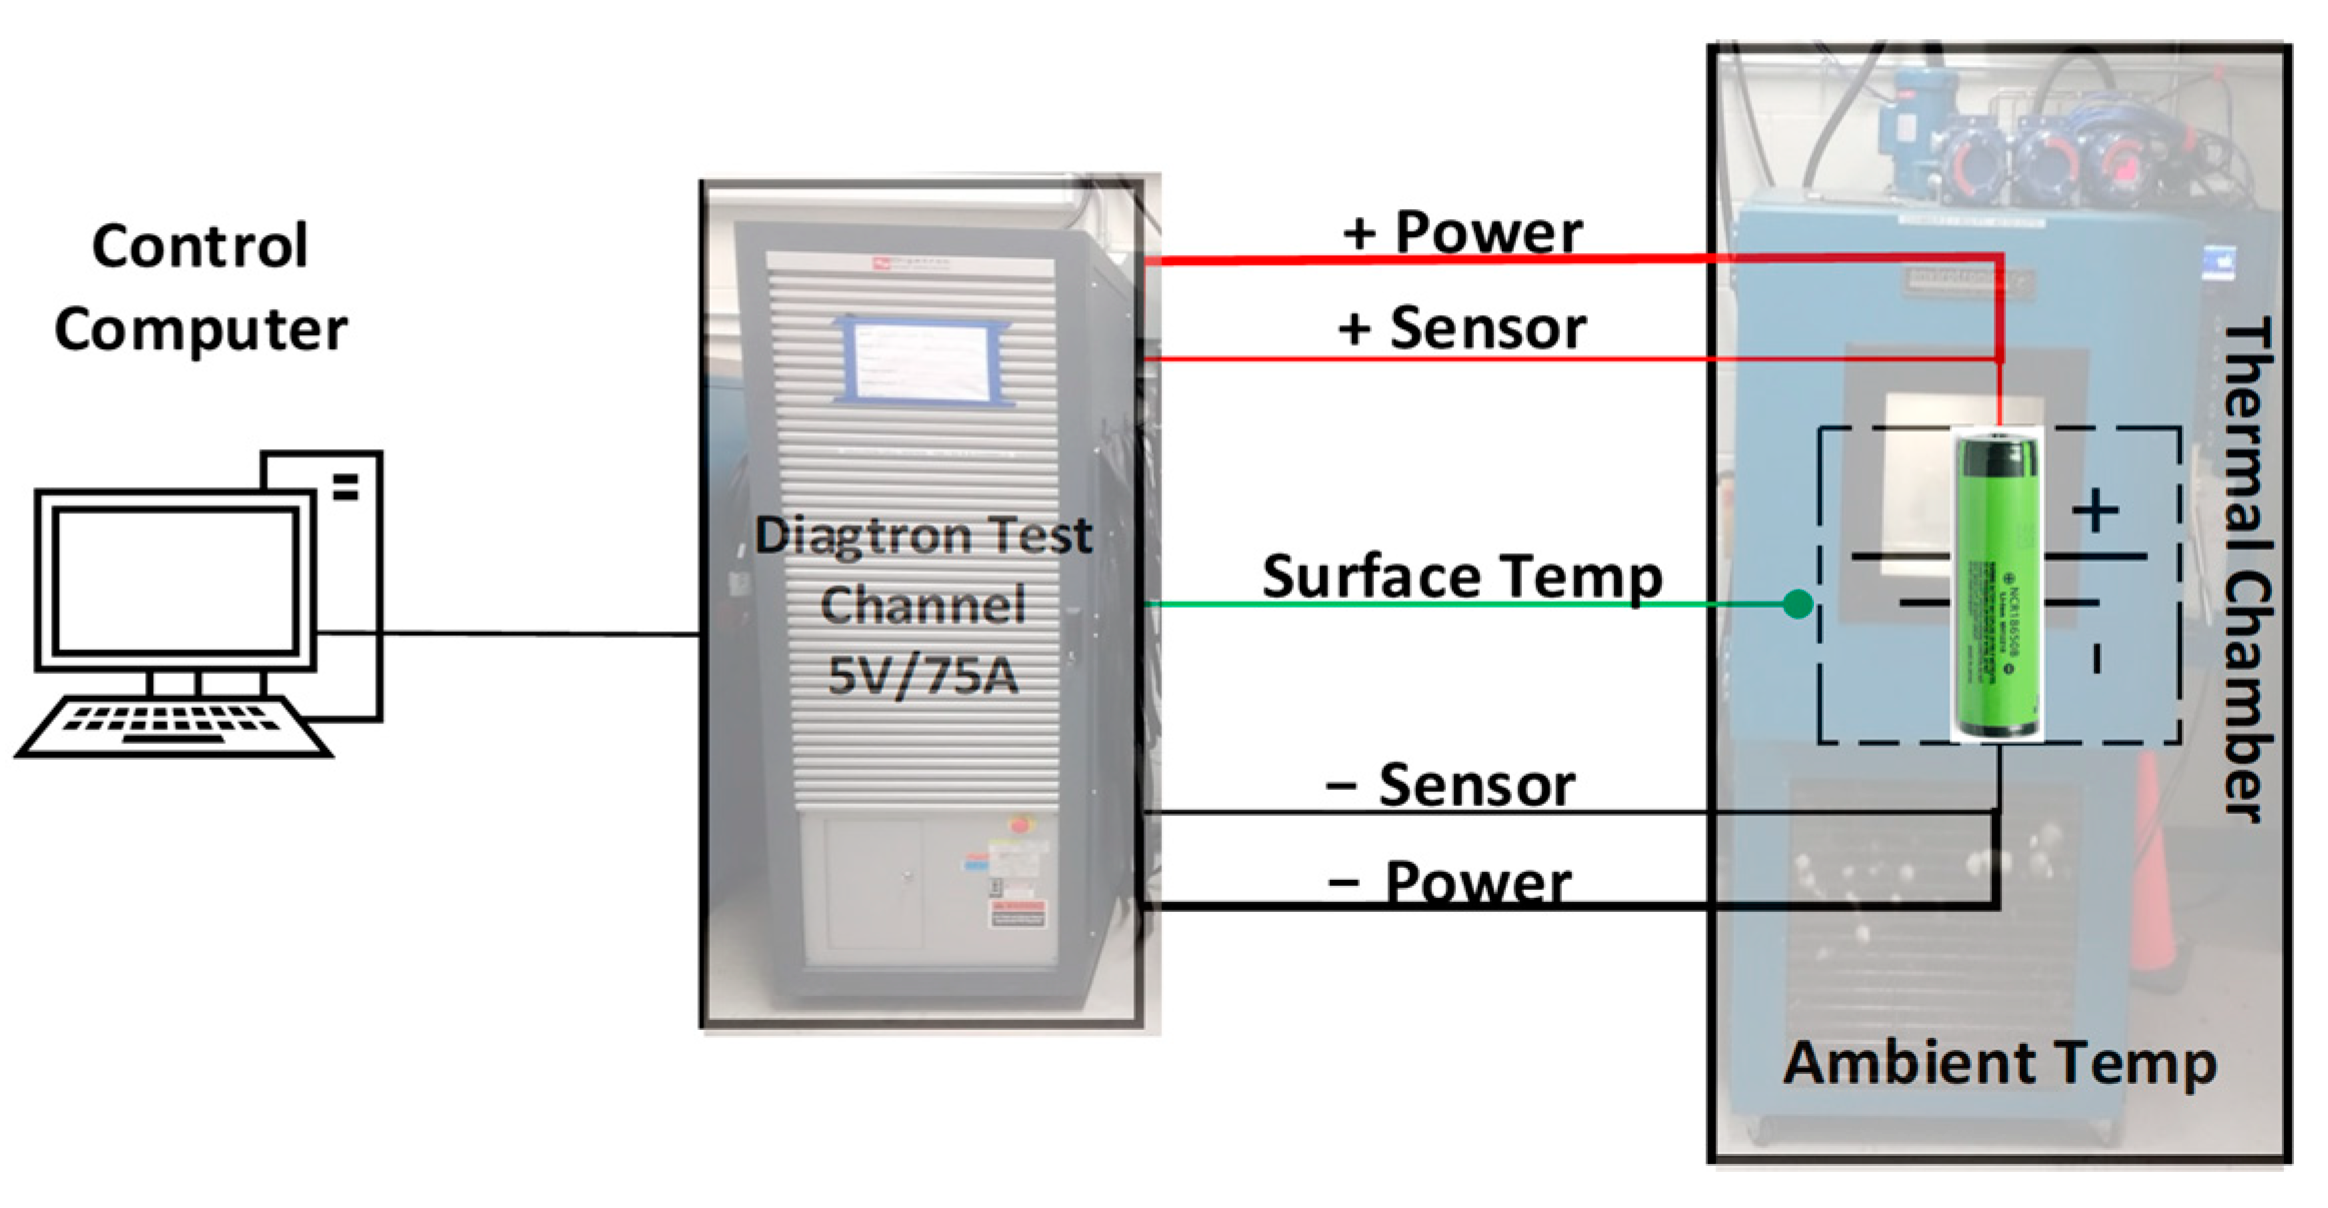
Figure 7.
ECM fit to 5-pulse HPPC test and the corresponding error at −20 and 25 °C ambient temperatures. (a) ECM fit at 25 °C ambient temperature; (b) ECM fit at −20 °C ambient temperature.
Figure 7.
ECM fit to 5-pulse HPPC test and the corresponding error at −20 and 25 °C ambient temperatures. (a) ECM fit at 25 °C ambient temperature; (b) ECM fit at −20 °C ambient temperature.

Figure 8.
ECM voltage estimation fit RMSE summary at ambient temperature range from −20 to 25 °C for HPPC tests.
Figure 8.
ECM voltage estimation fit RMSE summary at ambient temperature range from −20 to 25 °C for HPPC tests.
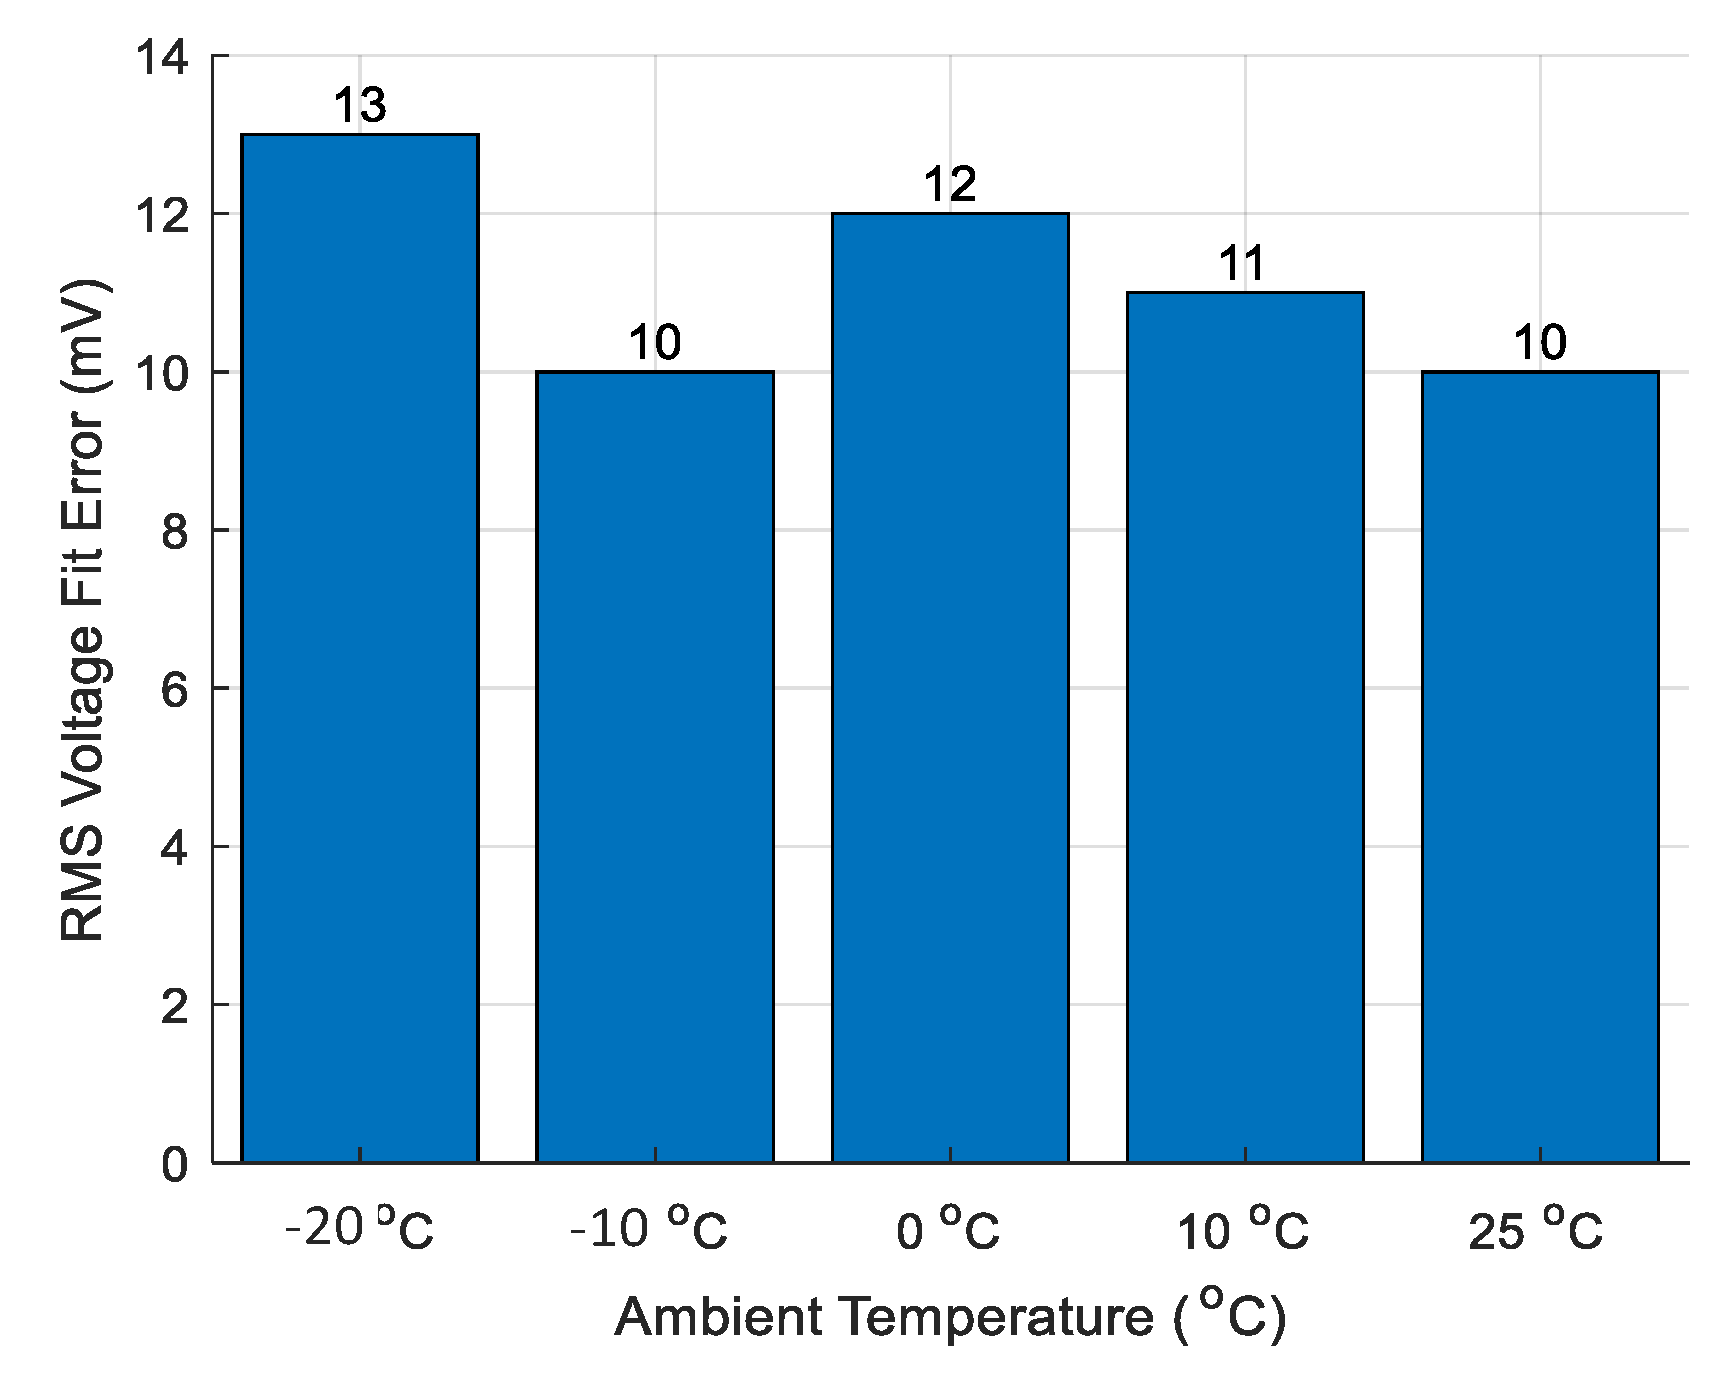
Figure 9.
ECM parameters at temperature range from −20 to 25 °C.
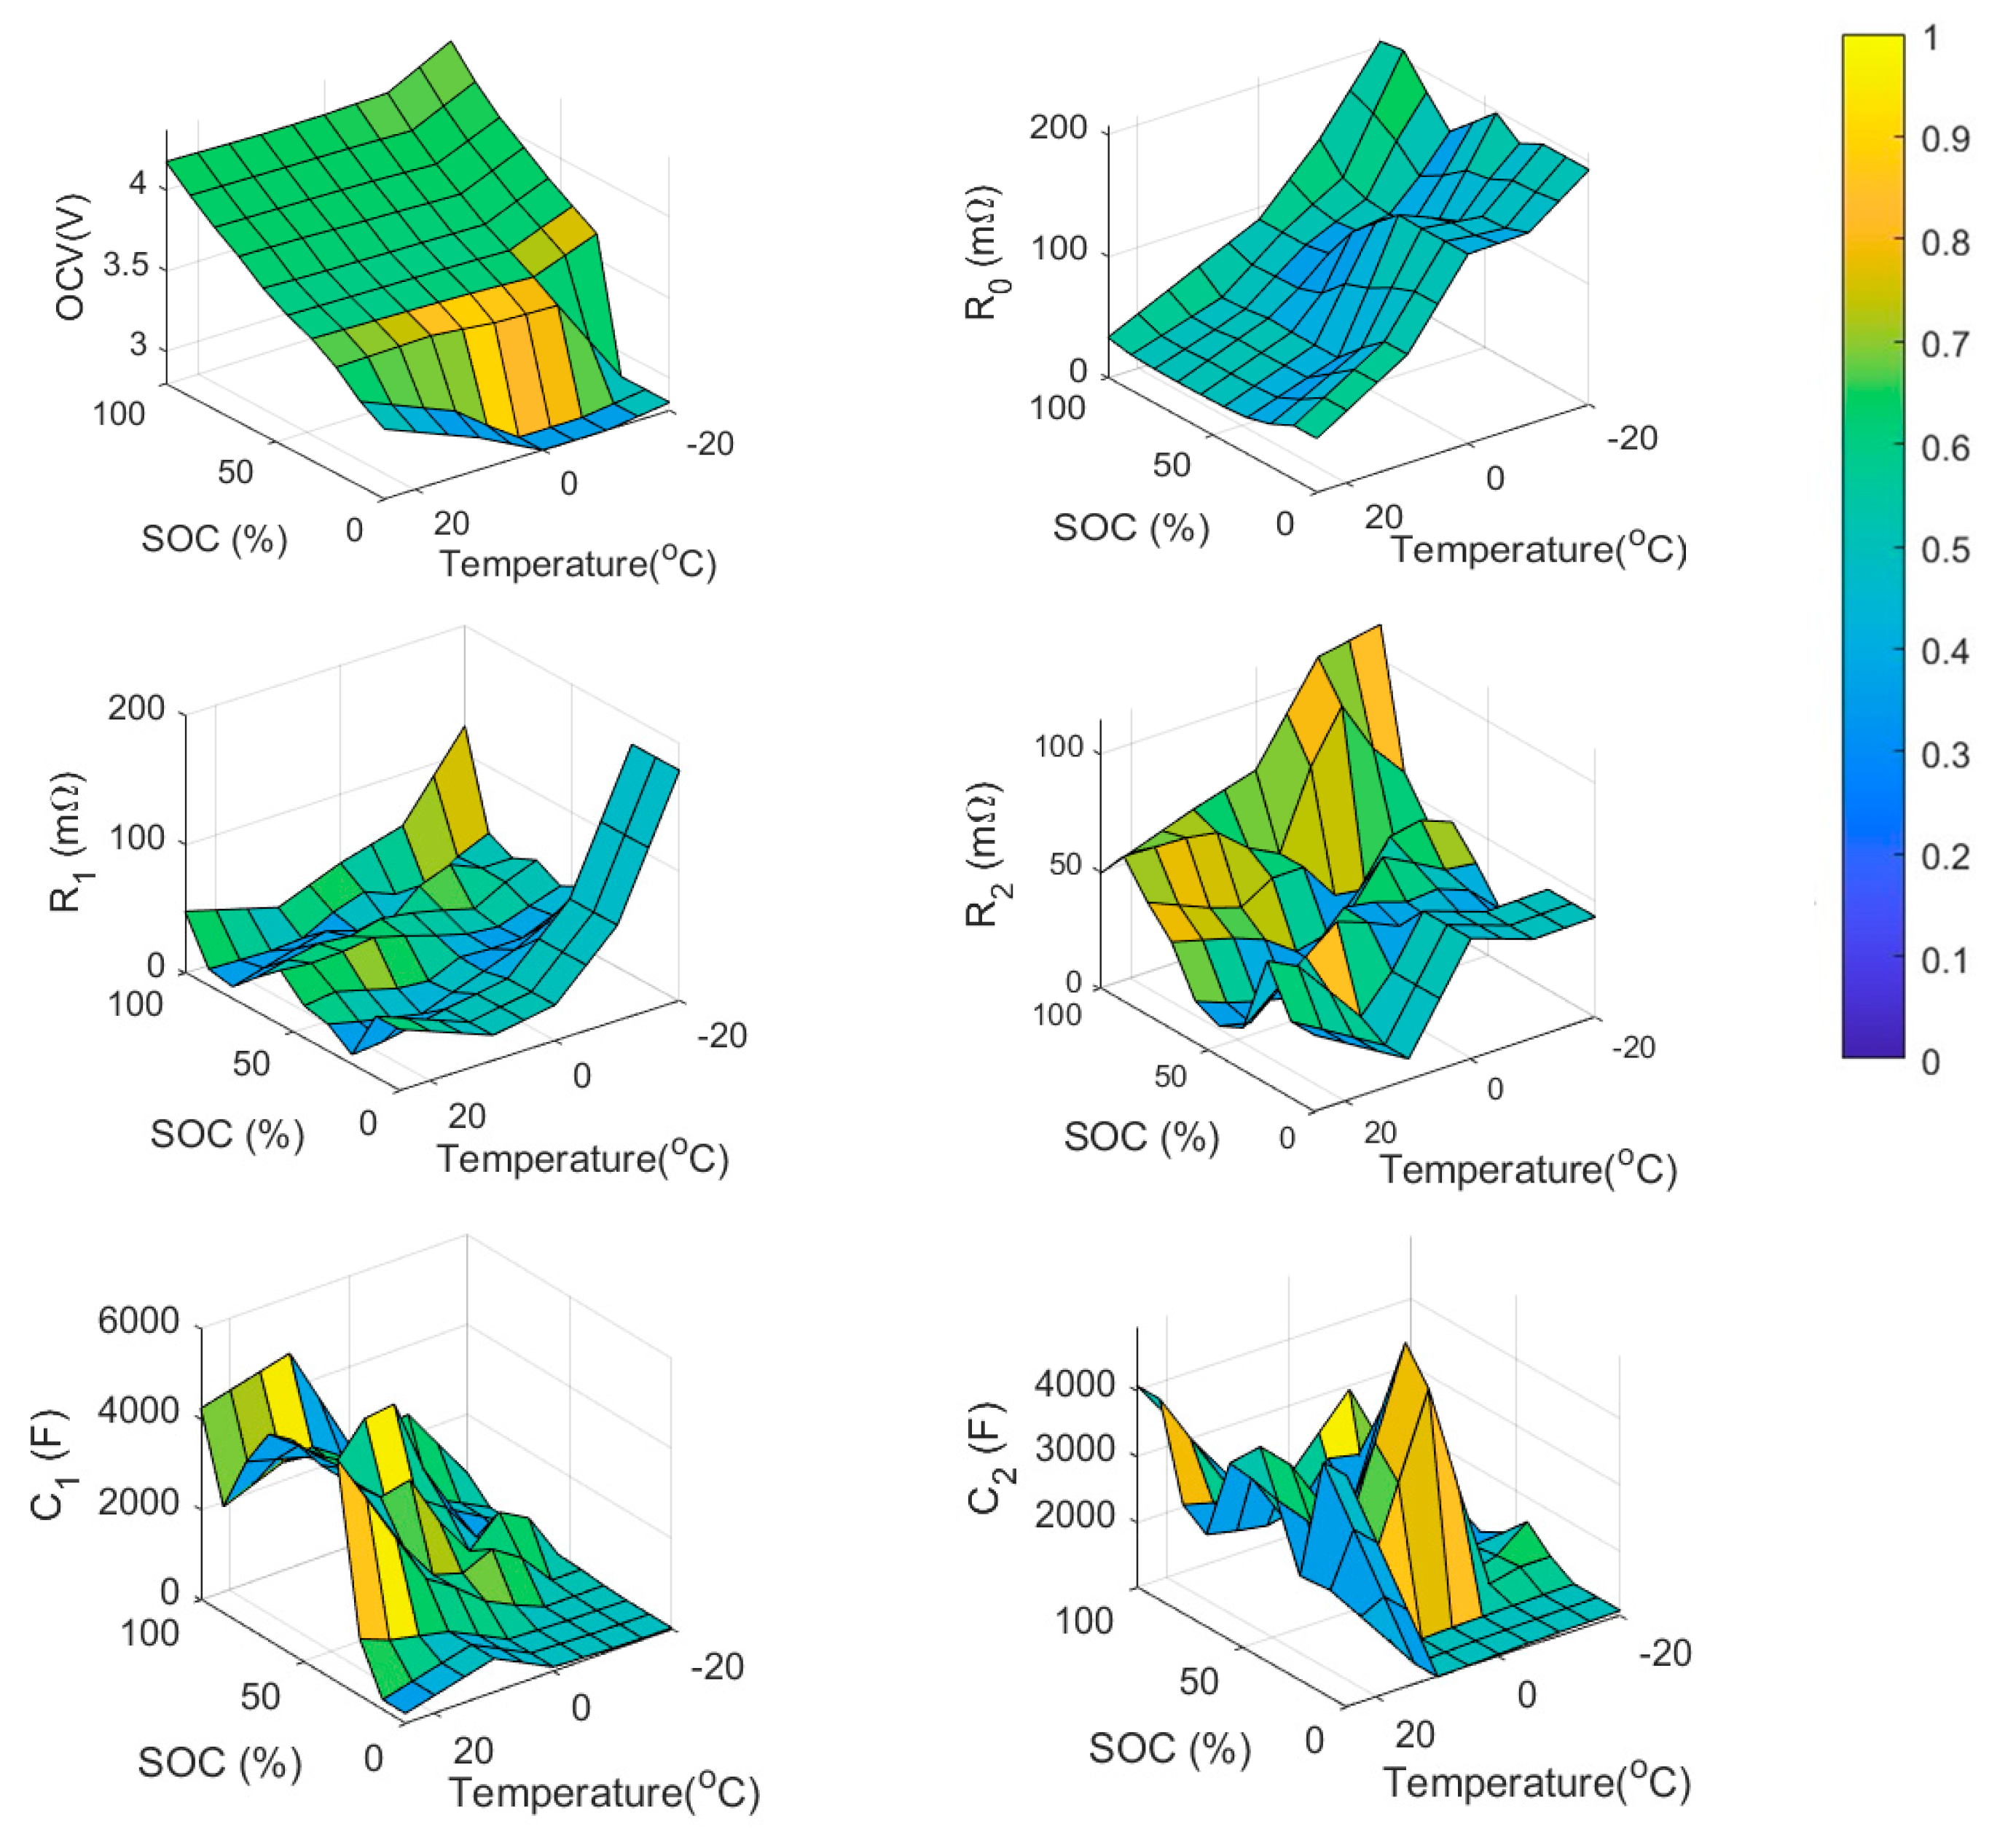
Figure 10.
The proposed thermal model fit using a mixed drive cycle at 25 °C.

Figure 11.
ECM RMSE summary for four different drive cycles at each temperature.
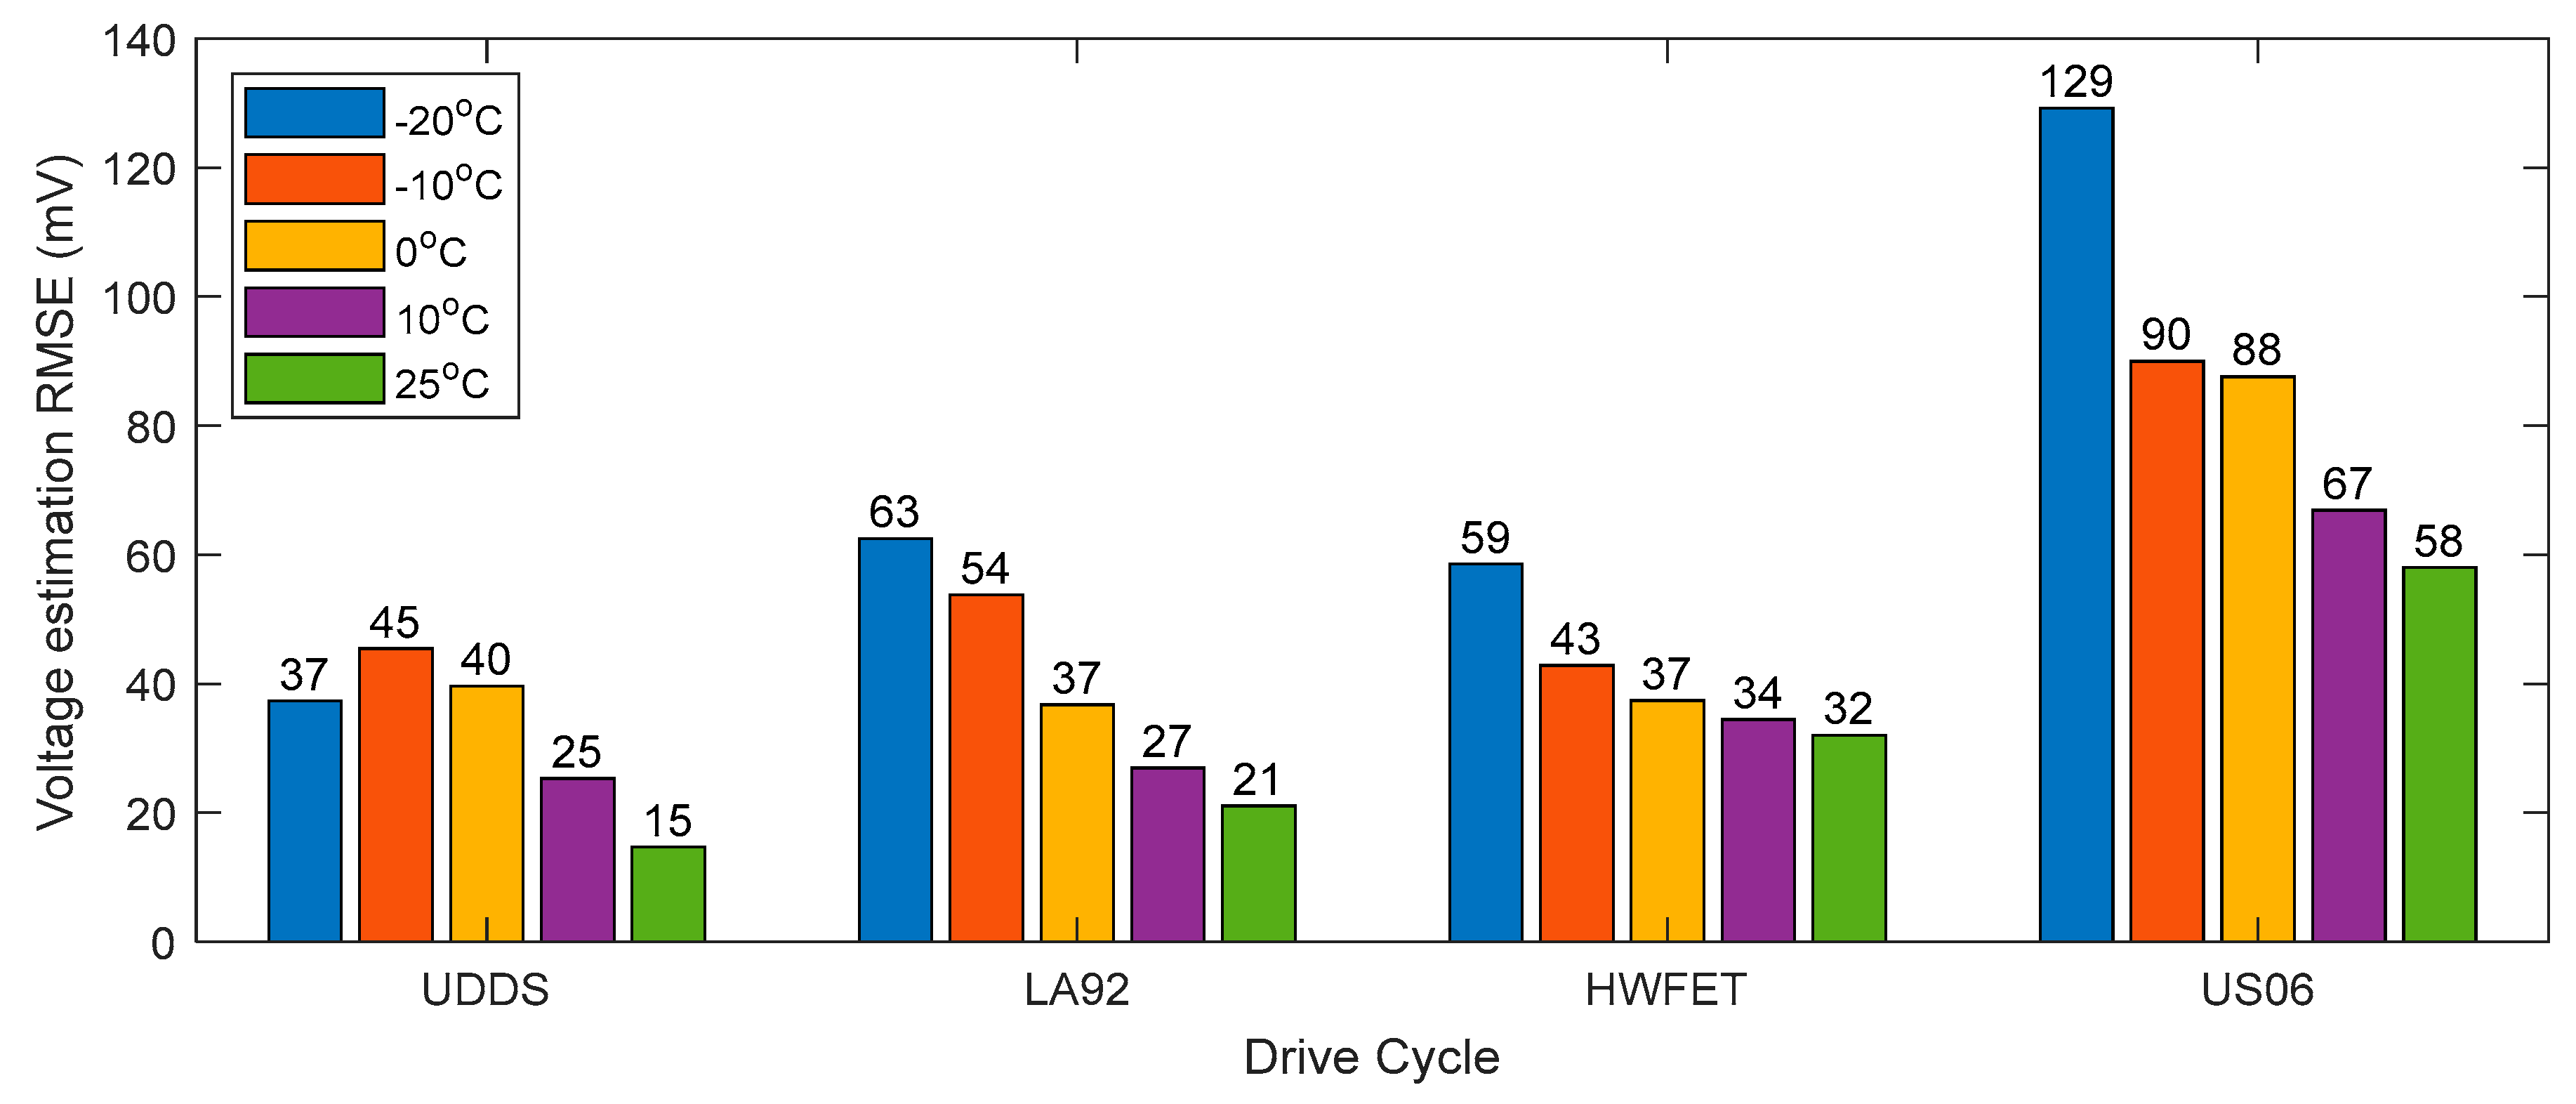
Figure 12.
ECM validation results for the best and worst test cases. (a) ECM voltage and the corresponding error for UDDS at 25 °C. (b) ECM voltage and the corresponding error for US06 at −20 °C.
Figure 12.
ECM validation results for the best and worst test cases. (a) ECM voltage and the corresponding error for UDDS at 25 °C. (b) ECM voltage and the corresponding error for US06 at −20 °C.
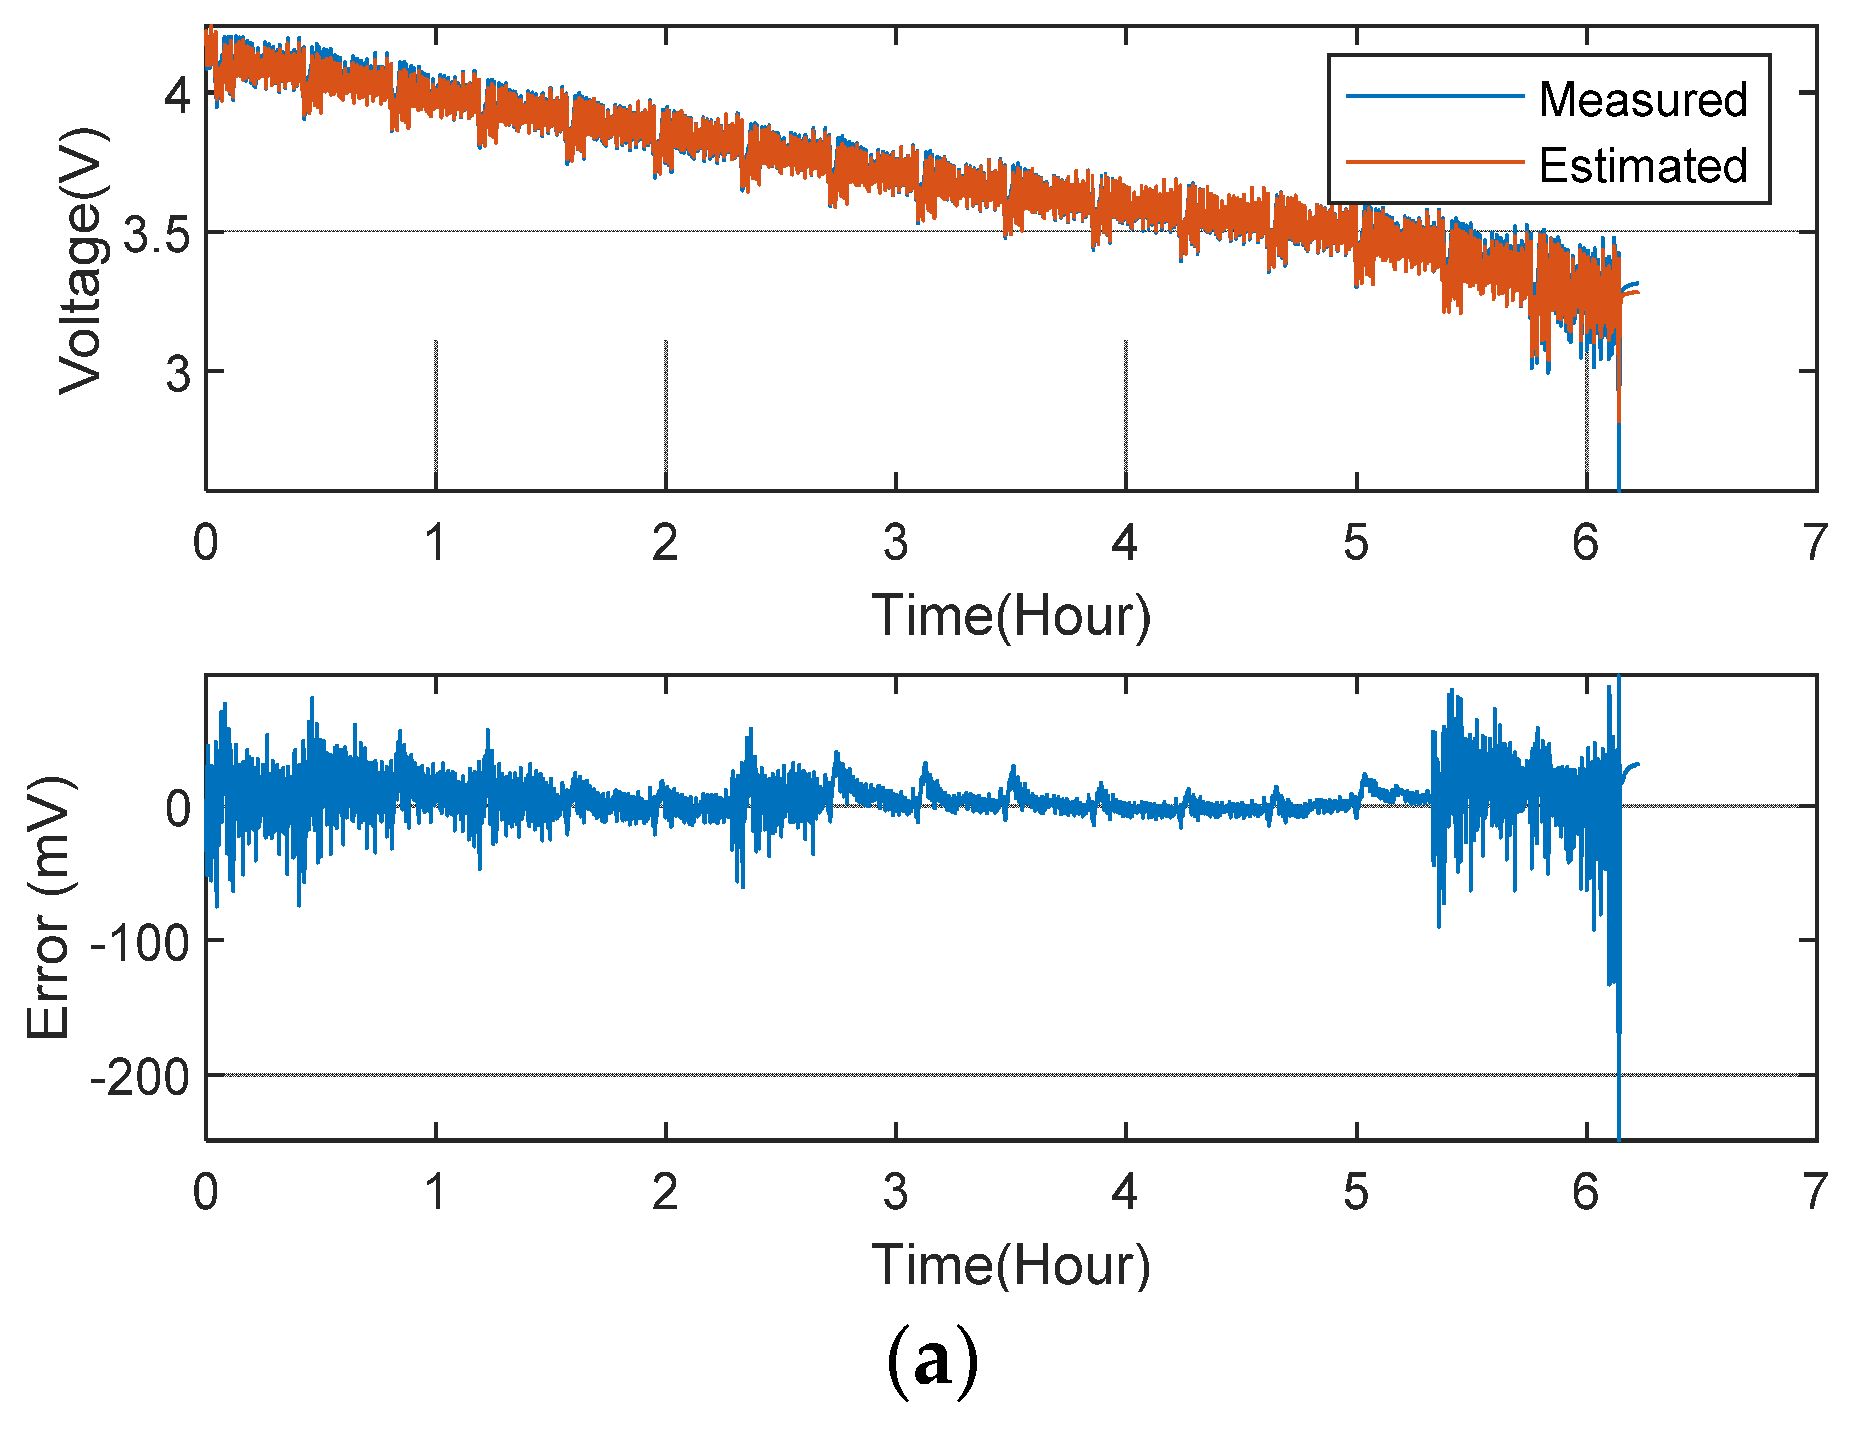

Figure 13.
ECM averaged RMS voltage error at temperature range from −20 to 25 °C.
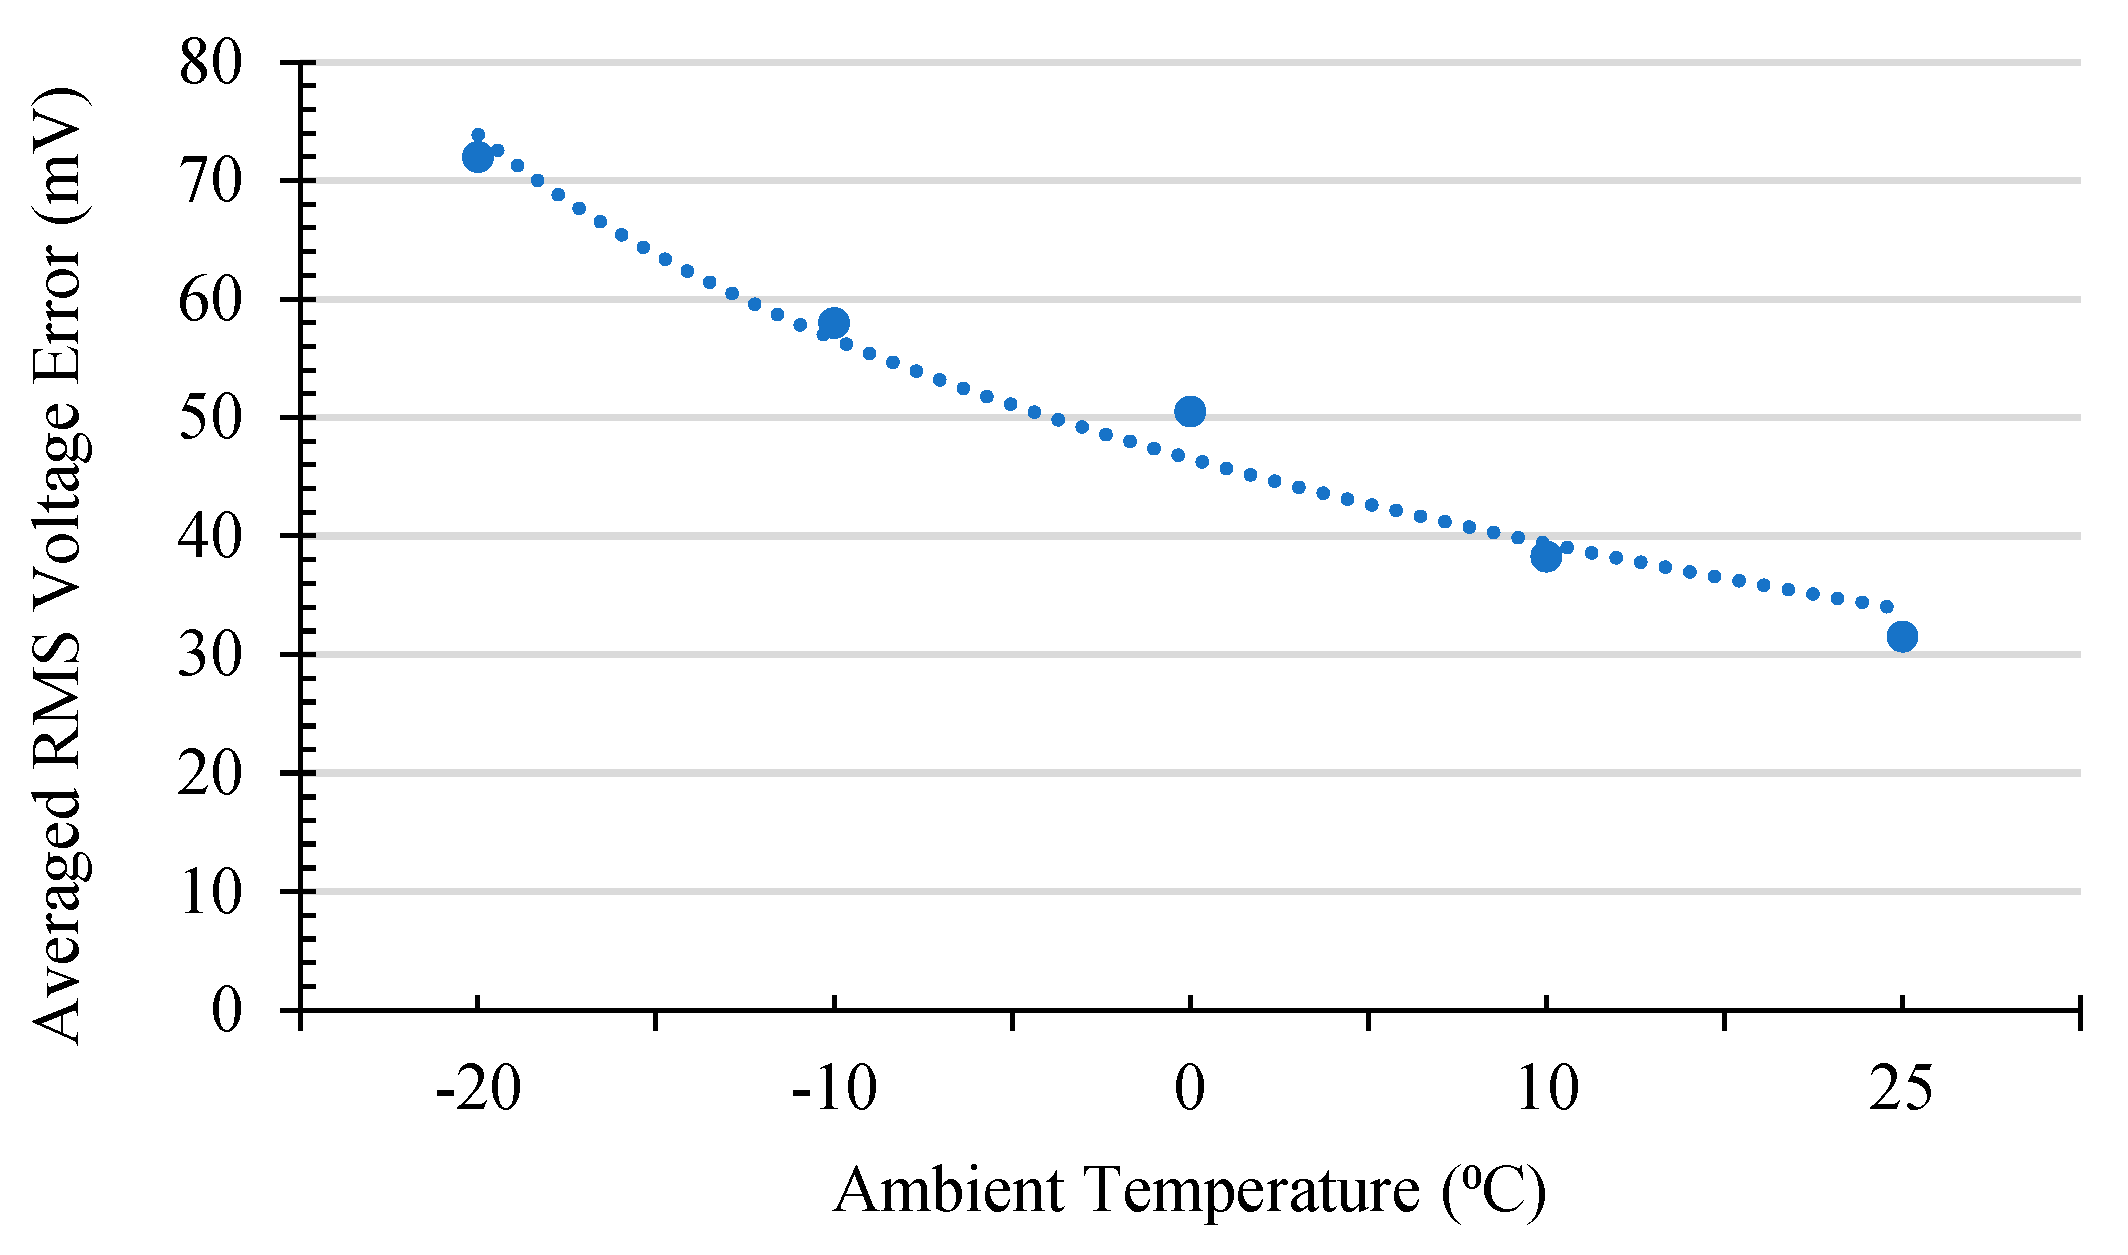
Figure 14.
Thermal model RMSE summary for four different drive cycles at each temperature.

Figure 15.
Thermal model surface temperature estimation best and worst cases. (a) Thermal model surface temperature and the corresponding error for UDDS at 25 °C. (b) Thermal model surface temperature and the corresponding error for US06 at −20 °C.
Figure 15.
Thermal model surface temperature estimation best and worst cases. (a) Thermal model surface temperature and the corresponding error for UDDS at 25 °C. (b) Thermal model surface temperature and the corresponding error for US06 at −20 °C.


Figure 16.
Thermal model averaged RMS temperature estimation error at ambient temperature range from −20 to 25 °C.
Figure 16.
Thermal model averaged RMS temperature estimation error at ambient temperature range from −20 to 25 °C.

Table 1.
A comprehensive summary of past publications in terms of the proposed approach.
| Work | Battery Type | Parameter Estimation Algorithm | Validation Dataset | Ambient Temperatures (°C) | Depth of Discharge |
|---|---|---|---|---|---|
| 1RC-ECM-Lumped [25] | Li-polymer 63 Ah pouch | N/A | CC/CD 1,2 | 25 | N/A |
| 2RC-ECM-Lumped [28] | 3.3 Ah cylindrical | Direct measurement | CC-CV 3 | 0, 30, 45 | N/A |
| R-ECM-lumped [29] | 50 Ah NMC prismatic | Experimental fit | CC-CV/PC 4 | 10, 20, 30 | N/A |
| 1RC + Lumped [30] | 2.9 Ah cylindrical | N/A | CD | −20, −15, −10, −5, 0, 22 | 100% |
| 1RC-PB-ECM-Lumped [10] | 1.8-Ah lithium-cobalt-oxide | N/A | Dynamic | 25 | 100% |
| 1RC-ECM-Lumped [22] | 1.6 Ah LFP cylindrical | Support vector method | Dynamic | 0, 10, 20, 30, 40 | 5% CS 5 |
| 1RC-ECM-Lumped [31] | 59.3 Ah NMC prismatic | Experimental fit | Dynamic | 0, 25, 40 | 100% |
| Lumped [32] | A123 26,650 cylindrical | RLS + DKF | Dynamic | 25 | N/A |
| R-ECM-Lumped [33] | 3.2 Ah cylindrical | N/A | Dynamic | 20 | 75% |
| 2RC-ECM-Lumped [34] | 2.3 Ah A123 LFP cylindrical | RLS | Dynamic | 5, 25 | 75% |
1 CC: constant charge, 2 CD: constant discharge, 3 CC-CV: constant current–constant voltage charge, 4 PC: pulsating charge, 5 CS: current sustaining cycle.
Table 2.
Panasonic 18650PF cell specifications.
| Shape, Chemistry | Cylindrical, NMC |
|---|---|
| Nominal Operating Voltage | 3.6 V |
| Nominal Capacity | 2.9 Ah |
| Min/Max Voltage | 2.5 V/4.2 V |
| Mass | 46.5 g |
Table 3.
Test setup specifications.
| Cycler Manufacturer | Digatron Firing Circuits |
|---|---|
| Test Channel Used | 75 A, 0–5 V |
| Voltage/Current Accuracy | +/−0.1% Full Scale |
| Data Acquisition Rate | 10 Hz |
| Thermal Chamber | Envirotronics |
| Chamber Size | 8 cu. Ft. |
Table 4.
Drive cycle data.
| Type | Drive Cycle | Length (km) | Duration (s) | Average Power (W) | Peak Power (W) |
|---|---|---|---|---|---|
| City | UDDS | 7.45 | 1370 | 1.62 | 12.01 |
| LA92 | 9.81 | 1436 | 1.45 | 17.47 | |
| US06 | 8 | 601 | 7.25 | 32.09 | |
| Freeway | HWFET | 10.25 | 766 | 5.08 | 10.16 |
Table 5.
GA initial and boundary values for the parameters of the ECM and thermal model.
| GA Parameter | Initial | Lower | Upper |
|---|---|---|---|
| ECM internal resistance () | 50 mΩ | 1 mΩ | 300 mΩ |
| ECM RC resistances () | 100 mΩ | 1 mΩ | 1000 mΩ |
| ECM RC capacitances () | 1000 F | 1000 F | 10,000 F |
| Core conduction thermal resistance () | 2 | 0.1 | 10 |
| Convection thermal resistance () | 15 | 0.1 | 50 |
| Heat capacity of the core of the battery () | 80 | 5 | 100 |
| Heat capacity of the casing of the battery () | 20 | 5 | 100 |
Table 6.
Battery thermal parameters.
| Battery core thermal resistance () | 0.1032 |
| Convection thermal resistance () | 7.679 |
| Heat capacity of the core () | 64.28 |
| Heat capacity of the casing () | 5.106 |
Table 7.
Proposed model performance benchmarking against different models in the literature.
| Work | Voltage Estimation Error | Surface Temperature Estimation Error | Testing Drive Cycle | Cycle Temperature Range (°C) | SOC Variation |
|---|---|---|---|---|---|
| Lumped [32] | N/A | 0.3 °C RMSE | ECC 1 | 25–40 | N/A |
| R-ECM-Lumped [33] | N/A | 1 °C MAXE 2.5 °C MAXE | City-I 2 FTP 3 | 20–50 | 25–100% |
| 1RC-ECM-Lumped [31] | 118 mV RMSE 500 mV MAXE | 1.5 °C RMSE 8 °C MAXE | FDC 4 | 25–50 | 0–100% |
| 2RC-ECM-Lumped [34] | 20.3 mV RMSE 45.4 mV RMSE | 0.65 °C RMSE 0.2 °C RMSE | ChS 5 ChD 6 | 5–23 25–38 | 30–53% 25–100% |
| The proposed 2RC-Lumped | 50.05 mV RMSE <300 mV MAXE | 0.50 °C RMSE <2.3 °C MAXE | MDC 7 | −20–35 | 0–100% |
1 ECC: escort convoy cycle, 2 City-I: city cycle, 3 FTP: federal test procedure cycle, 4 FDC: full discharge cycle with different C-rates, 5 ChS: charge sustaining cycle, 6 ChD: charge depletion cycle, 7 MDC: multiple behavior drive cycles including UDDS, LA92, HWFET, and US06.
Table 8.
Advantages and disadvantages of the proposed electro-thermal model.
| Advantage | Disadvantage | |
|---|---|---|
| Parameter Estimation |
|
|
| Model Parameters |
|
|
| Computational Load |
|
|
| Applications |
|
|
Disclaimer/Publisher’s Note: The statements, opinions and data contained in all publications are solely those of the individual author(s) and contributor(s) and not of MDPI and/or the editor(s). MDPI and/or the editor(s) disclaim responsibility for any injury to people or property resulting from any ideas, methods, instructions or products referred to in the content. |
© 2023 by the authors. Licensee MDPI, Basel, Switzerland. This article is an open access article distributed under the terms and conditions of the Creative Commons Attribution (CC BY) license (https://creativecommons.org/licenses/by/4.0/).
Share and Cite
MDPI and ACS Style
Naguib, M.; Rathore, A.; Emery, N.; Ghasemi, S.; Ahmed, R. Robust Electro-Thermal Modeling of Lithium-Ion Batteries for Electrified Vehicles Applications. Energies 2023, 16, 5887. https://doi.org/10.3390/en16165887
AMA Style
Naguib M, Rathore A, Emery N, Ghasemi S, Ahmed R. Robust Electro-Thermal Modeling of Lithium-Ion Batteries for Electrified Vehicles Applications. Energies. 2023; 16(16):5887. https://doi.org/10.3390/en16165887
Chicago/Turabian StyleNaguib, Mina, Aashit Rathore, Nathan Emery, Shiva Ghasemi, and Ryan Ahmed. 2023. "Robust Electro-Thermal Modeling of Lithium-Ion Batteries for Electrified Vehicles Applications" Energies 16, no. 16: 5887. https://doi.org/10.3390/en16165887
Note that from the first issue of 2016, this journal uses article numbers instead of page numbers. See further details here.