Article

Modelling of Floor Heating and Cooling in Residential Districts

1
Institute of Structural Mechanics and Design, Department of Civil and Environmental Engineering, Technical University of Darmstadt, 64289 Darmstadt, Germany
2
Institute of Geotechnics, Department of Civil and Environmental Engineering, Technical University of Darmstadt, 64289 Darmstadt, Germany
*
Author to whom correspondence should be addressed.
Energies 2023, 16(15), 5850; https://doi.org/10.3390/en16155850
Submission received: 26 June 2023 / Revised: 20 July 2023 / Accepted: 27 July 2023 / Published: 7 August 2023
(This article belongs to the Section G: Energy and Buildings)

Abstract

:
In this study, a method is proposed to expand the utilization of an existing calculation model for a floor heat exchanger (HX) from room scale to small district scale. The model, namely Trnsys Type 653, is typically employed for the simulation of single or simultaneously controlled parallel heating circuits. It uses a simplified approach to calculate the heat exchange between fluid and screed, taking the HX effectiveness as an input. In order to calculate the effectiveness based on the HX design, fluid properties and mass flow rate, a Python model is developed to be coupled with Type 653. The results are compared to a reference finite element model set up in COMSOL® and depend on the HX design. The highest deviations range from over 1 K for 35 min to over 2 K for 175 min, while the lowest deviations range from below 0.5 K to below 1 K. Furthermore, the simplification of the floor HX model is analyzed by summarizing heating circuits from single rooms to a whole flat and from single flats to a whole floor. This approach results in deviations of approximately 2 and 4%, respectively, in the overall transferred heat over longer periods of time, while the switch-on frequency of the controller in an exemplary day is halved. While further analysis is required, the described simplifications seem promising for detailed district simulations with relatively low computational effort.

1. Introduction

As part of the Paris Climate Agreement, many countries, including Germany, agreed to reduce their greenhouse gas emissions by 2015 [1]. Building on this, the amendment to the German Climate Protection Act in 2021 tightened the Federal Government’s climate protection targets and declared the goal of greenhouse gas neutrality by 2045 [2]. Taking into account not only energy consumption for domestic hot water and space heating, but also grey energy from construction and eventual demolition, the building sector is responsible for around 40% of CO2 emissions in Germany [3]. Globally, buildings alone account for 40% of global energy consumption [4]. Reducing energy consumption for building heating purposes and using greener energy sources to operate the system is therefore crucial to achieve lower overall carbon emissions. To mitigate the environmental impact of the building energy demand, renewable heat sources in district energy solutions have gained popularity in recent years, especially in the European Union, as described by Werner [5]. Compared to individual heating solutions, the reduction of greenhouse gas emissions by collectively switching to cleaner fuel sources is a key advantage of district heating, together with cost benefits such as high fuel efficiency, reduced demand for heat generation capacity and cheaper fuels [6]. In this context, low system temperatures are beneficial for energy and exergy efficiency as well as for the integration of renewable energies (described by Brand and Svendsen [7], among others). On the building side, low temperatures can be achieved through the use of surface heating, e.g., radiant floors (described by Jochum et al. [8] and others).
Numerical simulations are frequently performed to analyze and optimize said energy systems. Thereby, heating and cooling loads are often integrated by means of load profiles (e.g., by Formhals et al. [9], Carpaneto et al. [10]). However, designing and optimizing local heating networks and integrating multiple heat sources and sinks requires the detailed simulation of buildings and networks to understand the thermal dynamic behavior [11]. Such can be the case in investigating energy flexible control with dynamic price tariffs, as described by Arteconi and Polonara [12], or a passive floor cooling system using borehole heat exchangers (BHEs), due to the mutual influence of the in- and outlet temperatures of the floor HX and the BHE field. In certain cases, it cannot be guaranteed that the desired cooling power can be met at all times, depending on further heat injection, available temperatures and the dimensioning of the system, including the maximum flow rates and pipe spacing. Furthermore, the user behavior has a considerable influence on the cooling demand (observed, e.g., by Saelens et al. [13]).
There are several studies in the literature that deal with the detailed simulation of floor HX. Brideau et al. [14] presented a comparison of modelling approaches for embedded-tube radiant floors in TRNSYS, ESP-r and EnergyPlus, evaluating their performance through predictions and comparing them to a transient stand-alone finite element analysis tool. Stephan Göbel et al. [15] proposed a comprehensive model for floor HX in Modelica, taking into account the distribution, heating circuits and heat transfer through different floor layers. The study shows that variations in floor HX parameters and floor layers affect heat transfer, with pipe spacing having the most significant effect on the temperature level of the system. Miroshnichenko et al. [16] carried out a theoretical research study to analyze the impact of automating floor HX in a room, taking into account ambient conditions and heat transfer. Numerical simulations were used to investigate various parameters, such as surface emissivity, the length of the floor HX and ambient boundary conditions, highlighting the significant contribution of thermal radiation to the overall heat transfer even under typical room conditions. Furthermore, three available floor HX models in TRNSYS have been analyzed by Rey et al. [17]. They achieved good results regarding accuracy and computational effort using Type 653, which uses the HX effectiveness approach and assumes the slab to behave as a lumped capacitance, as was described by Thornton et al. [18]. The HX effectiveness approach is well known for the dimensioning of heat exchangers. Rey et al. [17] found that the effectiveness is the most sensitive model input of Type 653. Several studies have also investigated the coupling between the building energy system, especially with the integration of a BHE field, and the ground HX in individual buildings, e.g., by Danielewicz et al. [19], Dott et al. [20] and Arghand et al. [21]. However, to the authors’ knowledge, there are no similar studies to date that have considered the detailed simulation of floor HX on a larger scale, such as that of a residential district, to allow, for example, the investigation of the coupling with the district energy system.
The novelty of this study is the establishment of a simplified approach to model a floor heating and cooling system for building temperature control in a small district, to obtain a detailed simulation without the drawback of long simulation times. Accordingly, a new model to calculate the effectiveness in every time step has been implemented in Python using Type 3157 described by Bernier et al. [22] as an interface to TRNSYS. To verify the results using this new model, three different COMSOL® models of floor heat exchangers are set up as a reference. We provide the script, created with Python 3.10, and an example for coupling with Type 3157 on GitHub (https://github.com/xenkGit/TRNSYS_HX_effectiveness_for_Type653, accessed on 15 June 2023).
Using the aforementioned models, possible simplifications of the floor heating and cooling model are analyzed. First, simplification from a detailed flat with four different fluid circuits to one thermal zone with one floor heat exchanger model is considered. Subsequently, the simplification from flat level to the whole floor, including four individual flats, is performed.
The basic equations for the calculation of the HX effectiveness (Section 2.1) and the model set-ups (Section 2.2 and Section 2.3) are described in Section 2. In Section 3, the results of the comparison of the TRNSYS and the COMSOL® models for a heating and a cooling case are evaluated (Section 3.1), as well as the results of the TRNSYS model simplification (Section 3.2). These results are discussed in Section 4.

2. Materials and Methods

The simulation software TRNSYS, developed by Klein et al. [23], is a commonly used tool for building and energy system simulations and has been validated by Neymark et al. [24], among others. It allows the coupling of the building model with the energy system model. However, as the size of the district to be modelled increases, the level of detail usually needs to be reduced. TRNSYS Type 653 models a simple radiant slab and treats the slab as a single lumped capacitance without spatial thermal gradients. The fluid to slab heat transfer is modelled using the HX effectiveness approach. Its advantages lie in the low computation time and low parametrization effort. The calculation of the effectiveness as a model input to Type 653 is described in Section 2.1. The results of the implemented effectiveness model in combination with Type 653 are compared to the results of three different reference models set up in COMSOL®, which are described in Section 2.2. Subsequently, the simplifications of the building and floor heat exchanger model from individual rooms to whole flats and from individual flats to whole floors are analyzed using Type 653 and the aforementioned effectiveness models (Section 2.3). In this paper, the thermal zones of the building model are summarized, as well as the associated heat exchanger models.

2.1. HX Effectiveness

The Number of Transfer Units (NTU) method is a common method to calculate the heat transfer rate of heat exchangers if the outlet temperatures are not known a priori. The effectiveness ε of the heat exchanger is defined as the heat transfer rate Q ˙ at specific conditions related to the maximum possible heat transfer rate Q ˙ m a x at the same conditions (Equation (1)), which would occur if the medium with smaller thermal capacitance C m i n took the temperature of the medium with larger capacitance. Due to the assumed uniform temperature within the slab, the effectiveness can be determined according to Equation (2) and Equation (3), as given by Lienhard IV and Lienhard V [25] (p. 126). The heat transfer rate can then be calculated according to Equation (4).
ε = Q ˙ Q ˙ m a x
ε = 1 e N T U
N T U = U · A m ˙ · c p
Q ˙ = ε · C m i n · ( T f l u i d , i n T s l a b )
where A is the HX area, m ˙ · c p = C m i n , T f l u i d , i n is the inlet fluid temperature and T s l a b is the slab temperature.
In order to determine the thermal transmittance U between fluid and screed, the thermal resistance R due to the flow characteristics of the fluid and the material properties of the pipe is calculated according to Gnielinski et al. [26] (pp. 34, 785–789) (Equations (5)–(8)). Additionally, thermal contact resistance of 0.02 m 2 · K W between the PE pipe and the screed is assumed (a similar value has been reported by Li et al. [27]).
R = 1 U · A = 1 α · π · d i · l + l n ( r a r i ) λ p · 2 π · l
N u = α · d i λ f l
R e = v · d i ν
P r = ν a
where α is the heat transfer coefficient between fluid and pipe, λ p and λ f l are the thermal conductivity of the pipe and fluid, respectively, r a and r i are the outer and inner radii of the pipe, l is the pipe length, v is the fluid velocity, ν is the kinematic viscosity of the fluid and a is the thermal diffusivity of the fluid.
The Nusselt Number N u is calculated according to Gnielinski et al. [26] (pp. 785–789) as a function of the Reynolds number R e and the Prandtl number P r for the following cases:
  • At fully developed laminar boundary layer flow and a constant wall temperature for R e < 2300 and 0.6 < P r < 1000 :
    N u l a m , 1 = 3.66 3 + 0.7 3 + 1.615 · R e · P r · d i l 1 3 0.7 3 3
  • At developed turbulent boundary layer flow for R e > 10 4 and 0.6 < P r < 1000 :
    N u t u r b = ξ 8 · R e · P r 1 + 12.7 · ξ 8 · P r 2 3 1 · 1 + d i l 2 3
    with
    ξ = 1.8 · l o g ( R e ) 1.5 2
  • In the transition zone for 2300 < R e < 10 4 , 0.6 < P r < 1000 and 0 < γ < 1 :
    N u t r = ( 1 γ ) · N u l a m , 2 ( R e = 2300 ) + N u t u r b ( R e = 10 4 )
    with
    γ = R e 2300 10 4 2300
    and
    N u l a m , 2 = N u l a m , 1 3 + 2 1 + 22 · P r 1 6 · R e · P r · d i l 1 2 3 3

2.2. Reference Model in COMSOL®

To verify the approach described in Section 2.1, three finite element models are set up as a reference using the commercial simulation software COMSOL Multiphysics®, general-purpose simulation software based on finite element methods, which is validated against several benchmark problems according to [28]. For this purpose, two rooms in a building in a planned district in Darmstadt, Germany are chosen as real-life examples.
In room 1, with a floor area of 20.7 m 2 , pipe distances d of 35 and 10 cm (resulting pipe lengths: 52.6 m, 157.3 m) are analyzed. In room 2, with a floor area of 9 m 2 , a pipe distance of 10 cm (resulting pipe length: 67.2 m) is used (see Figure 1).
In COMSOL®, the nonisothermal pipe flow and heat transfer in solids modules are used to model the floor heat exchanger. The pipe flow profiles are approximated by 1D assumptions as described in the pipe flow module user’s guide [29] and embedded in a 6.5 cm thick layer of screed. Water is used as a fluid. The inlet temperature and inlet velocity are specified as model inputs. For the pipes, an inner radius of 17 mm and a 2.2 mm thick wall with thermal conductivity of 0.39 W m 2 · K are used. Heat exchange to the adjacent room is only considered at the upper surface of the screed with a heat transfer coefficient of 9.72 W m 2 · K , and the other surfaces are treated as adiabatic. The room temperature is assumed to remain constant. Two different use cases are analyzed, for which the conditions are specified in Table 1. The room temperature is, at the same time, the initial temperature of the heat exchanger. While COMSOL® determines the necessary calculation time step dynamically, in TRNSYS, a fixed time step of 5 min is used. An edge mesh with a minimum element size of 0.00759 m and a maximum element size of 0.177 m is used for the pipes, while a tetrahedral mesh with a minimum element size of 0.00101 m and a maximum element size of 0.101 m is used for the screed. The time-dependent parametric sweep is performed using the BDF time stepping method.

2.3. TRNSYS Model Simplification

In order to model the floor heating and cooling performance in buildings of a small district, the possibility of summarizing the individual circuits of the floor heat exchanger is analyzed (see Figure 2). Bewersdorff [30] (pp. 181–187) showed that the approach of summarizing a whole floor to one thermal zone can lead to good results (only about 4% deviation assuming a constant ventilation scenario) regarding the simulated final energy demand of a building. In this work, the application of this approach is to be verified using floor heating and cooling systems modelled with TRNSYS Type 653, as explained in Section 2.1. In the first step, the four heating circuits of an example flat are summarized. The flat consists of four rooms with different floor areas and pipe distances, as well as non-heated areas. In the second step, the individual heating circuits of the flats in a floor are summarized. The floor consists of four flats of similar size.

3. Results

The results of the implemented effectiveness model in combination with Type 653 are described in Section 3.1 for a cooling case (Section 3.1.1) and a heating case (Section 3.1.2). Subsequently, the results of the simplifications of the building and floor heat exchanger model from individual rooms to whole flats and from individual flats to whole floors are analyzed in Section 3.2.

3.1. HX Effectiveness

In the following, the outlet temperatures of the floor heat exchangers modelled using the approach described in Section 2.1 are compared to the outlet temperatures of the reference models presented in Section 2.2. In each case, four different constant inlet velocities (0.35, 0.29, 0.1 and 0.01 m s ) are studied in order to cover the whole range of inlet velocities available for a PID controller.

3.1.1. Cooling Case

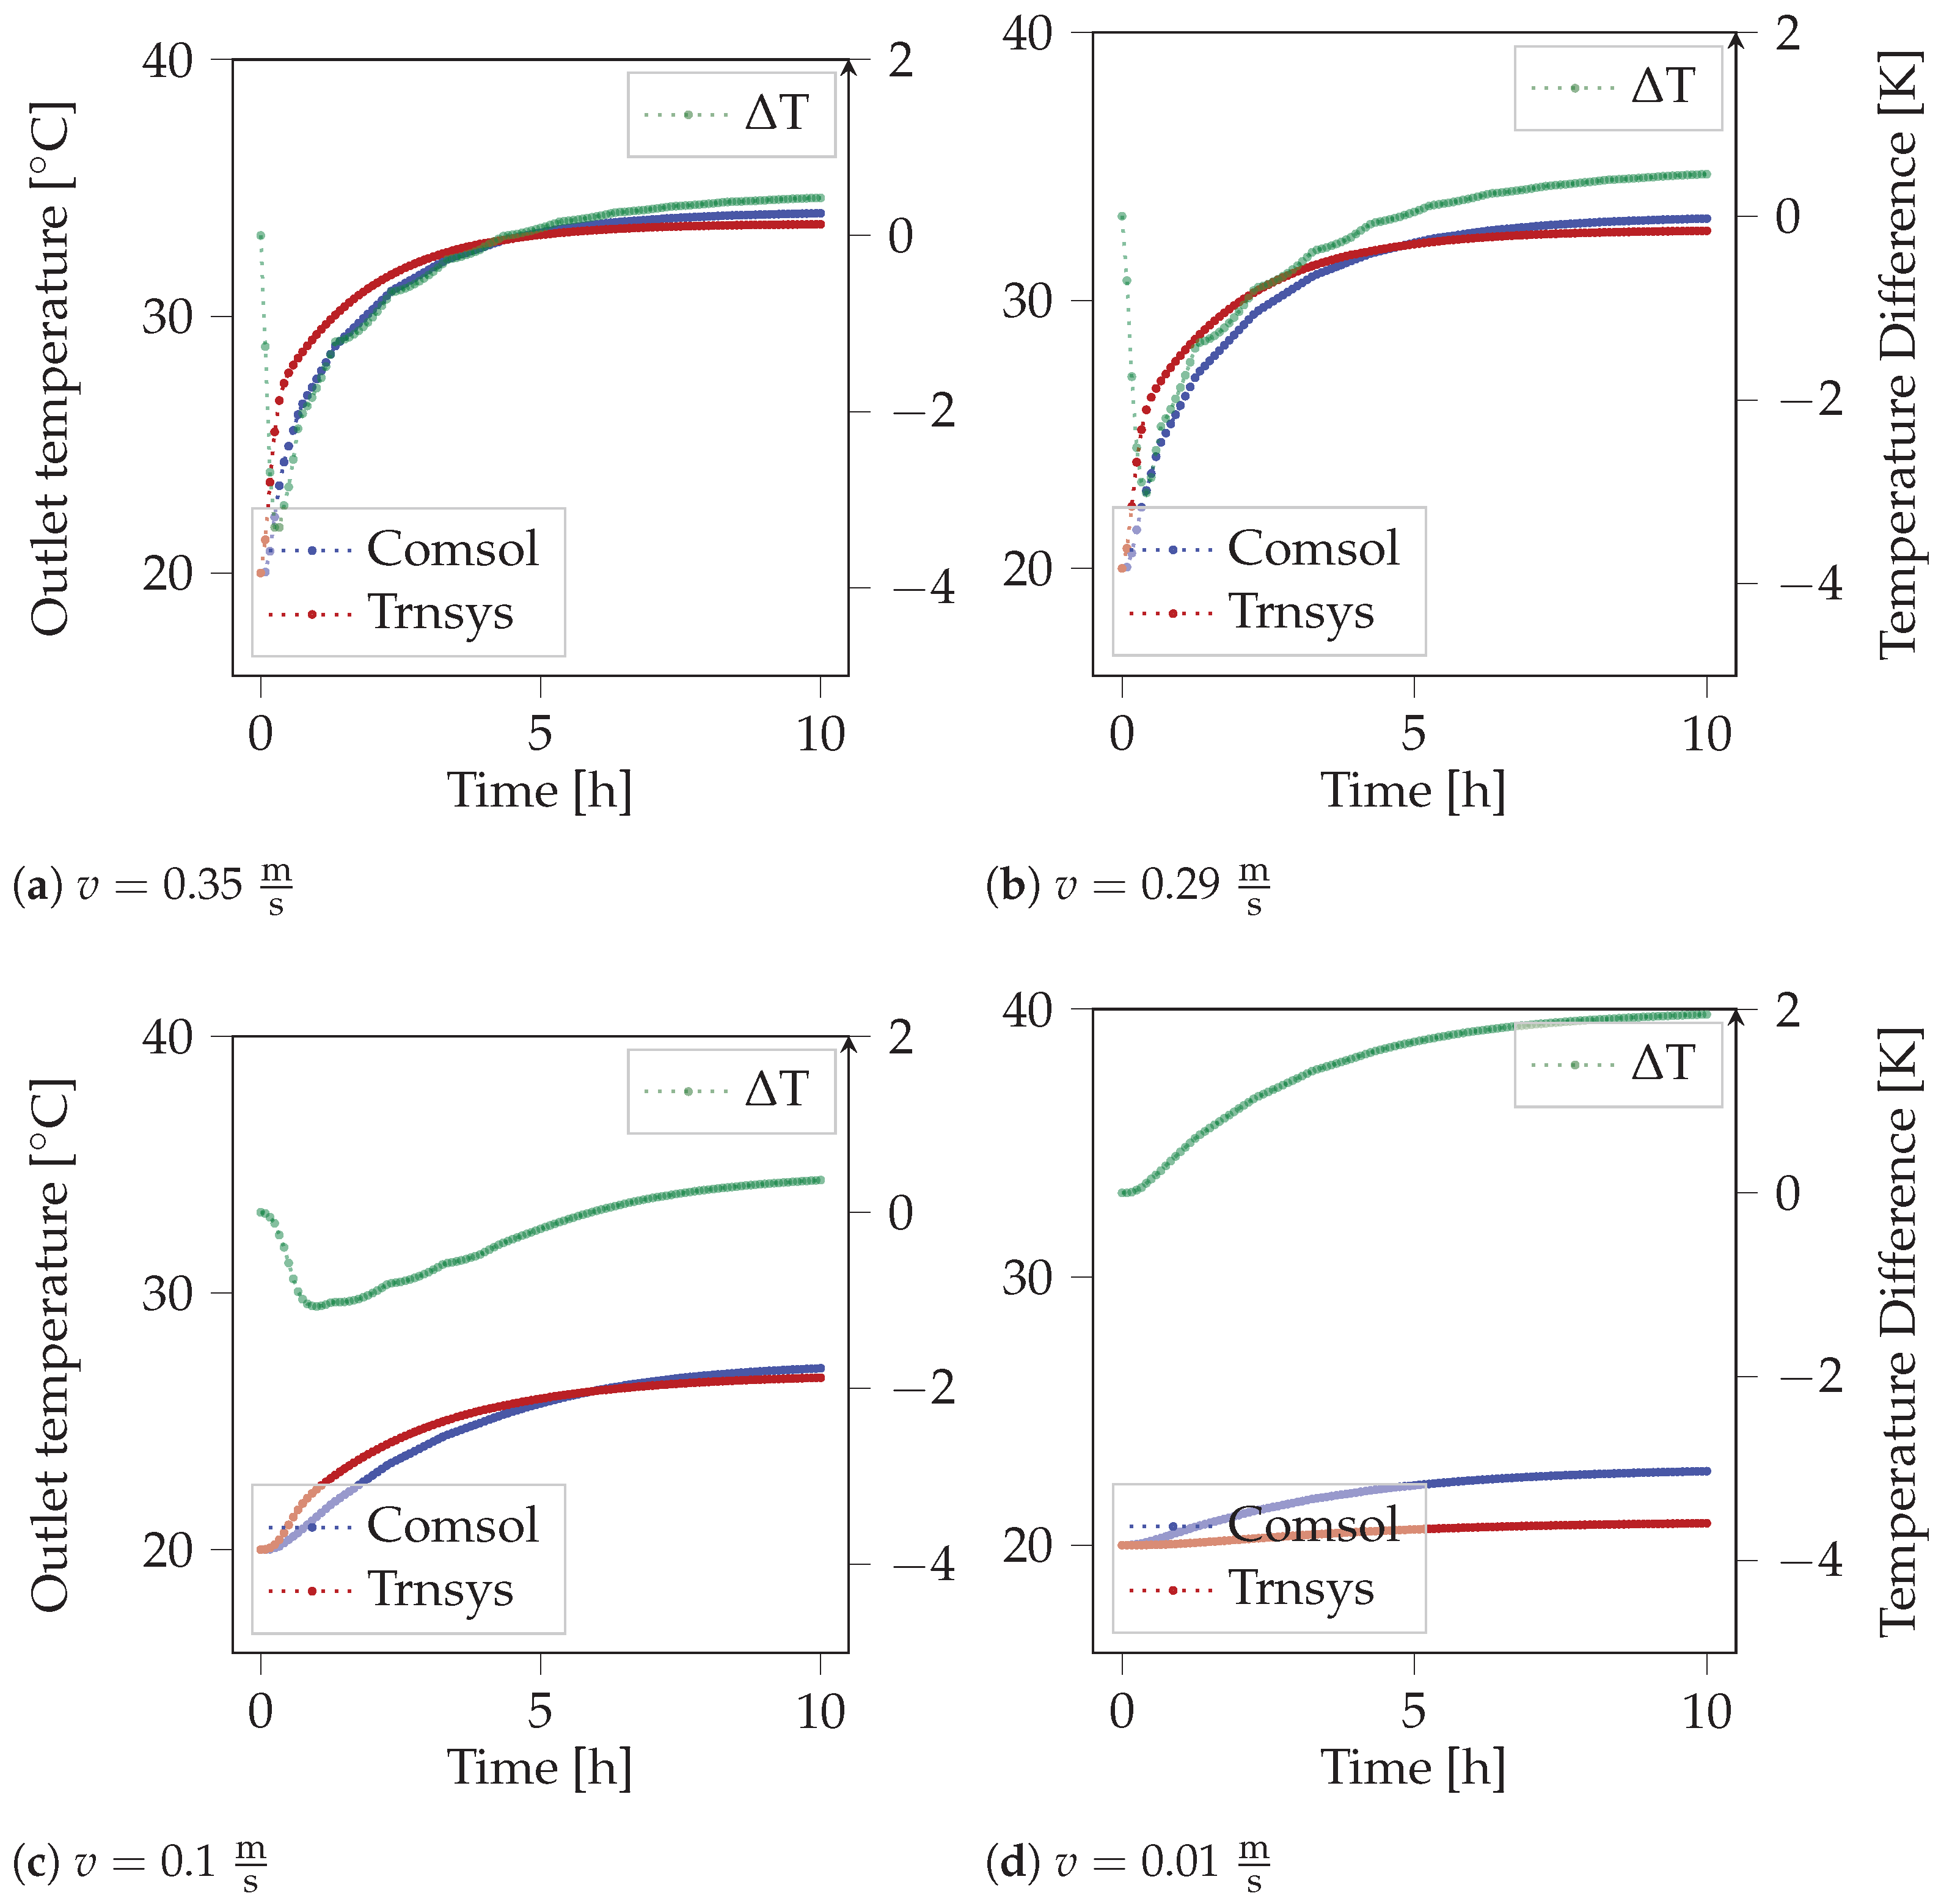
The outlet temperatures of the TRNSYS and the COMSOL® models in the cooling case in room 1 at a pipe distance of 35 cm are shown in Figure 3. The results for the other two geometries can be found in Appendix A (Figure A1 for room 1, pipe distance 10 cm and Figure A2 for room 2). The difference in the outlet temperatures of the TRNSYS and the COMSOL® models tends to converge below 1 K for each scenario. In Table 2, the time during which the temperature difference exceeds 0.5, 1 and 2 K, respectively, is displayed for room 1, pipe distance 10 cm. The results for the other geometries can be found in Table A1.
The effectiveness approach works well for steady state situations when the outlet temperature converges after the initial cooling down of the screed, especially for medium and high inlet velocities, where the temperature difference converges below 0.5 K after 0 to 105 min. The results with the lowest deviation over time are achieved when the inlet velocity is either very small (e.g., 0.01 m s , where the temperature difference does not exceed 1 K in all scenarios, but the deviation at steady state tends to be higher) and the transferred heat to the screed is close to the maximum, or when the inlet velocity is very high (e.g., 0.35 m s , where 1 K is only exceeded for 20 min in room 1 at a pipe distance of 35 cm) and steady state is reached faster than at low inlet velocities. In all scenarios, the deviation does not exceed 2 K. In 5 of 12 scenarios, it exceeds 1 K (10 to 35 min). In 5 of 12 scenarios, it exceeds 0.5 K for up to 5 min and in the remaining scenarios for 20 to 425 min.
The highest deviations occur during the initial cooling down of the screed at medium inlet velocities, where TRNSYS tends to cool down more quickly. This initially increased deviation takes the most time in room 2 at an inlet velocity of 0.1 m s , where a temperature difference of 1 K is exceeded for 35 min. In 10 of 12 cases, TRNSYS underestimates the heat transferred between fluid and screed during this time in comparison to COMSOL®.

3.1.2. Heating Case

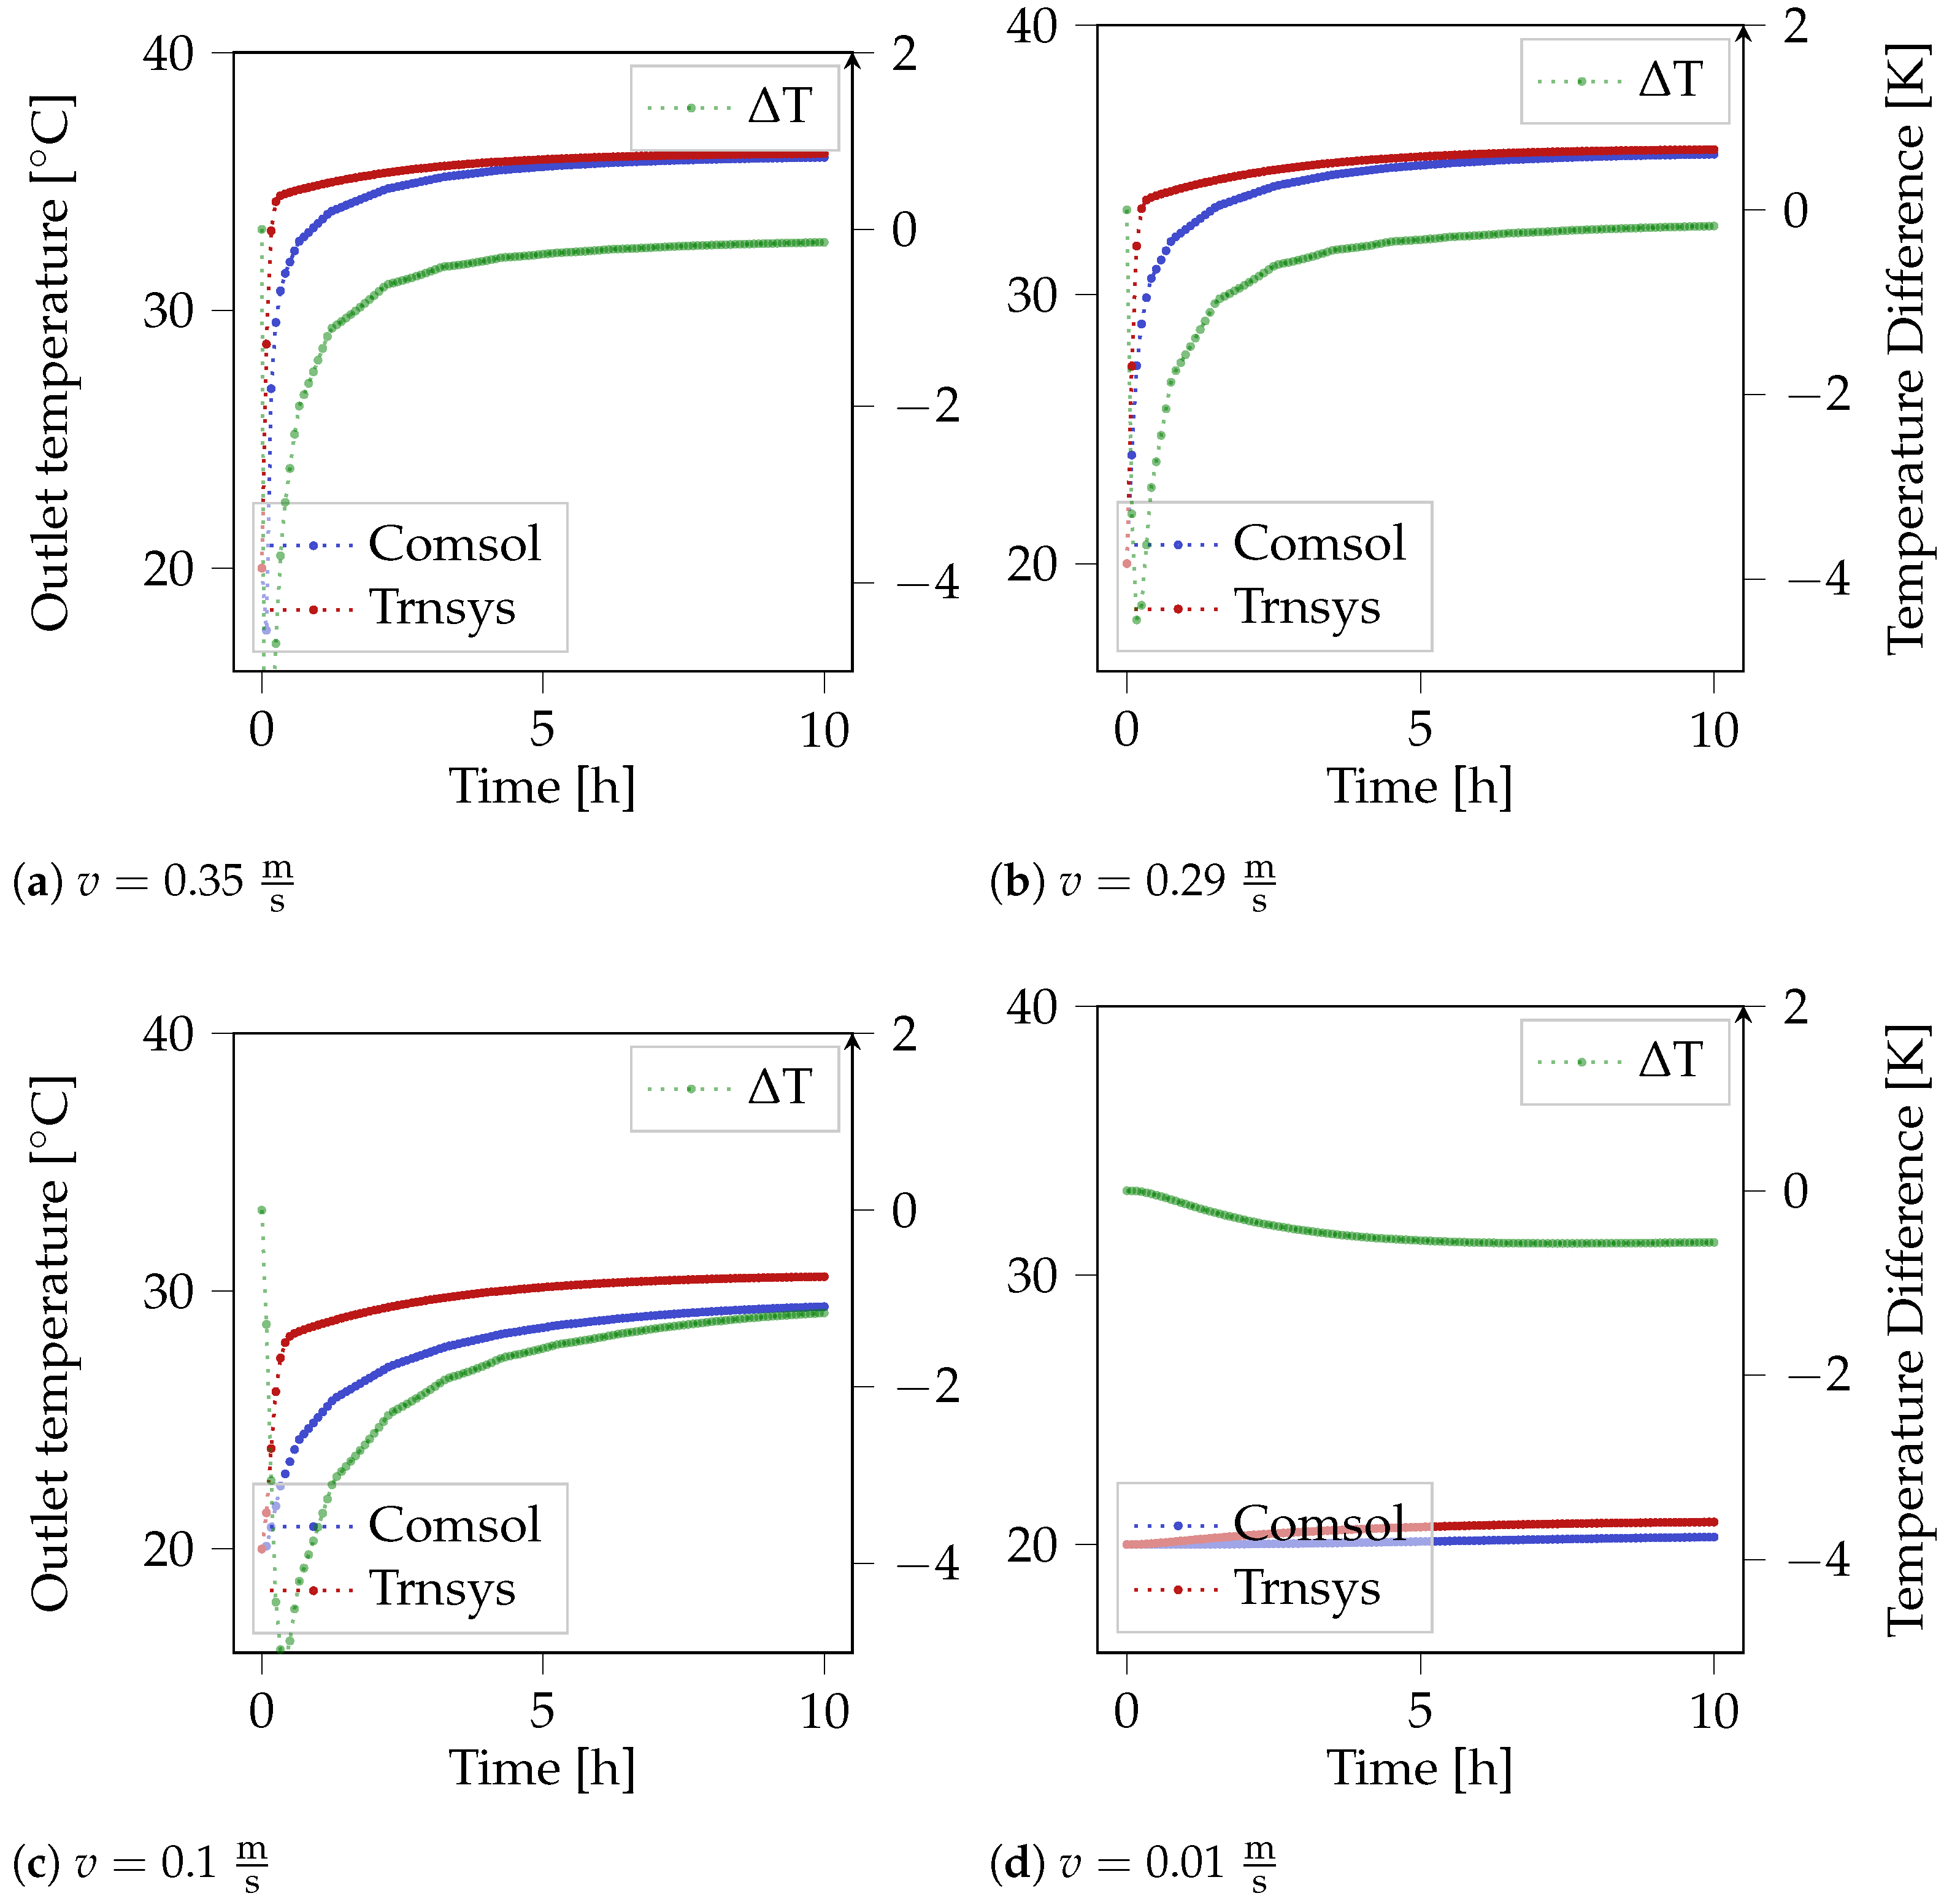
The outlet temperatures of the TRNSYS and the COMSOL® models for the heating case are shown in Figure 4 for room 1 at a pipe distance of 35 cm. The results for the other two geometries can be found in Appendix A (Figure A3 for room 1, pipe distance 10 cm and Figure A4 for room 2). In Table 3, the time during which the temperature difference exceeds 0.5, 1 and 2 K, respectively, is displayed for room 1, pipe distance 35 cm. The results for the other geometries can be found in Table A1.
Similarly to the cooling case, the main deviation occurs in the first 15 min, where TRNSYS reaches the final outlet temperature about 3 to 6 min earlier than COMSOL®. As the change in outlet temperature is high during the first hour, a direct comparison of the two outlet temperatures at one point in time shows a large temperature difference of up to 6 K. However, the same temperature is reached by COMSOL® only minutes later, with the exception of an inlet velocity of 0.1 m s in room 1 at a pipe distance of 35 cm (see Figure 4c), where the deviation is higher in the first few hours. Once more, TRNSYS seems to underestimate the transferred heat. In most cases, the temperature difference converges below 1 K.
In the heating case, the larger difference between the inlet and room temperature leads to higher absolute deviations. Only in 4 of 12 scenarios, a difference of 2 K is never exceeded. In 9 of 12 scenarios, 1 K is exceeded between 0 and 130 min and 2 K between 0 and 50 min. In the remaining three scenarios, 1 K is exceeded between 310 min and the whole simulation time of 10 h and 2 K between 0 and 175 min. At a small inlet velocity (0.01 m s ), the deviation is always lower than 2 K but exceeds 0.5 K in the majority of the simulation time. At high inlet velocities, the deviations are lowest in room 2 and highest in room 1 with a 10 cm pipe distance.
In Table A1, the time during which the temperature difference exceeds 0.5, 1 and 2 K, respectively, for the different heating and cooling scenarios is displayed. For the cooling case in room 1, pipe distance 35 cm, especially very high and very low inlet velocities lead to very low deviations. In room 2, low to medium inlet velocities lead to a slightly higher deviation. For the heating case in room 1, pipe distance 10 cm, a low inlet velocity leads to a high deviation. In room 2, high inlet velocities lead to a slightly lower deviation.

3.2. TRNSYS Model Simplification

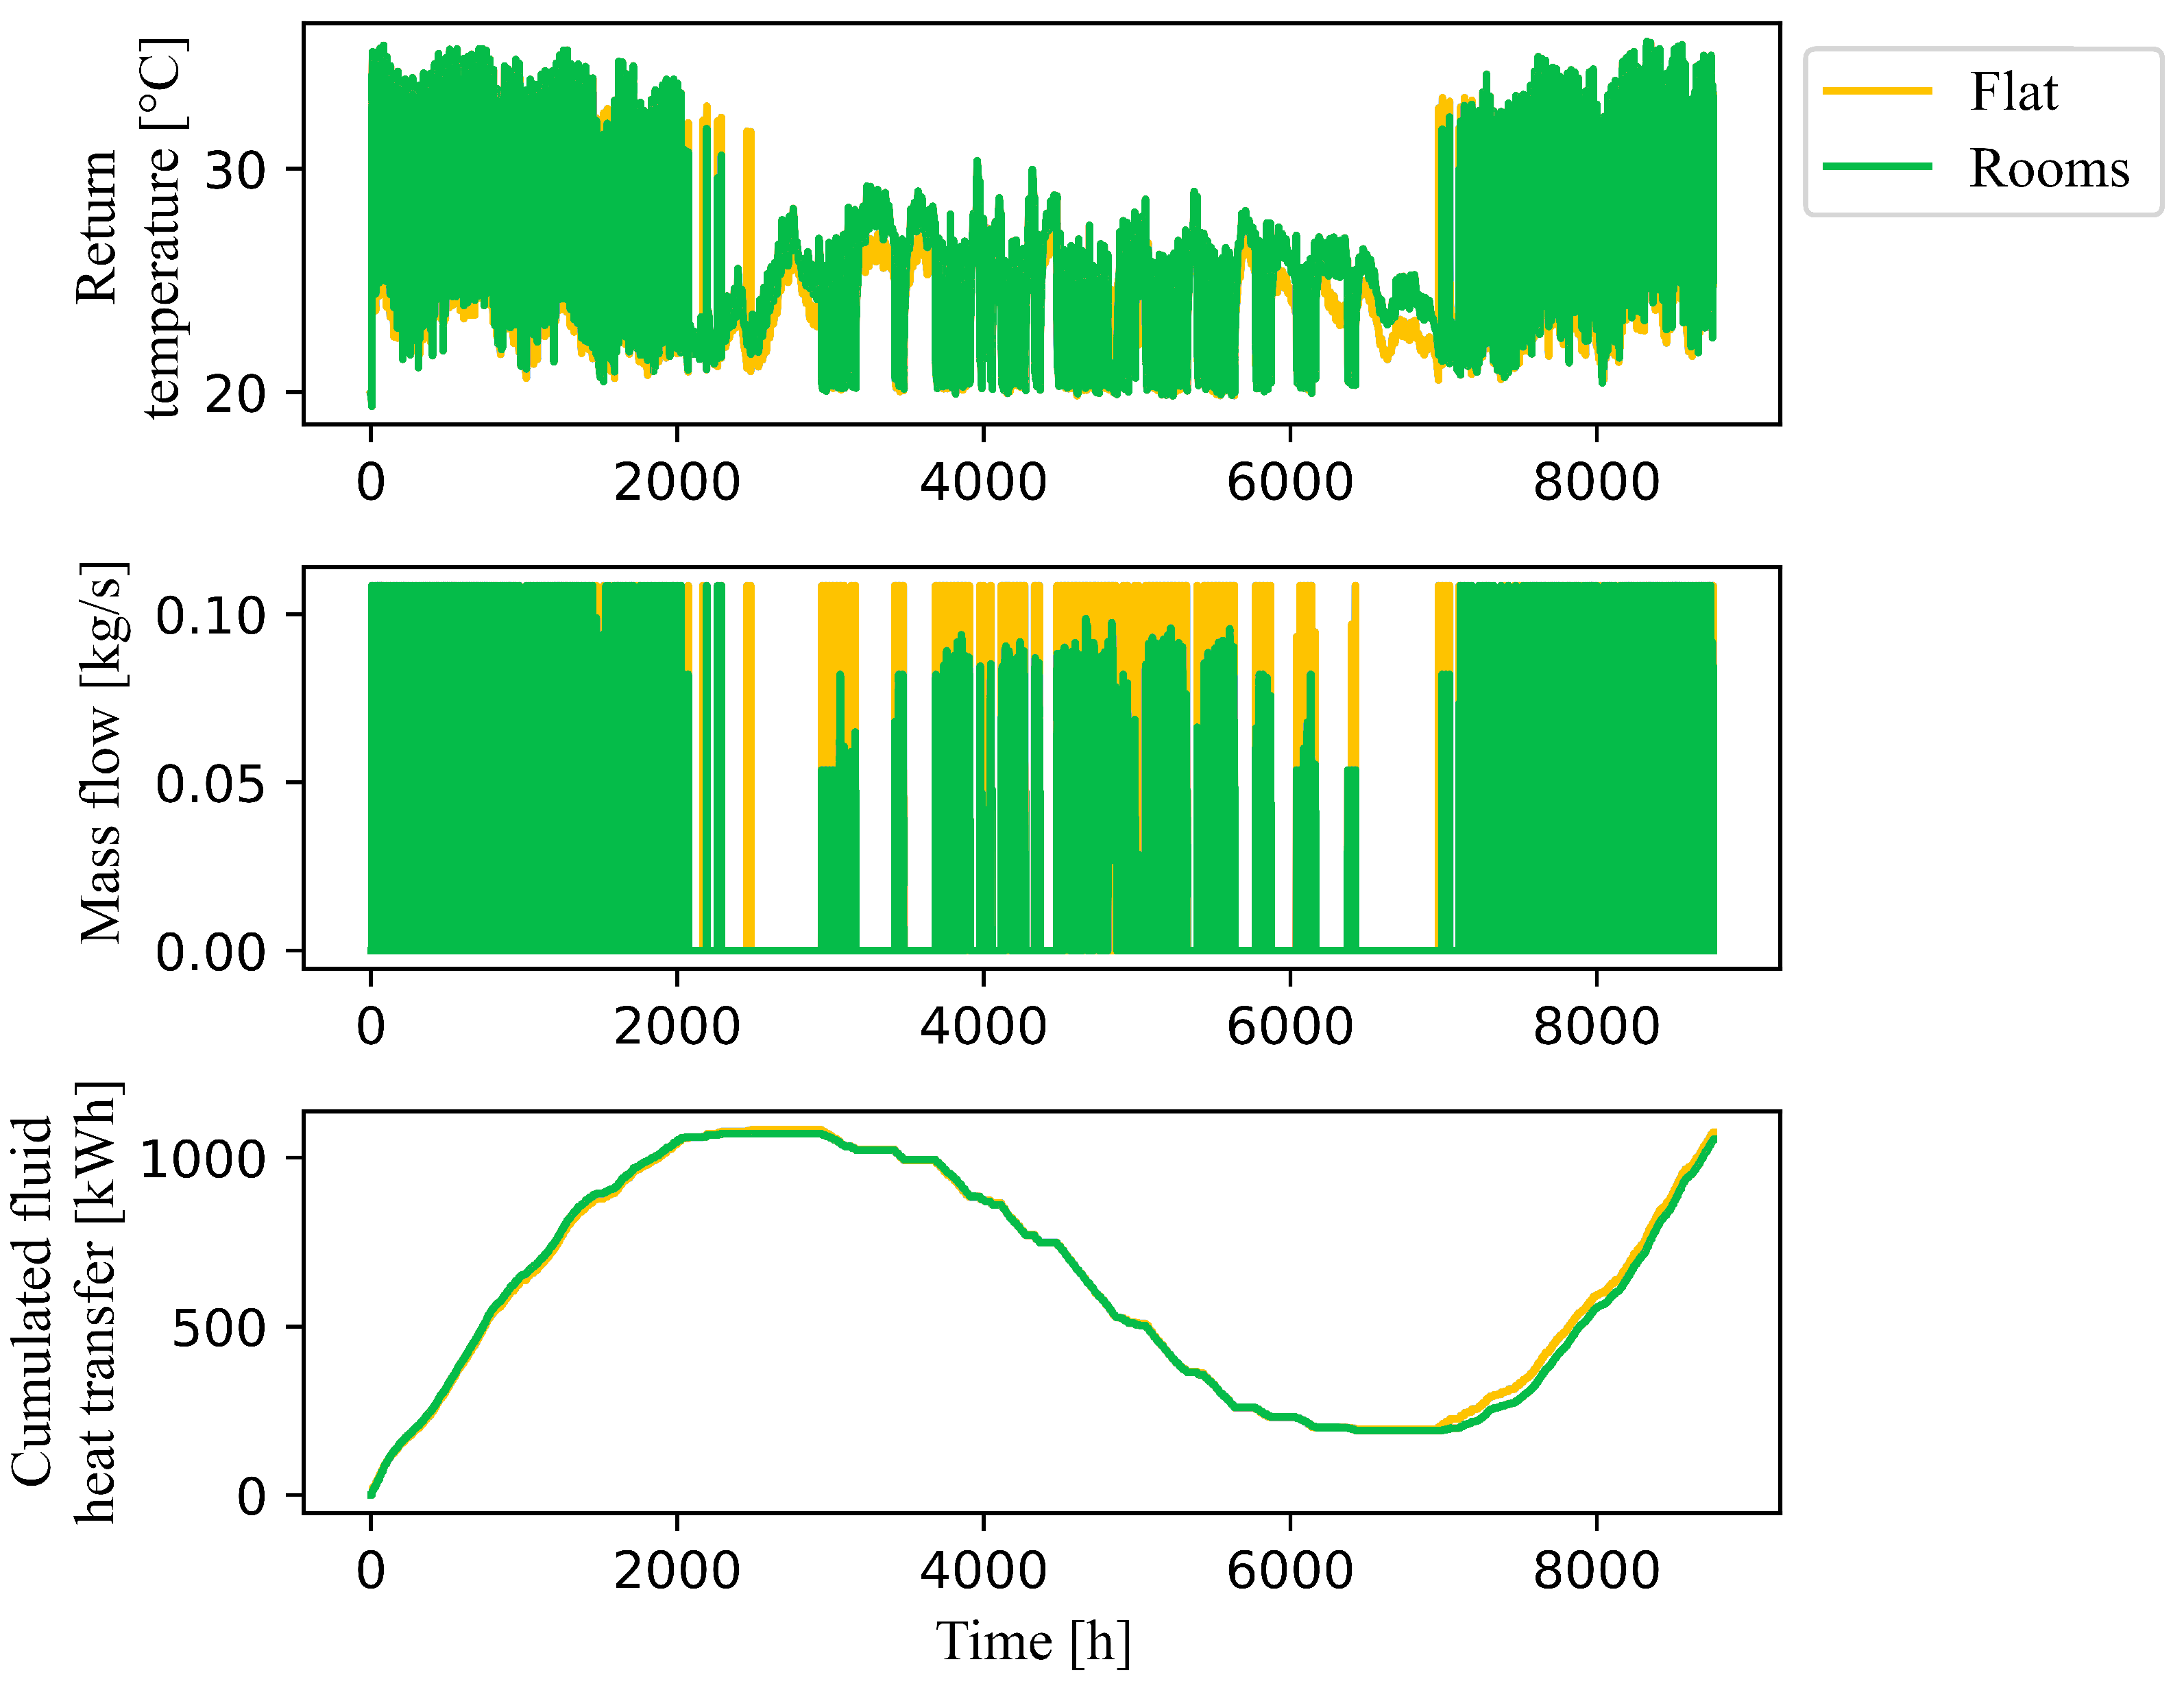
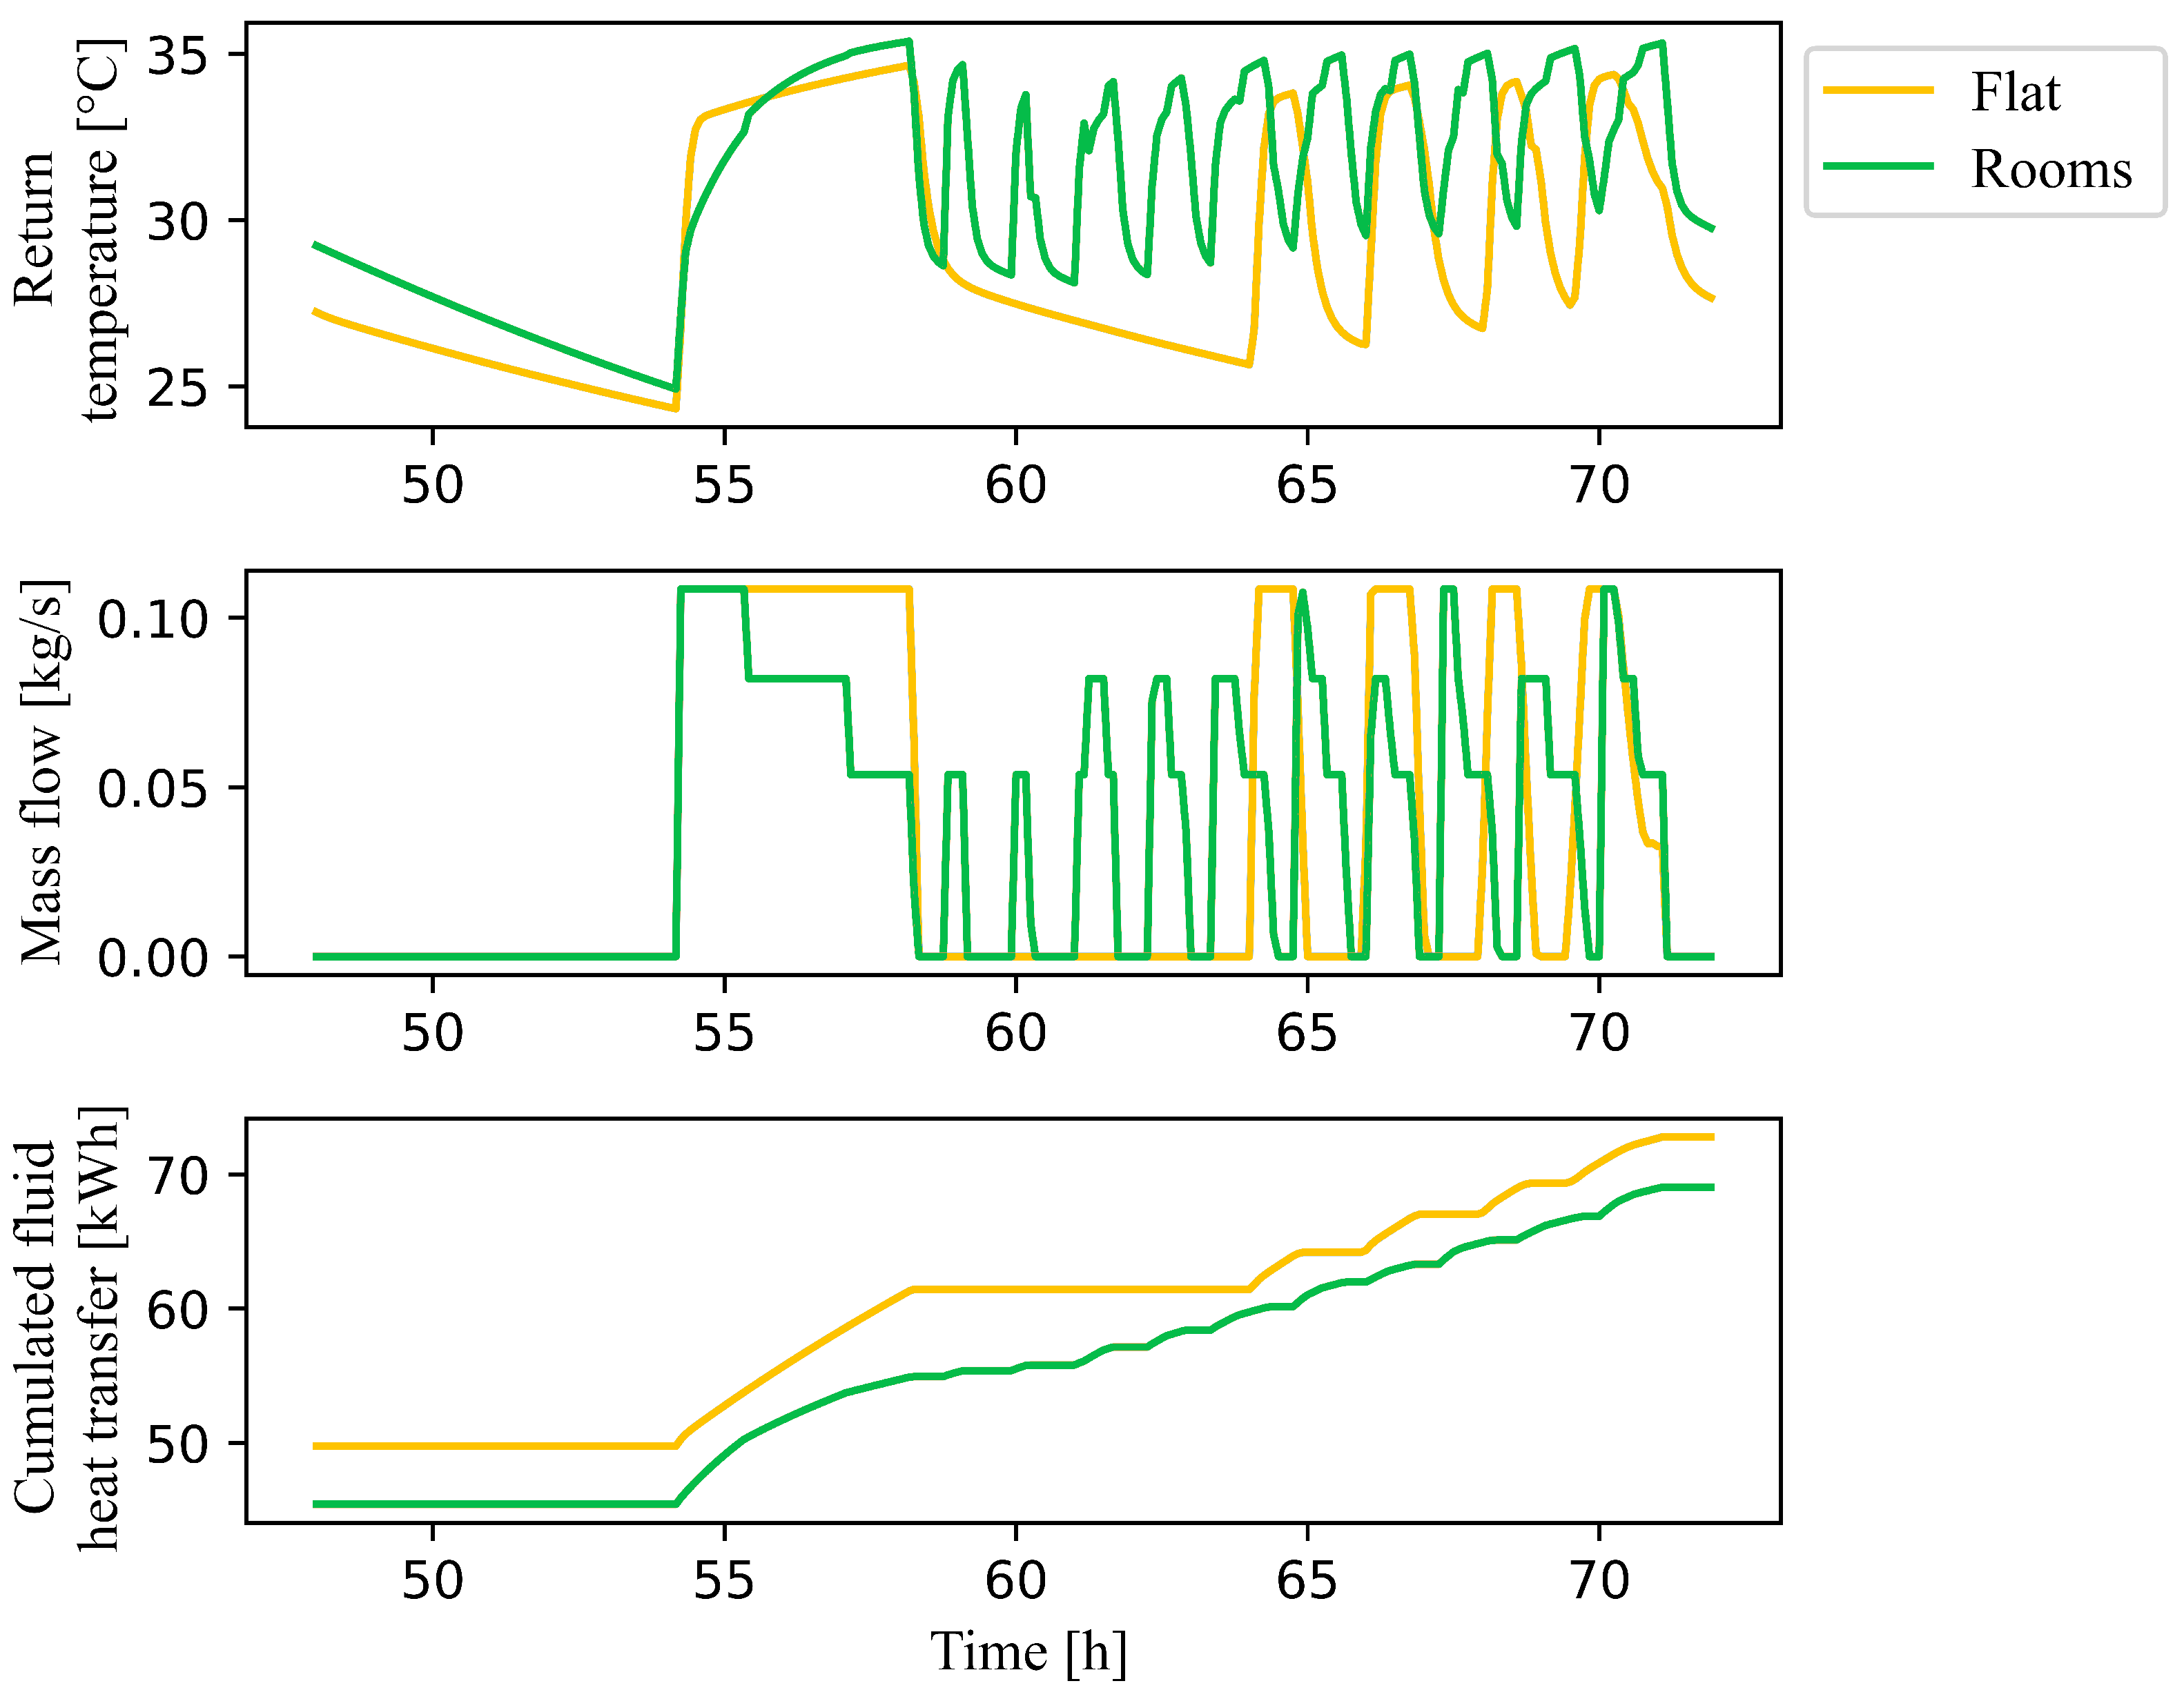
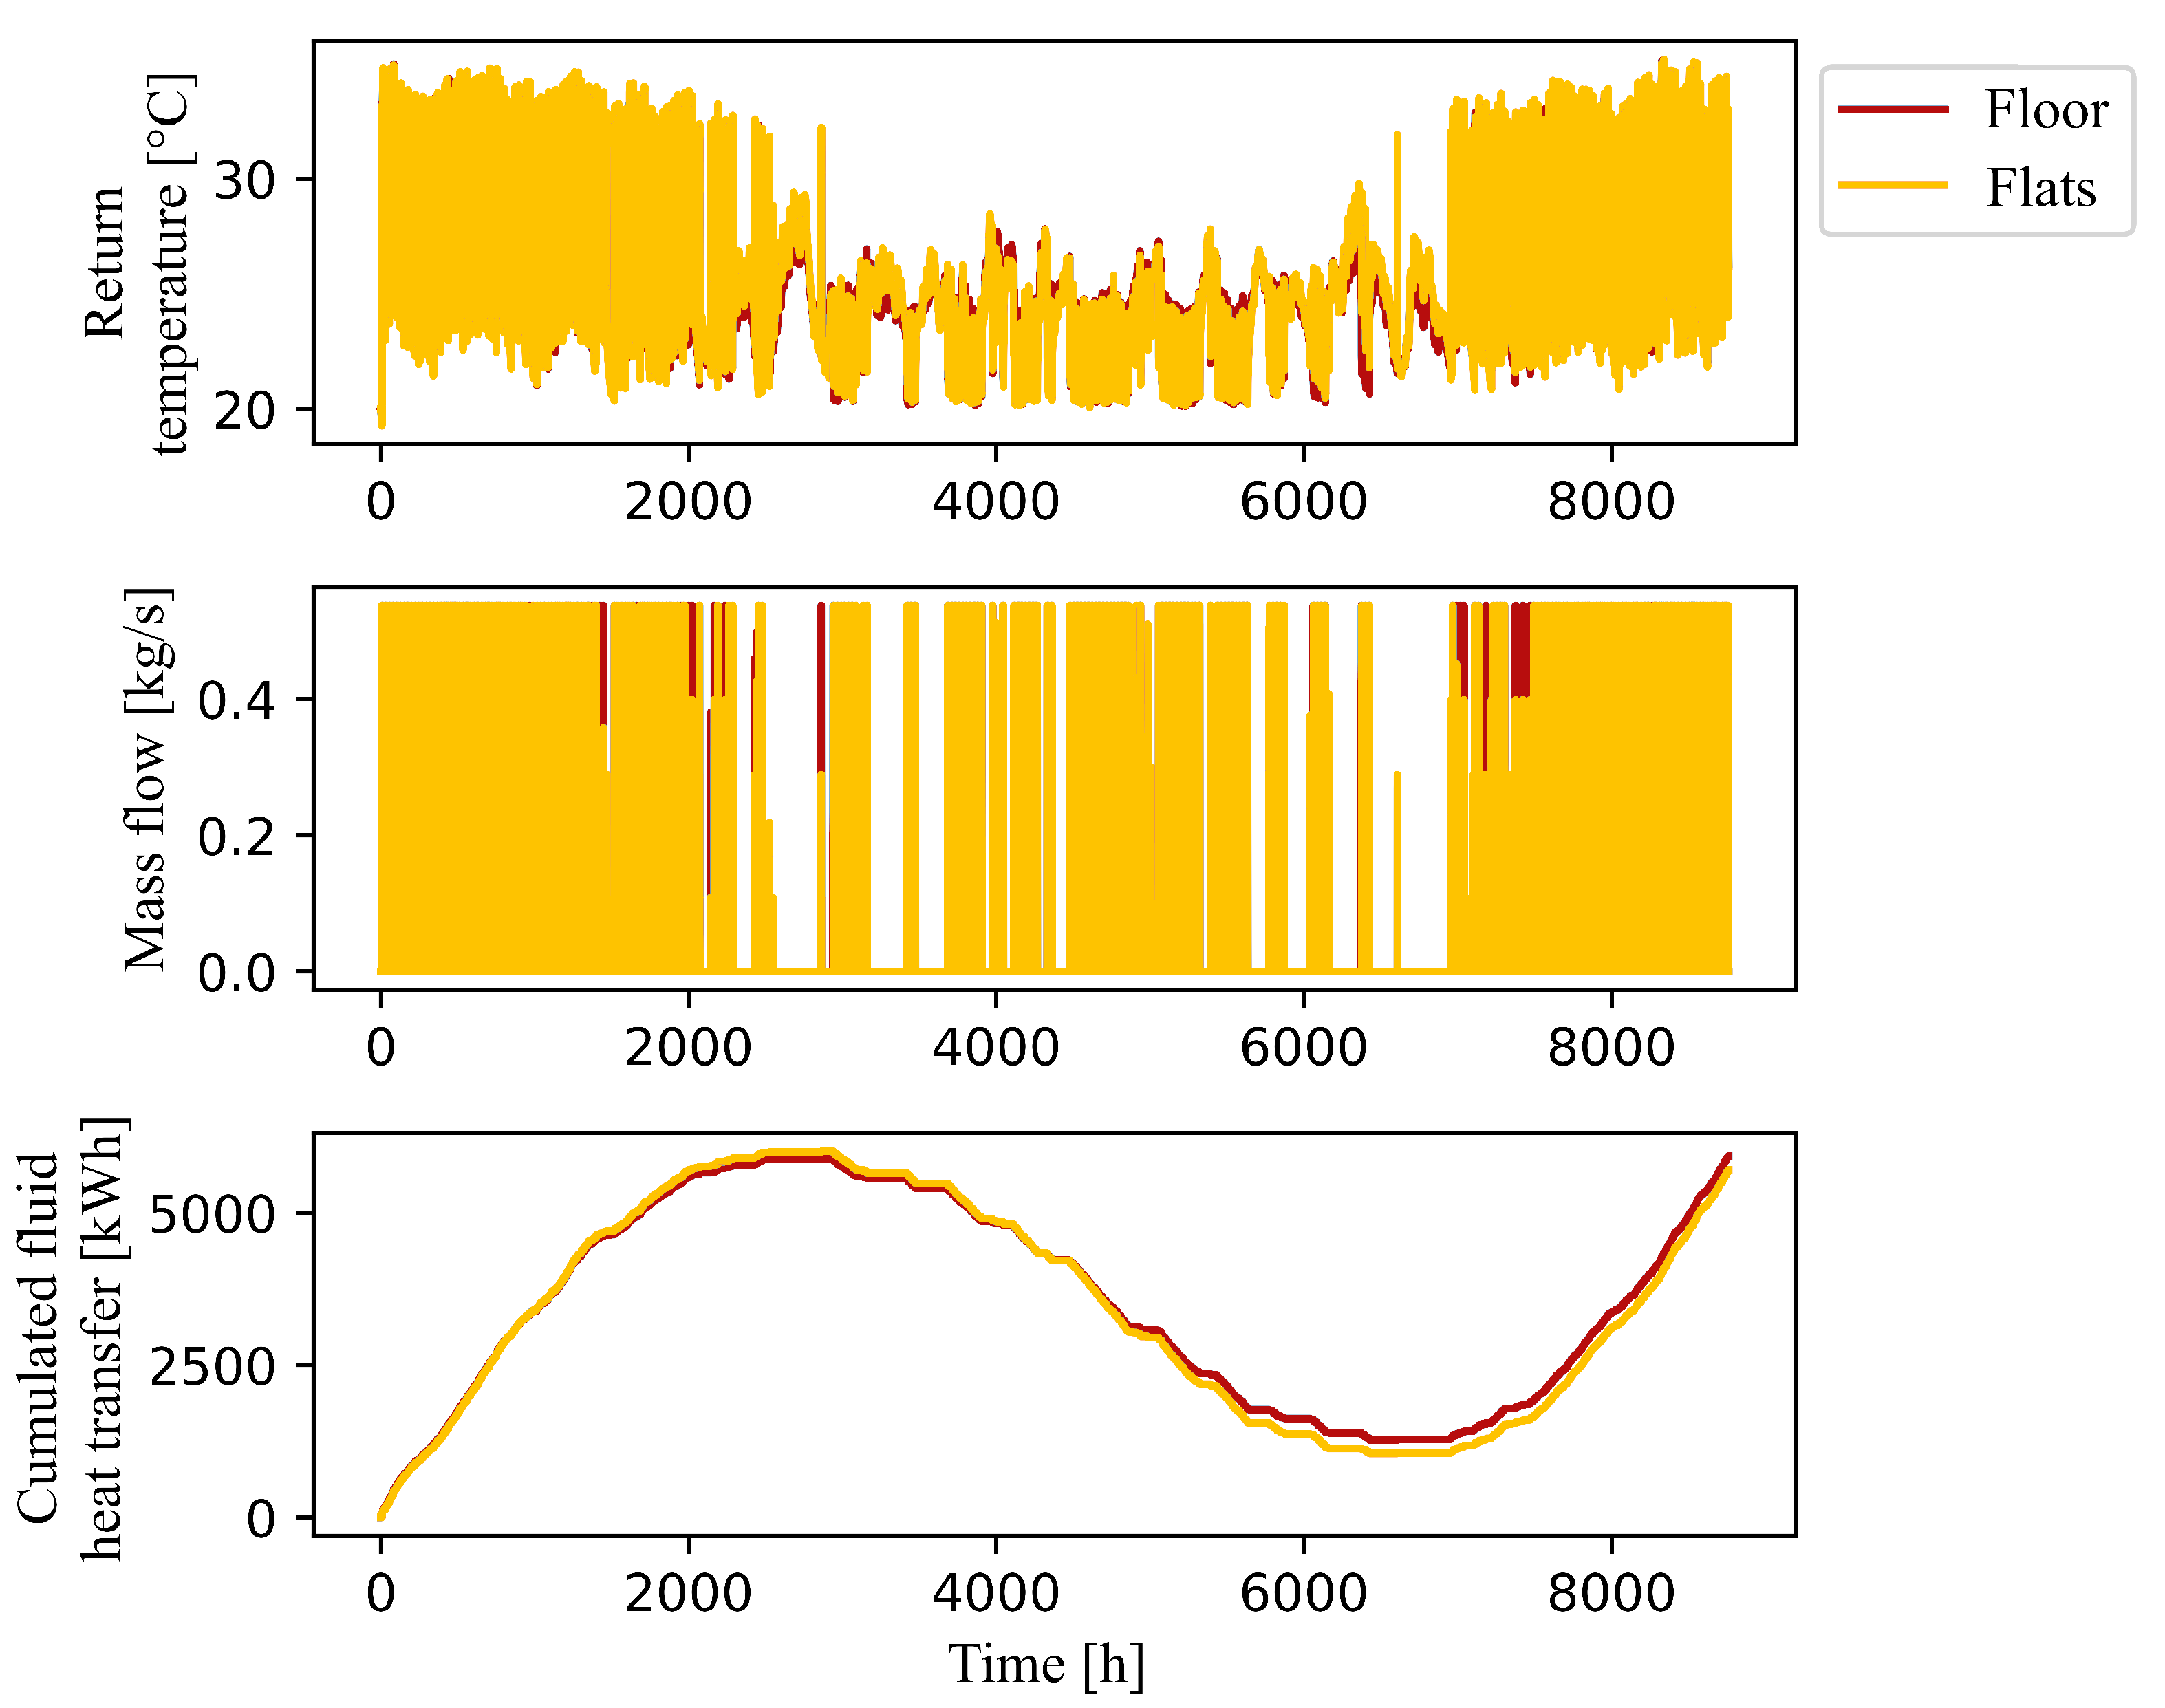
To summarize the heating circuits of a flat, the number of parallel circuits in the simplified model is selected so that the set room temperature is reached. In this case, two parallel circuits are used. The summary leads to reduced oscillation between on and off in the PID controller, as the parallel circuits are controlled at the same time. In Figure 5, a comparison between the return temperature, mass flow rate and accumulated emitted heat by the fluid for the single rooms and the simplified model of the whole flat over one year is shown. The overall heat transfer differs by approximately 5% using the same gain constant of the PID controller for cooling and approximately 2% with a slightly adjusted gain constant. Within one day, the deviation can be higher. In the exemplary day shown in Figure 6, the heating is turned on approximately twice as often in the detailed model and the return temperature differs by up to 1 K. The accumulated transferred heat differs by 5% at the end of the day.
In order to summarize the individual flats of a floor to one thermal zone, the number of parallel circuits is chosen once more so that the set temperatures are reached; in this case, two parallel circuits are used. The simplification leads to a deviation in the transferred heat of about 4% over one year in the considered case (see Figure 7). Again, the deviation in shorter time ranges may be higher. In Figure 8, the results for one exemplary day are shown. The deviation in accumulated transferred heat amounts to approximately 10% at the end of the day.

4. Discussion

In the following, the results obtained in Section 3 are discussed. Section 4.1 addresses the HX effectiveness approach while Section 4.2 addresses the TRNSYS model simplification. A general outlook is given in Section 4.3.

4.1. HX Effectiveness

The HX effectiveness approach appears to be highly appropriate for steady state applications, where there is a balance between the heat exchange taking place between the fluid and screed, and the heat exchange between the screed and its surroundings, as would occur after a certain period of operation. In transient applications, it seems more suitable for high inlet velocities, especially when the pipe distance is small. However, the actual deviation depends on the HX design. This is due to the following two points: firstly, Type 653 assumes an instantly homogeneous temperature distribution in the screed. Secondly, the presented approach to calculating the effectiveness is based on the assumption that the capacitance of the screed is much larger than the capacitance of the fluid. The effect can be observed, e.g., in Figure A1d and Figure 3d. At a pipe distance of 35 cm, the fluid nearly takes the room temperature in both approaches. In comparison, at a pipe distance of 10 cm, the heat transfer decreases in COMSOL® as the mutual influence of the neighboring pipes is taken into account, while, in TRNSYS, the heat transfer does not decrease noticeably. Low flow velocities seem to generate better results at a pipe distance of 35 cm than at 10 cm, as well in heating as in cooling mode, while there is a tendency for the opposite behavior for medium inlet velocities.
In both heating and cooling mode, the configuration with a large pipe distance (35 cm) and low inlet velocity (0.01 m s ) leads to low deviations, never exceeding a temperature difference of 1 K between both model’s results. This matches the nature of the modelling approach, assuming that the capacitance of the slab is much higher than the capacitance of the fluid (see Section 2.1). The same pipe distance at a high inlet velocity (0.35 m s ) leads to very low deviations in cooling mode and to moderate deviations in heating mode, exceeding 2 K for 35 min and 1 K for 90 min. Medium inlet velocities and small pipe distances tend to lead to higher deviations. However, the results do not allow for definite generalization.

4.2. TRNSYS Model Simplification

The approach of summarizing heating circuits using TRNSYS Type 653 leads to an overall deviation in exchanged heat of 2% over one year for simplification from single rooms to a whole flat and of 4% for simplification from single flats to a whole floor in the analyzed case. The fact that, using Type 653, a low number of heating circuits is required to fulfill the room temperature requirements is unexpected and should be analyzed in future works. The decrease in the accuracy of the results is difficult to quantify in general, due to the various influencing factors. However, in the case of modelling a residential district, simplifications are unavoidable, due to restricted computing power and time budgets. The approach is to be applied in studies where small districts are analyzed and the simplified modelling of the floor HX still offers added value compared to using load profiles. It might be reasonable to verify the results with detailed partial models. For detailed analyses, the proposed simplifications should not be used; instead, detailed models of the floor heat exchangers should be set up.

4.3. Outlook

The results of this study have not been validated with measured data yet. Whether the presented approaches are suitable to analyze, e.g., passive cooling by a BHE field in a small residential district will be further analyzed in future works. Additionally, further research could include other building configurations as well as optimized control strategies. In this study, only the HX geometry and inlet velocity were varied in a heating and a cooling case. Other relevant parameters are the inlet temperature of the fluid and the heat capacity of the screed and the fluid. These were not included because the influence of the geometry and inlet velocity was considered to be more important in the context of typical installation situations. Nevertheless, variations in these parameters should be considered in future works.

Author Contributions

Conceptualization, X.K. and J.R.; methodology, X.K. and R.Z.; software, X.K.; validation, X.K. and J.R.; formal analysis, X.K.; investigation, X.K.; resources, N.B. and M.S.; data curation, X.K.; writing—original draft preparation, X.K.; writing—review and editing, J.R., R.Z., N.B., M.S. and X.K.; visualization, X.K. and J.R.; supervision, N.B. and M.S.; project administration, N.B. and M.S.; funding acquisition, N.B. and M.S. All authors have read and agreed to the published version of the manuscript.

Funding

The authors gratefully acknowledge the financial support of the project Living Lab: DELTA (grant agreement No. 03EWR002A), which is funded by the Federal Ministry for Economic Affairs and Climate Action (BMWK) and managed by the management agency Project Management Jülich (PTJ).

Data Availability Statement

Not applicable.

Acknowledgments

The authors would like to thank Bernadette Lang-Eurisch for her sketch and Anja Schaffarczyk for her support.

Conflicts of Interest

The authors declare no conflict of interest. The funders had no role in the design of the study; in the collection, analyses, or interpretation of data; in the writing of the manuscript; or in the decision to publish the results.

Abbreviations

The following abbreviations are used in this manuscript:
HXHeat exchanger
BHEBorehole heat exchanger
NTUNumber of transfer units

Appendix A

Figure A1. Fluid outlet temperatures calculated in Trnsys and COMSOL® as well as their difference at varying inlet velocities for room 1, d = 35 cm, inlet temperature 18 C , room temperature 26 C .
Energies 16 05850 g0a1
Figure A2. Fluid outlet temperatures calculated in Trnsys and COMSOL® as well as their difference at varying inlet velocities for room 2, d = 10 cm, inlet temperature 18 C , room temperature 26 C .
Energies 16 05850 g0a2aEnergies 16 05850 g0a2b
Figure A3. Fluid outlet temperatures calculated in Trnsys and COMSOL® as well as their difference at varying inlet velocities for room 1, pipe distance 10 cm, inlet temperature 40 C , room temperature 20 C .
Energies 16 05850 g0a3
Figure A4. Fluid outlet temperatures calculated in Trnsys and COMSOL® as well as their difference at varying inlet velocities for room 2, pipe distance 10 cm, inlet temperature 40 C , room temperature 20 C .
Energies 16 05850 g0a4
Table A1. Duration during which the temperature difference between the TRNSYS and the COMSOL® solutions exceeds the threshold Δ T t h r e s h of 2, 1 and 0.5 K.
Δ T thresh v = 0.35 m s v = 0.29 m s v = 0.1 m s v = 0.01 m s
Room 1, pipe distance 35 cm, inlet temperature  18 C , room temperature 26  C
2 K 0 min 0 min 0 min 0 min
1 K 0 min 10 min 30 min 0 min
0.5 K 5 min 20 min 65 min 0 min
Room 2, pipe distance 10 cm, inlet temperature 18  C , room temperature 26  C
2 K 0 min 0 min 0 min 0 min
1 K 0 min 0 min 35 min 0 min
0.5 K 5 min 0 min 105 min 70 min
Room 1, pipe distance 10 cm, inlet temperature 40  C , room temperature 20  C
2 K 40 min 40 min 0 min 0 min
1 K 100 min 115 min 50 min 470 min
0.5 K 170 min 180 min 200 min 535 min
Room 2, pipe distance 10 cm, inlet temperature 40  C , room temperature 20  C
2 K 15 min 20 min 50 min 0 min
1 K 35 min 40 min 130 min 310 min
0.5 K 70 min 75 min 215 min 480 min

References

  1. Bundesministerium für Wirtschaftliche Zusammenarbeit und Entwicklung. Klimaabkommen von Paris. Available online: https://www.bmz.de/de/service/lexikon/klimaabkommen-von-paris-14602 (accessed on 10 July 2023).
  2. Die Bundesregierung Informiert|Startseite. Klimaschutzgesetz: Klimaneutralität bis 2045|Bundesregierung. Available online: https://www.bundesregierung.de/breg-de/schwerpunkte/klimaschutz/klimaschutzgesetz-2021-1913672 (accessed on 10 July 2023).
  3. Simon, B.; Jonas, H.; Rico, K. Dena-Gebäudereport 2022: Zahlen, Daten, Fakten; Deutsche Energie-Agentur GmbH (dena): Berlin, Germany, 2021. [Google Scholar]
  4. Nejat, P.; Jomehzadeh, F.; Taheri, M.M.; Gohari, M.; Abd Majid, M.Z. A global review of energy consumption, CO2 emissions and policy in the residential sector (with an overview of the top ten CO2 emitting countries). Renew. Sustain. Energy Rev. 2015, 43, 843–862. [Google Scholar] [CrossRef]
  5. Werner, S. International review of district heating and cooling. Energy 2017, 137, 617–631. [Google Scholar] [CrossRef]
  6. Hansen, C.H.; Gudmundsson, O.; Detlefsen, N. Cost efficiency of district heating for low energy buildings of the future. Energy 2019, 177, 77–86. [Google Scholar] [CrossRef]
  7. Brand, M.; Svendsen, S. Renewable-based low-temperature district heating for existing buildings in various stages of refurbishment. Energy 2013, 62, 311–319. [Google Scholar] [CrossRef]
  8. Jochum, M.; Murugesan, G.; Kissock, K.; Hallinan, K. Low Exergy Heating and Cooling in Residential Buildings. In Proceedings of the Asme 5th International Conference on Energy Sustainability 2011, Washington, DC, USA, 7–10 August 2011; pp. 2007–2013. [Google Scholar]
  9. Formhals, J.; Feike, F.; Hemmatabady, H.; Welsch, B.; Sass, I. Strategies for a transition towards a solar district heating grid with integrated seasonal geothermal energy storage. Energy 2021, 228, 120662. [Google Scholar] [CrossRef]
  10. Carpaneto, E.; Lazzeroni, P.; Repetto, M. Optimal integration of solar energy in a district heating network. Renew. Energy 2015, 75, 714–721. [Google Scholar] [CrossRef]
  11. Tabares-Velasco, P. Time Step Considerations When Simulating Dynamic Behavior of High-Performance Homes. In Proceedings of the Thermal Performance of the Exterior Envelopes of Whole Buildings XII International Conference, Clearwater, FL, USA, 1–5 December 2013. Available online: https://web.ornl.gov/sci/buildings/conf-archive/2013%20B12%20papers/149_Velasco.pdf (accessed on 23 March 2023).
  12. Arteconi, A.; Polonara, F. Assessing the Demand Side Management Potential and the Energy Flexibility of Heat Pumps in Buildings. Energies 2018, 11, 1846. [Google Scholar] [CrossRef] [Green Version]
  13. Saelens, D.; Parys, W.; Baetens, R. Energy and comfort performance of thermally activated building systems including occupant behavior. Build. Environ. 2011, 46, 835–848. [Google Scholar] [CrossRef]
  14. Brideau, S.A.; Beausoleil-Morrison, I.; Kummert, M.; Wills, A. Inter-model comparison of embedded-tube radiant floor models in BPS tools. J. Build. Perform. Simul. 2016, 9, 190–209. [Google Scholar] [CrossRef]
  15. Göbel, S.; Schmitt, E.; Mehrfeld, P.; Müller, D. Underfloor heating system model for building performance simulations. In Proceedings of the 14th Modelica Conference 2021, Linköping, Sweden, 20–24 September 2021; pp. 343–349. [Google Scholar] [CrossRef]
  16. Miroshnichenko, I.V.; Sheremet, M.A.; Chen, Y.B.; Chang, J.Y. Automation of the heated floor system in a room under the influence of ambient conditions. Appl. Therm. Eng. 2021, 196, 117298. [Google Scholar] [CrossRef]
  17. Rey, A.; Dumoulin, R.; Athienitis, A. Comparison of Three Transient Models for Slab Heating/Cooling Systems. In International High Performance Buildings Conference; Ray W. Herrick Laboratories: West Lafayette, IN, USA, 2018. [Google Scholar]
  18. Thornton, J.; Bradley, D.; McDowell, T.; Blair, N.; Duffy, M.; LaHam, N.; Naik, A. TESSLibs 17 Ground Coupling Library Mathematical Reference; Thermal Energy System Specialists, LLC.: Madison, WI, USA, 2012. [Google Scholar]
  19. Danielewicz, J.; Fidorow, N.; Szulgowska-Zgrzywa, M. A ground source heat pump with the heat exchanger regeneration-simulation of the system performance in a single family house. In Environmental Engineering IV: Proceedings of the Conference on Environmental; Pawlowski, A., Dudzinska, M.R., Pawlowski, L., Eds.; CRC Press-Taylor & Francis Group: Boca Raton, FL, USA, 2013; pp. 357–367. [Google Scholar]
  20. Dott, R.; Wemhoener, C.; Afjei, T. Hydraulics, performance and comfort of ground coupled heating-cooling systems. In Building Simulation 2007; Jiang, Y., Zhu, Y.X., Yang, X.D., Li, X.T., Eds.; Tsinghua University Press: Beijing, China, 2007; Volume 1–3, pp. 657–664. [Google Scholar]
  21. Arghand, T.; Javed, S.; Trüschel, A.; Dalenbäck, J.O. Influence of system operation on the design and performance of a direct ground-coupled cooling system. Energy Build. 2021, 234, 110709. [Google Scholar] [CrossRef]
  22. Bernier, N.; Marcotte, B.; Kummert, M. Calling Python from TRNSYS with CFFI. Polytech. Montréal 2022. [Google Scholar] [CrossRef]
  23. Klein, S.A.; Beckman, W.A.; Mitchell, J.W.; Duffie, J.A.; Duffie, N.A.; Freeman, T.L.; Mitchell, J.C. TRNSYS 18: A Transient System Simulation Program, Solar Energy Laboratory; University of Wisconsin: Madison, WI, USA, 2017. [Google Scholar]
  24. Neymark, J.; Judkoff, R.; Kummert, M.; Muehleisen, R.; Johannsen, A.; Kruis, N.; Glazer, J.; Henninger, R.; Witte, M.; Ono, E.; et al. Update of ASHRAE Standard 140 Section 5.2 and Related Sections (BESTEST Building Thermal Fabric Test Cases); Technical Report; Argonne National Lab (ANL): Argonne, IL, USA, 2020. [CrossRef]
  25. Lienhard, J.H., IV; Lienhard, J.H., V. A Heat Transfer Textbook; Phlogiston Press: Houston, TX, USA, 2005. [Google Scholar]
  26. Gnielinski, V.; Kabelac, S.; Kind, M.; Martin, H.; Mewes, D.; Schaber, K.; Stephan, P. VDI-Wärmeatlas; VDI e.V.: Düsseldorf, Germany, 2013; Volume 11. [Google Scholar]
  27. Li, A.; Sun, Y.; Xu, X. Development of a simplified resistance and capacitance (RC)-network model for pipe-embedded concrete radiant floors. Energy Build. 2017, 150, 353–375. [Google Scholar] [CrossRef]
  28. COMSOL AB. COMSOL Quality Policy. 2022. Available online: https://www.comsol.com/legal/quality-policy (accessed on 23 March 2023).
  29. Pipe Flow Module User’s Guide, COMSOL Multiphysics® v. 6.1; COMSOL AB: Stockholm, Sweden, 2022.
  30. Bewersdorff, D. HYGGiency: Raumhygiene und Behaglichkeit Durch Energetische Sanierung im Quartier = HYGGiency—Room Hygiene and Comfort through Energetic Refurbishment in District; Mechanik, Werkstoffe und Konstruktion im Bauwesen; Springer: Wiesbaden, Germany, 2021; Volume Band 61. [Google Scholar]
Figure 1. Geometries of the reference models.
Energies 16 05850 g001
Figure 2. Summary of the heating circuits of one flat and one floor, respectively.
Energies 16 05850 g002
Figure 3. Fluid outlet temperatures calculated in Trnsys and COMSOL® as well as their difference at varying inlet velocities for room 1, d = 10 cm, inlet temperature 18 C , room temperature 26 C .
Energies 16 05850 g003
Figure 4. Fluid outlet temperatures calculated in Trnsys and COMSOL® as well as their difference at varying inlet velocities for room 1, d = 35 cm, inlet temperature 40 C , room temperature 20 C .
Energies 16 05850 g004
Figure 5. Simplification results from single rooms (detailed) to whole flat (simplified) over one year.
Energies 16 05850 g005
Figure 6. Simplification results from single rooms (detailed) to whole flat (simplified) over one day.
Energies 16 05850 g006
Figure 7. Simplification results from flats (detailed) to whole floor (simplified) over one year.
Energies 16 05850 g007
Figure 8. Simplification results from flats (detailed) to whole floor (simplified) over one day.
Energies 16 05850 g008
Table 1. Conditions of different use cases.
CaseInlet Temperature [ C ] Room Temperature [ C ]
Cooling1826
Heating4020
Table 2. Duration during which the temperature difference exceeds the threshold Δ T t h r e s h of 2, 1 and 0.5 K in room 1, pipe distance 10 cm, inlet temperature 18 C , room temperature 26 C .
Δ T thresh v = 0.35 m s v = 0.29 m s v = 0.1 m s v = 0.01 m s
2 K 0 min 0 min 0 min 0 min
1 K 20 min 20 min 0 min 0 min
0.5 K 60 min 65 min 0 min 425 min
Table 3. Duration during which the temperature difference exceeds the threshold Δ T t h r e s h of 2, 1 and 0.5 K in room 1, pipe distance 35 cm, inlet temperature 40 C , room temperature 20 C .
Δ T thresh v = 0.35 m s v = 0.29 m s v = 0.1 m s v = 0.01 m s
2 K 35 min 40 min 175 min 0 min
1 K 90 min 90 min 600 min 0 min
0.5 K 170 min 190 min 600 min 365 min
Disclaimer/Publisher’s Note: The statements, opinions and data contained in all publications are solely those of the individual author(s) and contributor(s) and not of MDPI and/or the editor(s). MDPI and/or the editor(s) disclaim responsibility for any injury to people or property resulting from any ideas, methods, instructions or products referred to in the content.