Article

Mechanism of Low-Frequency Oscillation When Electric Multiple Units Pass Neutral Zone, and Suppression Method

1
School of Electrical Engineering, Beijing Jiaotong University, No. 3 Shangyuancun in Haidian District, Beijing 100044, China
2
Shuohuang Railway Development Co., Ltd. of National Energy, Cangzhou 062350, China
3
Institute of Materials Science, University of Connecticut, Storrs, CT 06269, USA
*
Author to whom correspondence should be addressed.
Energies 2023, 16(15), 5848; https://doi.org/10.3390/en16155848
Submission received: 7 June 2023 / Revised: 19 July 2023 / Accepted: 4 August 2023 / Published: 7 August 2023
(This article belongs to the Section F: Electrical Engineering)

Abstract

:
This article addresses the problem of the contact voltage increase caused by the low-frequency oscillation of the train-grid system in the phase-separation process of EMUs. The article establishes the EMU-contact line-traction substation model, reveals the mechanism of low-frequency oscillation, and ascertains the relationship between the phase angle when the pantograph leaves the line, and low-frequency oscillations. Methods to suppress overvoltage during the low-frequency oscillation are proposed. The research indicated that a significant voltage amplitude was observed in the neutral zone, when the phase angle of the pantograph to the contact line separation power supply fell within the range of 60–90° and 240–270°. The maximum voltage amplitude reached 69.75 kV, and there was an occurrence of low-frequency oscillation in the neutral zone, where electrical phase separation takes place. During this oscillation, the voltage of the contact network in the neutral zone mainly operated at one-third of the power frequency (16.7 Hz). However, after installing an RC suppression device in the neutral zone, when low-frequency oscillation occurred, the absolute value of the peak voltage dropped below 37 kV as soon as the EMU entered electric phase separation. Furthermore, compared to situations without a connected suppression device, there was nearly a 30% reduction in the absolute value of the peak voltage. The study provides a basis for the design of the neutral zone of the contact line, and the selection of high-voltage equipment for the EMU.

1. Introduction

During the process of circuit structure switching, equipment such as voltage transformers, inductors, and vehicle networks contain electromagnetic energy within their ground capacitance when the EMU is in the phase-separation zone. This energy undergoes conversion between the inductive element and an equivalent capacitor, resulting in a low-frequency oscillation. The consequences of this phenomenon include the excessive excitation of the ferromagnetic components, and abnormal increases in the port voltage and network voltage within the neutral zone. The presence of electromagnetic energy poses a significant safety risk to EMUs and catenary phase-separation equipment.
To solve the problem of low-frequency oscillation and overvoltage suppression in the power-supply system, industry experts and scholars have carried out extensive and in-depth modeling studies and characteristic analyses [1,2,3,4,5], and proposed methods for low-frequency oscillation suppression [5,6,7,8,9,10]. As for the mechanism of low-frequency oscillation, Ruifeng Zhang and others have studied the power-side oscillation combined with the system impedance characteristics [11,12,13,14,15]. They proposed a method to adjust the power-supply control strategy to reduce the low-frequency oscillation amplitude and oscillation time. Regarding the problem of low-frequency oscillation caused by line-side faults, Lingling Fan et al. determined the influence of line-capacitance parameters on the ferromagnetic resonance in the system, and calculated the transient process. The influence of the selection of the inductance, capacitance and resistance parameters on the ferromagnetic resonance phenomenon was analyzed [15,16,17,18,19,20]. To address the problem of low-frequency oscillation suppression, Zha W and others combined the matching relationship between the impedance of the power-supply line of the traction power-supply system, and the impedance of the locomotive, and proposed a strategy to reduce the oscillation by adding active filtering on the power-control side [21,22,23,24,25]. The method focused on the analysis of the input impedance characteristics of electric locomotives. The stability direction of the system is determined according to the coupling relationship between the input impedance, and the impedance of the power-supply line [26,27,28,29,30]. Regarding the operating system, combining the characteristics of the system impedance, and low-frequency oscillation characteristics, a parallel RC device was proposed, to reduce the oscillation process [31,32,33,34,35]. The above research provides a reference for the analysis of the low-frequency oscillation process of the EMU passing through the neutral zone, and the formulation of suppression strategies in the traction power-supply system.
However, the distance of the neutral zone in the contact line is short (200 m). The EMU will experience the disconnecting of the traction motor load [35,36,37,38,39,40], entering the neutral zone and the intersection of the feeding section, and separating the pantograph from the line. This process is complicated; at the same time, the neutral zone has a short distance, and the distributed capacitance and the circuit resistance are small, so the oscillation process is complicated [40,41,42,43,44,45], as shown in Figure 1.
If there is a low-frequency oscillation in the vehicle line system when the EMU passes the neutral zone, the magnetic field of the excitation circuit of the voltage transformer and other equipment will increase, the terminal voltage will rise, and the high-voltage coil insulation of the equipment will be damaged. There will be greater limitations if we use the existing research conclusions. In response to this problem, this article combines the operating conditions of the existing lines to test the line-voltage characteristics and the oscillation process of the EMU during the neutral-zone process, establishes the EMU contact line-traction substation model, and reveals the low-frequency oscillation mechanism. The study obtains the relationship between the phase angle when the pantograph leaves the line, and the low-frequency oscillation; and low-frequency oscillation overvoltage suppression methods are proposed. The research provides a basis for the design of the contact line neutral zone, and the selection of high-voltage equipment for the EMU.

2. Low-Frequency Oscillation and Overvoltage Characteristics of the Contact Line

2.1. Test Method and Test Process

Field tests are conducted using a test system that comprises a voltage divider device, a current sensor, and data acquisition in response to low-frequency oscillation on-site. The data acquisition system can analyze 100 harmonics with a sampling frequency of 20 kHz. Continuous interval recording is used for storing data every 1000 ms, whereas transient processes are recorded by storing 100 ms of data each time. Table 1 displays the specific parameters utilized in designing the test system.
During the test, the voltage and current signals are respectively obtained on the secondary terminals of the on-board voltage transformer and the current transformer. When the train is running on the line, the voltage waveform obtained is shown in Figure 2. The line voltage when passing through the neutral zone (i.e., position A shown in Figure 1) is shown in Figure 2. At this position, there is an instantaneous drop in the line voltage, but a higher amplitude overvoltage appears at position “1” compared with other position.

2.2. Wave Characteristics and Laws

When the train passes through the electrical neutral zone, the voltage waveform should conform to Figure 3, as this area is classified as a no-power zone, due to its electrical isolation.
When the train disconnects from the power source at stage A, a brief electrical discharge may occur. The voltage is influenced by both induced voltages, and should typically remain below 5 kV, with a 50 Hz power frequency, in the neutral zone. However, if low-frequency oscillations are produced by the EMU in this area, abnormal increases in the voltage rising may be observed, like that shown in Figure 4, and there may also be noticeable low-frequency oscillations in the grid voltage waveform, due to the pantograph separation from the contact line, resulting in overvoltage of up to 52.0 kV. The primary type of oscillation occurring within this region is that of a low-frequency nature (one-third power frequency, or approximately 16.7 Hz).
The examination of the harmonic ratio reveals that the amplitude of the one-third power frequency harmonic generated is approximately three times greater than the induced voltage in the neutral zone, shown in Table 2. Consequently, when these voltages are combined, an overvoltage occurs, which poses a risk to the safety of the EMU.

3. Vehicle-Line Institute Model and Oscillation Characteristics

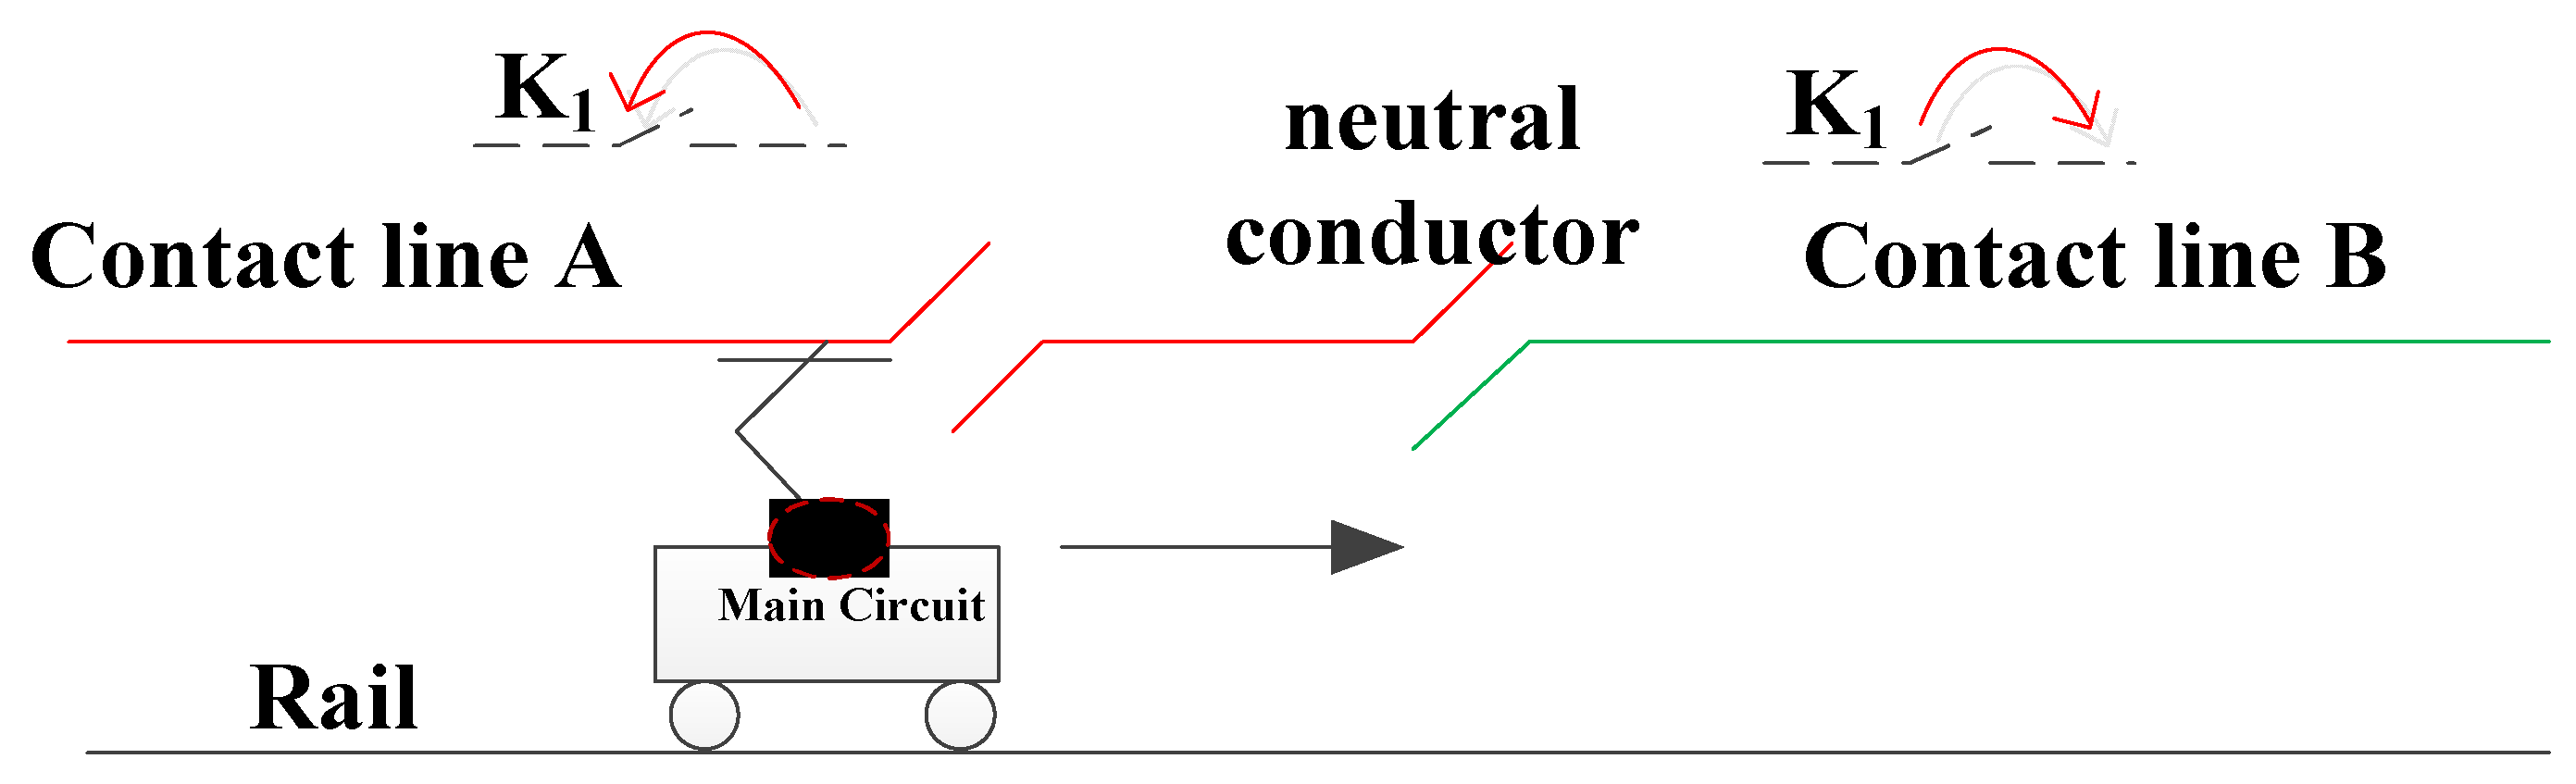
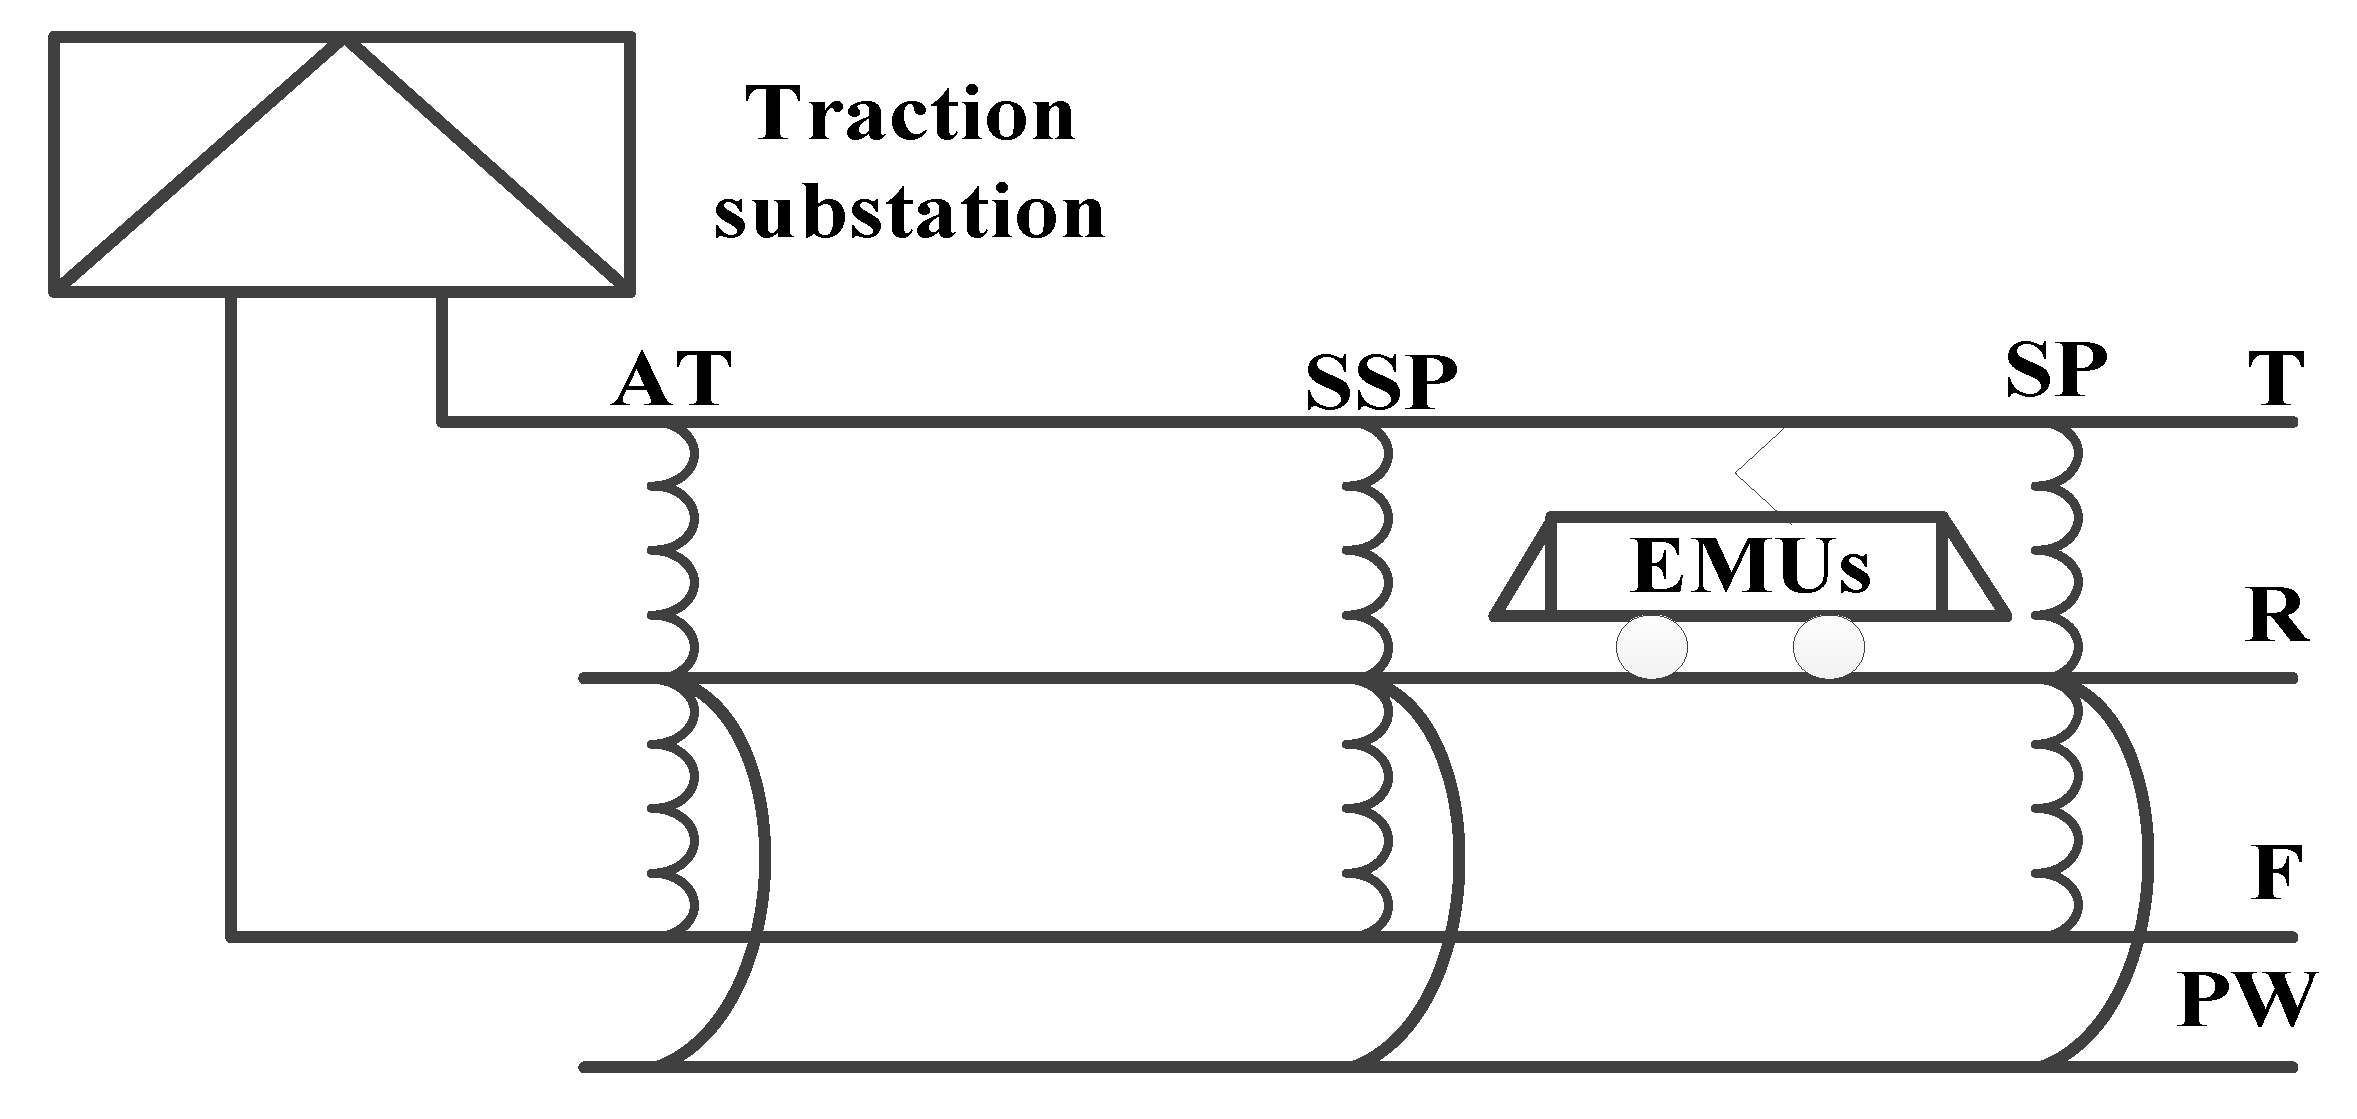
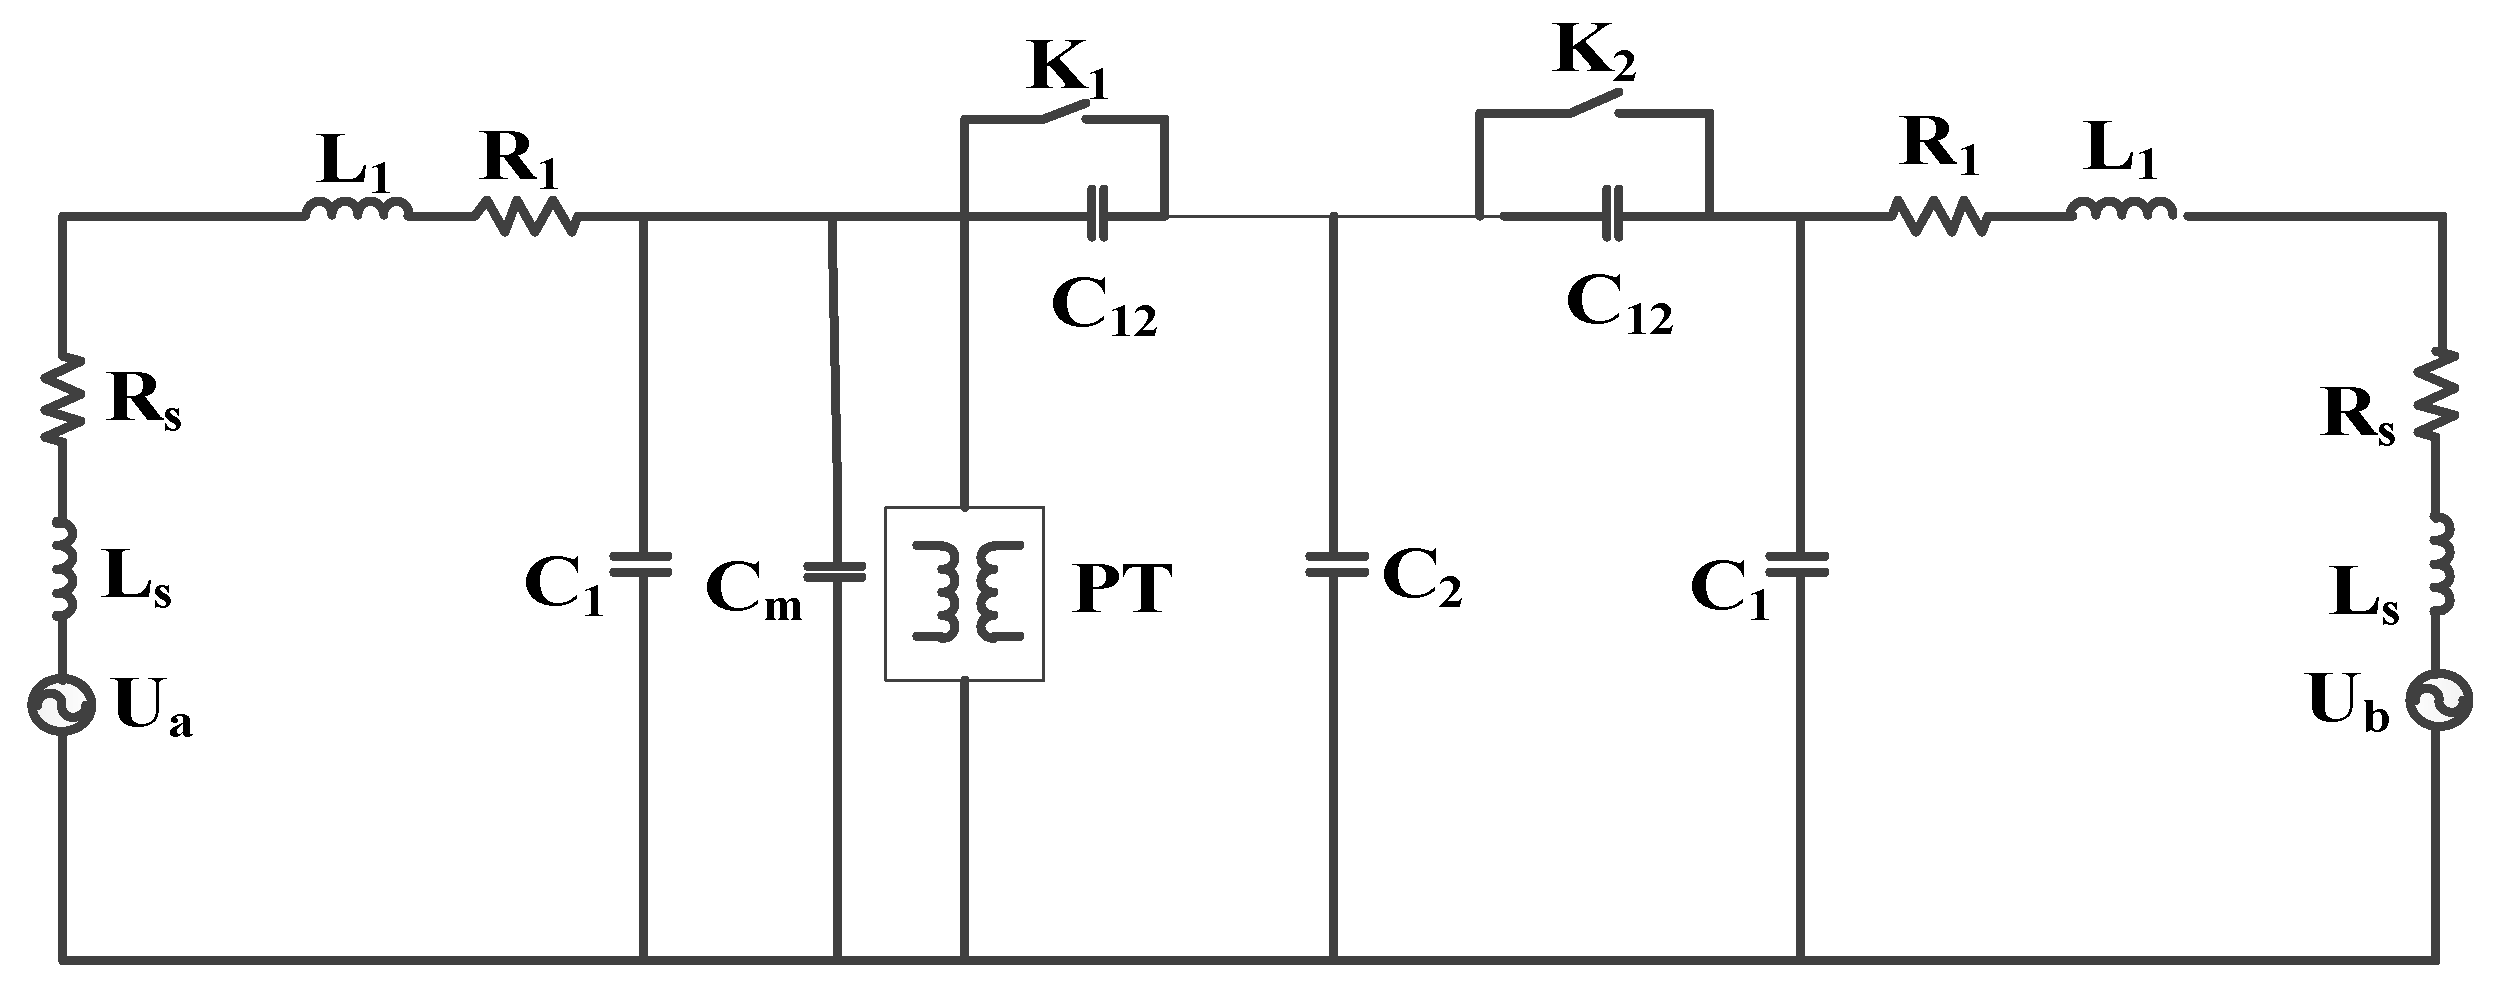
3.1. Research on the Model of a Train Passing through the Neutral Zone

The power supply utilizes AT (autotransformer) technology on the Beijing–Zhangjiakou railway line that is the object of the experiment, with an autotransformer being installed approximately every 10–15 km. One end of the autotransformer is connected to the contact line, while the other end is linked to the positive feeder. The neutral point is directly connected to the rail. Figure 5 illustrates that a protection wire (PW) is integrated into the power-supply system, and runs parallel to the rail (R). Additionally, a connector for the protective wire (CPW) has been introduced, to establish a connection between the rail and midpoint of each autotransformer, via the protection wire. This arrangement aims to minimize impedance, to enhance the voltage levels at feeding sections, and reduce power loss. Consequently, both the downstream contact lines and positive feeders in this double-track traction line are interconnected in parallel, at each AT. The equivalent circuit distributed capacitance that calculated is shown in Table 3.
The electrical parameters of the voltage transformer are shown in Table 4.
Only the pantograph and the roof voltage transformer are linked to the contact line in the entire EMU. This primary circuit can be represented as a high-voltage circuit, consisting of resistance, inductance, and capacitance. The diagram illustrating this equivalent circuit is presented in Figure 6.
In Figure 6, Ua and Ub are traction power supplies; RS and LS are the resistance and inductance of the traction transformer, converted according to the Thevenin circuit equivalent; R1 and L1 are the equivalent resistance and reactance of the contact line feeding section; C1 is the feeding section ground capacitance; C2 is the neutral zone-to-ground capacitance; C12 is the coupling capacitance between the neutral zone and the power-supply zone; PT is the roof voltage transformer; Cm is the EMU pantograph-to-ground capacitance; K1 and K2 are the switches that control the cut-off and closing-phase angle. The initial state is the off state, which is used to simulate the circuit-conversion process when the EMUs pass through the neutral zone, where no power is supplied.
When the EMU enters the neutral zone, K2 remains open, and K1 quickly changes from the open state to the closed state. The neutral zone voltage in this transient process can be determined using the differential equation. As the core inductances Lm and Rm of the roof voltage transformer are relatively large, and C1 and Cm are relatively small compared to C2, the neutral zone and the power-supply zone coupling capacitor C12 are short-circuited after the switch K1 is closed so, in the differential equation expression, the influence of the parameters Lm, Rm, C1, Cm, and C12 can be ignored. If L = Ls + L1, R = Rs + R1, and C = C2 according to the equivalent circuit of the EMU after the equivalent switching action, then the loop equation can be listed as:
u L + u C + u R = u s
Here, us is the power-supply voltage, the inductor voltage uL = Ldi/dt, the resistance voltage uR = R·i, and the loop current i = CduC/dt. By substituting them into Equation (1), the differential equation can be obtained:
L C d 2 u C d t 2 + R C d u C d t + u C = u s
Any voltage drop caused by this impedance can be disregarded by considering the negligible impedance of the contact line in the neutral zone. Consequently, the voltage uc at both ends of the neutral zone-to-ground capacitance C2 in Equation (2) represents the voltage across the joint-type electrical split’s neutral zone. Equation (2) is a second-order linear non-homogeneous differential equation with constant coefficients, and its complete response can be divided into the zero input response and zero state response. When the switch K1 is closed, the induced voltage from the capacitance C2 connected to the electric neutral zone discharges into an R-L circuit. This discharge process can be described using a differential equation.
L C d 2 u C d t 2 + R C d u C d t + u C = 0
The effective circuit’s expression with no input is:
u C = p 2 U 0 p 1 p 2 e p 1 t + p 1 U 0 p 1 p 2 e p 2 t = U 0 p 1 p 2 p 1 e p 2 t p 2 e p 1 t
The characteristic root can exhibit three distinct scenarios as a result of varying circuit parameters. The work will delve into the neutral zone-to-ground voltage in each of these situations.
(1)
When α > ω0; that is, R > 2 L / C , p1 and p2 are two unequal negative real numbers.
u C = U 0 p 1 p 2 p 1 e p 2 t p 2 e p 1 t
This situation is called the aperiodic discharge or non-oscillating discharge process.
(2)
When α < ω0; that is, R < 2(L/C)0.5, and p1 and p2 are equal, then the equivalent circuit has only one frequency, and the neutral voltage to the ground is:
u C = U 0 1 + α t e α t
It can be seen from Equation (6) that there is no oscillating change, and the circuit has a non-oscillating nature, but this is the dividing line between an oscillating circuit and a non-oscillating circuit, so the situation when R < 2(L/C)0.5 is called a critical non-oscillating process.
(3)
When α < ω0; that is, R < 2(L/C)0.5, then p1 and p2 are a pair of conjugate complex roots, and the neutral voltage to the ground is:
u C = U 0 ω 0 ω d e α t sin ω d t + β
This scenario involves an oscillating discharge, where the waveform undergoes periodic changes, and the energy storage component exchanges energy periodically, as well. Equation (2) can be expressed as us = Umsin(ωt + Φ), with ωt representing the angular frequency of the power supply, and Φ indicating its initial phase angle. Consequently, Equation (2) takes on a new form.
L C d 2 u C d t 2 + R C d u C d t + u C = U m sin ω t + ϕ
(1)
If it is a non-oscillating circuit, the neutral voltage to the ground can be expressed as:
u C = U m Z X C sin ω t + ϕ φ π 2 + A 1 e p 1 t + A 2 e p 2 t
Taking Equation (5) into Equation (9), the expression of Uc and i is:
u C = U m Z X C [ sin ( ω t + ϕ φ π 2 ) + cos ϕ φ p 1 p 2 p 1 e p 2 t p 2 e p 1 t + sin ϕ φ p 2 p 1 p 1 e p 1 t p 2 e p 2 t ]
(2)
If the circuit is in a critical state, in the same initial state, then the same as above can be obtained using:
u C = U m Z X C { sin ( ω t + ϕ φ π 2 ) + e α t [ 1 + α t cos ϕ φ + t ω sin ϕ φ ] }
(3)
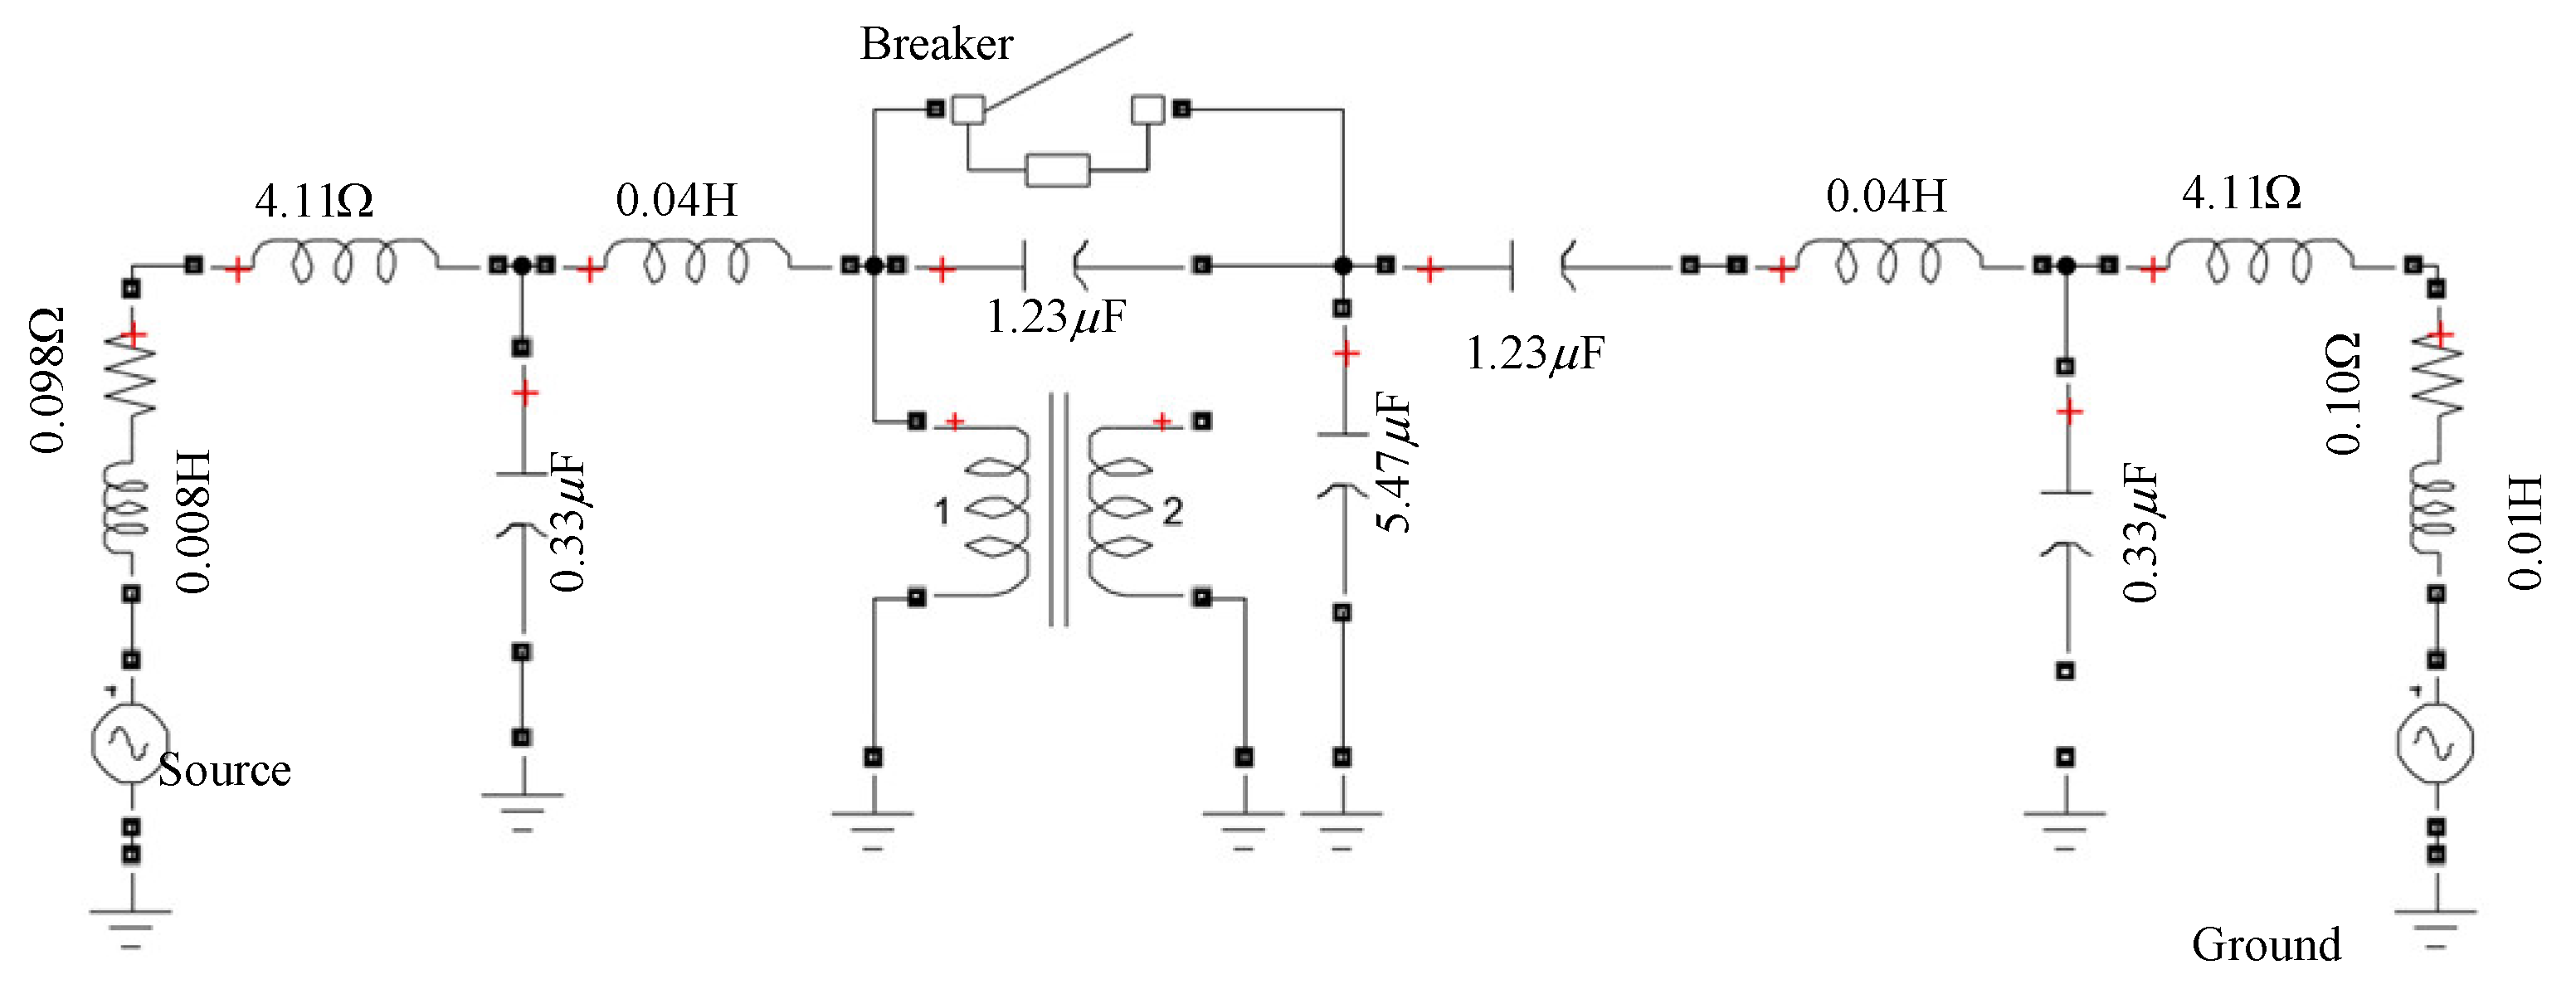
If it is an oscillating circuit then, at this time, p 1 and p 2 are a pair of conjugate complex numbers, p1= −α + d, p2 = −αd, which can be obtained under the same initial state:
u C = U m Z X C { sin ( ω t + ϕ φ π 2 ) + e α t ω d [ ω 0 sin ω d t + β cos ϕ φ + t ω sin ω d sin ϕ φ ] }
When the EMU enters the neutral zone, and experiences low-frequency oscillation, the equivalent circuit undergoes oscillation. By applying the principle of circuit superposition, we can combine Equations (6) and (7) with Equations (11) and (12), respectively. This allows us to derive a mathematical expression for the voltage when the EMU enters the electrical neutral zone.
u C t = U m Z X C sin ( ω t + ϕ φ π 2 ) + U m e α t Z ω d C sin ω d t sin ϕ φ + U 0 ω 0 ω d + U m X C Z sin β cos ϕ φ e α t sin ( ω d t + β )
When the EMU enters the electrical neutral zone, the ground voltage of the neutral zone is influenced by the phase angle of the contact line power supply. The structure of the neutral zone affects its capacitance parameter C, and determines how voltage oscillations occur within it. As entry into this zone occurs at random times, each time an EMU enters, a different electromagnetic transient process is generated, resulting in varying excitation levels in the roof voltage transformers. The circuit’s oscillation angular frequency ω0 exceeds that of its free component ωd, which decays exponentially with a speed determined by the attenuation coefficient α = R/2L. A larger value for α results in a faster amplitude decay, and a shorter time to reach zero, while also taking into account the contact line impedance.
Z = 0.05 + j 0.145 lg D d
The resistance part is 0.05 Ω/km, and the resistance value is about 0.01 Ω when the length of the neutral zone is 200 m.
Comparing the inductance and resistance parameters of the oscillating system, it can be seen that α = 0.001/10,000, the damping in the oscillation process is extremely small, and there is almost no attenuation process.

3.2. Oscillation Process and Overvoltage Characteristics

A model of the power-supply line, source, and train system is established, based on the percentage of the power supply, and the train operation status (Figure 7). The simulation of the pantograph for the net contact state for the EMU in a neutral zone is achieved by adjusting the time-controlled breaker’s on–off state and PT position within the model. During the entry process, the control breaker rapidly transitions from an open to a closed state, under the regulation of a time-control switch that governs its closing duration, before reopening.
A fixed time-controlled switch is utilized to regulate the opening and closing times, to investigate the impact of the power phase angle on low-frequency oscillation during pantograph and line separation. The neutral zone is observed for occurrences of low-frequency oscillation, while the power phase angle is varied, with the corresponding ranges recorded. Table 5 displays the maximum voltage amplitude in the neutral zone at different phase angles for an EMU.
A significant increase in amplitude is exhibited when the power supply’s phase angle falls within the range of 60–90° and 240–270°. The simulation conditions highlight that these specific phase angles are particularly associated with the prominent occurrence of low-frequency oscillation in the neutral zone. Figure 8 illustrates the typical waveform of low-frequency oscillation experienced by the EMU as it traverses through this electrical neutral zone under identical power phase angle conditions.
The analysis of the frequency spectrum for low-frequency oscillation in the neutral zone is based on a fundamental frequency of 50 Hz. The contact line voltage within this area primarily exhibits a power frequency of one-third (16.7 Hz) during instances of low-frequency oscillation. Figure 9 displays the typical amplitude and frequency characteristics for an abnormal line voltage simulation in the neutral zone region.
Following the simulation, a different type of low-frequency oscillation was observed (Figure 10). The alteration of either the capacitance or resistance value in the model, with a constant excitation factor, resulted in a modification in the waveform for this oscillation. Figure 10 depicts an increase in amplitude with a frequency similar to that shown in Figure 8, along with two peaks appearing within one cycle.

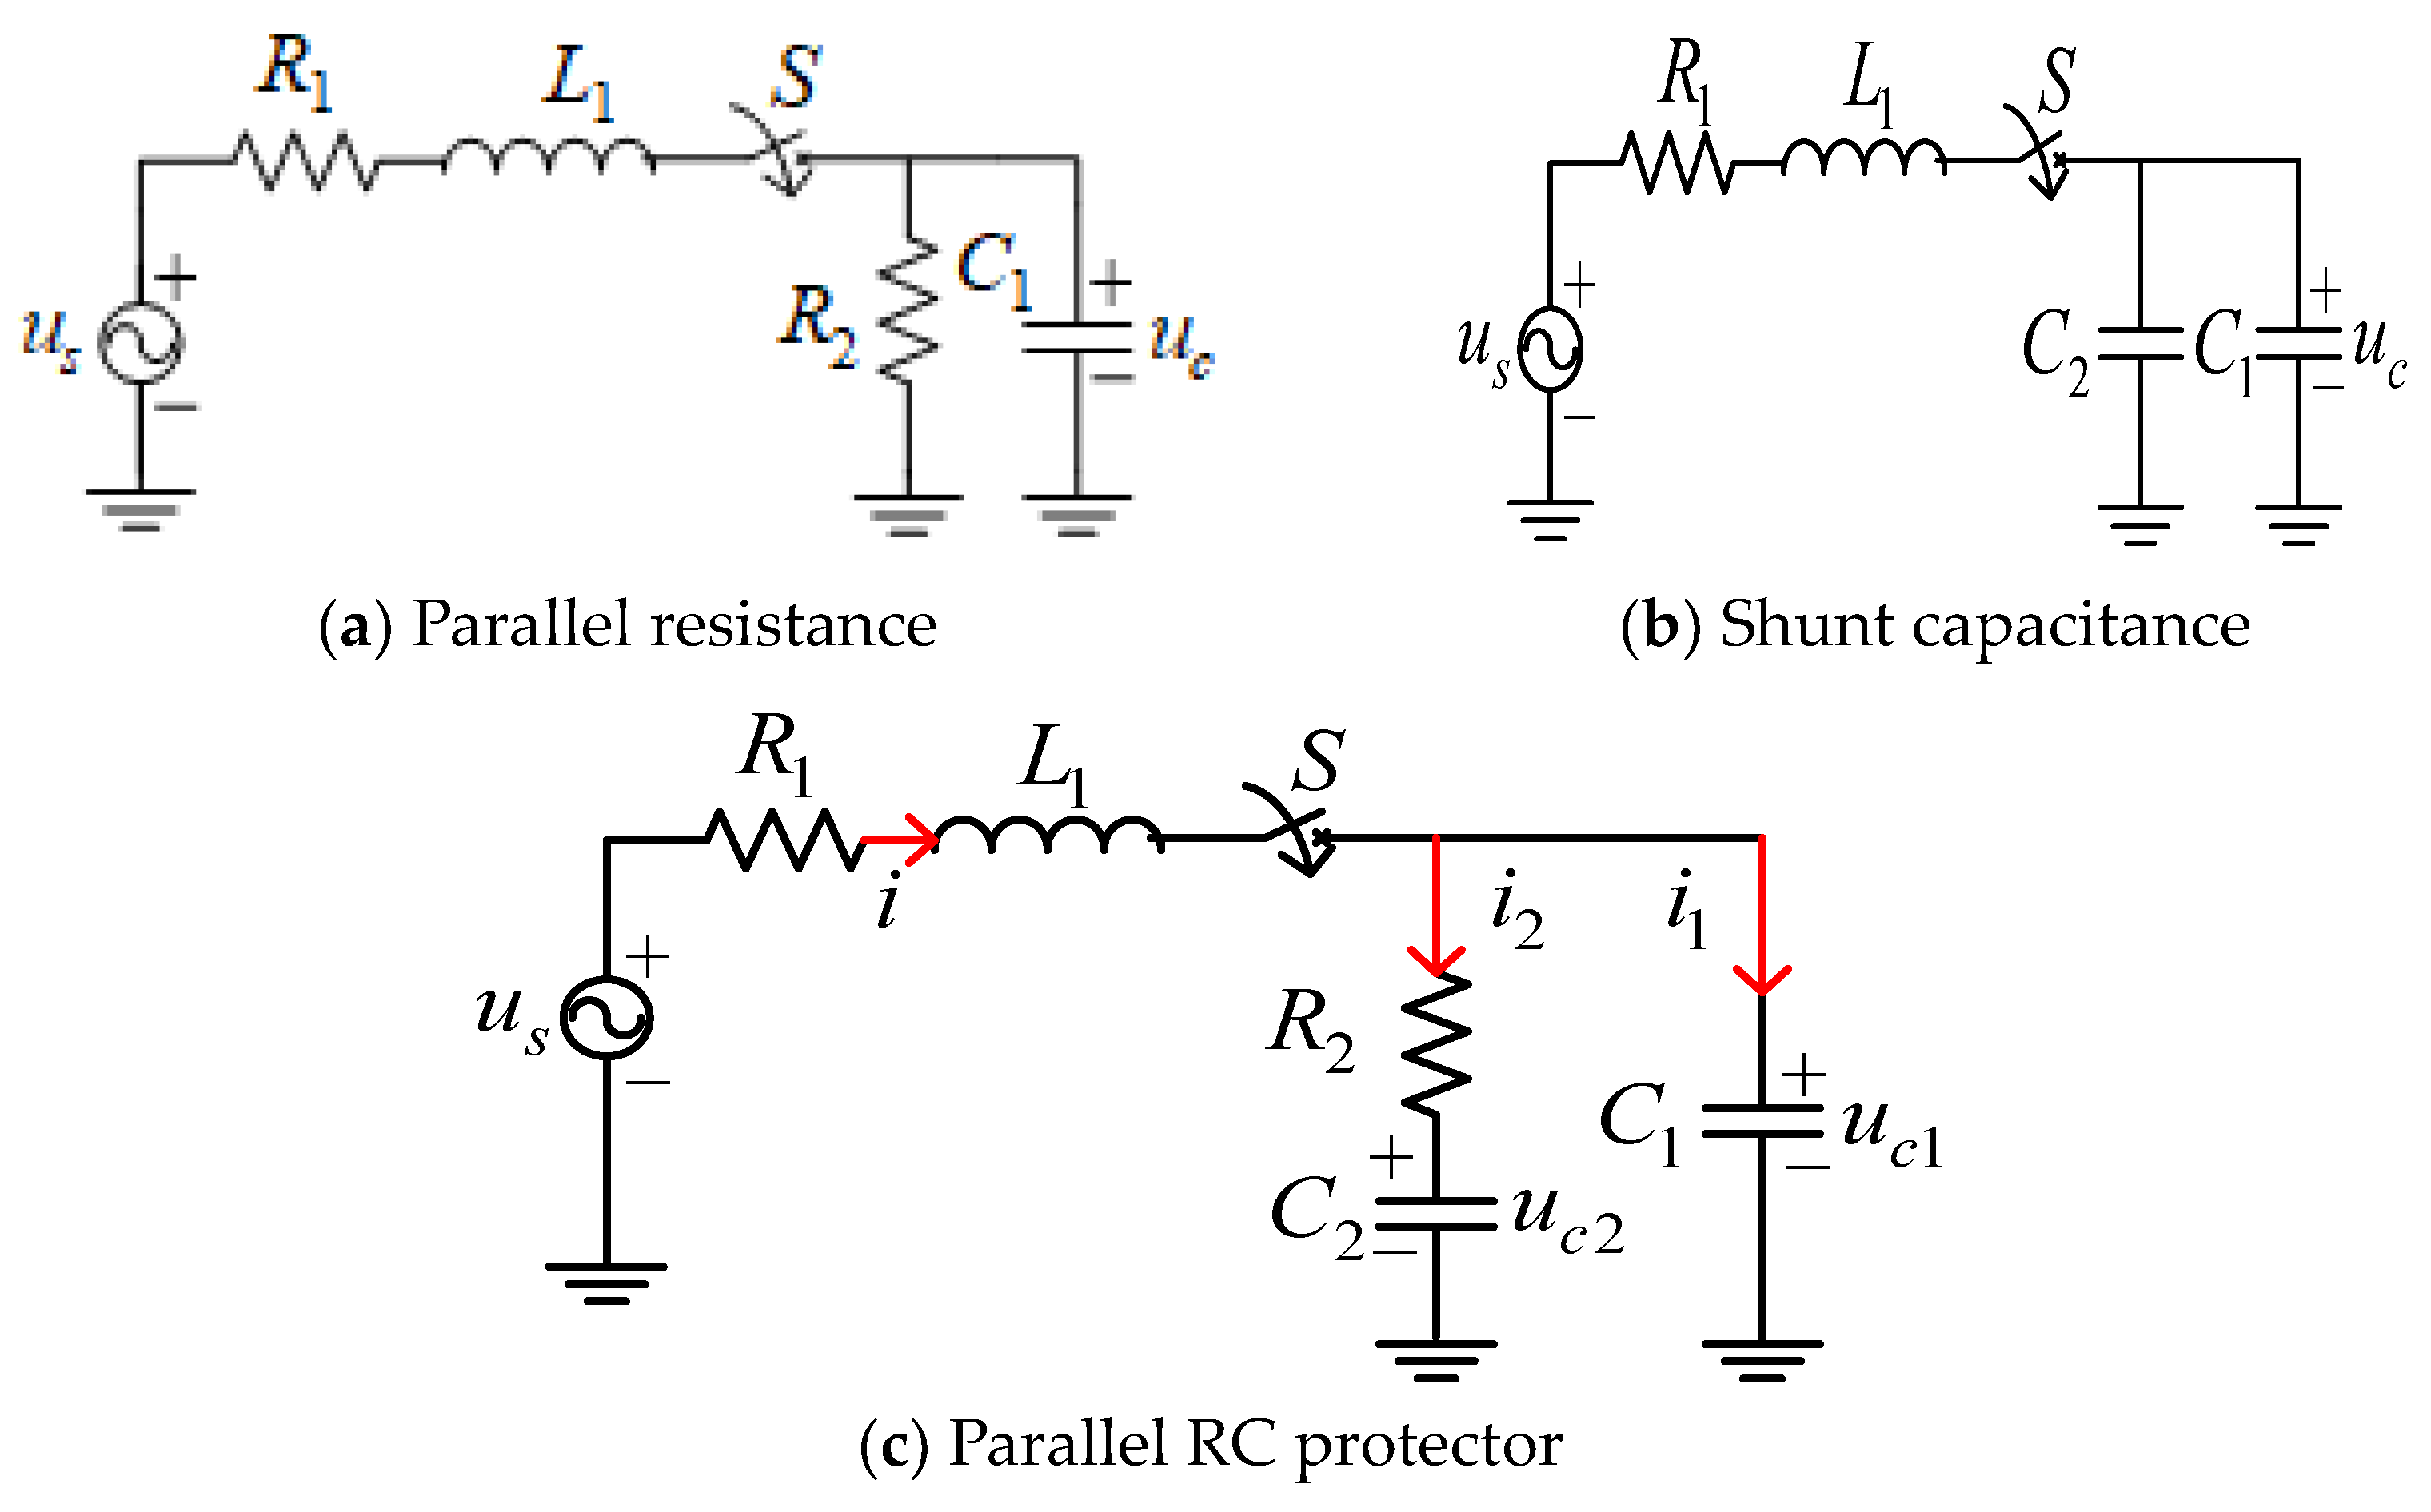
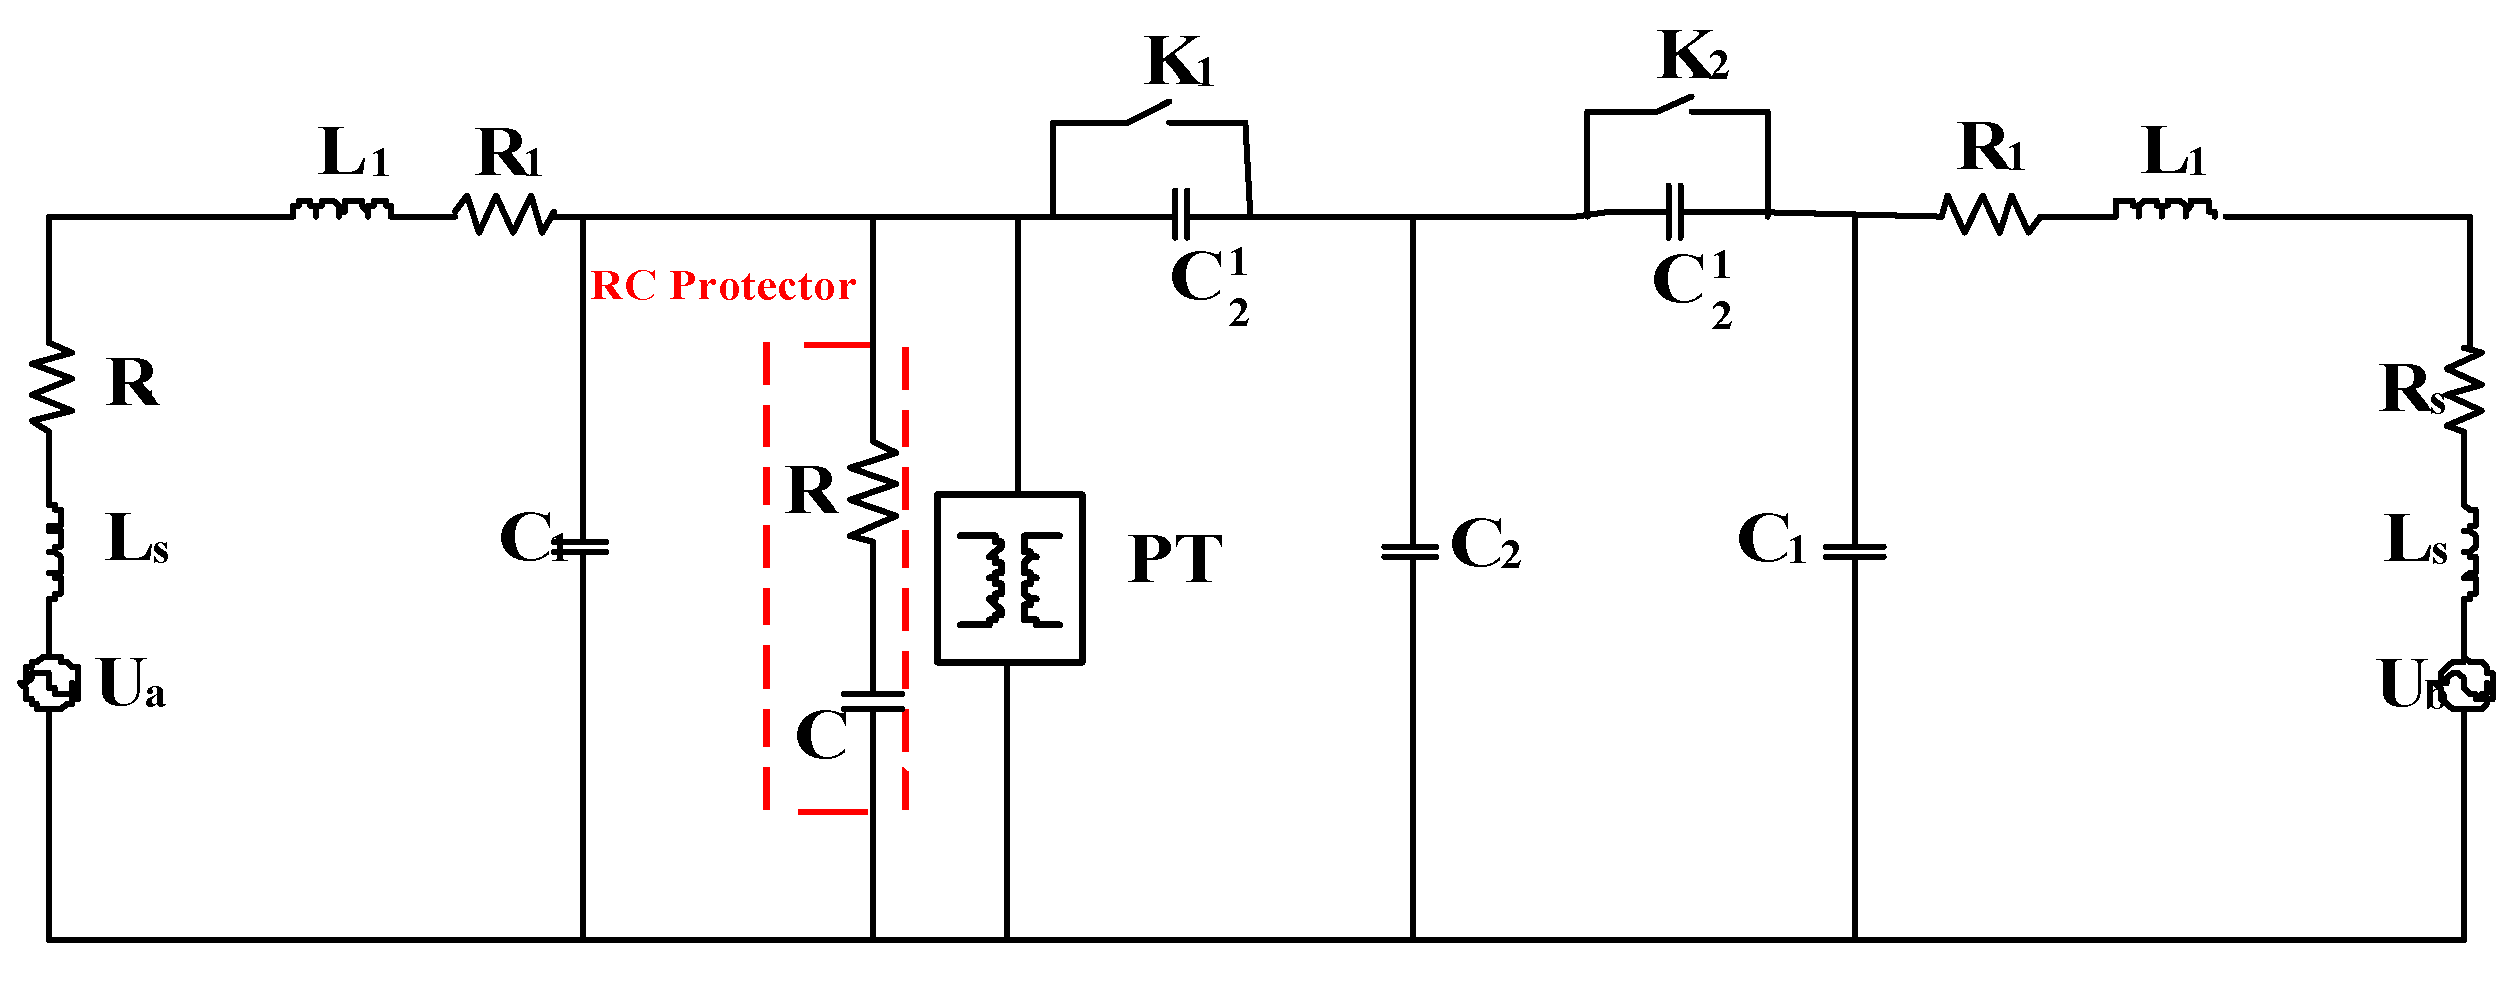
3.3. Methods of Suppressing Oscillation Process

To simulate the process of the EMUs running into the neutral zone, three equivalent circuits are established in Figure 11, R1 and L1 represent the equivalent impedance of the contact line power supply, while C1 denotes the equivalent capacitance of the traction power system. On the other hand, R2 and C2 indicate resistance and capacitance in the protection device. Only parallel resistance is considered in Figure 11a. The analysis of this second-order circuit reveals that an increase in parallel resistance results in a reduced damping in the system, leading to a decrease in the overvoltage value. Similarly, Figure 11b focuses on parallel capacitors, where it is observed that they enhance the damping of the system, and reduce the overvoltage value. Finally, Equation (19) mainly analyzes Figure 11c. A differential equation about capacitor voltage uc1 can be formulated, after closing switch S:
R 1 i 1 + i 2 + L d i 1 + i 2 d t + u C 1 t = u S t
R 2 i 2 + u C 2 = u C 1
i 1 = C 1 d u C 1 d t
i 2 = C 2 d u C 2 d t
Using Laplace transform, we can obtain:
Φ s = u C 1 s u s s = 1 + R 2 C 2 s L R 2 C 1 C 2 s 3 + L C 1 + L C 2 + R 1 R 2 C 1 C 2 s 2 + R 1 C 1 + R 1 C 2 + R 2 C 2 s + 1
Figure 11. Simple equivalent circuit diagram.
Energies 16 05848 g011
MATLAB is used to analyze the unit step response of the transfer function, and the results are shown in Figure 12 and Figure 13.
Figure 13 illustrates the equivalent circuit of the neutral zone after the incorporation of an RC protection device, according to the test on the excitation characteristic of the voltage transformer’s low-frequency oscillation. The transient process of an EMU passing through this neutral zone is simulated using MATLAB 2017b software (MathWorks, Natick, MA, USA), as depicted in Figure 14.
Under the same simulation conditions as the original low-frequency oscillation, an RC device was installed in the neutral zone, and the voltage waveform of the contact line in the neutral zone is shown in Figure 15.
The simulation waveform demonstrates that the installation of the suppression device results in a reduction in the voltage peak magnitude to below 20 kV, when the EMU enters the electrical neutral zone, and the time-controlled switch in the simulation model is closed. There has been an approximate 30% reduction in the absolute peak voltage magnitude, and the effective mitigation of low-frequency oscillation, in comparison to scenarios without the suppression device. The simulation demonstrates that incorporating an RC protection device in parallel with either the roof voltage transformer or the electric neutral zone results in a comparable circuitry and similar efficacy in attenuating the low-frequency oscillation.

4. Conclusions

The work utilized both model calculations and field tests to investigate the low-frequency oscillation mechanism that occurs when an EMU passes through the neutral zone. Methods were also proposed for suppressing this phenomenon. The findings of the research are as follows:
(1)
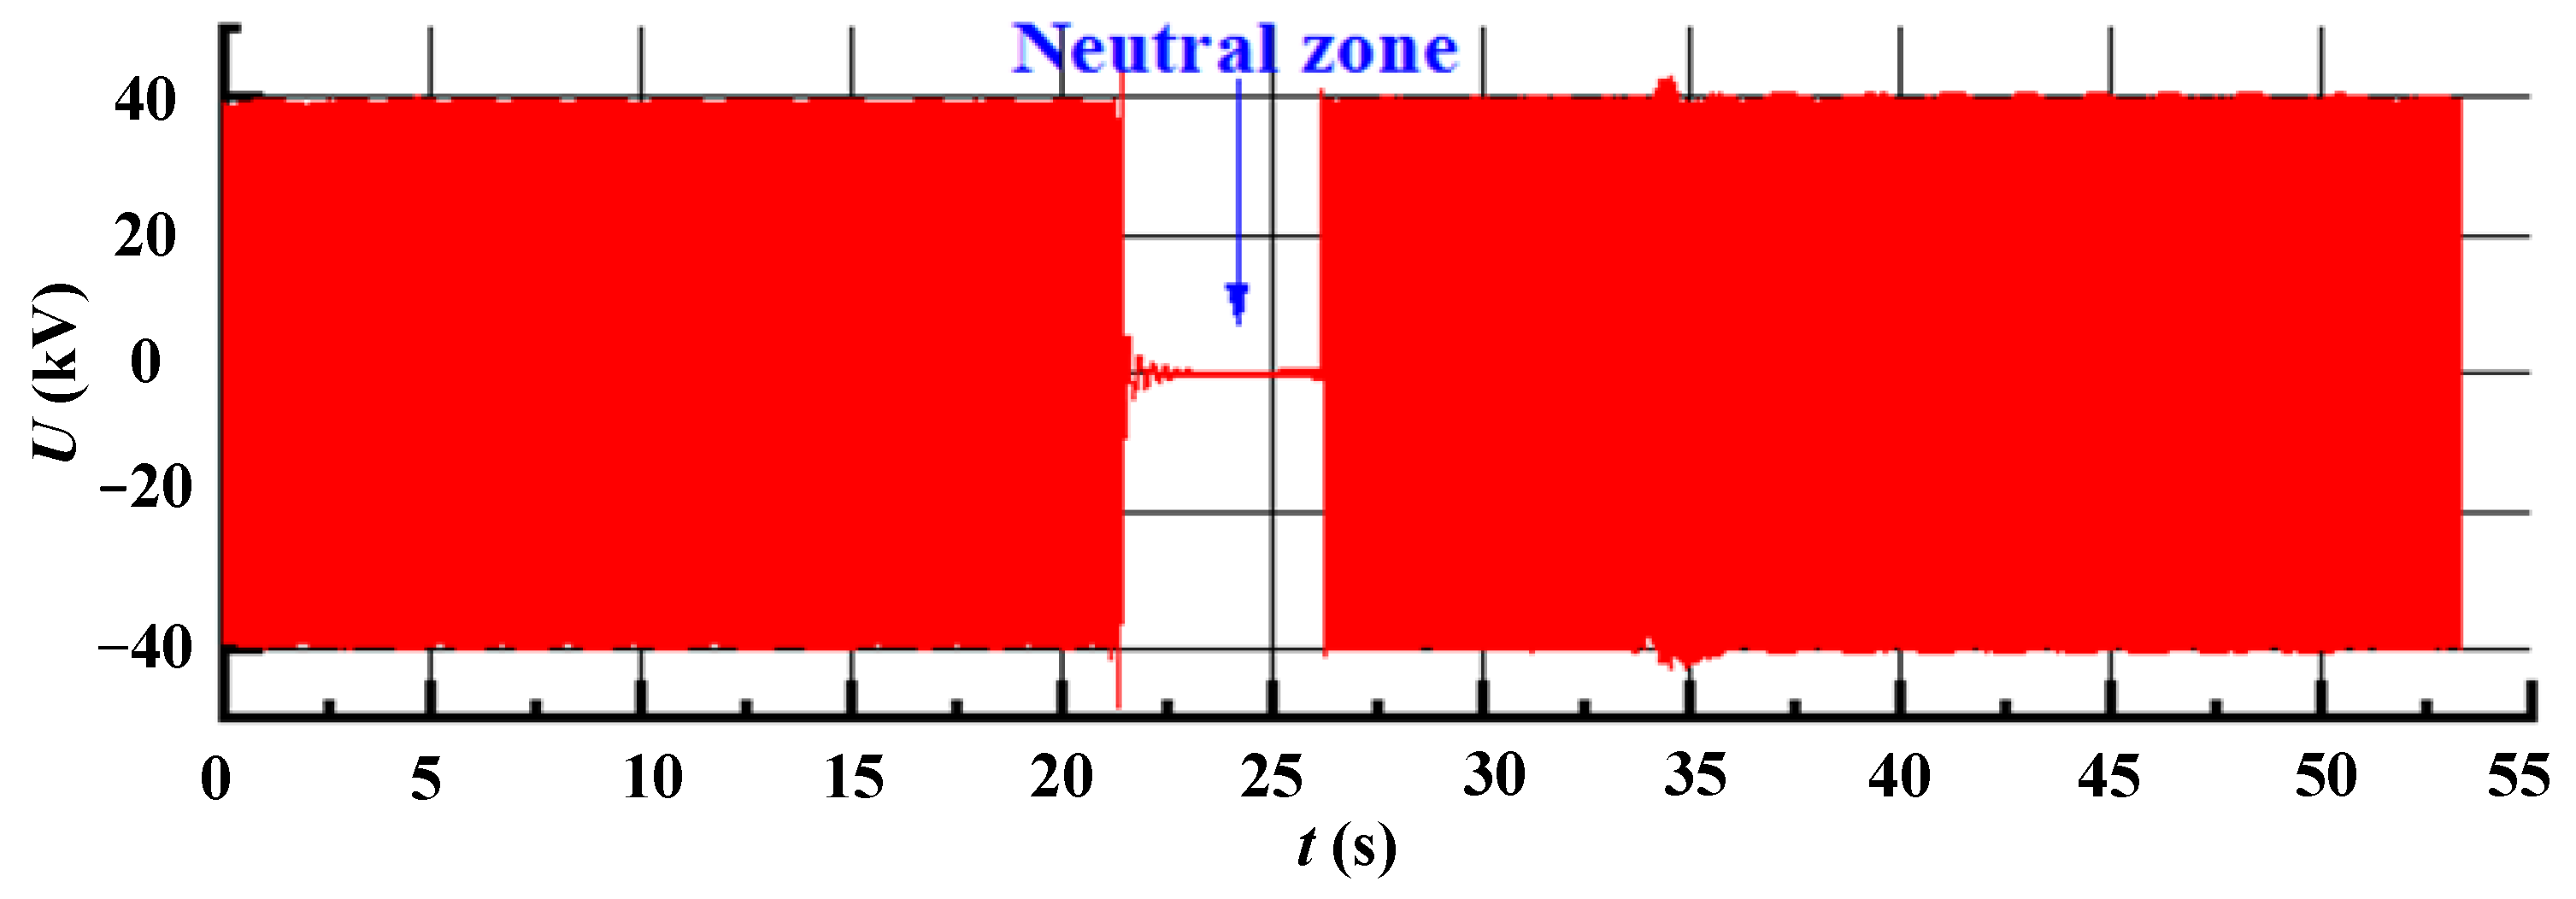
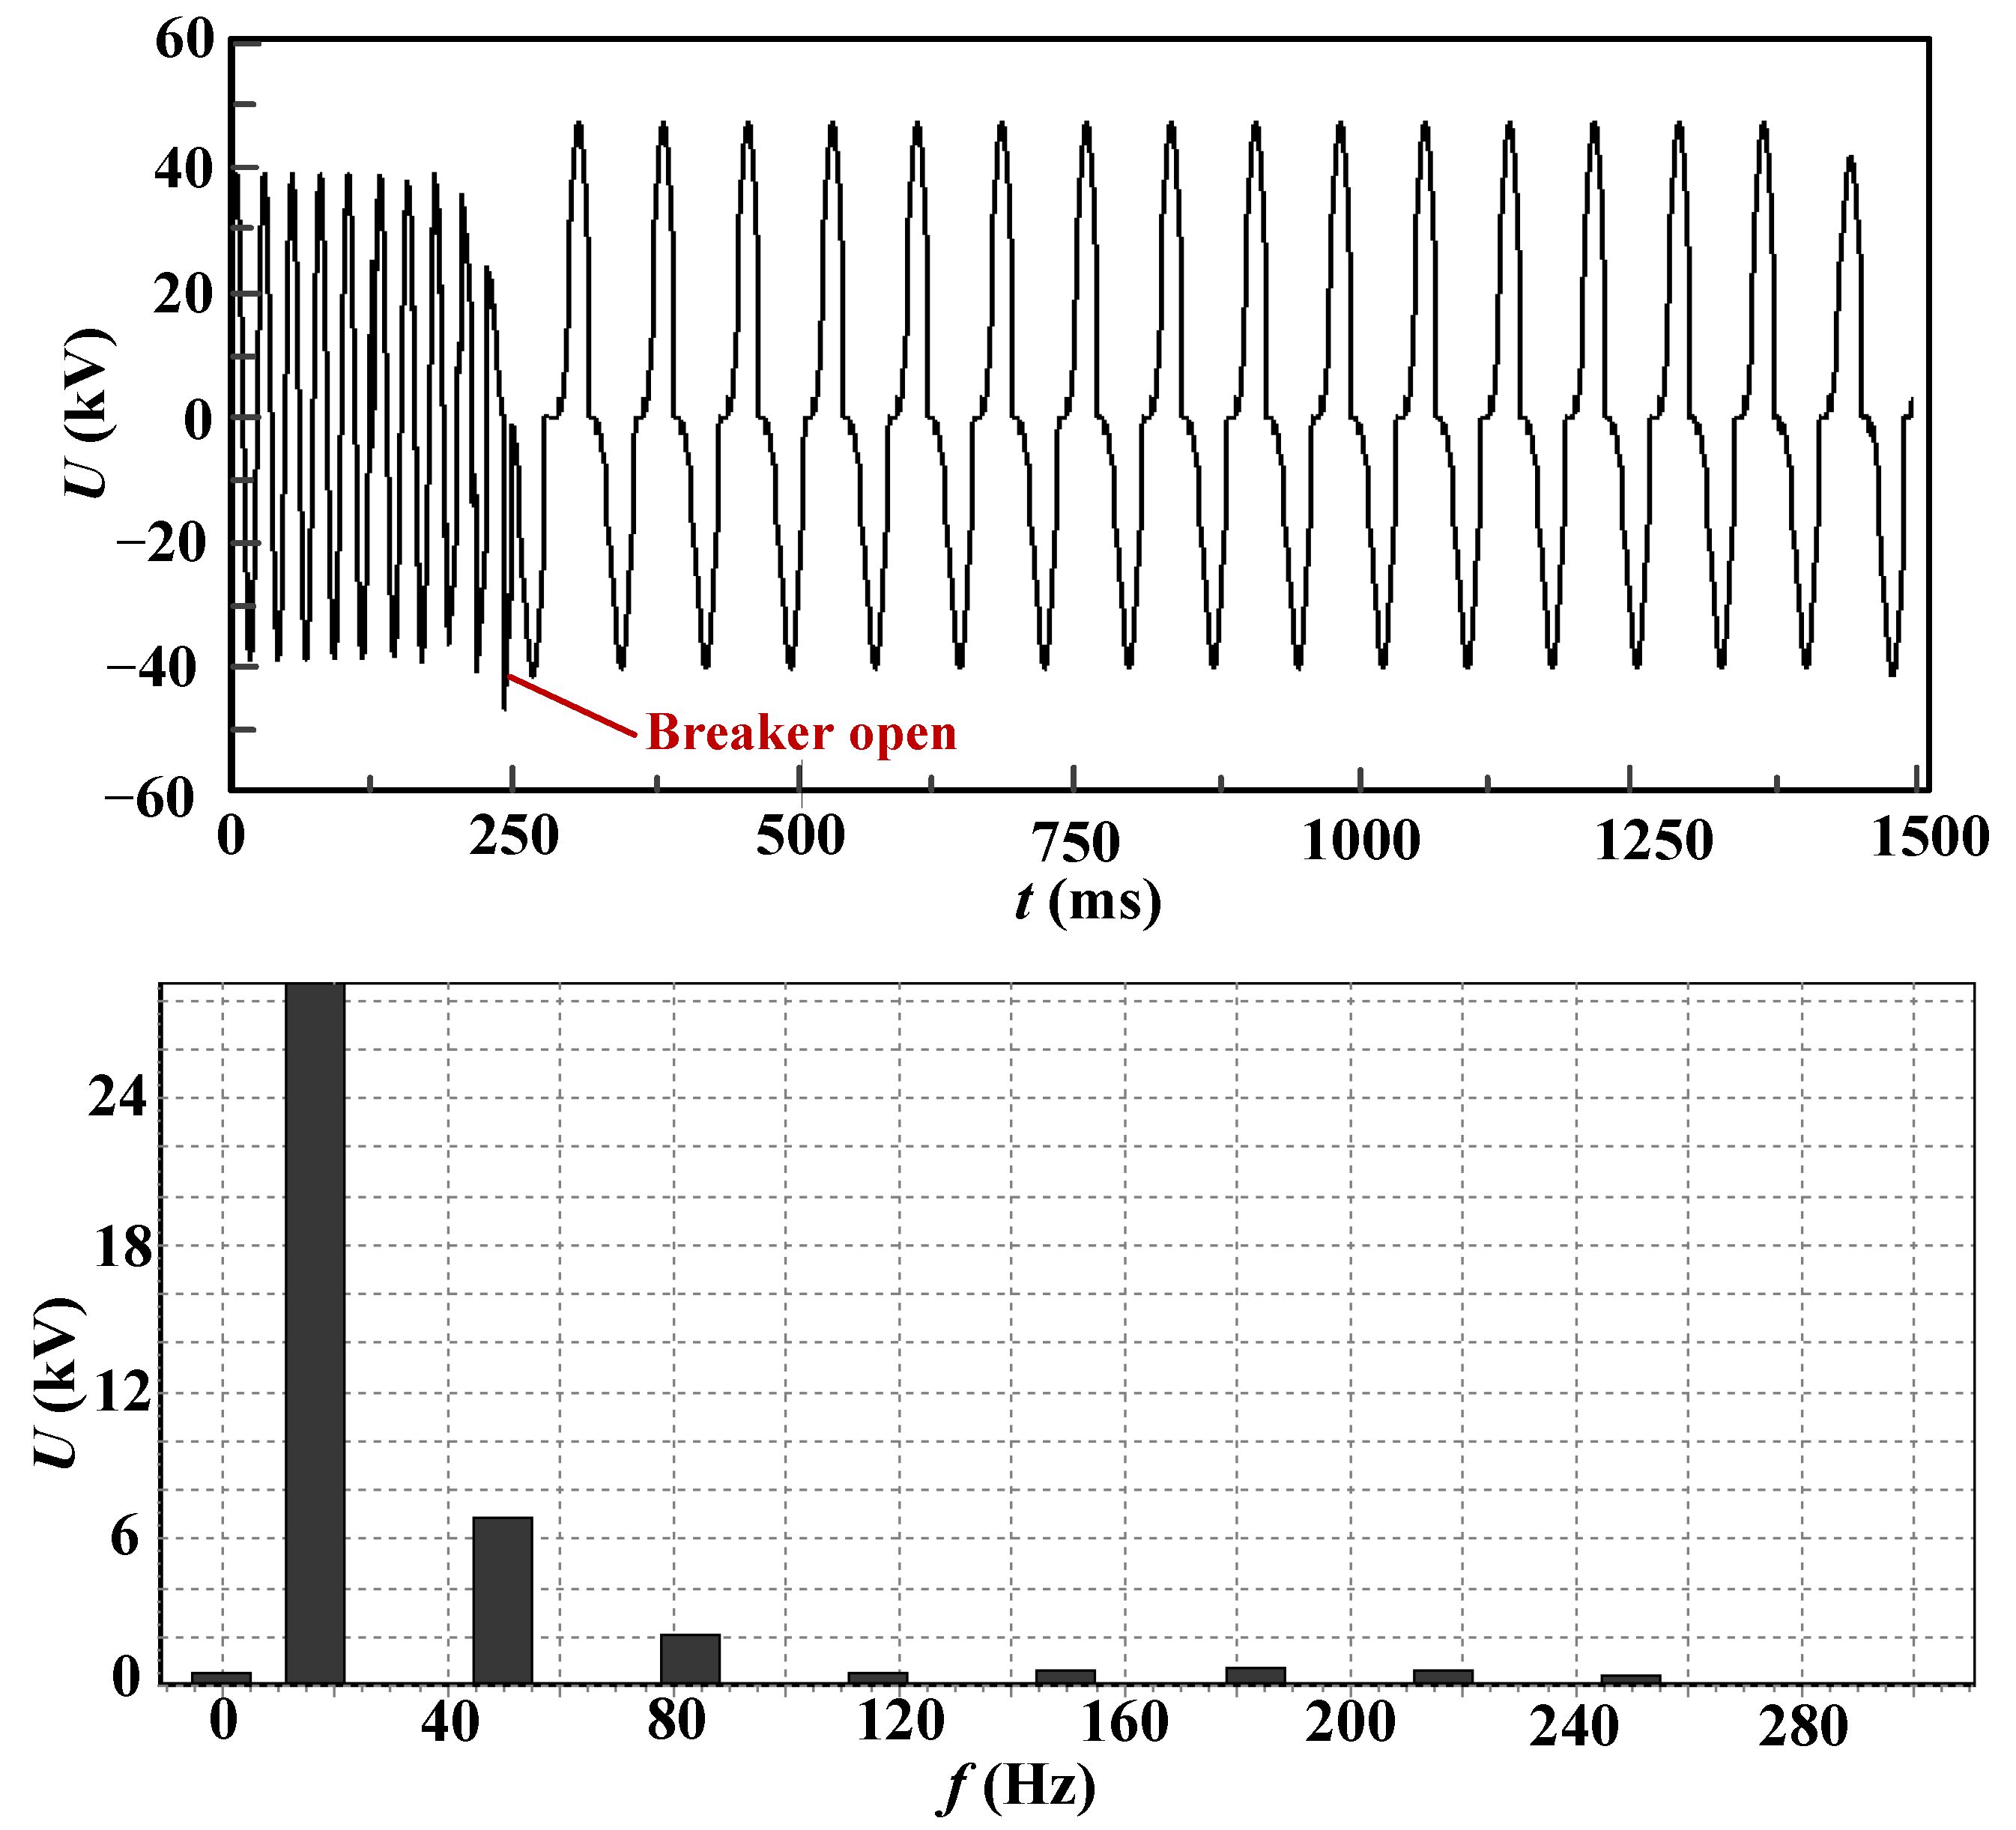
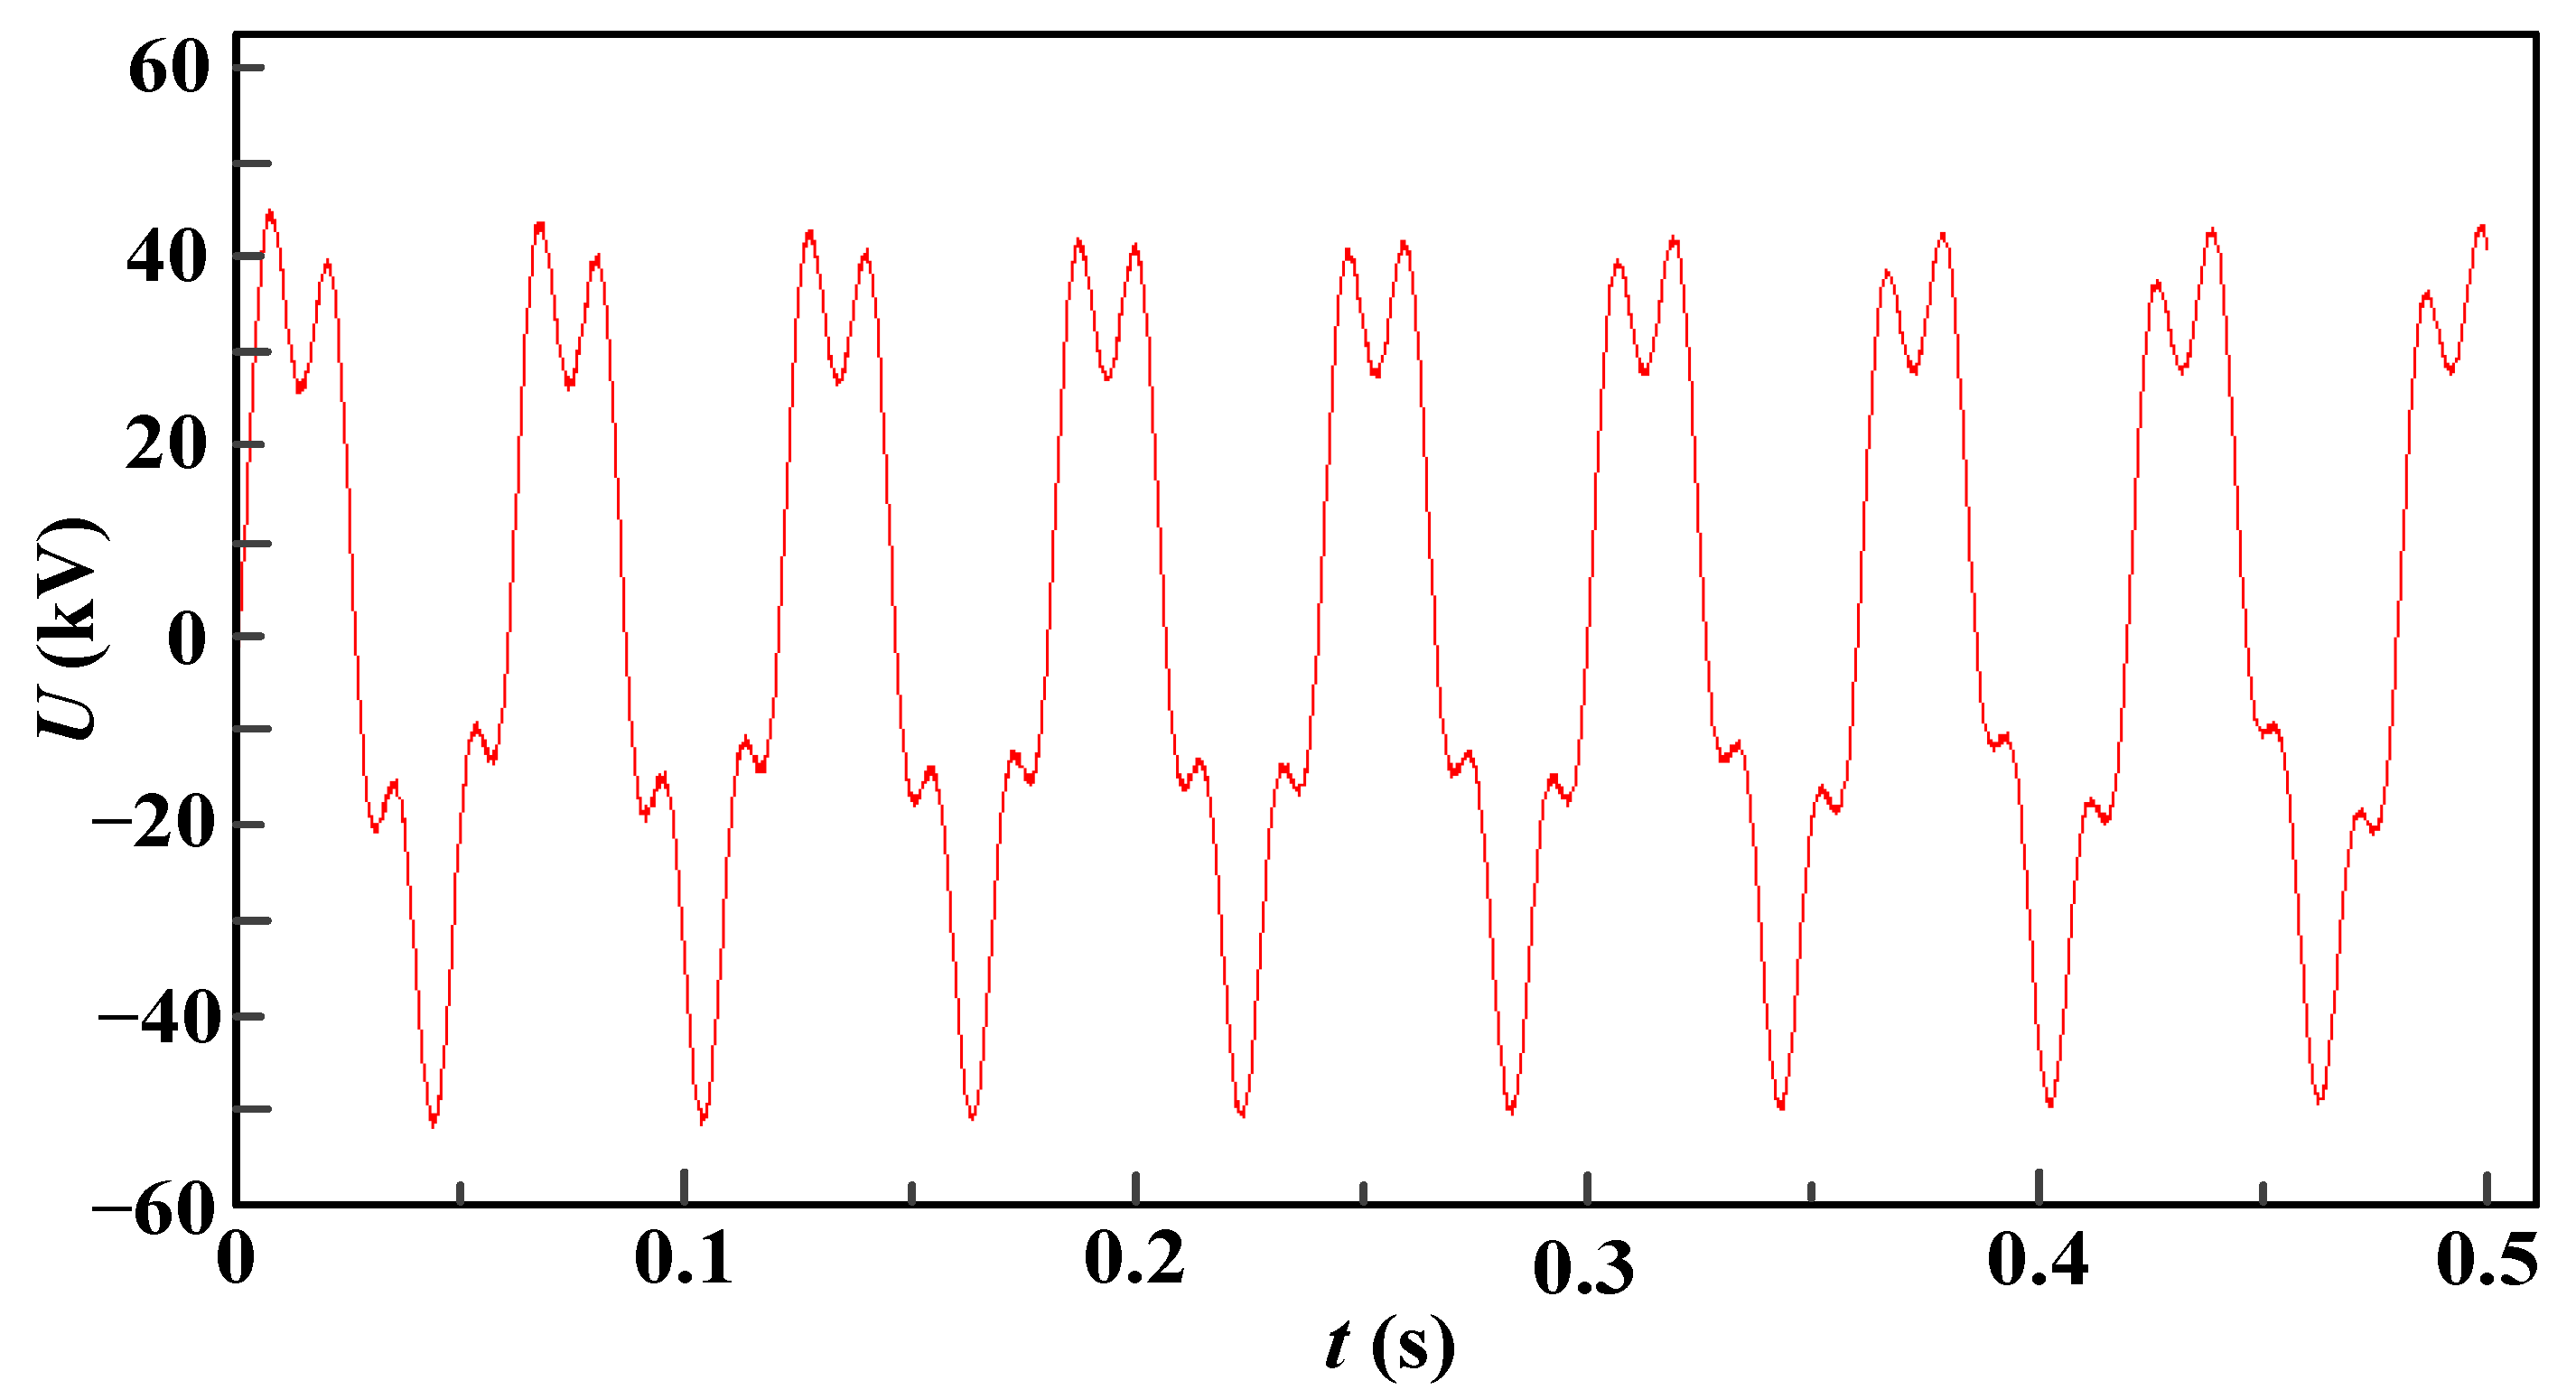
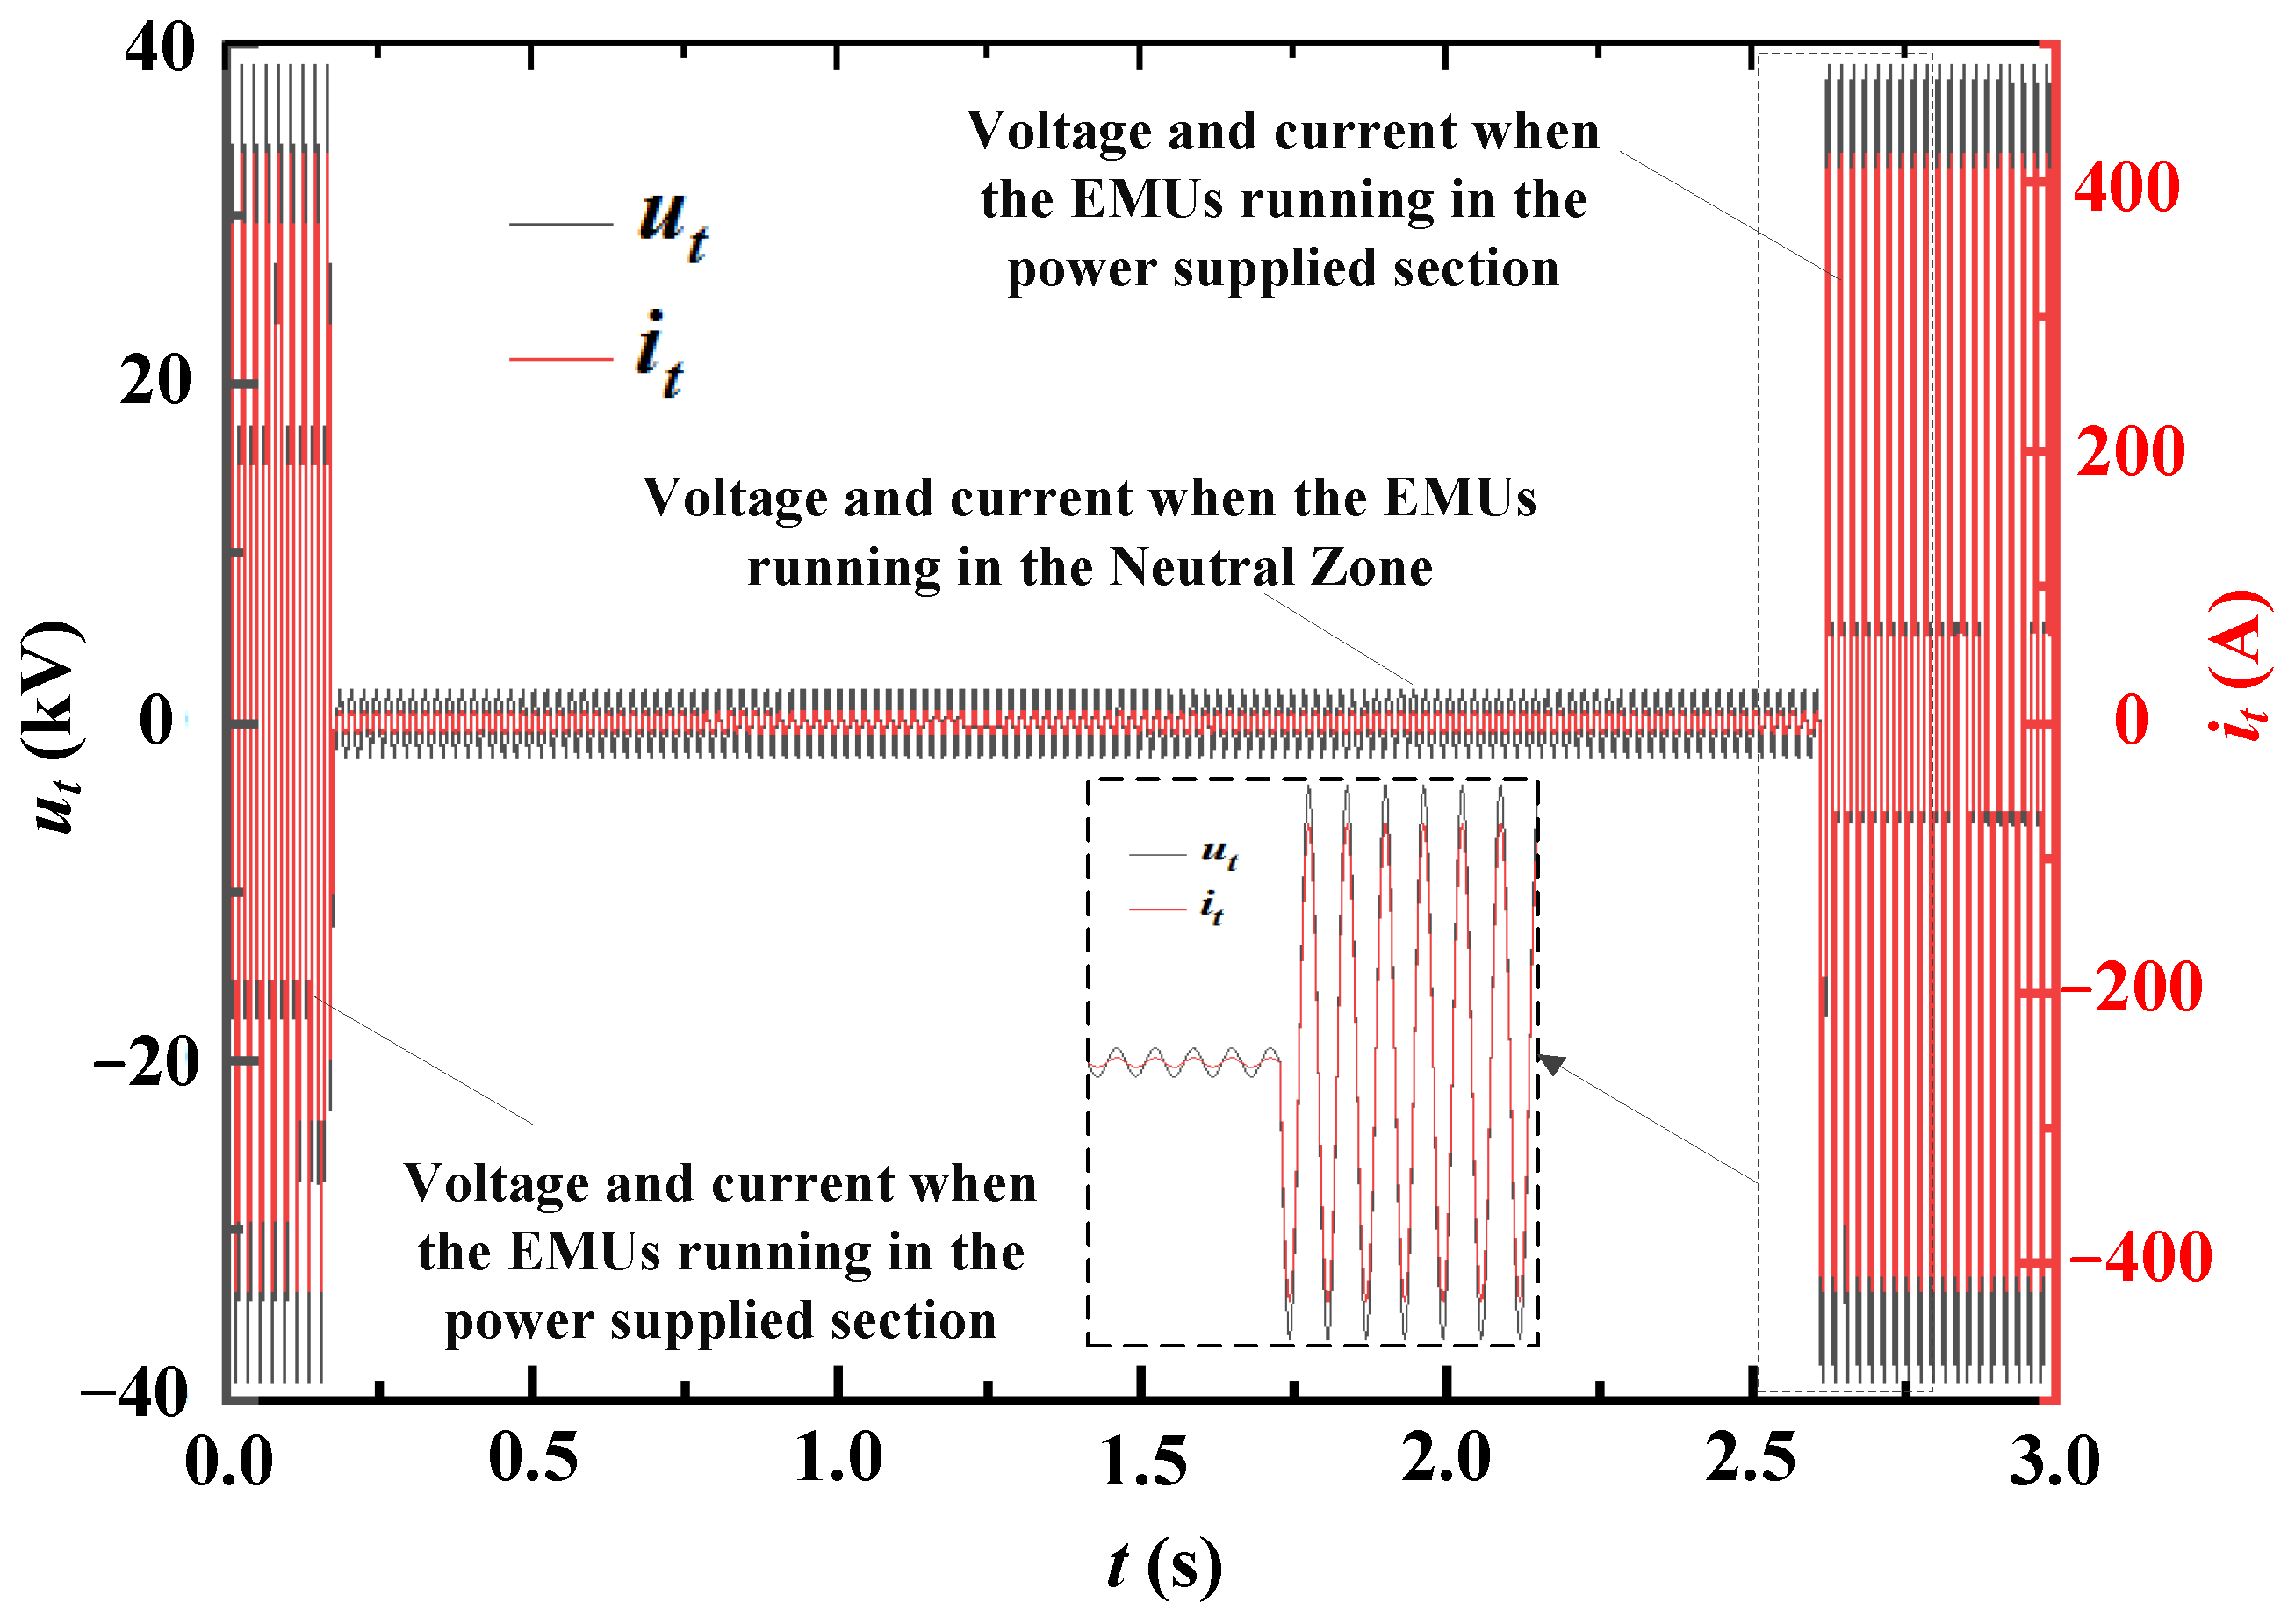
During normal operation, when an EMU entered the neutral zone, there was a significant increase in the operating overvoltage, due to the circuit breaker opening and closing. The voltage in the neutral zone remained very low. Abnormal increases in the grid voltage within this area could result in noticeable low-frequency oscillations, with amplitudes reaching up to 51.8 kV, and a frequency of approximately 16.67 Hz, or one-third of the power frequency.
(2)
The voltage levels within an EMU’s neutral zone during electrical separation were dependent on the power phase angles at the entry time. When these angles fell between 60–90° and 240–270°, the voltage amplitude was relatively high, with the maximum values reaching up to 69.75 kV, accompanied by low-frequency oscillations, mainly at one-third of the power frequency.
(3)
The installation of RC suppression devices reduced the absolute peak voltage below 20 kV upon entering the electrical neutral zone by nearly 60%, compared to cases without such devices. The low-frequency oscillation was also suppressed.

Author Contributions

Conceptualization, J.S.; Investigation, J.S.; Writing—original draft, J.S., K.H., J.L., J.H., S.Y. and Y.Z.; Writing—review and editing, J.S., K.H., K.Z., J.L., J.H., S.Y. and Y.Z. All authors have read and agreed to the published version of the manuscript.

Funding

This work was supported by Fundamental Research Funds for the Central Universities (2021JBM025), the National Natural Science Foundation of China (51907003) and Science and Technology Project of National Energy Group (SHSN-22-05, SHTL-21-08).

Data Availability Statement

The data in the paper are available and can be published by Energies.

Acknowledgments

The authors would like to thank the reviewers for their pertinent comments that helped to improve the quality of this paper.

Conflicts of Interest

The authors have no conflict, whether in the research field, or in publishing the paper in Energies.

References

  1. Chen, L.; Lu, X.; Min, Y.; Zhang, Y.; Chen, Q.; Zhao, Y.; Ben, C. Optimization of governor parameters to prevent frequency oscillations in power systems. IEEE Trans. Power Syst. 2018, 33, 4466–4474. [Google Scholar] [CrossRef]
  2. Chen, G.; Tang, F.; Shi, H.; Yu, R.; Wang, G.; Ding, L.; Liu, B.; Lu, X. Optimization strategy of hydro-governors for eliminating ultra-low frequency oscillations in hydro-dominant power systems. IEEE J. Emerg. Sel. Top. Power Electron. 2017, 6, 1086–1094. [Google Scholar] [CrossRef]
  3. Demello, F.P.; Koessler, R.J.; Agee, J.; Anderson, P.M.; Doudna, J.H.; Fish, J.H.; Hamm, P.A.; Kundur, P.; Lee, D.C.; Rogers, G.J.; et al. Hydraulic turbine and turbine control models for system dynamic studies. IEEE Trans. Power Syst. 1992, 7, 167–179. [Google Scholar]
  4. Yu, X.; Zhang, J.; Fan, C.; Chen, S. Stability analysis of governor turbine hydraulic system by state space method and graph theory. Energy 2016, 114, 613–622. [Google Scholar] [CrossRef]
  5. Liu, Z.; Yao, W.; Wen, J.; Cheng, S. Effect analysis of generator governor system and its frequency mode on inter-area oscillations in power systems. Int. J. Elect. Power Energy Syst. 2018, 96, 1–10. [Google Scholar] [CrossRef]
  6. Schleif, F.R.; Martin, G.E.; Angell, R.R. Damping of system oscillations with a hydrogenerating unit. IEEE Trans. Power Appar. Syst. 1967, 86, 438–442. [Google Scholar] [CrossRef]
  7. Martinez, J.A.; Mork, B.A. Transformer Modeling for Low- and Mid-Frequency Transients—A Review. IEEE Trans. Power Deliv. 2005, 20, 1625–1632. [Google Scholar] [CrossRef]
  8. Leon, F.; Farazmand, A.; Joseph, P. Comparing the T and pi Equivalent Circuits for the Calculation of Transformer Inrush Currents. IEEE Trans. Power Deliv. 2012, 27, 2390–2398. [Google Scholar] [CrossRef]
  9. Jazebi, S.; Zirka, S.E.; Lambert, M.; Rezaei-Zare, A.; Chiesa, N.; Moroz, Y.; Chen, X.; Martinez-Duro, M.; Arturi, C.M.; Dick, E.P.; et al. Duality Derived Transformer Models for Low-Frequency Electromagnetic Transients—Part I: Topological Models. IEEE Trans. Power Deliv. 2016, 31, 2410–2419. [Google Scholar] [CrossRef]
  10. Mork, B.A.; Gonzalez, F.; Ishchenko, D.; Stuehm, D.L.; Mitra, J. Hybrid Transformer Model for Transient Simulation—Part I: Development and Parameters. IEEE Trans. Power Deliv. 2007, 22, 248–255. [Google Scholar] [CrossRef]
  11. Zhang, R.; Bai, Y.; Huang, R.; Fu, Y. Cause Analysis and preventive measures of low frequency oscillation in power supply side of power supply terminal. Guizhou Electr. Power Technol. 2013, 16, 15–17. [Google Scholar]
  12. Wang, Y.; Chang, R.; Chang, X.; Guo, X. Study on the key technology of identifying the type of low frequency oscillation and locating the disturbance source in power grid. Xinjiang Electr. Power Technol. 2015, 2, 1–7. [Google Scholar]
  13. Li, Y.; Pan, J.; Yang, T.; Huang, S.; Gao, W. Status and development of low frequency oscillation monitoring and suppression technology in Power Grid. Hubei Electr. Power 2014, 38, 8–16. [Google Scholar]
  14. Zhang, X.; Chen, J.; Zhang, G.; Wang, L.; Qiu, R.; Liu, Z. An active oscillation compensation method to mitigate high-frequency harmonic instability and low-frequency oscillation in railway traction power supply system. IEEE Access 2018, 6, 70359–70367. [Google Scholar] [CrossRef]
  15. Chen, F.; Yang, X.; Liu, L.; Ma, X.; Zhang, L.; Yu, Y. Study on the influence of HVDC to low frequency oscillation in interconnected power system. In Proceedings of the 2018 2nd IEEE Conference on Energy Internet and Energy System Integration (EI2), Beijing, China, 20–22 October 2018; pp. 1–5. [Google Scholar]
  16. Li, H.; Peng, K.; Chen, Y.; Guo, L.; Li, P.; Li, X. Mechanism Analysis of Low Frequency Oscillation on DC Voltage Control Time Scale in DC Distribution System. High Volt. Eng. 2021, 47, 2232–2239. [Google Scholar]
  17. Chen, H.; Huang, H.; Zhang, Y.; Su, Y. Researches on DC modulation to damp low frequency oscillation in China Southern Power Grid. In Proceedings of the 2015 IEEE Power & Energy Society General Meeting, Denver, CO, USA, 5 October 2015; pp. 1–6. [Google Scholar]
  18. Gao, H.; Zhan, X.; Jiang, X.; Wu Jie Yang, Q. Research on mechanism of power system low frequency oscillation based on damping coefficient. In Proceedings of the 2017 4th International Conference on Electrical and Electronics Engineering, Ankara, Turkey, 8–10 April 2017; pp. 99–103. [Google Scholar]
  19. Yang, J.; Hu, H.; Zhou, Y.; Tao, H.; Zhao, C.; He, Z. Analysis of low frequency Oscillation suppression in Traction Power Supply System. Electrified Railw. 2018, 29, 15–28. [Google Scholar]
  20. Zhou, Y.; Hu, H.; Yang, X.; He, Z. Railway Electrification System. Chin. J. Electr. Eng. 2017, 37, 72–80. [Google Scholar]
  21. Zha, W.; Yuan, Y. Mechanism of active-power-PSS low-frequency oscillation suppression and characteristic of anti-regulation. In Proceedings of the 2011 Third International Conference on Measuring Technology and Mechatronics Automation, Shanghai, China, 6–7 January 2011; pp. 538–541. [Google Scholar]
  22. Lu, S.; Zhang, W.; Wang, T.; Cai, Y.; Li, H.; Zhu, T.; Gang, Y.; Yu, Y. Parameter Tuning and simulation analysis of PSS function in excitation system with suppression of low frequency oscillation. In Proceedings of the 2019 IEEE 8th International Conference on Advanced Power System Automation and Protection, Xi’an, China, 21–24 October 2019; pp. 474–479. [Google Scholar]
  23. Pan, Y.; Yang, Y.; He, J.; Ariya, S.; Frede, B.; Ariya, S.; Frede, B. Low-frequency oscillation suppressi-bregeon in series resonant dual-active-bridge converters under fault tolerant operation. In Proceedings of the 2019 IEEE Energy Conversion Congress and Exposition, Baltimore, MD, USA, 29 September–3 October 2019; pp. 1499–1505. [Google Scholar]
  24. Zhou, Y.; Hu, H.; Lei, K.; Meng, Z.; He, Z. Low frequency constant amplitude oscillation mechanism of railway electrification system. Chin. J. Electr. Eng. 2020, 36, 295–314. [Google Scholar]
  25. Zhou, Y.; Hu, H.; Jiang, X.; He, Z.; Zhao, C. Study on voltage resonance of Low Frequency Power Supply Network for Traction Power Supply. Grid Technol. 2016, 40, 1830–1838. [Google Scholar]
  26. Monteiro, T.C.; Martinz, F.O.; Matakas, L.; Komatsu, W. Transformer Operation at Deep Saturation: Model and Parameter Determination. IEEE Trans. Ind. Appl. 2012, 48, 1054–1063. [Google Scholar] [CrossRef]
  27. Casoria, S.; Sybille, G.; Brunelle, P. Hysteresis modeling in the MATLAB/Power System Blockset. Math. Comput. Simul. 2003, 63, 237–248. [Google Scholar] [CrossRef]
  28. Moses, P.S.; Masoum, M.A.S.; Toliyat, H.A. Dynamic Modeling of Three-Phase Asymmetric Power Transformers with Magnetic Hysteresis: No-Load and Inrush Conditions. IEEE Trans. Energy Convers. 2010, 25, 1040–1047. [Google Scholar] [CrossRef]
  29. Hassani, V.; Tjahjowidodo, T.; Do, T.N. A survey on hysteresis modeling, identification and control. Mech. Syst. Signal Process. 2014, 49, 209–233. [Google Scholar] [CrossRef]
  30. Leite, J.V.; Benabou, A.; Sadowski, N.; da Luz, M.V.F. Finite Element Three-Phase Transformer Modeling Taking into Account a Vector Hysteresis Model. IEEE Trans. Magn. 2009, 45, 1716–1719. [Google Scholar] [CrossRef]
  31. Yao, C.; Wang, X.; Bi, C.; Zhang, Y.; Jin, C. An approach to suppress low-frequency oscillation in electrification railway based on TCSC impedance control. In Proceedings of the 2018 IEEE 2nd International Electrical and Energy Conference (CIEEC), Beijing, China, 4–6 November 2018; pp. 110–113. [Google Scholar]
  32. Bi, C.; Wang, X.; Yao, C.; Pang, K.; Jin, C. Analysis and evaluation of suppression methods on low-frequency oscillation in electric railways. In Proceedings of the 2018 IEEE 2nd International Electrical and Energy Conference (CIEEC), Beijing, China, 4–6 November 2018; pp. 56–63. [Google Scholar]
  33. Zhou, G.; Tan, W.; Zhou, S.; Wang, Y.; Ye, X. Analysis of Pulse Train Controlled PCCM Boost Converter with Low Frequency Oscillation Suppression. IEEE Access 2018, 6, 68795–68803. [Google Scholar] [CrossRef]
  34. Sun, J.; Hu, K.; Fan, Y.; Liu, J.; Yan, S.; Zhang, Y. Modeling and Experimental Analysis of Overvoltage and Inrush Current Characteristics of the Electric Rail Traction Power Supply System. Energies 2022, 15, 9308. [Google Scholar] [CrossRef]
  35. Fan, L.; Li, N.; Wang, H. Analysis of low frequency oscillation of damping power system with controllable series capacitor compensation device. Power Grid Technol. 1998, 22, 35–39. [Google Scholar]
  36. Sun, J.; Mehrotra, V. Orthogonal winding structures and design for planar integrated magnetics. In Proceedings of the IEEE APEC, Anaheim, CA, USA, 22–26 February 2004; pp. 933–938. [Google Scholar]
  37. Sun, Y.; Zheng, W.; Xu, W. A new method to model the harmonic generation characteristics of the thyristor controlled reactors. In Proceedings of the Power Tech, Lausanne, Switzerland, 1–5 July 2007; IEEE: New York, NY, USA, 2007; pp. 1785–1790. [Google Scholar]
  38. Tylavsky, D.J.; Brown, K.A.; Ma, T.T. Closed form solution for underground impedance calculations. Proc. IEEE 1986, 74, 1290–1292. [Google Scholar] [CrossRef]
  39. Tylavsky, D.J. Conductor Impedance Approximations for Deep-Underground Mines. IEEE Trans. Ind. Appl. 1987, 23, 723–730. [Google Scholar] [CrossRef]
  40. Wait, J. Quasi-Static Limit for the Propagating Mode along a Thin Wire in a Circular Tunnel. IEEE Trans. Antennas Propag. 1977, 25, 441–443. [Google Scholar] [CrossRef]
  41. Hongyi, Z.; Zhigang, L.; Ye, C.; Ke, H. Extended black-box model of pantograph arcing considering varying pantograph detachment distance. In Proceedings of the 2017 IEEE Transportation Electrification Conference and Expo, Asia-Pacific, Harbin, China, 7–10 August 2017. [Google Scholar]
  42. Liu, Y.J.; Chang, G.W.; Huang, H.M. sMayr’s equation-based model for pantograph arc of high-speed railway traction system. IEEE Trans. Power Deliv. 2010, 25, 2025–2027. [Google Scholar] [CrossRef]
  43. Qu, Z.J.; Liu, Y.X.; Zhou, M.; Jiang, J.J.; Liu, L. Over-voltage suppression of electric railway articulated neutral insulator. Adv. Mater. Res. 2013, 791–793, 1837–1840. [Google Scholar] [CrossRef]
  44. Wang, Y.; Liu, Z.; Mu, X.; Song, X.; Huang, K.; Deng, Y. Research on electromagnetic transient process in articulated split-phase insulator of high-speed railway considering viaduct’s electrical coupling. Int. Trans. Electr. Energy Syst. 2017, 27, e2376. [Google Scholar] [CrossRef]
  45. Zhang, F.; Fang, D.; Song, W.; Chen, J. Study on a novel two-stage control method for UPFC with damping tie-line low-frequency Oscillation. In Proceedings of the 21th Annual Conference of Power System Automation, Shanghai, China, 18–21 January 2005; pp. 1039–1044. [Google Scholar]
Figure 1. Transient process of the EMU passing the phase-division zone.
Energies 16 05848 g001
Figure 2. Train operating current and voltage (RMS value).
Energies 16 05848 g002
Figure 3. Train overcurrent split-phase voltage waveform.
Energies 16 05848 g003aEnergies 16 05848 g003b
Figure 4. Harmonic frequency analysis of the voltage in the neutral zone.
Energies 16 05848 g004
Figure 5. Structure of the double-wire full parallel AT traction net.
Energies 16 05848 g005
Figure 6. Equivalent circuit diagram of the overphase division of the EMU.
Energies 16 05848 g006
Figure 7. A source, power-supply line, and train-system simulation model.
Energies 16 05848 g007
Figure 8. The EMU enters the electric split-phase simulation model.
Energies 16 05848 g008
Figure 9. Frequency spectrum of low-frequency oscillation network voltage in the phase-separated neutral zone.
Energies 16 05848 g009
Figure 10. Abnormal low-frequency oscillation phenomenon in the neutral zone.
Energies 16 05848 g010
Figure 12. Step response under different capacitance values (the resistance R2 at 200 Ω remains unchanged).
Energies 16 05848 g012
Figure 13. Step response under different resistance and capacitance values.
Energies 16 05848 g013
Figure 14. Equivalent circuit diagram of the EMU in the neutral zone (with an additional RC device).
Energies 16 05848 g014
Figure 15. Voltage waveform of the neutral zone.
Energies 16 05848 g015
Table 1. Main test equipment.
Serial NumberNameModelTest Standard, Accuracy
1Data acquisitionHS40.1% (12 bit)
5Voltage probe——100 V/2 V, 1%
6Current SensorPQ5 (U.S. Fluke)0~5 A, 40~2 kHz, 2%
Table 2. Harmonic frequency analysis data of the grid voltage waveform in the neutral zone.
Frequency (Hz)Percentage (%)Frequency (Hz)Percentage (%)
06.04133.3313.36
16.671001506.86
33.336.29166.6710.89
5031.34183.339.81
66.679.532006.12
83.3310.73216.676.88
10012.07233.332.81
116.674.602503.17
Table 3. Equivalent circuit distributed capacitance calculation results.
cT1R1P1F1T2R2P2F2
T113.12−0.83−1.74−2.04−2.00−0.41−0.36−0.56
R1−0.8320.12−0.63−0.23−0.41−0.44−0.12−0.09
P1−1.74−0.638.42−1.12−0.36−0.12−0.08−0.11
F1−2.04−0.23−1.128.28−0.56−0.09−0.11−0.26
T2−2.00−0.41−0.36−0.5613.12−0.83−1.74−2.04
R2−0.41−0.44−0.12−0.09−0.8320.12−0.63−0.23
P2−0.36−0.12−0.08−0.11−1.74−0.638.42−1.12
F2−0.56−0.09−0.11−0.26−2.04−0.23−1.128.28
Table 4. Voltage transformer inductance parameters.
Serial NumberJDZXW5-25JJDZXW5A-25JJDZXW7-25D
EMU typeCRH3XCRH5XCR400XF
Primary DC resistance 20 °C43,160 Ω46,488 Ω43,160 Ω
Primary inductance11,000 H–12,000 H11,000 H–12,000 H11,000 H–12,000 H
Table 5. Maximum voltage in the neutral zone of the electrical split.
Phase Angle (°)Voltage (kV)Phase Angle (°)Voltage (kV)Phase Angle (°)Voltage (kV)
046.7012051.7824069.75
1052.2513048.3725068.85
2056.1514045.1026067.61
3058.8015040.5327064.44
4060.6416041.8028062.25
5062.3017045.3929061.29
6066.2218050.1130057.81
7066.1219055.0431053.40
8064.1120059.5732048.50
9064.9821062.0033044.55
10059.2522065.1734043.84
11057.0123067.8435042.74
Disclaimer/Publisher’s Note: The statements, opinions and data contained in all publications are solely those of the individual author(s) and contributor(s) and not of MDPI and/or the editor(s). MDPI and/or the editor(s) disclaim responsibility for any injury to people or property resulting from any ideas, methods, instructions or products referred to in the content.

