Article

Multi-Performance Characterization of a Modular Wooden House

1
CONSTRUCT, Faculty of Engineering, University of Porto, Rua Dr. Roberto Frias, 4200-465 Porto, Portugal
2
Instituto Politécnico de Viseu, Campus Politécnico, 3504-510 Viseu, Portugal
3
LEPABE—Laboratory for Process Engineering, Environment, Biotechnology and Energy, Faculty of Engineering, University of Porto, Rua Dr. Roberto Frias, 4200-465 Porto, Portugal
4
ALiCE—Associate Laboratory in Chemical Engineering, FEUP, 4200-465 Porto, Portugal
5
ARCP—Associação Rede de Competência em Polímeros, 4200-355 Porto, Portugal
*
Author to whom correspondence should be addressed.
Energies 2023, 16(15), 5795; https://doi.org/10.3390/en16155795
Submission received: 7 July 2023 / Revised: 21 July 2023 / Accepted: 2 August 2023 / Published: 4 August 2023
(This article belongs to the Section B: Energy and Environment)

Abstract

:
Although not a new concept, modular construction has been the target of increasing interest and investment in recent years. Modular wood construction systems have economic and environmental advantages, as wood is a natural and locally available raw material with interesting thermal properties. In this context, the BlueWoodenHouse Project, a closed cooperation project between academy and industry, aims to improve the actual knowledge of modular wood construction in Portugal. Among other objectives, the project aims to characterize the solutions, systems, and materials used in wooden modular construction, specifically in a modular wooden, single-family house in full use. Afterward, the house was monitored for 1 year (temperature, relative humidity, and CO2) and the data collected were analyzed and the interior thermal comfort was evaluated. The results of CO2 concentration monitoring indicate adequate air renewal rates, except for some periods in the bedroom, during the night. Additionally, application of the adaptive comfort model proposed by the EN 16798-2 standard resulted in a percentage of time in discomfort due to overcooling ranging between 31.3% and 38.6%. However, most of these periods may correspond to times when there is no occupancy of these spaces.

1. Introduction

Modular construction is a construction methodology in stages, starting from the standardization of the parts that configure a house or a building. Thus, the modules are transported one by one and assembled to form the construction. Even though standardized, the modules can be fitted in different ways, the dimensions of the modules, the finishes and the architecture are fully customizable to suit specific need or preferences. The modular houses or buildings can be made with different materials, such as concrete, steel, wood. In recent years, the dynamics around the construction of modular buildings has increased significantly, arousing the interest of potential buyers and investors. Compared to traditional construction methods, modular construction has several advantages, such as: less labor requirements on the site, greater speed and safety in construction processes, construction processes are more ecological and environmentally friendly, and the planning of the construction is more predictable, minimizing the waste of resources [1,2,3,4].
Modular construction is not a new concept; it has already been widely used in several countries, such as the US, Japan, the UK, and Sweden, and has become very popular in China, Hong Kong, Australia, Germany, and the Netherlands. Several examples of modular buildings are described in the literature in the form of small tourist accommodation, hotels, schools, student residences, social housing, hospitals, offices and apartments [5,6,7].
On the other hand, several studies have shown that in situations of housing deficit, in which the pressure for new constructions is high, the modular construction system, being faster, is more efficient in responding to global needs, when compared to construction traditional methods [8]. Another important aspect is the growing concern and demand in the field of sustainability in civil construction, essential to reduce economic, environmental and social impacts. Traditional building construction is responsible for more than 30% of waste production, energy consumption and carbon dioxide emissions [9]. In more detail, construction waste is responsible for approximately 20% of all waste in landfills, reaching more than 50% in countries such as the USA and the UK [10,11,12].
Using more eco-friendly materials and modular construction seem an efficient way to contribute to a more sustainable and technological construction industry. Wood is an organic, renewable material unlike its main competitors, concrete, steel, and aluminum. Light wooden-structured buildings have many advantages compared with the buildings made of other materials such as, concrete, brick, or stone, namely: (i) the raw materials are renewable, (ii) higher insulation performance and energy-saving, (iii) the design is more flexible, (iv) reduced construction time [13,14]. These modular houses can be built with wood and wood-based panels. Wood-based materials can be used as structural or non-structural components, in dry, humid, or external conditions (EN 13986+A1) [15].
One of the most recent structural products is CLT (cross-laminated timber) that consists of several layers of timber laminations stacked crosswise. CLT panels play a fundamental role in the accelerating use of wood in construction. It should be taken into account that CLT panels have numerous advantages when compared to traditional wooden light-frame construction, namely their greater rigidity, resistance, and dimensional stability, in addition to greater ease of connection of the panels used [16,17]. Within the wide range of wood-based panels on the market, the oriented-strand board (OSB) panel is one of the most used in modular wooden construction. OSB panels are made up of multiple layers of wood strands pressed together with a binder and with a predetermined shape and thickness. These wood strands, which make up the OSB planks, are randomly oriented or aligned at right angles to the strands of the outer layers in the center layers and are aligned and parallel to the length or width of the panel in the outer layers (EN 300) [18]. OSB can be used in floors, walls, and roofs. Another recent material that can be used in modular wooden houses is modified wood. Thermally modified wood is wood which has been exposed to high temperatures, normally above 160 °C, and under conditions of lower oxygen availability. Thus, due to the effect of high temperatures, wood undergoes changes in its physical properties and in the composition of the cell wall material. Growing environmental concerns and the decreasing use of toxic preservatives and also a reduced need for maintenance have been the driving forces behind the increased interest of the market in modified wood. The thermal treatment improves the dimensional stability and resistance of wood against fungi and insects, but can be detrimental to mechanical properties. This process affects other properties such as color, odor, gluability, and coating performance [19]. However, despite the numerous advantages of modular construction, its acceptance is still limited and the construction sector continues to prefer the traditional method of construction based on brick masonry and reinforced concrete framed structures. This preference is even more evident in Mediterranean countries, and particularly in Portugal, where vernacular architecture is based on heavy construction where thermal inertia plays a crucial role. Insulation can be compatible with lighter constructive solutions, such as those in modular construction.
It is well-known that the most influential variables for an accurate thermal comfort prediction are associated with indoor environment quality standards, human behavior, and machine learning models. However, it should be noted that experimental results of real data of indoor environmental parameters of modular wooden houses are scarce in the literature [20,21].
The current work aimed to contribute to a better understanding of the in-service performance of modular wooden constructions, using as a case study, a single-family house, built in the municipality of Esposende, in the north of Portugal.

2. Case Study

2.1. Modular Wooden House

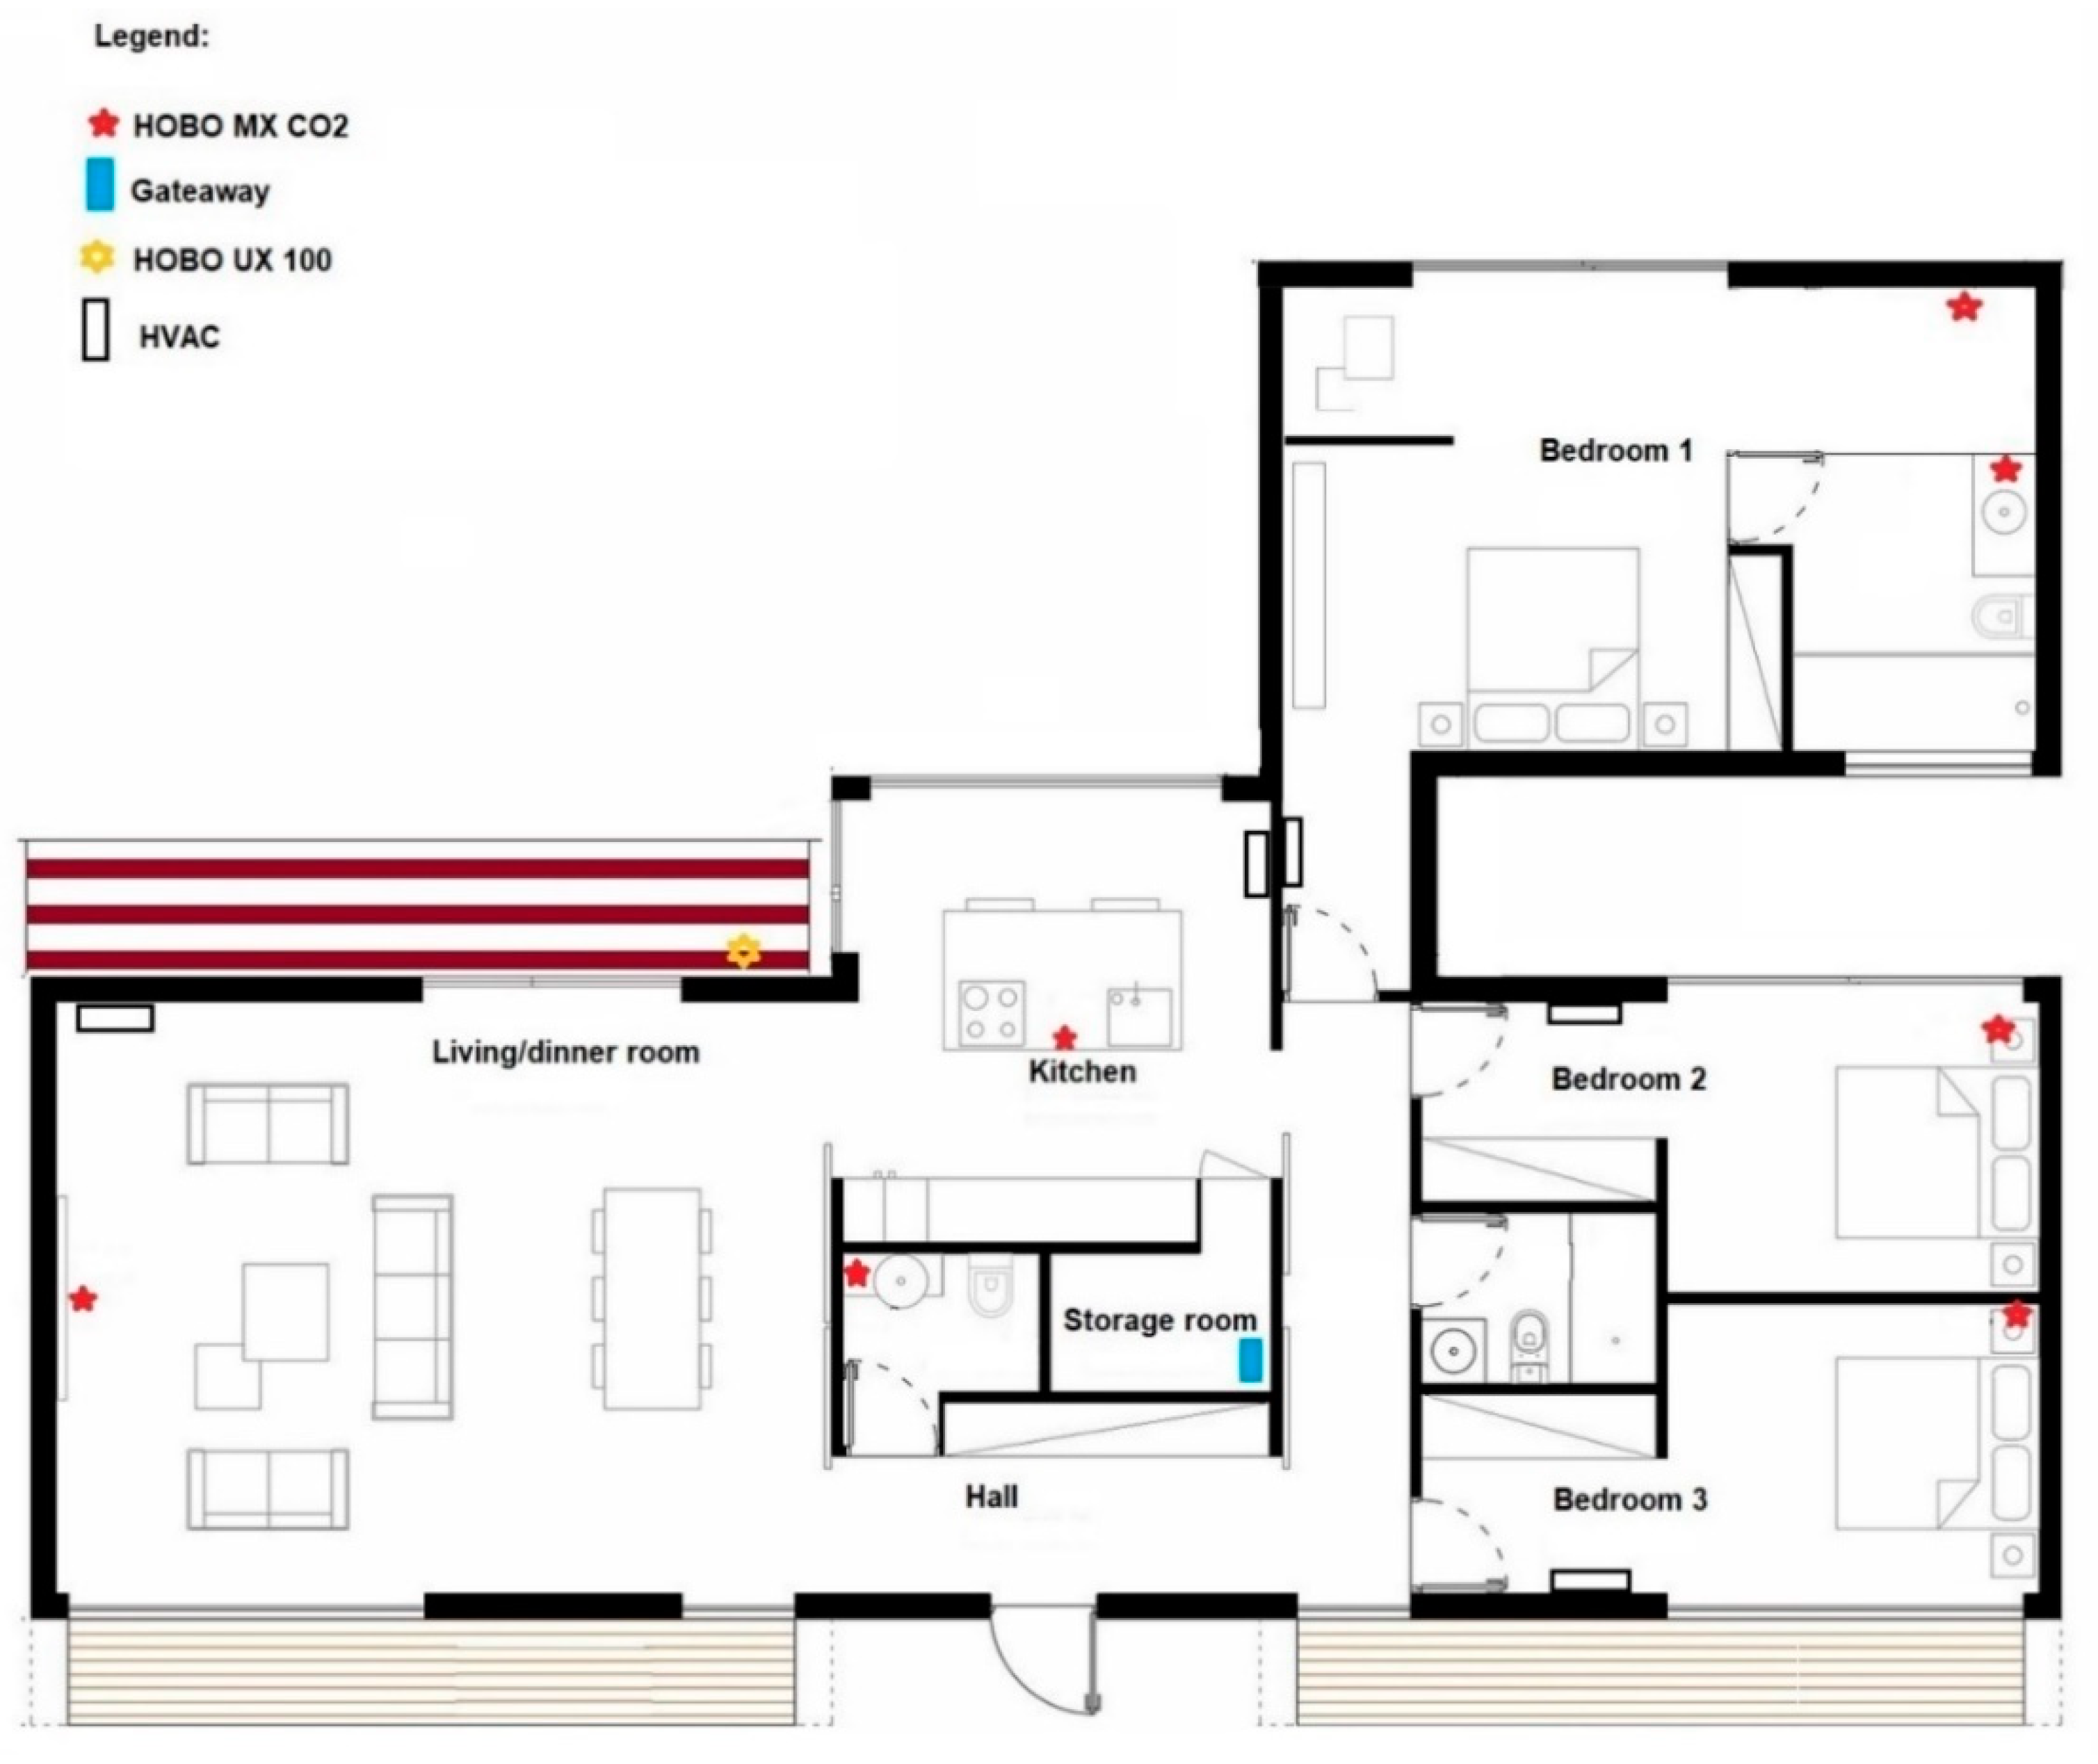
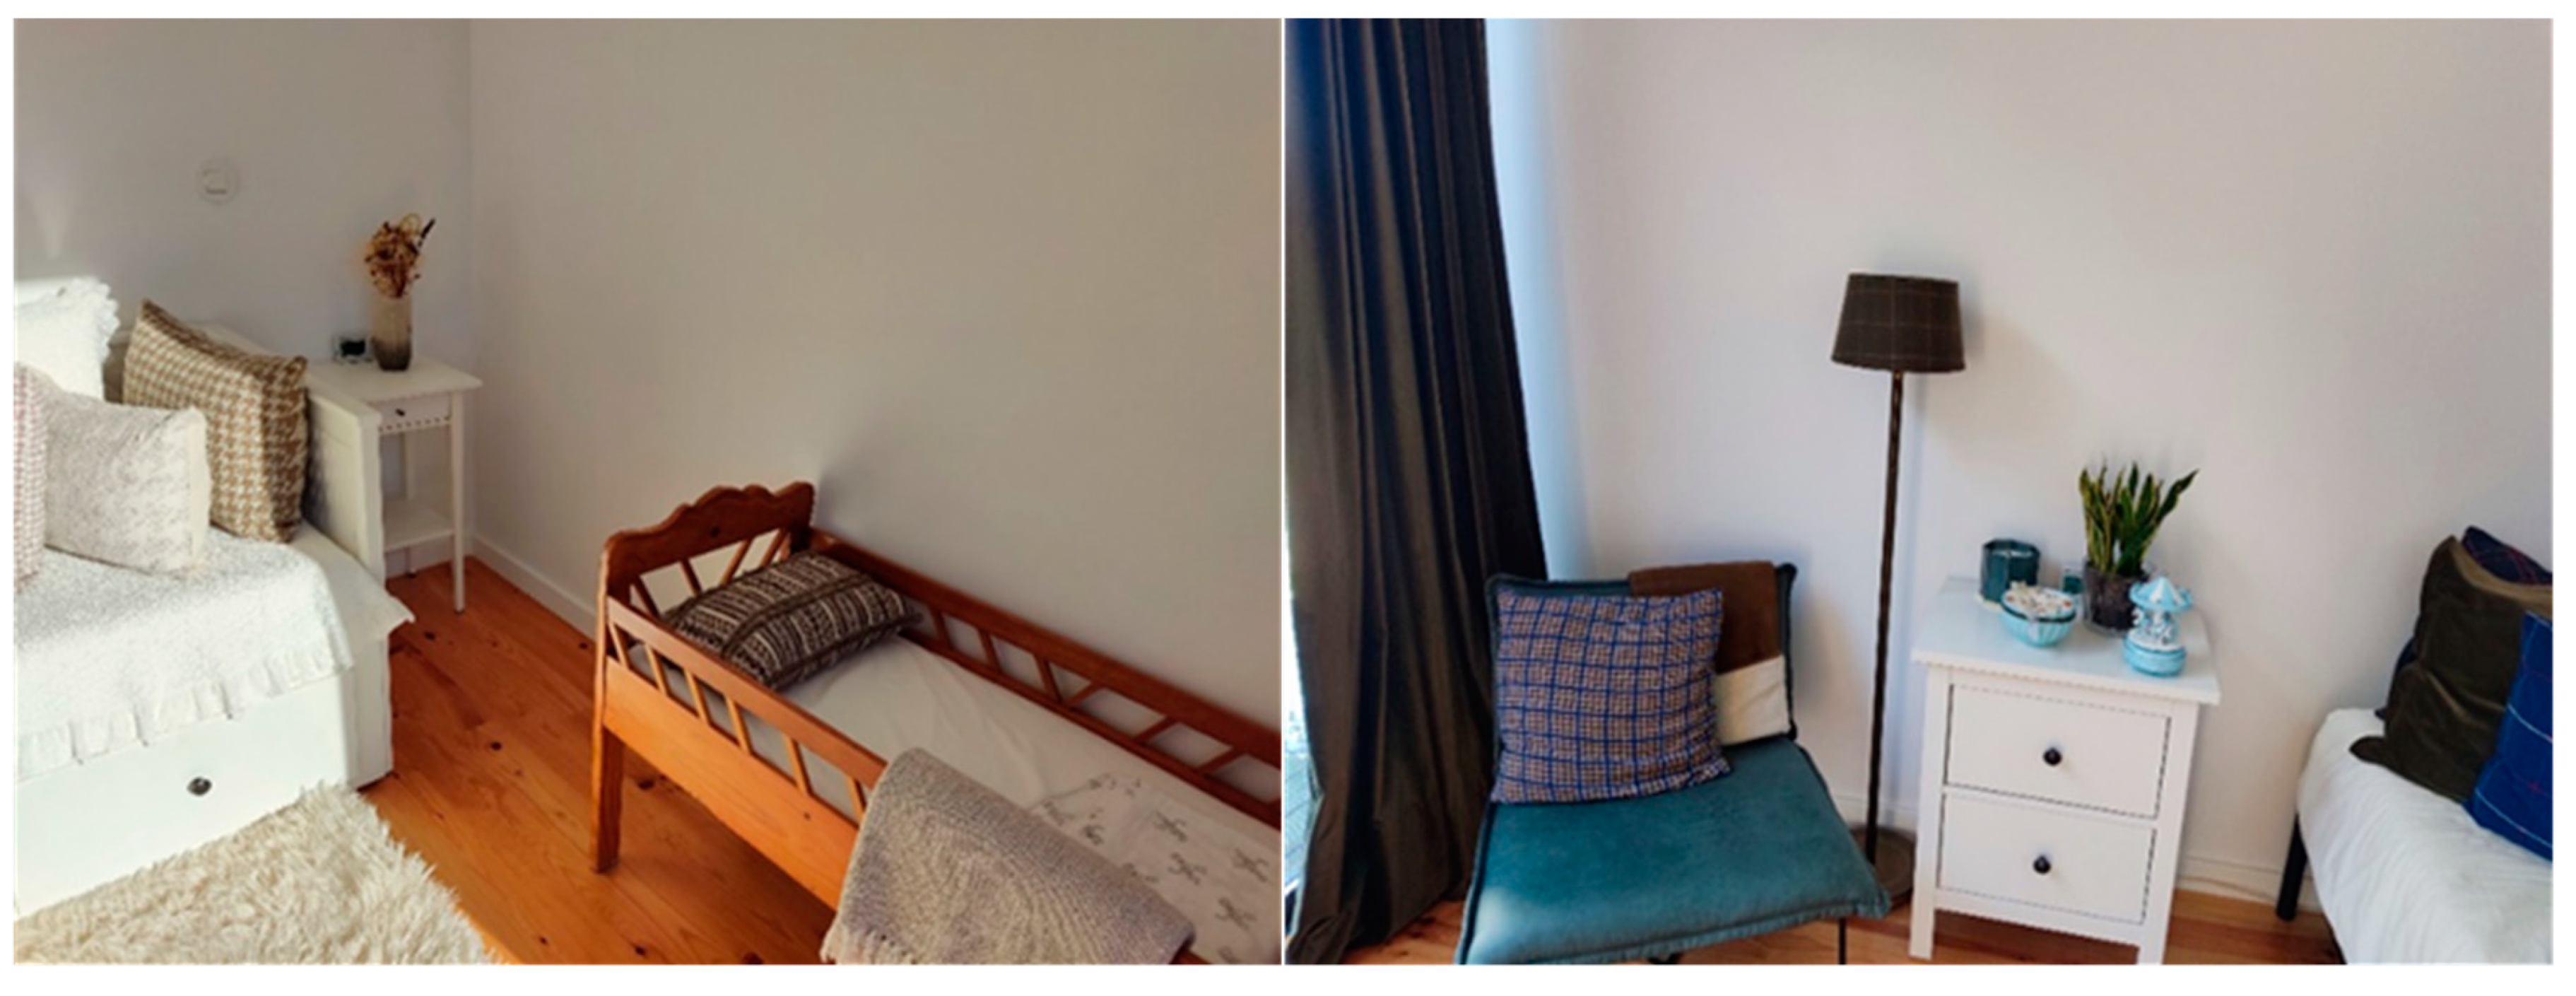
The study case is a single-family house manufactured by the leading company of the BlueWoodenHouse project consortium (http://bluewoodenhouse.com, accessed on 15 April 2023). The house, southeast-orientated, corresponds to a T3 (see Figure 1) with a covered area of 190 m2 and is located in the north of Portugal. Figure 2 shows the floor plan of the house as well as the sensor’s location (further detailed in Section 2.4).
The house has been in full use since 2019, and it is inhabited by a family of three people (a couple and one child). The energy sources and uses of the house are the following: (i) natural gas for cooking use; (ii) HVAC for space heating and cooling; (iii) heat pump for sanitary water heating. The average electricity bill is EUR 100 per month (information provided by the owner) and the energy consumption over one year (2022) is presented in Figure 3.

2.2. Constructive Solutions

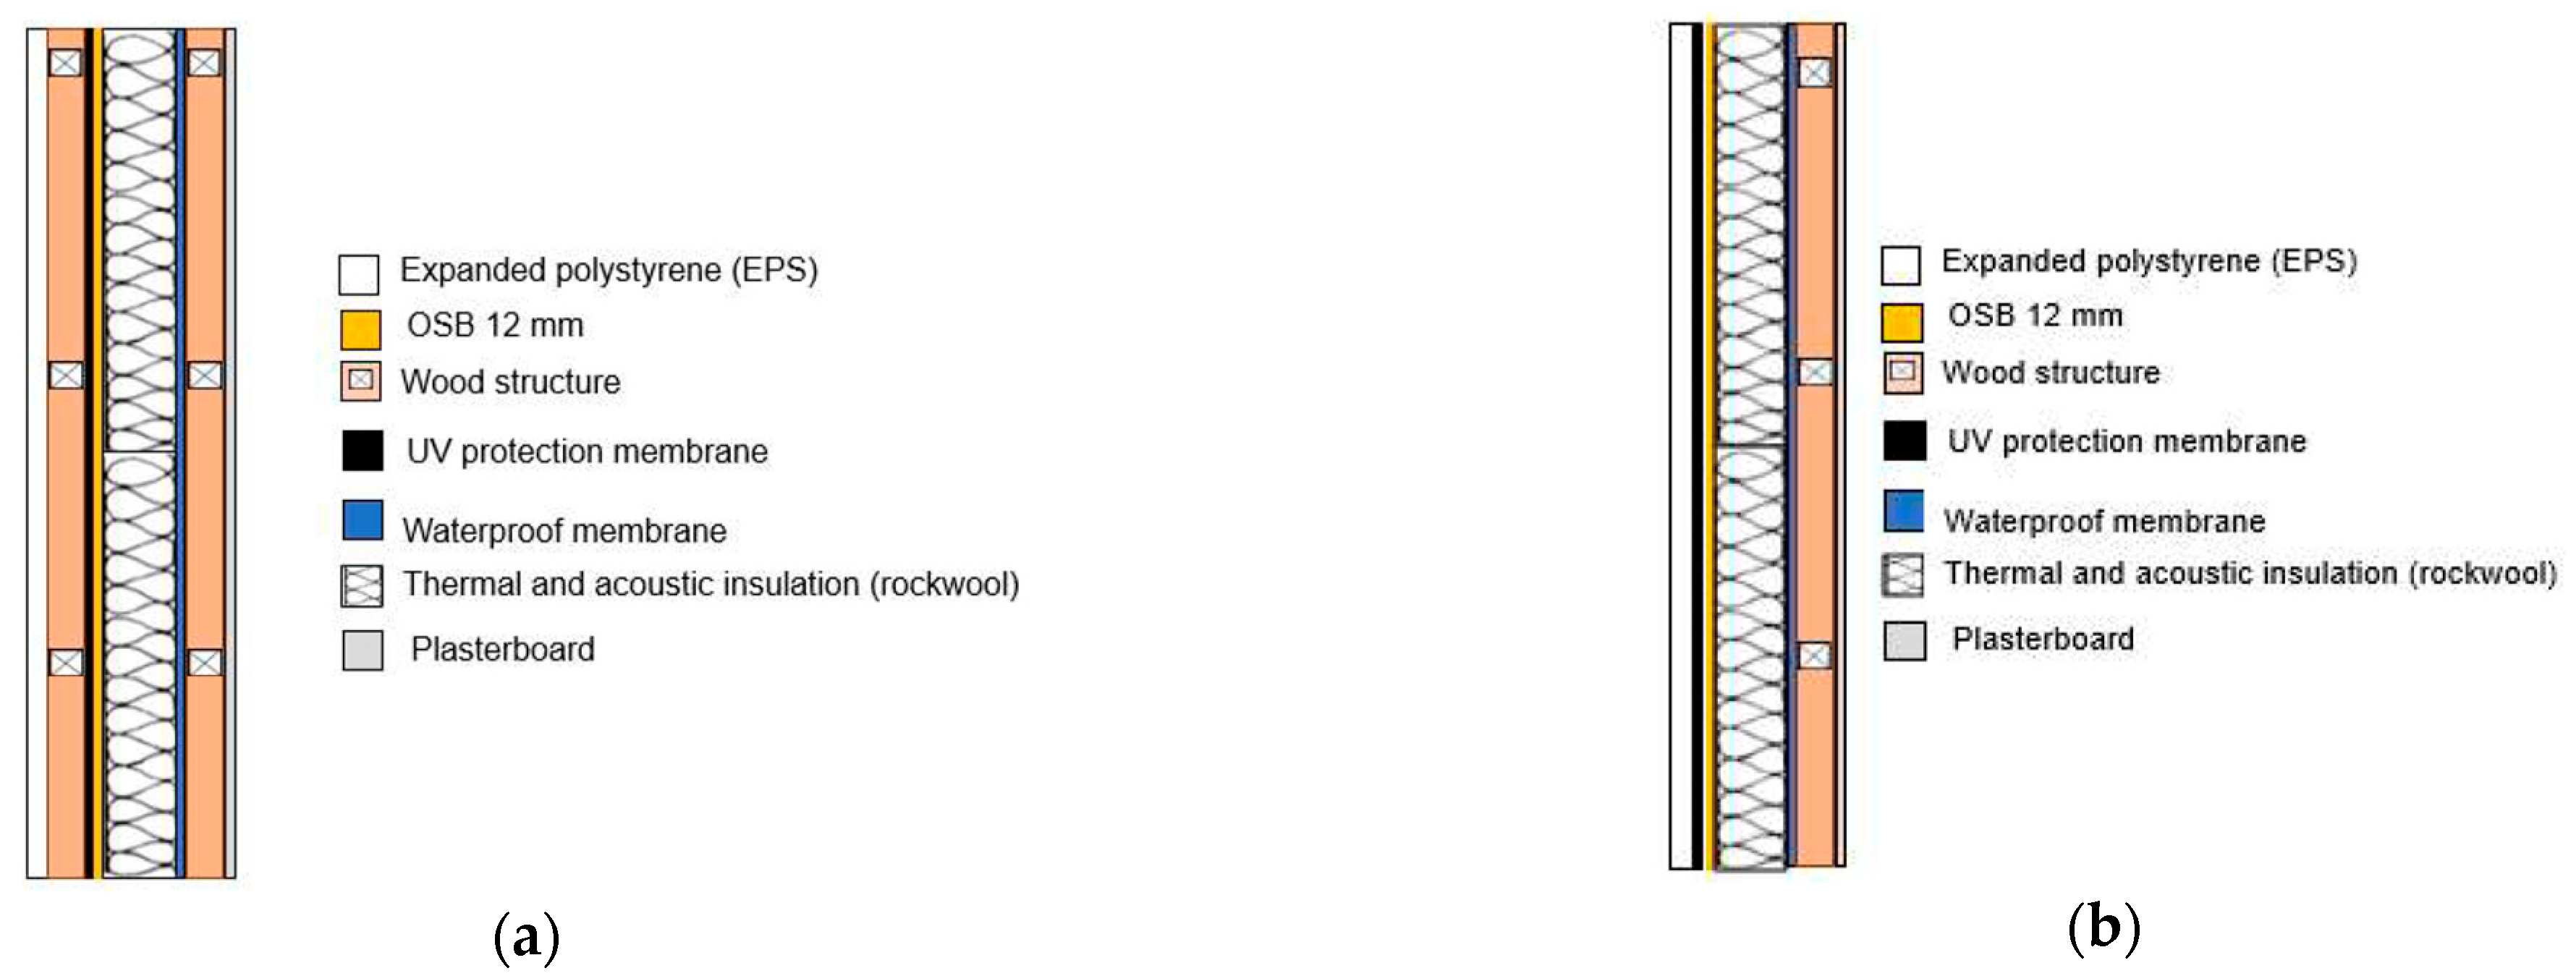
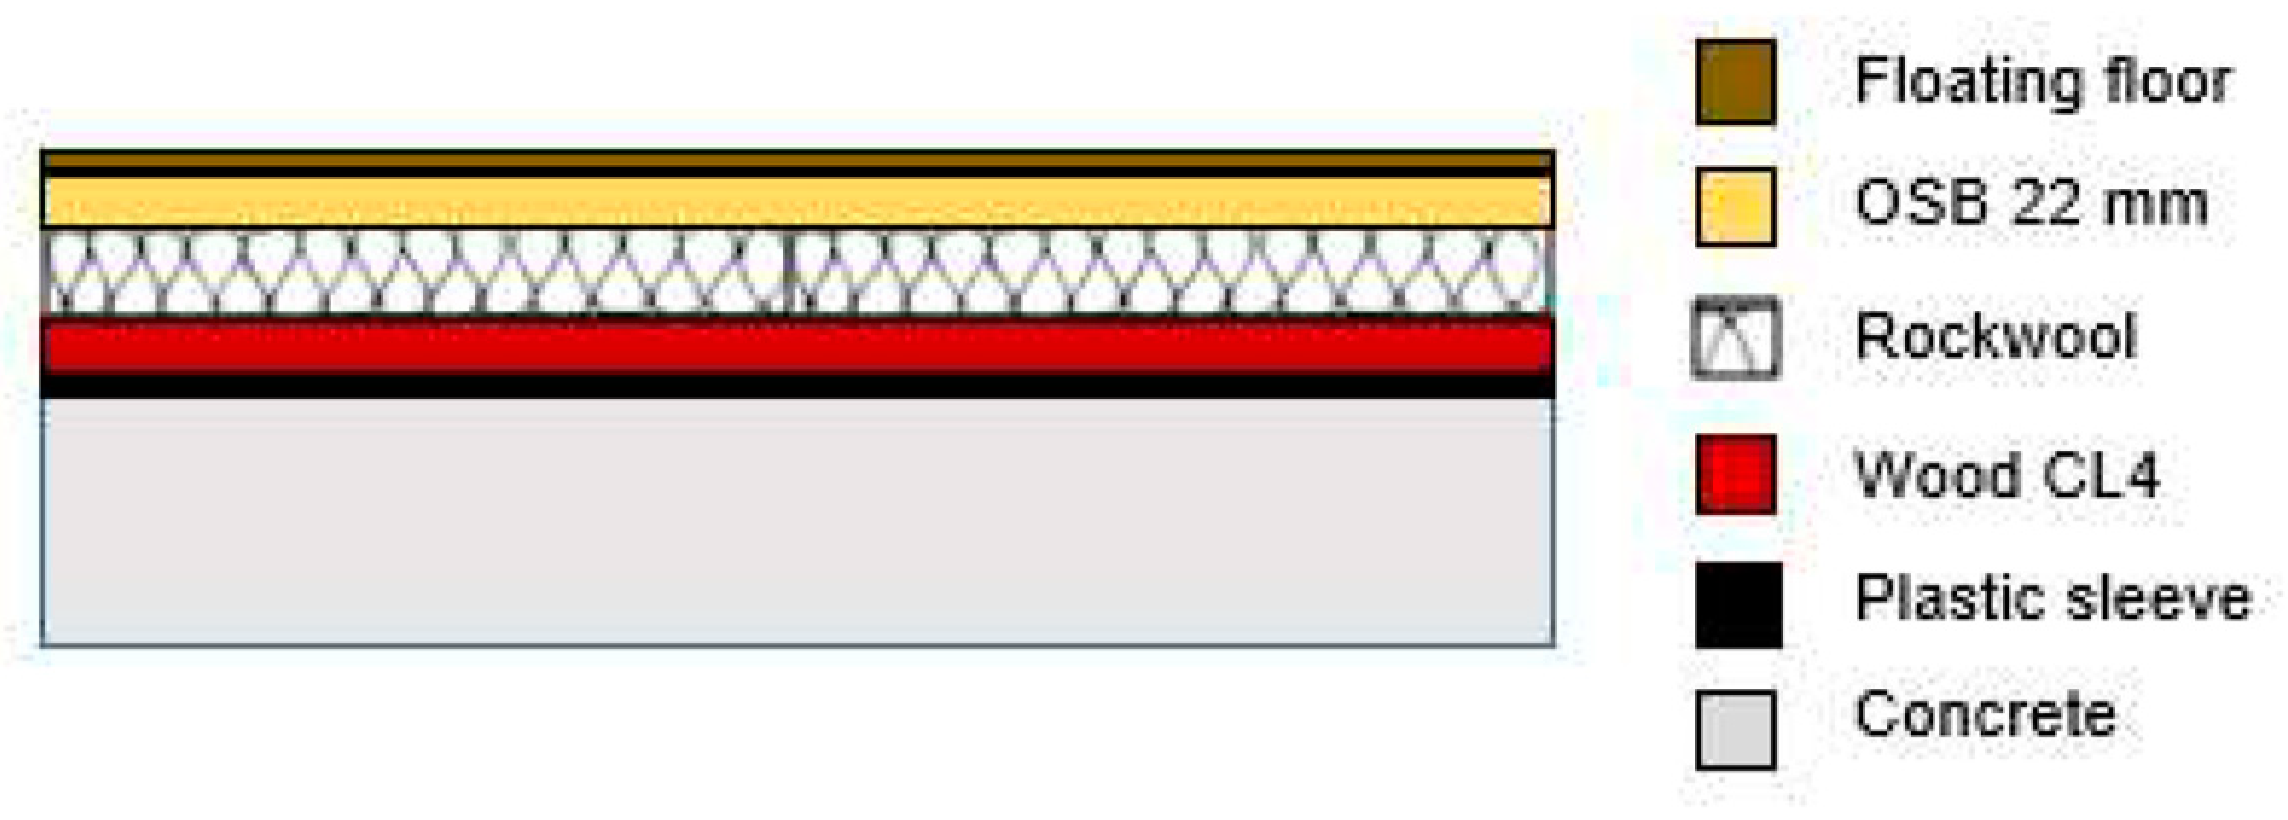
The exterior walls correspond to wooden profiles, with structural function, supporting loads, and transferred the foundation (foundations are the unique structural element made with conventional reinforced concrete). OBS boards with a thickness of 12 mm are incorporated in the wooden wall. There are two types of wood wall systems, named A and B. On the type-A external wall, see Figure 4a, the wood system involves the other materials, namely, OSB 12 mm board, rock wool as thermal and acoustic insulation, waterproofing, and plasterboard as an internal finish (see Figure 4a). In the type-B exterior wall, the wooden frame is located after the waterproof membrane (see Figure 4b). In both configurations, expanded polystyrene was applied as an external finish. The floor consists of a concrete base followed by CL4 wood (risk class 4), a plastic sleeve, rock wool, OSB, and a floating floor (see Figure 5).
The roof is flat and not accessible. The constructive solutions consist of a first layer of pebbles, followed by a layer of waterproof PVC, 22 mm OSB, a ventilation zone, breathable protection, rock wool, a vapor barrier, and as an interior finish, a false ceiling system. In addition to the above, the roof also has a plat band (see Figure 6).
In the exterior of the house, thermally modified wood (using the Thermowood® process [19]) was used as cladding. As can be perceived, the preferred thermal and acoustic insulation materials were rock wool (Rockwool) and expanded polystyrene (EPS).

2.3. Materials Characterization

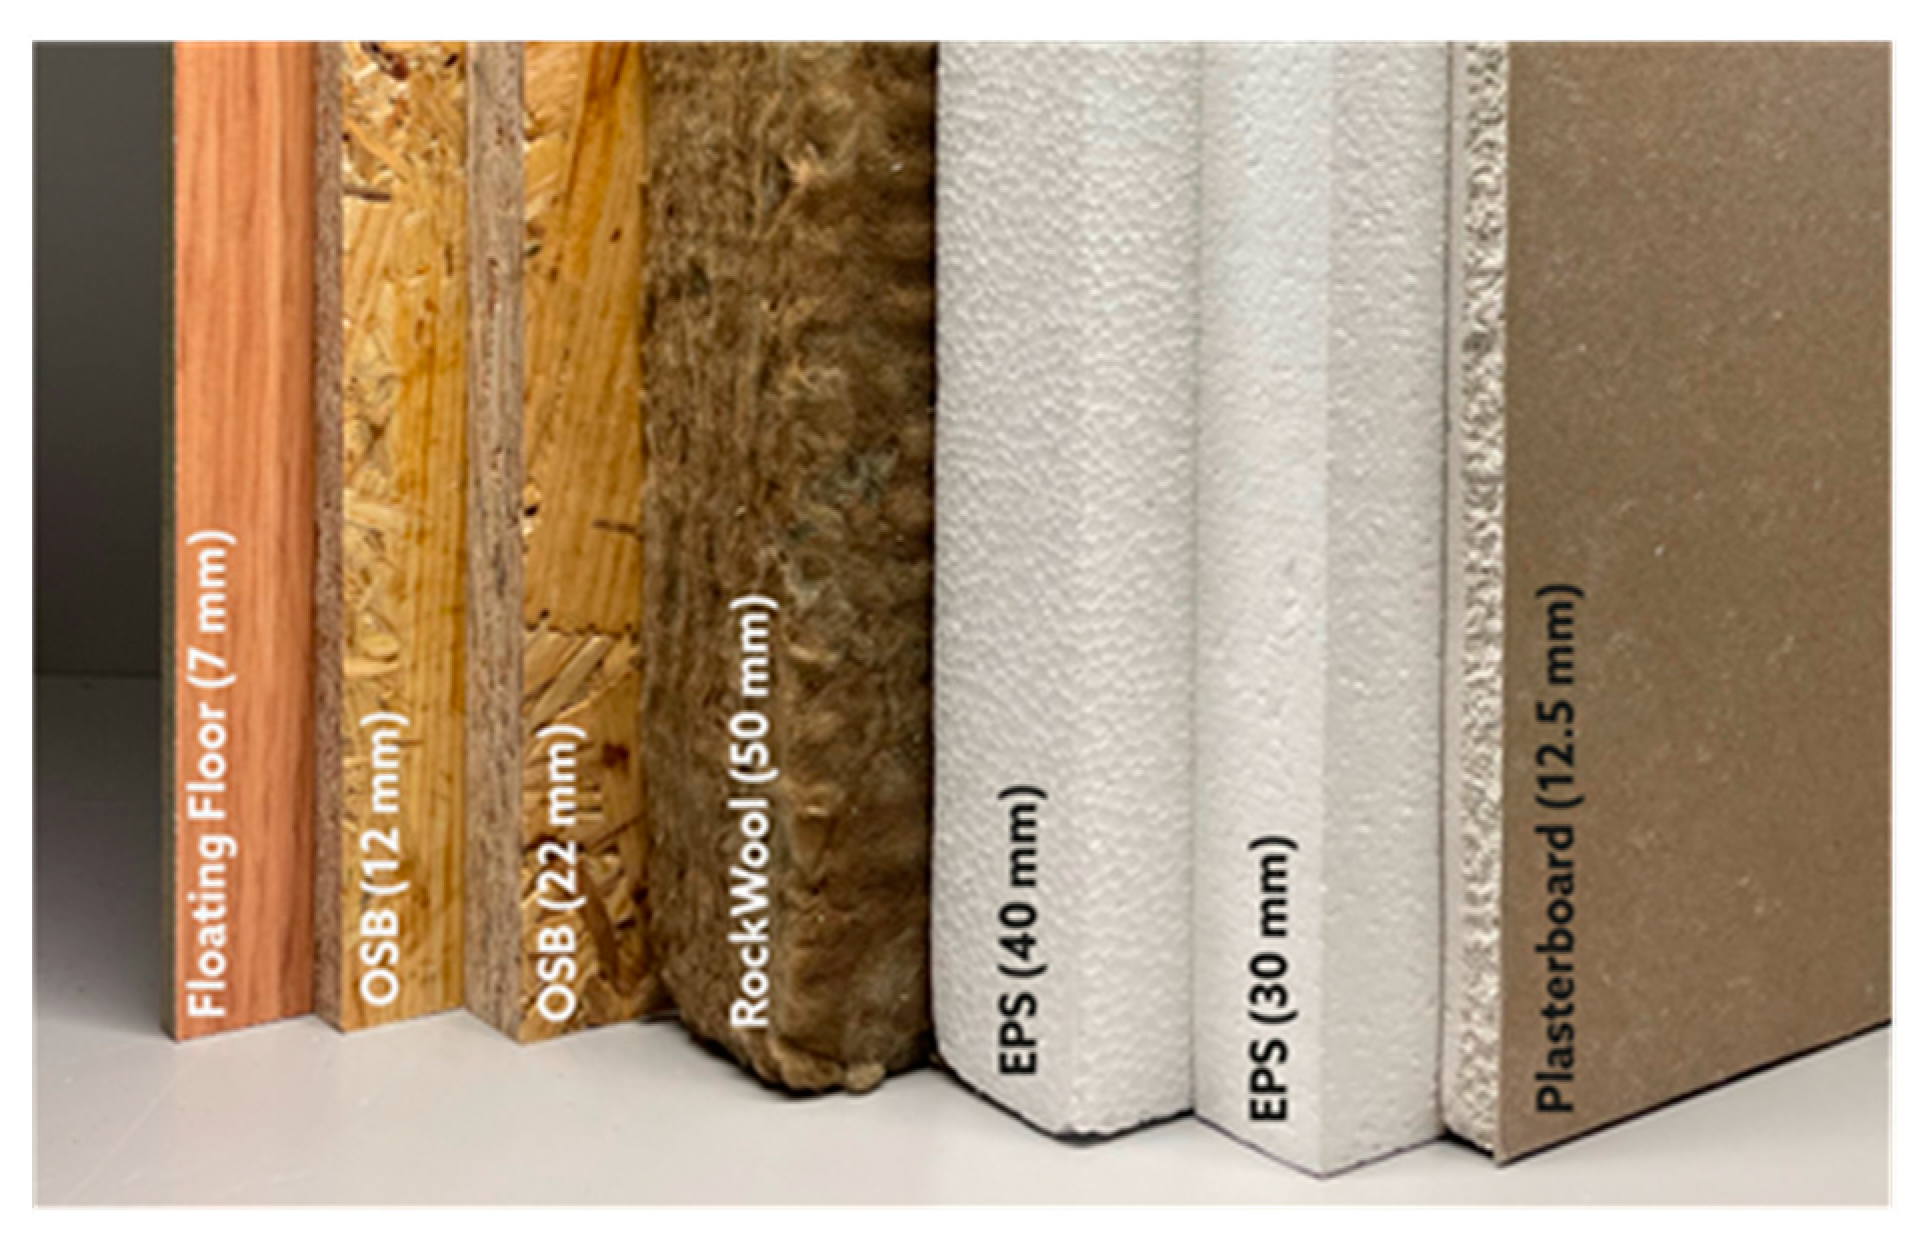
Material samples employed in the house under study (solutions described in Section 2.2) are shown in Figure 7. Samples of floating flooring with 7 mm, made of MDF (dry-process fiberboard) of high density, commercial HDF (High-Density Fiberboard) surfaced with melamine impregnated paper, OSB (oriented-strand board) (thicknesses of 12 and 22 mm), rock wool (thickness of 100 mm), EPS (thicknesses of 30 and 40 mm), and plaster wood (thickness of 12.5 mm) were provided by the company, KOZOWOOD, and several characterization tests were carried out.
The thermal conductivity of EPS (with 30 and 40 mm thickness), rock wool, OSB (with 30 and 40 mm thickness), floating floor, and plaster wood were determined following the EN 12667 [22] by means of a thermal conductivity measuring device (TCA 300 basic da NETZSCH Taurus Instruments, Weimar Deutschland)). Test results are presented in Table 1, and as expected, the thermal conductivity of the EPS and rock wool were the lowest, with values close to 0.03 W/m2K. For wood-based panels (OSB and floating floor in HDF), the results are slightly lower than the reference values indicated in EN 13986+A1 [15] for a similar density.
Additionally, OSB, flooring HDF, Thermowood®, and wood CL4 samples were stored in an airconditioned room (20 °C, 65% relative humidity) and were tested according to the European standards that described the test methods for density: D (EN 323 [23]), MC (EN 322 [24]), internal bond strength, IB (EN 319 [25]), bending strength (EN 310 [26]), thickness swelling over 24 h, and TS (EN 317 [27]), as summarized in Table 2.
In the case of OSB, bending strength is determined along the major axis (orientation of strands) or minor axis. Table 2 also specifies the required properties for OSB types: OSB/3 load-bearing boards for use in humid conditions and OSB/4 heavy-duty, load-bearing boards for use in moist conditions. The obtained values comply with the specifications for OSB or HDF surfaced with melamine. The same properties were determined for thermally modified wood or thermowood. For OSB, the formaldehyde content (F) of all samples was determined according to the perforator method (EN ISO 12460-5 [28]). In the case of the floating flooring (HDF surfaced with melamine-impregnated paper), the formaldehyde emission was determined using the gas analysis method (EN ISO 12460-3 [29]). Both materials have a low formaldehyde content and emission and can be classified as E1, as presented in Table 3.
In the case of solid wood of strength class CL 4 and thermowood, the density at 12% moisture content (NP 616 [30]) and shrinkage from green to oven-dry moisture content (NP 615 [31]) were also determined. These properties were compared with data from the literature for Pinus sylvestris L. [32], as presented in Table 4.
Table 2. Physico-mechanical properties of wood-based materials used in the house’s construction and specifications according to product standard.
MaterialThickness (mm)MC (%)D (kg/m3)TS (%)IB (N/mm2)BS (N/mm2)
OSB11.97 ± 0.037.4 ± 12.1644 ± 3012.1 ± 2.30.71 ± 0.06Major axis31.3 ± 3.6
Minor axis19.1 ± 1.6
OSB22 Major axis30.25 ± 5.4
Minor axis17.7 ± 1.6
EN 300 [18] (Type OSB/3)>10 to <18 150.32Major axis20
Minor axis10
EN 300 [18] (Type OSB/3)>18 to <22 120.4Major axis26
Minor axis14
Flooring HDF6.97 ± 0.016.2 ± 0.1966 ± 90.31.753.0 ± 1.1
EN 622-5 [33] (type MDF.HLS)>6 to <9 120.832
Thermowood®26.85 ± 0.078.0 ± 0.6561 ± 121.3 ± 0.1 47.9 ± 6.1
Wood CL428± 0.0110.7 ± 0.0438 ± 19--67.8 ± 2.8
Table 3. Formaldehyde content and emission for wood-based panels (OSB and flooring–HDF surface with melamine-impregnated paper.
MaterialFormaldehyde Emission (mg/m2 h)Formaldehyde Content
(mg/100 g Oven Dry Board)
Classification
EN 13986+A1 [15]
Flooring–HDF0.6 ± 0.04 E1
OSB (12 mm) 0.6 ± 0.07E1
Table 4. Shrinkage from green to oven-dry content for thermally modified wood and solid wood (strength class CL 4) and reference values for Pinus sylvestris L. [32].
MaterialEquilibrium Moisture Content
(20 °C; 65% RH)
Density
(kg/m3)
Shrinkage (%) from Green to Oven-Dry Moisture Content
TangentialRadialVolumetric
Thermowood® 7.9 ± 0.0550 ± 125.6 ± 0.33.5 ± 0.19.3 ± 0.2
Pinus sylvestris (non-treated)125507.54.013.4
Wood CL410.7 ± 0.0438 ± 198.0 ± 0.03.7 ± 0.311.9 ± 0.3

2.4. Monitoring Plan

The monitoring plan comprised equipment capable of measuring temperature (see Figure 8) relative humidity (RH), and CO2 concentration (ppm), namely: (i) seven HOBO MX CO2 sensors from Onset®, USA, distributed in different divisions of the house (kitchen, living room, suite, bathroom suite, bedroom 1, bedroom 2, WC service (see Figure 8)), with an acquisition every 15 min; (ii) one gateway that allows real-time monitoring of the HOBO MX CO2 (see Figure 9), through the HOBOLink application; a HOBO UX100 type sensor (temperature, RH) was attached to the outside, with acquisition every 15 min; however, it did not allow real-time monitoring and was only used to control external conditions.
Figure 2 (presented in Section 2.1) shows the floor plan of the house as well as the location of instrumentation and HVAC equipment. The instrumentation, as far as possible, was placed outside the direct area of influence of the HVAC equipment. The current work discusses the data monitoring from December 2021 (temperature, RH and CO2) to November 2022 (1 year of the experimental campaign). Additionally, an analysis of thermal comfort was carried out in that same time window. For the current analysis, the authors focused on the living room, bedroom 1, and kitchen areas (see Figure 2).

2.5. Numerical Simulation

In order to validate and evaluate the experimental results (temperature and relative humidity), a preliminary numerical study, using the Wufi-Plus hygrothermal model, was conducted. The governing equations associated with the program Wufi-Plus for energy and moisture transfer are, respectively,
H T T t = ( λ T ) + h v ( δ p ( φ   p sat ) )
w φ φ t = ( D φ φ + δ p ( φ   p sat ) )
where H is the enthalpy in J/m3, T is the temperature in K, t is the time in s, λ is the thermal conductivity in W/m2K, hv is the latent heat of phase change in J/kg, δp is the vapour permeability in kg/msPa, psat is the saturation vapour pressure in Pa, w is water content in kg/m3, φ is the relative humidity in %, and Dφ is the liquid conduction coefficient in kg/ms.
For each representative node of the building zone, the Wufi-Plus program uses the balance equations given in Equations (3) and (4) in order to obtain the indoor conditions of each zone:
ρ c p V d T i d t = j A j U j ( T j T i ) + Q s o l + Q i l + Q v e n t
V d w i d t = j A j g w j + n V ( w a w i ) + W M P + W v e n t
where ρ is the bulk density in kg/m3, cp is the specific heat capacity in J/kg K, V is the volume m3, Ti is the indoor air temperature in K, Aj is the superficial area in m2, Uj is the thermal transmission coefficient in W/m2K, Tj is the superficial temperature in K, Qsol is the direct solar energy in W, Qil is the internal gains in W, Qvent is the heat gains due ventilation in W, wi is the absolute indoor air humidity in kg/m3, gwj is the moisture flow from the interior surface to the room in kg/sm2, wa is the absolute air humidity in kg/m3, WMP is the moisture production in kg/h, and Wvent is the moisture gains or losses due ventilation in kg/h.
Table 1 and Table 2 present the physical and thermal properties of the materials used in the numerical simulations. It should also be noted that the windows are in aluminum with a thermal break, 6 mm double-glazing, a 16 mm argon layer, and low emissivity coating (Uw equal to 1.1 W/mK, solar transmittance of 0.83 and solar heat gain coefficient equal to 0.63). As shading devices, the building under analysis has metallic external venetian blinds.
Regarding the occupancy profile, the occupancy schedule described in Table 5 took into account the number of users and their habits, typical activities inside the house, and different habits on working days compared to weekends. Table 5 also presents the cooling and heating reference temperatures for the different times.
Finally, should be mentioned that in all numerical simulations performed, a specific lamp power of 3 W/m2/100 lx was assumed, during the occupancy schedule. The other lighting level variables adopted were 75 lx for bathrooms, 200 lx for bedrooms, 300 lx for the living room and kitchen, and 100 lx for the hall. Finally, the weather file for Esposende (Braga) was created with the experimental values of temperature and relative humidity measured.

3. Results and Discussion

3.1. Temperature and Relative Humidity

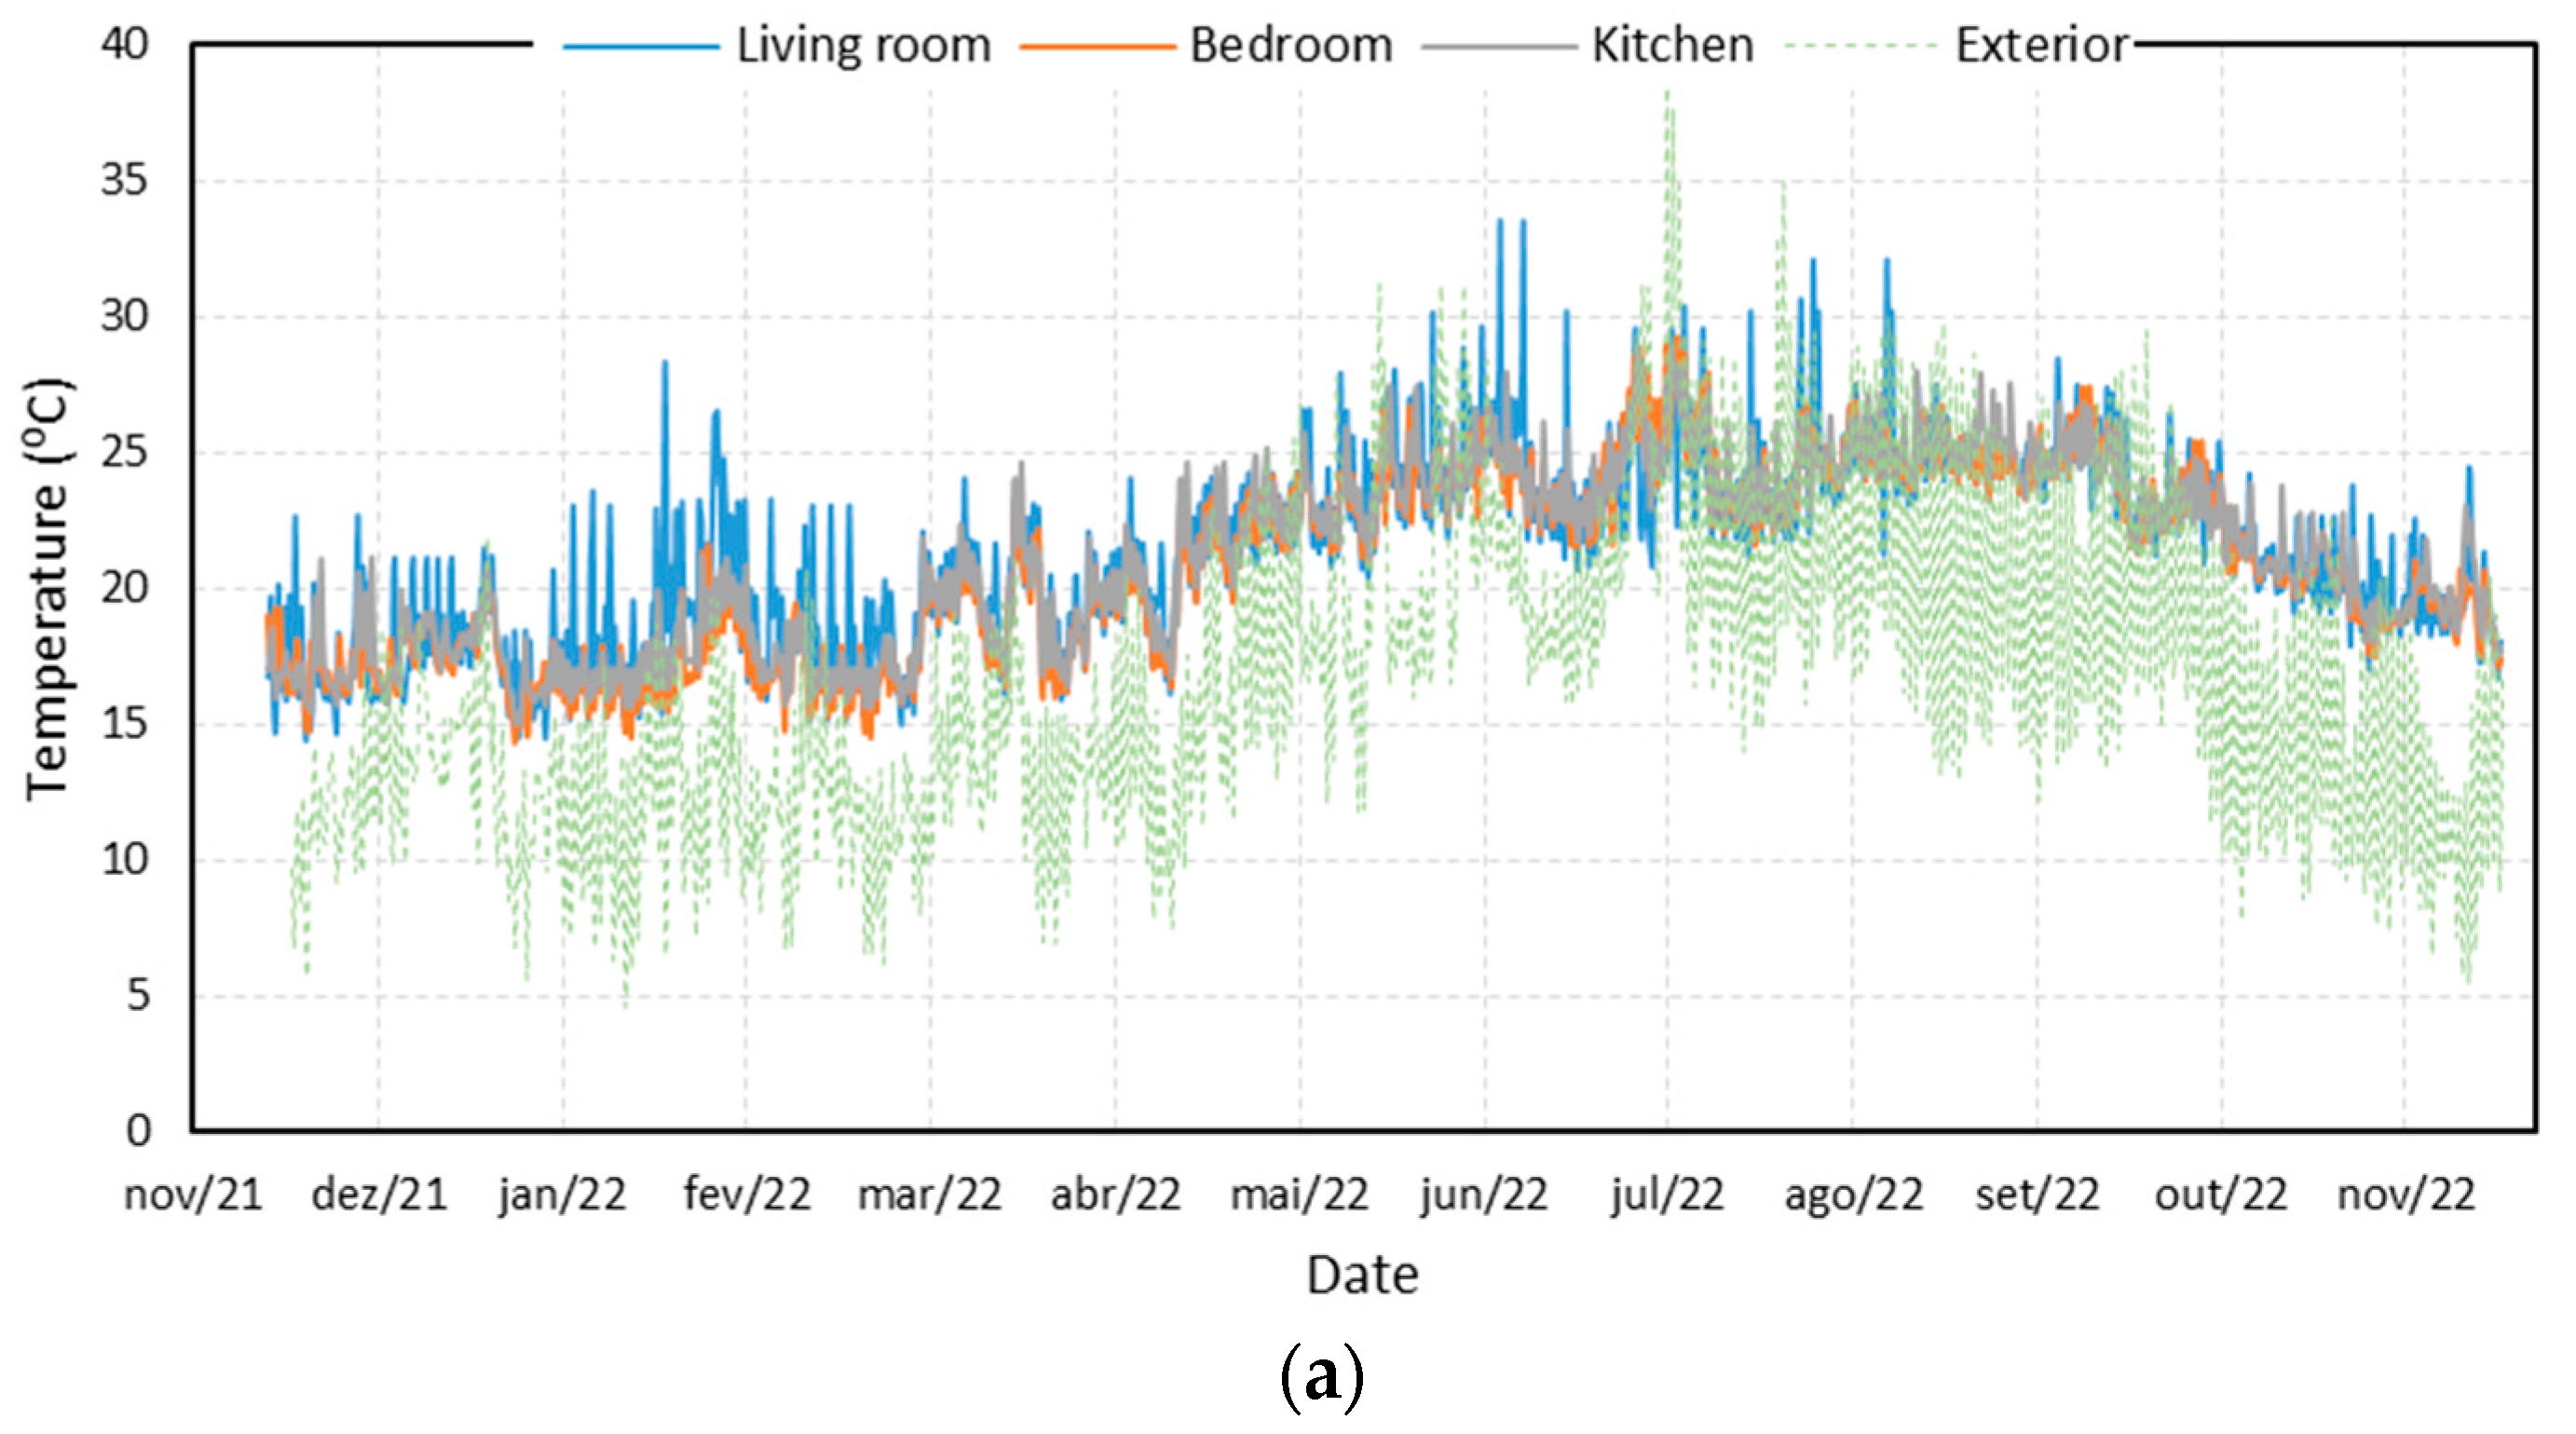
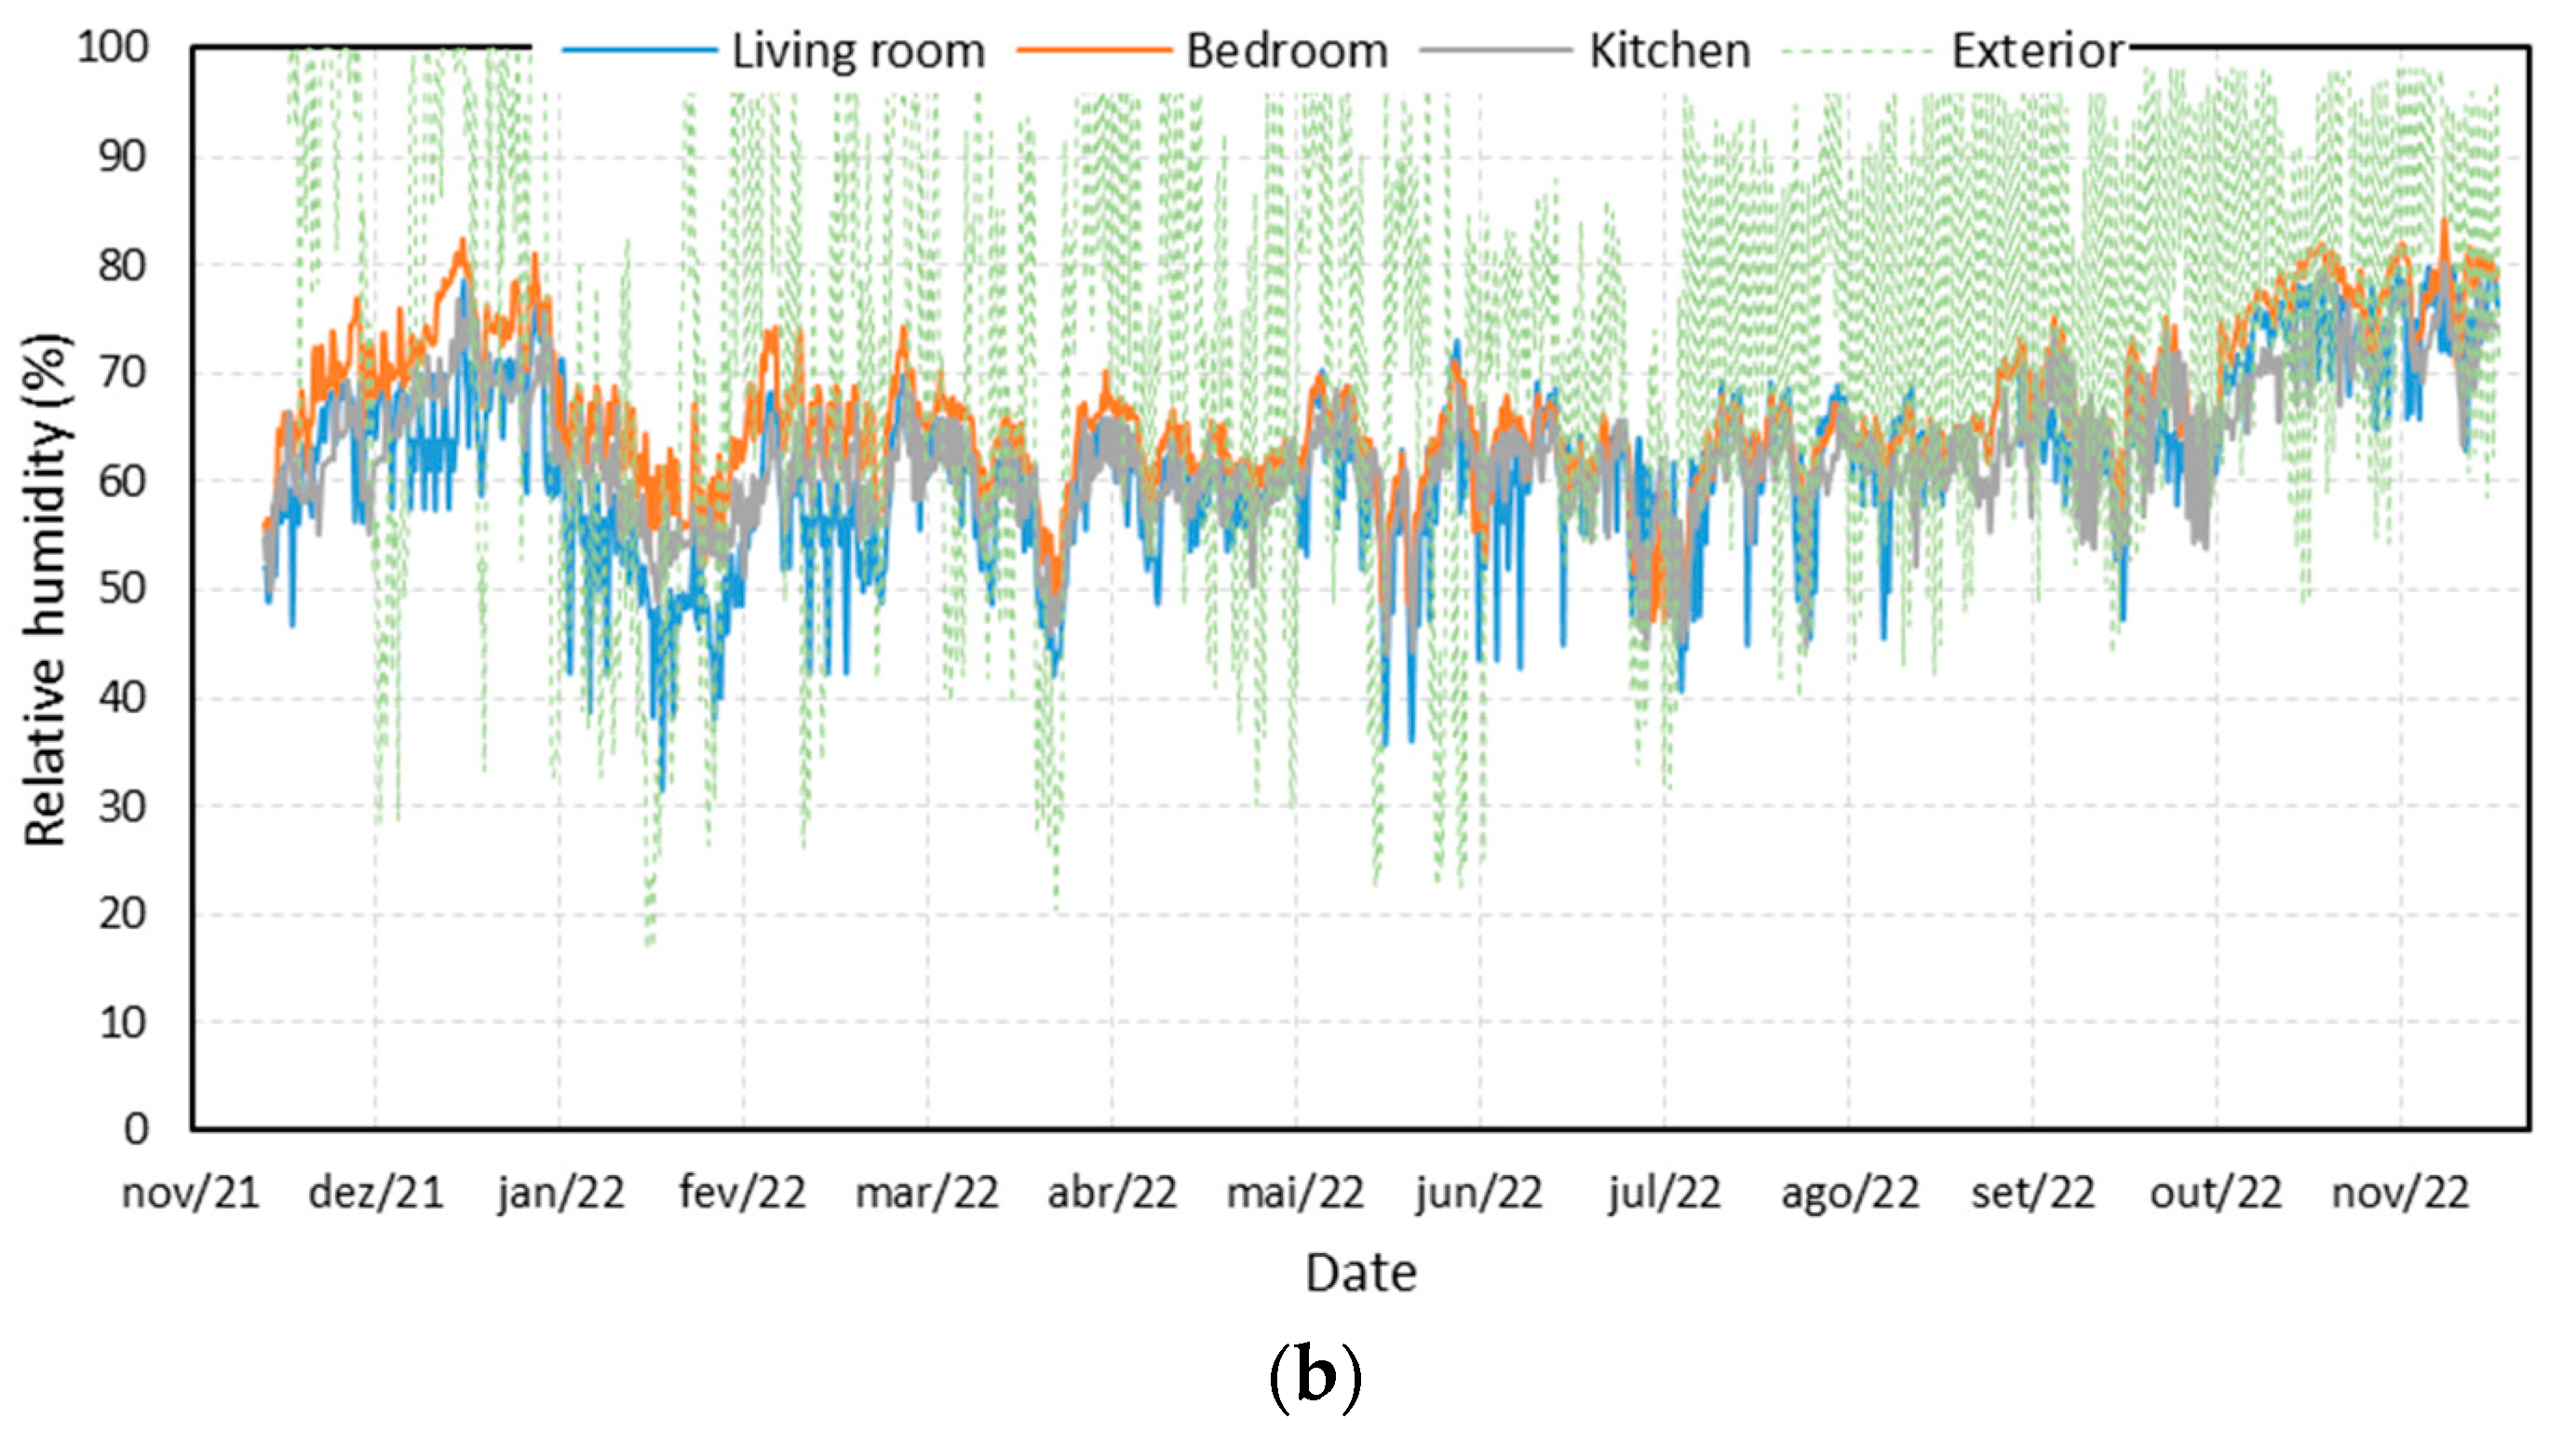
Figure 10 illustrates the air temperature (T) and relative humidity (RH) annual profiles measured inside the living room, bedroom 1, and kitchen. The outdoor conditions are also included for comparison purposes.
Temperature and RH showed a clear alignment between the outdoor and indoor temperatures throughout the experimental monitoring period. The results also showed that, in general, the temperature inside the compartments is very close, with occasional moments in which the air temperature inside the living room is higher. These situations are more prone to occur in the winter months and probably correspond to situations of space occupation with the possible use of heating systems. The variation in relative humidity, as would be expected, presents a more heterogeneous pattern, but within ranges usually considered to be adequate for the indoor environment.
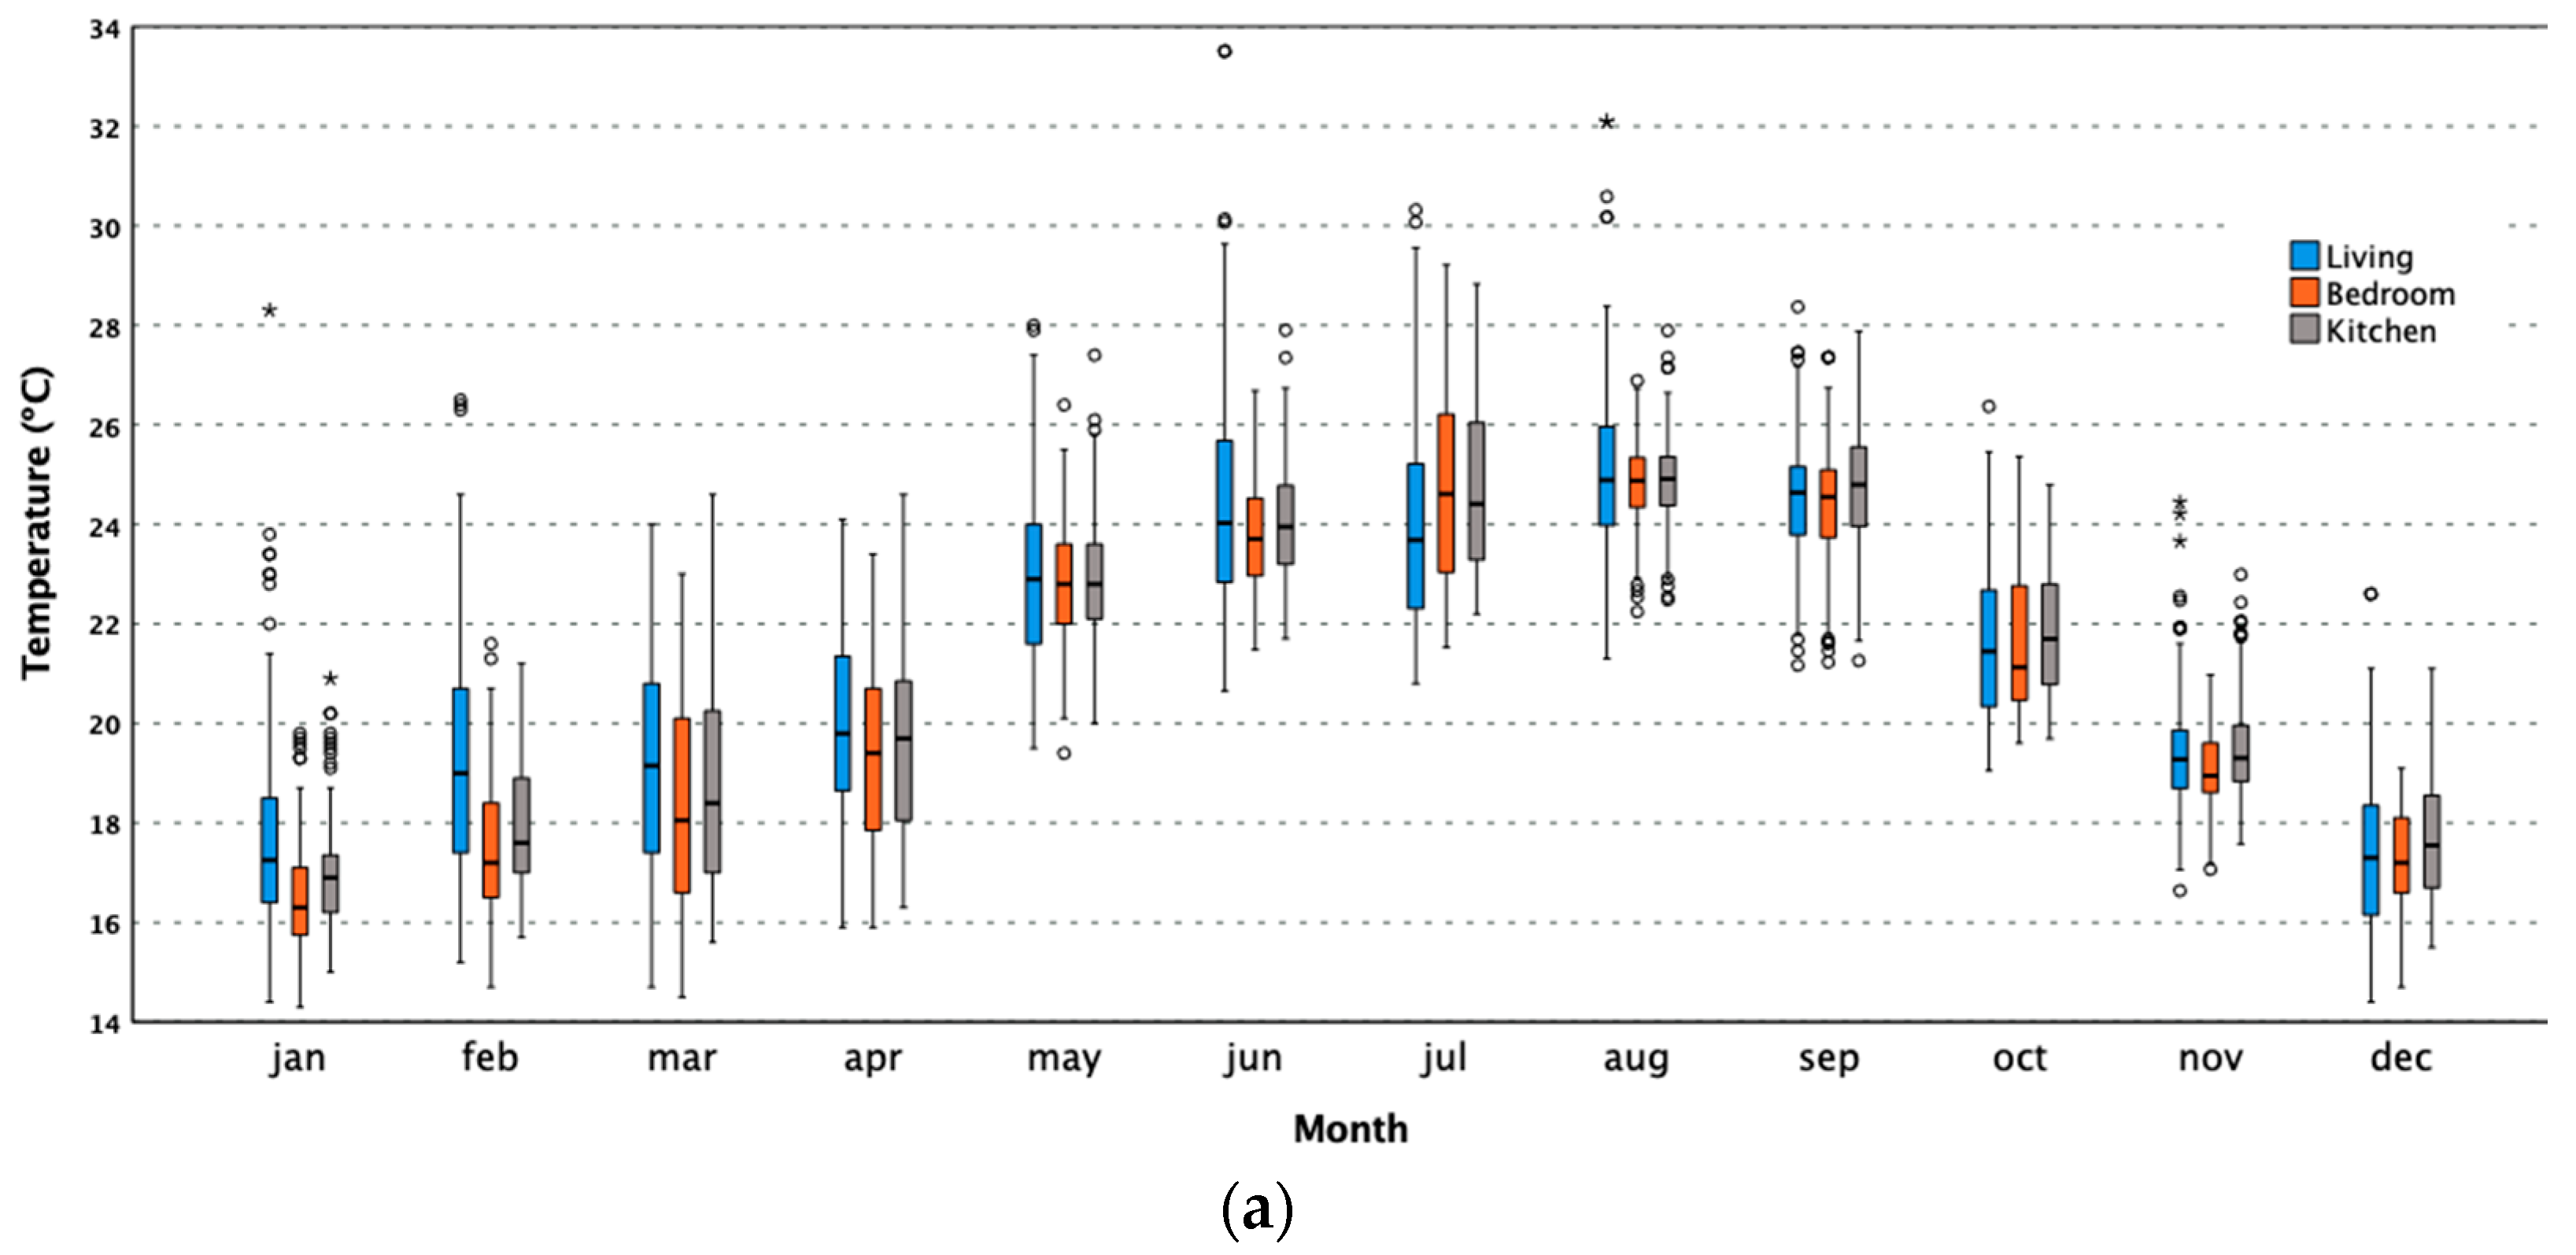
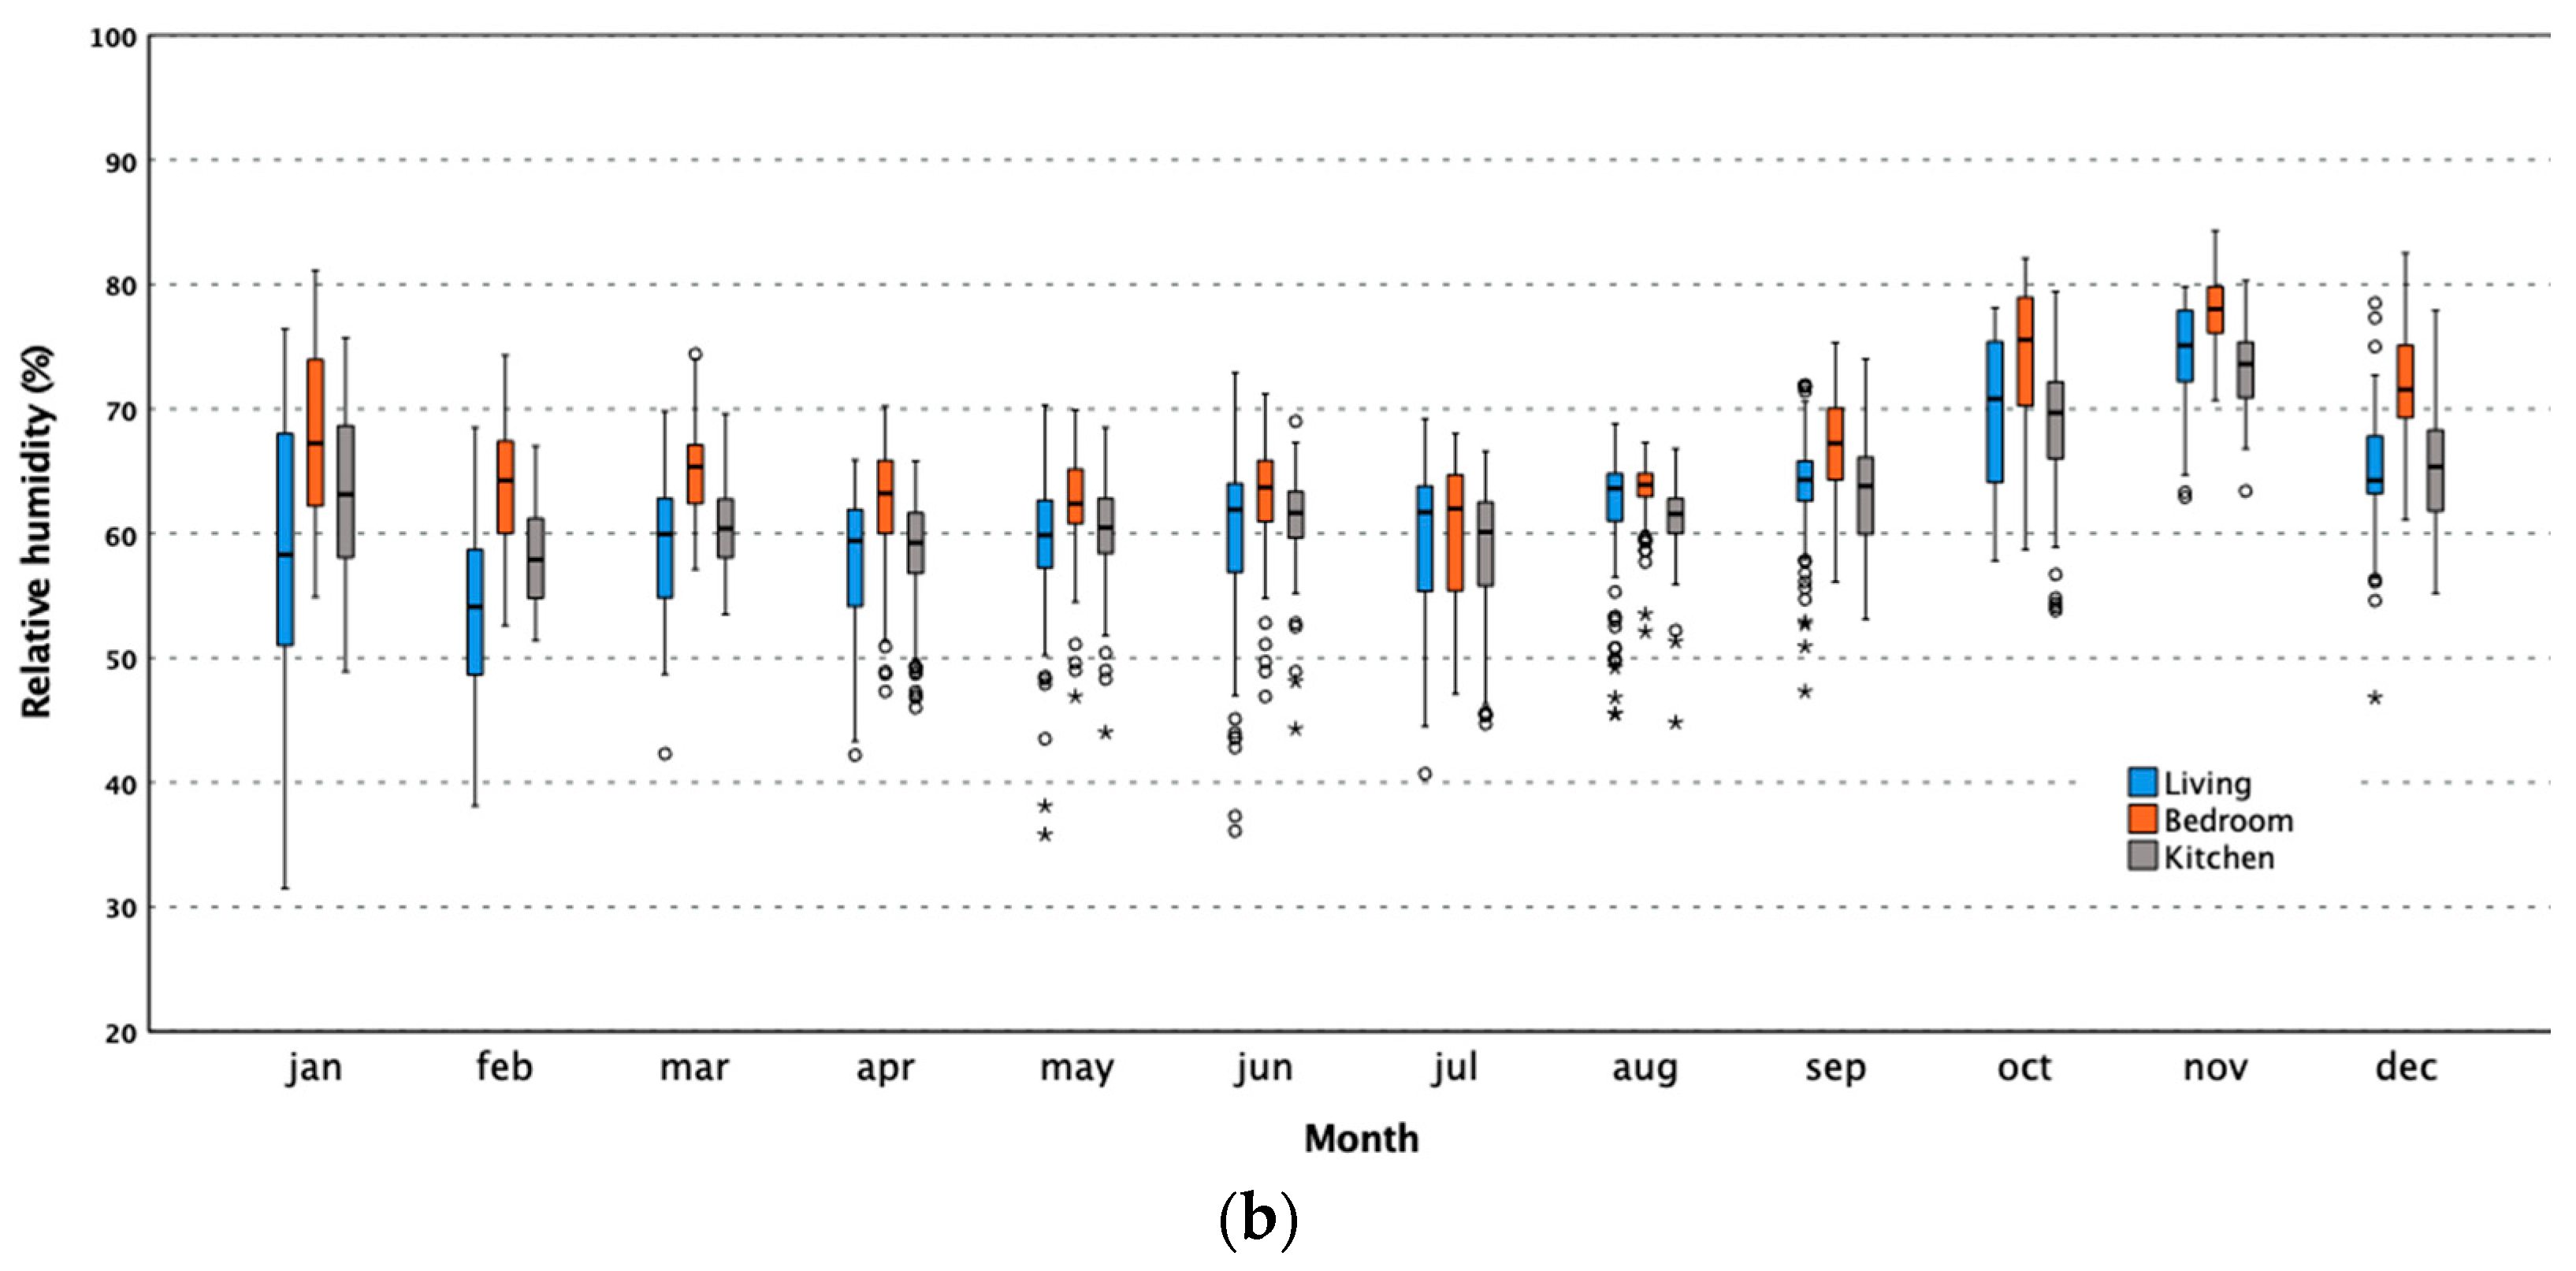
A detailed monthly analysis was carried out to facilitate the interpretation of the results and highlight the impact of the external climate, resulting in the box-plot shown in Figure 11.
Figure 11a shows a clear increase in the indoor temperature in May, leading to average temperatures above 22 °C in the three compartments until September. In the remaining months, the average temperature was below 20 °C, except in October, which corresponds to a shoulder season period. The overall performance of the three compartments is very similar; however, some differences can be pointed out. In the colder months, the average temperature inside the living room tends to be higher. Additionally, it is verified that its variability is also higher, with some outliers associated with atypical temperature peaks, suggesting the occasional use of the heating systems inside this compartment. During the summer, it is also in the living room that higher temperatures occur, with some outliers above 30 °C.
Figure 11b shows a very compact trend in the indoor relative humidity over the months of monitoring. The monthly average relative humidity is within the range of 50 to 80%. Relative humidity values above 80% only occasionally occur (in the bedroom, in the colder months). Comparing the compartments, the living room and the kitchen have consistently lower values and the highest values occur in the bedroom.

3.2. CO2 Concentration

Figure 12a illustrates the profile of the CO2 concentration measured inside the three compartments over the 12 months of monitoring. Figure 12b shows the respective cumulative probability distribution.
The results show very similar behavior in the living room and kitchen. In these compartments, the concentration of CO2 never exceeds 1200 ppm and only exceeds 1000 ppm for about 3% of the monitoring period. These values indicate that the ventilation conditions of these spaces are adequate to control indoor air quality. In the case of the bedroom, the concentration of CO2 showed some peak values, corresponding to the night when the compartment is occupied. Although the maximum concentration recorded is below 2000 ppm, approximately 10% of the time, the concentration exceeds 900 ppm.
These values suggest the need to continue monitoring this parameter and, eventually, adjust the bedroom ventilation strategy during the night. The CO2 concentration points to adequate fresh air admission in the remaining compartments.

3.3. Numerical Results and Real Data Collected

Figure 13 presents, by way of example, a comparison between numerical and experimental results resulting from the extensive monitoring period. This figure analyzes the temperature profile in the bedroom for the two extreme seasons (summer and winter). It is possible to observe that the numerical results show a good agreement with the monitoring results, with an absolute error of less than 6.5% (or less than 1.5 °C) for the two seasons analyzed. The accordance between the experimental and numerical results validate the numerical method developed in the Wufi-Plus, and this model becomes a very powerful tool for characterizing the impact of different retrofitting measures or energy solutions.

3.4. Thermal Comfort

This section presents an assessment of thermal comfort based on temperature records inside and outside the house. In order to evaluate the thermal comfort, the adaptive model proposed by the EN 16798-2 standard [34] was used. The adaptive model is based on the definition of the operating temperature limits that entail the thermal comfort of a building as a function of the exponentially weighted average temperature of the outside air. Since the air velocity is low and radiative effects, practically, are neglected, in this work, it was considered that the operating temperature can be approximated by the air temperature. In Figure 14, it is possible to observe the comfort limits, considering that the building can be classified in category II (a normal level of expectation), as well as the monitored temperature values for each of the analyzed compartments.
To facilitate the interpretation of results and for a better assessment of internal thermal comfort, the duration and magnitude of the periods of discomfort were assessed based on the “percentage outside the range” and “degree hours criteria” methods prescribed by EN 16798-2 [34] and Roque et al. [35,36]. Table 6 shows the percentage of hours of overcooling (%OCh) and overheating (%OHh) and the average discomfort index for winter (ADI_w) and summer (ADI_s).
The results confirmed that overheating is not an issue in this house as only in the living room was the registered temperature higher than the upper comfort limit, and only for a very limited period of time (approximately 1%). Regarding the colder months, the scenario is different and all the compartments showed some discomfort. The discomfort period due to low temperatures ranging between 31.3% and 38.6%. The magnitude of the discomfort was identical in the three compartments, with the higher value occurring in the bedroom, where the average temperature during the discomfort period was 1.66 °C below the lower comfort limit. These values, apparently worrying, must be framed in the context of the use of the building since the period of occupation of the compartments is clearly limited. Certainly, a large part of discomfort records corresponds to periods without occupancy. Should be take into account that discomfort during colder months is a common phenomenon in Portugal, as a consequence of energy poverty. In this case, according to the owners, the HVAC system is not always on and it is operated intermittently.
The next step in this investigation will then be identifying periods with occupancy and subsequent correlation with the results gathered from the thermal comfort models.

4. Conclusions

This work presents the experimental characterization of insulation materials applied in a modular wooden single house and an extensive monitoring campaign developed on the same house. The following conclusions can be drawn:
  • The thermal conductivity of EPS, rock wool, OSB, the floating floor, and plaster wood were determined, and the results showed that the thermal conductivity of EPS and rock wool were the lowest, with values close to 0.03 W/(m2K). For wood-based panels (OSB and floating floor in HDF), the results were slightly lower than the reference values indicated in the international standards, for a similar density;
  • Additionally, OSB, flooring HDF, Thermowood®, and wood CL4 samples were tested to determine density, moisture content, internal bond strength, bending strength, and thickness swelling over 24 h. The obtained values comply with the specifications for OSB or HDF surfaced with melamine. Additionally, both materials have low formaldehyde content and emission, and can be classified as E1;
  • There is a clear alignment between outdoor and indoor temperature conditions throughout the monitoring period;
  • The use of the heating system occurred intermittently and punctually, in specific compartments, probably as an immediate response to situations of thermal discomfort;
  • The results of CO2 concentration monitoring indicate adequate air renewal rates, except for some periods in the bedroom, during the night;
  • The application of the adaptive comfort model proposed in the EN 16798-2 standard resulted in a percentage of time in discomfort due to overcooling ranging between 31.3% and 38.6%. However, most of these periods may correspond to times when there is no occupancy of these spaces. Overheating is not a problem in this house, as only in the living room was the registered temperature higher than the upper comfort limit, and only for a very limited period of time (approximately 1%).
The results achieved in this research are important for the scientific community as real data of indoor environmental parameters of modular wooden houses are scarce. Moreover, the characterization of the materials used in the construction system is also important to provide reliable data for researchers modeling in this topic. The results of the monitoring could also be useful for the future optimization of the HVAC operation to mitigate the discomfort issues that were identified.

Author Contributions

Conceptualization, J.M.P.Q.D., E.B., R.M.S.F.A. and A.M.M.; methodology, R.M.S.F.A., J.M.P.Q.D., L.C., J.M. and A.M.M.; formal analysis, N.F., R.M.S.F.A. and A.S.G.; investigation, L.C.; writing—original draft preparation, R.M.S.F.A. and J.M.P.Q.D.; writing—review and editing, A.S.G., L.C., J.M. and J.M.P.Q.D.; visualization A.M.M., A.S.G. and J.M.P.Q.D.; supervision, A.S.G. and J.M.P.Q.D. All authors have read and agreed to the published version of the manuscript.

Funding

This work is a result of the project, “BlueWoodenHouse”, with the reference, POCI-01-0247-FEDER-047157, co-funded by the European Regional Development Fund (ERDF) through the Operational Programme for Competitiveness and Internationalization (COMPETE 2020), under the Portugal 2020 Partnership Agreement, and the project “BlueHouseSim”, with reference 2022.06841.PTDC, funded by national funds (PIDDAC) through FCT/MCTES. In addition, this work was financially supported by LA/P/0045/2020 (ALiCE), UIDB/00511/2020, and UIDP/00511/2020 (LEPABE) and funded by national funds through FCT/MCTES (PIDDAC). Base funding—UIDB/04708/2020, programmatic funding—UIDP/04708/2020, funded by national funds through the FCT/MCTES (PIDDAC), and by FCT—Fundação para a Ciência e a Tecnologia through the individual Scientific Employment Stimulus 2020.00828.CEECIND and 2021.01765.CEECIND.

Institutional Review Board Statement

Not applicable.

Informed Consent Statement

Not applicable.

Data Availability Statement

The data that support the findings of this study are available upon request from the authors.

Acknowledgments

The authors would like to thank Rafael Couto (owner of the house under study) for the collaboration in the current research.

Conflicts of Interest

The authors declare no conflict of interest.

References

  1. Ferdous, W.; Bai, Y.; Ngo, T.D.; Manalo, A.; Mendis, P. New advancements challenges and opportunities of multi-storey modular buildings—A state-of-the-art review. Eng. Struct. 2019, 183, 883–893. [Google Scholar]
  2. Lacey, A.W.; Chen, W.; Hao, H.; Bi, K. Structural response of modular buildings—An overview. J. Build. Eng. 2018, 16, 45–56. [Google Scholar] [CrossRef] [Green Version]
  3. Kasperzyk, C.; Kim, M.-K.; Brilakis, I. Automated re-prefabrication system for buildings using robotics. Autom. Constr. 2017, 83, 184–195. [Google Scholar] [CrossRef] [Green Version]
  4. Boyd, N.; Khalfan, M.M.A.; Maqsood, T. Off-site construction of apartment buildings. J. Archit. Eng. 2013, 19, 51–57. [Google Scholar] [CrossRef]
  5. Fathieh, A.; Mercan, O. Seismic evaluation of modular steel buildings. Eng. Struct. 2016, 122, 83–92. [Google Scholar] [CrossRef]
  6. Fifield, L.J.; Lomas, K.J.; Giridharan, R.; Allinson, D. Hospital wards and modular construction: Summertime overheating and energy efficiency. Build. Environ. 2018, 141, 28–44. [Google Scholar] [CrossRef]
  7. Steinhardt, D.A.; Manley, K. Adoption of prefabricated housing—The role of country context. Sustain. Cities Soc. 2016, 22, 126–135. [Google Scholar] [CrossRef] [Green Version]
  8. Srisangeerthanan, S.; Hashemi, M.J.; Rajeev, P.; Gad, E.; Fernando, S. Numerical study on the effects of diaphragm stiffness and strength on the seismic response of multi-story modular buildings. Eng. Struct. 2018, 163, 25–37. [Google Scholar] [CrossRef]
  9. Pons, O. Assessing the sustainability of prefabricated buildings. In Eco-Efficient Construction and Building Materials; Woodhead Publishing: Cambridge, UK, 2014; pp. 434–456. [Google Scholar]
  10. Li, Y.; Zhang, X. Web-based construction waste estimation system for building construction projects. Autom. Constr. 2013, 35, 142–156. [Google Scholar] [CrossRef]
  11. Lee, W.H.; Kim, K.W.; Lim, S.H. Improvement of floor impact sound on modular housing for sustainable building. Renew. Sustain. Energy Rev. 2014, 29, 263–275. [Google Scholar] [CrossRef]
  12. Tam, V.W.Y.; Gao, X.F.; Tam, C.M.; Chan, C.H. New approach in measuring water absorption of recycled aggregates. Constr. Build. Mater. 2008, 22, 364–369. [Google Scholar] [CrossRef] [Green Version]
  13. Ni, S.; Zhu, N.; Zhang, Z.; Hou, Y.; Li, S. The operational performance of net zero energy wooden structure building in the severe cold zone: A case study in Hailar of China. Energy Build. 2022, 257, 111788. [Google Scholar] [CrossRef]
  14. Yue, K.; Liang, B.; Liu, J.; Li, M.; Pu, Y.; Lu, W.; Han, Z.; Li, Z. Fire resistance of light wood frame walls sheathed with innovative gypsum-particle composite: Experimental investigations. J. Build. Eng. 2022, 45, 103576. [Google Scholar] [CrossRef]
  15. EN 13986+A1; Wood-Based Panels for Use in Construction—Characteristics, Evaluation of Conformity and Marking. CEN—European Committee for Standardization: Brussels, Belgium, 2015.
  16. Karacabeyli, E.; Douglas, B. CLT Handbook, U.S. ed.; FPInnovations: Pointe-Claire, QC, Canada, 2013. [Google Scholar]
  17. Espinoza, O.; Trujillo, V.; Mallo, M.; Buehlman, U. Cross-laminated timber: Status and research needs in Europe. BioResources 2016, 11, 281–295. [Google Scholar] [CrossRef]
  18. EN 300; Oriented Strand Boards (OSB)—Definitions, Classification and Specifications. CEN—European Committee for Standardization: Brussels, Belgium, 2000.
  19. Sandberg, D.; Kutnar, A.; Mantanis, G. Wood modification technologies—A review. iForest Biogeosci. For. 2017, 10, 895–908. [Google Scholar] [CrossRef] [Green Version]
  20. Aza-Medina, L.C.; Palumbo, M.; Lacasta, A.M.; González-Lezcano, R.A. Characterization of the thermal behavior, mechanical resistance, and reaction to fire of totora (Schoenoplectus californicus (C.A. Mey.) Sojak) panels and their potential use as a sustainable construction material. J. Build. Eng. 2023, 69, 105984. [Google Scholar] [CrossRef]
  21. Mamani, T.; Herrera, R.F.; Rivera, F.M.L.; Atencio, E. Variables That Affect Thermal Comfort and Its Measuring Instruments: A Systematic Review. Sustainability 2022, 14, 1773. [Google Scholar] [CrossRef]
  22. EN 12667; Thermal Performance of Building Material and Products—Determination of Thermal Resistance by Means of Guarded Hot Plate and Heat Flow Meter Methods—Products of High and Medium Thermal Resistance. iTeh Standards: Etobicoke, ON, Canada, 2001.
  23. EN 323; Wood-Based Panels—Determination of Density. CEN—European Committee for Standardization: Brussels, Belgium, 1993.
  24. EN 322; Wood-Based Panels—Determination of Moisture Content. CEN—European Committee for Standardization: Brussels, Belgium, 1993.
  25. EN 319; Particleboards and Fibreboards—Determination of Tensile Strength Perpendicular to the Plane of the Board. iTeh Standards: Etobicoke, ON, Canada, 1993.
  26. EN 310; Wood-Based Panels—Determination of Modulus of Elasticity in Bending and of Bending Strength. CEN—European Committee for Standardization: Brussels, Belgium, 1993.
  27. EN 317; Particleboards and Fibreboards—Determination of Swelling in Thickness after Immersion in Water. CEN—European Committee for Standardization: Brussels, Belgium, 1993.
  28. EN ISO 12460-5; Wood Based Panels—Determination of Formaldehyde Content—Part 5: Extraction Method Called the Perforator Method. CEN—European Committee for Standardization: Brussels, Belgium, 2015.
  29. EN ISO 12460-3:2020; Wood Based Panels—Determination of Formaldehyde Release—Part 3: Gas Analysis Method. ISO: Geneva, Switzerland, 2020.
  30. NP 616; Timbers: Determination of density, Instituto Português da Qualidade. LNEC: Lisboa, Portugal, 1973.
  31. NP 615; Timbers: Determination of shrinkage, Instituto Português da Qualidade. LNEC: Lisboa, Portugal, 1975.
  32. Carvalho, A. Madeiras Portuguesas—Estrutura Anatómica, Propriedades, Utilizações; Direcção Geral de Florestas: Lisboa, Portugal, 1996; Volume II, 415p. [Google Scholar]
  33. EN 622-5; Fibreboards—Specifications—Part 5: Requirements for Dry Process Boards (MDF). CEN—European Committee for Standardization: Brussels, Belgium, 2009.
  34. EN 16798-2; Energy Performance of Buildings—Ventilation for Buildings—Part 2: Interpretation of the Requirements in EN 16798-1—Indoor Environmental input Parameters for Design and Assessment of Energy Performance of Buildings Addressing Indoor Air Quality, Thermal Environment, Lighting and Acoustics. CEN—European Committee for Standardization: Brussels, Belgium, 2019.
  35. Roque, E.; Vicente, R.; Almeida, R.M.S.F. Opportunities of Light Steel Framing towards thermal comfort in southern European climates: Long-term monitoring and comparison with the heavyweight construction. Build. Environ. 2021, 200, 107937. [Google Scholar] [CrossRef]
  36. Roque, E.; Vicente, R.; Almeida, R.M.S.F. Indoor Thermal Environment Challenges of Light Steel Framing in the Southern European Context. Energies 2021, 14, 7025. [Google Scholar] [CrossRef]
Figure 1. Photos of the single-family house under study: (a) wooden modular house view, (b) bedroom 1, and (c) living room area.
Energies 16 05795 g001
Figure 2. Floor plan of the house under study.
Energies 16 05795 g002
Figure 3. Energy consumption (electricity) during 1 year.
Energies 16 05795 g003
Figure 4. (a) Composition of the wall (system A); (b) composition of the wall (system B).
Energies 16 05795 g004
Figure 5. Construction solution for the floor of the house under study.
Energies 16 05795 g005
Figure 6. Constructive solution for the roof of the house under study.
Energies 16 05795 g006
Figure 7. Materials used in walls and floor in the house under study.
Energies 16 05795 g007
Figure 8. Examples of Monitoring equipment HOBO MX CO2 in the house.
Energies 16 05795 g008
Figure 9. Monitoring equipment; (a) HOBO MX CO2; (b) Gateway; (c) HOBO UX100.
Energies 16 05795 g009
Figure 10. Annual variation of the air: (a) temperature; (b) relative humidity.
Energies 16 05795 g010aEnergies 16 05795 g010b
Figure 11. Box plot representation of monthly records inside the compartments: (a) temperature; (b) relative humidity.
Energies 16 05795 g011aEnergies 16 05795 g011b
Figure 12. (a) CO2 concentration annual profiles; (b) CO2 concentration cumulative probability distribution.
Energies 16 05795 g012
Figure 13. Temperature profiles comparison for the summer (a) and winter (b) seasons.
Energies 16 05795 g013
Figure 14. Thermal comfort assessment [34].
Energies 16 05795 g014
Table 1. Thermal conductivity results.
Dimension of Specimens (mm3)Thermal Conductivity (W/(m2 K)Average Thermal Conductivity (W/m2 K)
EPS300 × 300 × 400.03520.0367 ± 0.0015
0.0367
0.0382
EPS300 × 300 × 300.0364
0.0378
0.0392
0.0378 ± 0.0014
Rock wool300 × 300 × 500.0336
0.0348
0.0363
0.0349 ± 0.0014
OSB300 × 300 × 220.0984
0.1006
0.1030
0.1007 ± 0.0023
OSB300 × 300 × 120.1033
0.1057
0.1082
0.1057 ± 0.0025
Floating floor (HDF)300 × 300 × 70.1301
0.1334
0.1365
0.1333 ± 0.0032
Plaster wood300 × 250 × 12.50.1528
0.1535
0.1544
0.1536 ± 0.0008
Table 5. Occupancy profile and HVAC parameters used in numerical simulations (lower/upper limits).
Hourly TimePresence RateHeating Setpoint (°C)Heating Setback (°C)Cooling Setpoint (°C)Cooling Setback (°C)
Weekdays19:00–7:001.018142630
8:00–18:000.6
9:00–17:000.4
10:00–16:000.0
Weekends19:00–7:001.018142630
8:00–9:000.9
10:00–15:000.5
16:00–18:000.6
Table 6. Thermal comfort indicators.
%OChADI_w (°C)%OHhADI_s (°C)
Living room31.31.531.11.74
Bedroom38.61.660.00.00
Kitchen34.41.460.00.00
Disclaimer/Publisher’s Note: The statements, opinions and data contained in all publications are solely those of the individual author(s) and contributor(s) and not of MDPI and/or the editor(s). MDPI and/or the editor(s) disclaim responsibility for any injury to people or property resulting from any ideas, methods, instructions or products referred to in the content.