Abstract
The filling of the electrolyte and the subsequent wetting of the electrodes is a quality-critical and time-intensive process in manufacturing of lithium-ion batteries. The exact influencing factors are the subject of research through experiments and simulation tools. Previous studies have demonstrated that wetting occurs mainly in the transition between the materials but leads to gas entrapments. Therefore, this paper investigates the influence of the electrode surface structures, situated between anode and separator, on the wetting progress, through experimental capillary wetting and simulated with a lattice Boltzmann simulation. The results show that the simulations can identify the exact pore size distribution and determine the wetting rates of the entire materials. Furthermore, the experiments reveal a negative correlation between fast wetting and rougher surface properties. This enables a more precise determination of the wetting phenomena in lithium-ion cell manufacturing.
1. Introduction
Lithium-ion batteries play an increasing role in various applications, resulting in the expansion of manufacturing capacities to meet the growing demand. The primary challenges in manufacturing include reducing costs, minimizing the CO2 footprint of a battery cell, and improving product quality [1]. The best way to achieve these goals is by reducing process times [2]. When considering individual process times, especially the time-intensive wetting, forming, and aging processes, accounting for manufacturing deviations is crucial [3,4]. Currently, the process framework conditions for wetting and aging are standardized, and process durations are defined empirically with high safety margins to compensate for deviations in product quality. However, individual process conditions fail due to the limited accessibility of process characteristics caused by the closed metal housing after cell assembly. The implementation of a digital twin of the battery and the process conditions could provide transparency [5]. To this end, the literature mainly discusses filling the dry electrode sheets with electrolyte and the subsequent wetting [6]. This process aims to achieve complete electrolyte wetting of the porous electrode materials and separators [7]. Undesired gas entrapments in the material can result in capacity losses [8].
Various experimental methods can increase the transparency of the wetting process. Electrical methods, such as electrochemical impedance spectroscopy or chronoamperometry, can be employed to estimate the degree of wetting at the cell level [9,10]. Moreover, visual inspection methods, such as X-ray inspection, neutron radiography, lock-in thermography, or ultrasonic inspection can be employed to visualize the progress of wetting in a battery cell [11,12,13]. Although these methods are unsuitable for inline process control, they provide the opportunity to parameterize exemplary mathematical models. Gravimetric wetting balance or optical capillary rise tests are also utilized to parameterize the mathematical models and examine the wettability of cell composite materials, as well as the influence of various process frame conditions [9,14]. In addition to mathematical models for simulating the wetting behavior of a battery cell or its components, numerical fluid dynamics simulations are also found in the literature. For small dimensions, such as in the pores of the electrodes, the lattice Boltzmann (LBM) simulation method is particularly suitable [15,16]. This approach examines the wetting properties of porous media using the multicomponent Shan–Chen pseudopotential method [17].
The various experimental methods and the LBM simulation show heterogeneous results on the wetting speeds in the relevant publications [12]. This disparity can be attributed to different experimental methods focusing on complete cells or cell composite materials. While the process framework conditions are typically known for the mathematical descriptions, the product framework conditions, particularly the wetting properties of the porous media, are often unknown [18]. The primary factors influencing wetting, as determined by the porous materials, are the contact angle to the fluid and the effective pore radius of the porous media [16,19]. Generally, the contact angle can be measured using contact angle meters, and pore size distribution can be determined using mercury intrusion porosimetry [12,20]. The transition between the materials in a battery cell composed of wound or stacked porous materials significantly affects the wetting behavior [21]. Additionally, the surface structure of the individual materials also influences the wetting behavior. Kleefoot et al. demonstrated, through droplet tests and capillary rise tests, that the surface roughness of the electrode impacts the wettability. Laser surface modification of anodes, which increases surface roughness, leads to larger pores and faster wetting [22]. AlRatrout et al. confirmed that rougher surfaces result in larger pores and, consequently, faster wetting, accompanied by a lower contact angle [23]. In both cases, however, the electrodes undergo active modification in their pore and particle structures. Lautenschläger et al. discovered a correlation between particle sizes, porosity, contact angle, and capillary pressure through LBM simulations. They found that large particles, more porous media, and lower contact angles result in lower capillary pressure during wetting [24]. Jeon states that the particle shape has an influence on the wetting speed and the gas inclusions [25]. Jeon is also investigating the influence of different particle sizes in the electrodes and different porosities on the wetting rate through LBM simulations. More porous electrodes lead to faster wetting [26]. Malki et al. combined the LBM simulation with machine learning methods and identified the considerable influence of the contact angle as the main influencing factor for the same electrode geometries [27]. Chen et al. confirmed that the transition between the materials greatly influences the wetting speed and identified a significant susceptibility to gas entrapments. They also highlighted the winding tension on the layers as a non-negligible factor influencing gas entrapments [28]. Sheng et al. observed a linear relationship between effective pore radii and wetting rate through experiments. However, they noted that the effective pore radius alone cannot fully describe the complex physical structure of an electrode. The electrolyte initially converges into the cavities and then diverges into adjacent throats, indicating that wetting is primarily influenced by the connection between throats and cavities. The morphology of the investigated graphite particles, which is strongly influenced by calendering, remains an open question in this field [20]. Beyer et al. extended this assumption to the surface structure of separators [29]. Furthermore, the transition between the materials must also be taken into account, as overlapping effects make it challenging to identify correlations [21,28].
Thus, this publication focuses on investigating the impact of different electrode surface properties on wetting. To achieve this, different anode and separator cell coils are subjected to experimental analysis using the capillary wetting test and an LBM simulation. The wetting is evaluated through both experiments and simulations. Furthermore, the LBM simulation is utilized to explore the dominant pore radius within the cavities and the throats of the electrodes.
2. Methods
2.1. Capillary Wetting
The Lucas–Washburn equation describes the capillary rise in porous media, such as an electrode [30]. This equation is usually modified and simplified to describe the height increase of the infiltrating liquid using a wetting rate k [mm · s−0.5] [9]:
h represents the height of liquid penetration, while η denotes the dynamic viscosity of the liquid. Porous media with variable pore radii can be described with a geometry’s effective capillary radius as the macroscopic pore radius distribution, referred to as reff. The surface tension between the liquid and gas is denoted by γ, and θ represents the contact angle between the liquid and solid surfaces. This equation neglects the influence of gravity, which means there is no limit to the maximum height of rise. This leads to a deviation in the rise height with increasing wetting time. Therefore, Fries and Dreyer extended the term by incorporating the Lambert W function, which accounts for the effect of gravitation [31]:
corresponds to the density of the liquid, while g corresponds to the gravitation. The capillary pressure determined in LBM simulations, is described as:
2.2. Materials
In the experiments, graphite electrodes and a cellulose separator, specifically “cellulose paper (TF44-25)”, provided by NKK Nippon Kodoshi Corp (Kochi, Japan), are used. Three different graphite electrodes are examined, each having distinct structures. The surface properties of the materials utilized in the study are examined using a laser scanning microscope called Keyence VK-X200K (Keyence, Osaka, Japan). Figure 1 presents microscopy images of the electrodes and the separator. These images are evaluated and analyzed to determine surface roughness, porosity, average particle size, and pore size.
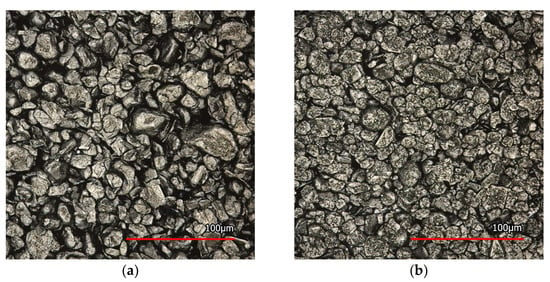
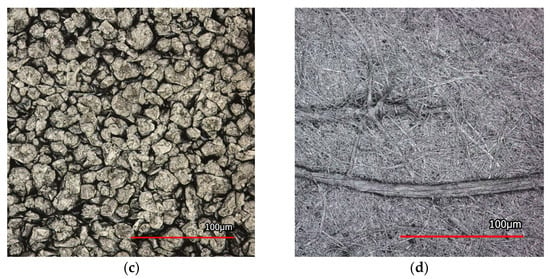
Figure 1.
Microscopy images of the graphite electrode used (a–c) and the separator (d).
The electrolyte solvent used for electrolyte penetration is dimethyl carbonate (DMC), obtained from Sigma-Aldrich (St. Louis, MO, USA). The material properties of DMC, including the surface tension (γ = 32.01 × 10⁻³ N/m), dynamic viscosity (η = 1.464 × 10⁻³ Pa*s), and density (ρ = 1070 kg/m³), are based on the data provided by the manufacturer and literature references [8,32,33,34]. To determine the contact angle between DMC and the materials used in the experiment, we employed an optical contact angle measuring and contour analysis system called OCA 40, manufactured by DataPhysics Instruments GmbH (Filderstadt, Germany).
The measured and calculated properties of the electrodes and separator, obtained from the microscopy images, are presented in Table 1. The measurements of the contact angle and surface roughness align with the findings of AlRatrout et al. [23], where the contact angle decreases according to media roughness.

Table 1.
Properties and measurement results of the used electrodes and separator.
2.3. Experimental Setup
The electrodes are wound with the separator around a winding mandrel with a diameter of 20 mm. During the winding process, a web tension is applied manually. The winding has a height of 81 mm and is placed inside a pouch bag with a sample holder. The pouch bag serves as a container for the electrolyte solvent DMC, preventing its evaporation. Additionally, a sample holder is used to ensure that the pouch foil does not touch the winding, as this could unintentionally affect the wetting behavior. In the laboratory setup, intense illumination is integrated to provide a good exposure of the images. A specific industrial camera, DFK 33GX183 from The Imaging Source, LLC (Charlotte, NC, USA), is used to record the wetting process. The camera is equipped with a lens M1614-MP2 obtained from a computer (Cary, NC, USA) and captures images at a sample rate of one frame per second, with a resolution of 20 megapixel. The setup is shown in Figure 2. The wetting is initiated by using a syringe attached to an electrolyte tube to fill the electrolyte solvent DMC into the pouch bag. The experiments are conducted at a temperature of 22 °C. After the completion of the experiment, the images are processed using Matlab R2023a to analyze sharpness, contrast, and gray values, which aim to quantify the wetting level at the winding.
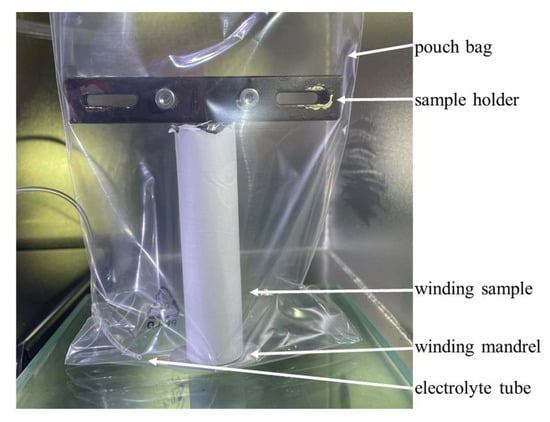
Figure 2.
The experimental setup consists of a winding sample with anode and separator, a sample holder, a pouch bag, and an electrolyte tube connected to a syringe for filling the electrolyte. A camera records the wetting progress.
2.4. Simulation Setup
The simulation procedure is adapted from Wanner and Birke [21]. The LBM simulation is processed using the open-source environment Palabos [35]. The exact parameterization of the simulation is described in Appendix A Table A1 and Table A2. The data analysis is performed using ParaView 5.11 and Matlab R2023a [36].
2.4.1. Generation of Simulation Geometry
The 3D surface profile microscopy images are processed in Matlab. To obtain a more homogeneous color or the surface structure of the electrode and smooth the edges of the electrode particles, a 2D Gaussian filtering of images is used. The hue value of the hsv color space is correlated with the height of the surface. Thus, a binary 3D model of the surface is created with a resolution of 0.28 µm. The hue factors and the resulting dimensions of the geometry (154 × 55.9 × 11.5 µm³) are consistent for all four microscopy images. The lowest layer of the microscopy image is permeable to gas and non-permeable to the electrolyte. The resulting geometries are shown in Appendix B Figure A1, Figure A2, Figure A3 and Figure A4. The electrodes are first processed individually and then combined with the separator. The 3D model of the electrode is added to the separator 3D model in the z-direction, with the surfaces oriented towards each other. The surface structure of the separator is soft and permeated by a few large fibers. However, simple stacking of the geometries on top of each other results in only a few points of contact between the electrode and the separator. Since this does not realistically reflect the pressure on the cell coil, the transition between the materials is redesigned in a subsequent step. For this purpose, the top layer of the electrode and the top three layers of the separator are each merged into one layer using a logical AND operator. This reduces the pore size between the materials and results in a more realistic large area and multiple contact points between the electrode and the separator.
2.4.2. Lattice Boltzmann Setup
Each of the three electrode surfaces is processed individually, combined with the same separator, and then integrated into the lattice Boltzmann environment. The voxel size and the lattice unit (lu) are both set to 0.28 µm. The wetting process occurs in the y-direction. To facilitate this, pressure boundary conditions are defined at the inlet and outlet in the y-direction (ρE and ρGdis). For stability purposes, a periodic boundary condition is defined in the x- direction. To ensure stability and pressurization in the y-direction, a reservoir with a thickness of four lattice units is added to each geometry at the inlet and outlet. This reservoir is filled with electrolyte at the inlet and gas at the outlet. Additionally, a membrane is inserted between the reservoirs and the geometry, which is permeable to the electrolyte at the inlet and to the gas at the output. A bounceback function is implemented for the respective other media to avoid unintended backflow. Initially, the pores of the geometry are filled with air (ρG) and the electrolyte density (ρEdis). The electrodes and the separator are defined with a bounceback mechanism. The contact angle measured in Table 1 is applied to each material through the adhesion parameter Gads,wetting for the electrolyte, and Gads,nonwetting for the gas. The wetting process is based on the pressure difference of the fluid phases, with an interfacial tension of the interaction parameter and the time step [17,24].
This pressure difference corresponds to the capillary pressure and is stimulated by an additional force at the layer y = 1 in the y-direction. This force is increased every 500 steps to complete the geometry’s complete wetting. A lattice cell is considered wetted when the gas density drops below a threshold value of ρG < 1 mu/lu3. The total wetting is calculated by determining the ratio of wetted lattice cells to the total number of lattice cells filled with gas at the beginning. The simulation is evaluated every 500 time steps and continues until no further wetting is observed.
3. Results
3.1. Experimental Results
Figure 3 shows an example of the wetting process for the separator and anode #2 winding at t = 1, 7, 45, and 72 s. The wetting progress is evident from the contrast to the white separator. Additionally, in Figure 3b,c, a partial grayscale is observed at the transition between the wetted and unwetted materials. Here, wetting at the interface between the two materials has to be expected. The subsequent complete impregnation of the separator results in a black coloration of the separator. In Figure 3c,d, the remaining gray areas can be seen. Here, wetting either does not occur or takes place very slowly. This is likely due to variations in pore radii, resulting in slower wetting rates. These effects were observed in all three experiments. To evaluate the images, a small image section with a width of 45 pixels and the entire height in the center of the coil was selected in all cases to minimize the effect of rounding. For the image evaluation, a gray-colored pixel is considered as wetted, allowing for the quantification of the fastest possible wetting of the materials. It is important to note that one pixel corresponds to 53 µm in the evaluated images.
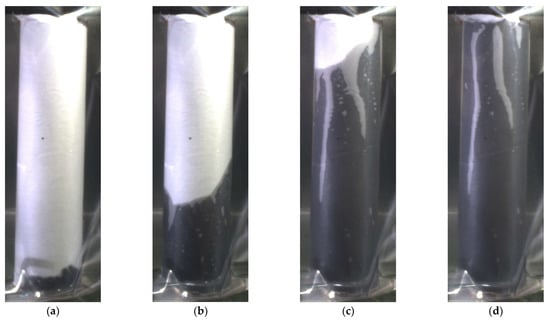
Figure 3.
Wetting state of the separator and anode #2 at different time steps: t = 1 (a), 7 (b), 45 (c), and 72 s (d). The white unwetted area corresponds to the external separator, the black area to the wetting area. The gray values correspond to a not-yet-complete wetting.
Figure 4a shows the wetting progress of the three different experiments over time. In all three experiments, the maximum possible wetting height is reached within 60 to 120 s. Between 0 and 15 s, a linear wetting is observed. However, after 16 s (#3), 18 s (#2), or 22 s (#1), a deceleration of the wetting is apparent. From the second 60 onwards, a slight noise in wetting height is recognizable in experiments #1 and #3. The curves in the figure correspond to the fastest wetting process as evaluated by the image recognition software, which quantifies the black and gray values. In experiment #1 the wetting reaches the maximum height in 88 s. After 111 s, the images indicate that complete wetting across the entire width of the coil is achieved.
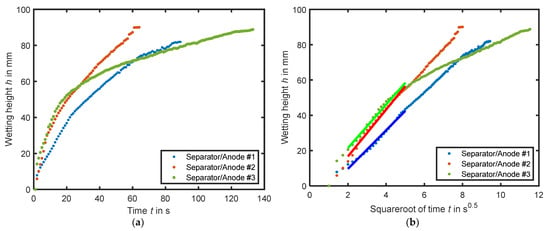
Figure 4.
The wetting height of the experiments is plotted in (a) versus time and in (b) versus the square root of time. In (b), the fit of Equation (1) is shown in bold.
To determine the wetting rate k, the wetting progression is plotted against the root of time in Figure 4b. Experiments #1 and #2 exhibit an almost linear increase in wetting. The wetting rates, following the approach of Kaden et al. and Wanner and Birke, are determined at the beginning of the wetting, specifically between 2 and 5 s0.5. These wetting rates are presented in Table 2 and can be determined with a high accuracy of RMSE > 98.4. Using Equation (1), the effective pore radius of each experiment is calculated, and the values range between 11.4 to 16.9 µm. Furthermore, the surface roughness values Sa (arithmetic average of profile height) of the laser scanning microscope measures are presented and compared with a correlation analysis with the wetting rate k. A high negative relationship (r = −0.9943) is observed between the considered characteristics of the surface roughness Sa and the wetting coefficient k. There appears to be no clear correlation with the porosity of the materials. Thus, the results reveal a link between a smoother electrode surface structure and faster wetting.

Table 2.
Experimental results. The wetting rate and effective pore radii as calculated from the experiments.
3.2. Simulation Results
3.2.1. Pore Size Distribution
At the beginning of the simulation, the contact angle to the material is defined using the interaction parameter Gc and the fluid densities. After an initialization time of 500 iterations without external force, the resulting density of the fluids along the x-axis can be evaluated, and the pressure difference calculated. Using Equation (3), the resulting pore size distribution can be determined for each geometry, which is illustrated in Figure 5.
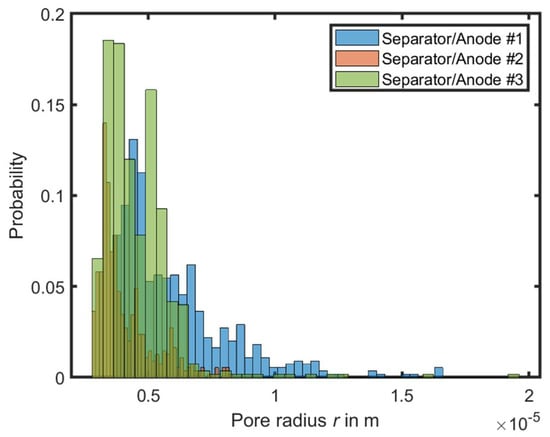
Figure 5.
Calculated pore size distribution of the materials based on the simulation.
The resulting pore size distribution corresponds to a normal distribution with the following values and is comparable to the optical analysis of the microscopy images. A normal distribution can be determined based on this pore size distribution. This is 6.05 µm (σ = 2.2 µm) for separator/anode #1, 4.1 µm (σ = 1.13 µm) for separator/anode #2, and 4.58 µm (σ = 1.47 µm) for separator/anode #3. The pore size distribution closely aligns with the average pore radii of the individual anodes measured from the microscopy images. However, it does not precisely match the calculated pore radii of the experiments. Despite this, the measured pore radii are also included in the distribution, particularly for experiments #1 and #3.
3.2.2. Wetting Results
Figure 6a presents the wetting results of the simulations with the separator and respective anode materials. The wetting is initiated almost simultaneously in all three geometries after 13 kPa pressure difference and continues up to 41 kPa in simulations #1 and #3. However, in simulation #2, the saturation increases more slowly, up to a differential pressure of 56 kPa. A further increase in pressure does not result in a significant rise in saturation. Instead, the saturation drops in #2 and increases slightly in #1 and #3. Around 41 kPa, the geometries #1 and #3 detect gas entrapments of different sizes. The air from the gas entrapments escapes due to increasing pressure. In simulation #1, the resulting gas entrapments account for 14.5% of the pore volume, while in simulation #2 and #3, they represent 28.5%, and 29.9% of the pore volume. If the wetting is performed at the same contact angle for all materials, the saturation curve of #2 follows the pattern of #1 and #3, except for the gas entrapments. The simultaneous wetting at the same differential pressures across different geometries suggests that the wetting process is dominated by the same separator.
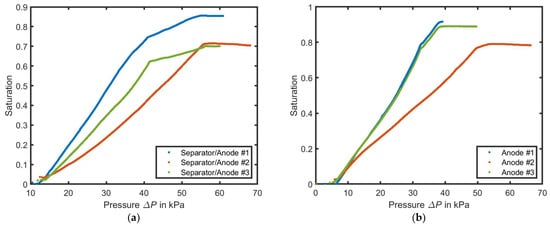
Figure 6.
Results of the simulation of the saturation of the electrolyte over the differential pressure per simulated geometry. In (a) for the combined approach of separator and anode and in (b) for anode only.
In Figure 6b, when only the electrodes are simulated under the same boundary conditions but with individual contact angles, differentiated wetting curves can be observed. Anodes #1 and #3 exhibit an almost simultaneous wetting between 5.21 kPa and 38.4 kPa, which differs only in the final saturation of the geometries. However, anode #2 shows a slower increase in wetting between 6.3 kPa and 53.5 kPa and reaches gas entrapments of 21%. The wetting time required to reach 50% wetting is 11 ms for anode #1, 19.1 ms for anode #3, and 12.1 ms for anode #2. Using Equation (3), it can be inferred that an increasing differential pressure corresponds to smaller pores. With a maximum differential pressure of 53.5 kPa of anode #2 and 38.4 kPa of anode #3, pore sizes of 1.15 µm and 1.65 µm can be calculated, respectively.
3.3. Comparison and Discussion
In the experiments, the two equations of Lucas Washburn and the modification of Fries and Dreyer are used to reproduce the wetting behavior. Figure 7 illustrates that the simulation of wetting, based on the Fries and Dreyer modification, more accurately reproduces the experimental wetting for the same pore radius.
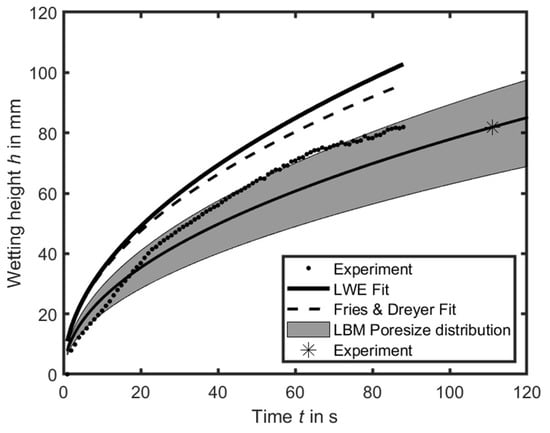
Figure 7.
Comparison of the experimental and the determined-by-simulation pore radii, and the fits with the Lucas Washburn and Fries and Dreyer equation, exemplary of anode/separator #1.
Since the image processing of the experiments records the fastest possible wetting of the materials, the pore size distribution is determined by LBM simulation for the anode/separator #1 to 11.35 µm. In Figure 5, the pore sizes ranging between 3 µm and 17 µm are displayed, with a normal distribution of 6.05 µm (σ = 2.2 µm) for anode/separator #1. This normal distribution is marked in Figure 7 according to the formula of Fries and Dreyer. However, the experimental data align very precisely with the upper edge of the normal distribution. Based on the experiments and the subsequent image recognition, complete wetting of the entire width of the coil occurs after 111 s (indicated with * in Figure 7). This point corresponds precisely to the center of the normal distribution. Although further wetting of the pores in the experiments is not visually evident, it is expected to occur based on the smaller pores.
In addition, in the separator/anode #2 experiments, it is observed that the fastest wetting occurs at a low surface roughness. However, this faster wetting with a smooth surface cannot be confirmed by simulation. In the LBM simulations, it is shown that gas entrapments are located in the small pores created by the geometries with lower surface roughness, which is evident in the geometry of simulation #2. This results in a slower complete wetting of the electrode. Compared to the other anodes, anode #2 is characterized by a lower porosity. Here Jeon can be confirmed that in LBM simulations this leads to slower wetting [26].
In general, the solvent DMC used is only one component of the electrolyte in a lithium-ion battery. Further additions such as ethylene carbonate or the conducting salt LiPF6 increase the density and viscosity of the electrolyte decisively [37]. This effect on wetting must be considered in further investigations.
4. Conclusions
The investigation of the wetting behavior in different electrodes with a separator was carried out using both experiments and LBM simulations. Experimentally, different fast-wetting processes can be investigated using image recognition to identify transitions between the materials. However, this could not be confirmed by the simulation, which might be attributed to incorrectly selected distances between the materials. The optical examination of the wetting process proved particularly effective in detecting dominant large pore radii. On the other hand, the LBM simulation allowed for the identification of the overall pore size distribution, including the smaller pores that are relevant for the overall wetting of the materials. The wetting time could be determined by fitting the Lucas Washburn equation and the Freis and Dreyer equation within a range of the pore size distribution. In addition, a negative correlation with surface roughness and wetting time can be identified in the experiments. Additionally, the LBM simulations revealed that a smaller surface roughness leads to smaller pores, ultimately delaying the complete wetting of the material. In the future, these findings can be used to mathematically describe the wetting time of the materials, especially in assembled cell stacks or coils.
Author Contributions
Conceptualization, J.W.; methodology, J.W.; software, J.W.; validation, J.W.; formal analysis, J.W.; resources, J.W.; writing—original draft preparation, J.W.; writing—review and editing, K.P.B.; visualization, J.W.; supervision, K.P.B.; project administration, K.P.B.; funding acquisition, J.W. and K.P.B. All authors have read and agreed to the published version of the manuscript.
Funding
This research was funded by the Federal Ministry of Education and Research (BMBF), funding code 03XP0529D. The authors would like to express their gratitude to the Federal Ministry of Education and Research, Germany, for funding this work as part of the accompanying research project “VisEl—Visualisierung der Elektrolytbewegungen und Elektrodenausdehnung einer Lithium-Ionen-Zelle”.
Data Availability Statement
Data available on request from the authors.
Acknowledgments
The authors would like to express their gratitude to Fabian Trost for setting up the first experimental setup and conducting basic measurements. They also extend their thanks to Dominic Welti for assisting with the laser scanning microscope images. Additionally, the authors thank Moira Peter for her valuable input and support in setting up the lattice Boltzmann simulation.
Conflicts of Interest
The authors declare no conflict of interest. The funders were not involved in the study’s design, data collection, analysis, interpretation, manuscript writing, or decision to publish the results.
Appendix A
Model Parametrization
In the simulation, gravitation is neglected, and the multicomponent Shan–Chen method is used. The adhesion parameter is calculated following the approach of Huang et al. The parameterization represents dimethyl carbonate (DMC) as the electrolyte and air as the gas. The conversion factors between lattice and SI units are provided in the table below:

Table A1.
Conversion factors between SI units and LBM units (lu = length unit, ts = time step, mu = mass unit).
Table A1.
Conversion factors between SI units and LBM units (lu = length unit, ts = time step, mu = mass unit).
| Unit | Conversion Factor | Unit | Conversion Factor |
|---|---|---|---|
| Length | Time | ||
| Mass | Pressure | ||
| Kinematic viscosity | Force density | ||
| Dynamic viscosity | Velocity | ||
| Surface tension |

Table A2.
Overview of the physical parametrization of the electrolyte (E) and gas (G).
Table A2.
Overview of the physical parametrization of the electrolyte (E) and gas (G).
| SI Units | Lattice Units | |
|---|---|---|
| Length | ||
| Density | () | |
| [24] | ||
| Kinematic viscosity | ||
| [24] | ||
| Surface tension | ||
| Contact angle | ||
| Separator | ||
| #1 | ||
| #2 | ||
| #3 | ||
| Relaxation coefficient |
Appendix B
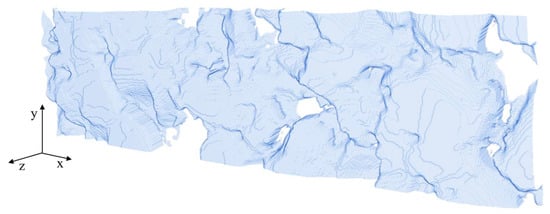
Figure A1.
Surface of the anode geometry #1.
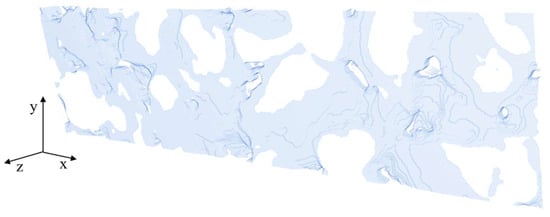
Figure A2.
Surface of the anode geometry #2.
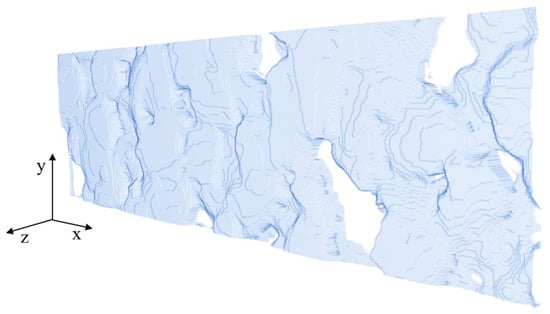
Figure A3.
Surface of the anode geometry #3.
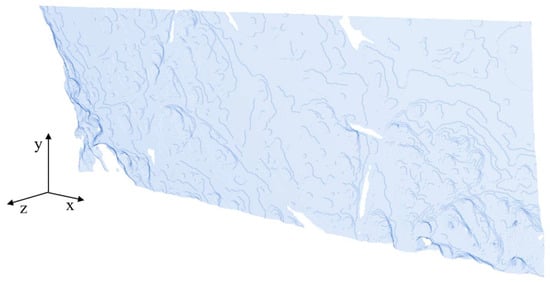
Figure A4.
Surface of the separator geometry.
References
- Baazouzi, S.; Feistel, N.; Wanner, J.; Landwehr, I.; Fill, A.; Birke, K.P. Design, Properties, and Manufacturing of Cylindrical Li-Ion Battery Cells—A Generic Overview. Batteries 2023, 9, 309. [Google Scholar] [CrossRef]
- Weeber, M.; Wanner, J.; Schlegel, P.; Birke, K.P.; Sauer, A. Methodology for the Simulation based Energy Efficiency Assessment of Battery Cell Manufacturing Systems. Procedia Manuf. 2020, 43, 32–39. [Google Scholar] [CrossRef]
- Wanner, J.; Weeber, M.; Birke, K.P.; Sauer, A. Production planning and process optimization of a cell finishing process in battery cell manufacturing. Procedia CIRP 2022, 112, 507–512. [Google Scholar] [CrossRef]
- Kampker, A.; Heimes, H.; Offermanns, C.; Wennemar, S.; Robben, T.; Lackner, N. Optimizing the Cell Finishing Process: An Overview of Steps, Technologies, and Trends. WEVJ 2023, 14, 96. [Google Scholar] [CrossRef]
- Birke, K.P.; Weeber, M.; Oberle, M. Handbook on Smart Battery Cell Manufacturing: The Power of Digitalization; WORLD SCIENTIFIC: Singapore, 2022; ISBN 978-981-12-4561-9. [Google Scholar]
- Wanner, J.; Weeber, M.; Birke, K.P.; Sauer, A. Quality Modelling in Battery Cell Manufacturing Using Soft Sensoring and Sensor Fusion—A Review. In Proceedings of the 2019 9th International Electric Drives Production Conference (EDPC), Esslingen, Germany, 3–4 December 2019; IEEE: Piscataway, NJ, USA, 2019; pp. 1–9, ISBN 978-1-7281-4319-4. [Google Scholar]
- Wanner, J.; Weeber, M.; Birke, K.P.; Sauer, A. Potentials of a Digital Twin implementation in the wetting process in battery cell manufacturing. Procedia CIRP 2023, 118, 987–992. [Google Scholar] [CrossRef]
- Sauter, C.; Zahn, R.; Wood, V. Understanding Electrolyte Infilling of Lithium Ion Batteries. J. Electrochem. Soc. 2020, 167, 100546. [Google Scholar] [CrossRef]
- Kaden, N.; Schlüter, N.; Leithoff, R.; Savas, S.; Grundmeier, S.; Dröder, K. Influence of the Lamination Process on the Wetting Behavior and the Wetting Rate of Lithium-Ion Batteries. Processes 2021, 9, 1851. [Google Scholar] [CrossRef]
- Peter, C.; Nikolowski, K.; Reuber, S.; Wolter, M.; Michaelis, A. Chronoamperometry as an electrochemical in situ approach to investigate the electrolyte wetting process of lithium-ion cells. J. Appl. Electrochem. 2020, 50, 295–309. [Google Scholar] [CrossRef]
- Schilling, A.; Gümbel, P.; Möller, M.; Kalkan, F.; Dietrich, F.; Dröder, K. X-ray Based Visualization of the Electrolyte Filling Process of Lithium Ion Batteries. J. Electrochem. Soc. 2019, 166, A5163–A5167. [Google Scholar] [CrossRef]
- Kaden, N.; Schlimbach, R.; Rohde García, Á.; Dröder, K. A Systematic Literature Analysis on Electrolyte Filling and Wetting in Lithium-Ion Battery Production. Batteries 2023, 9, 164. [Google Scholar] [CrossRef]
- Günter, F.J.; Keilhofer, J.; Rauch, C.; Rössler, S.; Schulz, M.; Braunwarth, W.; Gilles, R.; Daub, R.; Reinhart, G. Influence of pressure and temperature on the electrolyte filling of lithium-ion cells: Experiment, model and method. J. Power Sources 2022, 517, 230668. [Google Scholar] [CrossRef]
- Weydanz, W.J.; Reisenweber, H.; Gottschalk, A.; Schulz, M.; Knoche, T.; Reinhart, G.; Masuch, M.; Franke, J.; Gilles, R. Visualization of electrolyte filling process and influence of vacuum during filling for hard case prismatic lithium ion cells by neutron imaging to optimize the production process. J. Power Sources 2018, 380, 126–134. [Google Scholar] [CrossRef]
- Lautenschlaeger, M.P.; Weinmiller, J.; Kellers, B.; Danner, T.; Latz, A. Homogenized lattice Boltzmann model for simulating multi-phase flows in heterogeneous porous media. Adv. Water Resour. 2022, 170, 104320. [Google Scholar] [CrossRef]
- Shodiev, A.; Primo, E.; Arcelus, O.; Chouchane, M.; Osenberg, M.; Hilger, A.; Manke, I.; Li, J.; Franco, A.A. Insight on electrolyte infiltration of lithium ion battery electrodes by means of a new three-dimensional-resolved lattice Boltzmann model. Energy Storage Mater. 2021, 38, 80–92. [Google Scholar] [CrossRef]
- Shan, X.; Chen, H. Lattice Boltzmann model for simulating flows with multiple phases and components. Phys. Rev. E Stat. Phys. Plasmas Fluids Relat. Interdiscip. Top. 1993, 47, 1815–1819. [Google Scholar] [CrossRef]
- Shodiev, A.; Zanotto, F.M.; Yu, J.; Chouchane, M.; Li, J.; Franco, A.A. Designing electrode architectures to facilitate electrolyte infiltration for lithium-ion batteries. Energy Storage Mater. 2022, 49, 268–277. [Google Scholar] [CrossRef]
- Rokhforouz, M.R.; Akhlaghi Amiri, H.A. Effects of grain size and shape distribution on pore-scale numerical simulation of two-phase flow in a heterogeneous porous medium. Adv. Water Resour. 2019, 124, 84–95. [Google Scholar] [CrossRef]
- Sheng, Y.; Fell, C.R.; Son, Y.K.; Metz, B.M.; Jiang, J.; Church, B.C. Effect of Calendering on Electrode Wettability in Lithium-Ion Batteries. Front. Energy Res. 2014, 2, 121653. [Google Scholar] [CrossRef]
- Wanner, J.; Birke, K.P. Comparison of an Experimental Electrolyte Wetting of a Lithium-Ion Battery Anode and Separator by a Lattice Boltzmann Simulation. Batteries 2022, 8, 277. [Google Scholar] [CrossRef]
- Kleefoot, M.-J.; Enderle, S.; Sandherr, J.; Bolsinger, M.; Maischik, T.; Simon, N.; Martan, J.; Ruck, S.; Knoblauch, V.; Riegel, H. Enhancement of the wettability of graphite-based lithium-ion battery anodes by selective laser surface modification using low energy nanosecond pulses. Int. J. Adv. Manuf. Technol. 2022, 118, 1987–1997. [Google Scholar] [CrossRef]
- AlRatrout, A.; Blunt, M.J.; Bijeljic, B. Wettability in complex porous materials, the mixed-wet state, and its relationship to surface roughness. Proc. Natl. Acad. Sci. USA 2018, 115, 8901–8906. [Google Scholar] [CrossRef] [PubMed]
- Lautenschlaeger, M.P.; Prifling, B.; Kellers, B.; Weinmiller, J.; Danner, T.; Schmidt, V.; Latz, A. Understanding Electrolyte Filling of Lithium-Ion Battery Electrodes on the Pore Scale Using the Lattice Boltzmann Method. Batter. Supercaps 2022, 5, e202200090. [Google Scholar] [CrossRef]
- Jeon, D.H. Wettability in electrodes and its impact on the performance of lithium-ion batteries. Energy Storage Mater. 2019, 18, 139–147. [Google Scholar] [CrossRef]
- Jeon, D.H. Enhancing electrode wettability in lithium-ion battery via particle-size ratio control. Appl. Mater. Today 2021, 22, 100976. [Google Scholar] [CrossRef]
- El Malki, A.; Asch, M.; Arcelus, O.; Shodiev, A.; Yu, J.; Franco, A.A. Machine learning for optimal electrode wettability in lithium ion batteries. J. Power Sources Adv. 2023, 20, 100114. [Google Scholar] [CrossRef]
- Chen, H.-S.; Yang, S.; Song, W.-L.; Yang, L.; Guo, X.; Yang, X.-G.; Li, N.; Fang, D. Quantificational 4D visualization and mechanism analysis of inhomogeneous electrolyte wetting. eTransportation 2023, 16, 100232. [Google Scholar] [CrossRef]
- Beyer, S.; Kobsch, O.; Pospiech, D.; Simon, F.; Peter, C.; Nikolowski, K.; Wolter, M.; Voit, B. Influence of surface characteristics on the penetration rate of electrolytes into model cells for lithium ion batteries. J. Adhes. Sci. Technol. 2020, 34, 849–866. [Google Scholar] [CrossRef]
- Washburn, E.W. The Dynamics of Capillary Flow. Phys. Rev. 1921, 17, 273–283. [Google Scholar] [CrossRef]
- Fries, N.; Dreyer, M. An analytic solution of capillary rise restrained by gravity. J. Colloid Interface Sci. 2008, 320, 259–263. [Google Scholar] [CrossRef] [PubMed]
- Merck KGaA. 803525 Sigma-Aldrich Dimethylcarbonat: Dimethyl Carbonate for Synthesis. CAS 616-38-6, Chemical Formula (CH3O)2CO. Available online: https://www.merckmillipore.com/DE/de/product/Dimethyl-carbonate,MDA_CHEM-803525#anchor_orderingcomp (accessed on 1 June 2023).
- Lemmon, E.W. Thermodynamic Properties of Dimethyl Carbonate. J. Phys. Chem. Ref. Data 2011, 40, 43106. [Google Scholar] [CrossRef]
- Rodríguez, A.; Canosa, J.; Domínguez, A.; Tojo, J. Viscosities of Dimethyl Carbonate or Diethyl Carbonate with Alkanes at Four Temperatures. New UNIFAC−VISCO Parameters. J. Chem. Eng. Data 2003, 48, 146–151. [Google Scholar] [CrossRef]
- Latt, J.; Malaspinas, O.; Kontaxakis, D.; Parmigiani, A.; Lagrava, D.; Brogi, F.; Belgacem, M.B.; Thorimbert, Y.; Leclaire, S.; Li, S.; et al. Palabos: Parallel Lattice Boltzmann Solver. Comput. Math. Appl. 2021, 81, 334–350. [Google Scholar] [CrossRef]
- Hansen, C.D. Visualization Handbook; Elsevier Science: San Diego, CA, USA, 2011; ISBN 9780080481647. [Google Scholar]
- Logan, E.R.; Tonita, E.M.; Gering, K.L.; Li, J.; Ma, X.; Beaulieu, L.Y.; Dahn, J.R. A Study of the Physical Properties of Li-Ion Battery Electrolytes Containing Esters. J. Electrochem. Soc. 2018, 165, A21–A30. [Google Scholar] [CrossRef]
Disclaimer/Publisher’s Note: The statements, opinions and data contained in all publications are solely those of the individual author(s) and contributor(s) and not of MDPI and/or the editor(s). MDPI and/or the editor(s) disclaim responsibility for any injury to people or property resulting from any ideas, methods, instructions or products referred to in the content. |
© 2023 by the authors. Licensee MDPI, Basel, Switzerland. This article is an open access article distributed under the terms and conditions of the Creative Commons Attribution (CC BY) license (https://creativecommons.org/licenses/by/4.0/).