Article

Early Detection of Health Condition Degradation of Circuit Breaker Based on Electrical Quantity Monitoring

1
State Grid Shandong Electric Power Research Institute, Jinan 250003, China
2
State Key Laboratory of Control and Simulation of Power Systems and Generation Equipment, Department of Electrical Engineering, Tsinghua University, Haidian District, Beijing 100084, China
*
Author to whom correspondence should be addressed.
Energies 2023, 16(14), 5581; https://doi.org/10.3390/en16145581
Submission received: 30 March 2023 / Revised: 11 July 2023 / Accepted: 13 July 2023 / Published: 24 July 2023
(This article belongs to the Special Issue Fault Detection and Diagnosis of Electrical Power System Equipments)

Abstract

:
Circuit breakers on the filter bank branches in converter stations are vulnerable to contact wear and mechanical deterioration caused by frequent operations, which can lead to circuit breaker breakdowns and explosions. It is imperative to conduct research on the early detection of abnormal states in circuit breakers. Existing electrical quantity-based detection methods are constrained by a priori assumptions, and their measurement methods are susceptible to interference, leading to misjudgments. To address this issue, this paper examines the influence of changes in critical breakdown field strength and contact spacing on circuit breaker operation states. It also proposes a technical scheme that employs breakdown current values to comprehensively characterize circuit breaker operation states, replacing the use of critical breakdown field strength and contact spacing. An early detection method for abnormal circuit breaker states based on a sequence of breakdown current ratios at different times is proposed, and its effectiveness is verified through simulation and field recording data.

1. Introduction

The circuit breaker on the filter branch in the AC bus of the converter station demands frequent operation to regulate the reactive power balance. This frequent operation can potentially lead to performance degradation. As the operation is on capacitive loads, if an abnormal arc occurs during circuit breaker operation, it may result in a discharge explosion, seriously endangering the operational safety of the whole converter station.
In circuit breaker’s frequent operation process, due to arc ablation, high-temperature oxidation, friction contact, and other factors, the contact surface is easy to generate fine particles [1], leading to the tip discharge effect, which subsequently reduces the insulation margin between circuit breaker contacts. Simultaneously, the frequent operation of the circuit breaker may lead to spring fatigue, and the relaxation of spring stress can slow down the contact operation speed [2]. As a result, it cannot isolate the fault quickly and effectively. Furthermore, it may also cause significant distortion of the tie rod to make the contact move faster, and the mechanical mechanism may bear overloaded mechanical stress, causing structural damage or deformation and shortening the service life. Thus, it is imperative to carry out research on the early detection of the AC circuit breakers abnormal state.
Previous studies on the online detection of the operating state of AC circuit breakers have mainly focused on detecting contact wear and mechanical deterioration. The crucial element of detecting contact wear lies in effectively extracting characteristic quantities that signify the extent of contact wear, including arc energy [3,4], dynamic contact resistance [5,6], contact thickness, and mass loss [7]. Among these, the electrical quantity detection method based on arcing energy, dynamic contact resistance, and other electrical quantities can obtain the contact state without dismantling the arc extinguishing chamber and has the ability of online detection, which has gained more attention in recent years.
The arcing energy method calculates the integral value of the current in the arcing time, quantitatively reflecting the contact wear of the single operation of the circuit breaker. In Reference [8], the traditional dynamic contact resistance model was established by analyzing the functional relationship between dynamic conductance G, surface pressure P, and contact surface S, and the indirect calculation of dynamic contact resistance was realized. A hardware measurement device for dynamic contact resistance, combined with software simulation analysis to realize the simulation of dynamic contact resistance was introduce in Ref. [9], which realized the direct measurement of dynamic contact resistance. However, these methods assume that the arc current value in the arcing time is constant, neglecting the attenuation process of the current, which leads to inaccurate calculation results. On the other hand, the dynamic resistance method employs the measurement circuit to detect the average value of the dynamic resistance value and determines the contact wear by analyzing the stability of the resistance value. Nonetheless, the different types of measurement methods, such as the power supply type, significantly affect the resistance measurement results. The smaller the measurement current, the more imprecise the dynamic resistance measurement results are. Based on the above analysis, it is apparent that the existing detection methods based on electrical quantities are limited by unreasonable assumptions, and the measurement methods are prone to interference and can lead to erroneous detection results.
The current research on the online detection of AC circuit breaker operating states mainly focuses on detecting contact wear and mechanical transmission mechanism abnormalities [10,11]. Detecting contact wear involves extracting characteristic quantities that characterize the degree of wear, such as arc energy, dynamic contact resistance, contact thickness, and mass loss. The electrical quantity detection method is a popular approach that can obtain contact state information without dismantling the arc extinguishing chamber and can be carried out online [12]. However, existing electrical quantity detection methods have limitations due to the assumptions made and measurement methods that can lead to interference and inaccurate results.
Detecting mechanical transmission mechanism abnormalities can be achieved through analyzing the vibration signal of the circuit breaker or using the relationship between mechanical performance and the internal switching-closing coil current signal of the circuit breaker. In reference [13], the Fourier transform is limited by the window, and the predictive estimated value of the characteristic signal in different states is extracted and identified with the reference value to realize the diagnosis. However, in order to further determine the fault type, the literature [14] carried out EMD decomposition, and the decomposed different modal signals were used as feature quantities for identification and diagnosis. However, both methods have limitations, such as requiring built-in sensors or being prone to large diagnostic errors due to inaccurate eigenvalue extraction.
To address these limitations, this paper proposes an early detection method that quantitatively analyzes the influence of the deterioration process of the circuit breaker on its performance parameters and identifies its abnormal health state by using different breakdown current ratios. This method has the advantages of fast calculation speed, no sample quality constraints, and no deterioration of the detection threshold over time.

2. Characteristic Analysis of Circuit Breaker Operation State

The process of closing an AC circuit breaker involves using a mechanical transmission mechanism to move the moving contact towards the static contact at a constant speed until they make contact. The control loop receives the closing command, causing the closing spring inside the operating mechanism to release energy and act on the transmission rod inside the pillar. This upward movement drives the transmission shaft indirectly via the insulation rod, which in turn drives the moving contact inside the arc extinguishing chamber at the top of the circuit breaker towards the static contact. A successful closing occurs when the dynamic and static contacts are mechanically connected. However, during the general closing process, an electrical connection is formed in advance due to the arc generated by the breakdown between the fractures before the physical contact of the contacts [15].
Ideally, the surface of the arc contact is smooth, and the critical breakdown field strength Eset of the surface is fixed [16]. However, due to the high temperature burning of the arc and friction contact, the critical breakdown field strength Eset changes, and the abnormal mechanical transmission mechanism means that the contact spacing changes at the same time as the moving contact movement. Therefore, whether it is to characterize the electrical or mechanical life of the circuit breaker, it can be characterized by the critical breakdown field strength Eset and the degree of contact spacing d change. Considering that the health status of the circuit breaker is a degradation process, when the cumulative wear of the contact and the abnormality of the operating mechanism cause the critical breakdown field strength Eset and the contact spacing d to change to a certain extent, an alarm or shutdown should be issued. Therefore, the mathematical description of the operating state of the circuit breaker is given as follows:
| E s e t ( t ) E 0 | E t h | d ( t ) d 0 | d t h
where E0 and d0 are the critical breakdown field strength and the corresponding contact spacing value in the ideal state, respectively. The breakdown field strength at the first breakdown is E0, and the corresponding contact spacing is d0. Eth and dth are the alarm thresholds when the contact wears and the mechanical mechanism deteriorates to a certain extent.
It can be seen from (1) that the key to the detection of circuit breaker health abnormalities is to accurately obtain the real-time changes of Eset and d values. However, due to the obvious uncertainty of the field enhancement factor β generated by the tip effect of fine particles on the electrode surface, the change of Eset is random [17], so the change of Eset is difficult to measure directly. To find a new characteristic quantity instead of Eset to characterize the wear degree of circuit breaker contacts, the following analyzes the closing and arc development processes of the circuit breaker.
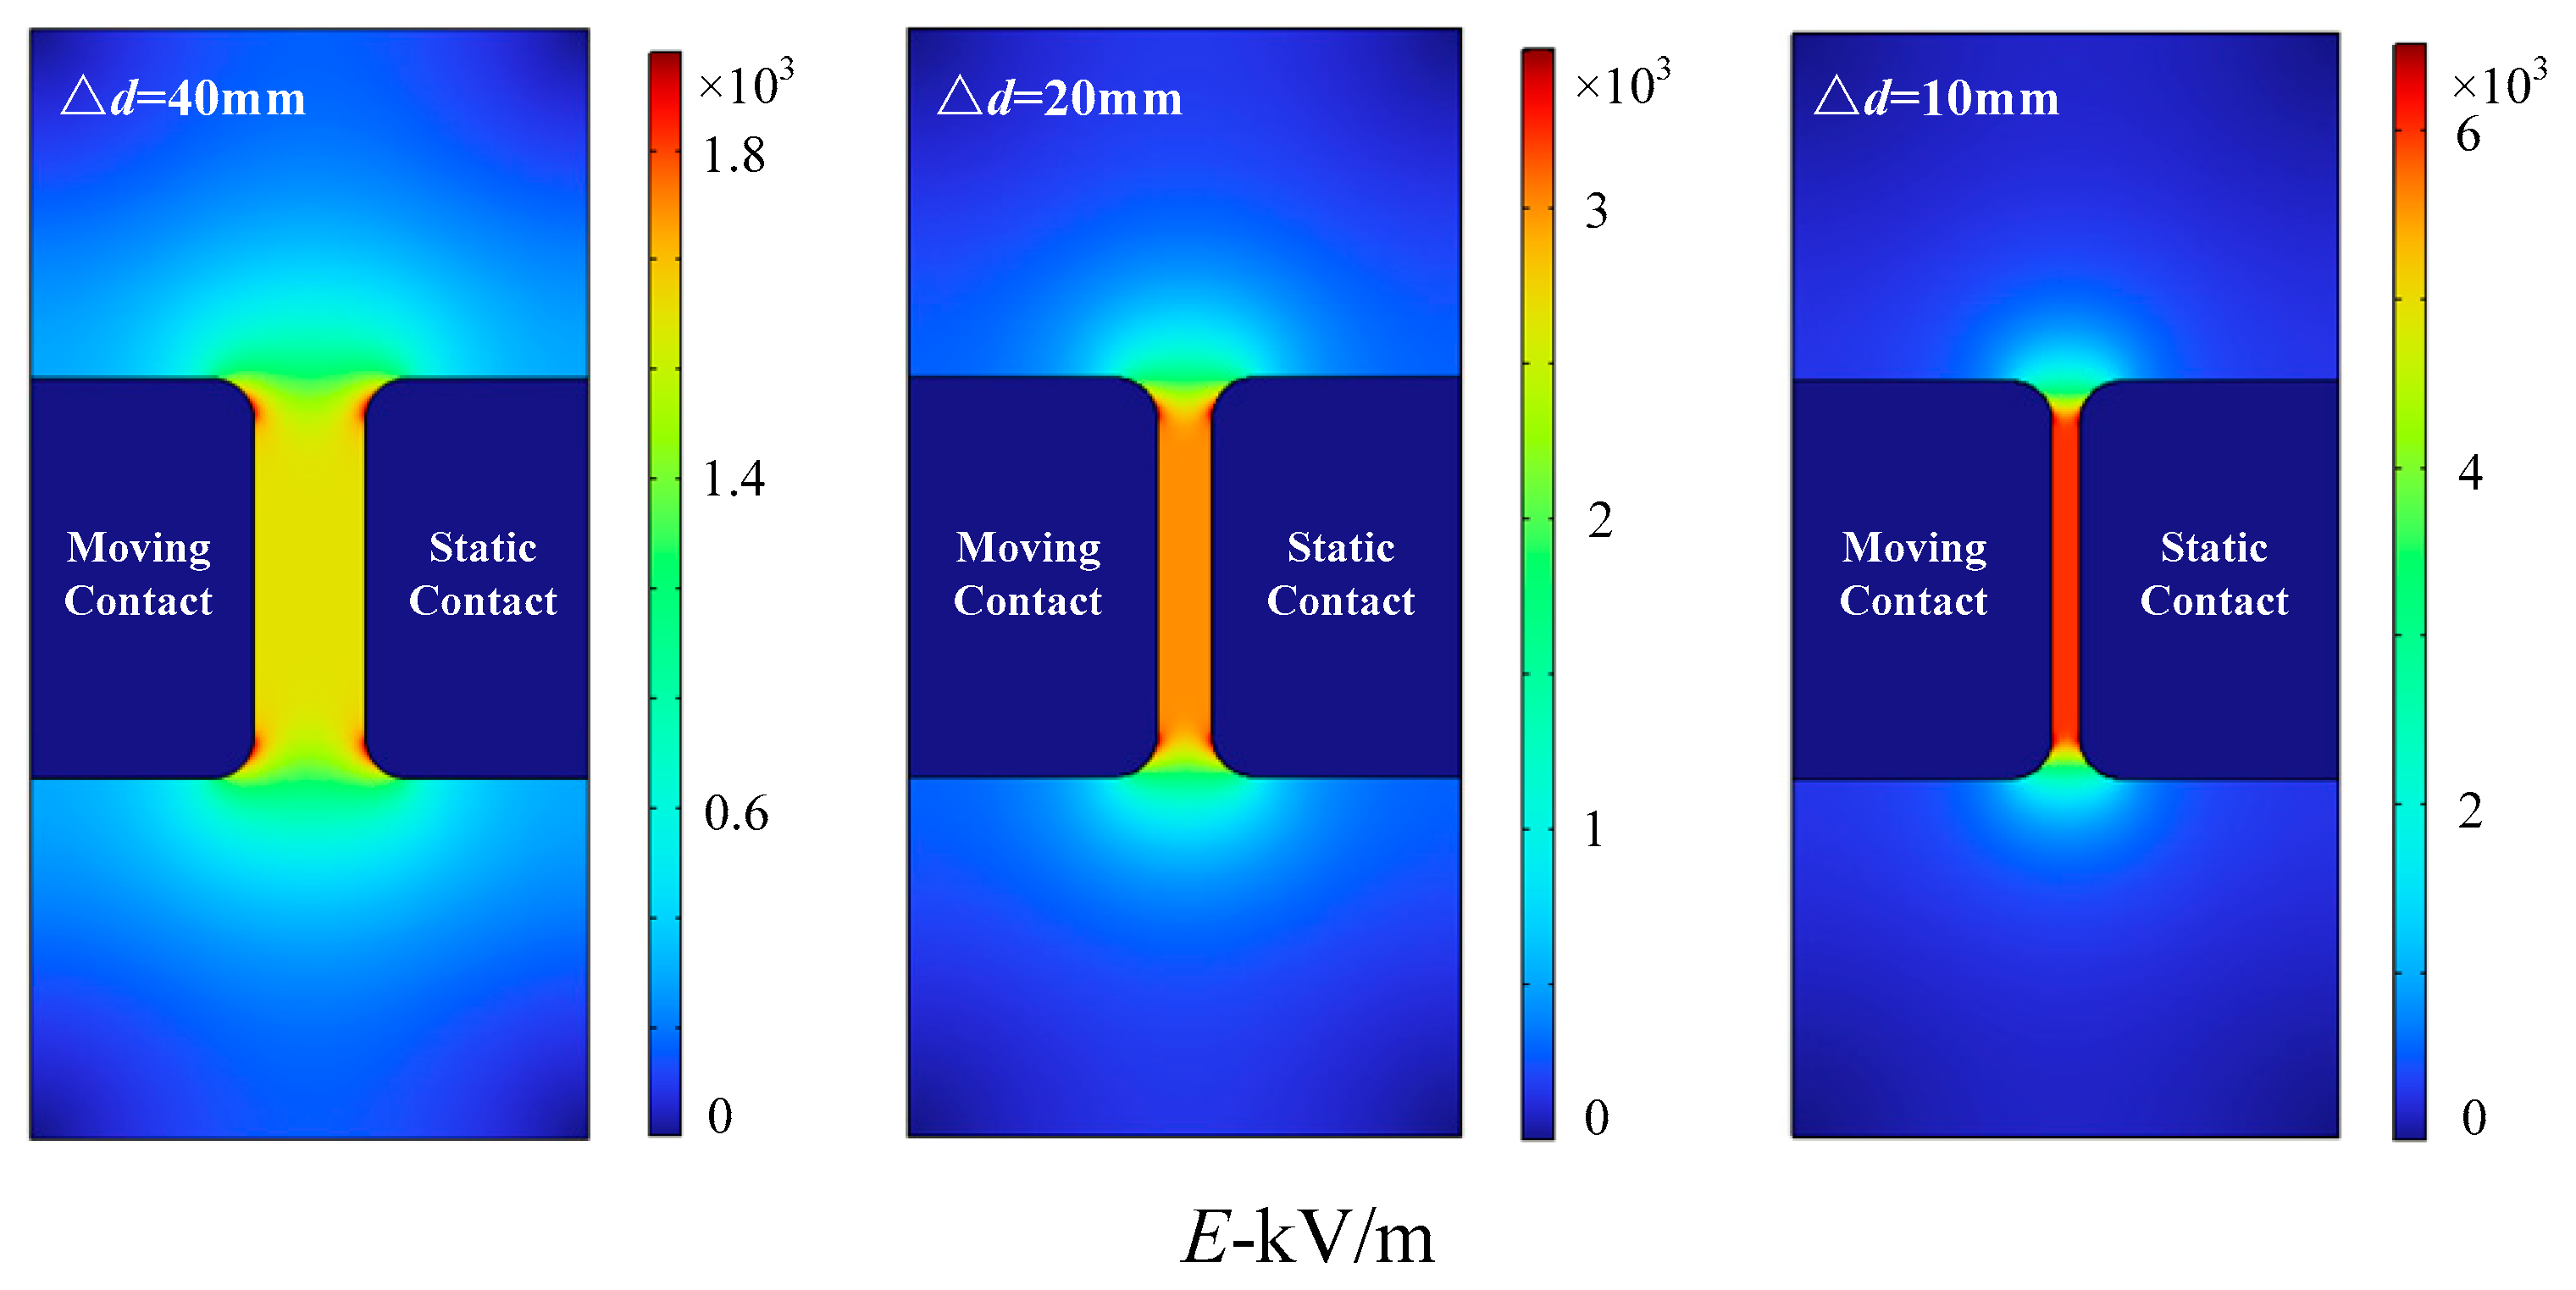
During the closing process, the spacing between the fractures of the circuit breaker gradually reduces. As the closing time is usually greater than 5 ms, the field strength between the fractures undergoes significant dynamic changes during the closing process. Figure 1 displays the simulation results of the multi-physical field software (based on COMSOL Multiphysics simulation software V5.6, Stockholm, Sweden, COMSOL Co.) of the voltage level of the 220 kV power supply side at the contact bus of the moving contact end and the no-load grounding of the static contact end, the mechanical closing operation of the circuit breaker, and the gradual reduction of the arc chamber fracture spacing with the moving speed of 10 mm/ms [18], where the electrode is made of copper material.
As shown in Figure 1, the color between the fractures gradually darkens, indicating a gradual increase in field strength. This signifies that the electric field force experienced by the particles on the contact surface gradually strengthens. Under the action of an applied electric field, the contact surface is ionized, and the relationship between them is:
q E x W i
where q is the amount of electron charge, E is the field strength between the fractures, x is the electric moving distance, and Wi is the work function of the metal.
When the electron moving distance x on the metal surface is constant, there is a minimum breakdown field strength, and the electron escapes after satisfying (2) [19]. After the electron escapes, it is subjected to the electric field force to collide and ionize between the fractures, eventually leading to gas breakdown. The mathematical description of the breakdown condition is:
E = u d E s e t
where u is the instantaneous value of the voltage difference between the breaks; that is, the instantaneous value of the breakdown field strength is greater than or equal to Eset when the contact is broken, so the instantaneous value of the breakdown field strength E can be considered to replace Eset. However, it can be seen from (3) that the instantaneous breakdown field strength E depends on the voltage difference u between the breaks and the contact spacing d. The bus-side voltage of the circuit breaker can be measured, but the change of the voltage on the opposite side depends on the residual charge of the connected capacitor bank after discharge, which cannot be measured in real time [20]. Therefore, it is difficult to accurately obtain the voltage value of the circuit breaker fracture in practice. In addition, considering factors such as cost and reliability, the circuit breaker is generally not equipped with contact displacement sensors, so the real-time change in contact spacing is not easy to know.

3. Selection of Circuit Breaker Characterization Quantity

To identify the measurable physical quantities that can replace the instantaneous breakdown field strength, an analysis of the circuit breaker contact breakdown process is necessary. When the arc is generated, the arc current mainly develops through the collision ionization of electrons, which is affected by the probability and intensity of electron impact ionization and indirectly influenced by the instantaneous breakdown field strength. This field strength also affects the number of new electrons generated and the breakdown current value that results from the directional movement of electrons. During collision ionization, the time for the electron current to rapidly increase and reach its peak value is typically very short, usually less than 0.1 ms [21], and the change in field strength during this process is minor. Therefore, it can be assumed that the measured breakdown peak current characterizes the instantaneous breakdown field strength, as the current reaches its peak value at the moment of breakdown.

Analysis of the Breakdown Current Characteristic

The above process can be mathematically described by introducing the collision ionization coefficient α, which characterizes the average number of collision ionizations completed by an electron in a 1 cm travel along the direction of the electric field. In other words, α represents the number of new electrons generated by an electron moving 1 cm [22].
α = 1 λ e U i λ E
where λ is the average free path distance of electrons, which represents the mean motion distance of two adjacent collisions of molecules, about 10−5 cm. The value is related to two factors: gas molecule type (related to contact material) and gas pressure in the container. In the study, assuming that the pressure does not change, the most commonly used copper contact material for circuit breakers is selected, and the reference values given are applicable to the vast majority of cases. Ui is the ionization potential of the gas, which is numerically equal to the ionization energy in units of eV, with a value of 15. These parameters are not affected by the type of circuit breaker but are only related to the motion properties of gas molecules.
Assuming that the initial number of electrons generated by each breakdown is n0, dn new electrons will be generated at the distance of dx after collision ionization. According to the definition of collision ionization coefficient:
d n = α n d x
Integrating on both sides of (5) with the upper limit of the integration on the right side set to the breakdown distance between the electrodes, denoted as “d”. The upper and lower limits of integration on the left side correspond to the number of electrons on two electrodes, respectively. Solving for n, the two sides of the equal sign are multiplied by the electron charge q. Then the expression of breakdown current I was obtained by sorting out the formula:
I = I 0 e α d
By substituting (4) into (6), it can further obtain:
I = I 0 e 1 λ e ln d U i λ u d
where I0 is the saturation current caused by the ionization factor, about 10−21 kA.
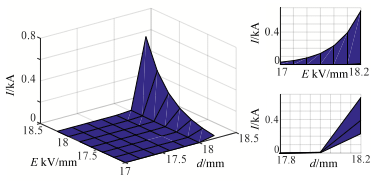
According to (3), d/u = 1/E. Therefore, (7) actually gives the relationship between the breakdown current, the instantaneous breakdown field strength, and the contact spacing. The three-dimensional characteristics are shown in Figure 2, where I-E and I-d are the projections of the three-dimensional characteristics on the two-dimensional plane.
From Figure 2, it is apparent that the value of the breakdown current is directly proportional to the instantaneous breakdown field strength and contact spacing, but only after the inflection point, which is located at 18 mm on the abscissa. The value at the inflection point corresponds to the critical breakdown field strength of a healthy circuit breaker. Consequently, if the observation window is positioned after the inflection point of the contact spacing, subtle changes in the instantaneous breakdown field strength and contact spacing can be delicately reflected by changes in the breakdown current value. If, however, the mechanical transmission mechanism is abnormal and the contact spacing falls before the inflection point and changes within this range, the change in the breakdown current value cannot sensitively reflect the change in contact spacing. Nonetheless, during the actual circuit breaker closing process, the contact spacing typically decreases uniformly from 200 mm, and the instantaneous transition to 18 mm is a rare occurrence and thus not considered in this paper.

4. Method for Early Detection of Circuit Breaker Abnormal State

The deterioration of circuit breakers does not typically occur abruptly or by chance. Instead, it is a gradual process characterized by irreversible changes such as the gradual burning of contacts, spring fatigue, and stress relaxation. In this process, changes in the breakdown field strength or contact spacing follow a certain trend, and the breakdown current sequence displays a monotonic trend, the steepness of which correlates to the extent of degradation. Thus, the shape of the breakdown current sequence can be analyzed to detect the stability of the sequence, which, in turn, can be used to determine whether the circuit breaker has degraded.

4.1. Detection Principle and the Criterion

The breakdown current value sequence is considered an autoregressive model, so this paper uses ADF (Augmented Dickey-Fuller) to check whether the breakdown current sequence is stable in detection step 3 of Section 4.2. The ADF test is also called the unit root test. Its basic idea is that when there is no unit root in the test sequence, the sequence is stable. Let the breakdown of the current sequence be Xt = Xt−1 + ΔXt, where Xt is a random walk process of unknown trend and ΔXt is an incremental process of random walk Xt−1. The ADF test model is:
Δ X t = γ X t 1 + i = 1 l β i Δ X t i + ε t Δ X t = α + γ X t 1 + i = 1 l β i Δ X t i + ε t Δ X t = α + β t + γ X t 1 + i = 1 l β i Δ X t i + ε t
where α is the intercept term, βt is the time trend term, εt is the white noise with the mean-variance of σ2, γ is the parameter to be solved, and l is the lag order of Xt.
Under the null hypothesis H0: γ = 0, there is at least one unit root; suppose H1: γ < 0, there is no unit root. The test process can be completed by t-testing based on the critical value table [23].
When the test results have a unit root, the sequence is determined to be a non-stationary deteriorating sequence; to further determine whether the mechanical parameter change and contact wear of the circuit breaker have reached the serious defect degree, the analysis is as follows:
Firstly, the relationship between contact spacing, breakdown field strength, and breakdown current can be obtained by the logarithmic transformation of (7):
d = λ e U i λ E ln I I 0 E = U i λ ln d λ ln I I 0
Subtract the relationship between contact spacing in (9)
Δ d = λ e U i λ E ln I 1 I 2
Among them, I1 and I2 represent the breakdown of current values when the contact spacing changes and in the ideal state, respectively.
Reference [24] provides the standard values for the breakdown field strength, approximately 9 kV/mm and 18 kV/mm, respectively, when the gas pressure is 0.1 MPa and 0.2 MPa at 300 K. Currently, the gas theory lacks a unified numerical characterization of the actual breakdown field strength. This paper considers the effects of gas pressure and temperature deviations across various regions. To facilitate numerical calculations, the value of E in (10) is taken as 12 kV/mm. Table 1 shows the breakdown of current ratios corresponding to different Δd values calculated.
It can be seen from Table 1 that when Δd > 10 mm, the change of the two breakdown current values is about 45%, while when Δd > 5 mm, the change of the two breakdown current values is only 18%. Considering the reliability and sensitivity of the detection, the threshold value Δd = 10 mm can be taken as the threshold value, corresponding to the ratio of the two breakdown currents equal to 0.69.
In view of the fact that the change in contact wear can be reflected by the change in critical breakdown field strength, the expression of breakdown field strength in (9) is organized as follows:
ln I 1 I 2 = d λ e U i λ E 1 d λ e U i λ E 2
When the contact spacing is 7.5~16 mm, the influence of contact structure change on its field strength is the most obvious [25]. In order to ensure that the two closing spacings Δd retain a certain margin, d takes 10 mm, E1 takes the breakdown field strength when the contact breakdown occurs after contact wear, and E2 takes the breakdown field strength when the contact breakdowns occur between good contacts in an ideal state.
After calculation, it is found that the change of E1 in (11) exceeds 5 kV/mm on the basis of the normal value E2, and the value of d/λe(Ui/λΕ1) is small and can be negligible. Then, I1/I2 < 0.69 in (11) is obtained. Therefore, when the breakdown current ratio is less than 0.69 or greater than 1.45, it means that the contact spacing change exceeds 10 mm or the breakdown field strength deviation exceeds 5 kV/mm. At this time, it can be judged that the circuit breaker has a serious defect and should be immediately alarmed for maintenance.

4.2. Detection Process

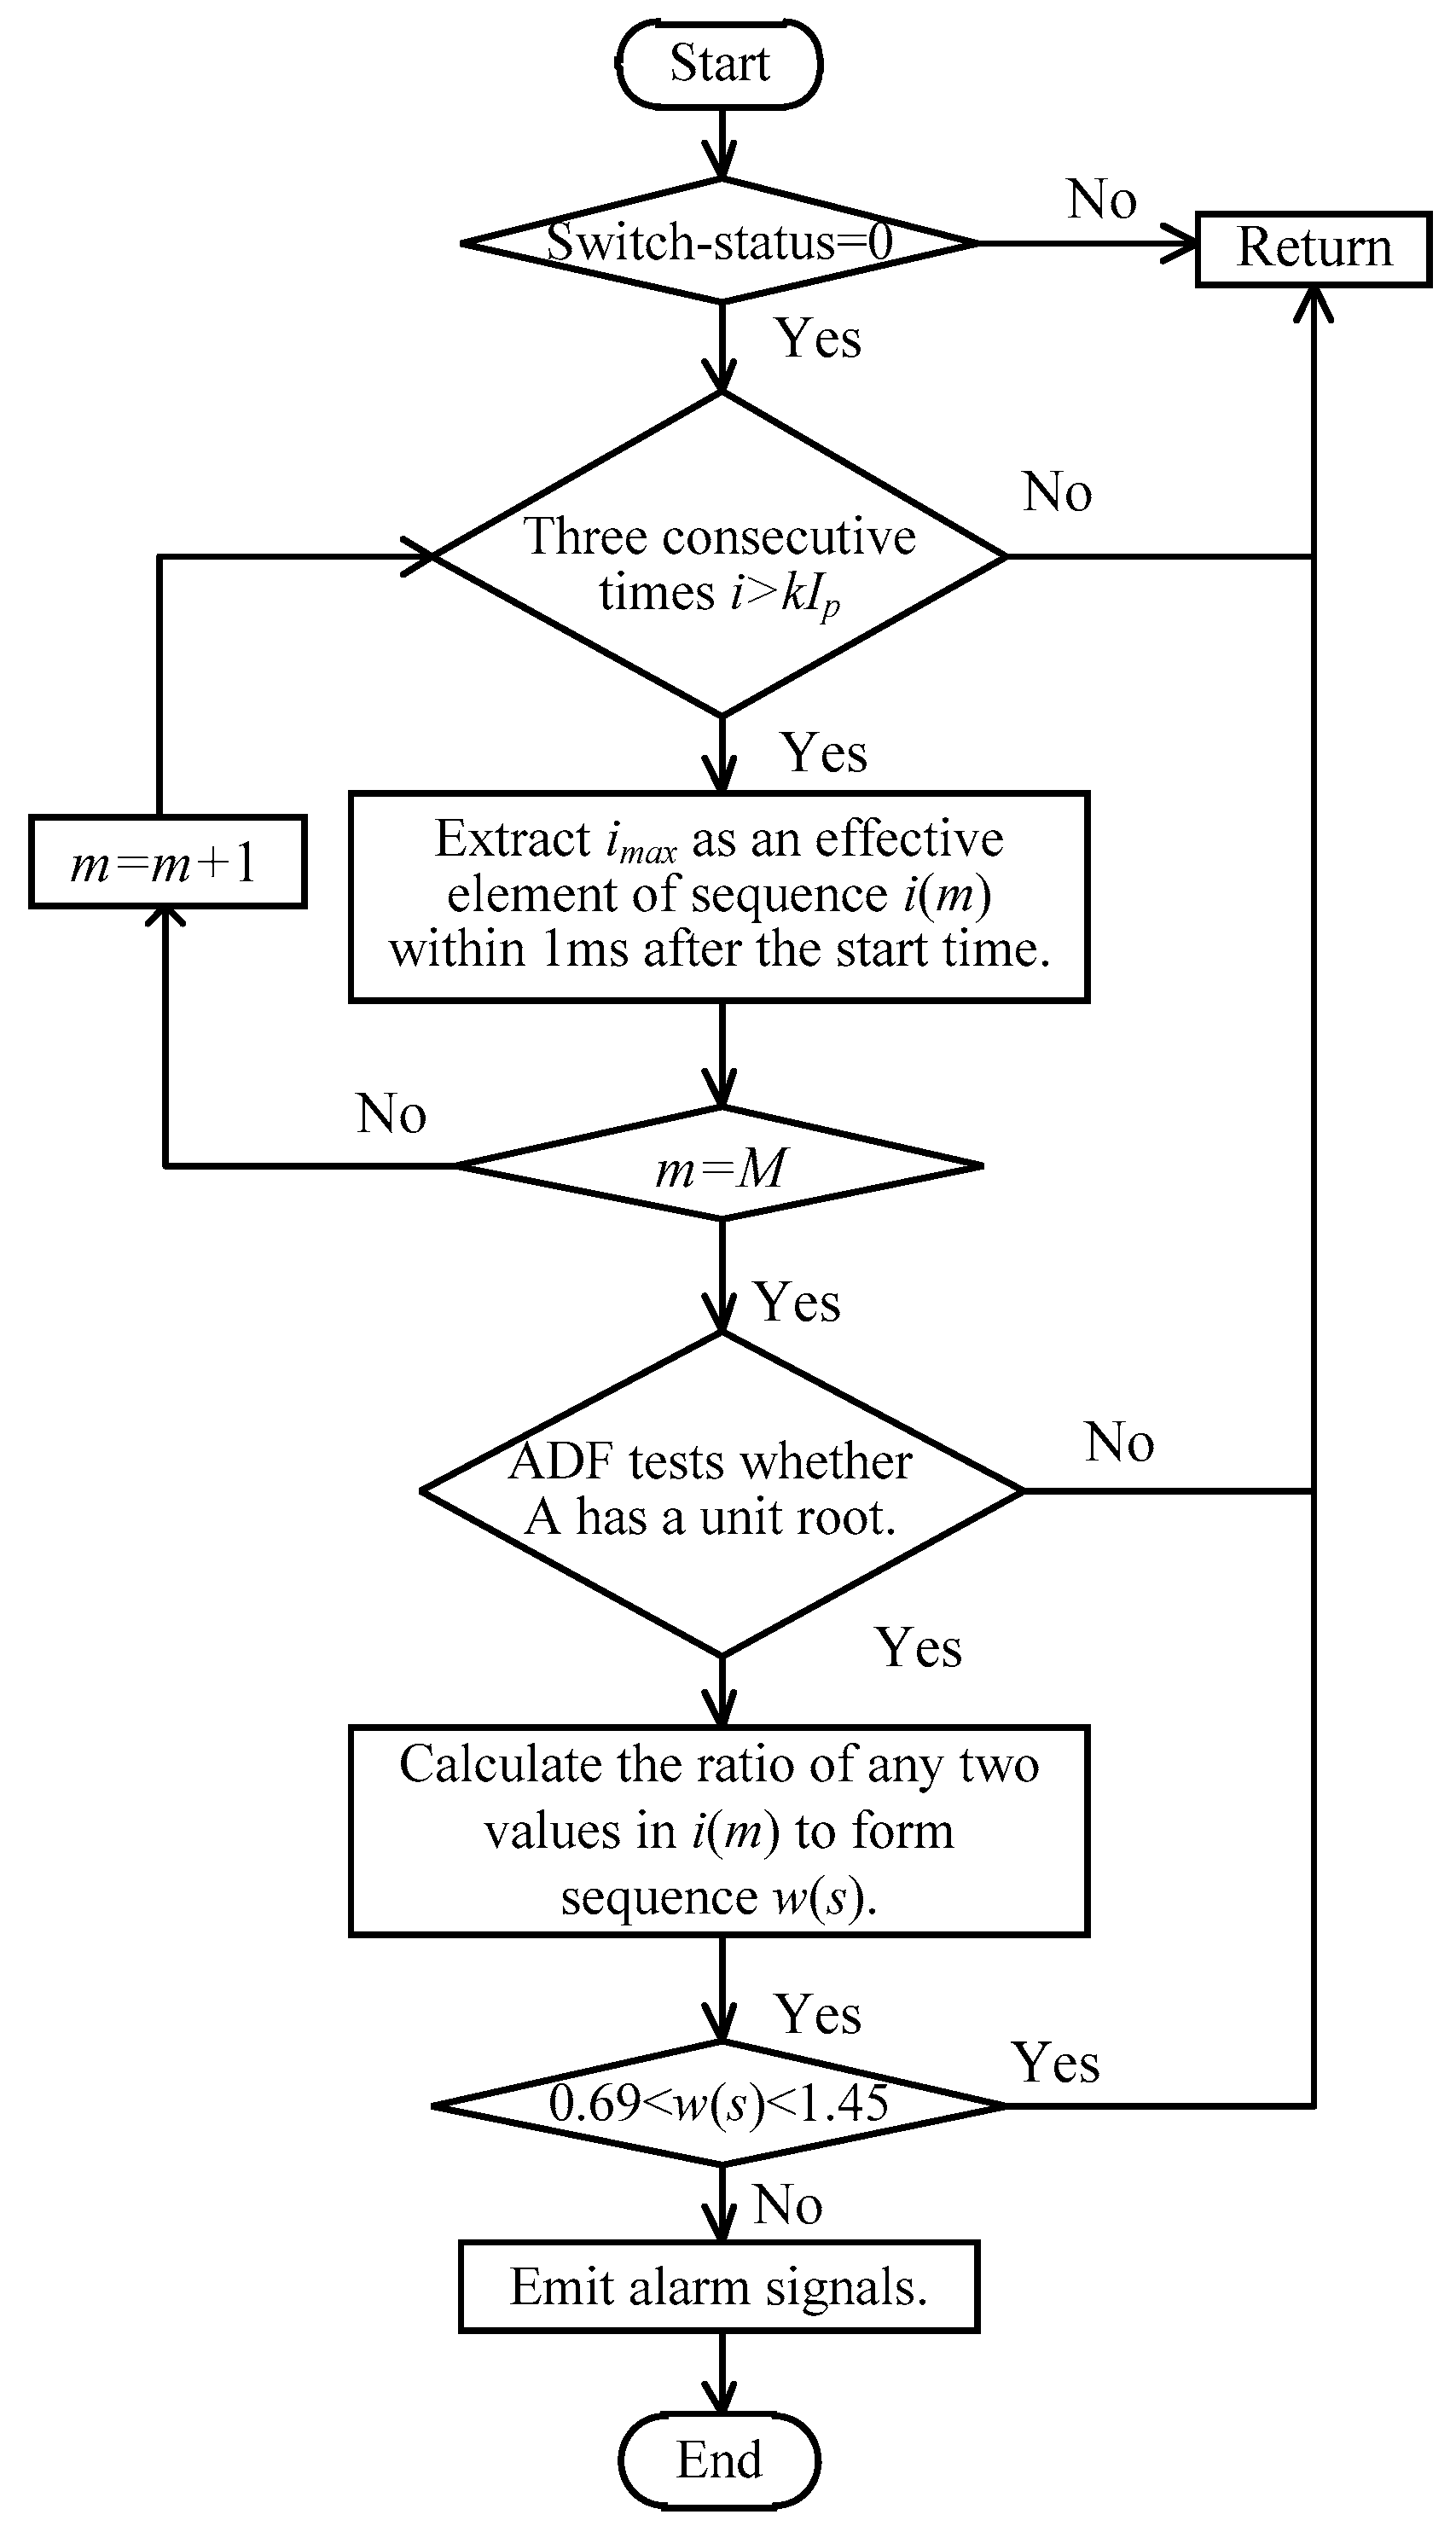
In this paper, the detection method uses the current transformer to obtain the load-side current of the filter branch. The switching state of the circuit breaker before fully closing is considered the binary value 0, and the switching state after fully closing is considered the binary value 1. The early detection process of the single-phase abnormal state of the AC circuit breaker based on closing electrical quantity monitoring is given as shown in Figure 3:
Step 1: Set the rated load current amplitude of the closing branch of the circuit breaker as Ip, collect, and monitor the instantaneous current value i when the switching state of the circuit breaker is 0 in real-time. When the continuous three i sampling values are greater than kIp, it is determined that the arc current occurs during the closing process of the circuit breaker, and we go to Step 2. Otherwise, continue to monitor the instantaneous value of the current in real-time; the value of k is less than 1, and in order to ensure sensitivity, the value of k = 1/3 is recommended.
Step 2: The sampling time when the first sampling value is greater than kIp is taken as the reference value, and the pre-breakdown peak can be reached in the subsequent fixed time window (generally 0.1 ms after arcing; the whole arcing process is generally 3–4 ms, so it is recommended that the time window be 1 ms). The current peak imax is recorded as the breakdown current value during the closing process of the circuit breaker, and the breakdown current value imax is used as an element of the continuous monitoring breakdown current sequence i(m), recorded as i(m = 1); then, the breakdown current value waiting for the next circuit breaker closing process is monitored in real-time, recorded as i(m = 2), until a complete breakdown current sequence i(m = M) is formed. In order to minimize the allowable error of the sample, it is recommended to generally take M > 10 and go to Step 3.
Step 3: ADF test model is established based on (8), and the ADF test is used to judge whether the sequence i(m) is stable. If the original sequence test results accept the null hypothesis, indicating that there is a unit root, that is, the original sequence is a non-stationary sequence, go to Step 4.
Step 4: Calculate the ratio of any two values in the i(m) sequence to form a new sequence w(s), and determine whether all values in the w(s) sequence satisfy:
0.69 < w ( s = 1 ,   , C m 2 ) < 1.45
If any value in the w(s) sequence does not satisfy (12), it indicates that the circuit breaker needs to be alarmed with a serious warning signal immediately.
Figure 3. Flow chart of circuit breaker single-phase abnormal state early detection.
Energies 16 05581 g003

5. Simulation and Field Data Verification

5.1. Simulation Verification

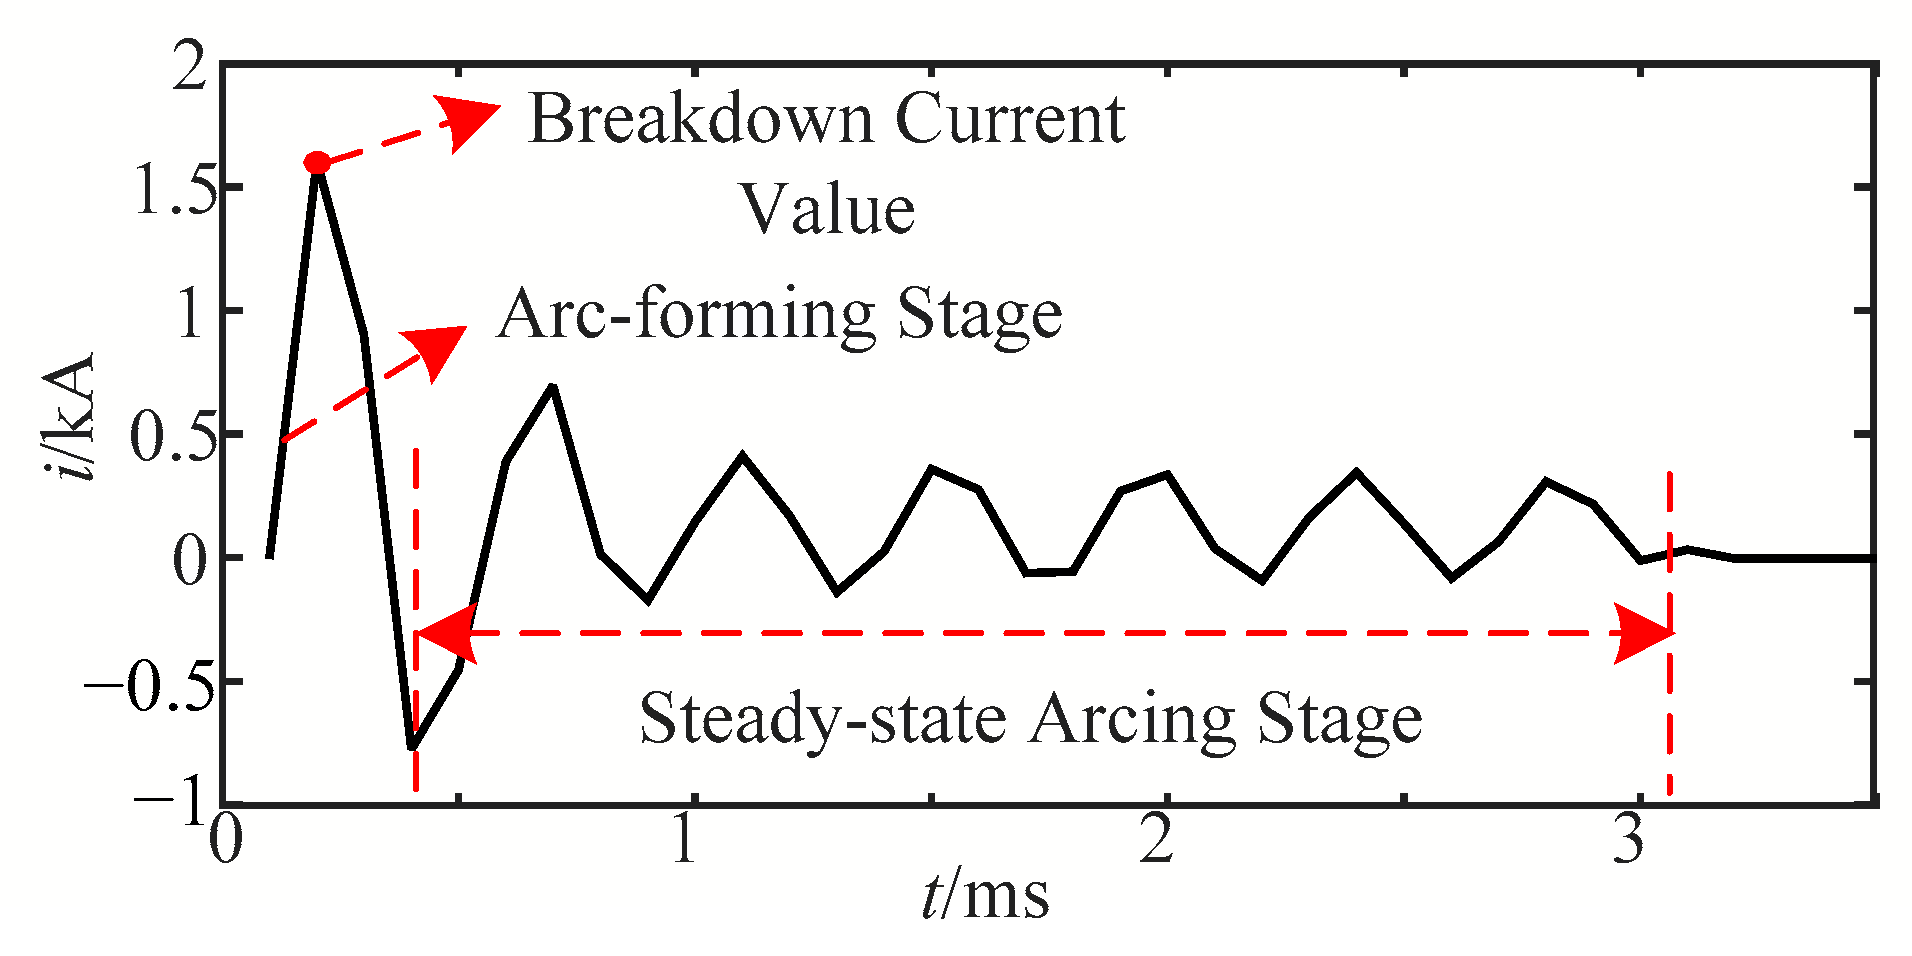
Using the actual recorded data of an arc fault, specifically phase B of the circuit breaker for the AC filter in a converter station, Figure 4 illustrates the arc current waveform.
It is shown that the current only appears after the breakdown and exhibits an upward trend until it reaches its maximum value. This period represents the arcing stage. The first zero-crossing point of the arc current is recognized as the beginning of the steady-state arcing stage [26], and the maximum current of the arcing stage is considered the breakdown current value.
To further substantiate the relationship between the breakdown current value and the difference between the breakdown field strength and the contact spacing at the moment of circuit breaker breakdown, the arcing fault model of the circuit breaker for the AC filter was constructed using the PSCAD (V4.6, Manitoba Hydro International Ltd, Canada, Manitoba) simulation software, based on actual arcing current recording data. The topology of the model is depicted in Figure 5, where K1, K2, and K3 denote isolation or grounding switches, CB signifies the circuit breaker, T1, T2, and T3 denote current transformers, F1 denotes the ground gap, and C1 denotes the filter bank. The equivalent capacitance value is 5.6 uf, and L1 represents the reactor, with an equivalent inductance value of 0.0032 H.
The relevant parameters of the model can be found in reference [27], and the relevant parameters of the circuit breaker are shown in Table 2.
In the model, the breakdown current is utilized to substitute the exponential function form of the conventional three-stage arc model in the arcing stage. Additionally, the arc resistance remains roughly constant in the steady-state arcing stage. The simulation outcomes are presented in Figure 6.
In order to verify the validity and accuracy of the model, the correlation between the simulated current and the measured arc current is analyzed. An alternative approach is to calculate the Pearson correlation coefficient, which is defined as:
r = i = 1 n ( X i X ¯ ) ( Y i Y ¯ ) i = 1 n ( X i X ¯ ) 2 i = 1 n ( Y i Y ¯ ) 2
where Xi and Yi are the simulation sample data, X and Y are the sample mean, and n is the number of samples.
In general, the closer r is to 1, the stronger the correlation between X and Y is. The similarity coefficient between the measured arc current data and the simulation data is calculated to be 0.819, which is highly correlated. Therefore, it can be considered that the constructed circuit breaker breakdown current model can highly fit the measured arc current size and trend in the pre-breakdown stage.

5.1.1. Changing the Contact Spacing Distance

The circuit breaker equipped with phase selection and closing functions regulates the separation and closure of the moving and static contacts at a specified phase angle of the system voltage waveform. Typically, the circuit breaker of the filter branch in the converter station is set to operate at the zero crossing (0° angle) of the power supply side voltage. The residual voltage of the load-side capacitor combination, after self-discharge, discharge by a specialized device, and artificial discharge, should not exceed 65 kV before closure. To minimize the impact of residual charge on the power grid during closure and achieve results closer to actual projects, the reference value of the voltage difference between contacts is 35 kV. Ideally, the voltage difference between the breaks and contact spacing remains constant during each closing of the target phase of the phase-selected closing circuit breaker, and the breakdown current sequence is considered constant. To confirm whether the stability of the breakdown current sequence is affected by the breakdown field strength and contact spacing, the simulation is performed as follows:
Based on the established breakdown current model, the contact spacing distances are set to be 5 mm, 10 mm, and 20 mm, respectively, and the breakdown current values are obtained as shown in Table 3. According to Table 3, it can be seen that the change in contact spacing will affect the breakdown current value. At the same time, the breakdown current ratio exceeds the detection threshold when Δd > 10 mm, which meets the detection conditions and verifies the accuracy of the model in this paper.

5.1.2. Change the Breakdown Field Strength

When the contact spacing remains constant, breakdown happens at different closing moments, resulting in a different pressure difference at both ends of the contact. As per the breakdown field strength E = u/d, it is easy to observe that the breakdown field strength is different at different times of the breakdown. To examine the impact of the breakdown field strength and the contact spacing on the stability of the breakdown current sequence, the occurrence time of two breakdowns is set to differ by 0.1 ms, and the load side voltage remains constant. This difference is used to indicate that the two breakdown voltages are different and to obtain different breakdown field strength values, and the corresponding breakdown current values are determined, as shown in Table 4. It can be observed that different breakdown field strengths significantly affect the magnitude of the breakdown current value. Moreover, it can be inferred that when the deviation in the breakdown field strength does not exceed 5 kV/mm, the breakdown current ratio does not exceed the detection threshold, thus satisfying the detection conditions and validating the accuracy of the model.
Based on the verification conclusions, it is apparent that the modification of contact spacing or breakdown field strength results in a change in the breakdown current value. Through meticulous calculation and analysis, the model simulation outcomes satisfy the detection threshold conditions, confirming the precision and efficiency of the current breakdown model as per (7). As the variance in the current breakdown value can mirror the alteration of either contact spacing or breakdown field strength, the distinction in the current value at various breakdowns is deemed appropriate in describing the operation state of the circuit breaker.

5.1.3. The Influence of Circuit Breaker Closing Phase Angle

In actual power transmission systems, the closing strategy for three-phase circuit breakers typically involves selecting two phases (such as A and C phases) whose instantaneous values are equal during closing and allowing the third phase voltage to reach zero before reclosing. For example, the phases for A, B, and C are at 30°, 0°, and 150°, respectively. However, for the detection method proposed in this paper, the peak value of the closing current is the object of detection, and its value depends on the voltage value at both ends of the contact and the contact spacing when any single phase is closed. Consequently, when the voltage of a phase is reclosed at the point of zero-crossing, the proposed algorithm becomes invalid when a resistive load is connected to the load side since the voltage at both ends of the phase circuit breaker contact is zero during closing and no arcing current is generated.
However, in the actual closing process of circuit breakers, it is often impossible to achieve accurate zero-angle closing due to the influence of mechanical transmission mechanism errors. Additionally, for the different three-phase circuit breakers, the fault probability for the phase of the zero-crossing closing is pretty low. In practical applications, circuit breakers for switching filter branches are more frequently used and have higher fault probabilities. Since the load is a capacitor, even if the voltage at the bus side is zero-crossing, the capacitor voltage can still produce a significant breakdown current, which can significantly reduce the dead zone range and ensure that the detection method proposed in this paper is still applicable.

5.1.4. Influence of Circuit Breaker Closing Phase Angle Deviation

In the case of a branch closing at a non-zero angle, there is still an observable breakdown current. However, in practical situations, the actual closing phase angle may deviate slightly from the intended angle due to mechanical transmission errors. As previously analyzed, the two closings at 0.1284 s and 0.1286 s can be considered a 3.2° phase angle deviation of the same closing. Although this deviation corresponds to a certain breakdown field strength deviation, the breakdown current ratio calculation results indicate that it still does not exceed the detection threshold. Therefore, as long as the error in the closing phase angle does not exceed 3.2°, the breakdown current ratio will remain below the threshold set in this paper, and the proposed detection method remains valid.

5.2. Verification of Field-Measured Data

One circuit breaker failure fault data set from 17–30 August 2015 in China is used to validate the proposed algorithm in this paper. Table 5 shows the sequence of breakdown current values at each closing before the fault. The phase B circuit breaker with type GL316X was unsuccessful during the closing operation. Circuit breaker failures do not occur frequently, and it is difficult to obtain on-site data. Although the data used is a bit old, the fault characteristics are more typical, so this set of data is used. The data for other fault conditions is simulated through the circuit breaker model built in this article.
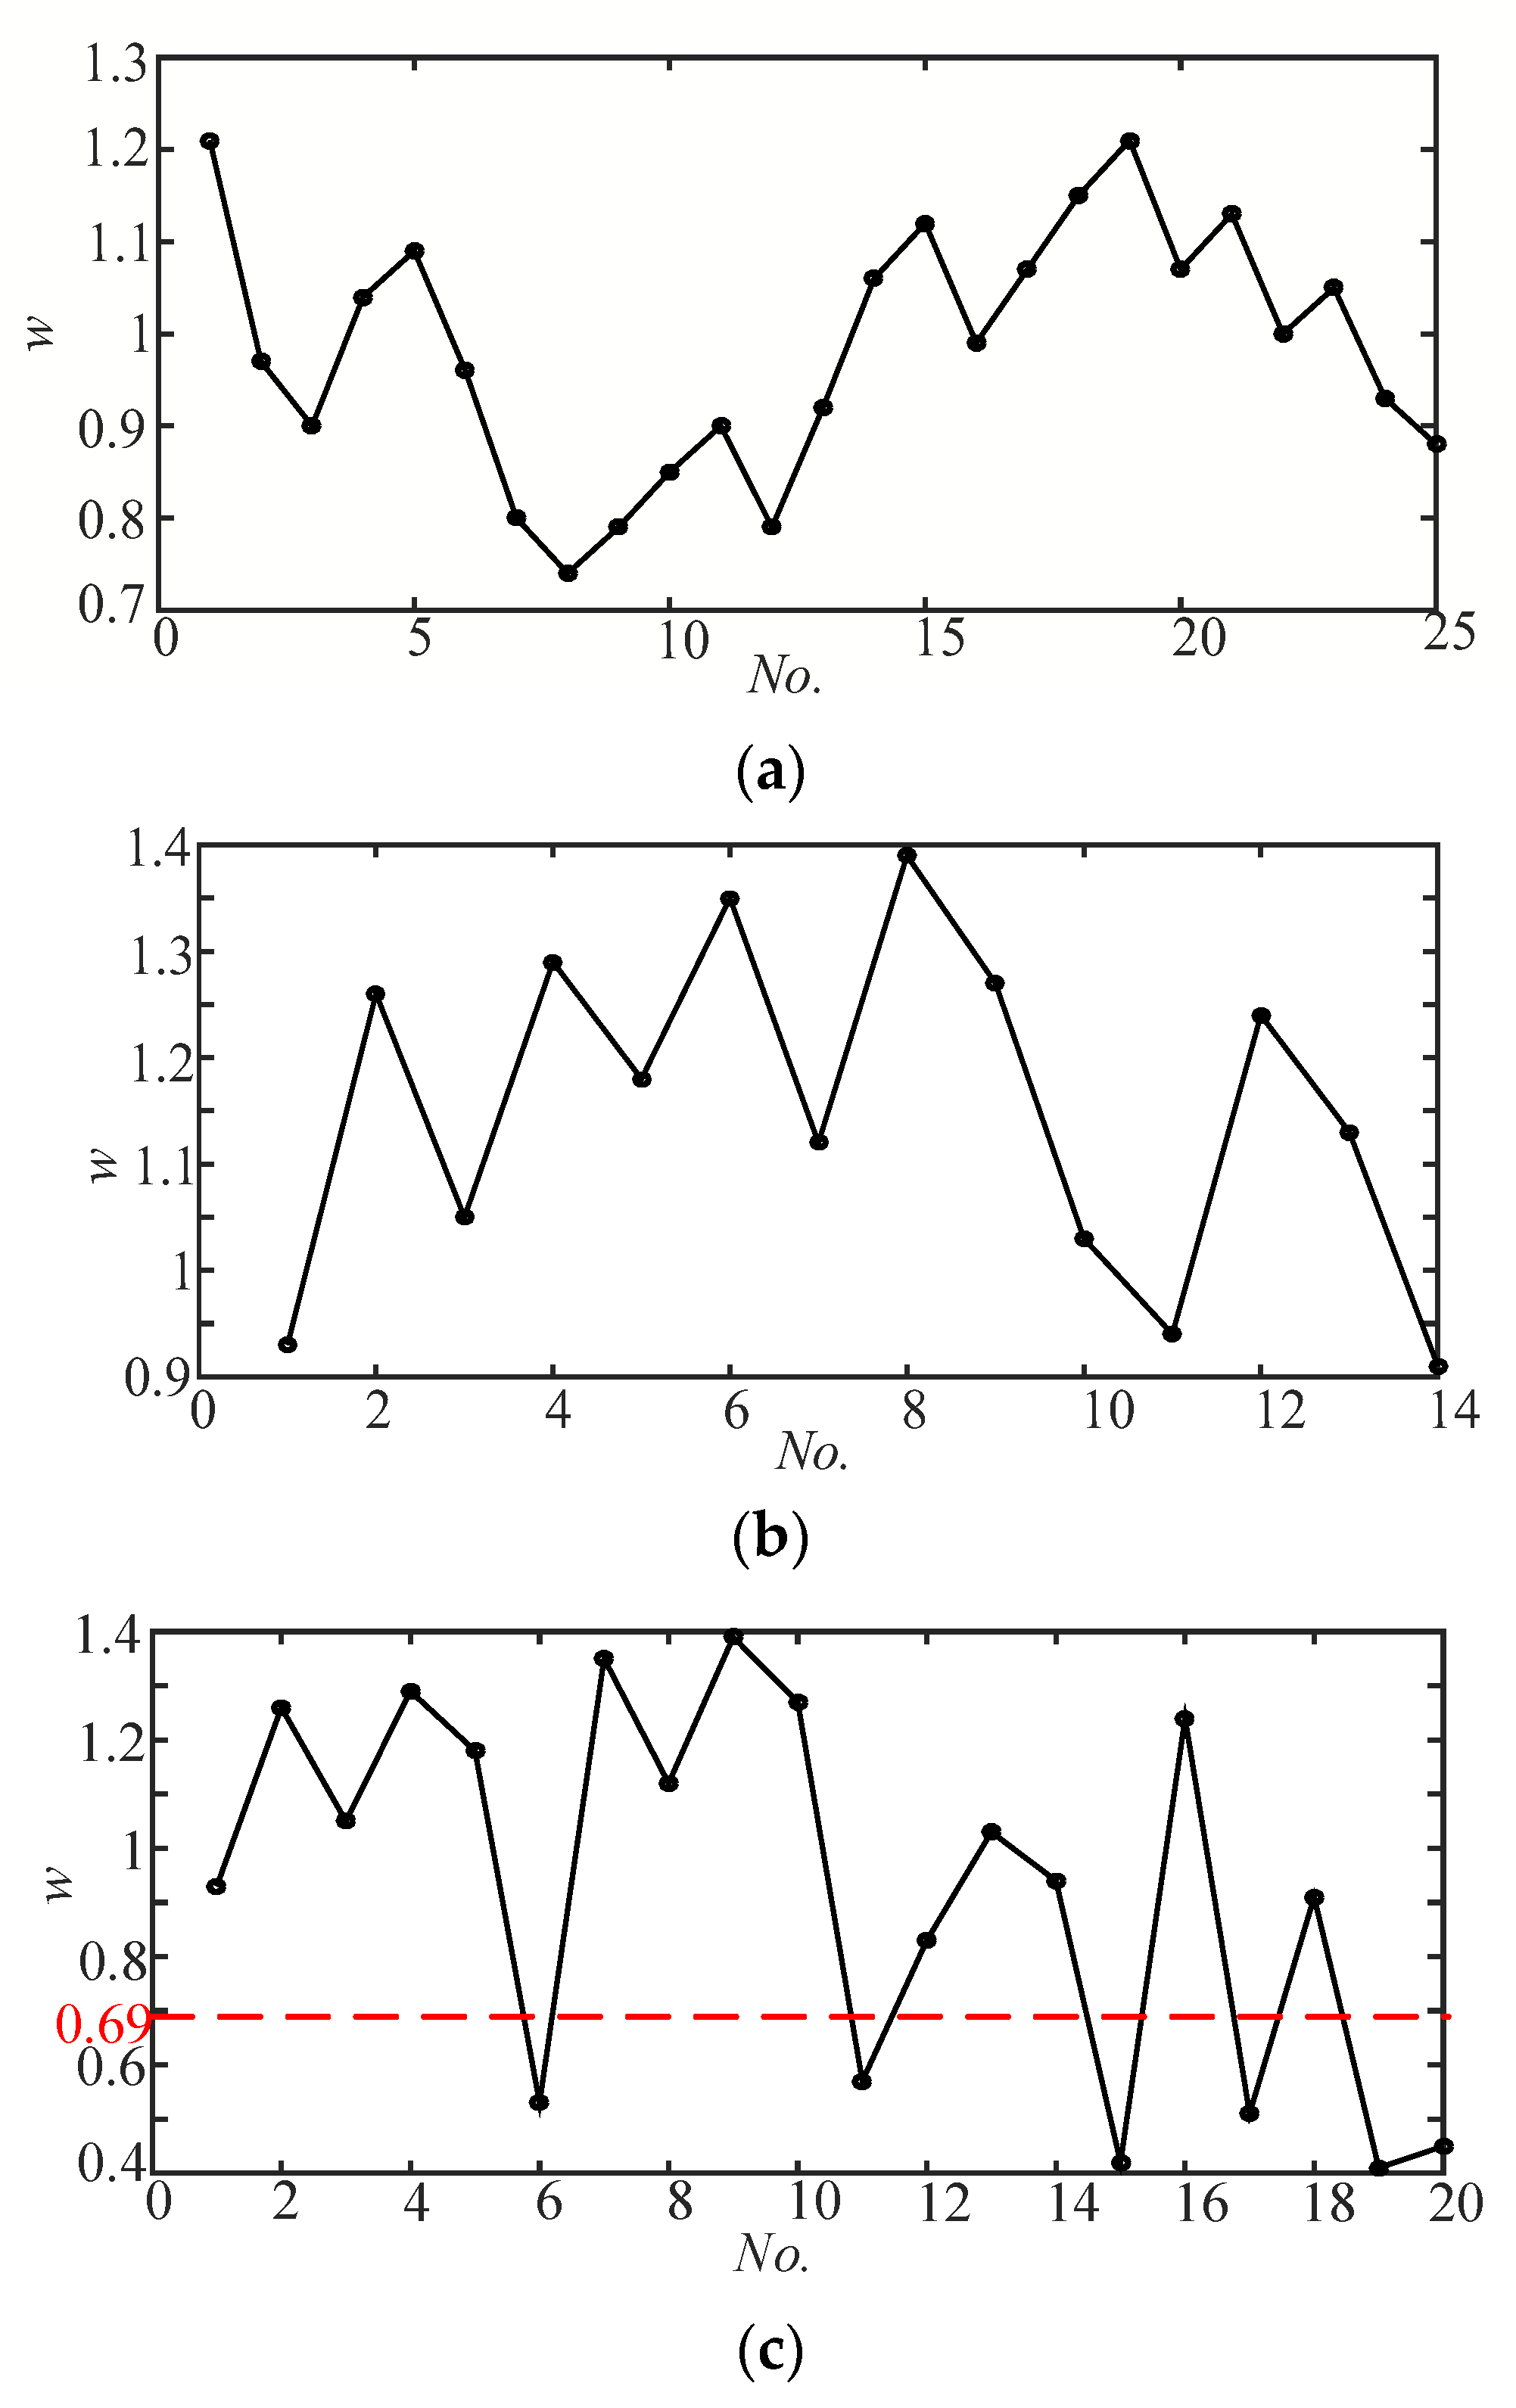
The non-stationary sequence of the breakdown current can be observed in phase B. The ratios of breakdown current at different times in phase A from 17–30 August, ratios of breakdown current at different times in phase B from 17–28 August, and ratios of breakdown current at different times in phase B from 17–29 August were calculated. The ratios are represented by ‘w’ on the y-axis, and the number of ratios is represented by ‘No.’ on the x-axis. The results are depicted in Figure 7.
The red dashed line in Figure 7 indicates the detection threshold described in Section 4.1. Based on Figure 7, it can be observed that the breakdown current ratio of phase A and phase B was within the range of 1.45 to 0.69 before 28 August. However, after 29 August, the breakdown current ratio of phase B fell below the lower limit of 0.69 due to an abnormal breakdown current value on the day before the fault occurred. This satisfies the detection conditions outlined in the proposed method. If the circuit breaker experiences such a fault, it should be taken out of service and repaired. Moreover, as indicated in Table 5, the breakdown current value varies with changes in the contact spacing or critical breakdown field strength value. The accuracy of the breakdown current model and the proposed detection method is further corroborated by comparing the simulation data presented in Table 3 and Table 4 with field recorded data. However, since only limited field-recorded data is available, further investigation and verification are necessary to ensure the reliability of the algorithm.

6. Conclusions

The early detection of abnormal states in circuit breakers is of great significance for ensuring the safety of substations and power supplies. The degradation of circuit breaker performance is generally not accidental or sudden, and there is a clear gradual process, such as irreversible changes such as gradual contact burning, spring fatigue, stress relaxation, etc. During this process, the breakdown field strength or contact spacing changes in a trend, and the breakdown current value sequence shows a monotonic trend, so the monotonic change steepness of the breakdown current is related to the degree of degradation. The paper first analyzed the impact of the changes in critical breakdown field strength and contact spacing on the operating status of the circuit breaker, quantitatively analyzed the characteristic quantities that can characterize the operating status of the high-voltage AC circuit breaker and the arc extinguishing capacity of the arc extinguishing chamber: breakdown current value and arc current trend term, and designed a technical scheme that uses breakdown current value to replace the critical breakdown field strength and contact spacing to comprehensively characterize the operating status of the circuit breaker. A method for early detection of abnormal states in circuit breakers based on sequences of different breakdown current ratio sequences was proposed, and its effectiveness was verified using simulation and on-site actual recorded data. The next step will be to develop an online detection device and carry out practical applications. At the same time, considering the changes in electrical quantities during the opening process of the circuit breaker, further improvements to the monitoring technology for the operating status of the circuit breaker will be researched.
Author Contributions

Conceptualization, B.W. and L.L.; methodology, B.W. and Y.L.; validation, H.Y. and M.H.; project administration, S.Z. All authors have read and agreed to the published version of the manuscript.

Funding

This research was funded by a project from State Grid Shandong Electric Power Corporation (52062622000Y) titled “Research and application of conditional maintenance technology of key equipment of dual high active distribution network automation system”.

Data Availability Statement

Data is unavailable due to privacy or ethical restrictions.

Conflicts of Interest

The authors declare no conflict of interest.

References

  1. Wen, W.; Wang, Y.; Li, B.; Huang, Y.; Li, R.; Wang, Q. Transient Current Interruption Characteristics of a Novel Mechanical DC Circuit Breaker. IEEE Trans. Power Electron. 2018, 33, 9424–9431. [Google Scholar] [CrossRef]
  2. Guo, Z.; Li, L.; Han, W.; Guo, Z. SF6 High-Voltage Circuit Breaker Contact Status Detection at Different Currents. Sensors 2022, 22, 8490. [Google Scholar] [CrossRef] [PubMed]
  3. Ma, H.; Liu, B.; Xu, H.; Chen, B.; Ju, P.; Zhang, L.; Qu, B. GIS mechanical state identification and defect diagnosis technology based on self-excited vibration of assembled circuit breaker. IET Sci. Meas. Technol. 2020, 14, 56–63. [Google Scholar] [CrossRef]
  4. Feizifar, B.; Usta, O. A Novel Arcing Power-Based Algorithm for Condition Monitoring of Electrical Wear of Circuit Breaker Contacts. IEEE Trans. Power Deliv. 2019, 34, 1060–1068. [Google Scholar] [CrossRef]
  5. Ma, S.; Chen, M.; Wu, J.; Wang, Y.; Jia, B.; Jiang, Y. High-Voltage Circuit Breaker Fault Diagnosis Using a Hybrid Feature Transformation Approach Based on Random Forest and Stacked Autoencoder. IEEE Trans. Ind. Electron. 2019, 66, 9777–9788. [Google Scholar] [CrossRef]
  6. Su, J.; Chen, K.; Wang, Q. Difference Analysis of Operation Stability of Vacuum Circuit Breaker in 10 KV Power Distribution System. In Journal of Physics: Conference Series; IOP Publishing: Guangzhou, China, 2022; Volume 2202, p. 012047. [Google Scholar]
  7. Razi-Kazemi, A.; Fallah, M.; Rostami, M.; Malekipour, F. A new realistic transient model for restrike/prestrike phenomena in vacuum circuit breaker. Int. J. Electr. Power Energy Syst. 2020, 117, 105636. [Google Scholar] [CrossRef]
  8. Bak, C.L.; Borghetti, A.; Glasdam, J.; Hjerrild, J.; Napolitano, F.; Nucci, C.A.; Paolone, M. Vacuum circuit breaker modelling for the assessment of transient recovery voltages: Application to various network configurations. Electr. Power Syst. Res. 2017, 156, 35–43. [Google Scholar] [CrossRef]
  9. Aizpurua, J.I.; Catterson, V.M.; Abdulhadi, I.F.; Garcia, M.S. A Model-Based Hybrid Approach for Circuit Breaker Prognostics Encompassing Dynamic Reliability and Uncertainty. IEEE Trans. Syst. Man Cybern. Syst. 2018, 48, 1637–1648. [Google Scholar] [CrossRef] [Green Version]
  10. Ji, T.; Ye, X.; Shi, M.; Li, M.; Wu, Q. Typical current modelling and feature extraction of high voltage circuit breaker towards condition analysis and fault diagnosis. IET Gener. Transm. Distrib. 2020, 14, 1521–1527. [Google Scholar] [CrossRef]
  11. Savaliya, S.G.; Fernandes, B.G. Performance Evaluation of a Modified Bidirectional Z-Source Breaker. IEEE Trans. Ind. Electron. 2020, 68, 7137–7145. [Google Scholar] [CrossRef]
  12. Khalyasmaa, A.I.; Senyuk, M.D.; Eroshenko, S.A. High-Voltage Circuit Breakers Technical State Patterns Recognition Based on Machine Learning Methods. IEEE Trans. Power Deliv. 2019, 34, 1747–1756. [Google Scholar] [CrossRef]
  13. Razi-Kazemi, A.A.; Niayesh, K.; Nilchi, R. A Probabilistic Model-Aided Failure Prediction Approach for Spring-Type Operating Mechanism of High-Voltage Circuit Breakers. IEEE Trans. Power Deliv. 2019, 34, 1280–1290. [Google Scholar] [CrossRef]
  14. Rudsari, F.N.; Razi-Kazemi, A.A.; Shoorehdeli, M.A. Fault Analysis of High-Voltage Circuit Breakers Based on Coil Current and Contact Travel Waveforms Through Modified SVM Classifier. IEEE Trans. Power Deliv. 2019, 34, 1608–1618. [Google Scholar] [CrossRef]
  15. Sakuyama, T.; Kotsuji, H.; Terada, M.; Shiraishi, K.; Urai, H. Interrupter Size Effect of High-Voltage Gas Circuit Breaker on Thermal Interruption Performance and Current Zero Properties. IEEJ Trans. Electr. Electron. Eng. 2021, 16, 215–225. [Google Scholar] [CrossRef]
  16. Feizifar, B.; Usta, O. A new arc-based model and condition monitoring algorithm for on-load tap-changers. Electr. Power Syst. Res. 2019, 167, 58–70. [Google Scholar] [CrossRef] [Green Version]
  17. Wei, M.; Liu, W.; Shi, F.; Zhang, H.; Jin, Z.; Chen, W. Distortion-controllable Arc modeling for high impedance Arc fault in the distribution network. IEEE Trans. Power Deliv. 2020, 36, 52–63. [Google Scholar] [CrossRef]
  18. Yang, Q.; Chen, S.; Zeng, X.; Wei, G.; Liu, H.; Chen, T. Suppression measures for overvoltage caused by vacuum circuit breaker switching off 10-kV shunt reactor. IEEE Trans. Power Deliv. 2019, 35, 540–548. [Google Scholar] [CrossRef]
  19. Lu, Y.; Guo, J.; Jiang, X. Simulation study on current-zero period phenomenon and analyse of high voltage gas circuit breaker. In Proceedings of the 2019 5th International Conference on Electric Power Equipment-Switching Technology (ICEPE-ST), Kitakyushu, Japan, 13–16 October 2019; pp. 543–546. [Google Scholar]
  20. Razi-Kazemi, A.A.; Fallah, M.R.; Rostami, M. A Hybrid-Approach for Realtime Assessment of the Pressure and Erosion in Vacuum Circuit Breakers. IEEE Trans. Dielectr. Electr. Insul. 2020, 27, 2087–2094. [Google Scholar] [CrossRef]
  21. Xiao, G.; Rong, Q.; Yang, M.; Xiao, P.; Chen, Q.; Fan, J.; Guo, H.; Wang, H. Research on VFTO Identification of GIS Based on Wavelet Transform and Singular Value Decomposition. Energies 2022, 15, 3367. [Google Scholar] [CrossRef]
  22. Wang, K.; Tan, X.Y.; Zhang, W.B. Design and Verification of VFTO Differentiating-Integrating Measurement Equivalent Circuit. Integr. Ferroelectr. 2020, 207, 96–107. [Google Scholar] [CrossRef]
  23. Guo, Z.; Liu, S.; Pu, Y.; Zhang, B.; Li, X.; Tang, F.; Lv, Q.; Jia, S. Study of the arc interruption performance of CO2 gas in high-voltage circuit breaker. IEEE Trans. Plasma Sci. 2019, 47, 2742–2751. [Google Scholar] [CrossRef]
  24. Ito, H.; Dufournet, D. Interrupting Phenomena of High-Voltage Circuit Breaker. In Switching Equipment; Springer: Cham, Switzerland, 2019; pp. 63–81. [Google Scholar]
  25. Sun, S.; Zhang, T.; Li, Q.; Wang, J.; Zhang, W.; Wen, Z.; Tang, Y. Fault Diagnosis of Conventional Circuit Breaker Contact System Based on Time-Frequency Analysis and Improved AlexNet. IEEE Trans. Instrum. Meas. 2021, 70, 3508512. [Google Scholar] [CrossRef]
  26. Guan, C.; Yao, X.; Zheng, J.; Zuo, X.; Li, X.; Liu, Z.; Wang, J.; Geng, Y. A Relationship Between Vacuum Arc Characteristics and Short-Circuit Current Interrupting Capability at Minimum Arcing Times. IEEE Trans. Plasma Sci. 2022, 50, 2670–2680. [Google Scholar] [CrossRef]
  27. Liu, M.; Li, B.; Zhang, J.; Wang, K. An application of ensemble empirical mode decomposition and correlation dimension for the HV circuit breaker diagnosis. Automatika 2019, 60, 105–112. [Google Scholar] [CrossRef] [Green Version]
Figure 1. Time-varying diagram of the field strength in the contact closing process.
Energies 16 05581 g001
Figure 2. Three-dimensional characteristics and two-dimensional projection between breakdown current, instantaneous breakdown field strength, and contact spacing.
Energies 16 05581 g002
Figure 4. Recorded data of actual arc fault.
Energies 16 05581 g004
Figure 5. Simulation topology of capacitive filter branch in converter station.
Energies 16 05581 g005
Figure 6. The simulation results of arc current when circuit breaker breaks down.
Energies 16 05581 g006
Figure 7. The ratio of two values of different times in measured breakdown current sequence of phases A and B, (a) The ratio of two values of different times in the breakdown current sequence of phase on 17–30 August is compared. (b) The ratio of different times in the breakdown current sequence of phase B on 17–28 August. (c) The ratio of different times in the breakdown current sequence of phase B on 17–29 August.
Energies 16 05581 g007
Table 1. The breakdown current ratio at different Δd.
Δd/mmBreakdown Current Ratio
11.04
51.18
101.45
201.75
Table 2. Related technical parameters of circuit breaker.
ParameterUnitParameter Value
Rated VoltagekV550
Rated CurrentA4000, 5000
Rated frequencyHz50
Rated short-circuit breaking currentShort-circuit currentkA50, 63
DC component percentage-60%
Rated short-time withstand current (3 s)kA63 (50)
Rated peak withstand currentkA125, 160
Table 3. The breakdown current value at different contact spacing.
Contact Spacing
d/mm
Breakdown Current Value
i/kA
50.42
100.58
200.86
Table 4. The Simulation results of breakdown current values at different breakdown times.
Breakdown Time
t/s
Voltage Difference between Fractures
u/kV
Field Strength between Fractures
E-kV/mm
Breakdown Current Value
i/kA
0.128427.958.21.61
0.128535.6391.70
0.128645.019.81.83
Table 5. The recorded data of breakdown current values at phase A and phase B.
DateA Phase Breakdown Current Value
ia/kA
B Phase Breakdown Current Value
ib/kA
17 August7.242.55
18 August5.962.74
24 August7.432.33
26 August8.062.44
27 August7.522.97
28 August6.983.36
29 August6.654.78
30 August7.540
Disclaimer/Publisher’s Note: The statements, opinions and data contained in all publications are solely those of the individual author(s) and contributor(s) and not of MDPI and/or the editor(s). MDPI and/or the editor(s) disclaim responsibility for any injury to people or property resulting from any ideas, methods, instructions or products referred to in the content.