
Preliminary Design and Analysis of a Photovoltaic-Powered Direct Air Capture System for a Residential Building

 , , ,
, , ,  and
and
Abstract
1. Introduction
2. Materials and Methods
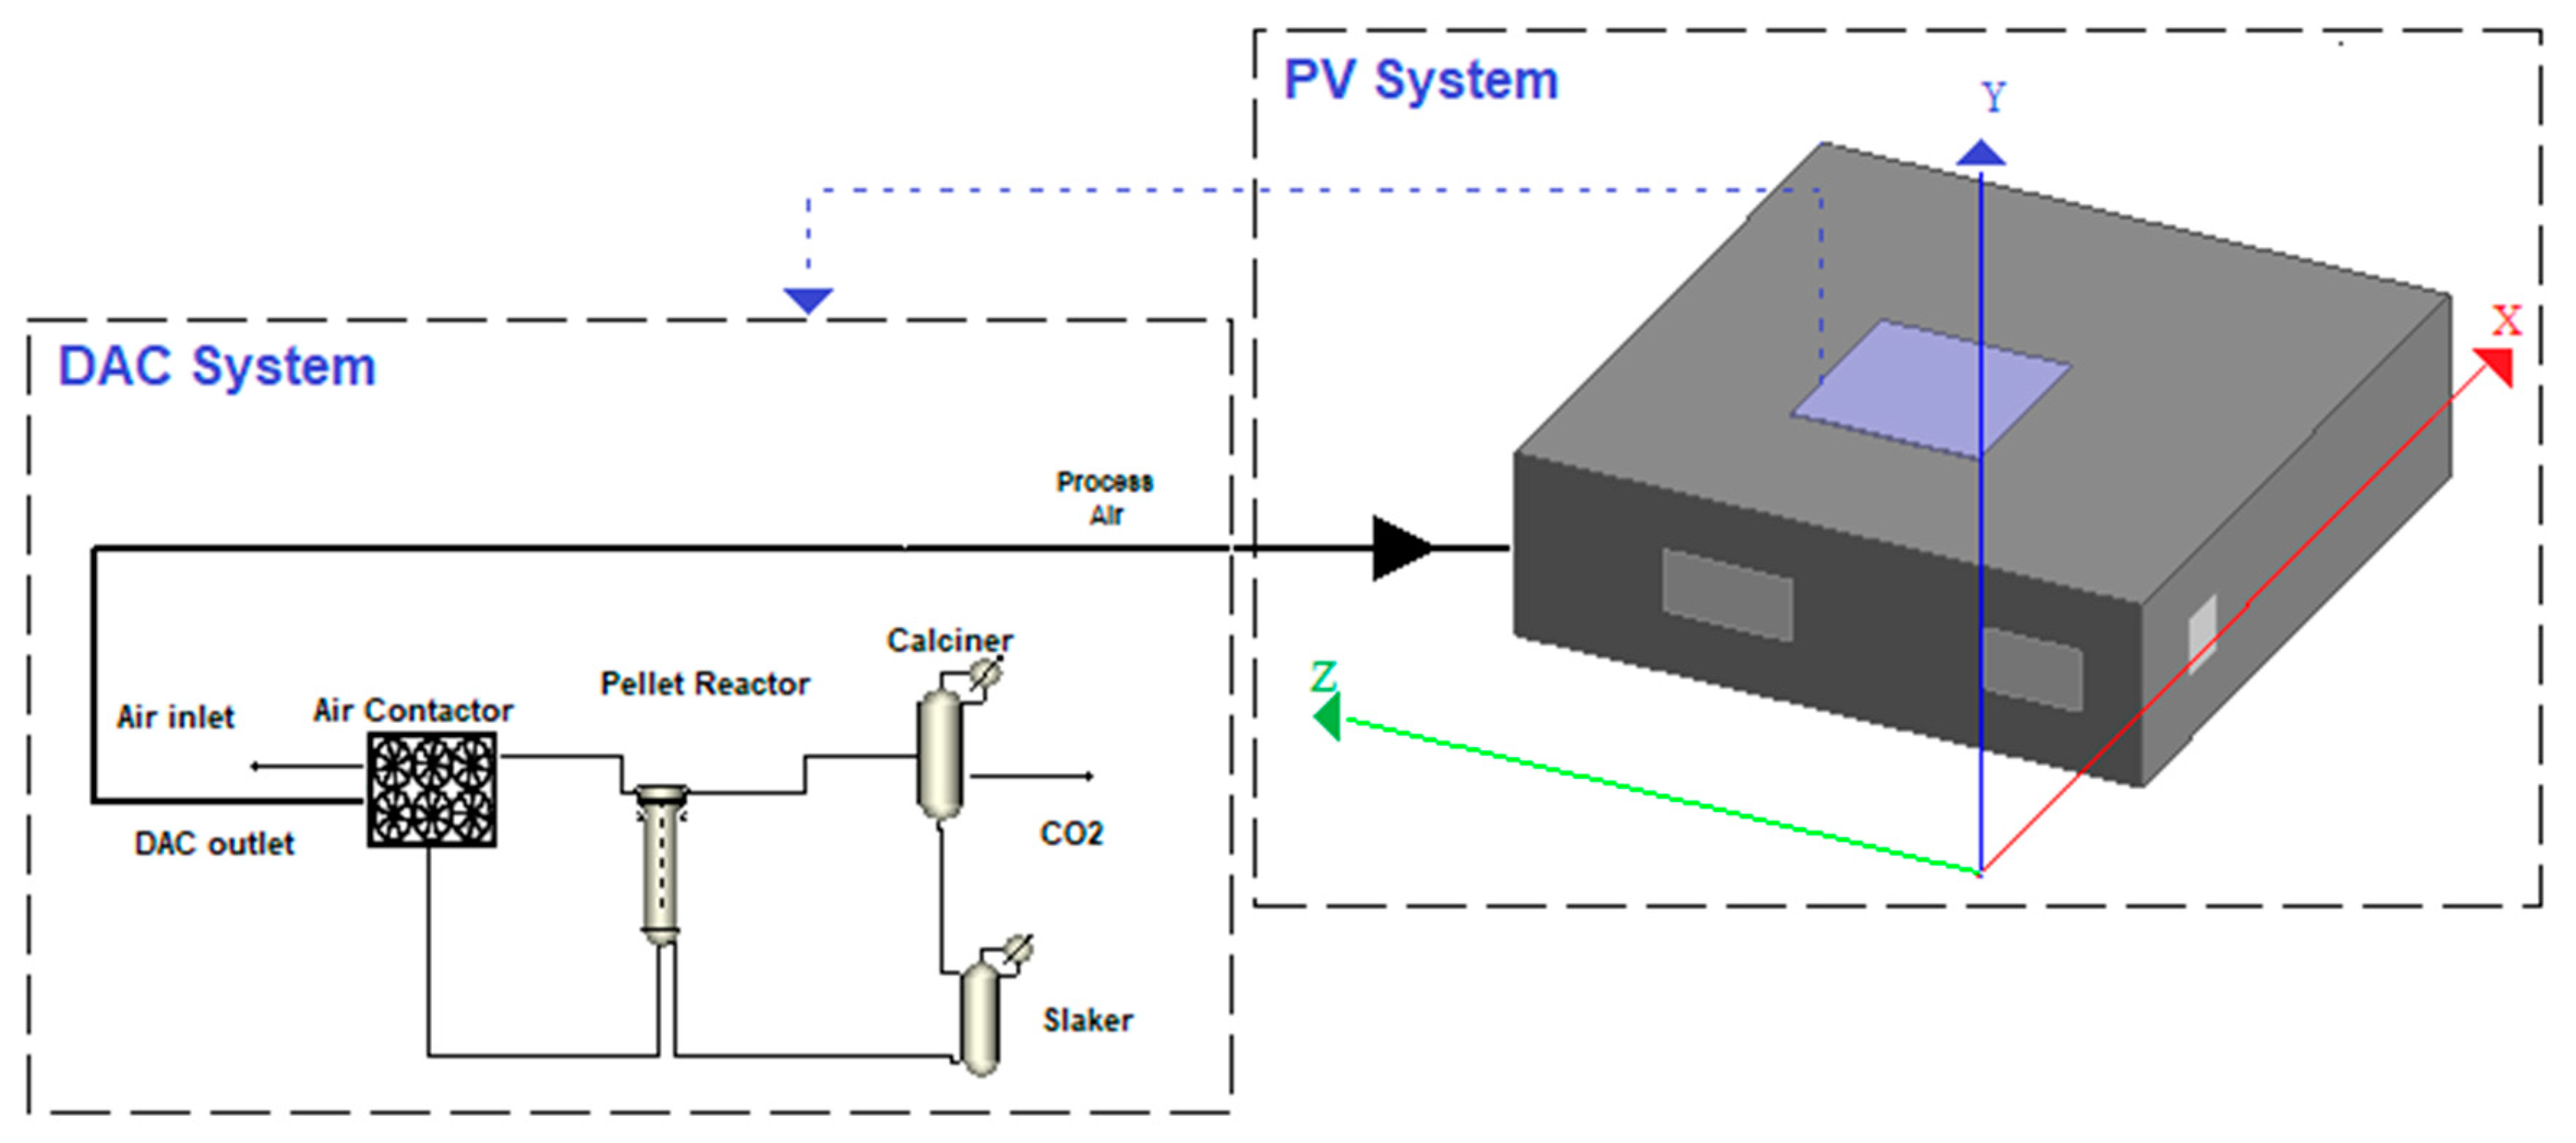
2.1. System Description (DAC)
2.2. System Description (Photovoltaic System)
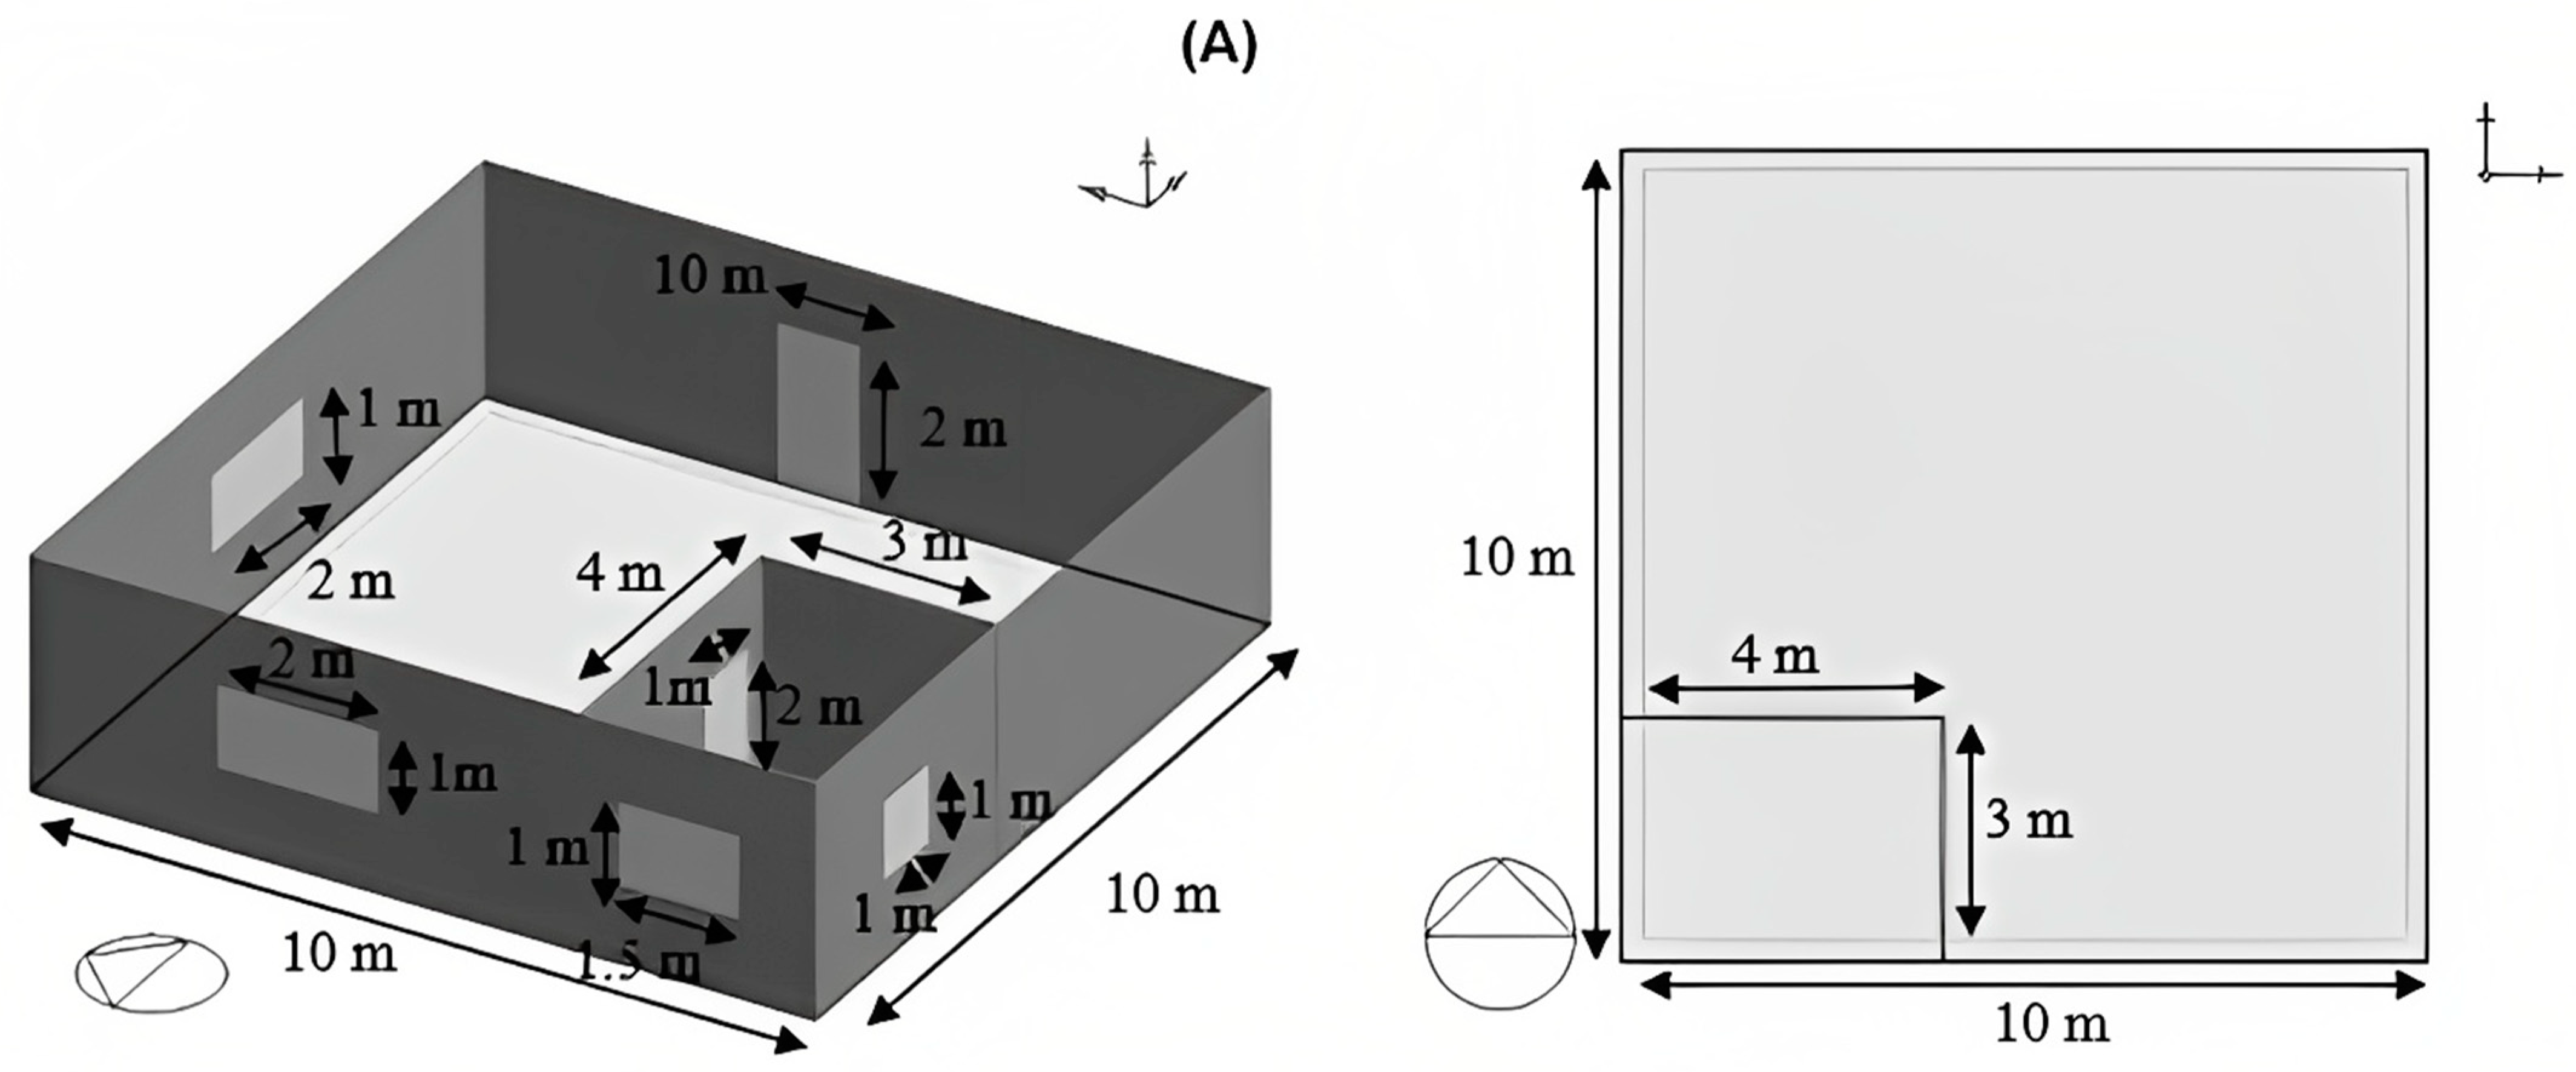
2.3. System Description (Generic Residential Building)

| Category | Property | Specification |
|---|---|---|
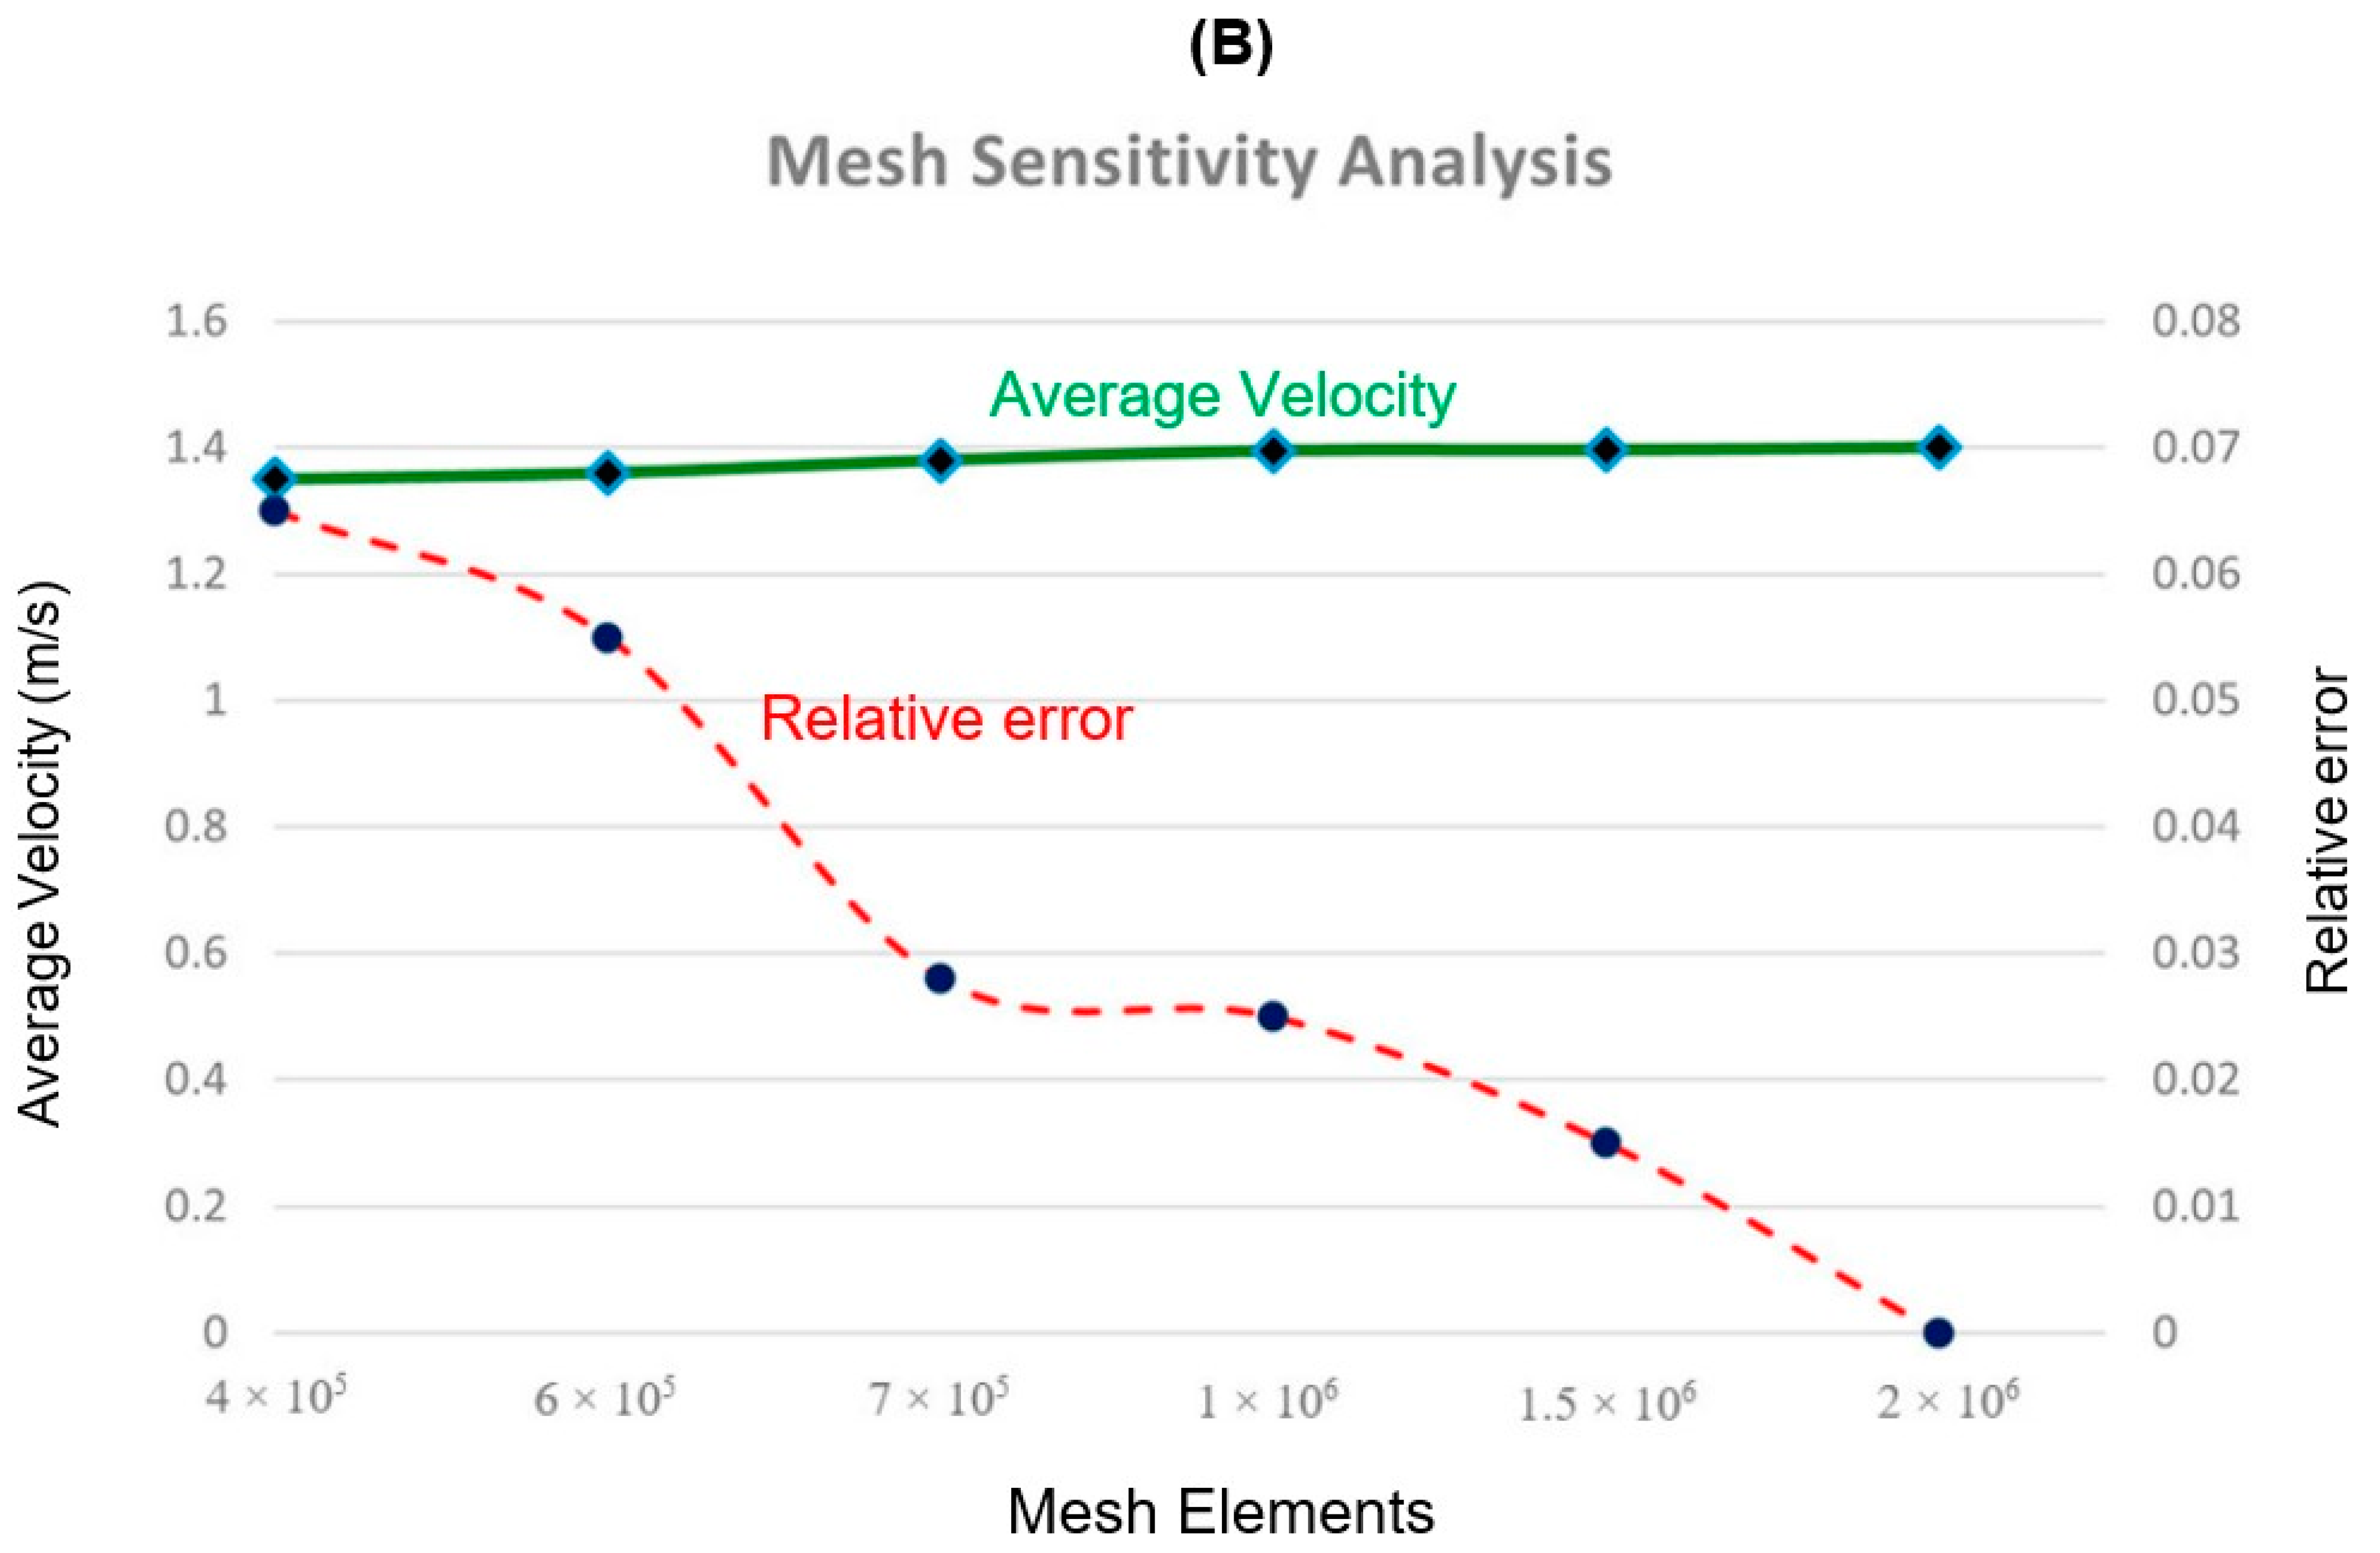
| Mesh Quality | Elements maximum size (mm) | 500 |
| Number of elements | 2,190,000 | |
| Growth rate | 1.2 | |
| Defeature size (mm) | 2.5 | |
| Curvature minimum size (mm) | 5 | |
| Curvature normal angle (degree) | 18 | |
| Skewness | 0.21188 | |
| Orthogonal quality | 0.78694 | |
| Inflation transition ratio | 0.75 | |
| Inflation number of layers | 5 | |
| Turbulence model | k − | |
| Solid Modeling | Domain | Boolean |
| Solid-fluid | No-Slip Walls | |
| Inlet conditions | Velocity inlets; as per Figure 5, with a turbulence intensity of 5% | |
| Fluid Modeling and Boundary Conditions | Outlet condition | Pressure outlets of 1 bar |
| External surfaces of the computational domain | Openings An open boundary condition is a computational boundary that allows phenomena generated in the interior domain to pass through the artificial boundary without distortion and without affecting the interior solution. | |
| Computational performance | Computational performance | Computational performance |
| Computational time | 12 h/case | |
| Software | Ansys CFX | |
| Residual targets | 1 × 10⁻³ | |
| Achieved residual level | Approximately 1 × 10⁻⁶ | |
| Boundary Wall | No slip wall | Smooth |
| Simulation | Steady state | |
| CFD assumptions | As detailed in [26,27,29,30] | [26,27,29,30]. |
2.4. Numerical Model Specifications and Assumptions
| DAC System | ||
|---|---|---|
| Parameter | Value | Reference |
| Subunits | Air contactor, Pellet reactor, Calciner, and Slaker | [19] |
| Mass transfer coefficient (KL) | 0.13 cm/s (293 K) | [19] |
| Mixture content in the air contractor | 1 M OH−, 0.5 M CO32−, and 2 MK+ | [19] |
| Reaction in the air contractor | [19] | |
| Reaction in the pellet reactor | [19] | |
| Reaction in the calciner | [19] | |
| Reaction in the slaker | [19] | |
| Energy consumption to capture 1 ton of CO2 | 2.45 MWh | [19] |
| Air flowrate needed to capture 1 ton of CO2 | kg/h | [19] |
| Percentage of captured CO2 | 75% | [19] |
| DAC-Building integration | CO2 captured from ducts transferring air to and from the rooms | Proposed |
| Photovoltaic system | ||
| Parameter | Value | Reference |
| ) | 15% | [20] |
| ) | 95% | [20] |
| ) | 90% | [20] |
| ) | 1–27 m2 | [20] |
| ) | 0.025 m | [20] |
| Tilting | Fixed horizontal | [20] |
| Mounting system for installing photovoltaic | Roof-Solar Bitumen | [20] |
| Operation scheme | Base load (operates even if the electric power generated is greater than the building demand) | [20] |
| Electric Bus type | Direct Current with inverter | [20] |
| Conditions of the generic building | ||
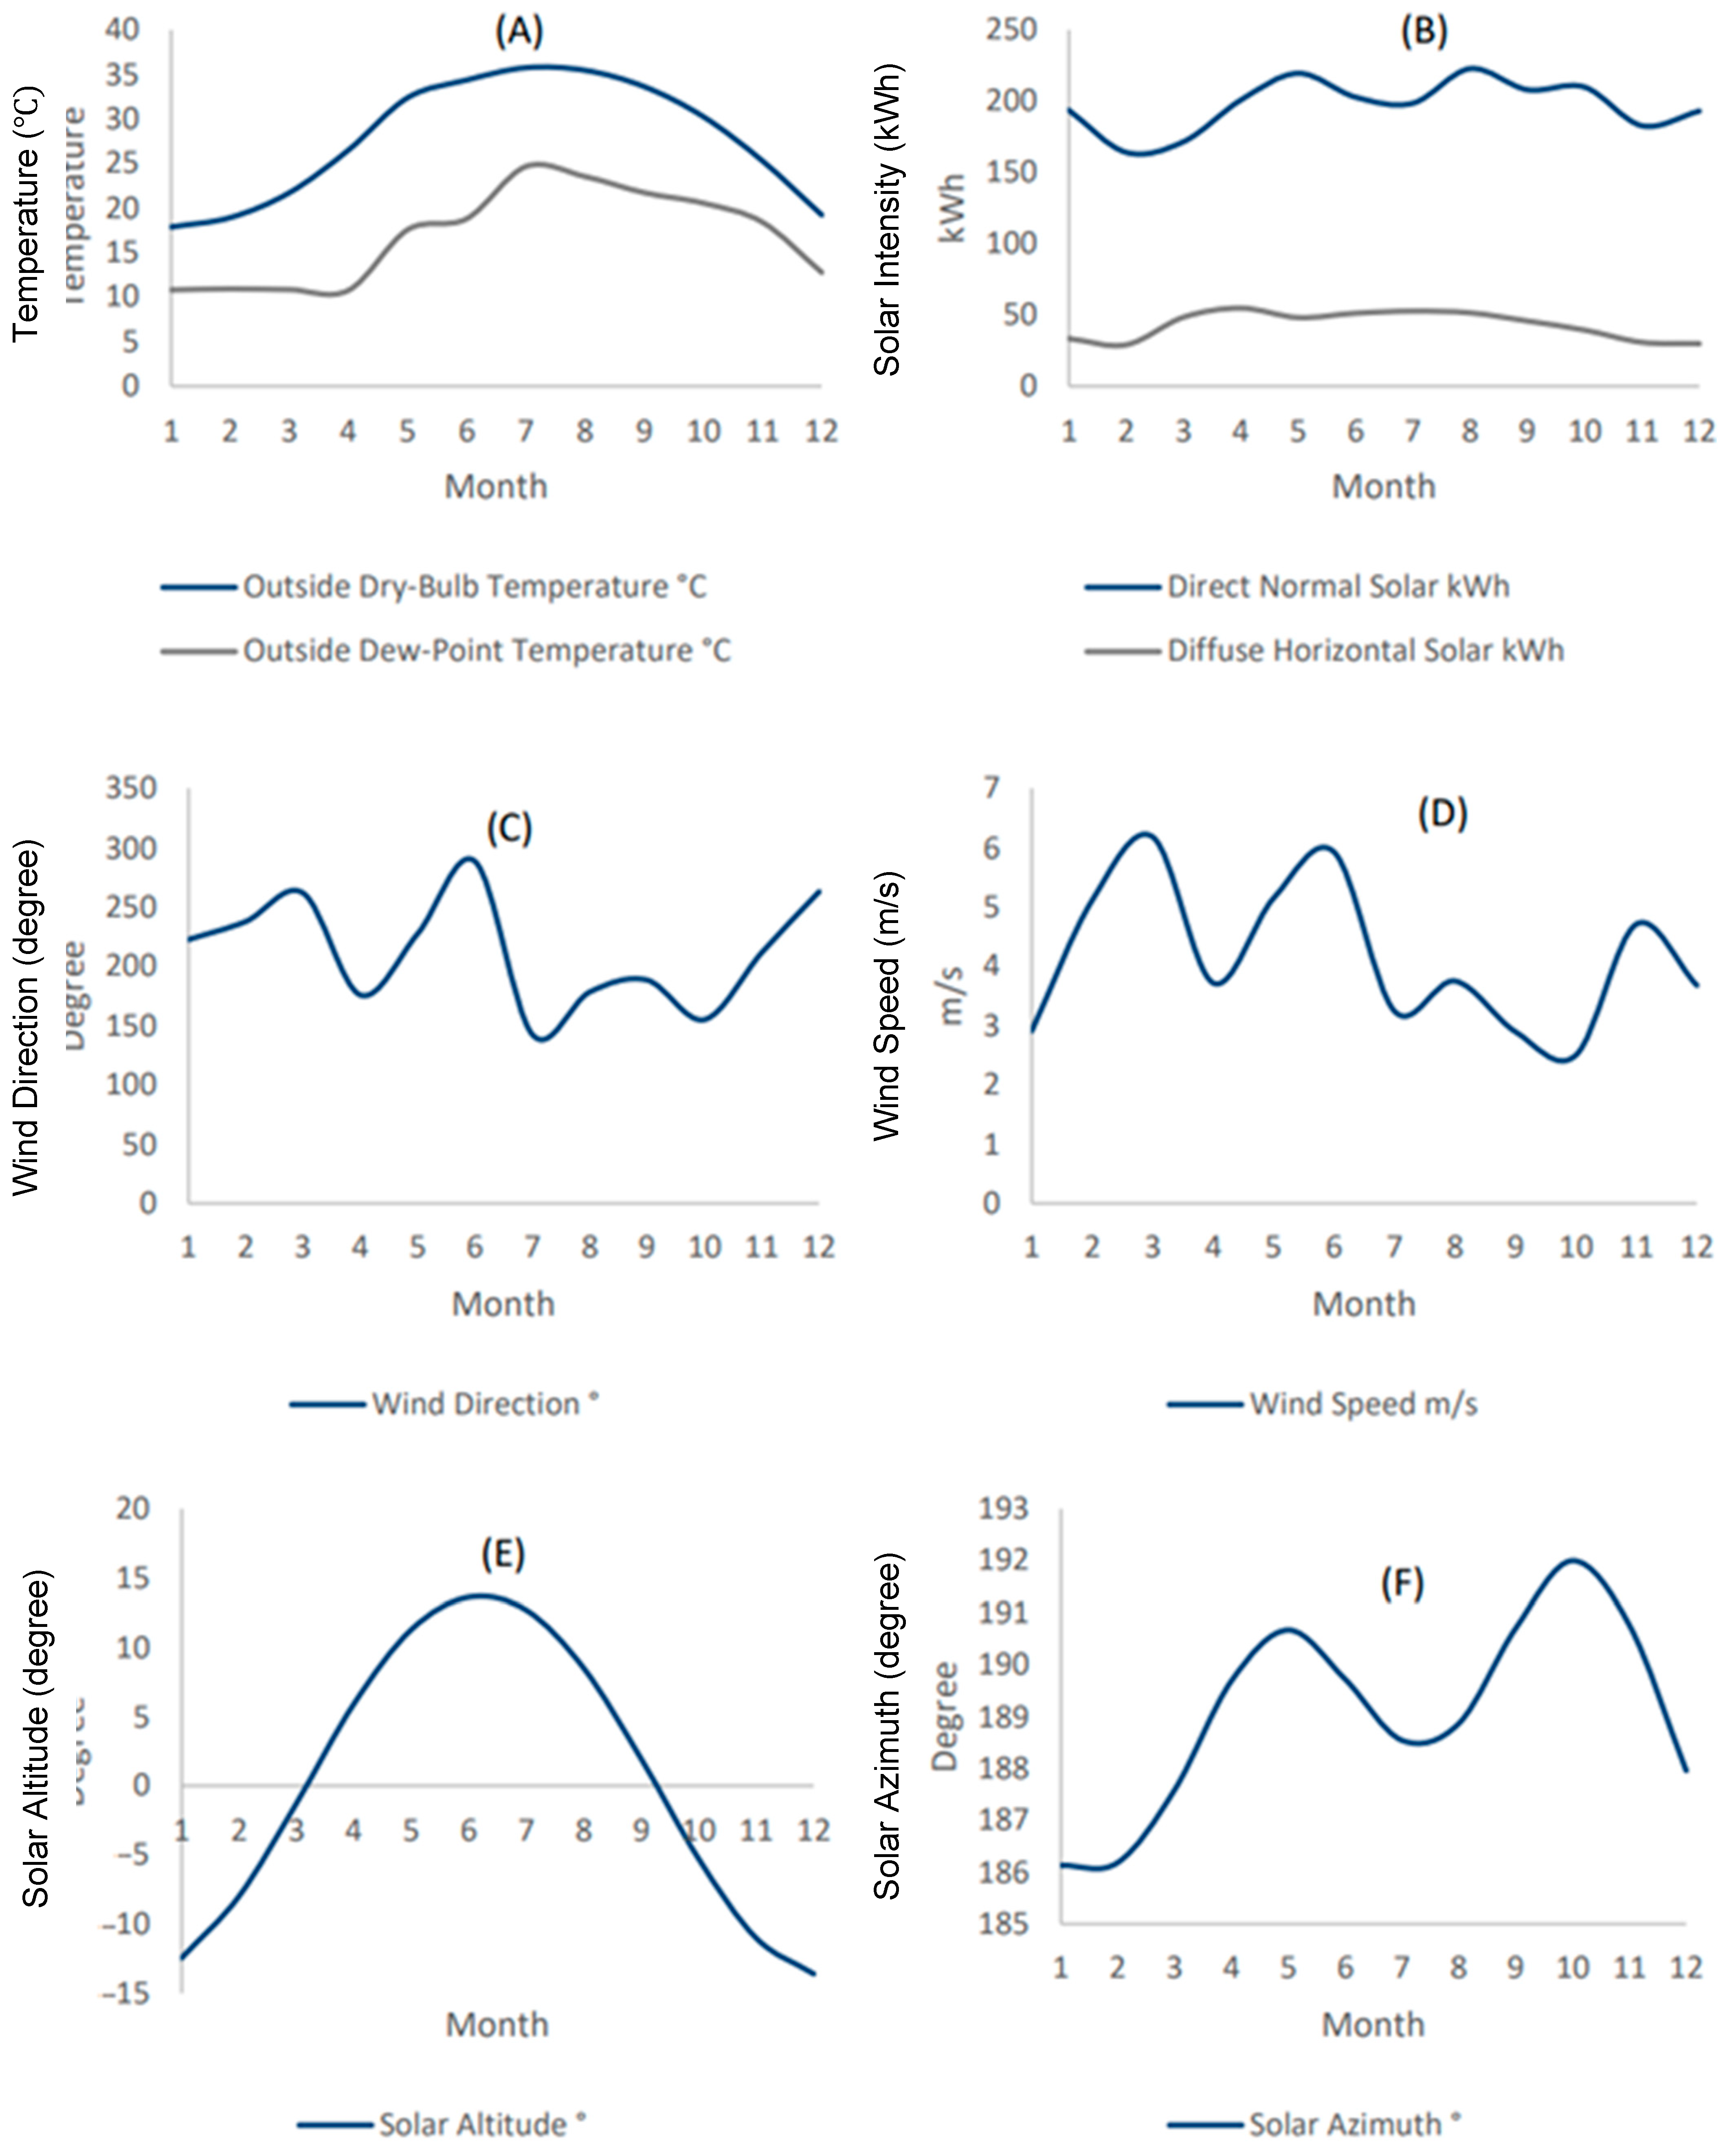
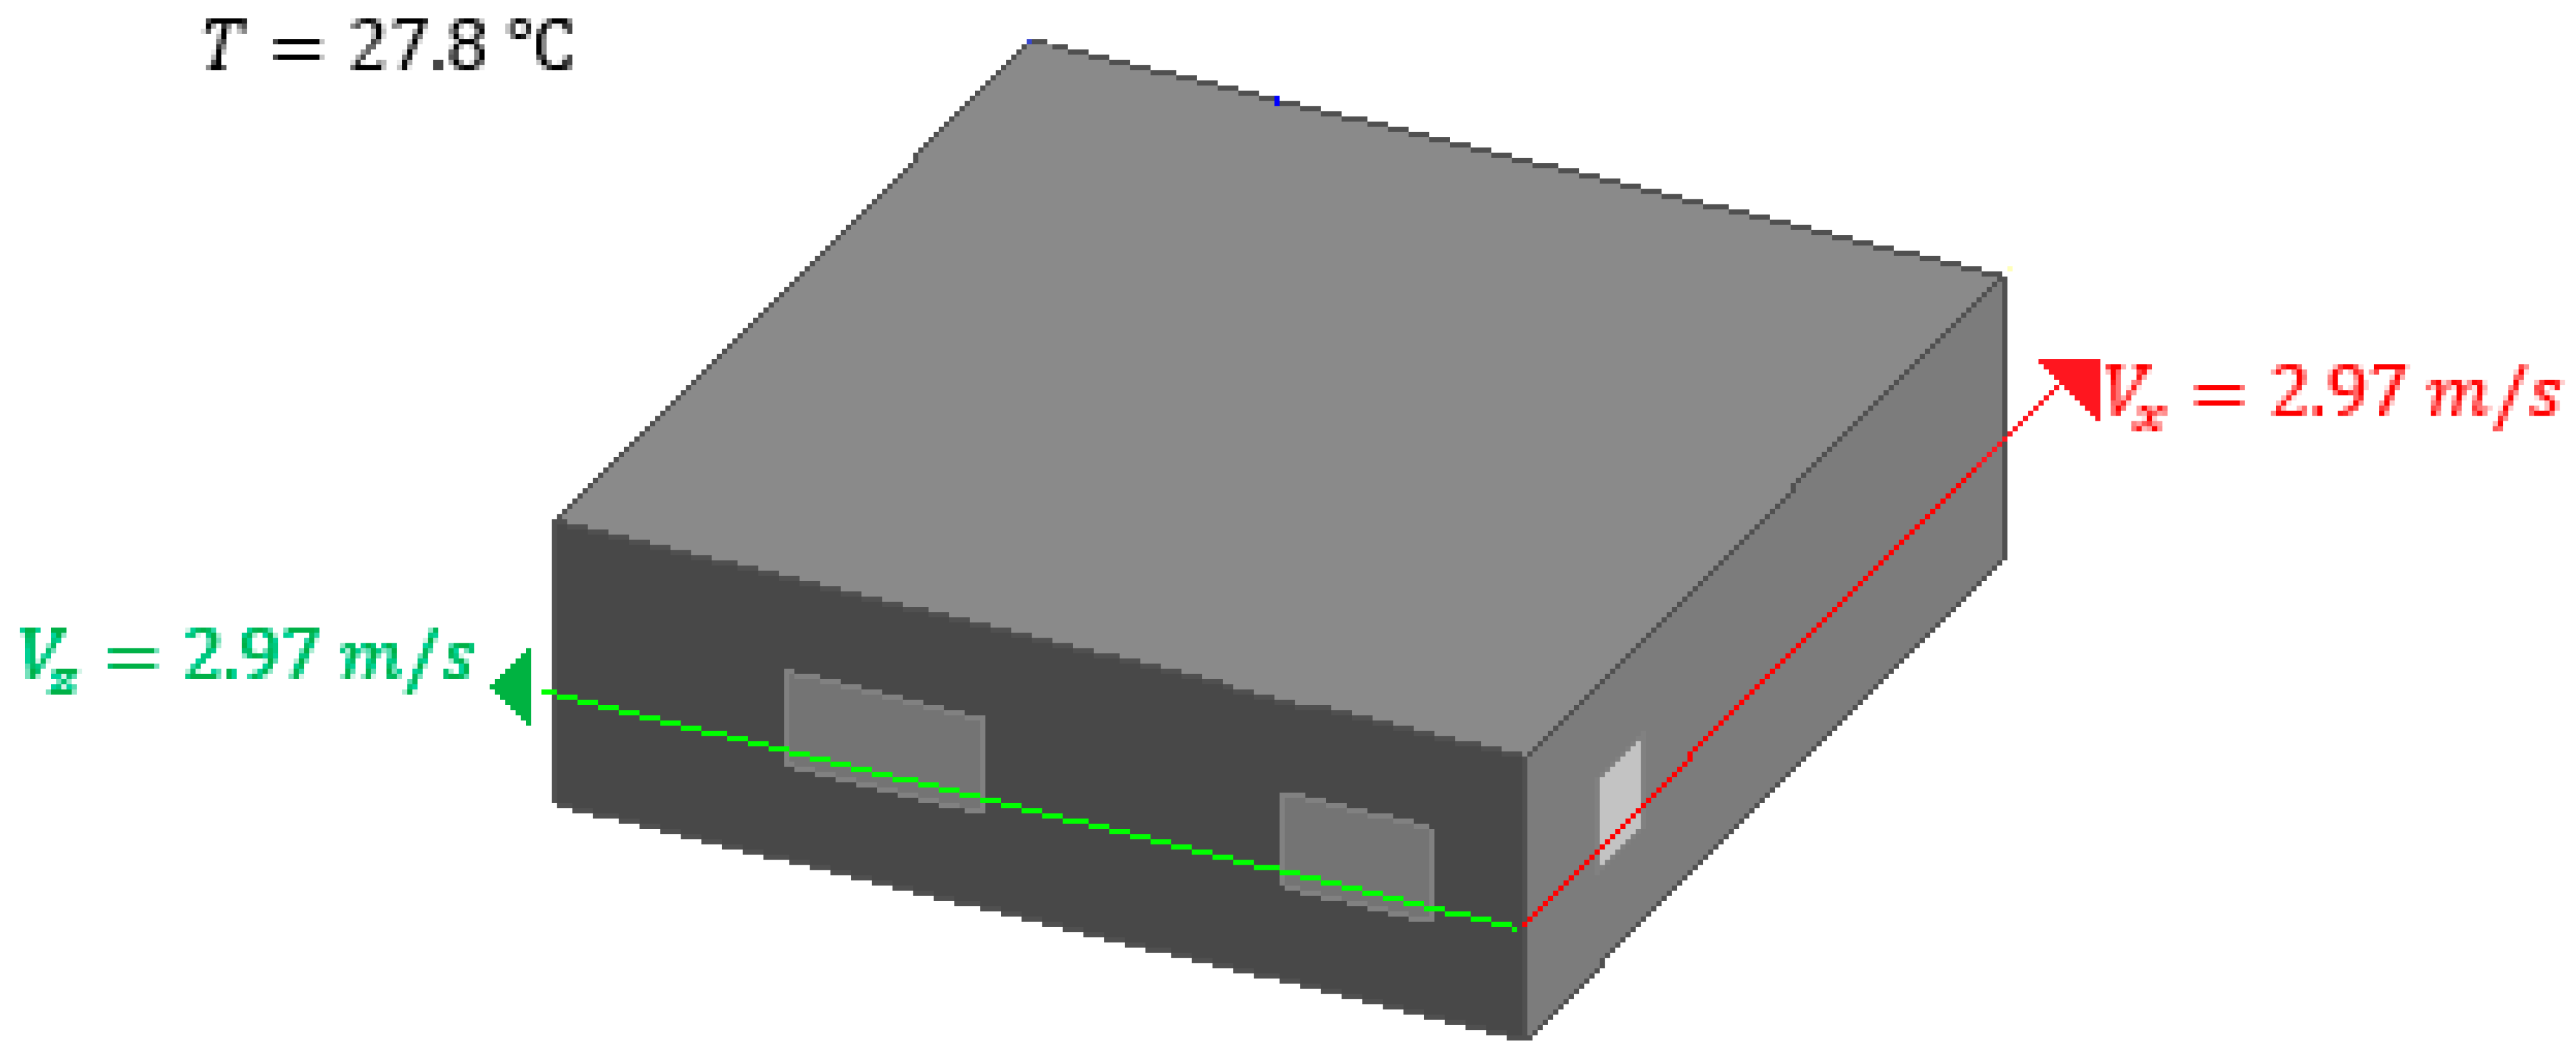
| Average outside temperature | 27.8 °C | [26] |
| Total wind velocity | 4.2 m/s | [27] |
| Shear and normal velocity, Vx, Vz | 2.97 m/s | [28] |
3. Results
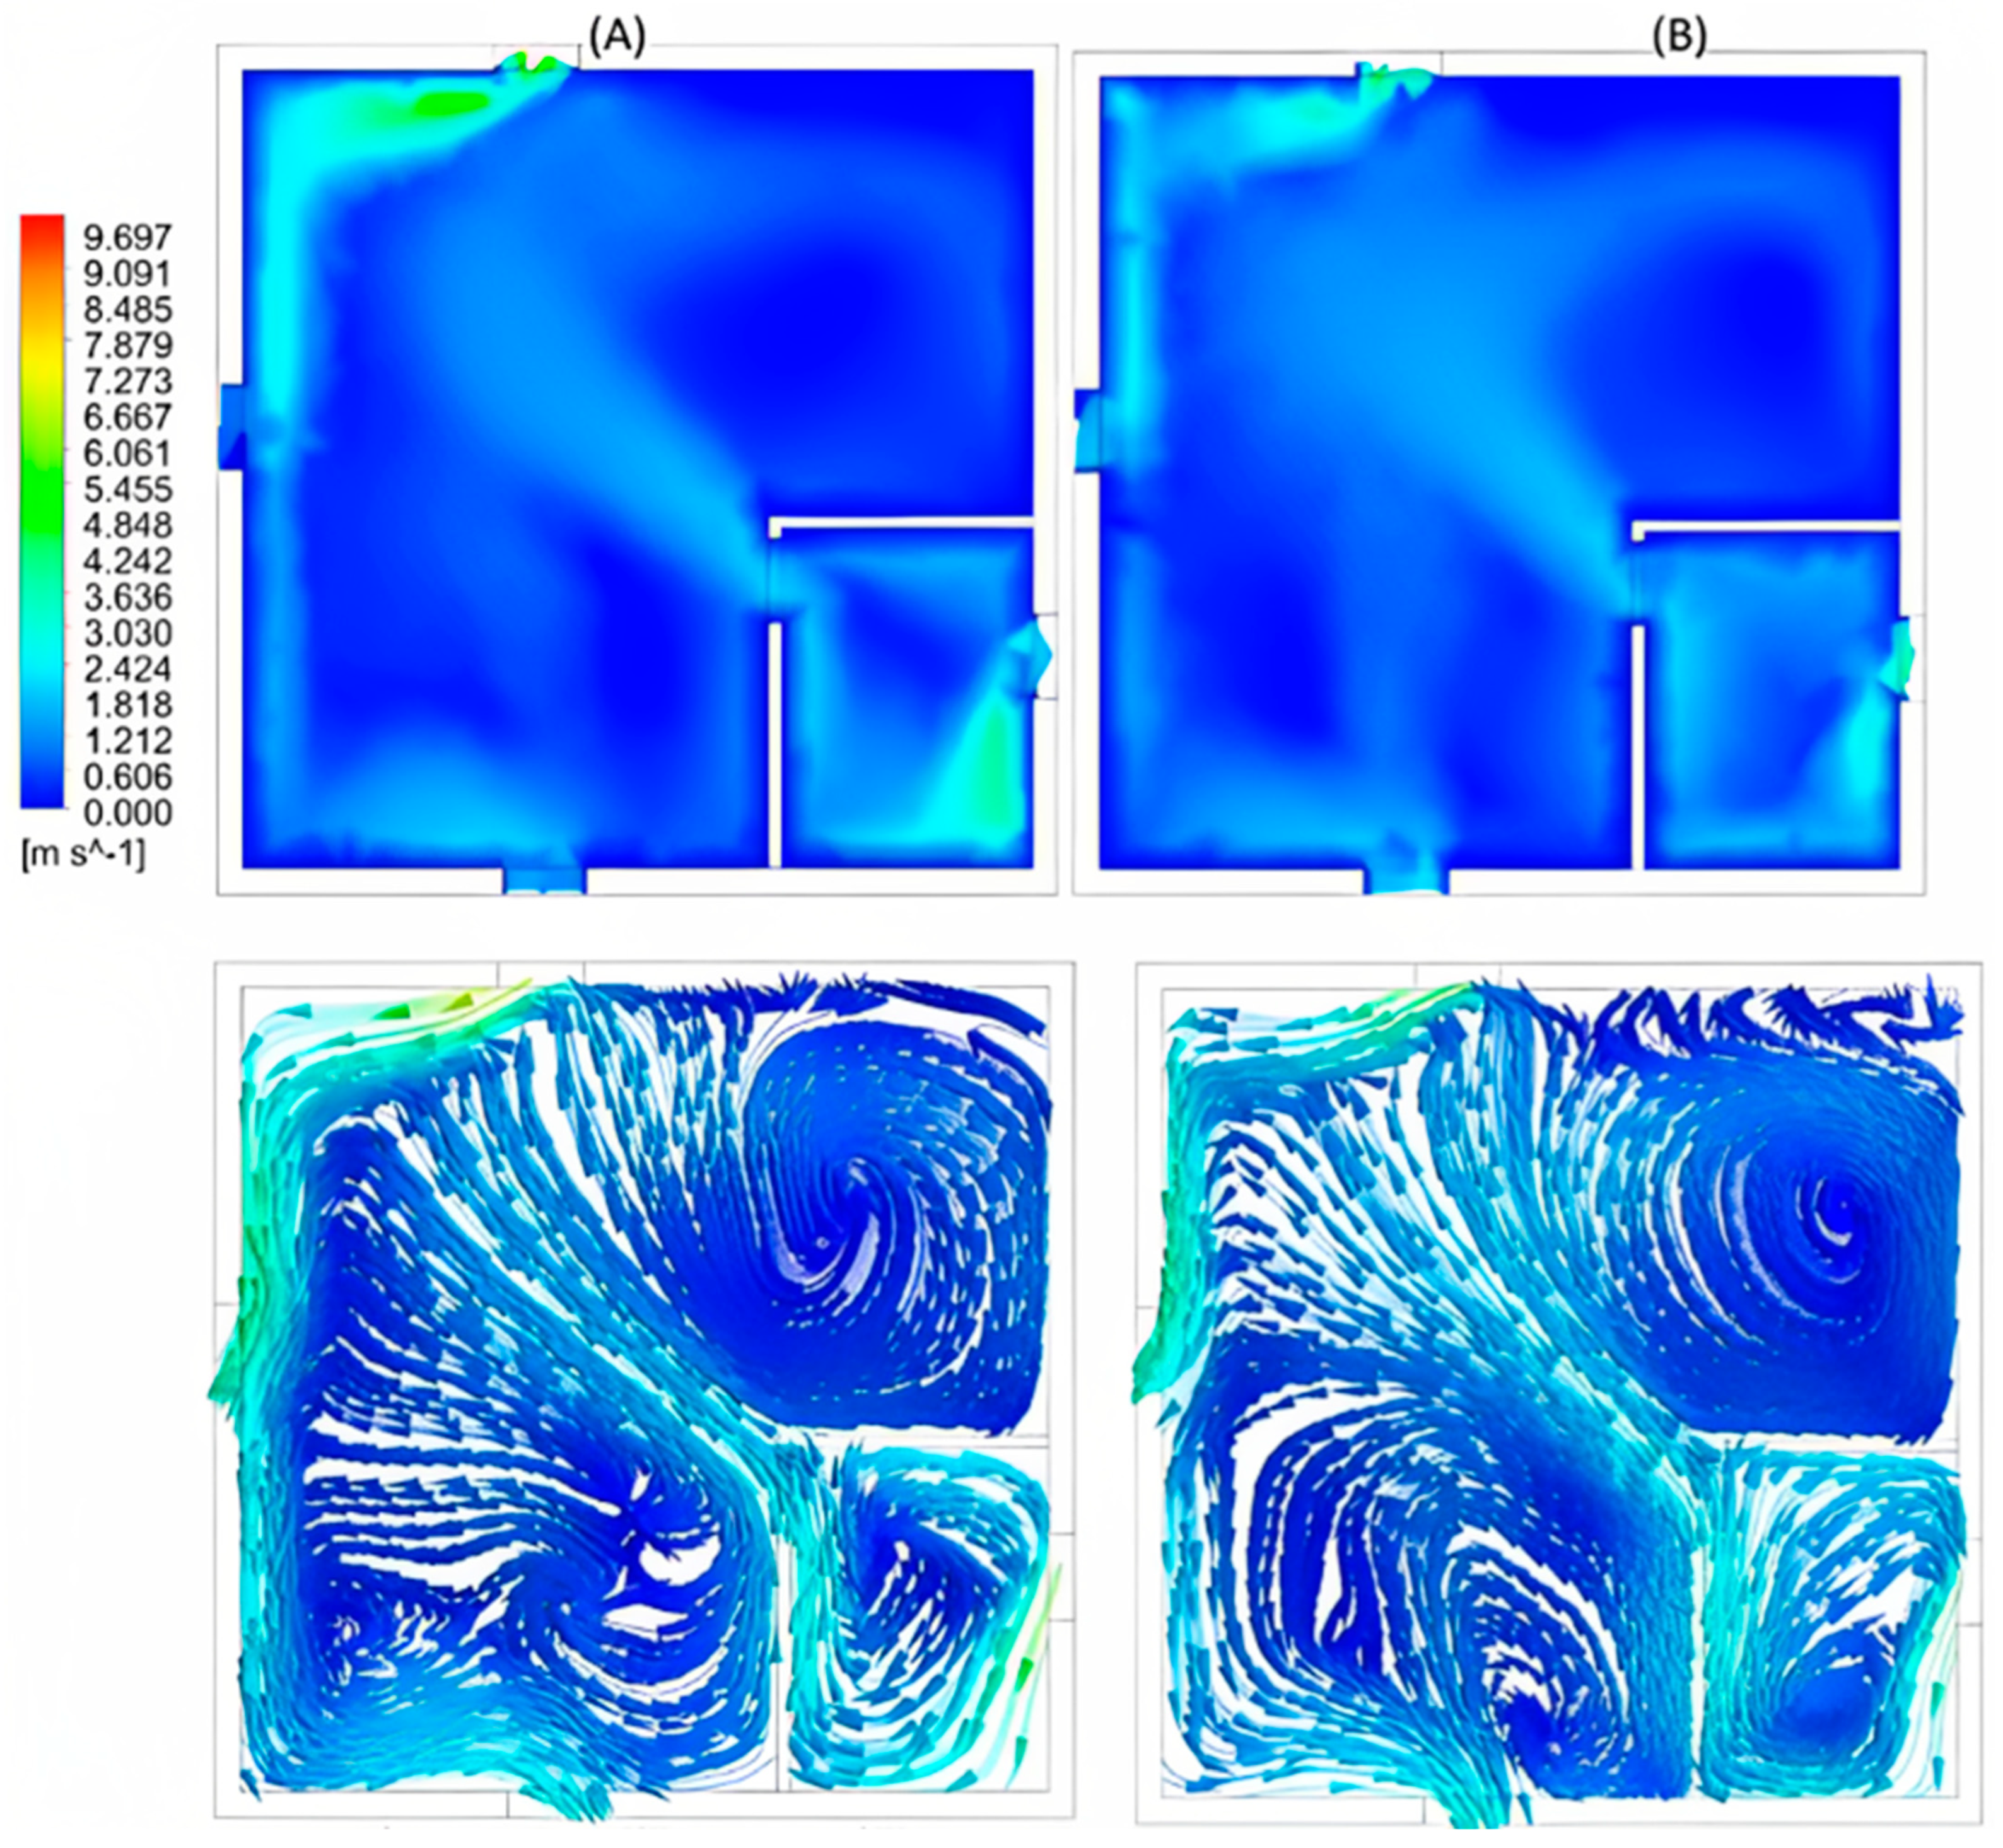
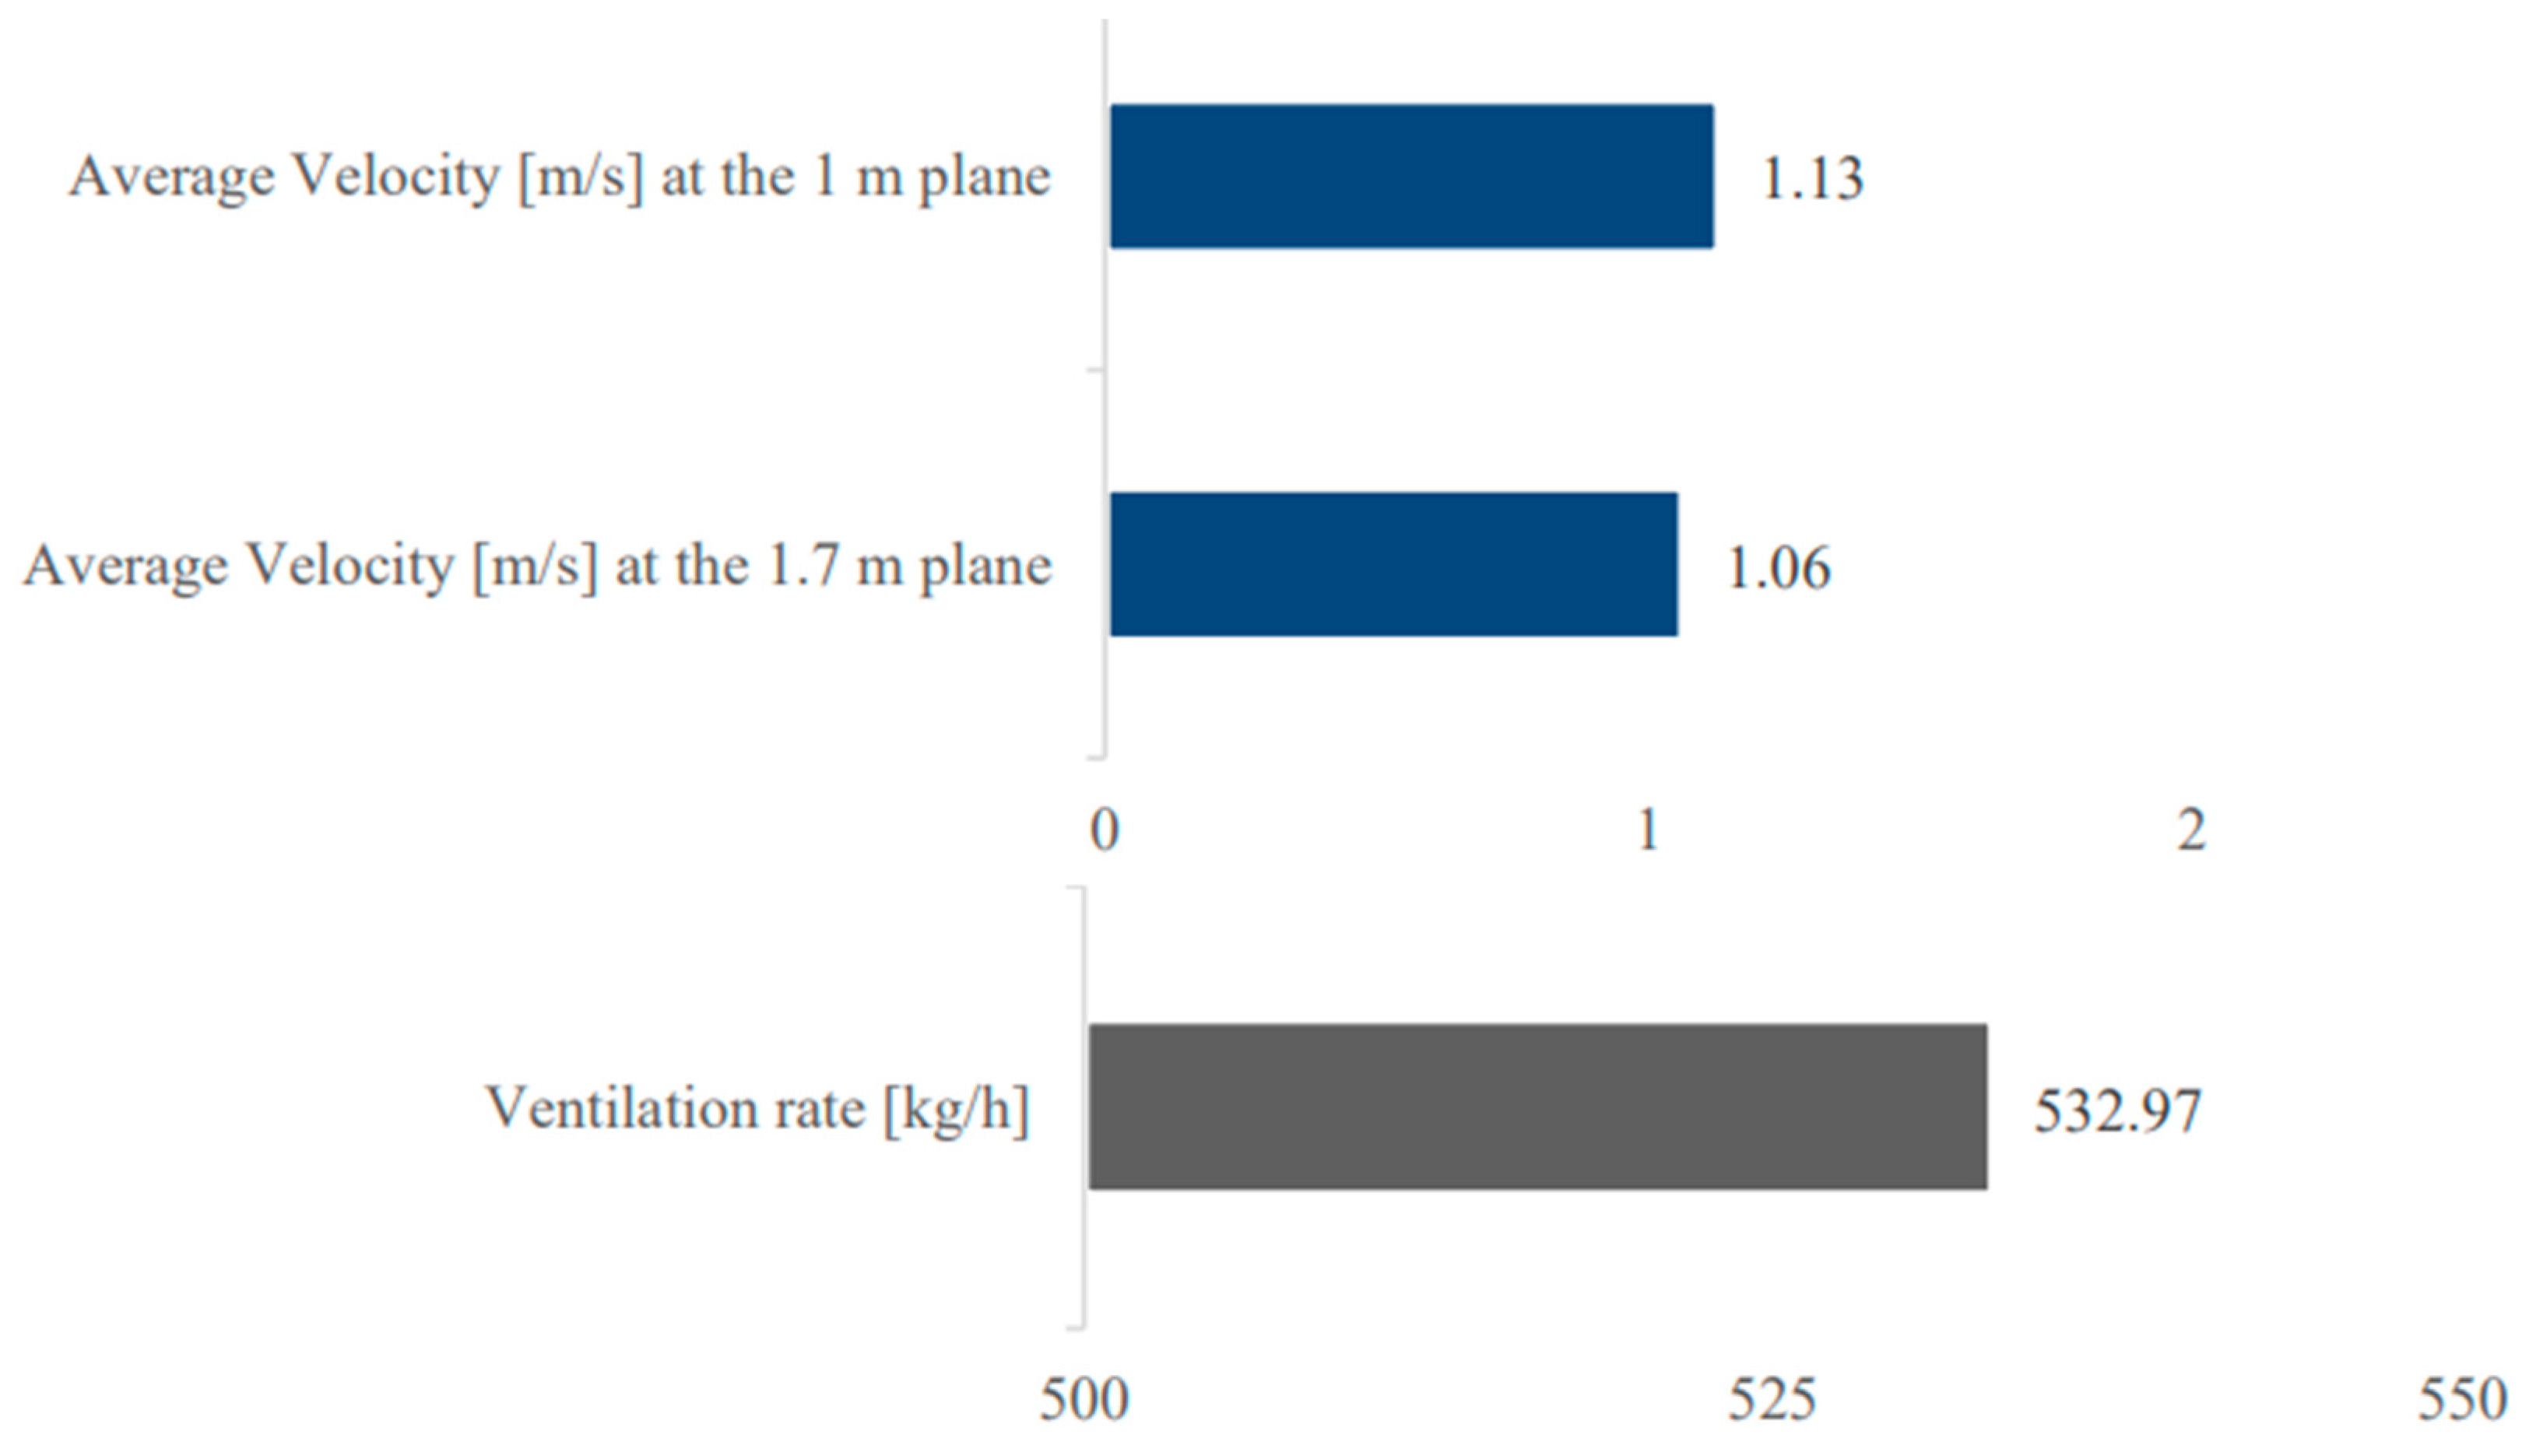
3.1. Ventilation Performance
3.2. Photovoltaic System Performance
4. Conclusions
Author Contributions
Funding
Acknowledgments
Conflicts of Interest
Nomenclature
| The total area of the PV [m2] | |
| Fraction of surface with active solar cells [%] | |
| PV Depth [m] | |
| Direct Air Capture | |
| The annually captured CO2 [tonne/year] | |
| The required DAC power to capture 1 tonne of CO2 [MW] | |
| The required DAC power to capture CO2 content from the actual natural ventilation airflow [MW] | |
| The DAC power to air flow ratio to capture 1 tonne of CO2 [MW/tonne] | |
| The total annual power generated by a 1-m2 solar-panel photovoltaic system [MW] | |
| Temperature [K] | |
| The actual natural ventilation rate supplied to the building [tonne/year] | |
| The required ventilation rate of the adopted generic building based on ASHRAE standards [tonne/year] | |
| The corresponding air flow rate to capture 1 tonne of CO2 [tonne/year] | |
| Shear component of the wind velocity [m/s] | |
| Normal component of the wind velocity [m/s] | |
| The power sensitivity of the photovoltaic system towards the solar-panel area [MW/m2] | |
| The sensitivity of captured amount of CO2 towards the solar-panel area [tonne/m2] | |
| PV efficiency [%] | |
| Inventor efficiency [%] | |
| Abbreviation | |
| ASHRAE | The American Society of Heating, Refrigerating and Air-Conditioning Engineers |
| BECCS | Bio-energy carbon capture and storage |
| CCS | Carbon Capture and Storage |
| CFD | Computational Fluid Dynamic |
| COP | Coefficient of Performance |
| DAC | Direct Air Capture |
| IAM | Integrated assessment models |
| IPCC | Intergovernmental Panel on Climate Change |
| NE | Negative emission |
| NEES | Non-emitting energy sources |
| RE | Renewable energy |
| TSA | Temperature swing adsorption method |
| VCR | Vapor compression refrigeration |
| VRE | Variable renewable energy |
| UNFCCC | United Nations Framework Convention on Climate Change |
References
- Kriegler, E.; Bauer, N.; Popp, A.; Humpenöder, F.; Leimbach, M.; Strefler, J.; Baumstark, L.; Bodirsky, B.L.; Hilaire, J.; Klein, D.; et al. Fossil-fueled development (SSP5): An energy and resource intensive scenario for the 21st century. Glob. Environ. Chang. 2017, 42, 297–315. [Google Scholar] [CrossRef]
- Rogelj, J.; Popp, A.; Calvin, K.V.; Luderer, G.; Emmerling, J.; Gernaat, D.; Fujimori, S.; Strefler, J.; Hasegawa, T.; Marangoni, G.; et al. Scenarios towards limiting global mean temperature increase below 1.5 °C. Nat. Clim. Chang. 2018, 8, 325–332. [Google Scholar] [CrossRef]
- Williamson, P. Emissions reduction: Scrutinize CO2 removal methods. Nature 2016, 530, 153–155. [Google Scholar] [CrossRef]
- Intergovernmental Panel on Climate Change. 2018. Available online: www.ipcc.ch (accessed on 15 December 2018).
- Harper, A.B.; Powell, T.; Cox, P.M.; House, J.; Huntingford, C.; Lenton, T.M.; Sitch, S.; Burke, E.; Chadburn, S.E.; Collins, W.J.; et al. Land-use emissions play a critical role in land-based mitigation for Paris climate targets. Nat. Commun. 2018, 9, 2938. [Google Scholar] [CrossRef] [PubMed]
- Fajardy, M.; Mac Dowell, N. The energy return on investment of BECCS: Is BECCS a threat to energy security? Energy Environ. Sci. 2018, 11, 1581–1594. [Google Scholar] [CrossRef]
- Fridahl, M.; Mariliis, L. Bioenergy with carbon capture and storage (BECCS): Global potential, investment preferences, and deployment barriers. Energy Res. Soc. Sci. 2018, 42, 155–165. [Google Scholar] [CrossRef]
- King, L.C.; van den Bergh, J.C.J.M. Implications of net energy-return-on-investment for a low-carbon energy transition. Nat. Energy 2018, 3, 334–340. [Google Scholar] [CrossRef]
- Jacobson, M.Z.; Delucchi, M.A.; Bauer, Z.A.F.; Goodman, S.C.; Chapman, W.E.; Cameron, M.A.; Bozonnat, C.; Chobadi, L.; Clonts, H.A.; Enevoldsen, P.; et al. 100% Clean and Renewable Wind, Water, and Sunlight All-Sector Energy Roadmaps for 139 Countries of the World. Joule 2017, 1, 108–121. [Google Scholar] [CrossRef]
- Jacobson, M.Z.; Cameron, M.A.; Hennessy, E.M.; Petkov, I.; Meyer, C.B.; Gambhir, T.K.; Maki, A.T.; Pfleeger, K.; Clonts, H.; McEvoy, A.L.; et al. 100% clean and renewable Wind, Water, and Sunlight (WWS) all-sector energy roadmaps for 53 towns and cities in North America. Sustain. Cities Soc. 2018, 42, 22–37. [Google Scholar] [CrossRef]
- Brown, T.W.; Bischof-Niemz, T.; Blok, K.; Breyer, C.; Lund, H.; Mathiesen, B.V. Response to “Burden of proof: A comprehensive review of the feasibility of 100% renewable-electricity systems”. Renew. Sustain. Energy Rev. 2018, 92, 834–847. [Google Scholar] [CrossRef]
- Breyer, C.; Bogdanov, D.; Aghahosseini, A.; Gulagi, A.; Child, M.; Oyewo, A.S.; Farfan, J.; Sadovskaia, K.; Vainikka, P. Solar photovoltaics demand for the global energy transition in the power sector. Prog. Photovolt. Res. Appl. 2018, 26, 505–523. [Google Scholar] [CrossRef]
- Child, M.; Koskinen, O.; Linnanen, L.; Breyer, C. Sustainability guardrails for energy scenarios of the global energy transition. Renew. Sustain. Energy Rev. 2018, 91, 321–334. [Google Scholar] [CrossRef]
- Fogarty, J.; Michael, M. Health and safety risks of carbon capture and storage. JAMA 2010, 303, 67–68. [Google Scholar] [CrossRef] [PubMed]
- Creutzig, F.; Peter, A.; Jan, C.G.; Gunnar, L.; Gregory, N.; Robert, C.P. The underestimated potential of solar energy to mitigate climate change. Nat. Energy 2017, 2, 17140. [Google Scholar] [CrossRef]
- Leung, D.Y.C.; Caramanna, G.; Maroto-Valer, M.M. An overview of current status of carbon dioxide capture and storage technologies. Renew. Sustain. Energy Rev. 2014, 39, 426–443. [Google Scholar] [CrossRef]
- Monastersky, R. Seabed scars raise questions over carbon-storage plan. Nature 2013, 504, 339–340. [Google Scholar] [CrossRef]
- Jiang, L.; Liu, W.; Wang, R.Q.; Gonzalez-Diaz, A.; Rojas-Michaga, M.F.; Michailos, S.; Pourkashanian, M.; Zhang, X.J.; Font-Palma, C. Sorption direct air capture with CO2 utilization. Prog. Energy Combust. Sci. 2023, 95, 101069. [Google Scholar] [CrossRef]
- Ying; Yong, J.; Liu, W.; Zhang, X.; Jiang, L. Thermodynamic analysis on direct air capture for building air condition system: Balance between adsorbent and refrigerant. Energy Built Environ. 2023, 4, 399–407. [Google Scholar]
- DS Limited. DesignBuilder 2.1. User’s Manual2009. Available online: http://www.designbuildersoftware.com/docs/designbuilder/DesignBuilder_2.1_Users-Manual_Ltr.pdf (accessed on 2 October 2021).
- BlBlanco, J.M.; Buruaga, A.; Rojí, E.; Cuadrado, J.; Pelaz, B. Energy assessment and optimization of perforated metal sheet double skin façades through Design Builder; A case study in Spain. Energy Build. 2016, 111, 326–336. [Google Scholar] [CrossRef]
- DS Limited. ASHRAE 140-2017/BESTEST Results for DesignBuilder v6.12021. Available online: https://designbuilder.co.uk/download/documents (accessed on 28 March 2022).
- Judkoff, R.; Neymark, J. International Energy Agency Building Energy Simulation Test (BESTEST) and Diagnostic Method; National Renewable Energy Lab.: Golden, CO, USA, 1995. [Google Scholar] [CrossRef]
- Alrebei, O.F.; Le Page, L.M.; Mckay, G.; El-Naas, M.H.; Amhamed, A.I. Recalibration of carbon-free NH3/H2 fuel blend process: Qatar’s roadmap for blue ammonia. Int. J. Hydrogen Energy 2023, in press. [CrossRef]
- Crawley, D.; Lawrie, L. Repository of Free Climate Data for Building Performance Simulation. 2018. Available online: https://climate.onebuilding.org/WMO_Region_2_Asia/QAT_Qatar/index.html (accessed on 10 March 2022).
- Fawwaz Alrebei, O.; Obeidat, L.M.; Ma’bdeh, S.N.; Kaouri, K.; Al-Radaideh, T.; Amhamed, A.I. Window-Windcatcher for Enhanced Thermal Comfort, Natural Ventilation and Reduced COVID-19 Transmission. Buildings 2022, 12, 791. [Google Scholar] [CrossRef]
- Mabdeh, S.; Al Radaideh, T.; Hiyari, M. Enhancing Thermal Comfort of Residential Buildings Through a Dual Functional Passive System (SOLAR-WALL). J. Green Build. 2021, 16, 155–177. [Google Scholar] [CrossRef]
- Weatherspark. Available online: https://weatherspark.com/ (accessed on 30 December 2021).
- Alrebi, O.F.; Obeidat, B.; Abdallah, I.A.; Darwish, E.F.; Amhamed, A. Airflow dynamics in an emergency department: A CFD simulation study to analyse COVID-19 dispersion. Alex. Eng. J. 2022, 61, 3435–3445. [Google Scholar] [CrossRef]
- Obeidat, B.; Alrebei, O.F.; Abdallah, I.A.; Darwish, E.F.; Amhamed, A. CFD Analyses: The Effect of Pressure Suction and Airflow Velocity on Coronavirus Dispersal. Appl. Sci. 2021, 11, 7450. [Google Scholar] [CrossRef]
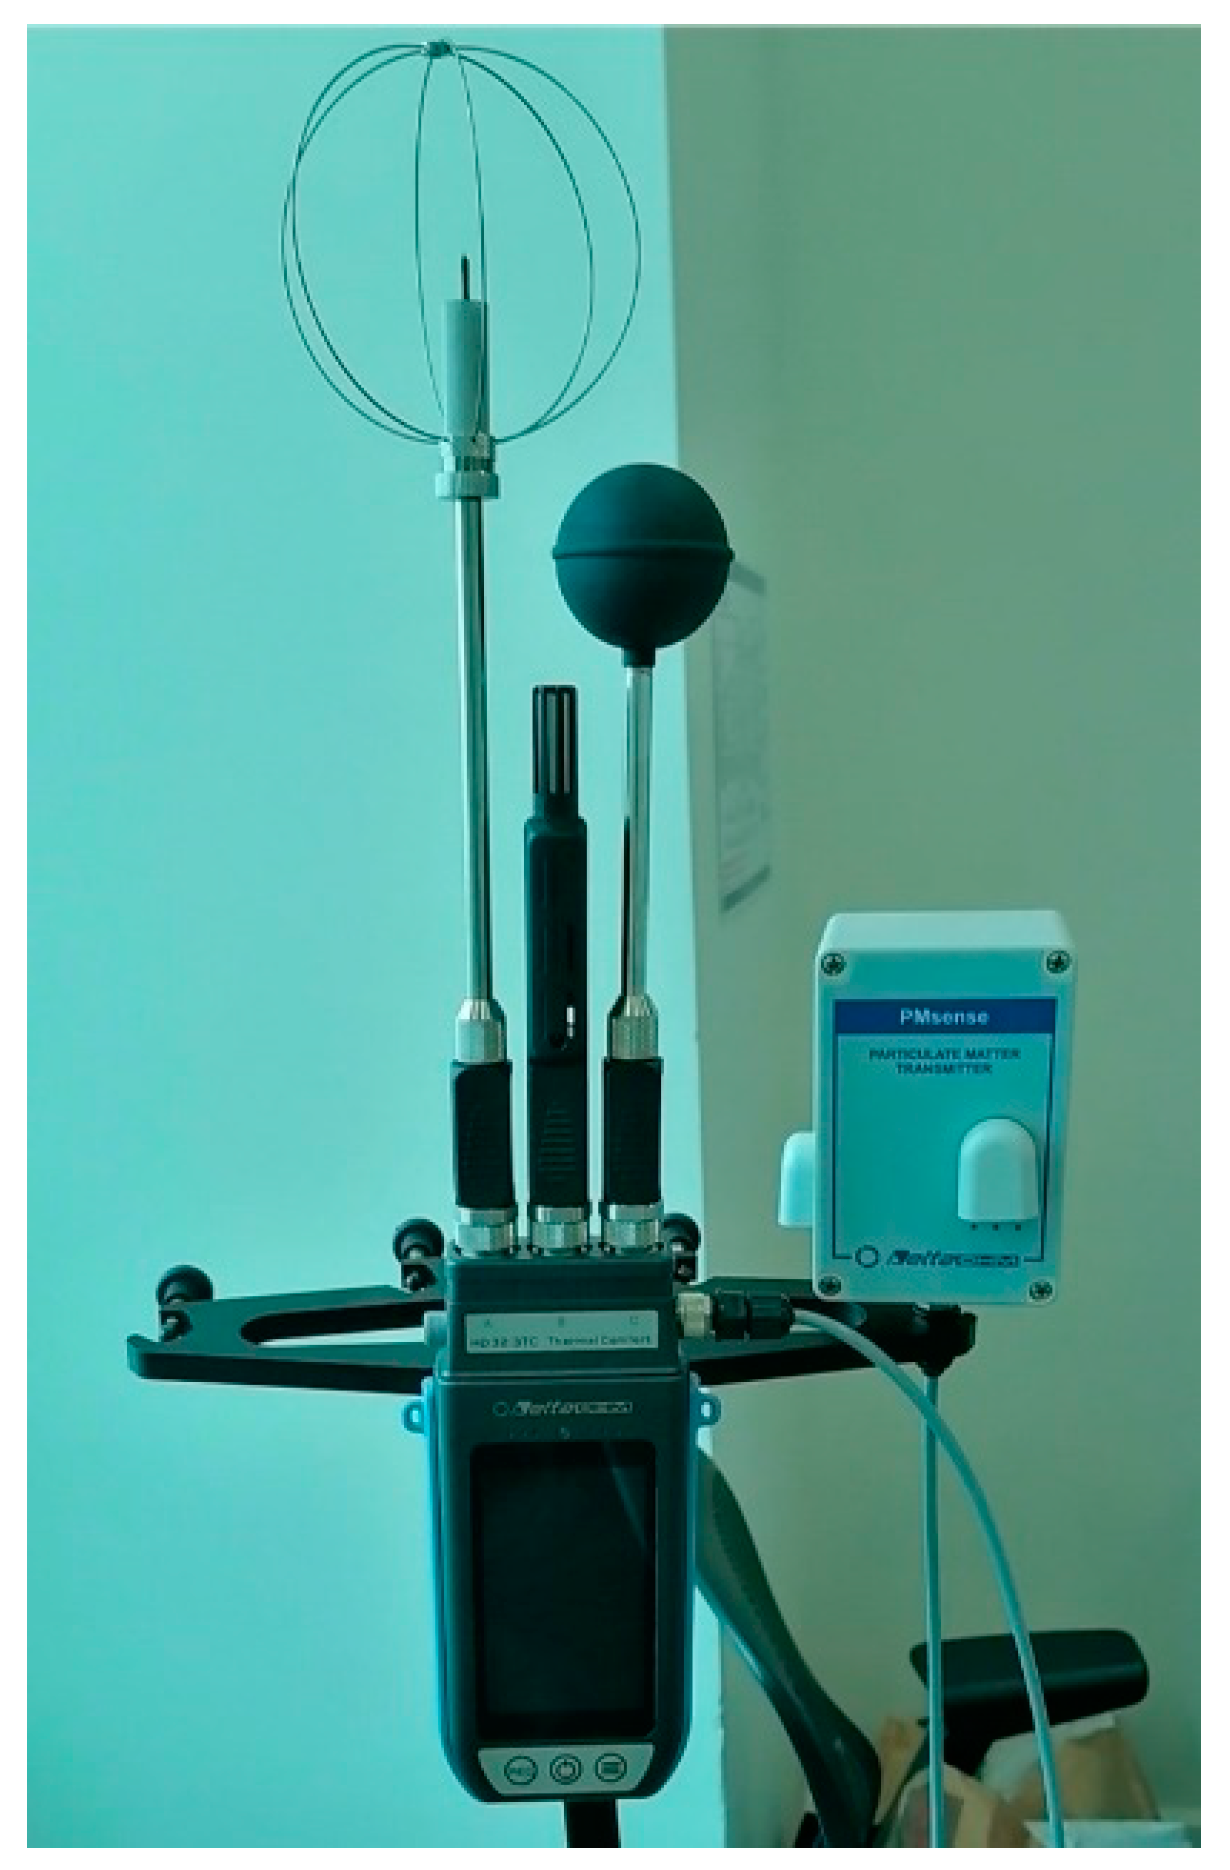
- Available online: https://www.deltaohm.com/product/hd32-3tc-thermal-microclimate-pmv-ppd-wbgt/ (accessed on 15 January 2023).
- Available online: https://www.deltaohm.com/product/ap3203f-omnidirectional-hotwire-probe-2/ (accessed on 15 January 2023).
- Bartak, M.; Beausoleil-Morrison, I.; Clarke, J.; Denev, J.; Drkal, F.; Lain, M.; Macdonald, I.; Melikov, A.; Popiolek, Z.; Stankov, P. Integrating CFD and building simulation. Build. Environ. 2002, 37, 865–871. [Google Scholar] [CrossRef]
- Nouh Ma’bdeh, S.; Fawwaz Alrebei, O.; Obeidat, L.M.; Al-Radaideh, T.; Kaouri, K.; Amhamed, A.I. Quantifying energy reduction and thermal comfort for a residential building ventilated with a window-windcatcher: A case study. Buildings 2023, 13, 86. [Google Scholar] [CrossRef]
- Li, Y.; Nielsen, P.V. CFD and ventilation research. Indoor Air 2011, 21, 442–453. [Google Scholar] [CrossRef] [PubMed]
- Alrebei, O.F.; Obeidat, B.; Al-Radaideh, T.; Le Page, L.M.; Hewlett, S.; Al Assaf, A.H.; Amhamed, A.I. Quantifying CO2 Emissions and Energy Production from Power Plants to Run HVAC Systems in ASHRAE-Based Buildings. Energies 2022, 15, 8813. [Google Scholar] [CrossRef]
- Liu, J.; Niu, J. CFD simulation of the wind environment around an isolated high-rise building: An evaluation of SRANS, LES and DES models. Build. Environ. 2016, 96, 91–106. [Google Scholar] [CrossRef]
- Alrebei, O.F.; Le Page, L.M.; Hewlett, S.; Bicer, Y.; Amhamed, A. Numerical investigation of a first-stage stator turbine blade subjected to NH3–H2/air combustion flue gases. Int. J. Hydrogen Energy 2022, 47, 33479–33497. [Google Scholar] [CrossRef]
- Zhai, Z.J.; Chen, Q.Y. Performance of coupled building energy and CFD simulations. Energy Build. 2005, 37, 333–344. [Google Scholar] [CrossRef]
- Obeidat, L.M.; Alrebei, O.F.; Nouh Ma’bdeh, S.; Al-Radaideh, T.; Amhamed, A.I. Parametric Enhancement of a Window-Windcatcher for Enhanced Thermal Comfort and Natural Ventilation. Atmosphere 2023, 14, 844. [Google Scholar] [CrossRef]
- Kasturi, A.; Jang, G.G.; Stamberga, D.; Custelcean, R.; Yiacoumi, S.; Tsouris, C. Determination of the regeneration energy of direct air capture solvents/sorbents using calorimetric methods. Sep. Purif. Technol. 2023, 310, 123154. [Google Scholar] [CrossRef]


Disclaimer/Publisher’s Note: The statements, opinions and data contained in all publications are solely those of the individual author(s) and contributor(s) and not of MDPI and/or the editor(s). MDPI and/or the editor(s) disclaim responsibility for any injury to people or property resulting from any ideas, methods, instructions or products referred to in the content. |
© 2023 by the authors. Licensee MDPI, Basel, Switzerland. This article is an open access article distributed under the terms and conditions of the Creative Commons Attribution (CC BY) license (https://creativecommons.org/licenses/by/4.0/).
Share and Cite
Al Assaf, A.H.; Alrebei, O.F.; Le Page, L.M.; El-Sabek, L.; Obeidat, B.; Kaouri, K.; Abufares, H.; Amhamed, A.I. Preliminary Design and Analysis of a Photovoltaic-Powered Direct Air Capture System for a Residential Building. Energies 2023, 16, 5583. https://doi.org/10.3390/en16145583
Al Assaf AH, Alrebei OF, Le Page LM, El-Sabek L, Obeidat B, Kaouri K, Abufares H, Amhamed AI. Preliminary Design and Analysis of a Photovoltaic-Powered Direct Air Capture System for a Residential Building. Energies. 2023; 16(14):5583. https://doi.org/10.3390/en16145583
Chicago/Turabian StyleAl Assaf, Anwar Hamdan, Odi Fawwaz Alrebei, Laurent M. Le Page, Luai El-Sabek, Bushra Obeidat, Katerina Kaouri, Hamed Abufares, and Abdulkarem I. Amhamed. 2023. "Preliminary Design and Analysis of a Photovoltaic-Powered Direct Air Capture System for a Residential Building" Energies 16, no. 14: 5583. https://doi.org/10.3390/en16145583
APA StyleAl Assaf, A. H., Alrebei, O. F., Le Page, L. M., El-Sabek, L., Obeidat, B., Kaouri, K., Abufares, H., & Amhamed, A. I. (2023). Preliminary Design and Analysis of a Photovoltaic-Powered Direct Air Capture System for a Residential Building. Energies, 16(14), 5583. https://doi.org/10.3390/en16145583