Review

Assessment of Energy Demand for PHEVs in Year-Round Operating Conditions

by
Mariusz Graba
1,*,
Jarosław Mamala
1,
Andrzej Bieniek
1,
Andrzej Augustynowicz
1,
Krystian Czernek
2,
Andżelika Krupińska
3,
Sylwia Włodarczak
3 and
Marek Ochowiak
3,*
1
Department of Vehicles, Opole University of Technology, Prószkowska 76, 45-758 Opole, Poland
2
Department of Process and Environmental Engineering, Opole University of Technology, Prószkowska 76, 45-758 Opole, Poland
3
Department of Chemical Technology, Poznan University of Technology, Berdychowo 4, 61-131 Poznan, Poland
*
Authors to whom correspondence should be addressed.
Energies 2023, 16(14), 5571; https://doi.org/10.3390/en16145571
Submission received: 13 June 2023 / Revised: 17 July 2023 / Accepted: 18 July 2023 / Published: 24 July 2023
(This article belongs to the Section E: Electric Vehicles)

Abstract

:
In this paper, particular attention is paid to an advanced variant of the plug-in hybrid electric vehicle, known as PHEV, which combines two functionalities: the vehicle’s internal combustion engine (ICE) and the electric motor. The study described herein also presents the influence of factors such as the ambient temperature, vehicle speed and traffic distance on the PHEV’s energy consumption. It has been shown that the vehicle’s range estimated based on its electronic control module (ECU) is about 20% shorter per annum on average for its year-round operation in everyday driving conditions. When analyzing the energy consumption based on the vehicle’s unitary energy consumption model, attention was paid to values that are strongly correlated with traffic and weather conditions. In addition, the authors emphasized that the estimated total energy consumption of a battery electric vehicle (BEV) or hybrid vehicle (PHEV), relative to the normative values arising from the type approval test cycle, deviate from the actual values arising from real driving conditions and often vary substantially. As shown in this paper, the energy consumption intensity of a vehicle is significantly influenced not only by its speed but also by weather conditions, including ambient temperature. In extreme cases, energy consumption intensity can increase by up to 68% relative to a WLTP (Worldwide Harmonized Light Vehicle Test Procedure) cycle.

1. Introduction

It is now widely accepted that BEVs or PHEVs are the solution for sustainable transportation in the future, at least for passenger and light-duty vehicles. This is due to their lower or zero-emission feature which reduces (and, in some areas, even completely removes—in its battery supply mode) the emissions caused by transportation processes. It also substantially contributes to the reduction in greenhouse gas emissions, especially CO2 emissions. However, it is necessary to keep in mind that some countries are still challenged by an unresolved electric vehicle battery charging issue caused by the fact that electricity in those countries is produced in a manner that generates high levels of total CO2 emissions [1].
The limited range of an electric vehicle (EV) leads users to fear that the battery will discharge, making it impossible to travel the planned route on a single charge. Simulation tests [2] have shown that the route type significantly affects energy consumption. Admittedly, urban driving involves frequent acceleration and braking phases, which can contribute to a significant increase in energy consumption; however, this enables energy recovery during braking. Higher energy consumption is observed at higher driving speeds, i.e., when driving on a highway or in non-urban conditions, at a constant speed, without any opportunities for energy recovery. The difference in average energy consumption between the urban cycle and the highway cycle amounted to 16%.
The driving range of BEVs or PHEVs is affected by many parameters with varying degrees of importance. Some parameters have a fixed value (e.g., vehicle type, drive unit type, number of seats, weight, battery type, road infrastructure, battery charging infrastructure availability, charging time, etc.). Variable parameters include the battery’s state of charge (SOC), its state of health (SOH), its behavior, the driver’s driving style, the traffic flow, the vehicle’s dynamic performance, the Battery Management System (BMS), external weather factors, etc. [3].
The issue of choosing ways to control and generate the driving force at the wheels, depending on the instantaneous load arising from traffic conditions, is the subject of scientific studies. The effect of the vehicle’s acceleration intensity on its energy demand was also analyzed in publications [4,5]. In many studies, authors are dealing with vehicle movement dynamics, which significantly affect its energy demand [6,7].
The way in which a specific route is traveled using a particular driving style is also the subject of analysis by many researchers. In papers [8,9,10], the authors estimated the residual range for various driving styles, strategies and speed profiles in real-word conditions, indicating that they substantially affect the vehicle energy demand. In paper [11], the authors presented results for the driving styles of older drivers in order to accurately account for differences in lead-vehicle operations for different driver subgroups. Hu et al. [12] have shown that energy consumption is partially related to differences in infrastructure design, traffic conditions, and personal driving styles. In paper [13], Sentoff et al. described the impact of the driving style and road infrastructure on the estimation of energy consumption and emissions.
An important element of predicting the range of vehicles and supporting the optimization of energy demand during vehicle movement is the expansion of the Intelligent Transportation System (ITS). An important element of this system is the development of intelligent vehicles. Some authors describe the need to improve the operation of intelligent vehicle positioning systems, basing their research on the proposal of an integrated positioning strategy [14], multi sensor fusion positioning method [15] and ultra-wide band positioning algorithm (UWB) [16]. The problem of the precise positioning system’s correct operation in difficult weather conditions is also the subject of research by the authors of publication [17].
Another factor that substantially affects the vehicle’s energy consumption is the ambient conditions and the commonly associated increased energy demand with power additional comfort-related systems/equipment (heating, cooling and ventilation in the passenger compartment) [18,19,20]. It was also shown in [21] that an electric vehicle’s energy consumption is significantly affected by ambient temperature and may result in a 24% decrease in battery capacity when the temperature falls down from 20 °C to 0 °C. At the same time, it is necessary to take into consideration the different functioning of most vehicle systems due to the impact, for example, of a low ambient temperature, associated with a decrease in their efficiency [22] and a decrease in the electric energy storage’s real capacity [23]. Such discrepancies affect the vehicle’s real energy demand and, consequently, its range. This is especially important in terms of the usually much more limited energy storage capacity of electric vehicles. In various publications, energy consumption is estimated for constant speed driving using multi-objective optimization [24], road information [25], real-world driving data [26] or a very large amount of data for many BEVs of different groups and sizes [27].
Smart et al. [28] analyzed the distances traveled by EV drivers in everyday operation. The predominantly declared daily range for an electric vehicle was between 15 and 45 km, accounting for about 34% of all vehicles analyzed, with the next range amounting to 45–60 km.
The range shown for electric vehicles is also based on an analysis of the daily mileage per annum of many vehicles with internal combustion engines. A report conducted by Eurostat [29] contained an analysis of the daily mobility of individuals and showed that the people who traveled the greatest distances lived in Germany. In this report, people traveled an average distance of 19 km per day.
In the next chapter of this paper, entitled “Materials and Methods”, special attention is paid to the method of energy flow in hybrid vehicles, for which a modernized Sankey diagram was developed and presented. The diagram serves to propose an information flow in the (DEVS) model. This model is similar to the discrete event model proposed by Bernard P. Zeigler [30], describing random events occurring over time. The authors propose the test methodology, describe the test facility and, in the following chapters, provide an analysis of the results obtained for a PHEV’s year-round operation, and they present summarized conclusions based on the test results.
The subject literature lacks comprehensive long-term studies of vehicles during normal operation; hence, the authors decided to present an analysis of such data. There are also a few analyses related to the operating share of individual drive units during individual trips, which prompted the authors to supplement this issue.

2. Materials and Methods

2.1. Energy Demand for an Electric Drive Unit in a PHEV Hybrid Vehicle

The energy required to overcome resistance during the vehicle’s movement is supplied to the wheels by the drive unit through the transmission system. Therefore, the total energy demand takes into account not only the movement resistance but also the losses between the drive unit and the vehicle’s wheels. Energy is supplied from storage to the drive unit with varying efficiency. Combustion engines have a significant energy loss, but the energy density of the fuel consumed is very high. This is the reason for the studied drive unit’s high input energy demand relative to its electrical energy demand. Examples of energy flows within a single drive unit are illustrated in the Sankey diagram (Figure 1), which also shows the aforementioned energy recovery that supplements the electric energy storage. The operation of an internal combustion engine involves a complete chain of conversion of the energy contained in the fuel into mechanical energy, which is then supplied to the vehicle’s wheels. The amount of mechanical energy supplied to the wheels depends on a number of conditions, including the internal combustion engine’s operating point, which affects the engine’s efficiency, as well as the external environment, the implemented speed profile and the driving dynamics. The amount of energy supplied to the wheels is significantly smaller and ranges from 9% to 28%, and it is analyzed in many papers. In terms of the electric motor’s efficiency, the amount of energy supplied to the wheels is significantly higher and ranges from 65–82%, which is due to the absence of thermodynamic transformations resulting from fuel combustion in internal combustion engines. The use of energy sources with varying energy densities in a single drive unit creates ambiguity with regard to total energy consumption. Energy consumption measurements take into account the energy expenditure from the storage units, i.e., the fuel tank or batteries. Some researchers, such as Yuan at al. [31], presented a mathematical model that covers all energy flow components, including a detailed determination of the efficiency of individual drive unit components.
However, the main factor that determines the energy demand is the actual driving conditions, which usually vary substantially and affect the vehicle’s range. Hence, the energy consumption during daily driving in real traffic conditions differs from the parameters obtained in the type approval test cycle. This is caused by the fact that the occurring differences are determined, among other things, by random factors in the interaction pattern of the DEVS system, which significantly alter the individual energy flows in the vehicle’s energy balance (Figure 1). For example, it is possible to note a significant increase in energy consumption in heavy urban traffic (traffic jam, intermittent driving), even for the most technically advanced drive unit. This is an important issue, because literature studies [32] have shown that the environment, in a sense, dictates the driving style on a given road section by increasing the driving intensity, resulting in an increased energy expenditure of several tens of percentage points, regardless of the energy carrier (Figure 2).
The differences in fuel consumption shown do not arise from the drive unit used or its power supply but from the conditions under which the vehicle was driven. Similar results were obtained by the authors in paper [33], where they evaluated the energy consumption of Audi Q4 Sportback 50 e-tron electric vehicles in a road test conducted in normal traffic conditions (Table 1).
In paper [33], energy consumption was analyzed against the WLTP test, showing that consumption increases by 76% at 140 km/h. Energy consumption per distance traveled can be calculated from correlation (1), the commonly used unit of which is (kWh/100 km), similar to fuel consumption, denoted in (l/100 km). Such an approach to the vehicle’s energy consumption enables the comparison of the impact of environmental factors for a specific vehicle’s energy consumption model. In a PHEV hybrid powertrain, the most important quantities are the total energy expenditure and its operation cost.
Q L = W o · t s t e   F C   d t F C + t s t e   P   d t E E + E R L
The presented mileage energy consumption QL changes after mass is taken into account. Therefore, the vehicle’s unitary energy consumption enables the evaluation of energy consumption over a certain distance and at a certain mass. The vehicle’s mass is the main energy-consuming component associated with its acceleration and depends on its speed profile and driving style [34]. Taking mass into consideration in the energy consumption analysis allows for an objective evaluation and making a reference to the total energy consumption of vehicles with different masses.
Q m L = Q L m
Nevertheless, the beginning and end of each trip are determined in standstill; therefore, the sum of kinetic energy in the drive unit is zero. It is possible to describe the input energy in the drive units in the vehicle’s entire powertrain chain with the following equation:
W o · t s t e   F C   d t   F C + t s t e   P   d t   E E E M E E E D E L + E R = 0
where the variables are energy consumption in movement (EM), i.e., energy required to overcome the car’s resistance to movement, engine energy losses (ΔEE) and drive unit losses—from engine to wheels (ΔED), as well as losses in energy supplied to the drive unit without transmission to the drive wheels (ΔEL)—the vehicle’s standstill phase, among others, and energy recovery (ΔER) during deceleration.
The DEVS model’s interdependencies and external factors for a vehicle’s hybrid drive unit are random structures, which can be described by an ordered seven, the components of which are defined by Formula (3) below, according to the Discrete Event System Specification and Modeling Structure Guidelines [12]:
Q T j = X , E T , Q T j , δ i n t , δ o u t , λ , t
where (X)—the DEVS model’s input variables, ET—Energy Unit Vehicle state variables in the powertrain, (QTj)—the model’s output variables, ( δ i n t )—internal parameter of energy transfer from storage to EET, ( δ o u t )—external parameter of energy transfer DEVS x X ET, with DEVS input factor states, (λ)—output function ETQTj, (t)—progressive time increase.
It is a model used to enable the representation of all changes by events (nodes) that affect the output value of the vehicle’s unitary energy consumption. A study of events in individual energy flows enables the parameterization of the factors affecting the vehicle’s unitary energy consumption index.
The DEVS model’s interdependencies can be represented as shown in the diagram below (Figure 3).
DEVS input vectors can be described as variables:
driver (D)—determines the route, speed profile, dynamics and load on the drive unit
D E V S D = L ,   V ,   a ,   P ,   ω , t
environment (E)—determines the movement resistance power, temperature and interference
D E V S E = P ,   T , N V H ,   t
vehicle (V)—determines the resistance power, mass, energy and interference
D E V S V = P ,   m ,   E ,   t
system (S)—determines the traffic flow, acceleration and travel time
D E V S S = V ,   a ,   t
All energy flows indicated in the DEVS model affect the vehicle’s unitary energy consumption to varying degrees, resulting in discrepancies between the mileage energy consumption in the type approval test and energy consumption in everyday driving. The proposed DEVS model includes a description of the factors that affect the vehicle’s energy consumption in real traffic conditions. The model illustrates a system of relationships and interdependencies of individual quantities on the energy flow in the analyzed test object. The proposed model takes into account the impact of changes in the model’s input parameters, such as the speed profile, ambient temperature or acceleration mode, on the output in the form of the vehicle energy intensity. The DEVS model should be treated as a set of interdependencies between individual input parameters, which should be implemented in the detailed equations of vehicle movement, e.g., in Equation (3).
In publication [33], the authors conducted a study on the energy consumption of an electric motor in real traffic conditions, arising from varying driving speeds. The road tests demonstrated significant discrepancies in the mileage energy consumption, ranging from 9.9 kWh/100 to 33.2 kWh/100 km, depending on the vehicle’s type and driving speed. The data presented in paper [35] were used by its authors to develop a figure that showed these dependencies (Figure 4). The difference between the “eco city” minimum value and the “140 km/h” maximum value, depending on the vehicle’s type, is a maximum of 3.3 times, while depending on the given vehicle type’s speed, the maximum difference is 2.3 times. The values shown cannot be compared to each other due to their differing structures and, above all, the vehicle’s mass, which was emphasized by Kropiwnicki [36], who compared electric motors and internal combustion engines in terms of their unitary energy consumption [5], including the unitary energy consumption of a hybrid vehicle.
The differences between specific vehicles—their minimum and maximum values—were reduced significantly in terms of their unitary energy consumption in the same traffic conditions. The difference between the minimum unitary energy consumption for the “eco city” mode and the maximum consumption for the 140 km/h speed has changed significantly, and it is now 2.4 times. The values have not changed for the same vehicle. The vehicle with the lowest unitary energy consumption in urban traffic is the Hyundai Kona Electric, while the best results for the set speeds were achieved by the BMW IX3, which has a slightly higher unitary energy consumption in urban traffic than the best Hyundai [35].
The PHEV hybrid vehicle has a different energy consumption for its electric motor, which was analyzed, similarly to the Audi Q4 Sportback 50 e-tron (Table 1) [33], in terms of its energy demand in a road test conducted at a constant and set speed in normal traffic conditions (Table 2).
The differences between both vehicles are already significant in terms of the WLTP cycle’s energy consumption and amount to 16%, and their energy demand at other speeds is also higher.

2.2. Research Methodology

The vehicle’s unitary energy consumption is a varying index dependent on many conditions, including the drive unit’s type, its movement parameters, its dynamics, its travel speed, environmental conditions or the driver’s preferences. In the case of the hybrid powertrain, the drive units’ interoperation cannot be measured in terms of the storage unit’s energy expenditure. Therefore, the main objective of this study was to evaluate the hybrid vehicle’s energy demand expressed in the unitary energy consumption index for the PHEV hybrid vehicle in year-round operating conditions. The vehicle’s unitary energy consumption in the TTW (Tank-To-Wheels) formula denotes the vehicle’s real energy performance. The vehicle’s unitary energy consumption index is denoted in universal units, expressing the energy [J] required to travel a distance of 1 m at 1 kg of vehicle mass. Energy consumption statistics for various conditions of everyday driving, but mainly for the electric motor, were taken into account in the evaluation.
The following assumptions were made in the research methodology:
a driving analysis was carried out for the dominant mileage derived from the year-round mileage histogram (Figure 5). The value shown denotes a single trip with a distance of 50 km, with a standard deviation of 5 km,
the presented dominant mileage, having taken into account the standard deviation, denoted the range of approximate mileages analyzed in terms of the vehicle’s unitary energy consumption,
the presented dominant mileage is within the electric mode driving range, and the analysis only encompassed trips starting at 100% of the electric energy storage’s charge. The internal combustion engine only served an auxiliary function,
the vehicle’s technical data have shown that the electric motor should enable traveling the entire distance of 50 km during the road tests,
the unitary energy consumption was evaluated for constant driving speeds.
The analysis of the vehicle’s unitary energy consumption index was carried out for the vehicle’s actual operating conditions resulting from daily trips characterized by arbitrary route selection, including random driver choices in the standard hybrid powertrain control mode. A total of 297 trips were analyzed, including 120 trips analyzed in detail due to the fact that they met the adopted dominant distance criteria.
The test vehicle was a Mercedes-Benz A 250e manufactured in 2021, equipped with a parallel full hybrid powertrain with two drive units (a 75 kW electric motor and a 118 kW internal combustion engine) located on the front driving axle (Table 3).
The vehicle’s traction and energy parameters were monitored during everyday driving with the use of vehicle-dedicated software and a TEXA diagnostic system, including simultaneous data recording. The vehicle manufacturer’s software enables real-time reading of the vehicle powertrain’s most important parameters via Bluetooth. In addition, the application saves each trip’s data collected in the database during year-round operation. The system allows for the recording of such parameters as the travel time, average speed, energy consumed and recovered, operating time and distance traveled by individual drive units, fuel consumed by the ICE, average energy consumption, etc. The OBD2 system, through which the TEXA diagnoscope communicated with the vehicle, complemented the data recorder. During the tests, the vehicle was mainly used by a single driver for commuting to work, but the tests also included trips on other routes. For each trip, the application generated a set of summary data that were stored in the database and subsequently analyzed.

3. Results

3.1. Analysis of the Test Vehicle’s Distance and Energy Indices

The authors evaluated the test hybrid vehicle’s energy demand (especially, the electricity demand) in everyday operating conditions in Poland for a period of 12 months. Figure 5 shows the average distance traveled by the PHEV in everyday operating conditions. The distance ranged from 45 to 55 km. It was found that such a distance ensured the predominant use of the electric motor, which minimized fuel consumption.
The conversion of the average mileage fuel consumption into carbon dioxide emissions in year-round operation demonstrated that the tested vehicle’s performance was very good in terms of the 2021 EURO 6 (AP) emissions standard of around 95 g/km. The carbon dioxide emissions, both for the entire year and for individual quarters, were lower than the cited standard (Figure 6). The quoted CO2 emissions only apply to the internal combustion engine’s fuel consumption; hence, the quoted emissions refer to the vehicle’s location of use. However, the value does not apply to possible emissions during the production of electricity used to charge the vehicle’s batteries.
The carbon dioxide emissions presented in the figures refer to different operating conditions (spring, summer, autumn, winter) over a total distance of 30,000 km. The evaluated trips vary in terms of traffic conditions, driving style preferences or ambient conditions, including the ambient temperature and road infrastructure. The analyzed trips obviously differ in terms of energy consumption and distance traveled, but all of them involved the predominant use of the electric motor due to the distance traveled (Figure 7a), as mentioned above.
The chart presenting the distance traveled clearly shows the predominant use of the electric motor, with the annual average accounting for 80%, including individual instances when the distance traveled was approximately 600 km. For all trips, the internal combustion engine’s participation only amounted to 20%, on average. The internal combustion engine was usually activated in three traffic situations:
(a)
at high driving speeds (highway—at speeds above 120 km/h),
(b)
during overtaking and dynamic acceleration (high-power sections),
(c)
when the electric energy storage was depleted.
The first two situations raise no objections, as the vehicle’s parallel hybrid powertrain allows both drive units to operate together. According to the WLTP, the vehicle’s range while using the electric motor is supposed to ensure a distance of 75 km; hence, the electric motor should cover 100% of the vehicle’s energy demand. This is not the case, however, if Figure 4b is taken into account. Disregarding routes with significant ranges, e.g., holiday trips, where the energy consumption reaches 75%, the average annual energy demand for the entire powertrain is 53%. A direct comparison of the energy of the drive units in a hybrid powertrain is difficult, especially since the vehicle’s deceleration process involves energy recovery, which distorts the energy demand. When analyzing the energy balance of a vehicle with a hybrid powertrain, moving in road conditions, the balance’s starting value is 100% of the energy supplied from both storage units to the respective drive units during the trip.
However, regardless of the drive unit used, the vehicle’s power demand depends on the instantaneous traffic conditions. Therefore, the authors focused on the evaluation of the energy consumption in the PHEV’s everyday operation and on the use of its electric motor compared to an all-electric BEV described in the literature [3,37].

3.2. Energy Consumption of an Electric Motor in a Hybrid Powertrain

When analyzing the results of the trips in terms of statistics, it is clear that the longer the route, the lower the share of the electric motor’s use in the hybrid powertrain, which can be explained by the depletion of the energy storage unit, and the mileage indicated for the electric motor is a result of the energy recovered from the powertrain. The energy recovery amounts to approx. 25% for longer trips, as shown in Figure 8.
The energy supplied through the power transmission system to the drive units is then supplied to the drive wheels only during the propulsion phase characterized by acceleration or when driving at a constant speed. This energy is needed to travel the assumed distance and is determined by the balance component (EM). Many works analyze the energy consumption by using Equation (1), but this mainly applies to a powertrain with the same types of drive units. For the hybrid powertrain, the TTW rate is quite different and depends on the drive units used and the energy storage unit’s capacity. In addition, there is the energy recovery process in the vehicle’s everyday driving, which takes places when the driving force is not applied to its wheels, i.e., during coasting or braking. This creates an opportunity to reverse the force flow and to recover energy from the wheels. The energy storage unit is thereby replenished with an additional energy input (Figure 1).

3.3. The Vehicle’s Unitary Energy Consumption Index

The analysis of the vehicle’s unitary energy consumption index was carried out according to the adopted methodology in everyday driving conditions throughout a year-long period, i.e., in various weather and road conditions, in urban and non-urban traffic. The distinguishing factor was the vehicle mileage, for which the average road conditions were determined on a quarterly basis. Table 4 shows the traction and energy parameters for the analyzed trips at different periods throughout the year.
Summer and autumn involved the predominant use of the electric motor in the hybrid powertrain, while the internal combustion engine was turned on occasionally for short periods to increase the vehicle’s instantaneous speed or to assist the vehicle’s intense acceleration on the road. Figure 9 shows each drive unit’s operation time in the studied powertrain.
In terms of individual percentage shares, the internal combustion engine’s maximum share was 15% for group IV (winter period). As shown in Table 4, the average trip distances in each period did not differ much. However, the unitary energy consumption of the vehicle’s electric motor varied significantly from period to period throughout the year (Figure 10). Each subsequent point on the diagram is a representation of the average of all trips for a given day in the year (if several trips were taken on a given day).
In paper [21], the authors estimated the unitary energy consumption’s variation with respect to temperature with an I-order equation, showing an increase of 0.0154 (J/(kg·m)) for each degree of temperature increase from −15 °C to 18 °C. The highest unitary energy consumption occurred during the winter period (group IV). It is therefore possible to estimate the change in the DEVS model’s energy consumption, caused by a change in ambient temperature, with the following function:
Q T j E = f 0.0154 · T + C ,   T = < 15 18 >
where: T—ambient temperature, C—test vehicle’s constant of 0.5664.
In paper [21], it was noted that no trip met the vehicle’s unitary energy consumption criterion and did not reach the limit from the WLTP test at temperatures below 5 °C. In this case, for the analyzed dominant distance, the internal combustion engine was enabled to complete the trip on the assumed road section. It also resulted in a significant reduction in the vehicle’s nominal mileage, estimated by its drive unit’s ECU. At the same time, the test vehicle’s average unitary energy consumption is approx. 30% higher relative to that of all-electric vehicles (Figure 4b).
The mileage energy consumption of the test vehicle’s electric motor presented in Table 4 is summarized for a set vehicle speed and an average drive speed in urban traffic. In this case, the test vehicle achieved a significant increase in energy consumption, twice that of the electric motor shown in Table 1. The energy consumption increases by as much as 150%, as shown in Figure 11.
In this case, it is possible to estimate the variation in unitary energy consumption against vehicle speed with an I-order equation, showing an increase of 0.0036 (J/(kg·m)) for each increase in speed of 1 km/h. The vehicle’s lowest unitary energy consumption was measured at 60 km/h and amounted to 0.3 (J/(kg·m)), whereas the increase in the vehicle’s unitary energy consumption at speeds from 60 km/h to 140 km/h was as high as 150% (Figure 12). For the vehicle’s set speed, its estimated unitary energy consumption in the DEVS model can be described with the following Equation (10)
Q T j V = ,   f 0.0036 · v + C 2 ,   v = < 60 160 >
where: v—vehicle speed, C2—test vehicle’s constant of 0.1176.
Figure 12 shows the impact of the vehicle speed on its unitary energy consumption in the context of the limit set by the WLTP cycle. After taking into account Equation (2), it is clear that the energy consumption limit is not met above the vehicle speed of 90 km/h.
In summary, the analyzed factors that affect the energy demand in road conditions during everyday driving also affect the vehicle’s unitary energy consumption index. The consumption’s increase among a group of environmental factors and the vehicle’s parameters is clear and has a direct impact on the range estimated by the vehicle’s ECU. However, real operating conditions involve significant differences between the estimated and actual range, as shown in paper [33]. In the case of the analyzed electric motor, the differences are very significant and amount to 38.6%, most likely due to the energy storage unit’s small capacity (Figure 13). Factors such as cold starting, low ambient temperatures or high vehicle speeds have a decisive impact on the vehicle’s unitary energy consumption.
Modeling the energy demand of a passenger vehicle equipped with a hybrid powertrain in real driving conditions is not an easy task. The number of factors that affect energy consumption is substantial, making it even more difficult to compare the energy demand of different vehicles. An analysis of the unitary energy consumption index for a vehicle driven at a set speed and only using its electric motor shows the disadvantage of the PHEV, as shown in Figure 14.

4. Conclusions

The changes in the vehicle’s unitary energy consumption at set speeds are smaller than those at variable speeds, despite the difference in the mass of all-electric vehicles and the studied hybrid vehicle. In this context, a change in the test vehicle’s unitary energy consumption relative to the external temperature generates the largest changes, which, at −15 °C, reach a nearly 140% increase relative to the temperature derived from the WLTP cycle.
Furthermore, an analysis of the results presented in the paper allows for the following conclusions:
the vehicle’s energy consumption is significantly affected by the time of year, which is related to ambient temperature and the road conditions; as can be seen in Figure 10, the differences in unitary energy consumption can be as high as 110%.
given the test methodology, i.e., the vehicle was driven by a single driver, the influence of the driver’s driving style on the results can be excluded,
it should be noted that the tests were mainly carried out on the same route at similar times of the day (commuting to and from work), and therefore, it should be concluded that the change in traffic intensity was random and did not, in this respect, have a significant impact on the vehicle’s energy intensity,
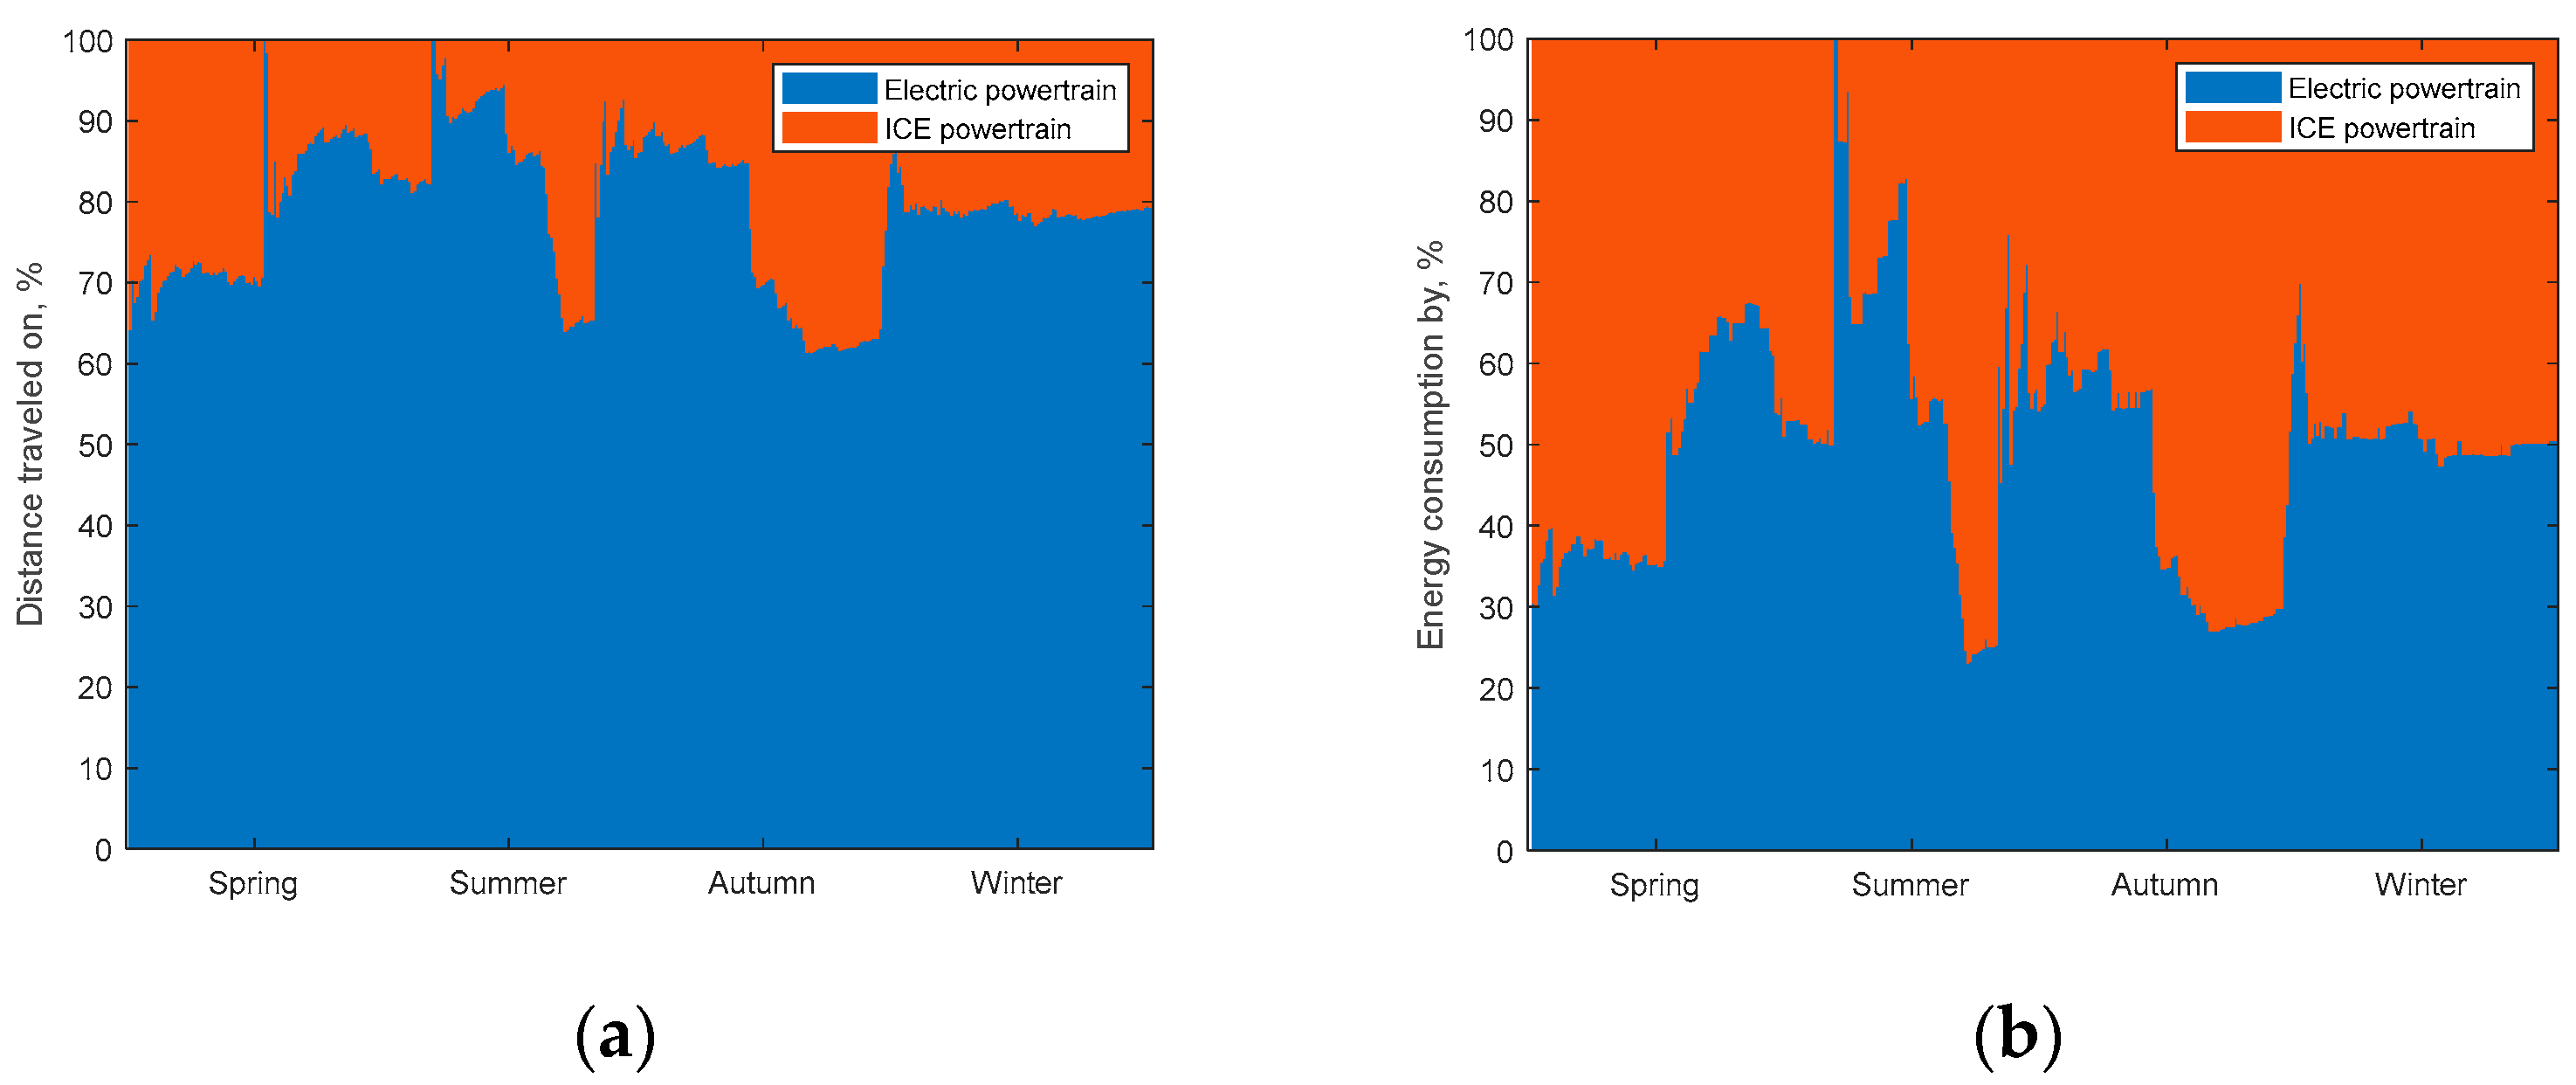
despite the significant share of the electric motor (more than 70%) in the recorded trips, its relative energy consumption is relatively low compared with that of the ICE (Figure 7),
the PHEV vehicle type is mainly used by a driver with similar preferences, and energy consumption minimization is linked to the possibility of frequent battery charging. This is a problem that has already been recognized in many papers, as the electricity needs to be replenished after each trip (due to low capacity); otherwise, the vehicle’s powertrain uses the internal combustion engine, which significantly increases the unitary energy consumption.
Taking into account the above conclusions, it can be summarized that a hybrid vehicle’s unitary energy consumption index is higher for both environmental factors and vehicle or system parameters, as described by the DEVS model. The resulting difference causes the vehicle’s ECU to underestimate the energy demand by an average of 39%. It is a significantly larger underestimation relative to all-electric vehicles, as shown in Figure 14.
Nevertheless, the presented analysis of the vehicle’s unitary energy consumption index in relation to the commonly used mileage energy consumption denoted in kWh/100 km (l/100 km for internal combustion engines) demonstrates that the index is reliable. It takes into account the most important energy consumption factor, i.e., the vehicle mass. The widespread use of this simple energy consumption index allows for an objective assessment of the vehicle’s energy demand, in which case its value is directly proportional to the driving dynamics and, therefore, the driver’s driving style, i.e., factors over which car manufacturers have little influence. This issue was presented in more detail in paper [38]. In addition, the dimension of the index represents the demand for energy required to move a vehicle with 1 kg in mass over a distance of 1 m.

Author Contributions

Conceptualization, J.M., M.G. and A.B.; methodology, A.B., J.M., K.C. and M.G.; data curation, formal analysis and simulation, A.A., M.O., M.G. and A.K.; writing—original draft preparation, J.M., A.B., A.A. and M.G.; writing—review and editing, A.B., J.M. and M.G.; software, M.G.; resources, A.K., S.W., K.C. and M.O.; resources, J.M., A.B. and M.G.; visualization, K.C., A.K., S.W. and M.O. All authors have read and agreed to the published version of the manuscript.

Funding

This research received no external funding.

Data Availability Statement

The data presented in this study are available on request from the corresponding author.

Acknowledgments

This research was supported by Polish Ministry of Education and Science.

Conflicts of Interest

The authors declare no conflict of interest.

Definitions/Abbreviations

λoutput function ETQTj,
Q T j E energy consumption in the Driver–Environment–Vehicle Communication System (DEVS) model due to changes in ambient temp. (J),
Q T j V energy consumption in the DEVS model due to changes in vehicle speed (J),
δintinternal function of energy transfer from storage to E→ET
δoutexternal parameter of energy transfer DEVS x X ET with DEVS input factor states,
amean acceleration of profile (m/s2),
AMRAllied Market Research,
BEVBattery Electric Vehicle,
BMSBattery Management System,
Ctest vehicle constant of 0.5664,
C2test vehicle constant of 0.1176,
DEVSDriver–Environment–Vehicle Communication System,
Eenergy (J),
ECUEngine Control Unit,
EEelectricity,
EMenergy consumption in movement (J),
EMSEnergy Management System,
ERrolling resistance energy (J),
ETEnergy Unit Vehicle state variables in the powertrain,
EURO6European Union emissions standard,
EVElectric Vehicle,
FCfuel consumption during test (g),
ICEInternal Combustion Engine,
ICEVInternal Combustion Engine Vehicle,
Ldistance (m),
Ledistance driven by electric unit (m),
LTtotal distance driven (m),
Mmass (kg),
NVHenvironmental interference,
PPower (W),
PHEVPlug-in Hybrid Electric Vehicle,
Qedistance-related electric energy consumption (kWh/100 km),
Qfdistance-related fuel consumption (dm3/100 km),
QLmileage energy consumption,
QmLmass-related energy consumption (J/kg),
QTjtotal unit energy consumption (J/m·kg−1),
QTj,total unit energy consumption (J/(kg m)),
QTje,electric motor’s unit energy consumption (J/(kg m)),
QTjp,combustion engine’s unitary energy consumption (J/(kg m)),
RBF NNRadial Basis Function Neural Network,
SOCbattery’s state of charge,
SOHbattery’s state of health,
Tambient temperature (°C),
ttime progression,
tedrive end time (s),
tsdrive start time (s),
tTtotal drive time (min),
TTWTank-To-Wheels,
Vmean vehicle speed (m/s),
vvehicle speed (m/s),
WLTPWorldwide Harmonized Light-Duty Vehicles Test Procedure,
Wocalorific value (MJ/kg),
Xinput variables from the DEVS model,
ΔEDdrive unit losses—engine-to-wheels (J),
ΔEEengine energy losses (J),
ΔELlosses in energy supplied to the drive unit without transmission to the driving wheels (J),
ΔERenergy recovery during car deceleration (J),
ωdrive unit rotation speed (RPM).

References

  1. Varga, B.O.; Mariasiu, F. Indirect Environment-Related Effects of Electric Car Vehicles Use. Environ. Eng. Manag. J. 2018, 17, 1591–1597. [Google Scholar] [CrossRef]
  2. Szumska, E.M.; Jurecki, R.S. Parameters Influencing on Electric Vehicle Range. Energies 2021, 14, 821. [Google Scholar] [CrossRef]
  3. Varga, B.O.; Sagoian, A.; Mariasiu, F. Prediction of Electric Vehicle Range: A Comprehensive Review of Current Issues and Challenges. Energies 2019, 12, 946. [Google Scholar] [CrossRef] [Green Version]
  4. Mamala, J.; Jantos, J.; Brol, S.; Malewicz, K.; Bieniek, A. The System of Supercharging for the Spark Ignition Engine. Combust. Engines 2007, 14, 291–298. [Google Scholar]
  5. Graba, M.; Mamala, J.; Bieniek, A.; Sroka, Z. Impact of the Acceleration Intensity of a Passenger Car in a Road Test on Energy Consumption. Energy 2021, 226, 120429. [Google Scholar] [CrossRef]
  6. Bokare, P.S.; Maurya, A.K. Acceleration-Deceleration Behaviour of Various Vehicle Types. Transp. Res. Procedia 2017, 25, 4733–4749. [Google Scholar] [CrossRef]
  7. Eisele, W.L.; Turner, S.M.; Benz, R.J. Using Acceleration Characteristics in Air Quality and Energy Consumption Analyses; Texas Transportation Institute, The Texas A & M University System College Station, Southwest Region University Transportation Center Texas Transportation: Bryan, TX, USA, 1996; Volume 7. [Google Scholar]
  8. Carlson, R.B.; Lohse-Busch, H.; Duoba, M.; Shidore, N. Drive Cycle Fuel Consumption Variability of Plug-in Hybrid Electric Vehicles Due to Aggressive Driving; SAE Technical Papers; SAE International: Warrendale, PA, USA, 2009; pp. 1–8. [Google Scholar]
  9. Rask, E.; Santini, D.; Lohse-Busch, H. Analysis of Input Power, Energy Availability, and Efficiency during Deceleration for X-EV Vehicles. SAE Int. J. Altern. Powertrains 2013, 2, 350–361. [Google Scholar] [CrossRef]
  10. Hayes, J.G.; De Oliveira, R.P.R.; Vaughan, S.; Egan, M.G. Simplified Electric Vehicle Power Train Models and Range Estimation. In Proceedings of the 2011 IEEE Vehicle Power and Propulsion Conference, VPPC 2011, Chicago, IL, USA, 6–9 September 2011. [Google Scholar] [CrossRef]
  11. Belz, N.P.; Aultman-Hall, L. Analyzing the Effect of Driver Age on Operating Speed and Acceleration Noise. Transp. Res. Rec. 2011, 2265, 184–191. [Google Scholar] [CrossRef]
  12. Hu, K.; Wu, J.; Schwanen, T. Differences in Energy Consumption in Electric Vehicles: An Exploratory Real-World Study in Beijing. J. Adv. Transp. 2017, 2017, 4695975. [Google Scholar] [CrossRef] [Green Version]
  13. Sentoff, K.M.; Aultman-Hall, L.; Holmén, B.A. Implications of Driving Style and Road Grade for Accurate Vehicle Activity Data and Emissions Estimates. Transp. Res. Part D Transp. Environ. 2015, 35, 175–188. [Google Scholar] [CrossRef]
  14. Zhu, B.; Tao, X.; Zhao, J.; Ke, M.; Wang, H.; Deng, W. An Integrated GNSS/UWB/DR/VMM Positioning Strategy for Intelligent Vehicles. IEEE Trans. Veh. Technol. 2020, 69, 10842–10853. [Google Scholar] [CrossRef]
  15. Tao, X.; Zhu, B.; Xuan, S.; Zhao, J.; Jiang, H.; Du, J.; Deng, W. A Multi-Sensor Fusion Positioning Strategy for Intelligent Vehicles Using Global Pose Graph Optimization. IEEE Trans. Veh. Technol. 2022, 71, 2614–2627. [Google Scholar] [CrossRef]
  16. Zhu, B.; Tao, X.; Zhao, J.; Ke, M.; Wang, Z.; Li, X. Two-Stage UWB Positioning Algorithm of Intelligent Vehicle. J. Traffic Transp. Eng. 2021, 21, 256–266. [Google Scholar] [CrossRef]
  17. Li, X.; Tao, X.; Zhu, B.; Deng, W. Research on a Simulation Method of the Millimeter Wave Radar Virtual Test Environment for Intelligent Driving. Sensors 2020, 20, 1929. [Google Scholar] [CrossRef] [Green Version]
  18. Badin, F.; Le Berr, F.; Briki, H.; Dabadie, J.C.; Petit, M.; Magand, S.; Condemine, E. Evaluation of EVs Energy Consumption Influencing Factors: Driving Conditions, Auxiliaries Use, Driver’s Aggressiveness. World Electr. Veh. J. 2013, 6, 112–123. [Google Scholar] [CrossRef] [Green Version]
  19. Evtimov, I.; Ivanov, R.; Sapundjiev, M. Energy Consumption of Auxiliary Systems of Electric Cars. MATEC Web Conf. 2017, 133, 2–6. [Google Scholar] [CrossRef] [Green Version]
  20. Bi, J.; Wang, Y.; Shao, S.; Cheng, Y. Residual Range Estimation for Battery Electric Vehicle Based on Radial Basis Function Neural Network. Meas. J. Int. Meas. Confed. 2018, 128, 197–203. [Google Scholar] [CrossRef]
  21. Mamala, J.; Graba, M.; Bieniek, A.; Prażnowski, K.; Augustynowicz, A.; Śmieja, M. Study of Energy Consumption of a Hybrid Vehicle in Real-World Conditions. Eksploat. i Niezawodn. 2021, 23, 636–645. [Google Scholar] [CrossRef]
  22. Wang, K. Study on Low Temperature Performance of Li Ion Battery. OALib 2017, 4, 1–12. [Google Scholar] [CrossRef]
  23. Lv, S.; Wang, X.; Lu, W.; Zhang, J.; Ni, H. The Influence of Temperature on the Capacity of Lithium Ion Batteries with Different Anodes. Energies 2022, 15, 60. [Google Scholar] [CrossRef]
  24. Vaz, W.; Nandi, A.K.R.; Landers, R.G.; Koylu, U.O. Electric Vehicle Range Prediction for Constant Speed Trip Using Multi-Objective Optimization. J. Power Sources 2015, 275, 435–446. [Google Scholar] [CrossRef]
  25. Wang, J.; Besselink, I.; Nijmeijer, H. Electric Vehicle Energy Consumption Modelling and Prediction Based on Road Information. World Electr. Veh. J. 2015, 7, 447–458. [Google Scholar] [CrossRef] [Green Version]
  26. Wang, H.; Zhang, X.; Ouyang, M. Energy Consumption of Electric Vehicles Based on Real-World Driving Patterns: A Case Study of Beijing. Appl. Energy 2015, 157, 710–719. [Google Scholar] [CrossRef]
  27. Cui, D.; Wang, Z.; Liu, P.; Wang, S.; Zhang, Z.; Dorrell, D.G.; Li, X. Battery Electric Vehicle Usage Pattern Analysis Driven by Massive Real-World Data. Energy 2022, 250, 123837. [Google Scholar] [CrossRef]
  28. Smart, J.; Powell, W.; Schey, S. Extended Range Electric Vehicle Driving and Charging Behavior Observed Early in the EV Project; SAE Technical Paper 2013-01–14; SAE International: Warrendale, PA, USA, 2013. [Google Scholar] [CrossRef] [Green Version]
  29. Eurostat Average Distance per Person per Day (Kilometres). Available online: https://ec.europa.eu/eurostat/statistics-explained/images/b/b8/Excel_Passenger_mobility_statistics.xlsx (accessed on 17 July 2023).
  30. Zeigler, B.P. Multifacetted Modelling and Discrete Event Simulation; Michigan University: Ann Arbor, MI, USA, 1984; p. 372. ISBN 978-02127784502. [Google Scholar]
  31. Yuan, X.; Zhang, C.; Hong, G.; Huang, X.; Li, L. Method for Evaluating the Real-World Driving Energy Consumptions of Electric Vehicles. Energy 2017, 141, 1955–1968. [Google Scholar] [CrossRef]
  32. Spalding, S. RACQ Congested Roads Report: The Effects on Fuel Consumption and Vehicle Emissions Prepared by RACQ Vehicle Technologies Department. RACQ 2008, 1–9. Available online: https://media.racq.com.au (accessed on 17 July 2023).
  33. Niechaj, T. Elektryczne Audi Q4 Sportback 50 E-Tron Quattro: 300 KM i Zasięg Ok. 450 Km w Mieście. (The Electric Audi Q4 Sportback 50 e-Tron Quattro: 300 Hp and a Range of Approx. 450 Km in the City). Available online: https://antyweb.pl/elektryczne-audi-q4-sportback-50-e-tron-quattro-300-km-i-zasieg-ok-450-km-w-miescie-test (accessed on 20 July 2023).
  34. Sharer, P.; Leydier, R.; Rousseau, A. Impact of Drive Cycle Aggressiveness and Speed on HEVs Fuel Consumption Sensitivity; SAE Technical Paper; SAE International: Warrendale, PA, USA, 2007. [Google Scholar] [CrossRef] [Green Version]
  35. Niechaj, T. Electric BMW IX3—Real Range and Energy Consumption Test, Also on the Motorway. Available online: https://antyweb.pl/elektryczne-bmw-ix3-rzeczywisty-zasieg-i-test-zuzycia-energii-takze-na-autostradzie (accessed on 17 July 2023).
  36. Kropiwnicki, J. A Unified Approach to the Analysis of Electric Energy and Fuel Consumption of Cars in City Traffic. Energy 2019, 182, 1045–1057. [Google Scholar] [CrossRef]
  37. Franke, T.; Krems, J.F. Interacting with Limited Mobility Resources: Psychological Range Levels in Electric Vehicle Use. Transp. Res. Part A Policy Pract. 2013, 48, 109–122. [Google Scholar] [CrossRef]
  38. Graba, M.; Bieniek, A.; Prażnowski, K.; Hennek, K.; Mamala, J.; Burdzik, R.; Śmieja, M. Analysis of Energy Efficiency and Dynamics during Car Acceleration. Eksploat. i Niezawodn. Maint. Reliab. 2023, 25, 196–208. [Google Scholar] [CrossRef]
Figure 1. Sankey diagram showing energy flow for a hybrid powertrain.
Energies 16 05571 g001
Figure 2. Increase in energy consumption for a vehicle moving at variable speeds [32].
Energies 16 05571 g002
Figure 3. Interdependencies occurring in the vehicle’s DEVS model.
Energies 16 05571 g003
Figure 4. Energy consumption for all-electric vehicles: (a) mileage energy consumption, (b) unitary energy consumption [35].
Energies 16 05571 g004
Figure 5. Average distance traveled by the PHEV in everyday operating conditions throughout the year.
Energies 16 05571 g005
Figure 6. Average carbon dioxide emissions for the PHEV’s year-round operation.
Energies 16 05571 g006
Figure 7. Hybrid powertrain indices for the PHEVs’ year-round operation: (a) distance traveled, (b) energy consumption.
Energies 16 05571 g007
Figure 8. Share of the drive units’ use for the hybrid powertrain at distances exceeding 100 km and the following initial states of charge: (a) discharged storage SOC = 0%, (b) fully charged storage SOC = 100%.
Energies 16 05571 g008
Figure 9. The drive units’ percentage shares for each trip in the given period (yellow—internal combustion engine, green—electric motor).
Energies 16 05571 g009
Figure 10. Unitary energy consumption index for the vehicle’s electric motor relative to outdoor temperature for each day of the year.
Energies 16 05571 g010
Figure 11. The PHEV’s energy consumption for different drive speeds while only using the electric motor.
Energies 16 05571 g011
Figure 12. Impact of vehicle speed on the reduction or increase in the vehicle’s unitary energy consumption relative to the limit set by the WLTP cycle.
Energies 16 05571 g012
Figure 13. Reduction in vehicle range relative to the WLTP estimated range.
Energies 16 05571 g013
Figure 14. Change in the test PHEV’s unitary energy consumption index for a set speed and only using the electric motor: (a) unitary energy consumption index, (b) percentage change in the electric motor.
Energies 16 05571 g014
Table 1. Audi Q4 Sportback 50 e-tron’s energy consumption during the road test [33].
TestEnergy Consumption (kW/h)Difference Relative to the WLTP Test (%)
WLTP175-
Urban traffic (average speed of 22 km/h)156−10.9
Constant speed of 90 km/h1845.1
Constant speed of 120 km/h24741.1
Constant speed of 140 km/h30876.0
Table 2. Energy consumption for the Mercedes-Benz A250e during the road test.
TestEnergy Consumption (kW/h)Difference Relative to the WLTP Test (%)
WLTP209-
Urban traffic (average speed of 22 km/h)179−13.78
Constant speed of 90 km/h217.54.6
Constant speed of 120 km/h261.725.8
Constant speed of 140 km/h350.368.2
Table 3. The test vehicle’s basic parameters.
ManufacturerMercedes Benz
ModelA250e/V177
Internal combustion engine displacement1332 cm3
Internal combustion engine power118 kW at 5500 rpm
Internal combustion engine maximum torque210 Nm at 1750 rpm
Electric motor power75 kW
Long-lasting electric motor power55 kW
Electric motor maximum torque450 Nm
Drive units’ installation locationAt the front, transversely
Internal combustion engine superchargingTurbocharger
Powertrain typePHEV
TransmissionAutomatic—eight gears
Vehicle mass1817 kg
Emissions standardEuro 6 (AP)
Gasoline range450 km
Battery range75 km
Average CO2 emissions according to WLTP23 g/km (1.0 dm3/100 km)
EV system’s energy consumption209 Wh/km
Battery capacity (electricity storage)15.6 kWh
Table 4. The powertrain average operating parameters during trips taken in everyday driving conditions.
Period/SeasonLT, (km)Le, (km)tT (min)V, (km/h)Qf (dm3/100 km)Qe (kWh/100 km)QTjp, (J/(kg m))QTje, (J/(kg m))QTj, (J/(kg m))Temp., (°C)
Winter (I)48.746.954.255.02.7814.71.770.410.813.9
Spring (II)48.247.348.257.81.2216.61.570.380.5511.5
Summer (III)49.749.047.459.50.7412.11.250.270.3824.0
Autumn (IV) 50.546.272.247.91.7713.31.530.350.617.5
Year49.746.449.148.31.5612.81.510.350.7511.42
Disclaimer/Publisher’s Note: The statements, opinions and data contained in all publications are solely those of the individual author(s) and contributor(s) and not of MDPI and/or the editor(s). MDPI and/or the editor(s) disclaim responsibility for any injury to people or property resulting from any ideas, methods, instructions or products referred to in the content.

