Article

Studies on Water–Aluminum Scrap Reaction Kinetics in Two Steps and the Efficiency of Green Hydrogen Production

1
Institute of Solid State Physics, University of Latvia, LV-1063 Riga, Latvia
2
Faculty of Industrial Engineering, Mechanical Engineering and Computer Science, University of Iceland, 102 Reykjavik, Iceland
3
Center for Hydrogen Energy Technologies, Lithuanian Energy Institute, 3 Breslaujos, 44403 Kaunas, Lithuania
*
Author to whom correspondence should be addressed.
Energies 2023, 16(14), 5554; https://doi.org/10.3390/en16145554
Submission received: 15 April 2023 / Revised: 29 May 2023 / Accepted: 13 July 2023 / Published: 22 July 2023
(This article belongs to the Special Issue Advances in Materials for Electrochemical Energy Applications 2023)

Abstract

:
This work aims to explain aluminum hydrolysis reaction kinetics based on a properly chosen theoretical model with machined aluminum waste chips as well as alkali solutions up to 1M as a promoter and to estimate the overall reaction profit. The purpose of this work is to assess the optimal alkali concentration in the production of small- and medium-scale green hydrogen. To obtain results with better accuracy, we worked with flat Al waste chips, because a flat surface is preferable to maximally increase the time for the created hydrogen bubbles to reach the critical gas pressure. Describing the reaction kinetics, a flat shape allows for the use of a planar one-dimensional shrinking core model instead of a much more complicated polydisperse spheric shrinking core model. We analyzed the surface chemical reaction and mass transfer rate steps to obtain the first-order rate constant for the surface reaction and the diffusion coefficient of the aqueous reactant in the byproduct layer, respectively. We noted that measurements of the diffusion coefficient in the byproduct layer performed and discussed in this paper are rare to find in publications at alkali concentrations below 1M. With our reactor, we achieved a H2 yield of 1145 mL per 1 g of Al with 1M NaOH, which is 92% of the theoretical maximum. In the estimation of profit, the authors’ novelty is in paying great attention to the loss in alkali and finding a crucial dependence on its price. Nevertheless, in terms of consumed and originated materials for sale, the conversion of aluminum waste material into green hydrogen with properly chosen reaction parameters has positive profit even when consuming an alkali of a chemical grade.

1. Introduction

With the world’s primary aluminum production of 65 million metric tons in 2020, the worldwide issue of residual aluminum waste from industry, contrary to conventional assumptions, is not resolved. Due to the content of domestic waste and the amount of aluminous residual byproducts produced by the primary and secondary Al industries, aluminum can be found in landfills in substantial quantities. In general, the byproduct of the aluminum recycling industry and the Bayer process is known as “aluminum dross”. In most regions Al dross is not classified as a hazardous waste material, and it can be stored in landfills without any pretreatment. Nevertheless, Al-rich waste in landfills is a serious hazard. Aluminum, stored in landfills, may come into contact with a kind of water source after some time, including landfill leachate with a pH < 7. Such liquids, especially those with a pH < 7, can react with landfill aluminum. As a result, pockets of concentrated hydrogen appear, and their growing gaseous pressure in landfills poses a risk of combustion. Subsurface landfill fires can be rather dangerous and destructive to landfill systems because they are hard to detect, and visible smoke may not arise. The monitoring and control of potentially hazardous wastes demand a lot of money that can be assigned to research on and the development of effective methods with which to deal with aluminous waste [1,2].
The findings and reported results of various studies on dealing with aluminum waste are always dependent on the region in which R&D work is carried out. Some of the pioneering authors on this subject, such as Martinez et al. from Mexico, in 2005, reported a hydrogen gas yield of 0.049 moles from each gram of aluminum waste cans with a 2M NaOH promoter [3], with this being a decent 88% of the maximum yield of pure aluminum. Hiraki and Akiyama from Japan, in 2009, developed a system by which gaining energy from aluminum waste containing down to 15% Al is still cost-effective [4]. Instead of using chemical promoters, such as hydroxides, oxides, or salts, the authors of [5] dealt with ball milling as a pretreatment and carried out the reaction in hot water. In [6], the difference between Al dross obtained from an aluminum recycling facility (RD) and Al dross directed to landfills (LD) was studied. The authors reported that, with NaOH as the promoter, the RD and LD samples generated 0.50 and 0.15 L of H2 per 1g of Al, respectively. The maximum flow rates were measured as 2 L/min and 0.8 L/min, respectively. The authors claimed that, on a large scale, this process can be cost-effective; moreover, the formation of bayerite and gibbsite has additional market value.
In terms of the hydrogen production concept, obtaining H2 from the reaction of certain metals with water has been a subject of investigation for many years. Among the number of metals that, under certain circumstances, can react with aqueous solutions to produce hydrogen, aluminum and its alloys are put forward as the most suitable materials for the development of hydrogen production in the future [7]. Aluminum can be transported and stored in a much simpler, safer, and cheaper way in comparison to the end product hydrogen. Compared with the chemical rival sodium borohydride, aluminum is much less expensive and more stable under normal conditions. The price of aluminum powder is more than 10 times lower than that of sodium borohydride [7,8]. Some authors, e.g., Wang et al., have proven that H2 produced by an aluminum chemical reaction has a purity valid for a PEM fuel cell. A mini-type hydrogen generator from 25 wt.% Al alloy strips provides a H2 generation rate of about 38 mL/min at a 0.01 mL/s dropping rate of a sodium hydroxide solution [9]. Even though empirical evidence on hydrogen production is substantial with controlled Al alloys and some types of processed Al waste, the reaction model may vary and is not completely clear. This work aims to explain the reaction mechanism based on a properly chosen theoretical model and experimental findings with flat Al chips and alkali solutions up to 1M, and to estimate the overall reaction profit. The purpose and main goal of this work is to find out from obtained data the optimal alkali concentration in the production of small- and medium-scale green hydrogen by taking into account the loss in alkali.

2. Materials and Methods

2.1. Aluminum Surface and Its Reaction with Water

Aluminum is known as a highly reactive chemical element that reacts with ambient oxygen to create a protective coating. A piece of aluminum, placed into a solution, already has a coating of aluminum oxide or alumina: Al2O3. Aluminum oxide reacts with water at a moderate temperature to produce a boehmite AlOOH layer. This is the so-called induction step [10]:
Al2O3 + H2O → 2AlOOH,
At the induction step the boehmite layer grows, and the diffusion of OH ions through the AlOOH layer is assumed. As a result, gaseous hydrogen bubbles appear at the Al:Al2O3 interface:
6AlOOH + 2Al → 4Al2O3 + 3H2↑,
The thickness of the surface passive oxide layer, Al2O3, on each aluminum particle is several nanometers, weakly dependent on the size of a spherical Al particle [11]. In contrast, the time required for the hydration of the oxide film has no significant difference for various Al powders. The difference in the induction time mainly comes from the accumulation of H2 molecules in gaseous bubbles to reach the critical gas pressure.
From a physical point of view, each gaseous H2 bubble has a critical pressure that the hydrated oxide film can withstand, as shown in Figure 1a. When, by proceeding with the chemical reaction, the gas pressure in a H2 bubble exceeds its critical threshold, the surface film on the Al particle locally breaks, and the reaction of aluminum with water refreshes. From the vector diagram in Figure 1b, the critical gas pressure in a H2 bubble, P H 2 * , can be written as follows [12,13]:
P H 2 * = P a t m + 2 h σ h c o s θ a
where Patm is the environmental gas pressure, h is the thickness of the hydrated oxide film, a is the radius of a H2 bubble, and σh is the tensile strength of the film. Theta, θ, is the critical angle between the stress vector, σ h , and the normal axis to the film. Evidently, the time taken for the accumulation of H2 quantity in the bubbles depends on their critical gas pressure. The critical gas pressure in the bubbles at the Al:Al2O3 interface must be lower for smaller Al particles as a smaller radius of a particle tends to reduce the total tolerable extension of a bubble on the surface. In other words, when the hydrogen gas pressure increases, a H2 bubble expands, and for small-sized Al particles the critical angle, θ, in Figure 1b has no further deviation from 90°. Noting that, at normal conditions, the first term, Patm, is more than a hundred times smaller than the second in Equation (3), a small change in the critical angle, θ, leads to a large change in the critical gas pressure, P H 2 * .
Regarding the opposite consideration that a larger Al particle has a higher critical gas pressure and, therefore, larger-sized H2 bubbles, a flat surface is preferable to increase the time for bubbles to reach the critical gas pressure. As increasing the induction time to perform the duration analysis is advantageous for the present work, instead of spheric waste particles we prefer to examine chips, i.e., flat pieces of machined aluminum waste. Describing the reaction kinetics allows us to use a planar one-dimensional shrinking core model instead of a much more complicated polydisperse spheric shrinking core model.

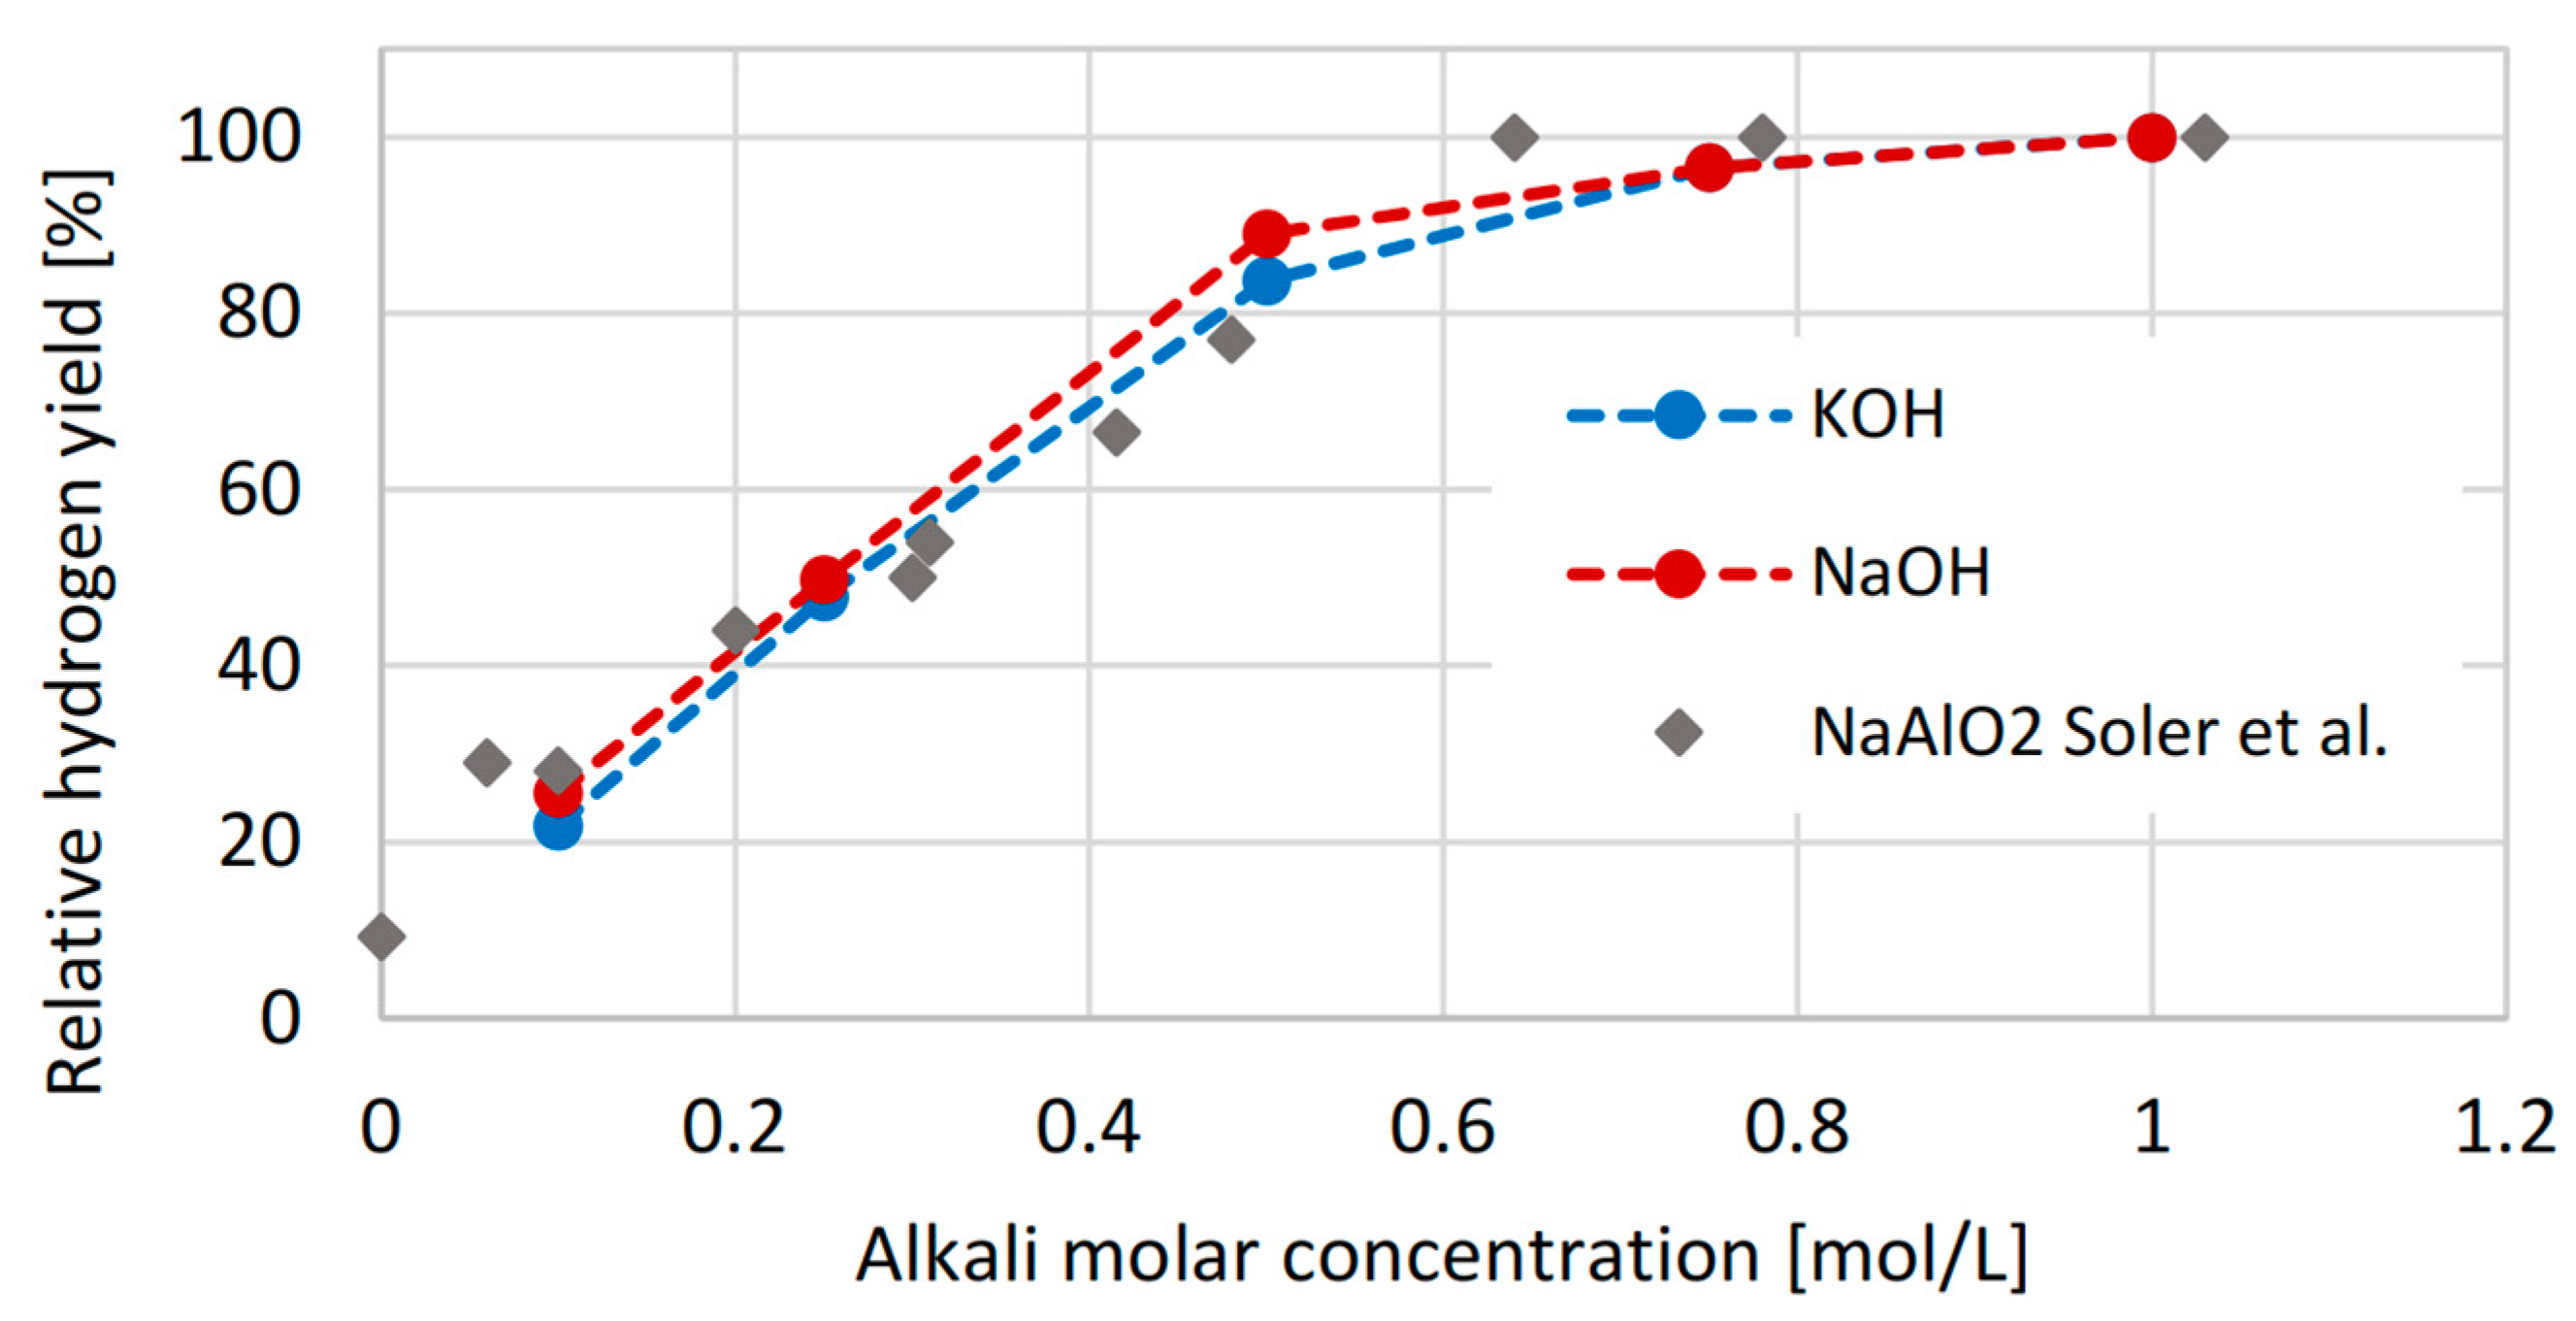
2.2. The Role of the Alkali Promoter

All practicable Al reactions with water are intended to use a method to eliminate the protective layer of aluminum oxide, which hinders the proceeding of the reaction with water. Between different eliminators, a chemical promoter, such as sodium or potassium hydroxide, works in a well-studied way. In the presence of sodium hydroxide as a promoter, aluminum oxide is dissolved [14]:
Al2O3 + 2NaOH + 3H2O → 2Na+ + 2[Al(OH)4],
As a result, the exposed Al surface is able to react with water to form hydrogen:
2Al + 6H2O → 2Al(OH)3 + 3H2
The created surface layer of aluminum hydroxide is dissolved by sodium hydroxide:
Al(OH)3 + NaOH → Na+ + [Al(OH)4]
Excluding dissociated ions, Equations (5) and (6) can be composed as follows:
2Al (s) + 6H2O + 2NaOH (aq) → 2NaAl(OH)4 (aq) + 3H2
To sum up, even at room temperature aluminum and its alloys are dissolved in an alkaline environment, which results in H2 production. The regeneration of sodium hydroxide occurs via the decomposition of aqueous NaAl(OH)4 and results in an aluminum hydroxide residue:
NaAl(OH)4 (aq) → NaOH (aq) + Al(OH)3 (s)
There are several parameters that affect this reaction chain: the purity of aluminum material and its morphology, alkali concentration, temperature, and fresh alkaline feed rate.

2.3. Determining the Activation Energy

The activation energy of the reactant is the base parameter with which to estimate the occurrence of a chemical reaction, i.e., the amount of energy needed for molecules or atoms to break existing chemical bonds. The activation energy, Ea, is defined by the Arrhenius equation:
k = A e E a R T
where k is the reaction rate constant, R is the universal gas constant, T is the absolute temperature, and A is the frequency factor constant, the value of which is rarely used. The reaction rate constant, k, here is assumed to be that of a “pure” chemical reaction, i.e., without any hindrances to the maximum reaction rate. It is assumed that the first-order rate constant for a surface reaction, k*, at sufficient stirring can be used as k. Ea is usually derived from obtained reaction rate constants, k, at different temperatures. Applying the natural log to Equation (9) yields the following:
ln ( k ) = ln ( A ) E a R T
With properly found values of k at various temperatures, T, plotting ln(k) vs. 1/T displays a straight line, known as an Arrhenius approximation. Its slope is equal to −Ea/R, whereas the y-intercept is equal to ln(A).

2.4. Reaction Kinetics in Two Steps

According to the ideal gas model, the hydrogen yield, α (0 < α < 1), can be written as follows:
α ( t ) = p e f f V e f f n 0 R T
where peff is the effective pressure (with subtracted initial gas pressure), Veff is the effective volume (with subtracted volumes, occupied by liquid and powder), and n0 is the theoretically calculated number of H2 moles by reacting all of the aluminum metal.
The aluminum–water reaction is a solid–liquid heterogeneous system. Its reaction dynamics are usually described through a shrinking core model. A well-known book [15] gives the formulae of shrinking cores for three geometries of reacting solid bodies: flat plates, cylinders, and spheres. With the examined sample we choose the flat plates model, the geometry of which is determined only by the half-thickness of the plate, r. In describing the reaction between a large number of small solid bodies and an aqueous solution, two main reaction steps are considered.

2.4.1. Surface Reaction Rate Step

In the first step the reaction rate is controlled by the surface chemical reaction, and the equation that describes the shrinking of a flat solid plate at isothermal conditions is as follows:
t τ = α ( t )
where t is the real time, and the characteristic time constant, τ, can be found from the following equation:
τ = r ρ A l b k * c a l k M A l
where ρAl and MAl are the density and molar mass of the solid (aluminum), respectively, calk is the molar concentration of the alkali aqueous promoter, and b is the stoichiometry coefficient in the reaction between solid and liquid, nAl = b·nalk, being equal to 2/3 in the examined reactions, such as Equation (7). The first-order rate constant for surface reactions, k* (mm/s), is the coefficient that is determined by processing experimental data. In [16] it is suggested to take k* as a composition of the surface reaction rate constant, ks, and the mass transfer constant in laminar boundary layers, kc:
1 k * = 1 k s + 1 k c
At sufficient stirring of aqueous alkali solutions, kcks and k*ks. In experiments, one can choose the intensity of stirring and therefore to exclude the mass transfer constant, kc.

2.4.2. Mass Transfer Rate Step

In the second step the reaction rate is mainly controlled by the mass transfer in the byproduct layer, and for a flat solid plate at isothermal conditions the corresponding equations are as follows:
t τ = α 2 t
τ = r 2 ρ A l 2 b D c a l k M A l ,
where D (mm2/s) is the diffusion coefficient of the aqueous reactant in the byproduct layer. Likewise, parameter k* in the surface reaction rate step, D, is the parameter to be determined by the experimental data processing in the mass transfer rate step.

3. Materials and Methods

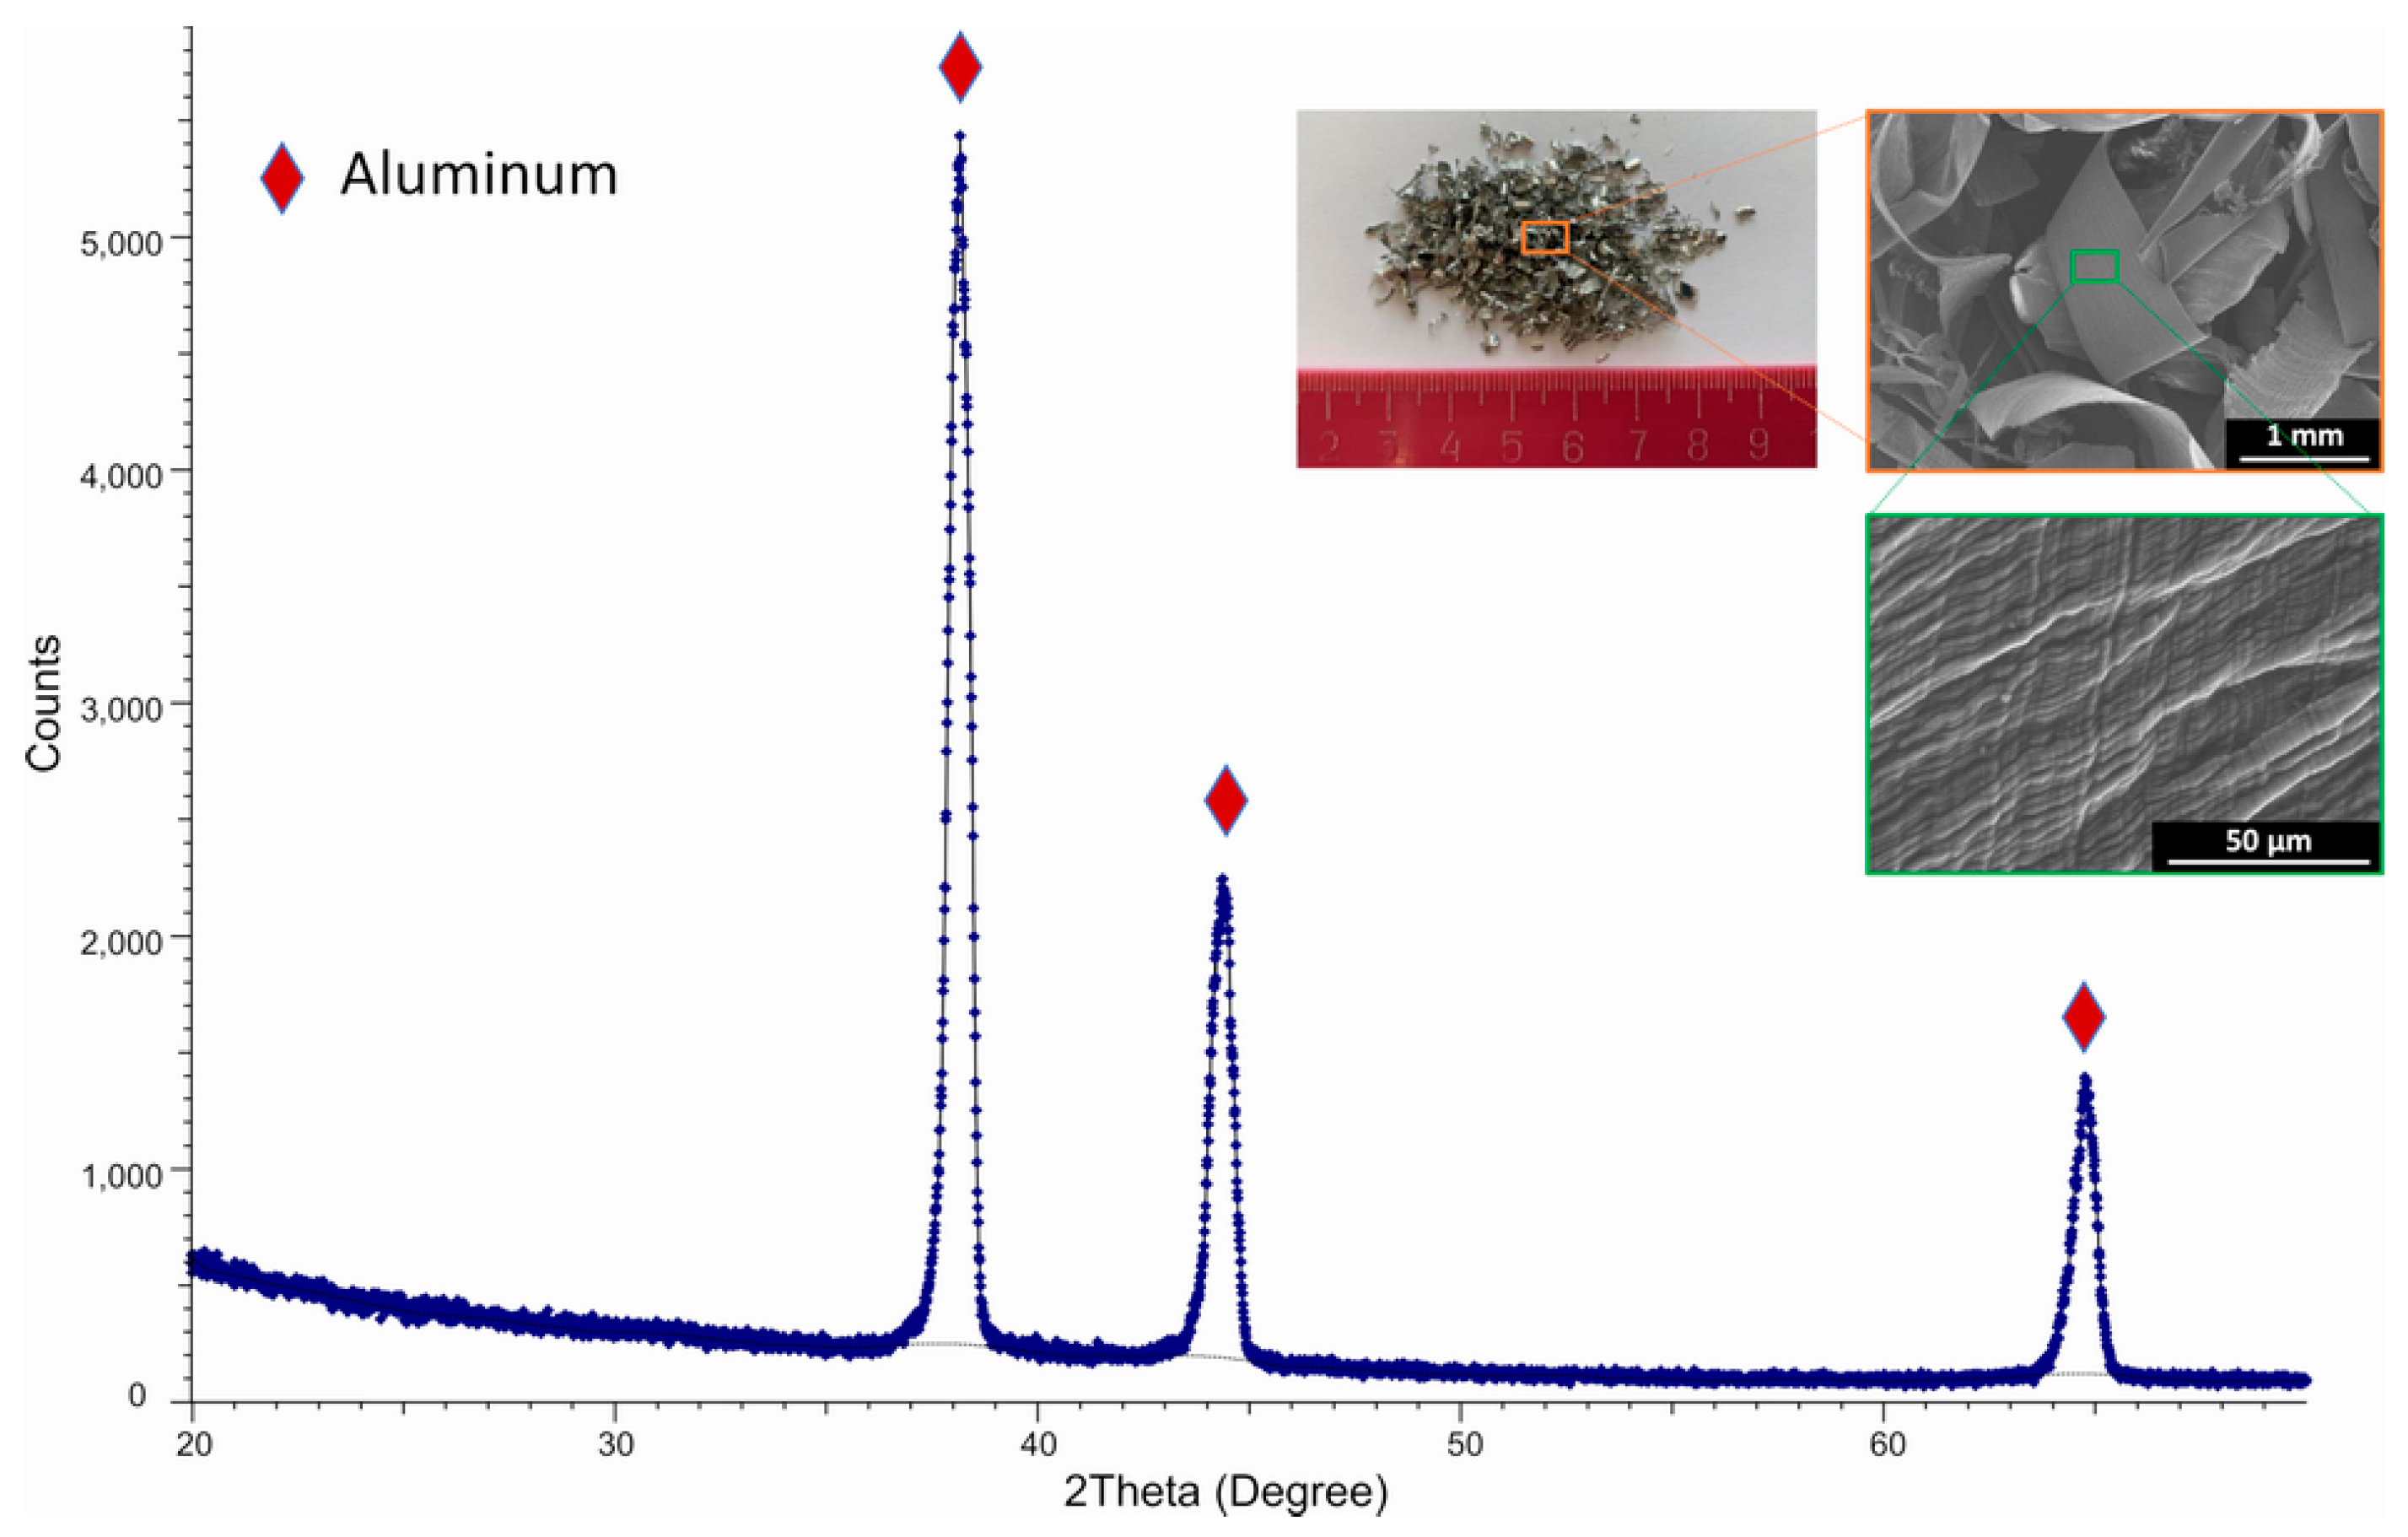
3.1. Experimental Sample

Flat Al chips are waste products from manufacturing aluminum constructions for insulating glass windows. We receive the chips, with an average thickness of 0.2 mm, from a Lithuanian company, “Stiklita, JSC”. An initial analysis of the chips was performed on the surface morphology via a scanning electron microscope (SEM, Hitachi S-3400N, Tokyo, Japan) and on the bulk elemental composition as well as elemental mapping via energy-dispersive X-ray spectroscopy (Bruker Quad 5040, Hamburg, Germany); the results are visible in Table 1. Additionally, the crystal structure of the initial Al material was examined via an X-ray diffractometer (XRD, Bruker D8, Hamburg, Germany), Cu Kα radiation, and a Lynx Eye linear position detector (Hamburg, Germany) at 2 theta angles in the range of 20° to 70°. The results can be seen in Figure 2: intense aluminum peaks with cubic crystallographic orientations of (111), (200), and (220) at 2Θ = 38.2°, 44.5°, and 64.9°. The results of these analyses are compiled here in Figure 2: Alkali pellets, NaOH and KOH, have purities of >99%. The activation energy of our flat 6063 aluminum alloy chips, obtained from a temperature-dependent series via Arrhenius approximation, is 48.1 kJ/mol. We can compare this value to that given in [17], obtained by applying 1–2M NaOH alkali. The extrapolation of very small dependence on the alkali molar concentration gives Ea = 40.9 kJ/mol with a 0.02 mm-thick foil and 57.2 kJ/mol with 0.5 mm thick plates. Thus, the value of Ea in this work is in the middle, which is fully consistent regarding the different material structures of the samples.

3.2. Experimental Setup

To investigate aluminum hydrolysis, we used a custom-made laboratory stand, shown in Figure 3. Before starting each experiment, we created a 10 Pa vacuum with a turbomolecular pump, No. 6 in Figure 3, in all volumes designed for the spreading of the produced hydrogen. A measured dose of initial waste Al chips from the container, 1, plunges into the reaction volume, 3. The magnetic stirrer is used to maintain a sufficiently low mass transfer constant in the solid–liquid laminar boundary layer. The water, required for the hydrolysis reaction, was deionized and purged by argon flow. The produced hydrogen is purified by passing through the water in 9 and spreads to the main volume, 12, where its samples can be taken for spectral analyses. The gas spectral analysis did not show deviation from expected pure hydrogen, with up to 99.98% hydrogen.
Since the whole volume occupied by the produced hydrogen is properly measured, we prefer to calculate the quantity of produced hydrogen via the ideal gas equation. For this aim, we measure the pressure, No. 10, and the temperature inside the volume, 12.
As we performed experiments with small quantities of Al chips (ca. 0.6 g) and low alkali concentrations (up to 1M), the reactor warmed up, due to the exothermic reaction, on average by seven to five degrees Celsius. Sacrificing accuracy at the highest reaction rates, for the sake of simplicity, we built an experimental stand without temperature stabilization of the reactor volume. All of the experiments were carried out at a constant laboratory temperature of 20 °C.

4. Results and Discussion

4.1. Experimental Parameters and Controls

4.1.1. Stirring Adjustment at the Surface Reaction Rate Step

Experiments performed with 0.6 g of Al chips in 50 mL of an alkali solution were assumed to run with excess alkaline. At the surface chemical reaction step, sufficient stirring provides a fresh surface contact between solid aluminum and alkali ions. In these cases, the maximum hydrogen production rate, mL/s, is proportional to the alkali molar concentration. In our 100 mL reactor, magnetic stirring worked really efficiently; 300 rpm is enough to achieve a good linearity, as shown in Figure 4. It is worth noting that the determined 300 rpm fits well with [18], describing the mixing of considerably larger aluminum particles by size, in which the difference becomes small between 300 and 400 rpm.

4.1.2. Temperature Control during Experiments

For more clarity, as an example, we present temperature fluctuations during the chemical reaction and hydrogen production rate in Figure 5. As the heat release is proportional to the hydrogen production reaction rate, and the peaks for both curves match well, the thermal inertia of the half-filled 100 mL reactor volume is sufficiently low.
The measured amplitude of thermal fluctuations, ca. 7 °C and 5 °C before and after the temperature peak, respectively, is rather high for the reaction constant determination. We had previously performed a temperature-dependent series from which the temperature shift of 5 °C with 0.5M alkali caused a difference in the estimated first step rate constant of 18%. Because the paper focuses on comparing results between different alkali concentrations, it is deemed acceptable. Note that the second step rate constant is estimated from the reaction region after the peak, where the amplitude of thermal fluctuations is evidently lower.

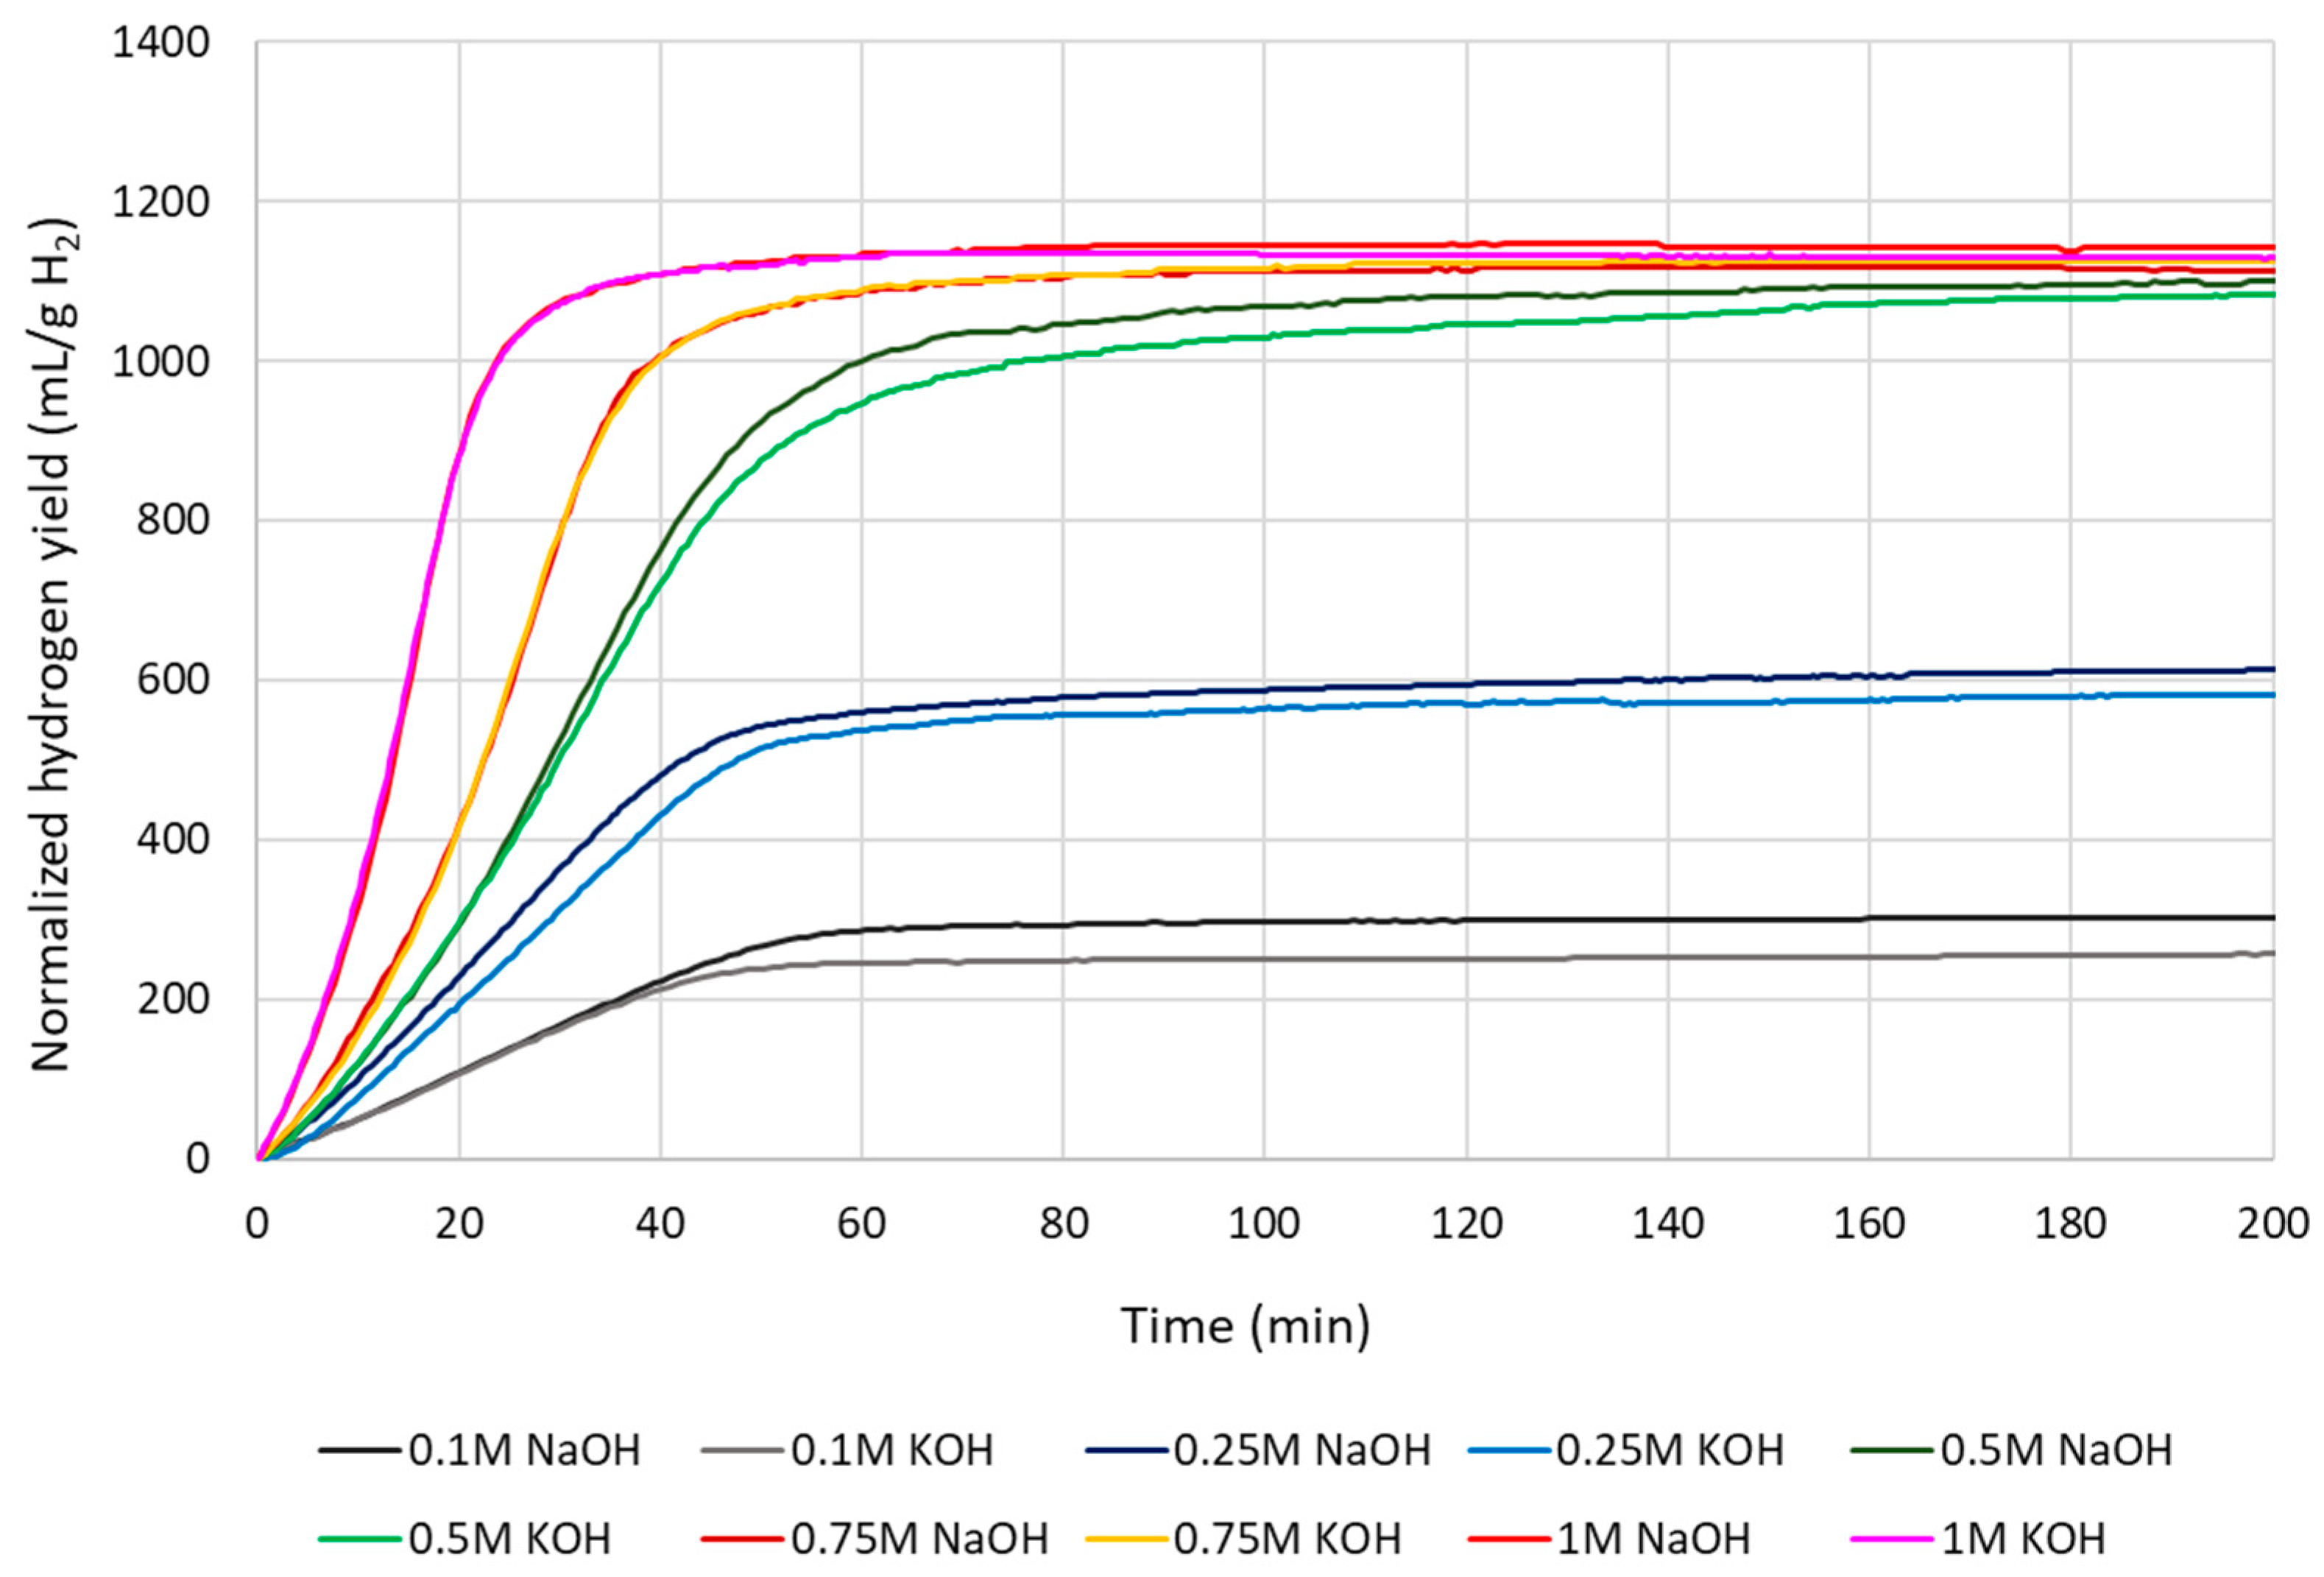
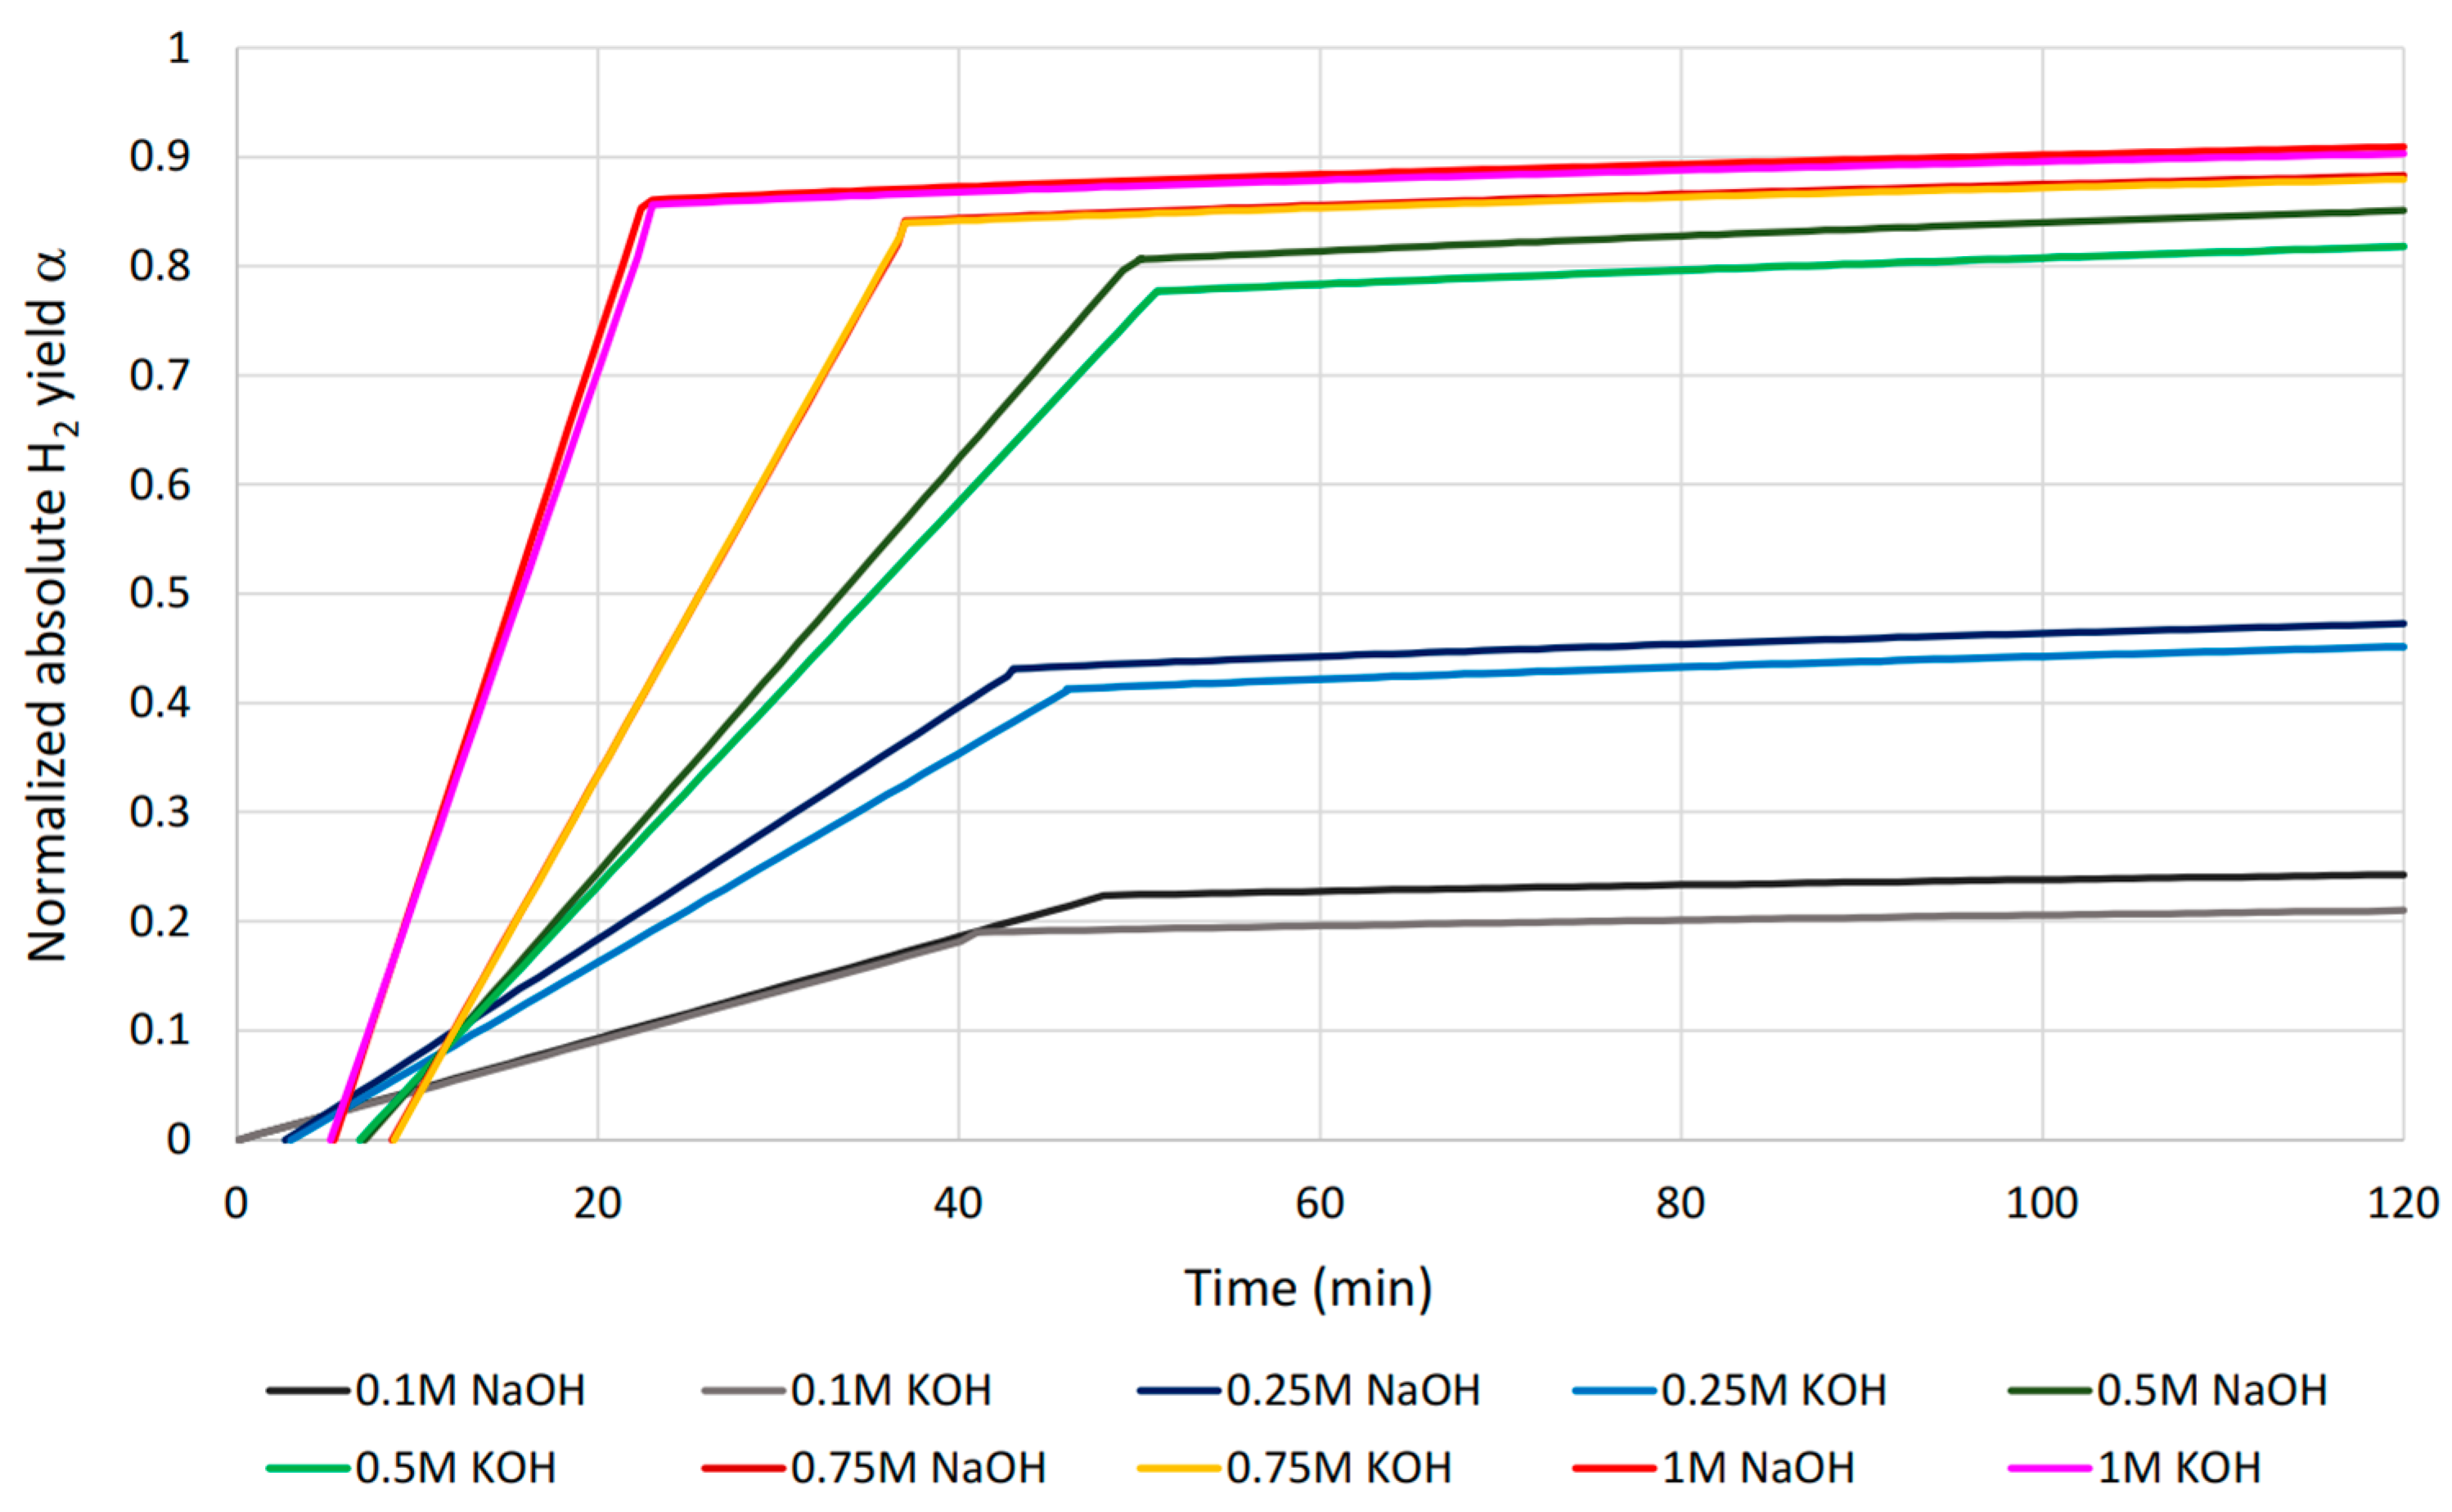
4.2. Normalized Cumulative Hydrogen Yield

In Figure 6 we plot the experimentally measured cumulative hydrogen yield, normalized to 1 g of Al, vs. real time. With smaller alkali concentrations of 0.1–0.5M, the yield with NaOH slightly exceeds that with KOH, whereas with 0.75–1M it is the same.
Similar to the experiments with aluminum flakes in [19], we normalized further our cumulative yield levels to the highest one (1145 mL/g with 1M NaOH) in order to make the comparison, shown in Figure 7. Despite the differences between pure alkalis—NaOH, KOH, and sodium aluminate, NaAlO2—and different temperatures, the trend is similar: after one hour of reaction, the relative hydrogen yield reaches the ca. 95% level at 0.75–0.8M of added aqueous promoter. We consider such alkali concentrations as creating the critical pressure in H2 bubbles to break the surface film on Al particles in one hour. Nevertheless, temperature dependency is expected in this effect. Our purpose is to investigate this question in our next paper.
Many authors perform experiments with alkali concentrations above 1M [17,19,20,21]. As is known in theory, the maximum H2 yield of pure aluminum is 1245 mL/g, whereas with our experimental setup we achieved 1145 mL/g with 1M NaOH at moderate stirring. It is 92% of the theoretical maximum, and the deficit of 8% can be mainly attributed to the chemical impurities of the used aluminum. Thus, we consider an alkali concentration up to 1M as appropriate for the profit analysis.

4.3. Hydrogen Production Rate

Figure 8 displays the experimentally measured H2 production rate. Since H2 cumulative yields with 1, 0.75M, and 0.5M alkali are very close (Figure 6), the areas below the production rate curves with corresponding alkali concentrations must be very close too. On the other hand, the corresponding three curves expose different slopes (Figure 6), i.e., with a lower alkali concentration the hydrogen production rate is distinctly lower. The mathematical solution to this problem, which was also actually observed in the experiments, is a symmetrical stretching of the production rate curves in the time scale with a lower alkali concentration. Indeed, the maximum hydrogen production rate with 1, 0.75M, and 0.5M alkali is reached at the 16, 27, and 35th minutes, respectively. This notwithstanding, the production rate curves with an alkali concentration less than 0.5M (0.1M and 0.25M) have smaller areas below and less distinct maximums.

4.4. Linear Trendline Approximations and Their Compositions

Linear trendline approximations have been carried out with the computer software OriginPro 2016 93E. In order to evaluate the second-order rate constant, i.e., the diffusion coefficient in the byproduct layer, D, in accordance with Equations (15) and (16), we define new particular coordinates.

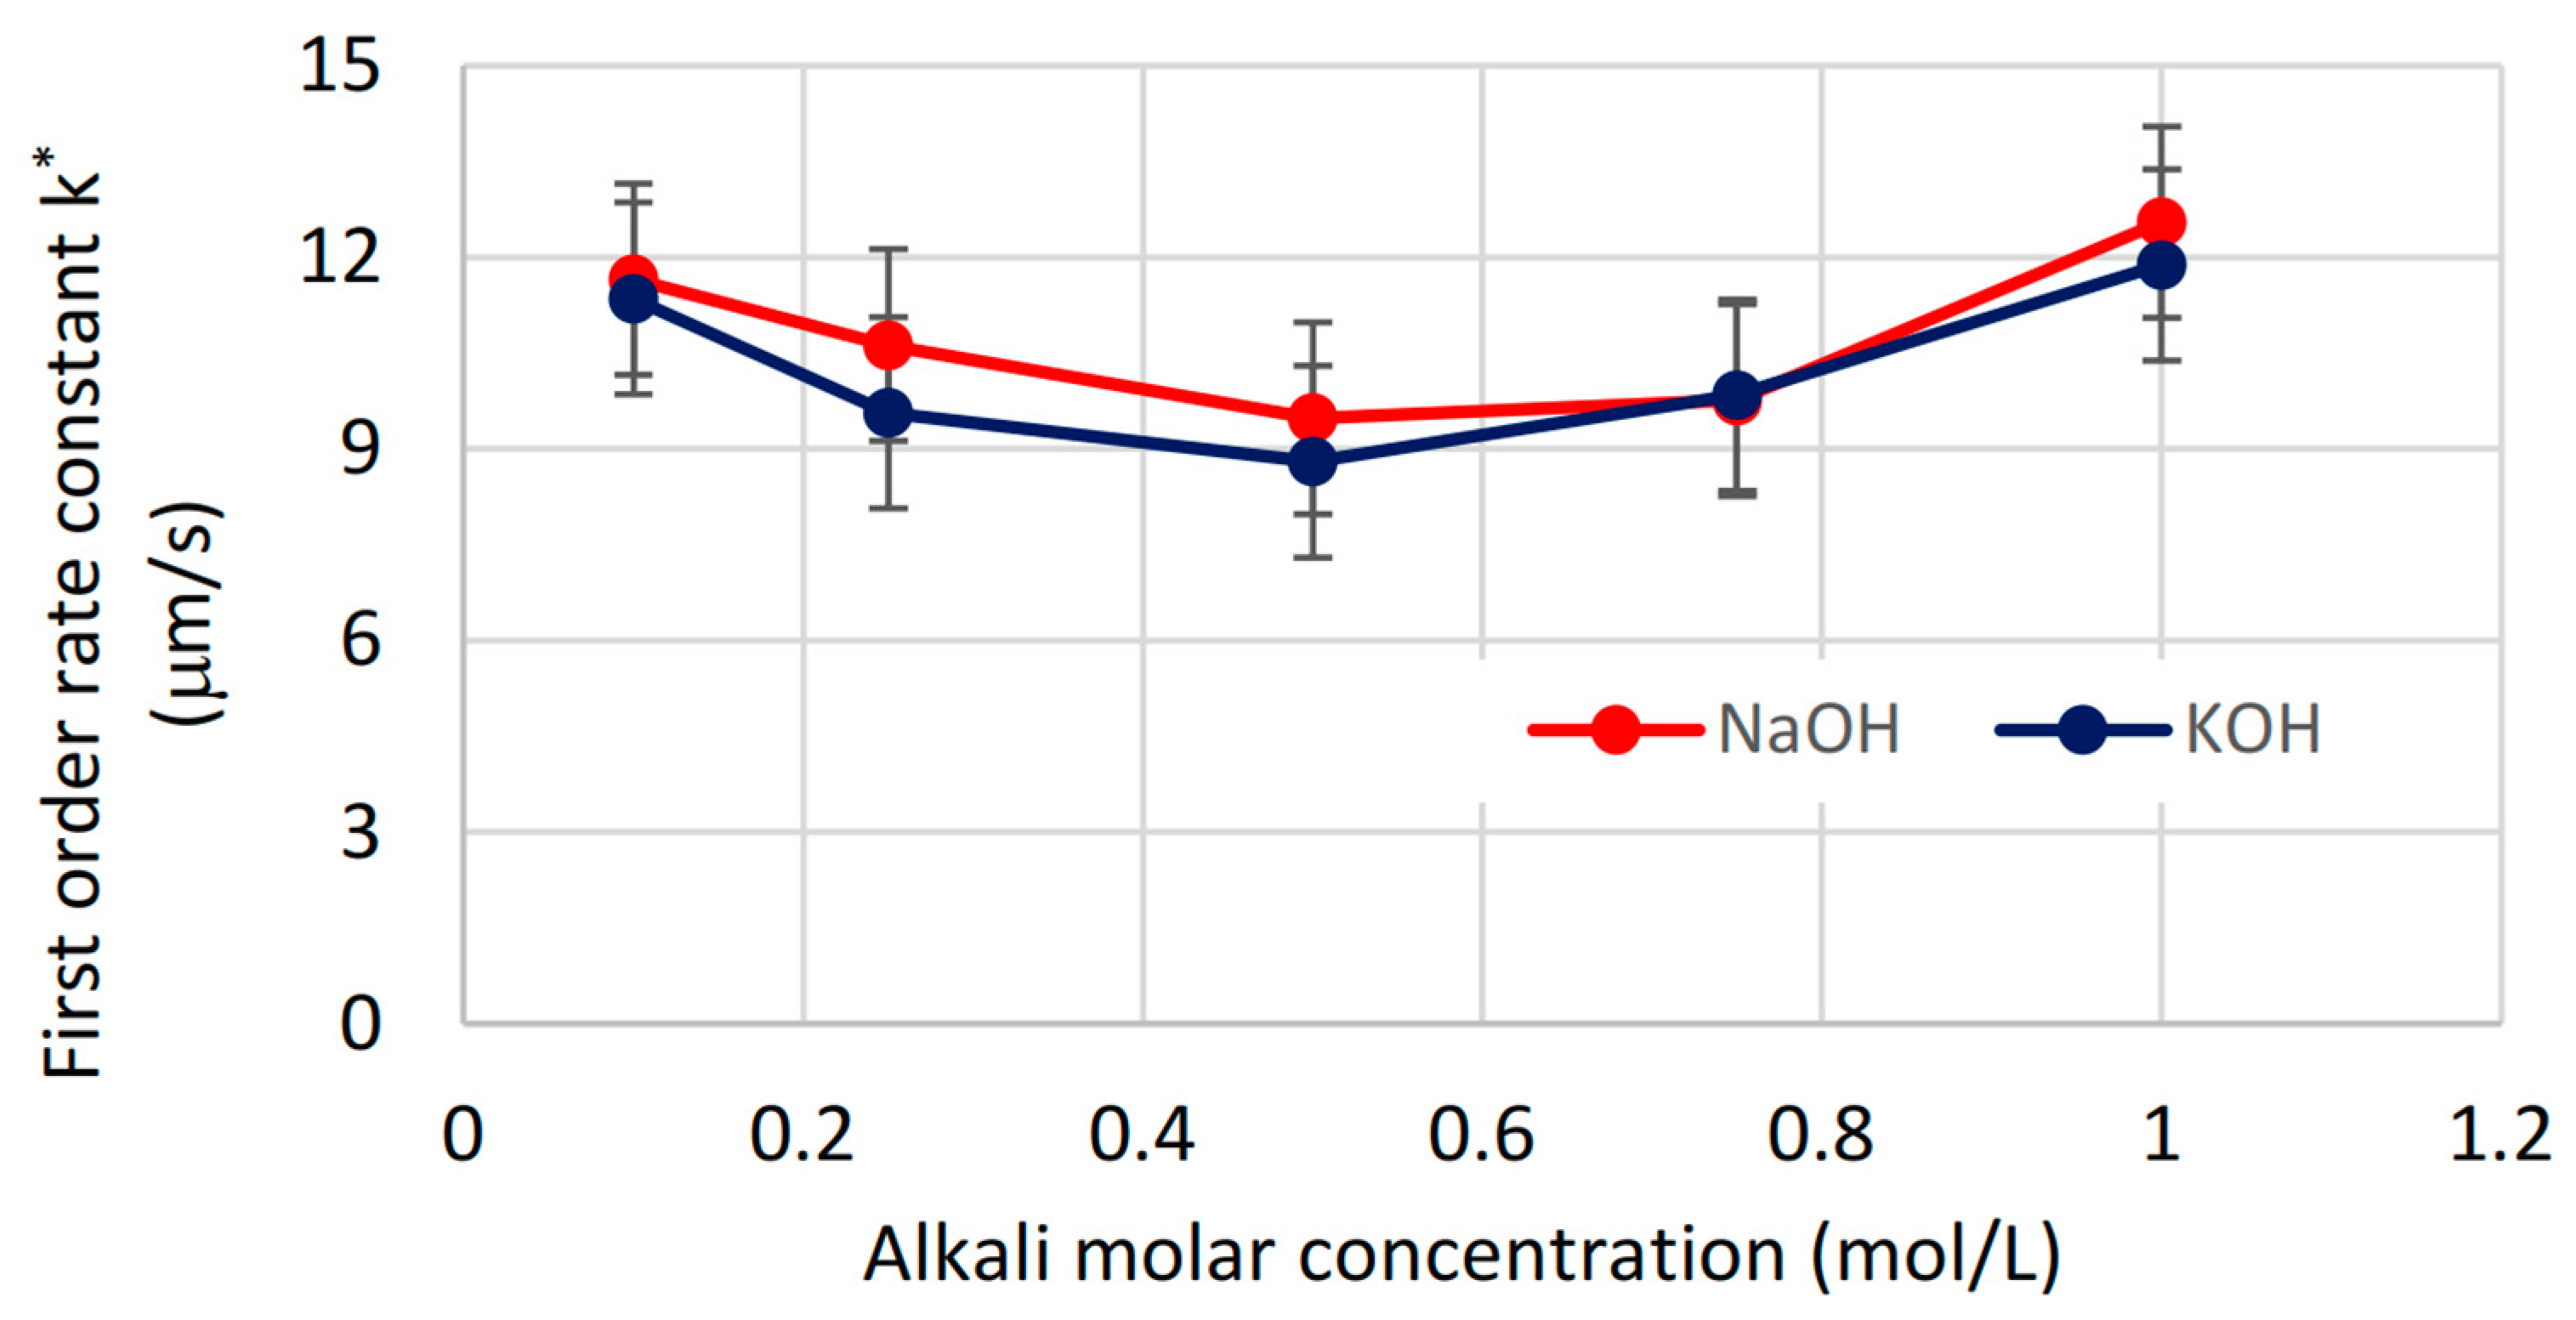
4.4.1. First-Order Rate Constant for Surface Reaction

Regarding Equations (12) and (13), the best way to evaluate the first-order rate constant, k*, is to plot the hydrogen yield curves in coordinates: x = M A l ρ A l · b c a l k t and y = α r 0 . The sloping of the best part of yield growth, measured by the linear trendline method, provides the value of k* for each experimental condition, depicted in Figure 9. Regarding the lack of temperature stabilization, discussed in Section 4.1.2., we estimate the error of k* as being around ±1.5 μm/s from Figure 9, and we assume that the first-order rate constant is independent from the alkali concentration at least up to 1M. This finding coincides with the theoretical opinion that, at the properly performed surface reaction step, the reaction rate, k*, is linearly proportional to calk [15].
The authors of [16] reported the values with a powdered aluminum reagent (Kojundo Chemical Laboratory Co., Ltd., Sakado, Japan) as having 99% mass purity and a particle size of 180–425 μm, with 0.5M NaOH of 1.97 μm/s at 20 °C and 22.8 μm/s at 40 °C. Since the average temperature in our reactor, at the maximum reaction rate, was measured to obtain the value of k, Equation (9), with 0.5M NaOH, is ca. 25 °C (Figure 5); the value of k* of 9.5 μm/s (Figure 9) seems to be consistent. A precise comparison is not possible as the value is strongly influenced by temperature, Al material, and its characteristic size.
Noting the error bars, the difference between NaOH and KOH in Figure 9 is not proven. Nevertheless, we point out that some authors have found NaOH a little more active than KOH. This can be explained by the slightly different mechanisms of catalysis for each alkali. The authors of [17] reported that the activation energies for performed experiments are larger in the presence of KOH over NaOH. The activation energy, Ea, of corrosion is related to the exchange current density, ic; for slower corrosion Ea is larger and ic is smaller, and vice versa [22]. This allows for the explanation that, in an open corrosion process, the value of ic in reactions with KOH is a bit less than that with NaOH.

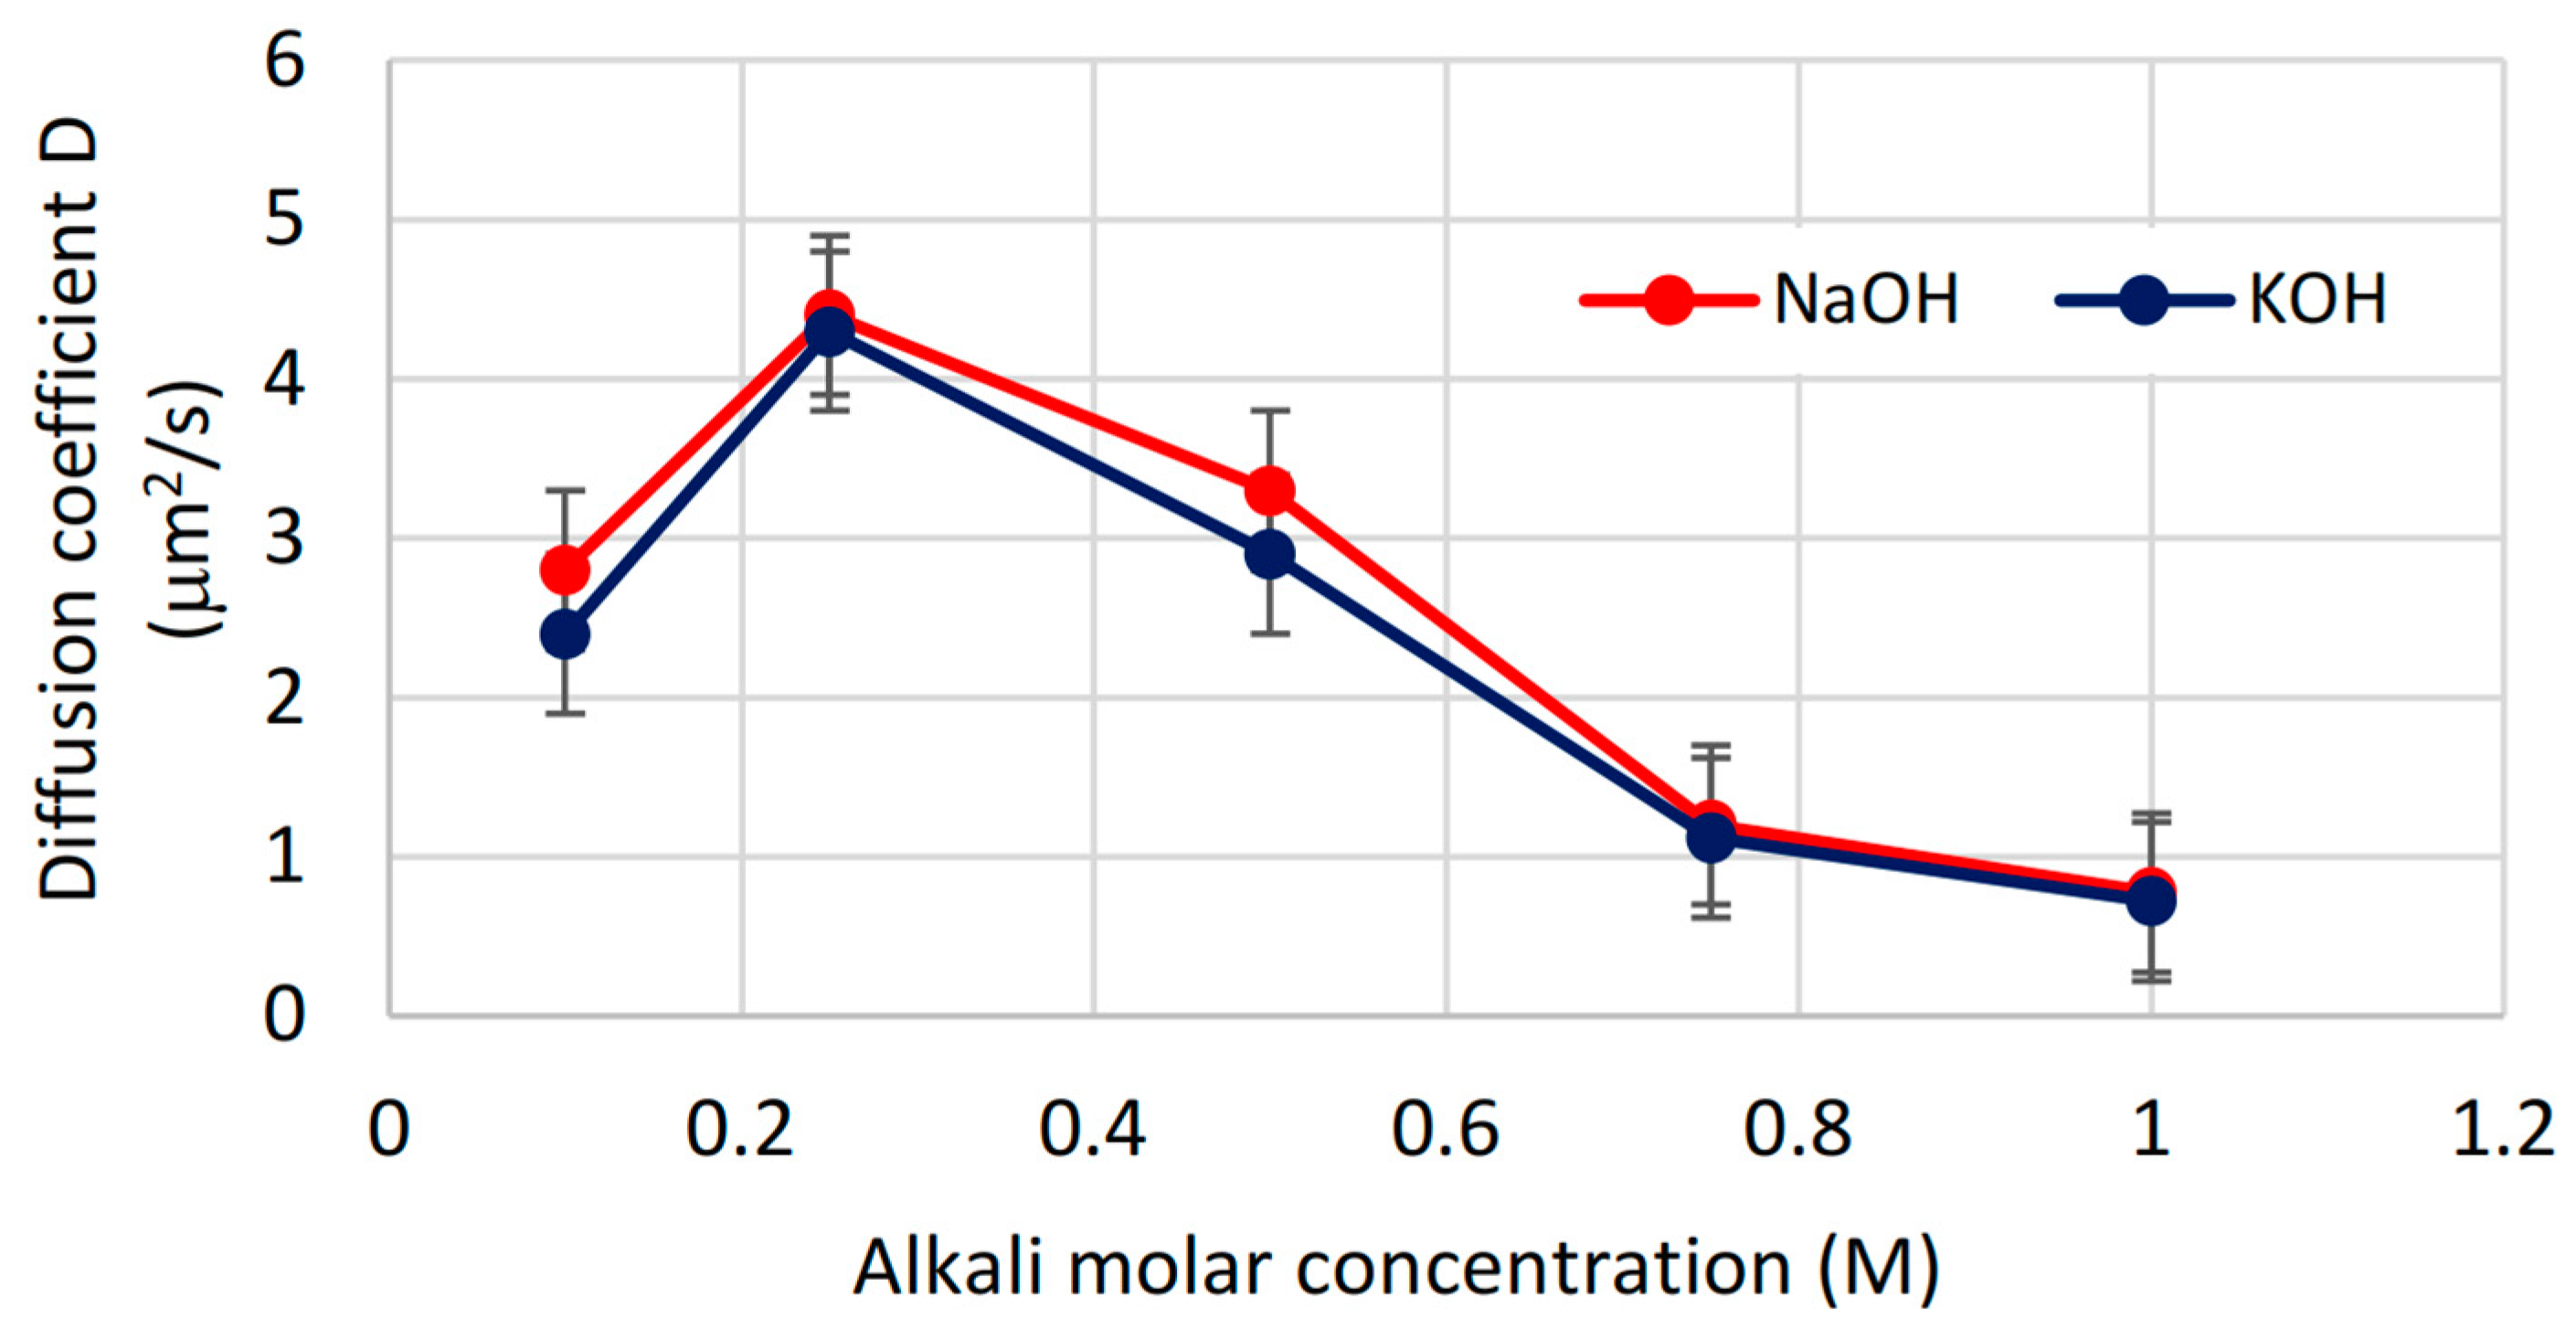
4.4.2. Diffusion Coefficient of an Aqueous Reactant in the Byproduct Layer

In order to evaluate the second-order rate constant, i.e., the diffusion coefficient in the byproduct layer, D, in accordance with Equations (15) and (16) we defined new particular coordinates: x = M A l ρ A l · b c a l k t and y = α 2 r 0 2 2 .
Figure 10 displays the evaluated values of the diffusion coefficient of an aqueous reactant in the byproduct layer, D, as the second-order reaction rate constant. Based on the restricted quantitative replicability of our experiments, we estimate the error of D as being around ± 0.5 μm2/s. The decrease in D by increasing the alkali concentration can be explained by the fact that an alkali of a higher concentration creates a denser surface layer of aluminum hydroxide, which hinders the diffusion of an aqueous reactant. Lower values of D with 0.1M have to be explained otherwise. We assume that, at such a low alkali concentration, not all aluminum oxide is being dissolved from the solid surface. Likewise, in Figure 9, the difference between NaOH and KOH at 0.1M and 0.25M in Figure 10 cannot be proven.

4.4.3. Reconstruction of the Hydrogen Yield via Numerically Obtained Values of k* and D

Figure 11 displays cumulative hydrogen yield curves, reconstrued from the first- and second-order rate parameters, including k* and D, both obtained through the linear trendline method. In general, the coincidence is quite good. The linear reconstruction shows the induction step of the chemical reaction as a shift on the x-axis. Nevertheless, the accuracy of this parameter in our experiments is under question and is not analyzed in this paper.

4.5. Economic Analysis

4.5.1. Profit Estimation of Performed Experiments

The hydrogen yield curves (Figure 6) and analyses discussed above indicate that, with NaOH or KOH concentrations starting from 0.5M, the yield approaches its real maximum. Hence, in terms of the key criterion of optimizing yield, the conclusion is that any molarity of either NaOH or KOH ≥ 0.5M is a potential candidate for the optimal economical production of hydrogen on small and medium scales via hydrolysis.
Considering the optimization of the reaction conditions in terms of economics, the following criterion is the reaction rate. We see in Figure 6 that, at 1M, the reaction completes in about 60 min, compared to 90 min at 0.75M and even up to 160 min at 0.5M. Therefore, in the case of a plant with a target hydrogen production rate, or equivalently a given waste Al throughput rate, the reactor volume must be increased by approximately 1.5 times if an operation opts for production at 0.75M rather than 1M. However, such savings on CAPEX (reactor size) should certainly be considered in the process economics, as it is far from the magnitude that allows clear conclusions.
In our opinion, very few authors who provide a simple profit estimation of the aluminum hydrolysis process pay attention to the loss in cycled alkali. Although NaOH is not consumed by the reaction chain, as shown in Equations (4)–(8), i.e., no NaOH would have to be replaced in an ideal case, elemental analysis indicates that ca. 6–10% of 6M NaOH ends up in a cycled sodium hydroxide solution, even rinsed to a neutral pH after being removed from the reaction volume [23]. There being no detailed investigations on NaOH loss at different initial molarities, it is sensible to assume the relative loss as being proportional to the initial molarity, giving ca. 1.33% with 1M NaOH. Recently, Soberanis et al. [24] and Moreno-Flores et al. [25] published data on the hydrolysis of aluminum cans and waste. The reaction profiles in their pilot reactors broadly agree with our data, and the same conclusions that we make regarding implications for the process economics here are generally backed up by their data and consistent with our findings. In laboratory work, an alkali of a chemical grade is usually used. A good price point of 50 wt.% NaOH solution in water of a chemical grade can be found at Sigma-Aldrich (code 415413), served in 18 L drums. The same NaOH solution of a technical grade, served in 200 L drums (680 lbs.) is seven times cheaper, see Table 2 [26].
Our simple profit estimation is made for NaOH promoters of both a chemical and a technical grade, and is shown in Table 2. In North Europe there is no fixed price for machined waste aluminum chips; we use a value found in reports of EUR 0.5/kg. Regarding the hydrogen yield, there is no sense to distinguish our real yield as 92% of the theoretical (stoichiometric) yield because we take the most frequent price point of European sales, EUR 6–8/kg, which creates an uncertainty of 25% by itself [27]. In this profit estimation, we account for the price of the gibbsite because the expenses of the calcination may depend on the grade of NaOH, which is discussed below. As is seen from Table 2, the difference in profit between applying NaOH of a chemical or technical grade is crucial. If all prices and sales are well estimated, applying 1M NaOH of a chemical grade even leads to negative profit.
There is a dilemma of losing less NaOH vs. increasing the reaction time from 60 min to 90 min by choosing an alkali concentration between 1M and 0.75M. Table 3 deals with calculated “over-profit” by shifting from 1M to 0.75M, related to the overtime of 1 h. As expected, the difference in over-profit between the chemical and technical grades of NaOH is huge, i.e., nine times.

4.5.2. Open Problems of the Further Treatment of Aluminum Hydroxide

To determine the most economical alkali hydroxide concentration for production, or to consider switching from alkali hydroxides to Ca(OH)2 [28,29], two related additional criteria have to be pointed out:
  • Hydroxide salt make-up required between runs;
  • Impurity levels of chemical elements within the solid aluminum hydroxide Al(OH)3 product and its general suitability for recycling/end use.
The most viable known use of a solid Al(OH)3 product is recycling it back to primary aluminum production. This could constitute “ideal recycling” as opposed to, for example, “down-cycling”, in which aluminum is being “sweetened” (diluted) by a significant amount of virgin aluminum from a smelter (20% to 96%, depending on feedstock quality and target alloy) [30,31,32]. Other examples of “down-cycling” are common plastic recycling and even the current state of the art of most aluminum scrap recycling, where the impurity levels of chemical elements require that they are recycled.
In order to return the solid Al(OH)3 product to aluminum smelters, the hydroxide needs to be converted into oxide or alumina, Al2O3. Ideal recycling would be enabled if the hydrolysis product does not incorporate, or entrain, more alkali metal or Ca than the smelter specification accepts. Aluminum smelters typically have accepted specifications on the surface areas (typically ca. 75 m2/g) and impurity levels of alumina (e.g., ≤0.2 wt.% for elements such as Na, K, or Ca). Given an acceptably low impurity profile, aluminum hydroxide can be converted into alumina via calcination either as part of the recycling operation itself or by shipping the solid Al(OH)3 product to an existing bauxite processing facility. In the case of shipping the hydroxide from the hydrolysis recycler, it can be co-introduced with the ore early in the extraction process or directly co-mingled with derived gibbsite, γ-Al(OH)3, via the Bayer process at the final calcination step. Generally, calcination on a large scale at this time is a very inefficient process in terms of energy. The thermodynamic minimum with which to treat 1 kg of Al is only 0.1 kWh, whereas publications report real energy use of 1.6 kWh [33]. In another event, gibbsite, being the dominant crystal phase of the aluminum hydroxide in ore and also the hydroxide precipitate formed within the Bayer process itself [34], would be the preferred phase, since the widely used standard calcination conditions of the hydroxide reliably results in an alumina powder that meets the specific surface area and other specifications for the alumina feedstock of smelters. This is not a trivial consideration, since the formation of the less common synthetic aluminum hydroxide phase bayerite, α-Al(OH)3, and the undesirable incorporation of a sufficient amount of cations, such as Na+ or Ca2+, to form XRD-detectable amounts of species, such as sodium aluminate or kotoite, as part of the solid hydrolysis product, have been frequently reported under standard hydrolysis conditions [16,27,28]. The formation of bayerite is less of a problem than the challenge posed by impurities. Bayerite often naturally transforms into gibbsite, likely because it is entropically favored, or one could probably research and demonstrate calcination conditions for bayerite not too distinct from those for gibbsite, where the resulting alumina meets the surface area specifications of smelters [34]. However, the impurities will likely play a key role in the morphology and surface area upon calcination; it is known that even small amounts of impurities such as fluoride, chloride, and alkali cations or alkali oxides (that can generally be reduced by careful product washing), or larger amounts of impurities such as carbonate (that is hard to remove fully by washing once resent) can play a critical role in determining the phase and morphology, including the pore structure and surface area, of the alumina powder produced from hydroxide via a given calcination protocol [35]. Additional difficulties in gibbsite calcination to alumina after applying NaOH of a technical grade are not reliably found in the literature.

5. Conclusions

The activation energy for flat Al chips is determined to be 48.1 kJ/mol, which coincides with referred Ea = 40.9 kJ/mol with a 0.02 mm-thick foil and 57.2 kJ/mol with 0.5 thick plates. The cumulative hydrogen yield, achieved in our experiments, reaches 1145 mL per 1 g of Al with 1M NaOH at moderate stirring, which is 92% of the theoretical (stoichiometric) H2 yield of pure aluminum, 1245 mL/g. The evaluated first-order rate constant of the chemical reaction, k*, is rather independent from the alkali concentration up to 1M. This notwithstanding, the diffusion coefficient of the aqueous reactant in the byproduct layer, D, decreases four times at increasing alkali concentrations, from 0.25M up to 1M. In Section 4 we provided our reflections on this. For the present type of Al chips, the determined values of k* and D have sufficient accuracy to be used in a mathematical simulation of chemical and physical processes. Although NaOH shows a bit more activity as a promoter than KOH, noting the error bars, this difference is not proven. The profit estimation of aluminum hydrolysis reveals a crucial difference between applying NaOH of a chemical or technical grade, if attention is paid to the loss in cycled alkali. It seems possible to reduce the expenses due to alkali by applying it at a lower concentration, down to 0.75M, allowing extra time for the reaction to proceed.

Author Contributions

Conceptualization and supervision, J.K., D.M. and C.R.; methodology, P.L., A.K., M.U., S.V. and C.R.; investigation, P.L., A.M., S.V., M.U. and C.R.; yheoretical model and calculations, A.M. and C.R.; writing—original draft preparation, A.M. and C.R.; writing—review and editing, A.K., J.K., D.M., S.V. and C.R.; visualization, A.M., C.R. and M.U.; project administration, A.K.; funding acquisition, S.V., A.K., C.R. and D.M. All authors have read and agreed to the published version of the manuscript.

Funding

This research was funded by the Baltic Research Programme project No. EEA-RESEARCH-92, EEA Grant No. EEZ/BPP/VIAA/2021/5.

Data Availability Statement

Data is contained within the article.

Conflicts of Interest

The authors declare no conflict of interest.

References

  1. Calder, G.V.; Stark, T.D. Aluminum reactions and problems in municipal solid waste landfills. Pract. Period. Hazard. Toxic Radioact. Waste Manag. 2010, 14, 258–265. [Google Scholar] [CrossRef]
  2. International-aluminium.org. Primary Aluminium Production—International Aluminium Institute. Available online: https://international-aluminium.org/statistics/primary-aluminium-production/ (accessed on 29 January 2023).
  3. Martínez, S.S.; Benítes, W.L.; Gallegos, A.A.Á.; Sebastián, P.J. Recycling of aluminum to produce green energy. Sol. Energy Mater. Sol. Cells 2005, 88, 237–243. [Google Scholar] [CrossRef]
  4. Hiraki, T.; Akiyama, T. Exergetic life cycle assessment of new waste aluminium treatment system with co-production of pressurized hydrogen and aluminium hydroxide. Int. J. Hydrog. Energy 2009, 34, 153–161. [Google Scholar] [CrossRef]
  5. Razavi-Tousi, S.S.; Szpunar, J.A. Mechanism of Corrosion of Activated Aluminum Particles by Hot Water. Electrochim. Acta 2014, 127, 95–105. [Google Scholar] [CrossRef]
  6. Elsarrag, E.; Elhoweris, A.; Alhorr, Y. The production of hydrogen as an alternative energy carrier from aluminium waste. Energy Sustain. Soc. 2017, 7, 9. [Google Scholar] [CrossRef] [Green Version]
  7. Xuan, J.; Leung, M.K.H.; Leung, D.Y.C.; Ni, M. A review of biomass-derived fuel processors for fuel cell systems. Renew. Sustain. Energy Rev. 2009, 13, 1301–1313. [Google Scholar] [CrossRef]
  8. Amendola, S.C.; Sharp-Goldman, S.L.; Janjua, S.M.; Spencer, N.C.; Kelly, M.T.; Petillo, P.J.; Binder, M. A Safe, portable, hydrogen gas generator using aqueous borohydride solution and Ru catalyst. Int. J. Hydrog. Energy 2000, 25, 969–975. [Google Scholar] [CrossRef]
  9. Wang, E.D.; Shi, P.F.; Du, C.Y.; Wang, X.R. A mini-type hydrogen generator from aluminum for proton exchange membrane fuel cells. J. Power Sources 2008, 181, 144–148. [Google Scholar] [CrossRef]
  10. Gai, W.Z.; Liu, W.H.; Deng, Z.Y.; Zhou, J.G. Reaction of Al powder with water for hydrogen generation under ambient condition. Int. J. Hydrog. Energy 2012, 37, 13132–13140. [Google Scholar] [CrossRef]
  11. Bunker, B.C.; Nelson, G.C.; Zavadil, K.R.; Barbour, J.C.; Wall, F.D.; Sullivan, J.P.; Windisch, C.F.; Engelhardt, M.H.; Baer, D.R. Hydration of Passive Oxide Films on Aluminum. J. Phys. Chem. B 2002, 106, 4705–4713. [Google Scholar] [CrossRef]
  12. Deng, Z.Y.; Ferreira, J.M.F.; Tanaka, Y.; Ye, J. Physicochemical Mechanism for the Continuous Reaction of γ-Al2O3-Modified Aluminum Powder with Water. J. Am. Ceram. Soc. 2007, 90, 1521–1526. [Google Scholar] [CrossRef]
  13. Deng, Z.Y.; Ferreira, J.M.F.; Sakka, Y. Hydrogen-generation materials for portable applications. J. Am. Ceram. Soc. 2008, 91, 3825–3834. [Google Scholar] [CrossRef]
  14. Omran, M.P.; Mousa Oskueyan, G.; Farhadi, M.; Sedighi, K. Design of Hydrogen Generator for on-Board Hydrogen Generation from Waste Aluminum Chips. In Proceedings of the 22th International Symposium on Transport Phenomena, TUDelft, The Netherlands, 8–11 November 2011; pp. 25–27. [Google Scholar]
  15. Levenspiel, O. Chemical Reaction Engineering, 3rd ed.; Wiley: New York, NY, USA, 1998; p. 704. [Google Scholar]
  16. Hiraki, T.; Takeuchi, M.; Hisa, M.; Akiyama, T. Hydrogen production from waste aluminum at different temperatures, with LCA. Mater. Trans. 2005, 46, 1052–1057. [Google Scholar] [CrossRef] [Green Version]
  17. Porciúncula, C.B.; Marcilio, N.R.; Tessaro, I.C.; Gerchmann, M. Production of hydrogen in the reaction between aluminum and water in the presence of NaOH and KOH. Braz. J. Chem. Eng. 2012, 29, 337–348. [Google Scholar] [CrossRef] [Green Version]
  18. Ambaryan, G.N.; Vlaskin, M.S.; Dudoladov, A.O.; Meshkov, E.A.; Zhuk, A.Z.; Shkolnikov, E.I. Hydrogen generation by oxidation of coarse aluminum in low content alkali aqueous solution under intensive mixing. Int. J. Hydrogen Energy 2016, 41, 17216–17224. [Google Scholar] [CrossRef]
  19. Soler, L.; Candela, A.M.; Macanás, J.; Muñoz, M.; Casado, J. In situ generation of hydrogen from water by aluminum corrosion in solutions of sodium aluminate. J. Power Sources 2009, 192, 21–26. [Google Scholar] [CrossRef]
  20. Soler, L.; Macanás, J.; Muñoz, M.; Casado, J. Aluminum and aluminum alloys as sources of hydrogen for fuel cell applications. J. Power Sources 2007, 169, 144–149. [Google Scholar] [CrossRef]
  21. Berna, X.S.; Genesca, M.M.; Daga-Monmany, J.M.; Mujal-Rosas, R. Analysis of Valorization Process of Aluminum Breakage Scraps to Obtain Green Hydrogen. Adv. Valuab. Met. Recycl. 2021, 11, 598. [Google Scholar]
  22. Brett, C.M.A.; Maria, A.N.A.; Brett, O. Principles, Methods, and Applications. Electrochemistry 1993, 67, 444. Available online: http://www.getcited.org/pub/102998784 (accessed on 29 January 2023).
  23. Haller, M.Y.; Amstad, D.; Dudita, M.; Bäuerle, Y. AlEnCycles—Aluminium-Redox-Cycles for the Production of Heat and Electricity for Buildings Based on Renewable Energies. Zenodo. Available online: https://zenodo.org/record/6393255#.ZBjQkMJBy70 (accessed on 20 March 2023).
  24. Soberanis, M.A.E.; Vales-Pinzón, C.; Hernández-Núñez, E.; Flota-Bañuelos, M.; Medina, J.; Quintal-Palomo, R.; San-Pedro, L.; Ruiz-Gómez, M. Temperature dependence on hydrogen production from hydrolysis reaction of recycled aluminum. Clean Techn Environ Policy 2023, 25, 35–49. [Google Scholar] [CrossRef]
  25. Moreno-Flores, R.; Loyola-Morales, F.; Valenzuela, E.; Sebastian, P.J. Design and performance evalu-ation of a prototype hydrogen generator employing hydrolysis of aluminum waste. Clean Techn Environ Policy 2023, 25, 747–753. [Google Scholar]
  26. Sodium Hydroxide/Caustic Soda Supplier & Distributor|Univar Solutions|Univar Solutions. Available online: https://www.univarsolutions.com/product-categories/essential-chemicals-ingredients/liquid-caustic-soda?hasprice=cspweb (accessed on 20 March 2023).
  27. Hydrogen Cost and Sales Prices|H2Valleys. Available online: https://h2v.eu/analysis/statistics/financing/hydrogen-cost-and-sales-prices (accessed on 20 March 2023).
  28. Gai, W.Z.; Wang, L.Y.; Lu, M.Y.; Deng, Z.Y. Effect of low concentration hydroxides on Al hydrolysis for hydrogen production. Energy 2023, 268, 126731. [Google Scholar] [CrossRef]
  29. Kanehira, S.; Kanamori, S.; Nagashima, K.; Saeki, T.; Visbal, H.; Fukui, T.; Hirao, K. Controllable hydrogen release via aluminum powder corrosion in calcium hydroxide solutions. J. Asian Ceram. Soc. 2013, 1, 296–303. [Google Scholar] [CrossRef] [Green Version]
  30. Zhu, Y.; Cooper, D.R. An Optimal Reverse Material Supply Chain for U.S. Aluminum Scrap. Procedia CIRP 2019, 80, 677–682. [Google Scholar] [CrossRef]
  31. Soo, V.K.; Peeters, J.R.; Compston, P.; Doolan, M.; Duflou, J.R. Economic and Environmental Evaluation of Aluminium Recycling based on a Belgian Case Study. Procedia Manuf. 2019, 33, 639–646. [Google Scholar] [CrossRef]
  32. Modaresi, R.; Müller, D.B. The role of automobiles for the future of aluminum recycling. Env. Sci. Technol. 2012, 46, 8587–8594. [Google Scholar] [CrossRef] [PubMed]
  33. Haller, M.Y.; Amstad, D.; Dudita, M.; Englert, A.; Häberle, A. Combined heat and power production based on renewable aluminium-water reaction. Renew. Energy 2021, 174, 879–893. [Google Scholar] [CrossRef]
  34. Gale, J.D.; Rohl, A.L.; Milman, V.; Warren, M.C. An ab Initio Study of the Structure and Properties of Aluminum Hydroxide: Gibbsite and Bayerite. J. Phys. Chem. B 2001, 105, 10236–10242. [Google Scholar] [CrossRef]
  35. Oxides and Hydroxides of Aluminum. WorldCat.org. Available online: https://www.worldcat.org/title/oxides-and-hydroxides-of-aluminum/oclc/18997314 (accessed on 18 March 2023).
Figure 1. (a) A hydrogen bubble on the boundary layer of metal-hydroxide, (b) the acting forces on a H2 bubble in the boundary layer [10].
Energies 16 05554 g001
Figure 2. Initial waste Al chips: XRD graph; photo camera image; and SEM images at different magnitudes.
Energies 16 05554 g002
Figure 3. Experimental setup of the chemical reactor to produce hydrogen from aluminum. 1—Al material (chips); 2—Al(OH)3 residue; 3—reactor volume; 4—magnetic stirrer; 5—stirrer stick; 6—turbomolecular pump; 7—water deionizer; 8—argon tank; 9—gaseous hydrogen pre-volume; 10—manometer; 11—gas spectral analyzer; and 12—volume for produced hydrogen.
Energies 16 05554 g003
Figure 4. Stirring adjustment by reaching linearity.
Energies 16 05554 g004
Figure 5. Temperature fluctuations and H2 production rate during the chemical reaction with 0.5M NaOH.
Energies 16 05554 g005
Figure 6. Experimentally measured cumulative H2 yield.
Energies 16 05554 g006
Figure 7. Comparison of normalized cumulative H2 yields at different alkali concentrations after 1 h of reaction between the present work with NaOH, KOH, and [19].
Energies 16 05554 g007
Figure 8. Experimentally measured H2 production rate.
Energies 16 05554 g008
Figure 9. Evaluated first-order rate constants, k*, for surface reactions at different alkali concentrations.
Energies 16 05554 g009
Figure 10. Evaluated second-order rate constants, D, for mass transfer at different alkali concentrations.
Energies 16 05554 g010
Figure 11. Reconstrued diagrams of cumulative H2 yield.
Energies 16 05554 g011
Table 1. Elemental composition of Al chips as received.
Elemental CompositionConcentration, %
Aluminum94.3
Magnesium0.6
Carbon5.0
Oxygen0.1
Table 2. Profit estimation of aluminum hydrolysis with NaOH promoters of a chemical and technical grade (per 1 kg H2 yield).
Al Chips
9 kg
Green H2 Sale
1 kg
Gibbsite Sale
26 kg
NaOH Price
26.6 kg 50 wt.% (aq)
NaOH Loss of 1.33% (with 1M NaOH)Profit of Al Hydrolysis Process
EUR 0.5/kg·9 kg
= EUR 4.5
EUR 6EUR 0.2/kg·26 kg
= EUR 5.2
Chemical: EUR 547EUR 7.3EUR −0.6
Technical: EUR 76EUR 1.0EUR 5.7
Table 3. Over-profit estimation by shifting from 1M to 0.75M NaOH, related to 1 h of overtime (per 1 kg H2 yield).
NaOH Price
26.6 kg 50 wt.% (aq)
NaOH Loss of 1.33% (with 1M NaOH)Profit of Al Hydrolysis Process with 1MNaOH Loss of 1% (with 0.75M NaOH)Profit of Al Hydrolysis Process with 0.75M“Over-Profit” of Decreased NaOH Molarity vs. Overtime
Chemical: EUR 547EUR 7.3EUR −0.6EUR 5.5EUR 1.2EUR 3.6/h
Technical: EUR 76EUR 1.0EUR 5.7EUR 0.76EUR 5.9EUR 0.4/h
Disclaimer/Publisher’s Note: The statements, opinions and data contained in all publications are solely those of the individual author(s) and contributor(s) and not of MDPI and/or the editor(s). MDPI and/or the editor(s) disclaim responsibility for any injury to people or property resulting from any ideas, methods, instructions or products referred to in the content.

