Abstract
Education for sustainable development has among its pillars, capacity building, which equips future generations with the set of skills needed to face the challenge of the transformation of society for sustainable development. This paper presents a training course for a novel model of long-term energy planning (the ModUlar energy system Simulation Environment, MUSE), as an example of capacity building activities for sustainable development. The activities were part of the Joint Summer School on Modelling Tools for Sustainable development, held in Trieste (Italy) in 2022. This summer school was one of the first successful implementations of education and training courses in a super-hybrid mode in the post-COVID era. Describing the training activities for MUSE open-source, this paper addresses one of the challenges that education for sustainable development is expected to increasingly face in the future: the training of future professionals in the use of novel toolkits and the implementation of truly trans-disciplinary approaches.This paper discusses the pre-school online training course for MUSE, the summer school contents, and some student modeling outcomes. While doing so, it shows the importance of leveraging the abstract contents of a course with practical exercises when learning a new tool. Reflecting upon the students’ experience, this paper draws conclusions that can be used to improve future editions of the same course and be extended to the design of training courses for other tools.
1. Introduction
The future development of the world must find foundations on the United Nations (UN) Sustainable Development Goals (SDGs), incorporating each of them into national agendas and policies on climate change, economic inequality, innovation, sustainable consumption, peace, and justice [1]. Sustainable development, preserving resources and ecosystems, and promoting resilience against the consequences of climate change, grants a future for societies striving to transform the risks originating from the interactions between humans, systems climate, and ecosystems into new development opportunities [2].
Education has had a primary role in achieving sustainable development (also named education for sustainable development), since the UN Conference of Stockholm (1972). Subsequent international initiatives took place during the United Nations Decade (2005–2014) of education for sustainable development, which aimed to institutionalize education for sustainable development [3]. The importance of education was reaffirmed during COP21, as a means to train individuals and institutions to tackle climate change [4] and the SDGs. Among the SDGs, some explicitly mention education: SDG 4 aims at inclusive and equitable quality education and at lifelong learning opportunities for all; SDG 17 aims at boosting global partnerships for sustainable development includes targets for increasing technology and innovation in the least developed countries [1]. The realization of each SDG is linked to education for sustainable development, which is founded on capacity building, the development and enhancement of the skills needed by organizations to live and advance in a fast-changing world [5]. As sustainable development encompasses a broad strategy, ranging from the economic, to the environmental, and to the social dimension, higher education institutions must become the catalysts to create such a future [6].
This paper presents an example of a capacity building effort, the Joint Summer School on Modelling Tools for Sustainable Development (held in Trieste, Italy, in 2022), which focused on energy-resource nexus education. The event was part of a successful trans-institutional and trans-national sustainability education and research program, Climate Compatible Growth (CCG). This work is novel, as it presents the process of learning an integrated assessment model for climate change, with an audience from a background different from energy system modeling. The learning process described in this work is unique, as it demonstrates the advantages and disadvantages of working with integrated assessment models. Integrated assessment models (IAMs) are a class of software tools used to explore climate-policy actions for climate change mitigation, for estimating mitigation costs, and in general for promoting sustainable development [7], as well as the monitoring of the learning progress of the students. The teaching and learning process of a new IAM, the MUSE model (ModUlar energy system Simulation Environment), is presented, as it had the unique feature of having just been made an open-source model at the time the summer school was held, thus meaning that the precipitants had little past experience of using it. This work can inspire educators when they introduce students to the concepts of energy system modeling, to IAMs, and to the energy–resource nexus. It can also represent a reference for teaching energy toolkits within and outside of academia, especially to users with varied backgrounds and motivations.
After an introduction on the sustainable development process and an overview of the MUSE model, this paper will describe the structure of the school and of the lectures. A country-specific case study, out of the three developed by the students attending the MUSE track at the Summer School, will be presented. Final considerations about how to overcome the challenges of capacity building and recommendations for the preparation of future training material on IAMs close the paper.
2. Background
Since the launch of the 2030 Agenda, stating that Sustainable Development Goals (SDGs) (shown in Figure 1) are unavoidable targets for the future of humanity [1], education has become an essential pillar for building sustainable development based on the SDGs.
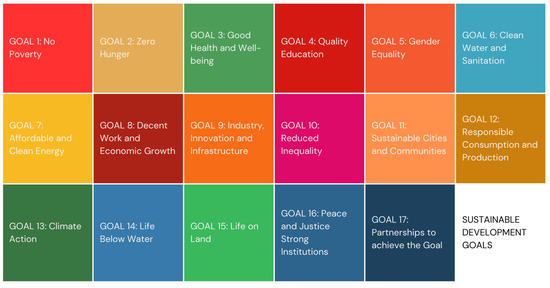
Figure 1.
Sustainable development goal (SDG) representation.
Education for sustainable development (ESD) is a learning process “based on ideals and principles that prepare people to plan for, cope with, and find solutions for issues that threaten the sustainability of our planet” [5]. Quality education at all levels improves development outcomes for individuals, communities, and countries. With regards to higher education, institutions are called on to develop new avenues for education, including undergraduate and graduate teaching, professional training, executive and adult education, online learning, co-curricular activities, and student clubs and societies [8].
Many have called for a revolutionary change in higher education, to meet the challenges of global environmental change and to shift consciousness and engage actors in research, education, and capacity building with reflexive processes for inherent changes [9]. With the role of higher education being crucial in delivering a sustainable future, several authors have focused on specific aspects of the inclusion of SDGs in higher education and provided a teaching framework that integrated both entrepreneurship and sustainability, valuing the importance of an increased collaboration with external parties [10]. Other authors have focused on the implementation of SDGs in relation to the sustainability of architecture, with the built environment being linked to multiple SDGs, such as SDG 7 (which aims to “ensure access to affordable, reliable, sustainable, and modern energy for all”), SDG 9 (which aims to “build resilient infrastructure, promote inclusive and sustainable industrialization, and foster innovation), SDG 11 (which aims to “make cities and human settlements inclusive, safe, resilient, and sustainable”) [11]. With regards to higher education, universities should advance sustainability, not only through education and research, but also through societal collaboration and outreach [12]. In addition, they should align their curricula and research with SDG principles, include new learning methods, seek to develop more applied research around the SDGs, renovate PhD programs, more actively engage with students’ communities, and act as champions of public opinion in support of SDGs [6]. To achieve such goal, there is also a need to develop a new entrepreneurial mindset for an “entrepreneurial-oriented sustainability education”, increasing collaboration between universities and communities (such as industries, associations, public institutions, and businesses) and training generations for dealing with complex sustainability problems [13]. Broadening the perspective from sustainability in production toward moving to a complete implementation of SDG 12 (aiming at “Sustainable Production and Consumption”), other authors drew a future characterized by a faster-growing trend of sustainability-related programs integrating consumer and/or citizen perspectives [14].
Other authors focused on a very broad spectrum of SDGs and addressed the challenges of their practical implementation. Without proposing any prioritization among the SGDs, some authors quantitatively showed that the implementation of SDG 7 could foster sustainable developments in other SDGs through SDG interaction [15]. For example, the implementation of SDG 7 worldwide would allow universal access to clean energy, reducing inequality and poverty. For SDG 7 to be successful, low-income countries should move along a low-carbon path. This would rely on developing local skilled professionals. One way to fill this gap of skilled professionals would be to prepare university masters programs, which should respond to SDG 7 and which, if integrating a gender perspective in the curricula, can create an environment valuing and practicing inclusivity and diversity [16]. An additional and essential way to provide knowledge and skills to deploy and adapt renewable energy systems to local contexts would be encouraging doctoral students to focus on clean energy technologies [17]. These radical changes that universities need to undergo to can be realized exclusively via international programs of research and education, aimed to create capacity building at a global scale, as urged by SDG 17.
As the SDGs seek advancements beyond climate action, it is important to avoid the unbalanced prioritization of carbon intensity reduction exclusively but rather promote the even advancement of each SDG. For example, affordability of clean energy; water resource preservation; promotion of population well-being, including in developing countries; and eradication of poverty and hunger should be pursued altogether to build an equitable transition to a sustainable world [18]. As highlighted in the latest IPCC report [2], the level of transformational change needed to mitigate emissions can only be foreseen from the perspective of creating an equitable and just world, thus realising a just transition, “a fair and equitable process of moving towards a post-carbon society” [19]. This would include “distributional justice”, allowing for a fair distribution of costs and revenues for communities; “procedural justice”, promoting participation of citizens and stakeholders in the policy-making process [20]; and “restorative justice”, to grant compensation for damages caused [19].
The CCG research program supports investment in sustainable energy and transport systems, to meet development priorities, based on the principle that these would allow a more even distribution of technical and soft skills in low-carbon energy technologies across the globe. Starting from raising the awareness about the energy–environment–resource nexus and strengthening the collaboration among universities and communities, the program is generating capacity building, forming new generations of experts in energy policy and energy modeling. In the remainder of this paper, we present the experience of the Joint Summer School on Modelling Tools for Sustainable Development (2022 edition). The School focused on toolkits to develop energy balances, energy projections, energy investment, and emissions and renewable integration modeling.
3. Joint Summer School on Modelling Tools for Sustainable Development (2022 Edition)
The Joint Summer School on Modelling Tools for Sustainable Development was held from 30 May to 16 June at the International Centre for Theoretical Physics (ICTP) in Trieste (Italy). It contained six tracks on which students could enroll and which are briefly discussed in the following.
3.1. OnSSET: The Global Electrification Platform
The open-source spatial electrification tool (OnSSET) [21] is an open-source framework for conducting geospatial electrification analyses. It combines GIS (geographical information system) data with demographic and techno-economic information, to determine where grids/mini-grids can be installed at the lowest cost. Pre-existing electrification results obtained with OnSSET for 58 countries can be consulted on the World Bank’s Global Electrification Platform (GEP) [22].
3.2. Energy and Flexibility Modeling: OSeMOSYS and FlexTool
For the estimation of long-term energy system development, the open-source energy modeling system (OSeMOSYS) can be used to model long-term energy scenarios, looking for the cheapest integration of energy technologies, each of which is defined by costs, technical parameters (e.g., capacity factor, life time), and production potential [23]. FlexTool can be used to complement OSeMOSYS, by performing a flexibility analysis of the energy scenarios and determining how to overcome a potential loss of load and/or curtailment.
3.3. Financial Analysis of Power Sector Projects Using the FinPlan Model
The model for financial analysis of electric sector expansion Plans (FINPLAN) proposes financial modeling of energy projects and provides a better understanding of the financial viability of a project [24]. This is assessed by comparing the cost components of a project during its construction and operation with the available funding sources. The risk exposure of a project is analyzed from cash-flows and financial statements.
3.4. Energy Demand Assessment and Scenarios: MAED and EBS Tools
The model for analysis of energy demand (MAED) evaluates future energy demand based on assumptions about socioeconomic developments in a country or a region [25]. The energy balance studio (EBS) is used to organize data statistics as inputs to energy models, such as MAED.
3.5. CLEWs
The climate, land-use, energy, and water systems (CLEWs) model is a tool for the simultaneous consideration of food, energy, and water security [26]. It was designed to compare value chains for the promotion of clean energy, showing competition for water and food systems.
3.6. MUSE
The software MUSE (ModUlar energy system Simulation Environment) version 1.0.1, developed at the Sustainable Gas Instituted of Imperial College London, is an open-source agent-based integrated assessment model that is unique, as it depicts complex micro-dynamics among agents, resulting in the emergence of macro system characteristics. This process adds realism to climate mitigation pathways. Differently from most past IAM approaches based on single-actor simulation or optimization, the ability to capture heterogeneity in consumer and firm behavior brings to energy modeling the potential for in-depth studies of agent responses to interventions and circumstances, as is typical in agent-based models (ABM).
MUSE is a model used to simulate long-term energy system scenarios at global, national, or local scale where technological transitions of the energy system occur. MUSE explicitly models techno-economic data on various technologies and therefore is a bottom-up model.
MUSE is available open source under a GNU General Public License v3.0 on GitHub at https://github.com/SGIModel/MUSE_OS (accessed on 21 June 2023). A representative diagram of the model is shown in Figure 2. While a detailed description of the MUSE modeling environment is presented in [27], in this paper, an overview of the aspects of the model that emerged as relevant during the training is presented:
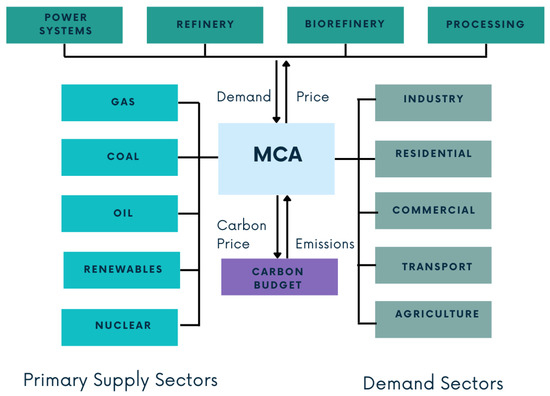
Figure 2.
MUSE schematic approach. MCA: market-clearing algorithm.
- Sectors typically group areas of economic activity together. In MUSE, the whole energy system can be covered in terms of energy flows and emissions, using primary supply sectors (including the extraction of coal, gas, oil, uranium, and renewables), conversion sectors (including power systems, refineries, biorefineries, and all activities involved in resource processing into energy vectors), and demand sectors (including industrial, residential, commercial, transport, and agricultural activities). Each sector contains technologies that are operated and owned by agents. Technologies are characterized by economic, technical, and environmental features, as well as constrained in their growth. Agents in each region and sector can invest in technologies to meet their demand. They operate with a knowledge of prices and costs, which can be set to flexibly change; agent foresight is typically limited to the time when the investment occurs (so-called “limited foresight” behavior);
- The market clearing algorithm (MCA) is the marketplace of each of the commodities exchanged across the sectors. The price of a commodity is formed when supply meets demand. With the supply–demand mechanism, the MCA creates an interface where each sector can interact with the others. In fact, during the supply–demand process, after the sector agents have invested and operated the technologies, commodity demands are aggregated and sent to the MCA, forming a new price, which is returned to the sectors. The supply–demand mechanism is repeated by the MCA, until convergence is reached between the quantity of a commodity produced at a certain price and the quantity of the same commodity demanded at the same price. The supply–demand mechanism is repeated during every simulated period;
- The carbon budget is an approach to modeling the earth system reaction to increased emissions that is more simplified than interfacing with a climate model. It involves defining an emission trajectory chosen to represent the more likely trajectory of emissions, corresponding to a certain level of warming. At every iteration, in each time period, MUSE calculates the total emissions of the system and compares them with the emission limit; if emissions are higher, then the carbon price increases proportionally to the gap of emissions. This is repeated until system emissions are lower than the emission constraint.
For teaching the MUSE model, the MUSE track was split into two parts:
- an Open University course: https://www.open.edu/openlearncreate/course/view.php?id=8401 (accessed on 21 June 2023), to build modeling skills with the software;
- development of a country-specific case study
The advantages of using MUSE as an IAM to model the energy system transition are derived from a series of features. The model was written in Python, thus allowing the students to be exposed, although minimally and typically of an initial stage of use, to a programming language characterized by a continuous growth in its number of users. The model is open-source, thus having potential integration with other open-source tools. Its flexibility and wide range of uses is shown in the set of applications detailed in Table 1. As shown in the Table, the MUSE model has been used in national and global studies, both in single-model applications and in multi-model comparison works.

Table 1.
The MUSE model: applications.
4. The Muse Open University Course: Lectures and Hands-On
Before applying for the Summer School, the students had to enroll on the Open University course and received a mark from attending the lectures and successfully answering the quizzes. Once the course was completed, they obtained an attendance certificate acknowledging that the course had been passed. The course enrollment was open between March and April 2022. Trainers for the MUSE track, similarly to other tracks, were available for a one-hour online weekly meeting, to answer the students’ questions and assist them in the completion of the course, throughout the course duration.
The Open University course for MUSE, after an introduction to the course, included seven lectures, and seven hands-on. The content of each lecture and hands-on session is summarized in Figure 3. The introduction to the course contained a description of the course and notions of energy system modeling, where concepts surrounding limited resource availability and links between fuel combustion and emissions were introduced. In this way, the students were given the basics of technological, societal, and economic pathways (also called scenario narratives) to transition to a low-carbon world.
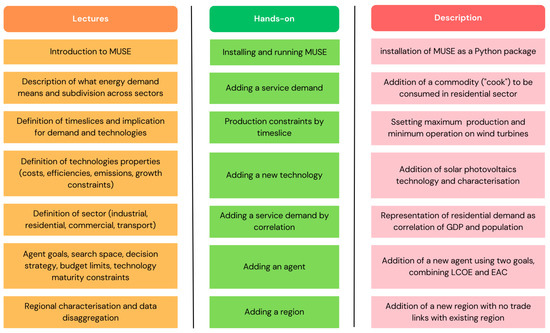
Figure 3.
Open University course structure. LCOE: levelized cost of energy; EAC: equivalent annual cost.
After the introduction, the students were guided through a set of lectures, followed by questions checking their general understanding of the lecture contents. Each lecture–quiz ensemble described an aspect of the MUSE model and how to link the modeling feature with a real-world analysis. For example, the concept of sectoral representation is key within the MUSE model.
Although different aggregations are possible, sectoral representation tends to reflect the classification that can be found in the energy balance of a country; it normally distinguishes between supply, transformation (or conversion), and consumption (or demand) of energy. In each sector, agents can be defined to model key investors or market players that may be relevant for the case study or country/region analyzed. Agents can represent typical household consumers, large/small industrial enterprises, and regulators.
Energy balances are available from different sources. They are normally compiled in national statistics, such as the UK ones https://www.gov.uk/government/statistics/energy-chapter-1-digest-of-united-kingdom-energy-statistics-dukes (accessed on 21 June 2023). Countries exchange their energy data with the International Energy Agency, which then makes available country and regional figures of energy flows for the whole world.
Hands-on exercises were available for the students to familiarize themselves with the model, through applying incremental changes to a starting demo case. The demo case was a one-region 3-sector MUSE model. This was a simplified version of the case described in [27]; differently from the article, no limits were applied to emissions, the gas sector included one technology, and some techno-economic assumptions varied. The relevant settings of the demo case are given in Table 2.
Table 2.
Demo: general settings.
Additionally, an overview of key sector-specific features is presented below:
- The technologies modeled were as follows: in the residential, sector gas boilers and heat pumps; in the power sector, combined gas turbines and wind turbines; in the supply sector, an extraction technology for gas;
- Demand was set exogenously on residential heat over six timeslices, from 2020 and linearly growing until 2050;
- A timeslice set is a subdivision of the year into intervals, useful for characterizing demand and production dynamics typical of the energy system. For example, certain regions may have harsh winter conditions, as opposed to warm summers. In these situations, a minimum of two timeslices can be recommended to model the higher heat demand in winter compared to summer. Each timeslice is characterized by a number of representative hours: this is a sum of the number of hours per day in a year where the timeslice conditions (for example “high heat demand”) are expected to occur. In the demo, representative conditions refer to 1 season, 1 representative day with 6 diurnal timeslices. The timeslice intervals are night, morning, afternoon, early peak, late peak, and evening timeslices;
- A single agent following a rational approach is modeled in each sector. The agent goal is the levelized cost of energy (LCOE). This means that while choosing among all the available technologies, the objective is to minimize the unit cost of energy. There are no constraints on the budget or maturity level of the technology (which corresponds in the model to the technology market share).
5. The Muse Track at the Summer School
Once the Open University course was completed, students could apply to the Summer School, which was held in the first half of June, with the trainer headquarters at the ICTP in Trieste and remote participation for the students.
The School Organising Committee, led by Loughbourough University, scheduled a series of daily keynote lectures. The lectures were common to all tracks. The lectures gave the students background knowledge of social, environmental, and political aspects linked to energy, energy access, and low-carbon energy. This series of lectures introduced the students to the understanding that the process towards sustainable development goes beyond carbon mitigation and involves acknowledging the fundamental role of policy and society in building a just world.
In addition to the lectures, students attended one course track for the specific software they had chosen to learn. In this paper, for example, the focus is on the MUSE model track.
The Summer School was open to the students, who after attending the Open University course, were positively selected according to the grade of their applications. The students’ applications were judged on the basis of their motivations for attending the school and their commitment to complete the school assignments. The school called for over a hundred participants from all over the world.
5.1. The MUSE Track: Overview of Participants
Among all the applications received for the MUSE track, twelve were selected. Of the twelve students who started the school, ten completed the MUSE track and obtained the certificate of attendance. Due to the super-hybrid participation of the school, student-to-student interactions were facilitated using an online platform created for the School on Gather Town by the Loughborough team. On the Gather Town online platform, selected rooms were allocated to working in groups, to presenting/lecturing, and to hosting other types of student interactions.
Most students had a background in engineering, primarily in the energy (50%) and power sectors (20%), but also in industrial, mechanical, and environmental engineering (each accounting respectively for 10% of the students). Almost 50% of the students came from Europe, with 30% from Asia and the remainder from the Americas. The students also had different interests in using the model. Many of those coming from education institutes (40%) aimed to learn the software, to integrate their curriculum with a course on education. A wide portion of students (40%) were junior researchers; two of those had previous, although short, modeling experience with the software MUSE. The remaining students came from non-academic research institutions (10%) or were senior researchers (10%).
5.2. The MUSE Track: Course Organization
The first week of the MUSE track was a consolidation of the skills gained during the Open University course; it served to familiarize the students with one another, starting to work in groups to complete the daily assignment; and it was useful to transfer the abstract model behavior into a definition of a policy-relevant case study. Each day had a coaching session (on Microsoft Teams) in the morning, focusing on a selected feature, on a daily exercise using the selected MUSE feature, and on showing the relevance of the selected feature for policy modeling. The students could meet as their working/studying schedule allowed in groups on the online platform developed on Gather Town https://www.gather.town/ (accessed on 21 June 2023) Every afternoon, the MUSE track trainer was available for a one-hour troubleshooting session during an online meeting, to advise students and answer their questions. The coaching sessions organized on Microsoft Teams were recorded and made available to the students on the same day. This helped overcome time zone differences, which prevented the participation of some students at certain times of the day.
The second week focused on case study modeling. At the beginning of the second week, the students divided into groups gave a description of their case study to their colleagues. Every day, students could meet on the online platform and were assisted by the trainer during morning and afternoon troubleshooting sessions.
The third week focused on the preparation of a policy brief and a slide-deck, to present the case study results. Every day, two troubleshooting sessions were organized, one in the morning and one in the afternoon, to assist the students with how to report the work conducted and to draw key conclusions from the study. The three groups presented their work, alongside the groups from the other track. One presentation was chosen to then represent the track at the “high-level meeting” closing event of the Summer School, before an international audience and speakers.
The students attending the MUSE track were organized into three groups, each one working on the case study the students had selected, as follows:
- decarbonization of the UK (United Kingdom) car fleet (Group 1);
- hydrogen deployment in the steel industry in the South of Italy (Group 2);
- electrification of road transport in the city of Tehran (Group 3)
The selection of the region in each case study reflected the cultural background of the participants: the case study geographical coverage matched either the provenance or the area of education of most of the participants in each team (Europe and Asia). With this choice, the students had easier access to databases and regulations. The subject of each case study was one of the policy priorities of each chosen region, which matched most of the participants’ educational interests. Thus, for example, researchers studying transport, chose transport electrification or transport net-zero strategies as a topic, whereas researchers with an energy and power system background had an interest in industrial modeling. The presence among the students of two researchers having previous experience in using the tool was a precious source of knowledge sharing with the other participants, which allowed a better understanding of the kind of assumptions to make and the kind of data sources to use in the case study implementation.
In the definition and the implementation of the case study, students’ assumptions were scrutinized with the track trainer against the model features. The students were encouraged to develop aspects which could be covered in the model capabilities but also advised to simplify hypotheses that were infeasible for the model structure. Considerations of plausible research questions needed to come from acknowledging the nature of the model, with a bottom-up and technology-rich model of the energy system, thus lacking economy-wide equilibrium modeling and specifically an equilibrium between capital, labor, and energy services, when computing economic productivity. For modeling sustainable development, it was explained to the students, also referring to existing model applications, that the representation of SDGs in MUSE with the current setup would be straightforward in terms of SDG 7 and SDG 13. However, the representation of other SDGs such as SDG 6 (on water scarcity), SDG 8 (on decent work), and SDG 16 (on land use) would require extending the data use beyond the pure energy technology aspects. Other dimensions such as SDG 1 (on stopping poverty) or SDG 2 (on eradicating hunger), could not be modeled without integration of MUSE with other more specific models.
6. The Muse Course at the Summer School: Decarbonization of the UK Car Fleet
In this section, one of the case studies developed at the Summer School for the MUSE track is presented. The case study presented considers a one-country one-sector modeling developed for the decarbonization of the car fleet in the UK.
Starting from the motivation for the case study, and continuing with methods and a discussion of the results, the research project developed by the students is presented, with a focus on the students’ experience, challenges, and the lessons learned from the school, thus reflecting a model learning curve which could be extended to other toolkits.
6.1. Context
The case study focused on the UK transport sector; more specifically, the fleet development of light-duty vehicles under different demand projections and technological progress until 2050. The selection of UK as the case study was based on, first, the relevance of the UK as a major economy, as it accounted for 1.1% of global greenhouse gas (GHG) emissions in 2020, a share equivalent to approximately 400 million tones of CO2 equivalent [38]; and, second, the availability of open data from national statistics (e.g., [39]). Regarding the transport sector’s relevance for national decarbonization plans [40], 27.0% of the country’s domestic emissions come from transportation, excluding international aviation and shipping [41], of which 55.4% originates from road passenger vehicles (i.e., cars) [42]. Currently, there are more than 32 million vehicles in the UK, which represents 400 billion vehicle-km (v-km) traveled [43] and an approximate consumption of 900 PJ per year [44].
With respect to a net-zero economy and the SDGs, the UK has committed to a reduction of 63% in GHG emissions by 2035 relative to 2019 [40]. Therefore, while traffic has been forecast to grow by between 17.0 and 51.0% by 2050 from 2015 levels [45], the UK government has announced the intention to end the sales of new petrol and diesel cars and vans by 2030 and to make it mandatory for all new cars and vans sold after 2035 to have zero tailpipe emissions [46]. These actions would make sure that the future demand is met by low-carbon alternatives. Given the presented context, the MUSE model was used to project the UK’s car technology capacity, energy consumption, emissions, and future lithium demands (assuming that electric vehicle (EV) battery technologies maintain a similar composition as today) under different scenarios.
6.2. Methodology
Considering the Summer School duration and learning purpose, students from Group 1 built a MUSE model with only one sector, representing light-duty road passenger transport. The developed model relied on a simplistic representation of the market, as only one agent and one region (i.e., the UK) were modeled. The investor–agent made decisions based on the single objective function of minimizing the LCOE. Nonetheless, the students had the opportunity to discuss the importance of having different agents representing different socio-economic groups; for instance, so as to consider the potential uneven uptake of alternative vehicles given their higher purchase costs. Commodities modeled represented fuels (input) and CO2 emissions (output). Scenarios of transport decarbonization were simulated from 2020 (base year) up to 2050 using a 5-year time step and six evenly distributed timeslices. The workflow of the case study development is represented in Figure 4, framed by the Summer School’s time span.
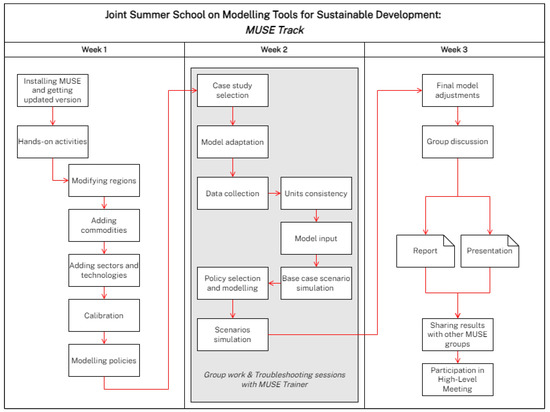
Figure 4.
Workflow of MUSE case studies during the Summer School.
After selecting the case study and modifying MUSE to accommodate its features, as shown in Figure 4, students focused on gathering data to feed the model and check their unit consistency.
6.2.1. Input Data: Initial Capacity
The group decided to measure the initial capacity of vehicles in billion v-km (bv-km), which is a measure of the traffic flow obtained by multiplying the fleet in billion vehicles (bv) by the average distance traveled (km), assumed as 15,000 km per year. The total existing capacity referred to values by the end of December 2020 [47].
6.2.2. Input Data: Demand
The demand for cars was estimated by correlating macroeconomic variables with a dataset of historical demand values, historical macroeconomic variables, and one future data point for an estimated demand of cars in 2050.
The macroeconomic variables were defined as in the shared socio-economic pathways (SSPs). SSPs are reference pathways describing plausible alternatives for the evolution of society and ecosystems over a century [48]; they are characterised by a narrative storyline which includes demographic and economic variables and induces a certain socio-economic development. Among the macroeconomic variables, which mainly affect energy demand, population, gross domestic product (GDP), interest rates, and exchange rates, have a primary role [49]. Specifically for the transport demand modelling, GDP and population were the only variables considered [48], since they highly affect interest and exchange rates. Referring to the UK case study, GDP, and population data up to 2020 were obtained from [50,51], population and GDP projections between 2020 and up to 2100 were retrieved from [49]. These quantities were employed without considering seasonal or monthly variability.
The historical demand was retrieved from [44]; it showed (i) an increasing number of registered vehicles from 1949 up until 2019 [44], and a post-pandemic rise in registered cars in 2020 (nearly reaching 1990 values)).
The future increase in car demand by 2050 is expected to be between 17% and 51% by 2050 with respect to 2015 values [45])
The demand for cars (D), expressed in Bv-km, was modeled as a logistic regression Sigmoid function, with the parameters A1, A2, X0, and L shown in the equation below:
Assuming in the regression, an increase in car volumes by 2050 equal to 51% with respect to 2015 values [45], the regressed parameters for the demand estimation are reported in Table 3.
Table 3.
Coefficient of the sigmoid function.
6.2.3. Input Data: Technologies
The technologies included in the model are presented in Table 4, along with their respective initial market share and related assumptions. Information about initial capacities was retrieved from the vehicle licensing national statistics [39] and data statistics for electric vehicles [52]. It was assumed that diesel and gasoline cars belonged to three different efficiency categories, namely, high-efficiency (HE), medium-efficiency (ME), and low-efficiency, representing the age of the fleet and respective Euro standards. Older cars, having lower efficiencies, were assumed to be equivalent to Euro-1 and -2 cars and expected to be “decommissioned” without integrating into the new fleet in the following years. ME cars represent Euro-3 and -4 standards, whereas HE represent new cars of Euro-5 and -6 standards that will be decommissioned after complying with a assumed technology lifetime of 15 years. In addition, purchase prices, i.e., capital costs, and fixed operation and maintenance costs were estimated for each technology from 2020 to 2050 according to [49], adjusting the input data to the UK.
Table 4.
Technologies considered in the model and related assumptions.
6.2.4. Input Data: Prices
Historical fuel prices up to 2022 and projections up to 2050 were used as input for the model (Table 5).
Table 5.
Prices, measured as MUSD/PJ of fuel or MUSD/ton CO2 respectively for fuels and for CO2.
Historical prices were retrieved for gasoline and diesel from the UK road fuel price statistics, which are based on average retail pump prices [53]. Electricity and gas prices were gathered from the Digest of United Kingdom Energy Statistics (DUKES) [54] published by the Department for Business, Energy & Industrial Strategy (BEIS). Compressed natural gas (CNG) and liquefied petroleum gas (LPG) prices, which are not published by the UK government, were gathered from other sources [55,56]. Price projections were obtained by applying the growth rate reported by the Annual Energy Outlook 2021 (https://www.eia.gov/outlooks/aeo/pdf/AEO_Narrative_2021.pdf, accessed on 21 June 2023) for all fuels, except for hydrogen, whose prices were gathered from [57].
A price for carbon was assigned simulating the continuation of current carbon policies in the energy system, from those in force currently, up to 2050 (Table 6) [36].
Table 6.
Carbon prices estimations. Source: [36].
6.2.5. Input Data: Emissions
For each fuel, tailpipe CO2 emissions per unit of energy (ktons/PJ) were considered, assigning to electricity and hydrogen a value of zero, whereas the remaining fuel emissions were retrieved from [58]. The values used are reported in Table 7.
Table 7.
Different fuels and their CO2 emission factors. Source: [58].
6.3. Scenarios
Four different scenarios were built, including base case assumptions, technological developments, and the UK’s road transport policies (Table 8). The main characteristics of each scenario are summarized as follows:
Table 8.
Scenario descriptions and acronyms used.
- The business-as-usual (BAU) scenario assumed that purchasing prices, fixed annual costs, and fuel costs remained the same as 2020 values;
- Scenario 1 (S1) took into consideration the possible future development of technology efficiency and costs. Technology efficiency improvements by technology are presented in Table 9;
Table 9. Technology improvements expressed as a time-averaged reduction in fuel consumption from 2020 through 2050.
- Starting with S1 assumptions, Scenario 2 (S2) considered internal combustion engine (ICE) and hybrid vehicles being limited to zero from 2030 and 2040 onward, following government plans to cease ICE sales [46]. In addition, a carbon price (see Table 6) was introduced starting from 2025;
- Starting with S2 assumptions, Scenario 3 (S3) applied a cap for the BEVs’ total capacity according to estimations presented in the Sixth Carbon Budget [40].
6.4. Results
After collecting the data necessary for modeling the case study in MUSE and clarifying questions during the troubleshooting sessions carried out during the 2nd week of the Summer School, the students simulated the selected scenarios (Table 8). While MUSE allows the user to add input and output files, the results presented here are some of the default MUSE outputs; namely, the total number of vehicles, emissions, and capital costs. A post-analysis was also performed to evaluate the lithium demand of each scenario.
Each scenario narrative (BAU, S1, S2, S3) was assigned a future traffic demand, considering an increase in traffic volume equal to 51%, indicated with the suffix “51” next to the scenario name. It is worth mentioning that, a hypothetical case in which no technology efficiency improvement occurs, i.e., the values remain the same as in 2020, was considered (BAU_51 scenario).
The results are reported in Figure 5, showing the dynamic evolution of the car fleet from 2020 to 2050 and the corresponding emissions, and in Figure 6, displaying the share of vehicles of each technology of the total number of cars for the years 2030 and 2050.
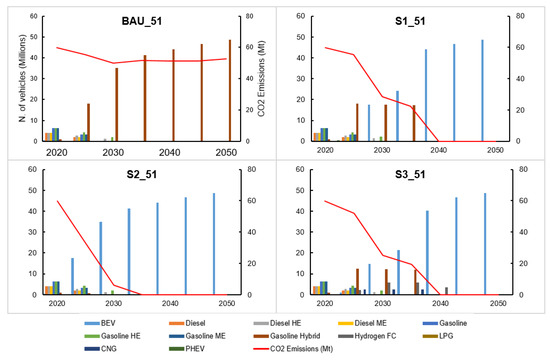
Figure 5.
Scenario comparison: number of vehicles by technology (principal axis) and total CO2 emissions (secondary axis) from 2020 through 2050 in each scenario.
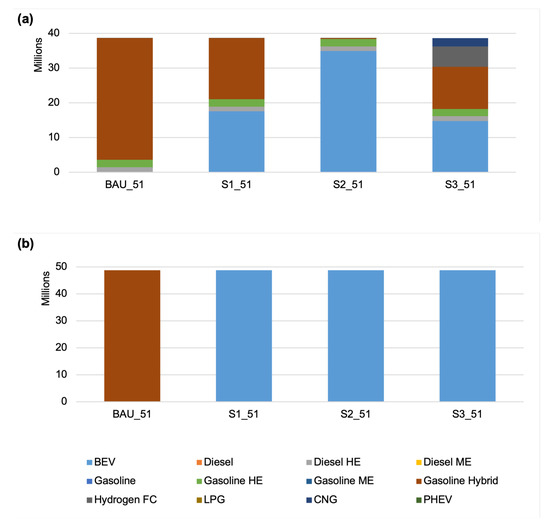
Figure 6.
Fleet composition: share of vehicle by technology in 2030 (a) and 2050 (b) in each scenario.
6.4.1. Fleet Composition
In Figure 5, there is a dominance of hybrid gasoline cars in the BAU_51 scenarios because of the better fuel efficiency of the technology (70% of HE gasoline vehicles) and the higher costs of alternative vehicles.
S1_51 shows the deployment of BEVs by 2030, due to cost and technology improvements over time. This technological choice drastically reduced tailpipe CO2 emissions by 2030, reaching zero in 2040 in S1. While this BEV uptake may seem exaggerated, historical trends show that incentives provided by the UK government summed to a reduction in battery costs have considerably increased the sales of BEVs and PHEVs [59]. BEV registrations, for instance, increased by 184% between 2019 and 2020 as consumers increasingly chose to switch to lower emitting technologies [60].
In S2_51, BEVs started being deployed earlier than in S1, due to the addition of a carbon price from 2025 onward. The scenario reached zero emissions in 2035; overall, resulting in a greatly accelerated decarbonization process.
When the addition of BEVs was limited in S3_51 as proposed in the Sixth Carbon Budget [40], hydrogen FC vehicles appeared in the fleet from 2025 to 2040 as an alternative zero-emission technology. S3 reached zero emissions in 2040, in agreement with the UK Government plans, according to which transport emissions must fall by 70% in the mid-2030s in comparison to 2020 levels [40].
Figure 6, focusing on the fleet composition changes between 2030 and 2050 across the scenarios analyzed, shows again that all the scenarios, except BAU, had 100% BEV in 2050. More interestingly, all the scenarios, except BAU_51, had at least 30% of BE penetration by 2030. A fleet composition in line with the UK targets would see some hydrogen FC cars already by 2030, making up for the constraints on BEVs; the rest of the fleet would still see petrol/diesel cars, hybrid cars, and CNG.
6.4.2. Capital Costs
As for the total capital costs, BAU_51 was more expensive, as it was assumed that technology purchase prices remained equal to 2020 value. The remaining scenarios (S1_51, S2_51, and S3_51) shared a similar reduction in technologies prices, especially low-carbon ones.
6.4.3. Reality Check on Lithium Demand
Concerning the lithium demand associated with the future BEV capacity addition, a post-analysis considering a weight of 5 kg of lithium per 50 kWh BEV [57] showed that only scenarios S1_51 and S3_51 had demands of approximately 200 kt in 2040, befitting the forecasts made by the International Energy Agency in their Sustainable Development global scenario, in which 1063.3 kt of lithium would be required in 2040 [57]. However, the estimated lithium quantities were relatively high considering the UK’s car fleet volume in comparison to China or US [61]. Nonetheless, technological improvements are expected to occur as a means to reduce transport electrification’s reliance on lithium.
6.5. Remarks
In the last week of the Summer School, the group discussed the main conclusions and potential improvements to the model. The proposed case study aimed to evaluate plausible scenarios for the UK road passenger sector decarbonization, considering the commitments made by the government and forecasts for electric vehicles’ (EVs) market share. Under these assumptions, Group 1 concluded that the UK policies were aligned with the achievement of a zero-emission tailpipe transport sector. Nonetheless, students also noted the sensitivity of the model to technology cost and efficiency. Model outputs needed to undergo “reality checks” regarding the amount of lithium required for batteries.
The future research agenda for the further extension of the proposed case study would include adding more consumer-agents and associating them with specific goals, and representing the diverse attitudes of consumers.
7. Conclusions and Outlook
This paper describes the MUSE (ModUlar energy system Simulation Environment) model course, conceived as an Open University course first and later as a training track at the Joint Summer School on Modelling Tools for Sustainable development, held in Trieste (Italy) in 2022.
This work contributes to consolidating methods for education and training for capacity building within the remit of the resource–energy nexus and aiming for sustainable development. In fact, this work presents course structure and school track organization of a newly developed open-source integrated assessment model (IAM). These kinds of model (open-source models for energy system planning) are expected to grow in relevance and use, for the training of future professionals in the development and deployment of low-carbon technologies. From the students’ perspective, the course was evaluated, first, in terms of the preparatory material for the lectures, quizzes, and hands-on activities before the Summer School and, later, in terms of the Summer School course itself. As emerged from the evaluation forms and the comments from the participants on the closing day of the School, the course proved to be successful. The positive outcome was reflected, not only in the low drop-out rate of the course, but also in the comments on the quality and quantity of the learning process, also coming from participants who had not had previous exposure to energy system modeling.
7.1. Case Study: Challenges
Key challenges which have emerged as the students worked on the case studies were
- adapting the available data from the national energy balance data to MUSE;
- searching for reliable technological data to be used to project costs;
- understanding of the model workflow, especially during the initial attempts at model formulations, when problems in unit conversion caused output inconsistencies.
7.2. Case Study: Lessons Learned
In addition to how to use the MUSE model, how to perform a critical evaluation of techno-economic and socio-economic datasets, and how to implement basic instructions in Python, the students learned how to approach energy-related modeling problems. In fact, the process that included data gathering for energy demand modeling, for technology cost estimation, and policy implementation is a generic “recipe”, valid in any future energy modeling exercise.
The students also understood the importance of making modeling results policy-relevant. After the evaluation of result consistency, energy modeling efforts can only impact policy making when translating the results into accessible forms of communication for the stakeholders.
7.3. Next Steps
In view of the challenges highlighted by the students, future energy modeling courses and, specifically, on the MUSE model could expand in these areas:
- preparing the students to use energy balances, becoming familiar with the terminology used in the national energy balance sheets, and extracting the databases inputs for the model in a consistent format;
- preparing the students about the relevance of uncertainty estimation, especially in techno-economic data, and its implications for modeling result communication;
- improving the description of the model workflow.
Author Contributions
Conceptualization, S.G.; Data curation, S.S., M.C. and A.D.-O.; Formal analysis, A.K., M.C. and A.D.-O.; Funding acquisition, A.H.; Methodology, S.G., A.K., S.S., M.C. and A.D.-O.; Project administration, A.H.; Software, S.G. and A.K.; Supervision, S.G. and P.L.; Validation, S.G.; Writing—original draft, S.G., M.C. and A.D.-O.; Writing—review and editing, S.G., S.S., P.L. and A.H. All authors have read and agreed to the published version of the manuscript.
Funding
SG has received funding from the European Union’s HORIZON EUROPE Research and Innovation Programme under the Marie Skłodowska Curie grant agreement project No. 101033173. ADO gratefully acknowledges the financial support of “Fundação para a Ciência e Tecnologia” (FCT – Portugal) through the Ph.D. Grant 2022.11468.BD. The authors also thank the IAM COMPACT project, which have received funding from the European Union’s HORIZON EUROPE Research and Innovation Programme under grant agreement no. 101056306.
Data Availability Statement
The data used for the model case studies can be found on the MUSE Lab GitHub repository (https://github.com/SGIModel/MUSE_Lab). The structure is consistent with a typical MUSE model structure, MUSE version 1.0.1 and MUSE version 1.0.2, and can be run directly from the command line with the muse command (“python -m muse” (version 1.0.1) or “muse” (version 1.0.2) followed by the path to the settings.toml of the scenario of interest.
Conflicts of Interest
The authors declare no conflict of interest.
Abbreviations
The following abbreviations are used in this manuscript:
| Acronyms | |
| Agent-Based Model | |
| business-as-usual | |
| Department for Business, Energy | |
| & Industrial Strategy | |
| Battery Electric Vehicles | |
| Climate Compatible Growth | |
| Compressed Natural Gas | |
| Equivalent Annual Cost | |
| Energy Balance Studio | |
| Electric Vehicles | |
| Fuel Cell | |
| Model for Financial Analysis of Electric | |
| Sector Expansion Plans | |
| Global Electrification Platform | |
| Greenhouse Gas(es) | |
| Geospatial Information System | |
| gross domestic product | |
| high efficiency | |
| Integrated Assessment Model(s) | |
| internal combustion engine | |
| medium efficiency | |
| low efficiency | |
| International Centre for Theoretical Physics | |
| Intergovernmental Panel on Climate Change | |
| Levelised Cost of Energy | |
| Liquefied Petroleum Gas | |
| Model for Analysis of Energy Demand | |
| Market Clearing Algorithm | |
| ModUlar energy system Simulation Environment | |
| Open Source Spatial Electrification Tool | |
| Open Source Energy Modelling System | |
| plug-in hybrid electric vehicles | |
| Sustainable Development Goal(s) | |
| Socioeconomic Pathway(s) | |
| Scenario 1 | |
| Scenario 2 | |
| Scenario 3 | |
| United Kingdom | |
| United Nations | |
| United Nations Educational, Scientific and Cultural Organization |
References
- United Nations. Agenda of Sustainable Development Goals 2030; United Nations: New York, NY, USA, 2015; Available online: https://sdgs.un.org/goals (accessed on 21 June 2023).
- Pörtner, H.-O.; Roberts, D.C.; Poloczanska, E.S.; Mintenbeck, K.; Tignor, M.; Alegría, A.; Craig, M.; Langsdorf, S.; Löschke, S.; Möller, V.; et al. (Eds.) Summary for policy makers. In Climate Change 2022: Impacts, Adaptation, and Vulnerability. Contribution of Working Group II to the Sixth Assessment Report of the Intergovernmental Panel on Climate Change; IPCC: Geneva, Switzerland, 2022; pp. 3–33. Available online: https://www.ipcc.ch/report/ar6/wg2 (accessed on 21 June 2023).
- UNESCO. Education for Sustainable Development: A Roadmap; UNESCO: Paris, France, 2019; Available online: https://unesdoc.unesco.org/ark:/48223/pf0000374802 (accessed on 21 June 2023).
- United Nations. The Paris Agreement; United Nations Climate Change: New York, NY, USA, 2015; Available online: https://unfccc.int/process-and-meetings/the-paris-agreement (accessed on 21 June 2023).
- Leicht, A.; Heiss, J.; Byun, W. Issues and Trends in Education for Sustainable Development; UNESCO: Paris, France, 2018; Available online: https://unesdoc.unesco.org/ark:/48223/pf0000261445 (accessed on 21 June 2023).
- Filho, W.; Shiel, C.; Paço, A.; Mifsud, M.; Ávila, L.; Brandli, L.; Molthan-Hill, P.; Pace, P.; Azeiteiro, U.; Vargas, V.; et al. Sustainable Development Goals and sustainability teaching at universities: Falling behind or getting ahead of the pack? J. Clean. Prod. 2019, 232, 285–294. [Google Scholar] [CrossRef]
- Guivarch, C.; Le Gallic, T.; Bauer, N.; Fragkos, P.; Huppmann, D.; Jaxa-Rozen, M.; Keppo, I.; Kriegler, E.; Krisztin, T.; Marangoni, G.; et al. Using large ensembles of climate change mitigation scenarios for robust insights. Nat. Clim. Chang. 2022, 12, 428–435. [Google Scholar] [CrossRef]
- Leal Filho, W.; Frankenberger, F.; Salvia, A.; Azeiteiro, U.; Alves, F.; Castro, P.; Will, M.; Platje, J.; Lovren, V.; Brandli, L.; et al. A framework for the implementation of the Sustainable Development Goals in university programmes. J. Clean. Prod. 2021, 299, 126915. [Google Scholar] [CrossRef]
- O’Brien, K.; Reams, J.; Caspari, A.; Dugmore, A.; Faghihimani, M.; Fazey, I.; Hackmann, H.; Manuel-Navarrete, D.; Marks, J.; Miller, R.; et al. You say you want a revolution? Transforming education and capacity building in response to global change. Environ. Sci. Policy 2013, 28, 48–59. [Google Scholar] [CrossRef]
- Cornell, S.; Berkhout, F.; Tuinstra, W.; Tàbara, J.; Jäger, J.; Chabay, I.; Wit, B.; Langlais, R.; Mills, D.; Moll, P.; et al. Opening up knowledge systems for better responses to global environmental change. Environ. Sci. Policy 2013, 28, 60–70. [Google Scholar] [CrossRef]
- Boarin, P.; Martinez-Molina, A. Integration of environmental sustainability considerations within architectural programmes in higher education: A review of teaching and implementation approaches. J. Clean. Prod. 2022, 342, 130989. [Google Scholar] [CrossRef]
- Beynaghi, A.; Trencher, G.; Moztarzadeh, F.; Mozafari, M.; Maknoon, R.; Filho, W. Future sustainability scenarios for universities: Moving beyond the United Nations Decade of Education for Sustainable Development. J. Clean. Prod. 2016, 112, 3464–3478. [Google Scholar] [CrossRef]
- Hermann, R.; Bossle, M. Bringing an entrepreneurial focus to sustainability education: A teaching framework based on content analysis. J. Clean. Prod. 2020, 246, 119038. [Google Scholar] [CrossRef]
- Sahakian, M.; Seyfang, G. A sustainable consumption teaching review: From building competencies to transformative learning. J. Clean. Prod. 2018, 198, 231–241. [Google Scholar] [CrossRef]
- Elavarasan, R.; Pugazhendhi, R.; Jamal, T.; Dyduch, J.; Arif, M.; Kumar, N.; Shafiullah, G.; Chopra, S.; Nadarajah, M. Envisioning the UN Sustainable Development Goals (SDGs) through the lens of energy sustainability (SDG 7) in the post-COVID-19 world. Appl. Energy 2021, 292, 116665. [Google Scholar] [CrossRef]
- Pailman, W.; Groot, J. Rethinking education for SDG 7: A framework for embedding gender and critical skills in energy access masters programmes in Africa. Energy Res. Soc. Sci. 2022, 90, 102615. [Google Scholar] [CrossRef]
- Colenbrander, S.; Lovett, J.; Abbo, M.; Msigwa, C.; M’Passi-Mabiala, B.; Opoku, R. Renewable energy doctoral programmes in sub-Saharan Africa: A preliminary assessment of common capacity deficits and emerging capacity-building strategies. Energy Res. Soc. Sci. 2015, 5, 70–77. [Google Scholar] [CrossRef]
- Araújo, O.; De Medeiros, J. Sustainable and equitable decarbonization. Clean Technol. Environ. Policy 2022, 24, 1945–1947. [Google Scholar] [CrossRef]
- McCauley, D.; Heffron, R. Just transition: Integrating climate, energy and environmental justice. Energy Policy 2018, 119, 1–7. [Google Scholar] [CrossRef]
- Vandenbussche, T. A Just Energy Transition: Tapping into a Century of Ideas. European Policy Center (EPC). 2021. Available online: https://www.epc.eu/content/PDF/2021/Energy_transition_DP.pdf (accessed on 21 June 2023).
- KTH Open Source Spatial Electrification Tool. 2023. Available online: https://github.com/OnSSET/onsset (accessed on 21 June 2023).
- World Bank Group. The Global Electrification Platform. 2023. Available online: https://electrifynow.energydata.info (accessed on 21 June 2023).
- Löffler, K.; Hainsch, K.; Burandt, T.; Oei, P.; Kemfert, C.; Von Hirschhausen, C. Designing a Model for the Global Energy System—GENeSYS-MOD: An Application of the Open-Source Energy Modeling System (OSeMOSYS). Energies 2017, 10, 1468. [Google Scholar] [CrossRef]
- Shafiqul, I.; Bhuiyan, T. Assessment of costs of nuclear power in Bangladesh. Nucl. Energy Technol. 2020, 6, 181–194. [Google Scholar] [CrossRef]
- Mpholo, M.; Mothala, M.; Mohasoa, L.; Eager, D.; Thamae, R.; Molapo, T.; Jardine, T. Lesotho electricity demand profile from 2010 to 2030. J. Energy S. Afr. 2021, 32, 41–57. [Google Scholar] [CrossRef]
- Howells, M.; Hermann, S.; Welsch, M.; Bazilian, M.; Segerström, R.; Alfstad, T.; Gielen, D.; Rogner, H.; Fischer, G.; Van Velthuizen, H.; et al. Integrated analysis of climate change, land-use, energy and water strategies. Nat. Clim. Chang. 2013, 3, 621–626. [Google Scholar] [CrossRef]
- Giarola, S.; Sachs, J.; D’Avezac, M.; Kell, A.; Hawkes, A. MUSE: An open-source agent-based integrated assessment modelling framework. Energy Strategy Rev. 2022, 44, 100964. [Google Scholar] [CrossRef]
- Crow, D.; Giarola, S.; Hawkes, A. A dynamic model of global natural gas supply. Applied Energy 2018, 218, 452–469. [Google Scholar] [CrossRef]
- García Kerdan, I.; Jalil-Vega, F.; Toole, J.; Gulati, S.; Giarola, S.; Hawkes, A. Modelling cost-effective pathways for natural gas infrastructure: A southern Brazil case study. Appl. Energy 2019, 255, 113799. [Google Scholar] [CrossRef]
- García Kerdan, I.; Giarola, S.; Hawkes, A. A novel energy systems model to explore the role of land use and reforestation in achieving carbon mitigation targets: A Brazil case study. J. Clean. Prod. 2019, 232, 796–821. [Google Scholar] [CrossRef]
- Sachs, J.; Meng, Y.; Giarola, S.; Hawkes, A. An agent-based model for energy investment decisions in the residential sector. Energy 2019, 172, 752–768. [Google Scholar] [CrossRef]
- Huntington, H.; Bhargava, A.; Daniels, D.; Weyant, J.; Avraam, C.; Bistline, J.; Edmonds, J.; Giarola, S.; Hawkes, A.; Hansen, M.; et al. Key findings from the core North American scenarios in the EMF34 intermodel comparison. Energy Policy 2020, 144, 111599. [Google Scholar] [CrossRef]
- Brown, M.; Siddiqui, S.; Avraam, C.; Bistline, J.; Decarolis, J.; Eshraghi, H.; Giarola, S.; Hansen, M.; Johnston, P.; Khanal, S.; et al. North American energy system responses to natural gas price shocks. Energy Policy 2020, 149, 112046. [Google Scholar] [CrossRef]
- Giarola, S.; Molar-Cruz, A.; Vaillancourt, K.; Bahn, O.; Sarmiento, L.; Hawkes, A.; Brown, M. The role of energy storage in the uptake of renewable energy: A model comparison approach. Energy Policy 2020, 151, 112159. [Google Scholar] [CrossRef]
- Budinis, S.; Sachs, J.; Giarola, S.; Hawkes, A. An agent-based modelling approach to simulate the investment decision of industrial enterprises. J. Clean. Prod. 2020, 267, 121835. [Google Scholar] [CrossRef]
- Sognnaes, I.; Gambhir, A.; Van De Ven, D.; Nikas, A.; Anger-Kraavi, A.; Bui, H.; Campagnolo, L.; Delpiazzo, E.; Doukas, H.; Giarola, S.; et al. A multi-model analysis of long-term emissions and warming implications of current mitigation efforts. Nat. Clim. Chang. 2021, 11, 1055–1062. [Google Scholar] [CrossRef]
- Van De Ven, D.; Mittal, S.; Gambhir, A.; Lamboll, R.; Doukas, H.; Giarola, S.; Hawkes, A.; Koasidis, K.; Köberle, A.; McJeon, H.; et al. A multimodel analysis of post-Glasgow climate targets and feasibility challenges. Nat. Clim. Chang. 2023, 13, 570–578. [Google Scholar] [CrossRef]
- Paul, B. UK and Global Emissions and Temperature Trends. House of Commons Library. 2021. Available online: https://commonslibrary.parliament.uk/uk-and-global-emissions-and-temperature-trends/ (accessed on 21 June 2023).
- Department for Transport and Driver and Vehicle Licensing Agency Vehicles Statistics. HM Government. Available online: https://www.gov.uk/government/statistics/vehicle-licensing-statistics-2020 (accessed on 21 June 2023).
- Climate Change Committee. The Sixth Carbon Budget—The UK’s Path to Net Zero. 2020. Available online: https://www.theccc.org.uk/wp-content/uploads/2020/12/The-Sixth-Carbon-Budget-The-UKs-path-to-Net-Zero.pdf (accessed on 21 June 2023).
- BEIS 2019 UK Greenhouse Gas Emissions, Final Figures. Department for Business, Energy. 2021. Available online: https://assets.publishing.service.gov.uk/government/uploads/system/uploads/attachment_data/file/957887/2019_Final_greenhouse_gas_emissions_statistical_release.pdf (accessed on 21 June 2023).
- Department for Transport. Decarbonising Transport: A Better, Greener Britain. Department for Transport. 2021. Available online: https://assets.publishing.service.gov.uk/government/uploads/system/uploads/attachment_data/file/1009448/decarbonising-transport-a-better-greener-britain.pdf (accessed on 21 June 2023).
- Department for Transport. Road Traffic Statistics. Department for Transport. Available online: https://roadtraffic.dft.gov.uk/#6/55.254/-6.053/basemap-regions-countpoints (accessed on 21 June 2023).
- BEIS Energy Consumption in the UK (ECUK) 1970 to 2020. Department for Business, Energy. 2021. Available online: Energy%20Consumption%20in%20the%20UK%20(ECUK)%201970%20to%202020%20million%20tonnes%20of%20oil%20equivalent%20Industry%20Transport%20Services%20Domestic (accessed on 21 June 2023).
- Department for Transport. Road Traffic Forecasts 2018. Department for Transport. 2018. Available online: https://www.gov.uk/government/publications/road-traffic-forecasts-2018 (accessed on 21 June 2023).
- Department for Transport. Green Paper on a New Road Vehicle CO2 Emissions Regulatory Framework for the United. Department for Transport. 2021. Available online: https://assets.publishing.service.gov.uk/government/uploads/system/uploads/attachment_data/file/1007466/green-paper-on-a-new-road-vehicle-CO2-emissions-regulatory-framework-for-the-United-Kingdom-web-version.pdf (accessed on 21 June 2023).
- Department for Transport and Driver and Vehicle Licensing Agency Vehicle Licensing Statistics Data Tables. HM Government. 2022. Available online: https://www.gov.uk/government/statistical-data-sets/vehicle-licensing-statistics-data-tables (accessed on 21 June 2023).
- O’Neill, B.; Kriegler, E.; Riahi, K.; Ebi, K.; Hallegatte, S.; Carter, T.; Mathur, R.; Van Vuuren, D. A new scenario framework for climate change research: The concept of shared socioeconomic pathways. Clim. Chang. 2014, 122, 387–400. [Google Scholar] [CrossRef]
- Giarola, S.; Mittal, S.; Vielle, M.; Perdana, S.; Campagnolo, L.; Delpiazzo, E.; Bui, H.; Kraavi, A.; Kolpakov, A.; Sognnaes, I.; et al. Challenges in the harmonisation of global integrated assessment models: A comprehensive methodology to reduce model response heterogeneity. Sci. Total. Environ. 2021, 783, 146861. [Google Scholar] [CrossRef] [PubMed]
- FRED Constant GDP per Capita for the United Kingdom. Federal Reserve Bank of St. Louis. Available online: https://fred.stlouisfed.org/series/NYGDPPCAPKDGBR (accessed on 21 June 2023).
- FRED Population in the United Kingdom (POPUKA). Federal Reserve Bank of St. Louis. Available online: https://fred.stlouisfed.org/series/POPUKA (accessed on 21 June 2023).
- SMMT SMMT VEHICLE DATA—EV & AFV Registrations—Electric Vehicle and Alternatively Fuelled Vehicle Registrations. SMMT. Available online: https://www.smmt.co.uk/vehicle-data/evs-and-afvs-registrations/ (accessed on 21 June 2023).
- Department for Energy Security and Net Zero and Department for Business, Energy & Industrial Strategy Road Fuel and Other Petroleum Product Price Statistics. HM Government. Available online: https://www.gov.uk/government/collections/road-fuel-and-other-petroleum (accessed on 21 June 2023).
- Department for Energy Security and Net Zero and Department for Business, Energy & Industrial Strategy Digest of UK Energy Statistics (DUKES). HM Government. Available online: https://www.gov.uk/government/collections/digest-of-uk-energy-statistics-dukes (accessed on 21 June 2023).
- MyLPG Chart of Fuel Prices in United Kingdom. myLPG. Available online: https://www.mylpg.eu/stations/united-kingdom/prices/ (accessed on 21 June 2023).
- CNG Europe. Great Britain CNG Filling Stations. CNG Europe. 2018. Available online: https://cngeurope.com/countries/great-britain/ (accessed on 21 June 2023).
- IRENA. Green Hydrogen Cost Reduction: Scaling up Electrolysers to Meet the 1.5 °C Climate Goal. IRENA. 2020. Available online: https://www.irena.org/-/media/Files/IRENA/Agency/Publication/2020/Dec/IRENA_Green_hydrogen_cost_2020.pdf (accessed on 21 June 2023).
- Gómez, D.; Watterson, J.; Americano, B.; Ha, C.; Marland, G.; Matsika, E.; Namayanga, L.; Osman-Elasha, B.; Kalenga Saka, J.; Treanton, K. Chapter 2: Stationary Combustion. IPCC. 2006. Available online: https://www.ipcc-nggip.iges.or.jp/public/2006gl/pdf/2_Volume2/V2_2_Ch2_Stationary_Combustion.pdf (accessed on 21 June 2023).
- BloombergNEF. Battery Pack Prices Fall as Market Ramps Up with Market Average at 156/kWh in 2019. BloombergNEF. 2019. Available online: https://about.bnef.com/blog/battery-pack-prices-fall-as-market-ramps-up-with-market-average-at-156-kwh-in-2019/ (accessed on 21 June 2023).
- HM Government. Transitioning to Zero Emission Cars and Vans: 2035 Delivery Plan. HM Government. 2021. Available online: https://www.gov.uk/government/publications/transitioning-to-zero-emission-cars-and-vans-2035-delivery-plan (accessed on 21 June 2023).
- Shafique, M.; Rafiq, M.; Azam, A.; Luo, X. Material flow analysis for end-of-life lithium-ion batteries from battery electric vehicles in the USA and China. Resour. Conserv. Recycl. 2022, 178, 106061. [Google Scholar] [CrossRef]
Disclaimer/Publisher’s Note: The statements, opinions and data contained in all publications are solely those of the individual author(s) and contributor(s) and not of MDPI and/or the editor(s). MDPI and/or the editor(s) disclaim responsibility for any injury to people or property resulting from any ideas, methods, instructions or products referred to in the content. |
© 2023 by the authors. Licensee MDPI, Basel, Switzerland. This article is an open access article distributed under the terms and conditions of the Creative Commons Attribution (CC BY) license (https://creativecommons.org/licenses/by/4.0/).