Article

Using Central Composite Design to Improve Methane Production from Anaerobic Digestion of Tomato Plant Waste

by
Graciela M. L. Ruiz-Aguilar
1,
Juan H. Martínez-Martínez
2,
Rogelio Costilla-Salazar
1 and
Sarai Camarena-Martínez
1,*
1
Departamento de Ciencias Ambientales, División Ciencias de la Vida, Campus Irapuato-Salamanca, Universidad de Guanajuato, Irapuato 36500, Mexico
2
Departamento de Ingeniería en Energías Renovables, Tecnológico Nacional de México/ITS de Abasolo, Abasolo 36976, Mexico
*
Author to whom correspondence should be addressed.
Energies 2023, 16(14), 5412; https://doi.org/10.3390/en16145412
Submission received: 13 June 2023 / Revised: 4 July 2023 / Accepted: 13 July 2023 / Published: 16 July 2023

Abstract

:
Tomato plant waste (TPW) is a significant agricultural byproduct that has been often underutilized. Recent studies have shown that its use to obtain methane in an anaerobic digestion (AD) process is viable. However, there is not much information available on studies to improve methane production from this substrate using statistical methods for optimization processes such as central composite design (CCD). For this investigation, CCD was adopted to analyze the effect of S/I ratio (substrate/inoculum ratio) (0.32–1.12), temperature (27–43 °C), and inoculum concentration (10.35–20.95 g VS/L) on methane generation and volatile solids (VS) removal in a batch AD system mono-digestion of TPW. The highest average value of methane yield was found to be 210.8 mL CH4/g VS (S/I ratio 0.48, 40 °C, and 18.80 g VS/L), and the highest average value of VS removal was found to be 36.9% (S/I ratio 1.12, 35 °C, and 15.65 g VS/L). We obtain a model with a better fit for the VS removal (R2 = 0.9587) than for the methane production (R2 = 0.9156). Temperature and S/I ratio were the factors most important for methane production and VS removal, respectively.

1. Introduction

Energy production through anaerobic digestion (AD) from agricultural waste has been considered an attractive technology because it requires less investment and can be carried out under ambient conditions compared to other waste treatment technologies [1,2]. This approach has the potential to benefit farmers by providing an additional source of income by utilizing waste materials that would otherwise be discarded. It helps reduce greenhouse gas emissions by capturing and utilizing methane, and it provides a renewable energy source that can be used to generate electricity or heat. This method could contribute to the development of more efficient and sustainable agricultural practices that benefit both farmers and the environment.
Tomato plant waste (TPW), which includes stems, leaves, and other plant parts, is a significant agricultural byproduct that is often underutilized. Tomato is one of the main greenhouse crops worldwide, and it is estimated that it generates 3.5 kg/m2 of vegetable waste [3]. Recent studies have shown that this waste material can be used for the production of methane through AD, but in most of these studies, the tomato plant was used in co-digestion with other residues or mixed with the fruit of the tomato plant [4,5]. Nevertheless, the option of co-digestion may not always be possible.
Our work team has performed experiments to investigate the mono-digestion of tomato plant waste for hydrogen and methane production in a two-stage process, and its feasibility to be used as a mono-substrate in an AD process has been proven [6].
In order to increase the yields of an AD process from this substrate, it is necessary to evaluate different control parameters. Central composite design (CCD) is a statistical optimization method used to study the effects of multiple factors on a process. This method allows for the identification of optimal conditions for a particular process while minimizing the number of experimental trials required. CCD has been used to optimize methane production from substrates such as rice straw [7,8,9,10], cotton stalk [11], wheat straw [12], and sugarcane bagasse [13]. In optimization AD studies, it has been reported that temperature, substrate/inoculum ratio (S/I ratio), C/N ratio, initial pH, organic loading, amount of substrate, and amount of inoculum have an important effect on methane production [7,8,9,10,11,12,13,14,15,16,17].
On the other hand, limited information is available regarding the optimization of volatile solids (VS) removal in anaerobic digestion studies focused on agricultural residues. Zhang et al. [11] conducted a study examining the utilization of cotton stalk as a substrate. They employed a second-order model to establish the relationship between volatile solids removal and independent variables: feed-to-inoculum (F/I) ratio and organic loading (OL). To the best of our knowledge, there is no existing model that explains volatile solids removal using tomato plant waste.
For this investigation, CCD was adopted to analyze the effect of batch design operational parameters (S/I ratio, temperature, and inoculum concentration) on methane generation and volatile solids removal in an anaerobic mono-digestion of TPW.

2. Materials and Methods

2.1. Substrate

The substrate used in this study comprised the above-ground portion (stem and leaves) of tomato plants, specifically the Saladette variety. The plant waste was obtained from the Agrifood Expo, situated in Irapuato, Guanajuato, Mexico. To prepare the substrate, the plant material was air-dried under natural sunlight conditions at an average temperature of 20 ± 8 °C for a period of 15 days until it reached a moisture content of approximately 8 ± 3%. Following drying, the plant material was processed into a powder using an agricultural hammer mill and stored at ambient temperature until needed. Subsequently, a 200 g sample of the dried plant material was further pulverized using a cereal and grain mill manufactured by SURTEK, Grupo Urrea Salamanca, Guanajuato, Mexico. The resulting powder was then sieved using a set of laboratory sieves (W.S. Tyler, Mentor, OH, USA). Only particles within the size range of 0.85 mm to 1.68 mm were selected for the subsequent laboratory tests. The substrate’s total solids (TS) and VS contents were determined to be 93.93 ± 0.31% and 80.79 ± 0.45%, respectively, on a wet basis. On a dry basis, the cellulose, hemicellulose, and lignin contents of the tomato plant material were found to be 28.6%, 8.4%, and 7.5%, respectively. These values were calculated based on the dry weight of the samples.

2.2. Inoculum

The inoculum utilized in this study was derived from anaerobic sludge obtained from a 1000 L geomembrane bag biodigester. The biodigester was fed with a mixture of cow manure and water, which had a TS content ranging from 7% to 10% and a pH value of 6.83 ± 0.14. Prior to its utilization in the methane production test, the collected inoculum underwent a degassing process at room temperature (approximately 19.7 ± 7.0 °C) for a duration of 10 days. The experimental biodigester, which maintained an operating temperature of around 20 ± 8 °C, possessed a solid retention time of 7 days. This biodigester was installed within the experimental unit of the Laboratory of Technology for Sustainability, University of Guanajuato. The inoculum had a wet basis TS content of 6.23 ± 0.44% and a dry basis VS content of 52.03 ± 0.84%.

2.3. Experimental Desing and Statistic Analysis

In this study, the central composite design was used to perform the experimentation using Design-Expert software (version 11.0, Stat-Ease, Inc., Minneapolis, MN, USA). Three different factors, namely “S/I ratio,” “temperature (°C),” and “inoculum (g VS/L),” were involved. The response variables measured were methane production yield (mL CH4/g VS) and VS removal (%). All experiments were carried out in a randomized order to minimize the impact of miscellaneous factors on the response. The experiment consisted of 18 trials organized in a fractional factorial design. This design included 8 factorial points, 6 axial points, and 4 replicas of the center point to obtain a more accurate estimate of the experimental error.
The levels of each factor for the central composite design are indicated in Table 1 and were defined based on some preliminary experimental studies [18]. Two repetitions for each factorial and axial point and four repetitions of the central point were included.
The results of the methane production yield (mL/g VS) and the removal of volatile solids (%) were analyzed by analysis of variance (ANOVA) using the Design-Expert software (version 11.0, Stat-Ease, Inc., Minneapolis, MN, USA).
The experimental results were adjusted using a second-order polynomial equation:
Y = β0 + ΣβiXi + ΣβiiXi2 + ΣβijXiXj,
where Y is the response variable, Xi and Xj are independent variables, B0 is the intercept, Bi is the linear coefficient, Bii is the quadratic coefficient, and Bij is the interaction coefficient.
The independent variables were coded with A, B, and C. So, the polynomial equation was represented as:
Y = β0 + β1A + β2A + β3A + β11A2 + β22B2 + β33C2 + β12AB + β23BC + β13AC
where Y represents the predicted response (yield of methane production or removal of volatile solids); A is the “S/I ratio”; B is the “temperature (°C)”; and C is the “inoculum (g VS/L)”. The model terms were selected or rejected based on the probability value (P) with a confidence level of 95%. The quality of the fit of the polynomial equation model was expressed through the coefficient of determination (R2), adjusted R2, and “adequate precision”. Three (3D) response surfaces were generated with their respective contour plots based on the effects of the two-factor levels. Using 3D graphs, the simultaneous interaction between two factors on the response variable was studied.

2.4. Batch Assays for Methane Production

The serological bottles, with a total volume of 120 mL and a working volume of 80 mL, were utilized to conduct the methane production assays in a batch regime over a 30-day incubation period. The addition of substrate and inoculum to the serum bottles followed the S/I ratio and inoculum concentration specified in Table 2. To attain a total volume of 80 mL, a mineral medium [19] was added, whose composition per liter consisted of: 4.8 g KH2PO4, 6.98 g K2HPO4, 6.0 g NH4Cl, 0.1 g MgCl2·6H2O, 0.02 g CaCl2, 0.015 g MnSO4·6H2O, 0.025 g FeSO4·7H2O, 0.005 g CuSO4·5H2O, and 0.125 mg CoCl2·5H2O. The initial pH of the mixture remained unadjusted due to its proximity to a neutral pH (7.0 ± 0.2). After sealing the vials, they were placed in an incubator set at the corresponding temperature as indicated in Table 2, maintaining static conditions throughout the experiment. Furthermore, an endogenous control was incorporated, consisting solely of inoculum and mineral medium. To assess the TS and VS contents as well as the pH, measurements were taken at the beginning and end of the incubation period for each treatment. Duplicate trials were conducted for each treatment.

2.5. Analytical Methods

The determination of TS and VS contents followed standard procedures [20]. The pH was measured using the method described by Kang et al. [21]. For the pH measurement of methane test samples, the samples were manually shaken and allowed to stand for 10 min, after which the reading was taken from the supernatant.
To determine the volume of methane produced, liquid displacement was employed using a 4 M NaOH alkaline solution to absorb carbon dioxide [22]. Gas measurements were conducted by manually shaking the reactors. Gas volumes were calculated based on standard conditions (273.15 K, 101.325 kPa). Methane yields were reported per gram of volatile solid added as a substrate.
Gas chromatography was utilized to verify the presence of methane in the biogas and detect H2, O2, N2, and CH4. A 30 μL sample from the headspace of each bottle was taken for analysis. The gas chromatography analysis was carried out using a PerkinElmer Clarus 580 chromatograph (PerkinElmer, Waltham, MA, USA), with an Elite CG GS-MOLESIEVE 52 capillary column (30 m × 0.53 mm × 50 μm) (PerkinElmer, Waltham, MA, USA) and a thermal conductivity detector (TCD). The injector, oven, and detector temperatures were set to 150 °C, 50 °C, and 200 °C, respectively. Argon was employed as the mobile phase at a pressure of 14 psi, and its oxygen content was maintained below 5 ppm. All other chemicals utilized were reagent grade from Sigma-Aldrich (Sigma-Aldrich, St. Louis, MO, USA).

3. Results and Discussions

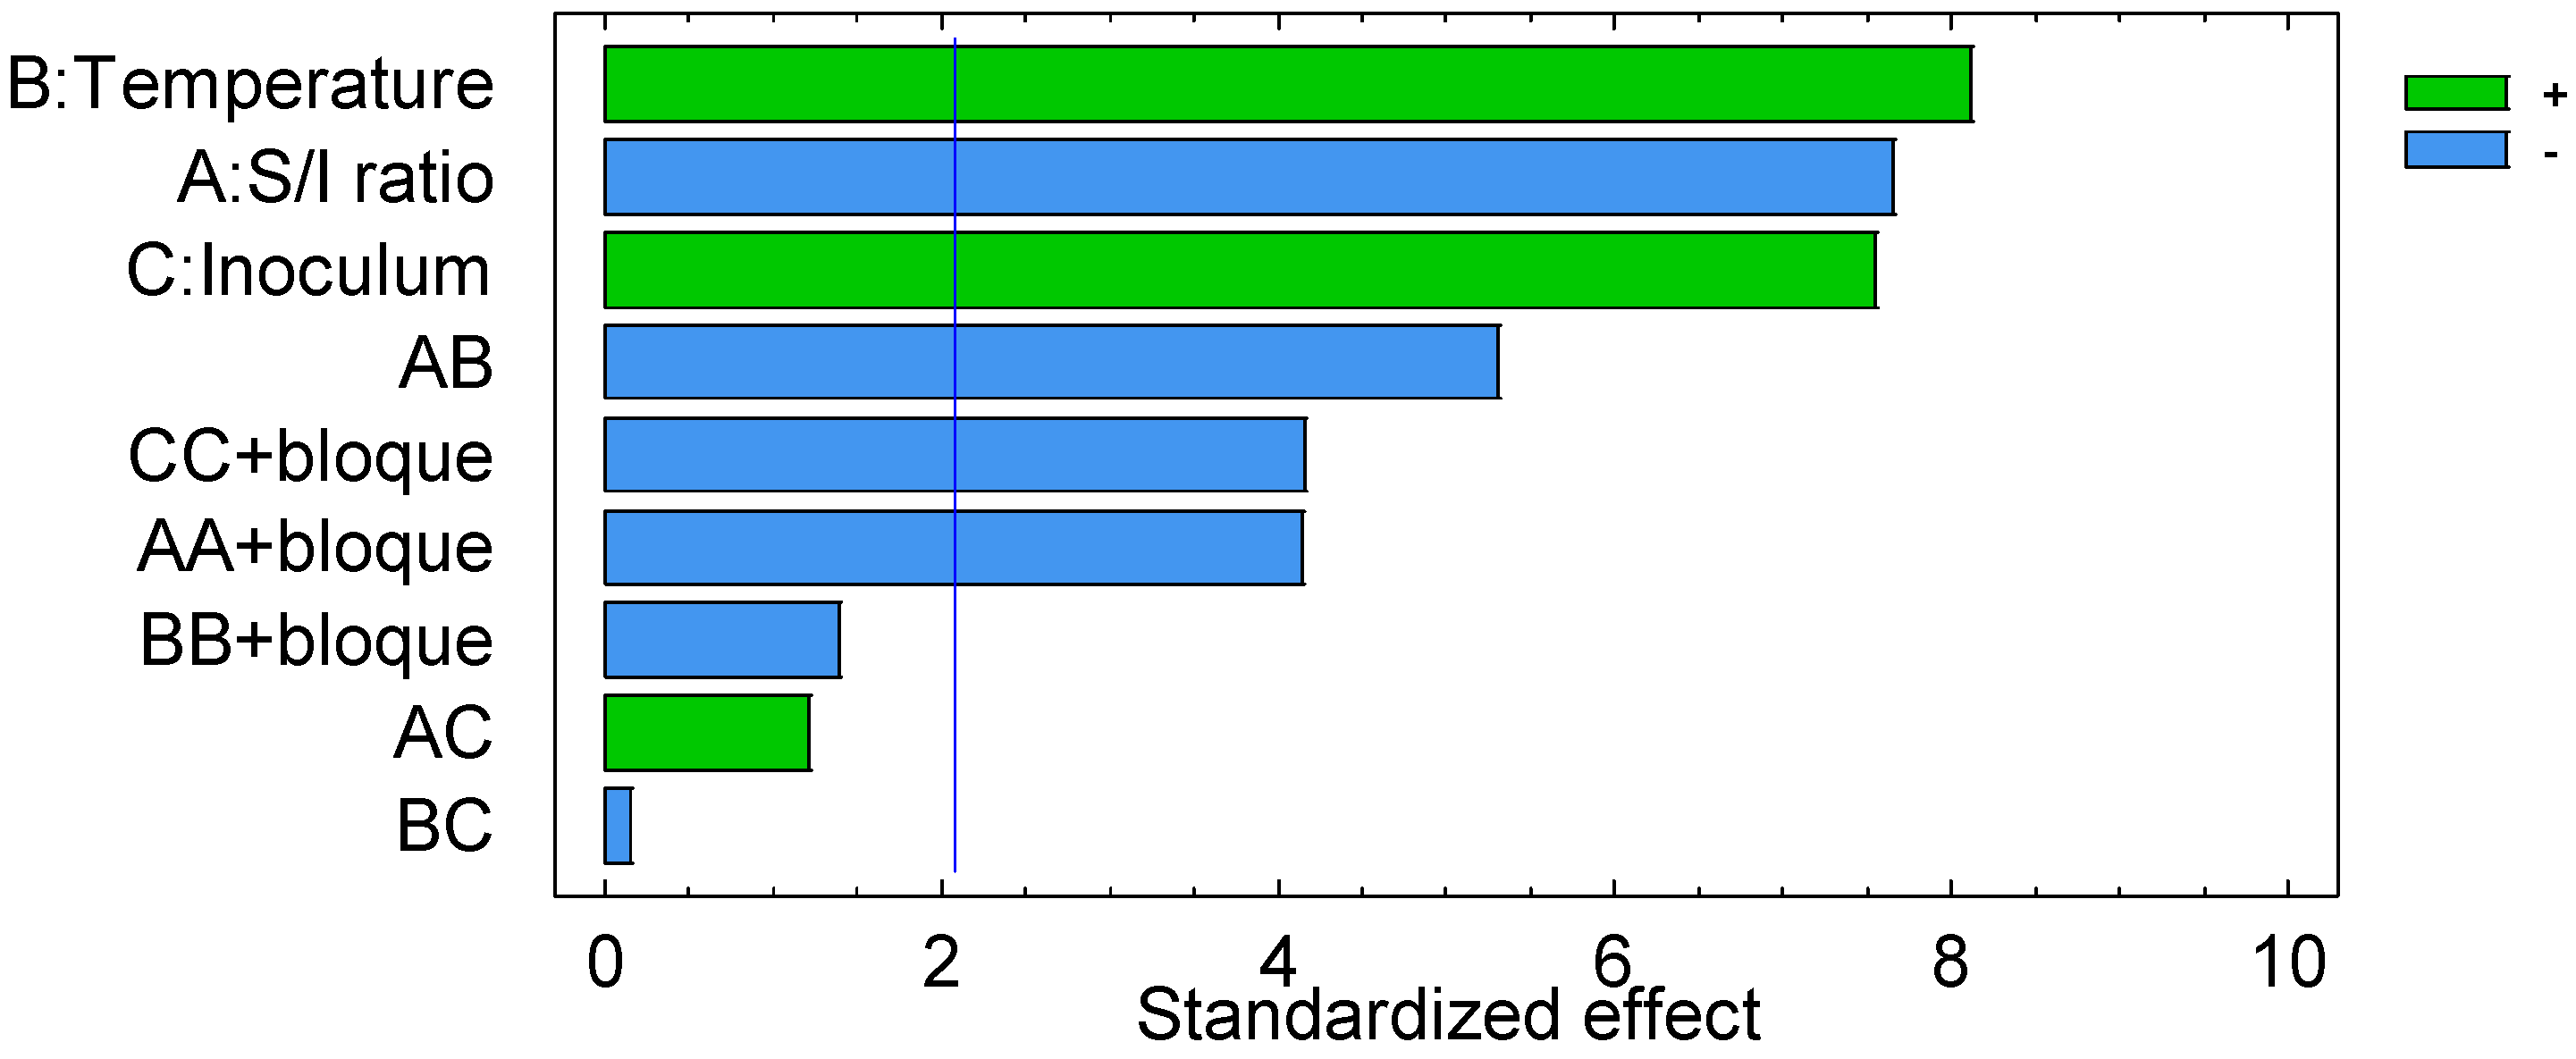
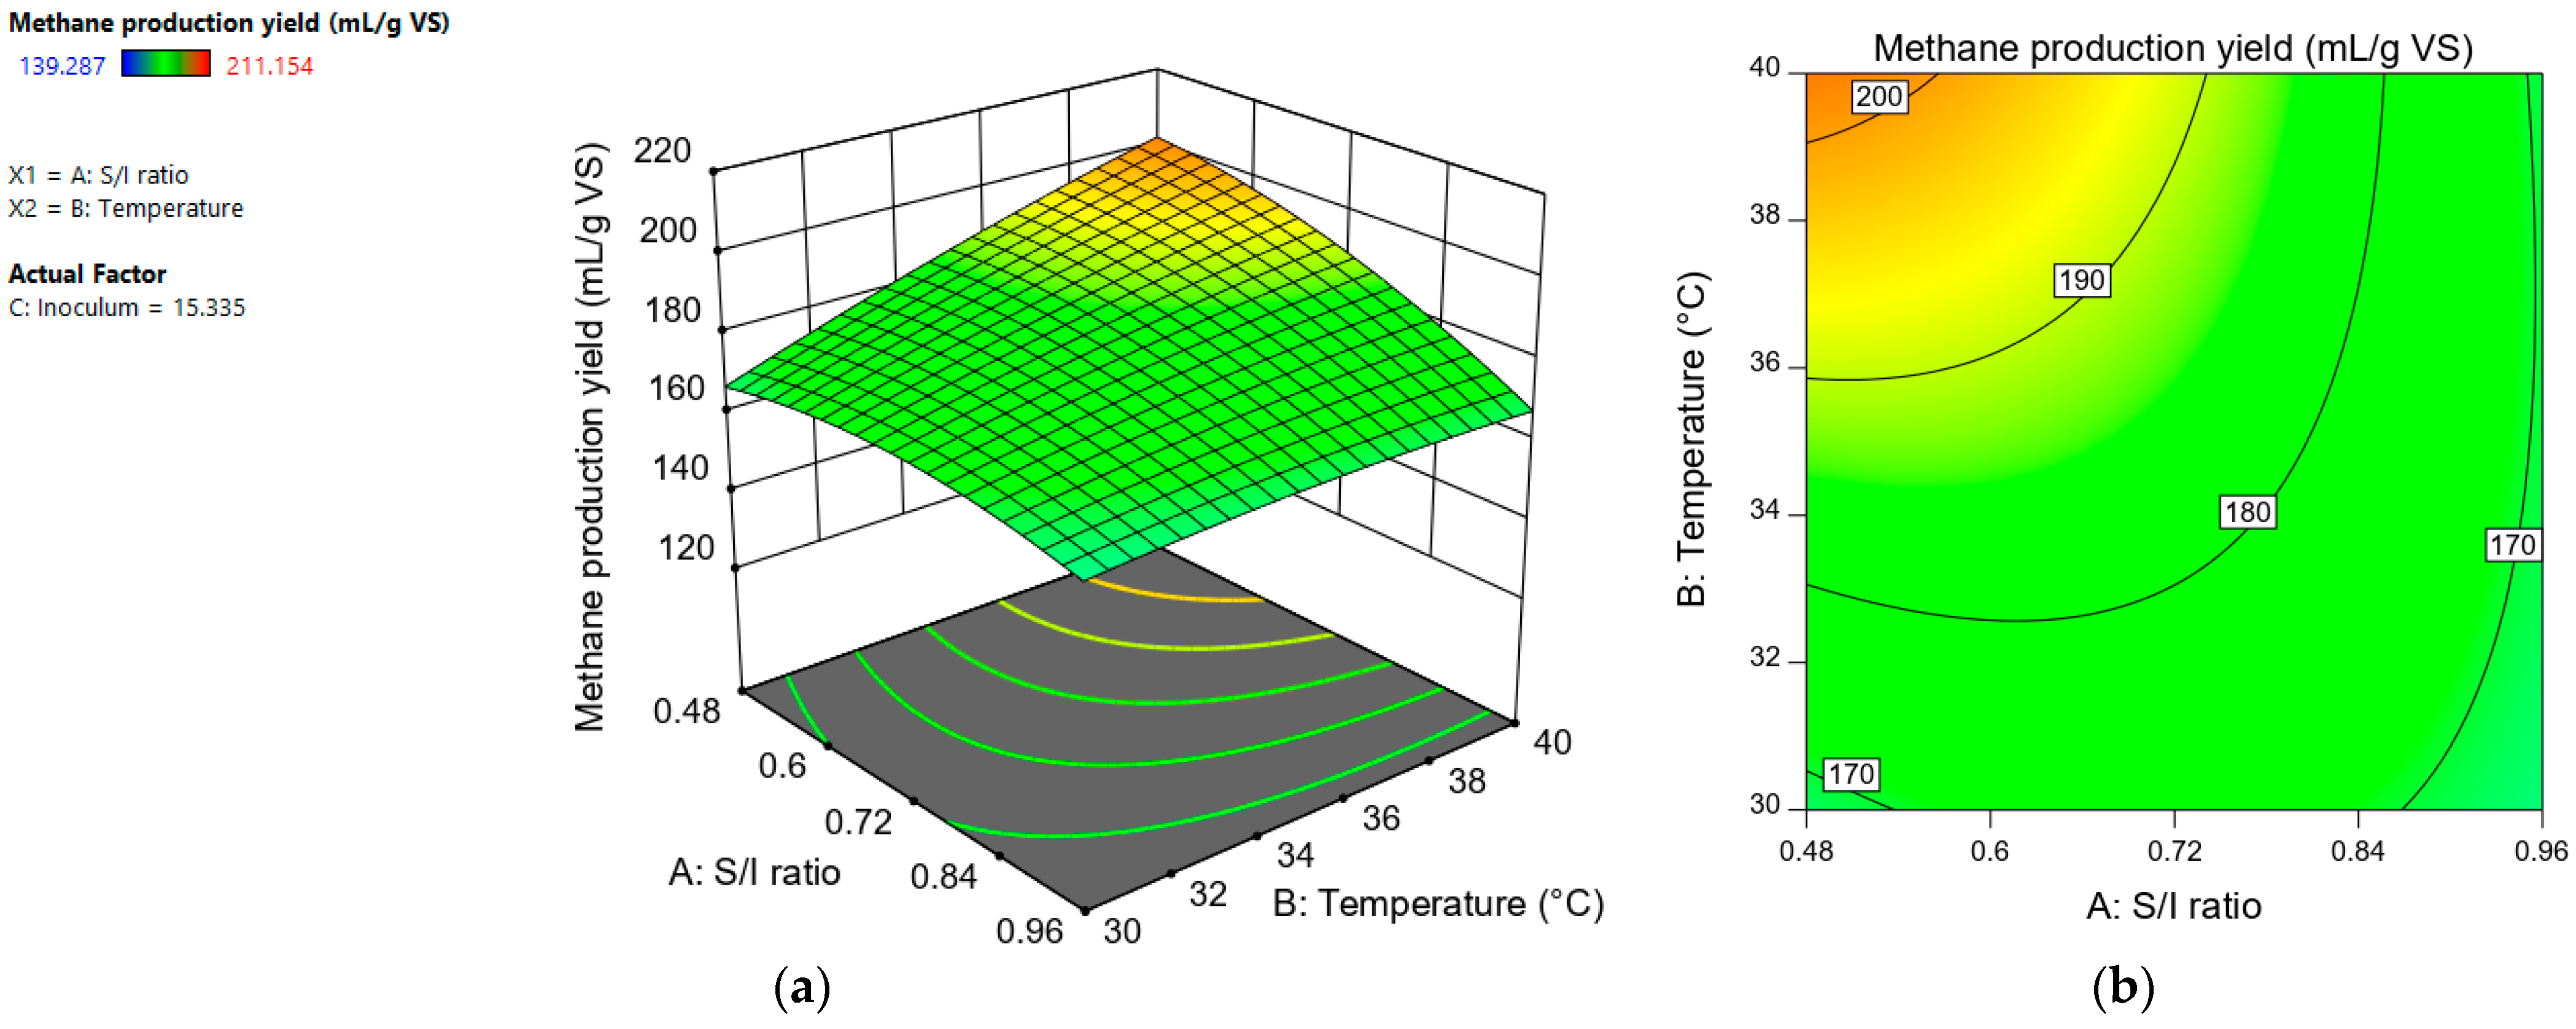
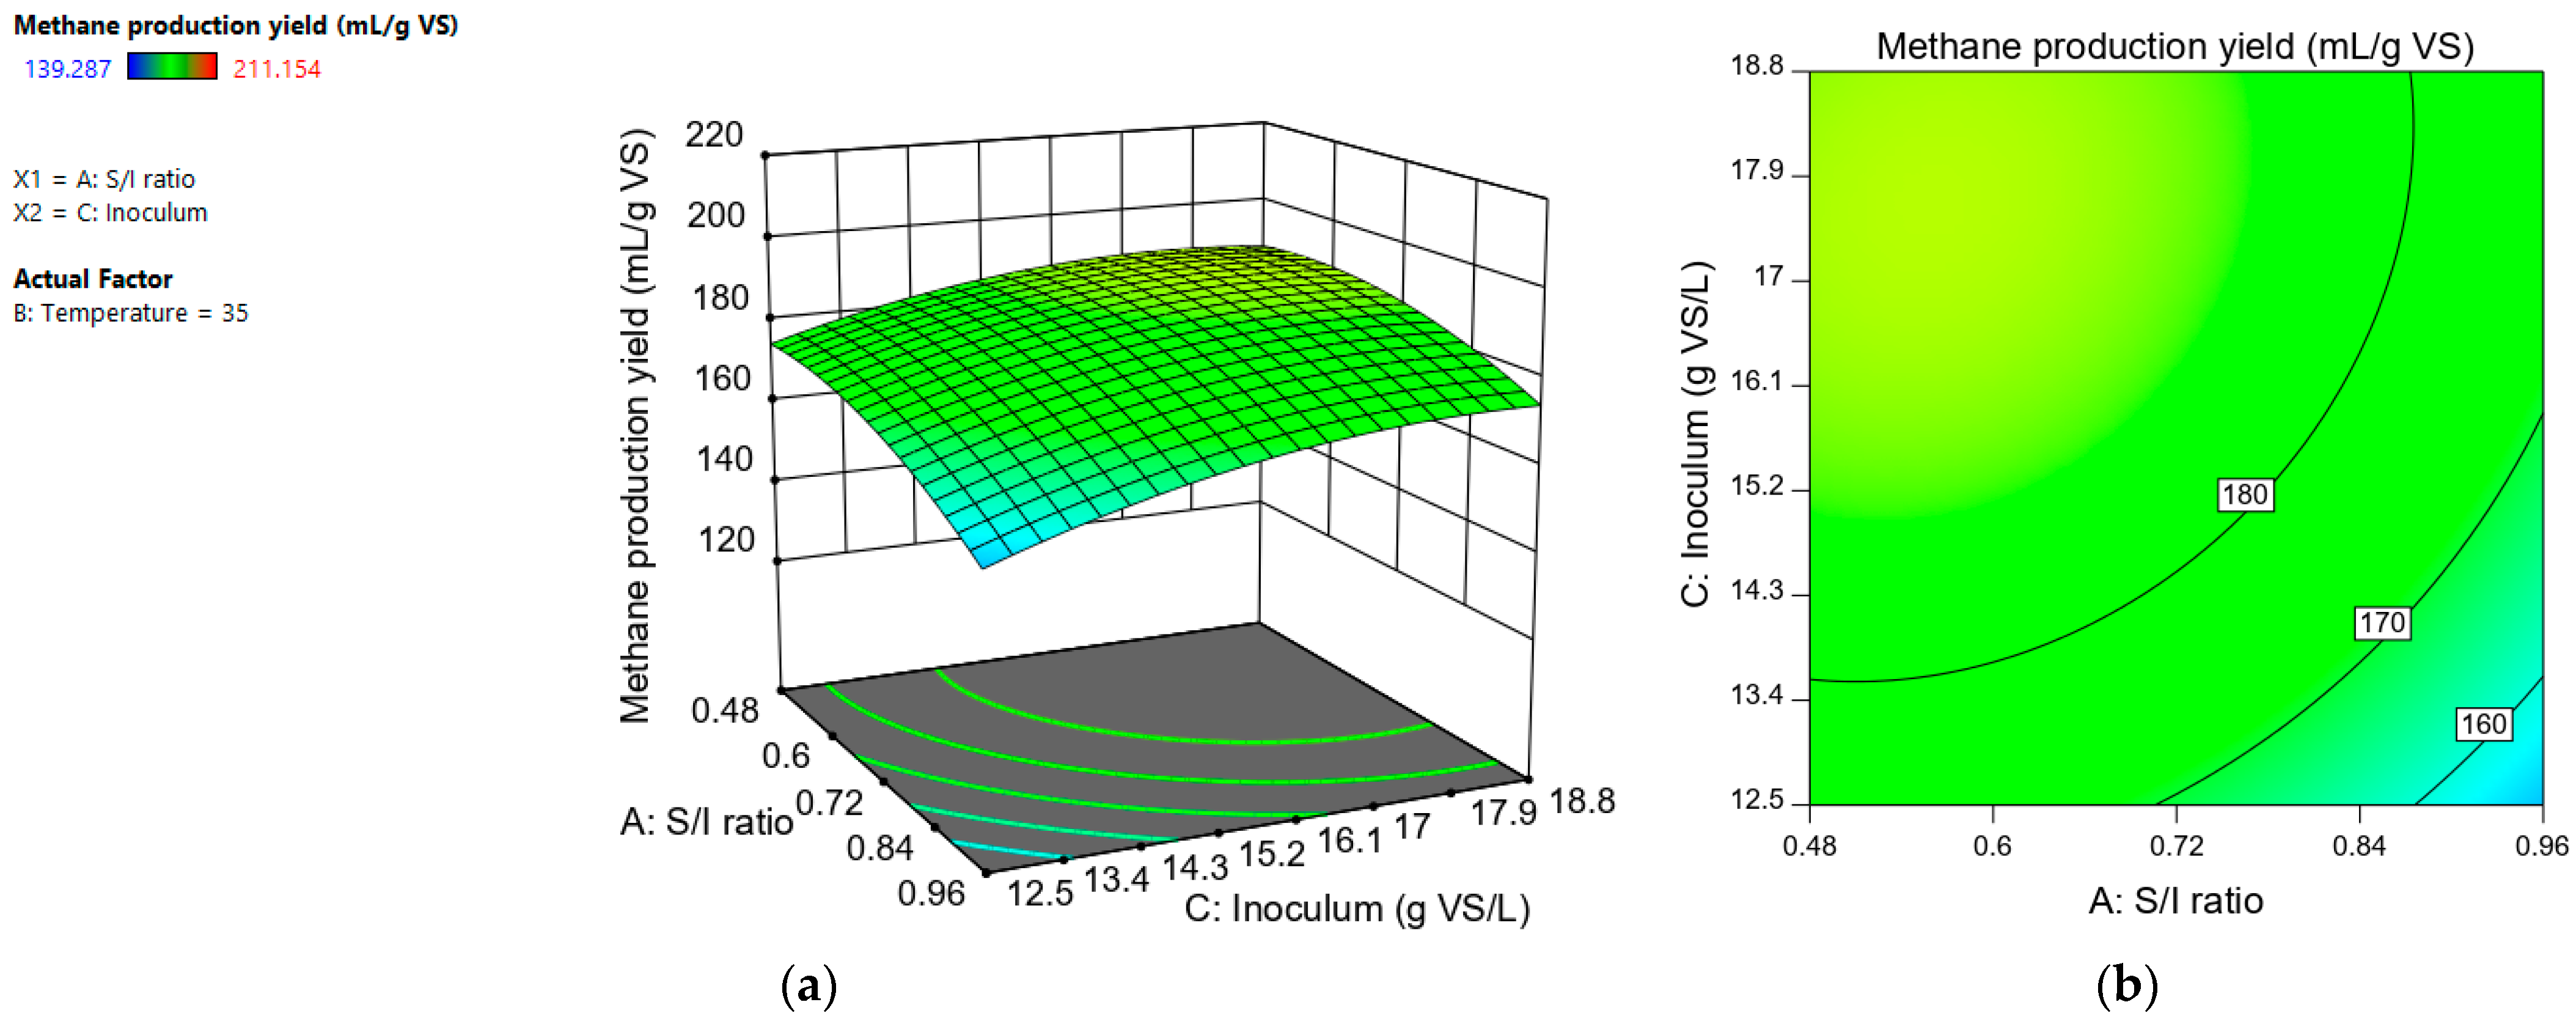
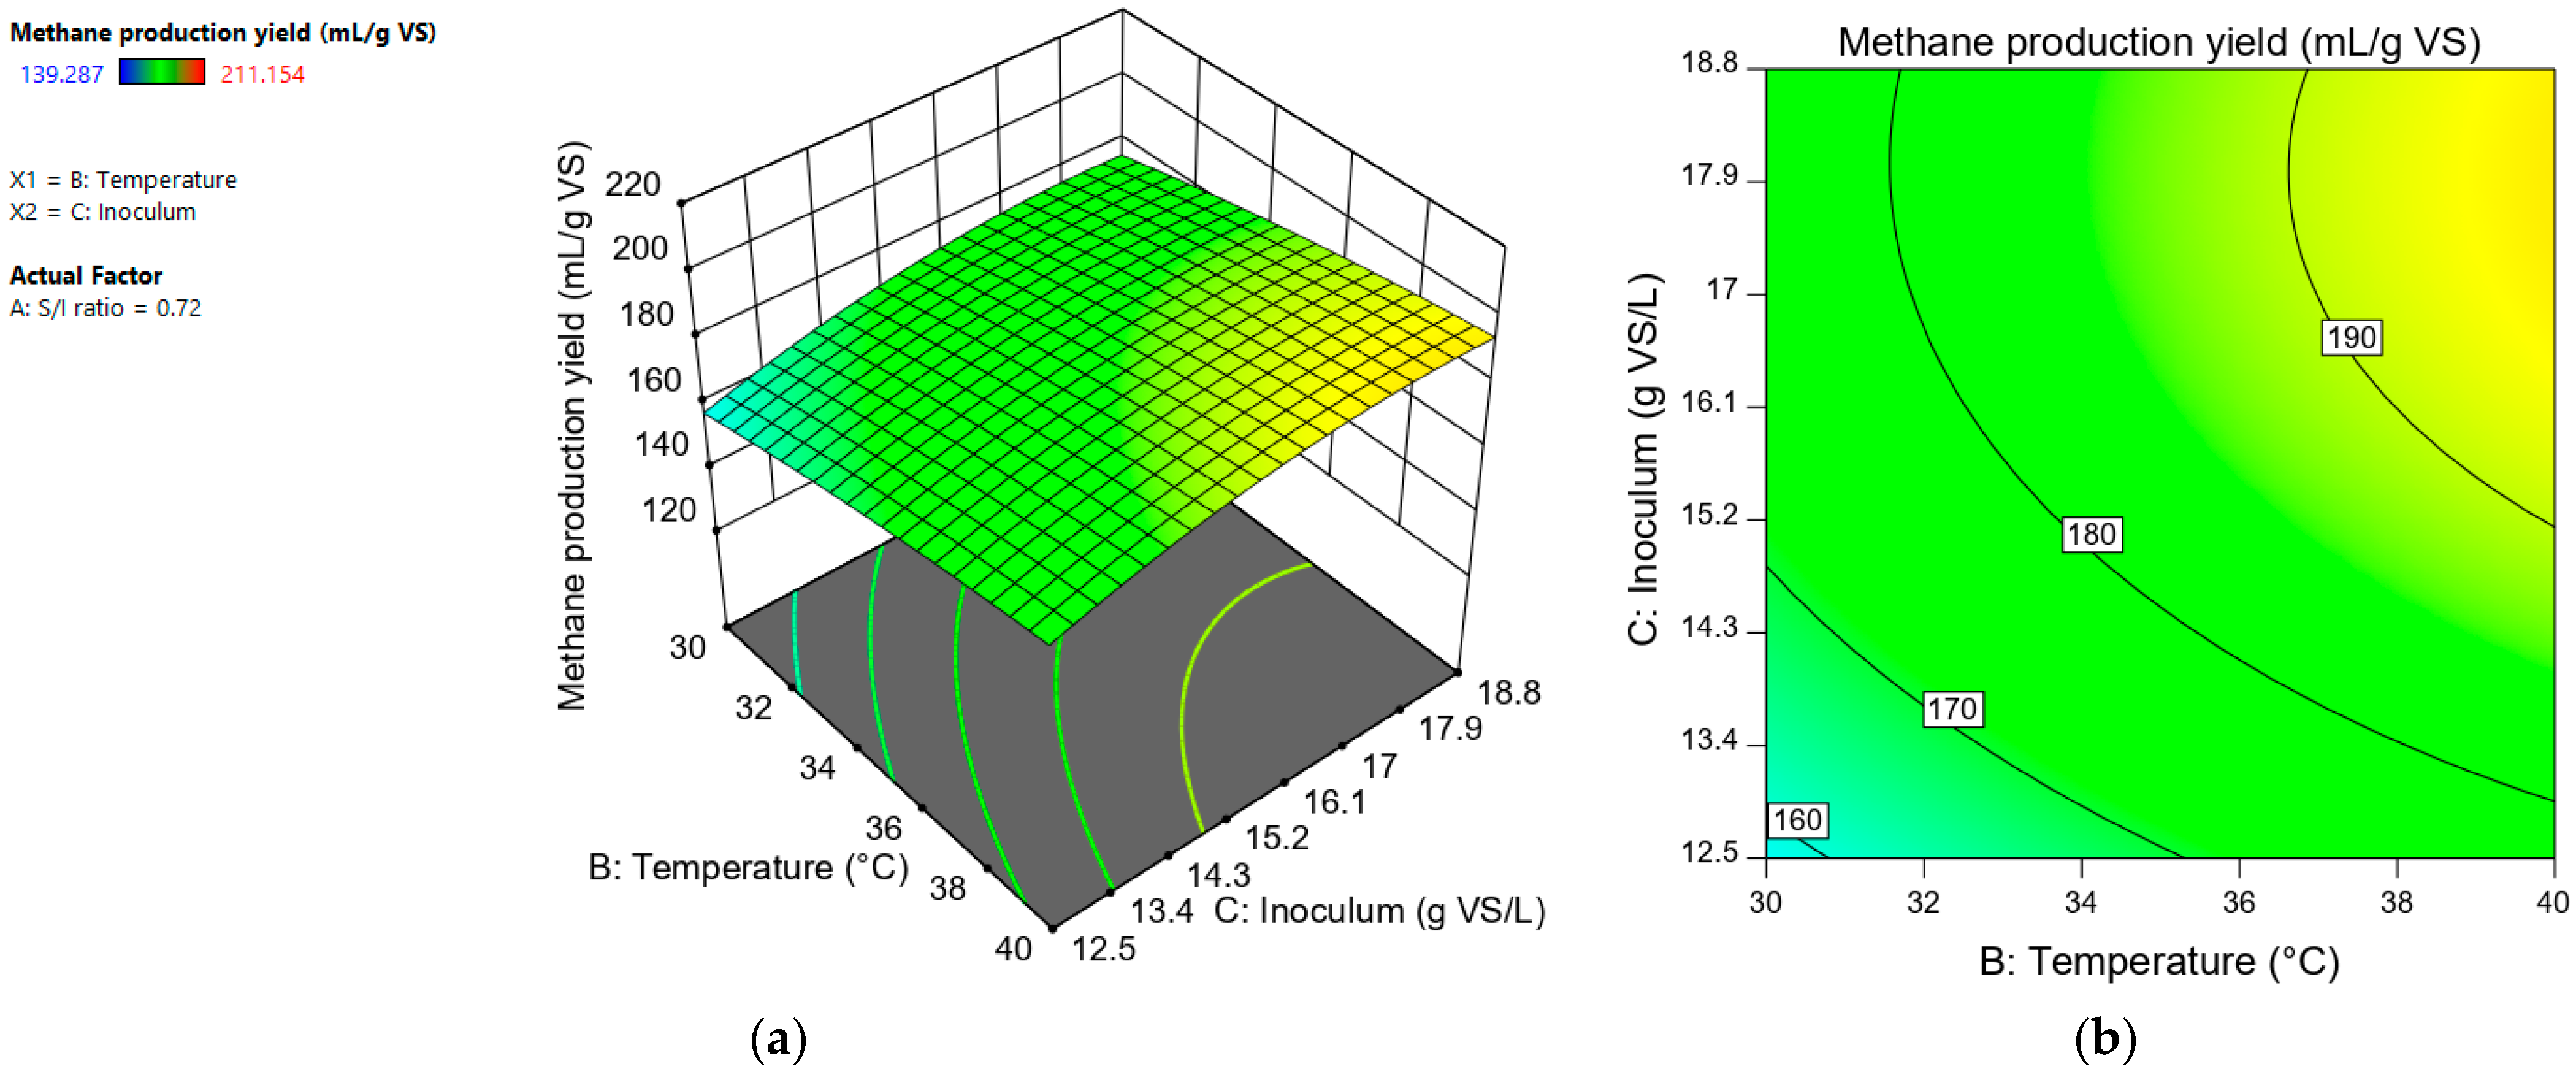
3.1. Regression Analysis and Response Surfaces for Methane Production Yield

Table 2 shows response values for different experimental conditions. By applying a multiple regression analysis, the results were adjusted to a second-order polynomial equation. The equation obtained in coded terms is as follows:
mL CH4/g VS = +183.94 − 8.87(A) + 9.40(B) + 8.72(C) − 8.04(AB) + 1.83(AC) −
0.2413(BC) − 5.77(A2) − 1.83(B2) − 5.83(C2)
Similarly, other researchers have chosen to employ a second-order polynomial model to describe the behavior of methane production yield (mL/g VS) from various substrates. This modeling approach allows for the capture of both main effects and interaction effects that significantly influence the outcomes while maintaining a desirable level of simplicity [7,8,9,10,11,12,13,14,16,17].
An analysis of variance (ANOVA) was used to assess model fit (Table 3). The statistical significance of the second-order polynomial equation was evaluated using the F test (ANOVA).
The F-value of 25.93 implies that the model was significant. There is only a 0.01% chance that the model’s F value could be caused by noise. In addition, the ANOVA corresponding to the quadratic regression model was significant (p < 0.05). The p-value represents the significance of the variables, and the lower the p-value, the greater the significance of each variable. The regression analysis of the experimental design shows that the linear terms (A, B, and C), quadratic terms (A2 and C2), and interaction terms (AB) were significant (p < 0.05). However, the B2 term and the AC and BC interaction terms were not significant (p > 0.05). The coefficient of determination (R2) of the polynomial equation was 0.9153. This implies that 91.53% of the sample variation can be explained by the model, and only 8.47% is outside the range that can be explained by the model. The adjusted R2 statistic was 0.8791, which indicates a high significance of the model. The predicted R2 (0.8075) showed high agreement between observed and predicted values. The R2 value of 0.9153 turned out to be lower than previously reported [7,8,9,10,11,12,13,14,15,16,17]. Nevertheless, researchers have established that good statistical models of best fit should have an R2 value between 0.75 and 1 [23].
The statistic known as “adequate precision” quantifies the signal-to-noise ratio, with a preference for a ratio exceeding 4. The value of 18.037 represents a sufficiently strong signal in the context of this study. This model facilitated the exploration of the design space. The percentage coefficient of variation (% CV) serves as a metric to gauge the residual variation of the data in relation to the mean. Usually, the higher the CV value, the less reliable the experiment. The value obtained from % CV was 3.56, indicating high reliability [12]. The Sum of the Residual Squares Predicted (SCRP) evaluates the fit of the model at each point. A low value of the SCRP statistic indicates a better fit of the model. The SCRP value obtained was 1821.66. The “lack of fit F-value” of 4.40 implies that it is significant [16]. There is a 0.01% chance that the “lack of fit F-value” could occur due to noise. The model showed a standard deviation and a mean of 6.18 and 173.39, respectively (Table 4).
The Pareto chart indicated in Figure 1 describes the relative importance of each factor and the effect of the adjustment by showing the variables from greater to lesser influence. Temperature was the factor with the greatest influence, while the “S/I ratio” and “inoculum” contributed similarly to the variability of the dependent variable.
Temperature had a significant positive effect. As the temperature increases, so does the methane production (Figure 2). Saleh et al. [14] evaluated methane production from co-digestion between palm oil mill effluent (POME) and oil palm empty fruit bunch (EFB). In their study, they included the independent variables “temperature”, “POME volume”, “inoculum volume”, and “co-substrate addition (EFB)” in a Box–Behnken design. They found that temperature was the most significant variable with a positive effect. This result was similar to that obtained in our study, in which temperature turned out to be the variable with the greatest influence on methane production with respect to the S/I ratio and the amount of inoculum added.
Abbasi et al. [24] mentioned that a temperature of 35 °C is the most suitable for performing anaerobic digestion. Saleh et al., [14] found that the maximum specific biogas production rate and maximum percentage of methane were obtained at 43 °C and 44 °C, respectively. Safari et al., [17] used a Box–Behnken design to study the effect of “temperature”, “agitation time”, “TS”, and “inoculum” on methane yield from co-digested canola residues with cow manure. They found that the maximum production was obtained at 40.36 °C. Therefore, the optimal temperature value reported in a mesophilic range differs in the literature. In our study, the optimum temperature was not found within the evaluated range (27–43 °C), and the predicted optimal temperature was higher than 43 °C.
The S/I ratio had a negative effect. The lower its value, the higher the methane production yield (Figure 3). This is because, at low S/I values, the available proportion of inoculum to degrade the substrate is higher [25]. This result is consistent with that reported by different authors, who observed a higher methane production using small values of the S/I ratio [9,10,11,13].
The variable “inoculum (g VS/L)” had a positive effect on methane production. Figure 4 shows that the higher the value of the “inoculum (g VS/L)” variable, the higher the methane production. Sajeena et al. [16] carried out the optimization of biogas production using a central composite design for the anaerobic digestion of municipal solid waste. The parameters studied were initial pH, inoculum concentration, and total organic carbon. Only the initial pH and the inoculum concentration had a significant individual effect on the biogas production yield. In their study, the inoculum concentration was the factor that had the largest effect on the variability of the response. This result was also reported by Safari et al. [17], who determined that the inoculum concentration plays an important role in the anaerobic digestion process.
According to our results, the increase in total solids from 3.2 to 6.1% was reflected in a higher methane production. Buyidono et al. [26] obtained a maximum point of biogas production using 7.4% of the total solids of cattle manure as substrate. Shen and Zhu [27] evaluated methane production from batch co-digestion of poultry litter and wheat straw at 2%, 5%, and 10% of total solids, and they obtained the maximum specific methane volume at the 5% TS level.
According to the quadratic model, to achieve optimal performance, it is necessary to handle a temperature higher than 43 °C and an S/I ratio lower than 0.32. A temperature > 43 °C implies a greater energy expenditure, which can result in a negative energy balance in the process. An S/I ratio < 0.32 implies processing a low amount of substrate in the batch system. Therefore, it will be important to analyze whether it is convenient to implement these conditions to achieve the predicted optimum production.
In most methane production optimization studies involving lignocellulosic substrates, they are typically mixed with manure or other organic waste. Consequently, the reported methane production yields in these studies are generally higher compared to mono-digestion systems using agricultural residues alone. For instance, Kainthola et al. [10] achieved an optimal yield of 323.78 mL CH4/g VS added from co-digestion of rice straw and food residues, while Zhang et al. [11] obtained a maximum yield of 70.22 mL CH4/g VS from the mono-digestion of cotton stalk. In our study, the highest average methane yield obtained from the mono-digestion of TPW was 210.8 mL CH4/g VS (S/I ratio 0.48, 40 °C, and inoculum concentration of 18.8 g VS/L). Although the methane yield depends on the specific substrate, it is notable that the amount of methane obtained from TPW is comparable to that obtained from other agricultural substrates used in co-digestion. Therefore, the utilization of TPW is attractive for both mono-digestion and co-digestion systems at room temperature.

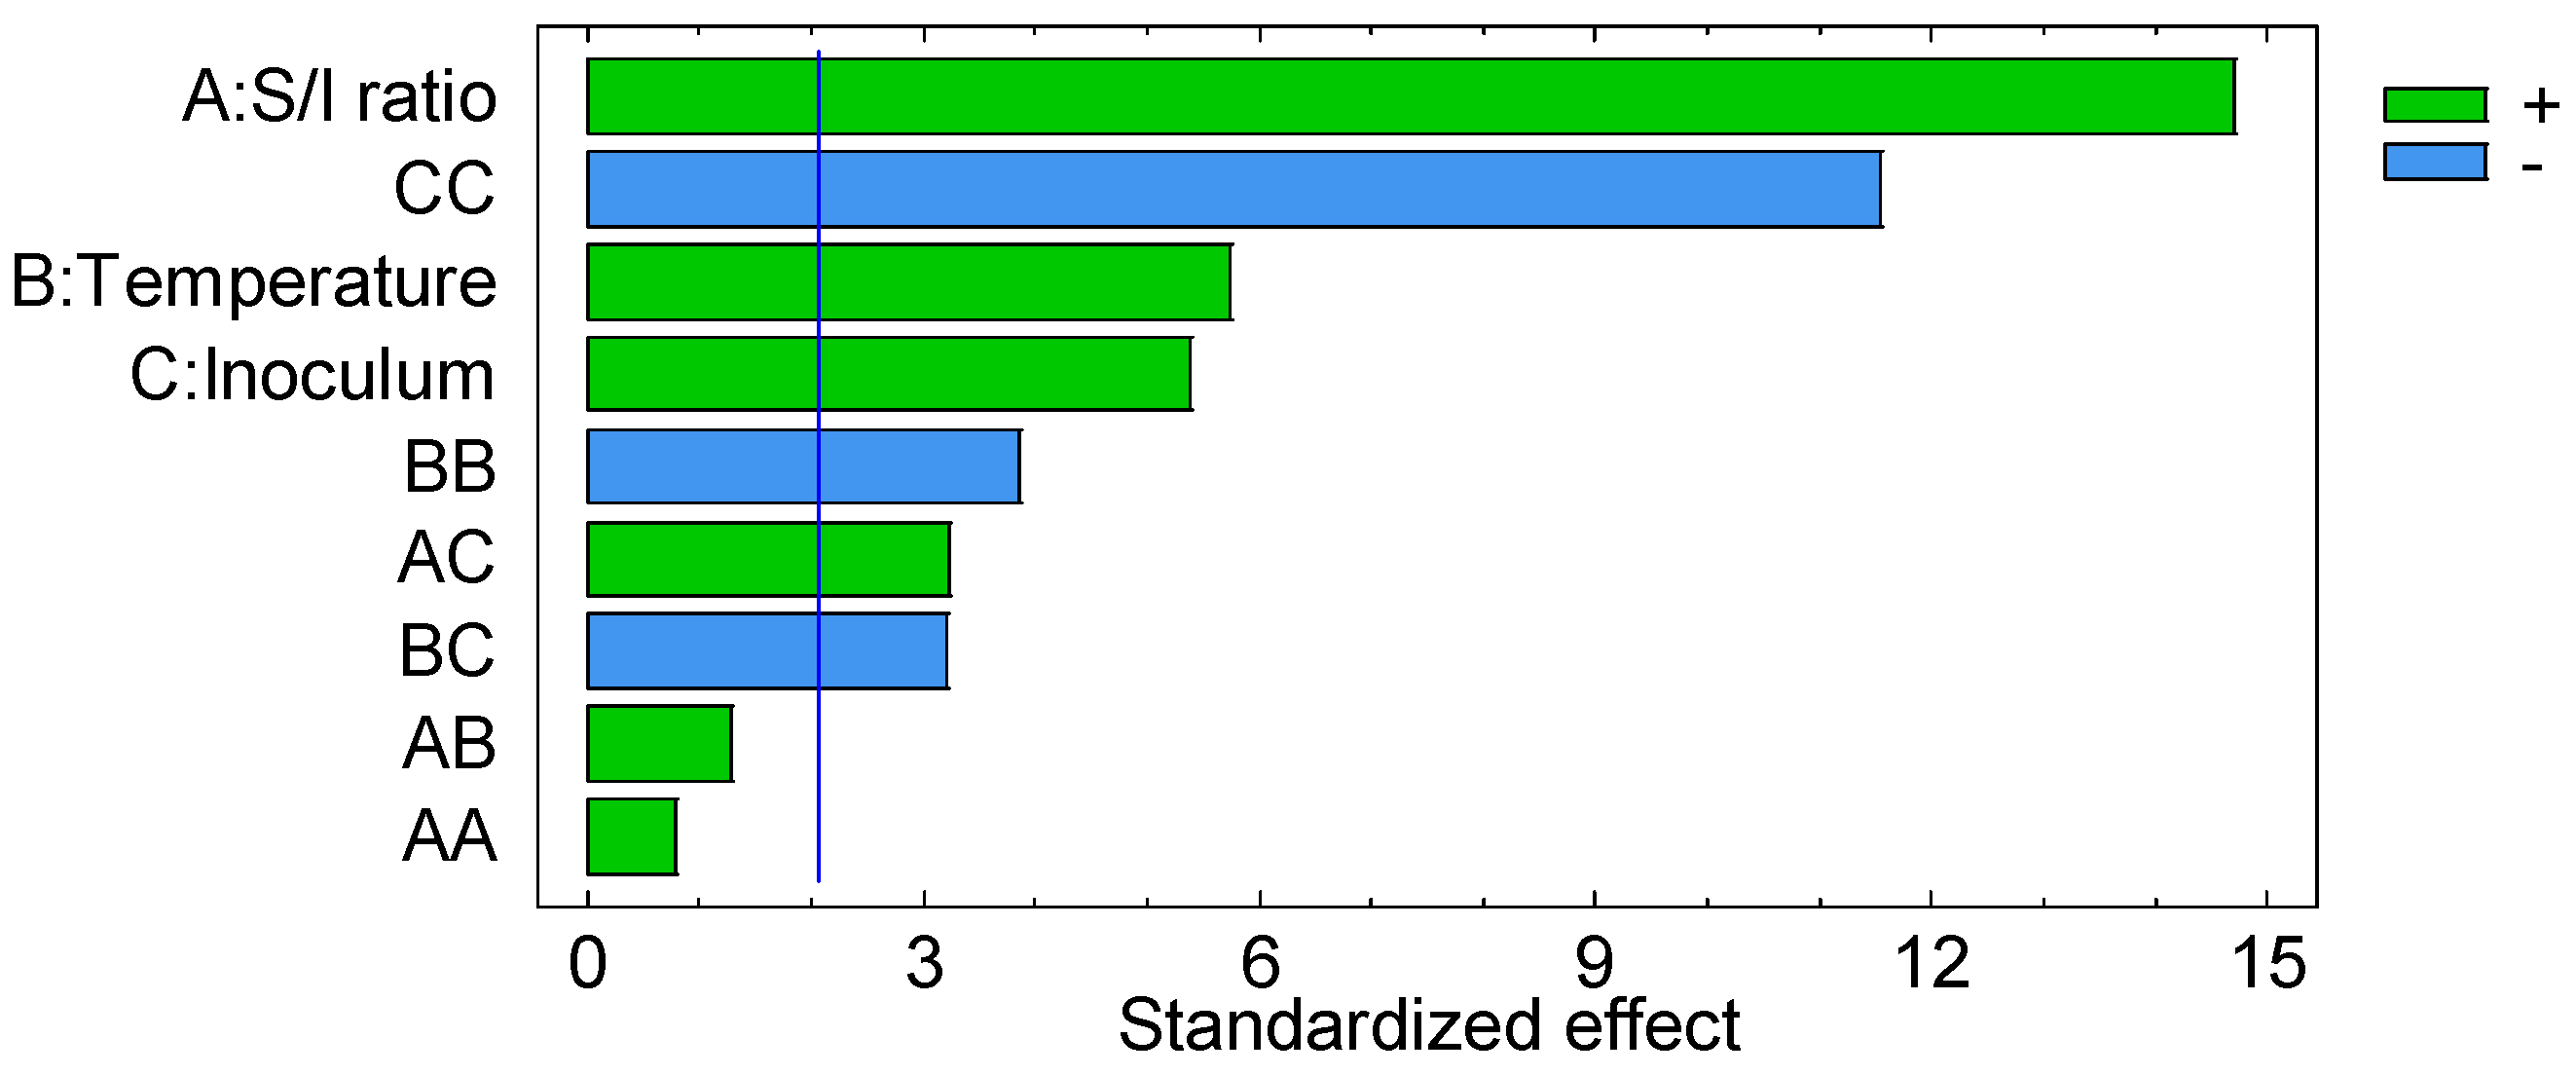
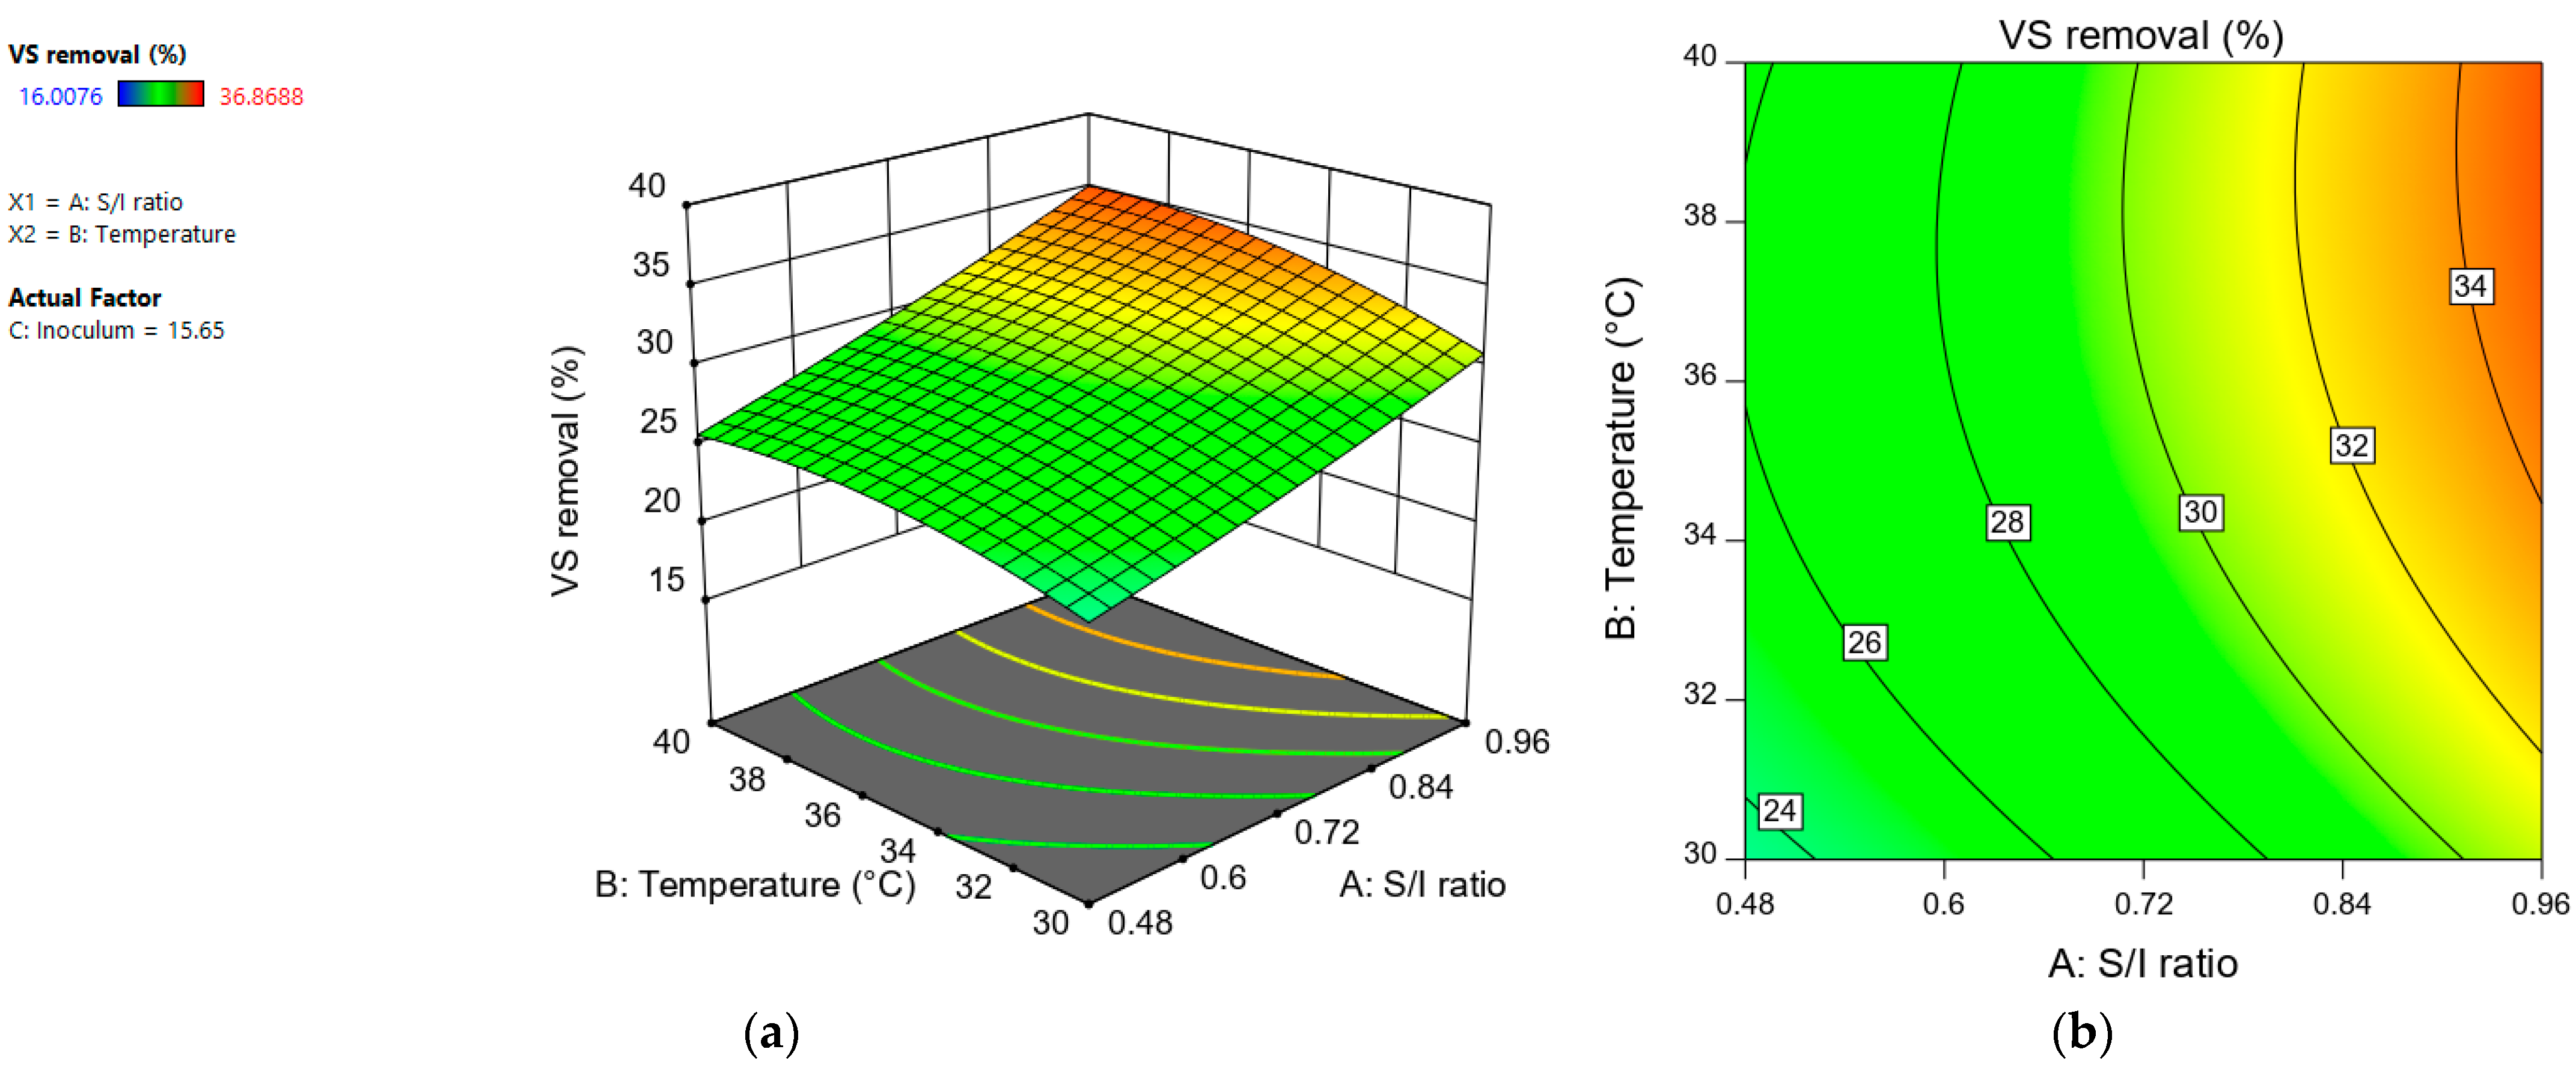
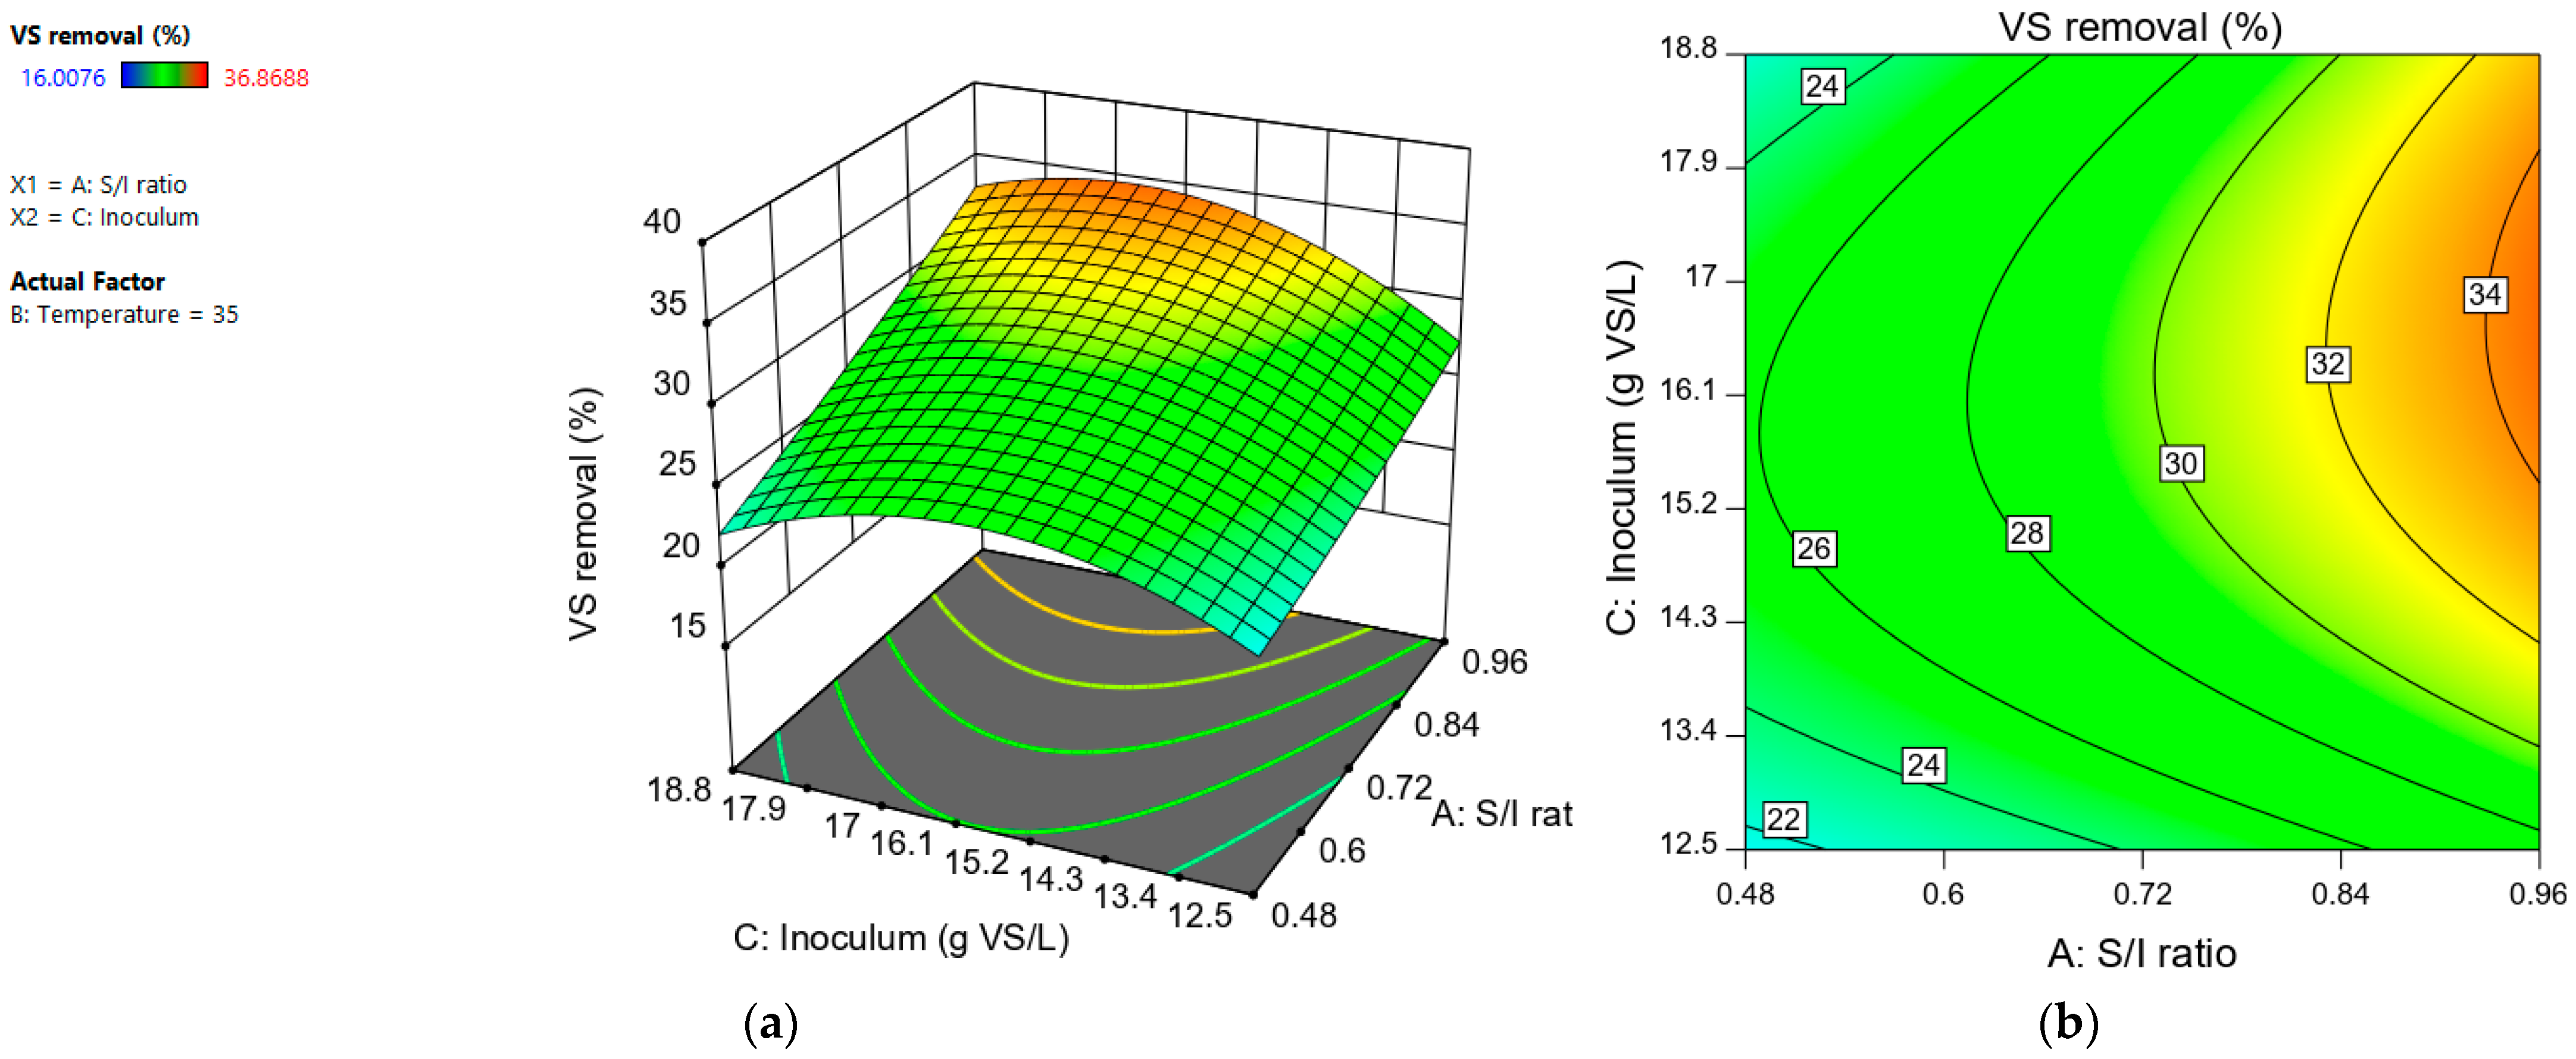
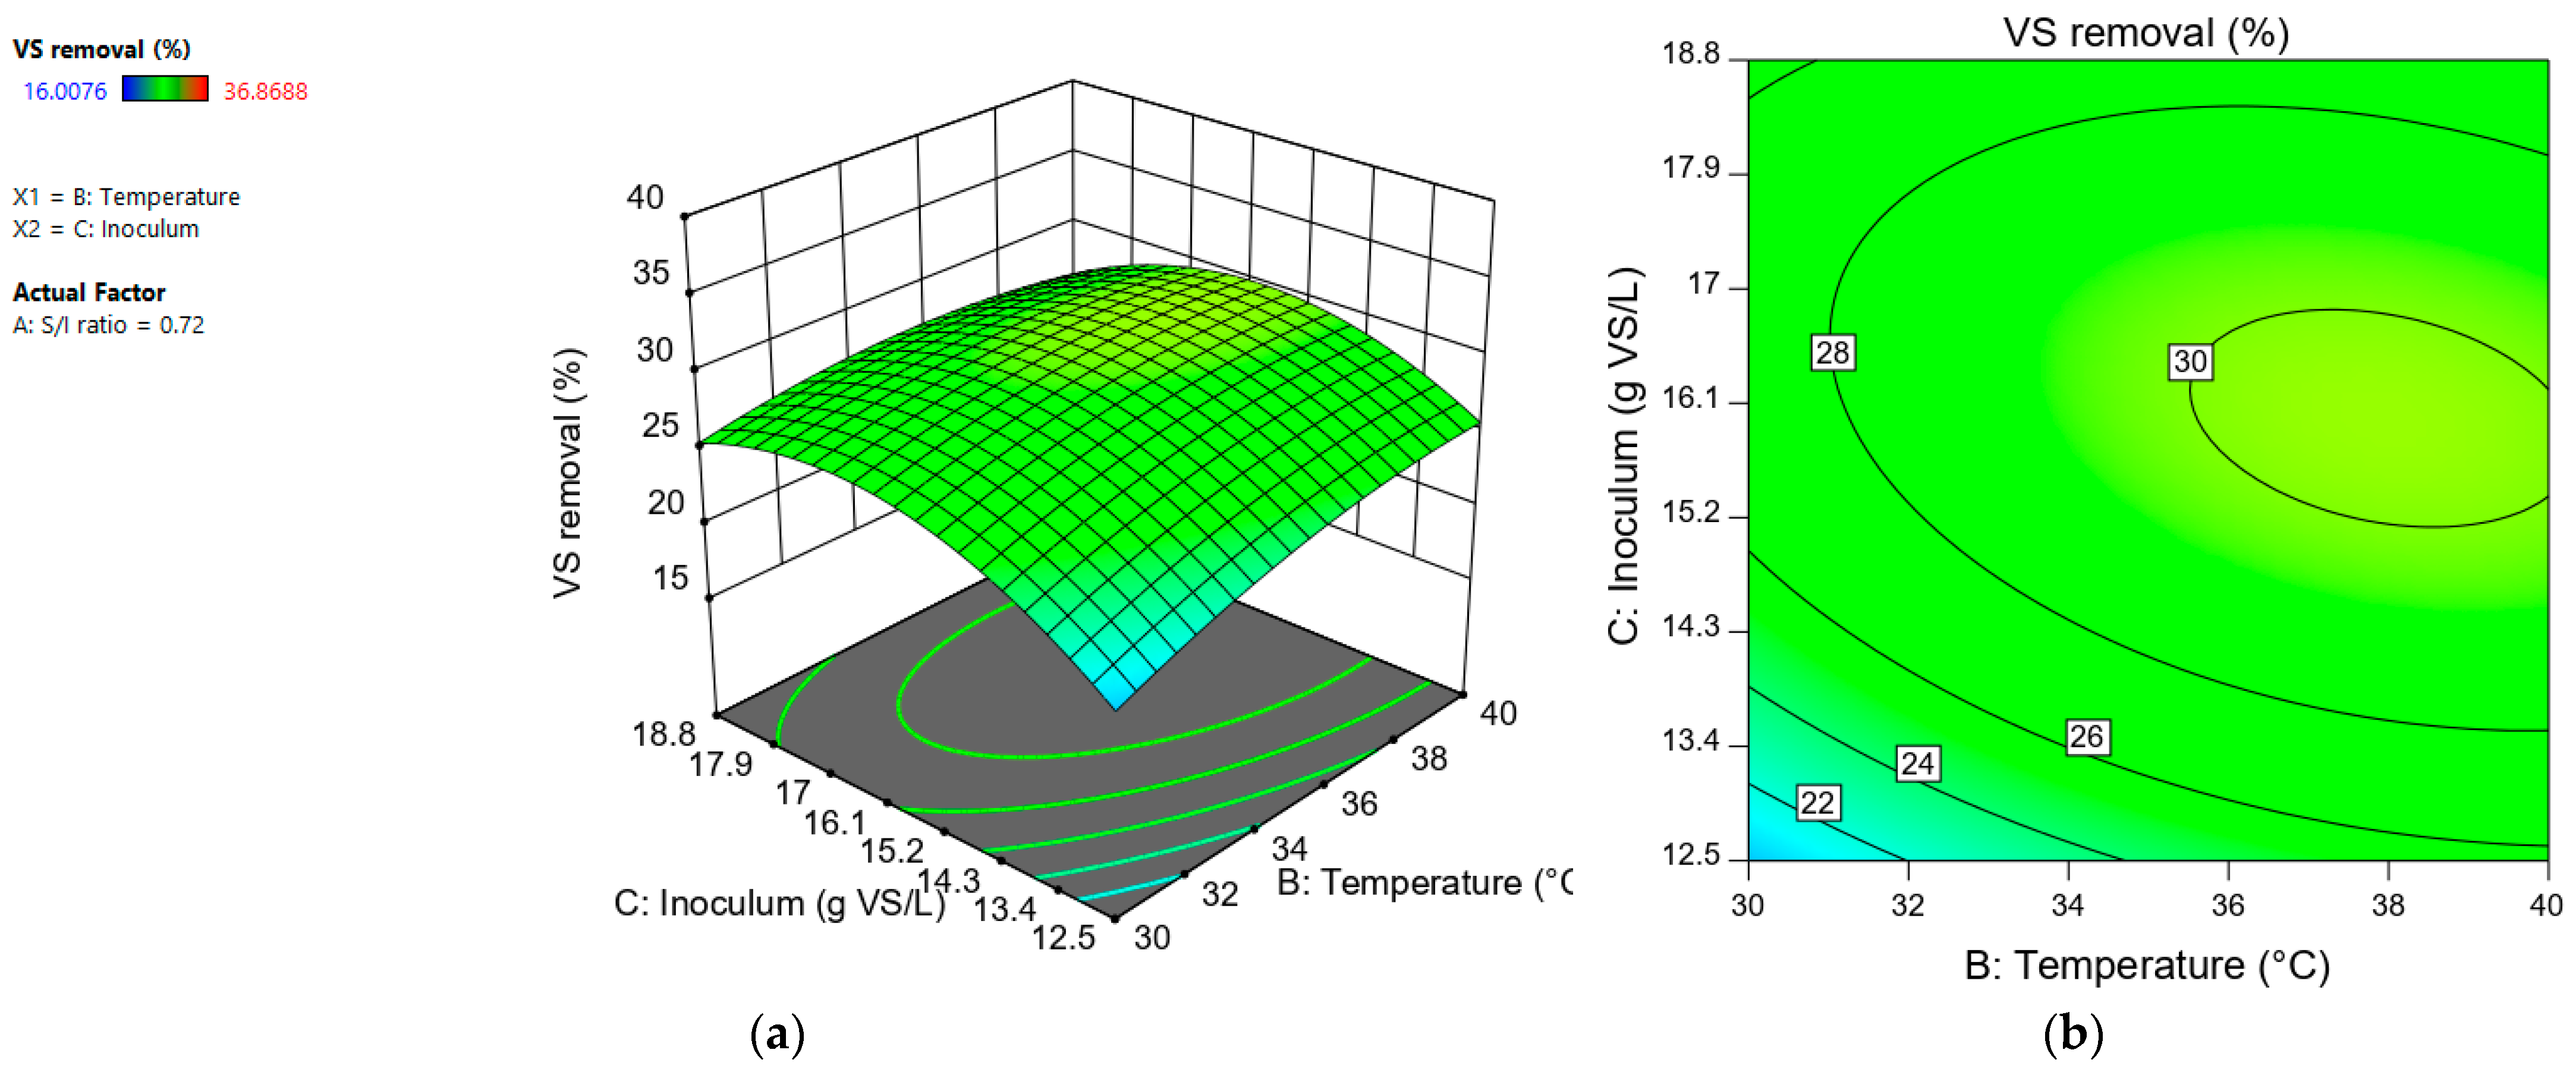
3.2. Regression Analysis and Response Surfaces for Volatil Solids Removal

Volatile solids removal values were subjected to response analysis to evaluate the relationship between “S/I ratio (A)”, “temperature (B)”, and “inoculum (g VS/L). By applying a multiple regression analysis, the results were adjusted to a second-order polynomial equation. The equation obtained in coded terms is as follows:
VS removal% = +29.72 + 4.19(A) + 1.62(B) + 1.54(C) − 0.4913(AB) + 1.20(AC) −
1.19(BC) − 0.3321(A2) − 1.28(B2) − 4.02 (C2)
An analysis of variance (ANOVA) was used to assess model fit (Table 5). The statistical significance of the second-order polynomial equation was evaluated using the F test (ANOVA).
The F-value of 54.10 implies that the model was significant. There is only a 0.01% chance that the model’s F value could be caused by noise. In addition, the ANOVA corresponding to the quadratic regression model was significant (p < 0.05). The regression analysis of the experimental design shows that the linear terms (A, B, and C), quadratic terms (B2 and C2), and interaction terms (AC y BC) were significant (p < 0.05). However, the A2 term and the AB interaction terms were not significant (p > 0.05). The coefficient of determination (R2) of the polynomial equation was 0.9587. This implies that 95.87% of the sample variation can be explained by the model, and only 4.13% is outside the range that can be explained by the model.
The adj R2 statistic was 0.9409, which indicates a high significance of the model. The pred R2 (0.9017) showed a high agreement between observed and predicted values. We obtain a model with a better fit for the VS removal (R2 = 0.9587) than for the methane production (R2 = 0.9156).
The “adequate precision” ratio of 25.4024 indicates an adequate signal for this study. The value obtained from % C.V. was 5.77, indicating high reliability [12]. The SCRP value obtained was 108.19. The “lack of fit F-value” of 4.04 implies that it is significant [16]. The model showed a standard deviation and a mean of 1.47 and 25.53, respectively (Table 6).
The “S/I ratio” was the factor with the greatest influence, while “temperature” and “inoculum” contributed similarly to the variability of the dependent variable (Figure 5).
The “S/I ratio” had a significant positive effect. Volatile solids removal increases as the “S/I ratio” increases (Figure 6). These results do not agree with what has been reported in other studies, which mention that VS removal increases as the S/I ratio decreases [28,29]. However, there are other investigations in which it has been reported that the greatest removal was not obtained when using the lowest values of S/I [30,31]. For example, Xu et al. [30] reported that there was no statistically significant correlation between the VS removal and the S/I variable.
Nevertheless, our results are consistent with those obtained in previous experiments [18], in which a greater volatile solids removal was obtained at a higher S/I ratio. This phenomenal result could be due to the fact that conditions of higher substrate saturation (when the S/I ratio is higher) favor the growth of fermentative bacteria. These microorganisms use metabolic pathways whose final products are volatile fatty acids instead of methane. These metabolites can inhibit methanogenesis but contribute to the removal of volatile solids [32,33].
In addition to the above, there was an increase in the pH (0.16–0.4 tenths) at the end of the incubation period in the treatments in which an S/I ratio of 0.96 was used with respect to those treatments in which the S/I ratio was 0.48. The increase in pH could have been due to propionic acid accumulation. The accumulation of this acid may decrease methane production [34].
The variables “temperature” and “inoculum” had a positive effect. At a temperature of 40 °C, a greater removal of volatile solids was observed with respect to a temperature of 30 °C, regardless of the S/I value used. This indicated that the interaction between “S/I ratio” and “temperature” was not significant (Figure 7). The interaction between the variables “S/I ratio” and “inoculum” was significant (Figure 8). An inoculum concentration of 18.8 g VS/L favored the VS removal when the S/I ratio was 0.96. In contrast, at an S/I ratio of 0.48, the VS removal percentage was similar regardless of the inoculum concentration used.
The interaction between the variables “temperature” and “inoculum” also had a significant effect. Regardless of the concentration of inoculum used, the removal percentage was similar at 40 °C. But at 30 °C, an improved solids removal was produced when the inoculum concentration was 18.8 g VS/L (Figure 8).
Table 7 presents several methane production optimization studies conducted on different residues, including lignocellulosic residues. Among the studies listed in Table 7, only Zhang et al. [11] reported the removal of volatile solids in their experiments. It is worth noting that there is limited information available on the removal of volatile solids in optimization studies of anaerobic digestion using agricultural residues. Zhang et al. [11] reported a volatile solids removal of 14.33% when employing cotton stalk as a substrate. They utilized a second-order model to describe the relationship between VS removal and the independent variables: feed-to-inoculum (F/I) ratio and organic loading (OL). The R2 value of the model was 0.8363. In our study, we were able to develop a model that provides a better fit for explaining the behavior of VS removal compared to the model reported by Zhang et al. [11].
The highest average value of volatile solids removal in our study was 36.9%, achieved at an S/I ratio of 1.12, a temperature of 35 °C, and an inoculum concentration of 15.65 g VS/L. This value was also higher than that reported by Zhang et al. [11]. However, it is important to consider that the extent of removal can vary significantly depending on the specific substrate involved.

4. Conclusions

In the anaerobic mono-digestion tests from tomato plant waste performed in this study, the highest average value of methane yield was found to be 210.8 mL CH4/g VS at an S/I ratio of 0.48, 40 °C, and an inoculum concentration of 18.80 g VS/L. This represents an increase of 48% with respect to the minimum average value obtained of 142.4 mL CH4/g VS in the conditions of an S/I ratio of 0.72, a temperature of 35 °C, and an inoculum concentration of 10.35 g VS/L. On the other hand, the highest average value of volatile solids percentage was found to be 36.9% at an S/I ratio of 1.12, a temperature of 35 °C, and an inoculum concentration of 15.65 g VS/L. This represents an increase of 127% with respect to the minimum average value obtained of 16.3% in the conditions of an S/I ratio of 0.72, a temperature of 35 °C, and an inoculum concentration of 10.35 g VS/L.
It was determined that temperature was the factor with the greatest influence on methane production, while the S/I ratio was the factor with the greatest influence on volatile solids removal. It was found that the higher the S/I ratio, the greater the removal of volatile solids, despite the fact that the lowest methane production yields were obtained under these conditions.

Author Contributions

Conceptualization and methodology, G.M.L.R.-A., J.H.M.-M. and S.C.-M.; software, S.C.-M.; validation G.M.L.R.-A. and S.C.-M.; formal analysis S.C.-M.; investigation S.C.-M.; resources G.M.L.R.-A., J.H.M.-M. and R.C.-S.; data curation S.C.-M.; and writing—review and editing, G.M.L.R.-A., J.H.M.-M., R.C.-S. and S.C.-M. All authors have read and agreed to the published version of the manuscript.

Funding

This research received no external funding.

Data Availability Statement

Not applicable.

Acknowledgments

The authors are grateful for the support from the CONACYT scholarship to Sarai Camarena-Martínez, No. 442714.

Conflicts of Interest

The authors declare no conflict of interest.

References

  1. Khanal, S.K. Anaerobic Biotechnology for Bioenergy Production: Principles and Applications; Wiley: Blackwell, UK, 2008. [Google Scholar]
  2. Rao, P.R.V.; Baral, S.S.; Dey, R.; Mutnuri, S. Biogas generation potential by anaerobic digestion for sustainable energy development in India. Renew. Sustain. Energy Rev. 2010, 14, 2086–2094. [Google Scholar] [CrossRef]
  3. Lopez, M.J.; Masaguer, A.; Paredes, C.; Roca, L.; Ros, M.; Salas, M.C.; Boluda, R. Residuos orgánicos y agricultura intensive III. In Red Española de Compostaje; Ediciones Peaninfo SA: Madrid, Spain, 2015; Volume 45, p. 58. [Google Scholar]
  4. Li, Y.; Xu, F.; Li, Y.Y.; Lu, J.; Li, S.; Shah, A.M.; Zhang, X.; Zhang, H.; Gong, X.; Li, G. Reactor performance and energy analysis of solid state anaerobic co-digestion of dairy manure with corn stover and tomato residues. Waste Manag. 2018, 73, 130–139. [Google Scholar] [CrossRef] [PubMed]
  5. Almeida, P.A.; Rodrigues, R.M.; Teixeira, L.; Santos, A.; Martins, R.P.; Quina, M.J. Bioenergy Production through Mono and Co-Digestion of Tomato Residues. Energies 2021, 14, 5563. [Google Scholar] [CrossRef]
  6. Ruiz-Aguilar, G.M.L.; Nuñez-Palenius, H.G.; Lovanh, N.; Camarena-Martínez, S. Comparative Study of Methane Production in a One-Stage vs. Two-Stage Anaerobic Digestion Process from Raw Tomato Plant Waste. Energies 2022, 15, 9137. [Google Scholar] [CrossRef]
  7. Wang, X.; Yang, G.; Li, F.; Feng, Y.; Yang, G.; Han, X. Evaluation of two statistical methods for optimizing the feeding composition in anaerobic co-digestion: Mixture design and central composite design. Bioresour. Technol. 2013, 131, 172–178. [Google Scholar] [CrossRef]
  8. Sathish, S.; Vivekanandan, S. Parametric optimization for floating drum anaerobic bio-digester using Response Surface Methodology and Artificial Neural Network. Alex. Eng. J. 2016, 55, 3297–3307. [Google Scholar] [CrossRef] [Green Version]
  9. Kainthola, J.; Kalamdhad, A.S.; Goud, V.V. Optimization of methane production during anaerobic co-digestion of rice straw and hydrilla verticillata using response surface methodology. Fuel 2019, 235, 92–99. [Google Scholar] [CrossRef]
  10. Kainthola, J.; Kalamdhad, A.S.; Goud, V.V. Optimization of process parameters for accelerated methane yield from anaerobic co-digestion of rice straw and food waste. Renew. Energy 2020, 149, 1352–1359. [Google Scholar] [CrossRef]
  11. Zhang, H.; Khalid, H.; Li, W.; He, Y.; Liu, G.; Chen, C.W. Employing response surface methodology (RSM) to improve methane production from cotton stalk. Environ. Sci. Pollut. Res. 2017, 25, 7618–7624. [Google Scholar] [CrossRef]
  12. Wang, X.; Yang, G.; Li, F.; Feng, Y.; Ren, G. Response surface optimization of methane potentials in anaerobic co-digestion of multiple substrates: Dairy, chicken manure and wheat straw. Waste Manag. Res. 2012, 31, 60–66. [Google Scholar] [CrossRef]
  13. Ghaleb, A.; Kutty, S.R.M.; Ho, Y.; Hayder, G.; Noor, A.; Al-Sabaeei, A.M.; Almahbashi, N. Response Surface Methodology to Optimize Methane Production from Mesophilic Anaerobic Co-Digestion of Oily-Biological Sludge and Sugarcane Bagasse. Sustainability 2020, 12, 2116. [Google Scholar] [CrossRef] [Green Version]
  14. Saleh, A.F.; Kamarudin, E.; Yaacob, A.B.; Yussof, A.W.; Abdullah, M.Z. Optimization of biomethane production by anaerobic digestion of palm oil mill effluent using response surface methodology. Asia-Pac. J. Chem. Eng. 2011, 7, 353–360. [Google Scholar] [CrossRef]
  15. Rasouli, M.; Ajabshirchi, Y.; Mousavi, S.M.; Nosrati, M.; Yaghmaei, S. Process Optimization and Modeling of Anaerobic Digestion of Cow Manure for Enhanced Biogas Yield in a Mixed Plug-flow Reactor using Response Surface Methodology. Biosci. Biotechnol. Res. Asia 2015, 12, 2333–2344. [Google Scholar] [CrossRef] [Green Version]
  16. Sajeena, B.B.; Jose, P.P.; Madhu, G. Optimization of process parameters affecting biogas production from organic fraction of municipal solid waste via anaerobic digestion. Int. J. Bioeng. Life Sci. 2014, 8, 43–48. [Google Scholar] [CrossRef]
  17. Safari, M.; Abdi, R.; Adl, M.; Kafashan, J. Optimization of biogas productivity in lab-scale by response surface methodology. Renew. Energy 2018, 118, 368–375. [Google Scholar] [CrossRef]
  18. Camarena-Martínez, S.; Martínez-Martínez, J.M.; Saldaña-Robles, A.; Nuñez-Palenius, H.G.; Costilla-Salazar, R.; Valdez-Vazquez, I.; Lovanh, N.; Ruiz-Aguilar, G.M.L. Effects of experimental parameters on methane production and volatile solids removal from tomato and pepper plant wastes. Bioresources 2020, 15, 4763–4780. [Google Scholar] [CrossRef]
  19. Lara-Vázquez, A.R.; Sánchez, A.B.; Valdez-Vazquez, I. Hydration treatments increase the biodegradability of native wheat straw for hydrogen production by a microbial consortium. Int. J. Hydrogen Energy 2014, 39, 19899–19904. [Google Scholar] [CrossRef]
  20. APHA. Standard Methods for the Examination of Water and Wastewater, 21st ed.; American Public Health Association/American Water Works Association/Water Environment Federation: Washington, DC, USA, 2005. [Google Scholar]
  21. Kang, J.; Kim, K.; Oh, G.; Rhee, S. Analysis on biochemical methane potential of agricultural byproducts with different types of silage storage. J. Mater. Cycles Waste Manag. 2013, 16, 468–474. [Google Scholar] [CrossRef]
  22. Drosg, B.; Braun, R.; Bochmann, G.; Al Saedi, T. Analysis and characterisation of biogas feedstocks. In The Biogas Handbook; Elsevier: Amsterdam, The Netherlands, 2013; pp. 52–84. [Google Scholar] [CrossRef]
  23. Reungsang, A.; Pattra, S.; Reungsang, A. Optimization of Key Factors Affecting Methane Production from Acidic Effluent Coming from the Sugarcane Juice Hydrogen Fermentation Process. Energies 2012, 5, 4746–4757. [Google Scholar] [CrossRef] [Green Version]
  24. Abbasi, S.A.; Tauseef, S.M.; Abbasi, S.A. Biogas Energy; Springer: Berlin/Heidelberg, Germany, 2012. [Google Scholar] [CrossRef]
  25. Rodriguez-Chiang, L.; Dahl, O. Effect of Inoculum to Substrate Ratio on the Methane Potential of Microcrystalline Cellulose Production Wastewater. Bioresources 2014, 10, 898–911. [Google Scholar] [CrossRef]
  26. Budiyono, I.N.; Widiasa, S.; Seno, J. The Influence of Total Solid Contents on Biogas Yield from Cattle Manure Using Rumen Fluid Inoculum. Energy Res. J. 2010, 1, 6–11. [Google Scholar] [CrossRef] [Green Version]
  27. Shen, J.; Zhu, J. Modeling Kinetics of Anaerobic Co-Digestion of Poultry Litter and Wheat Straw Mixed with Municipal Wastewater in a Continuously Mixed Digester with Biological Solid Recycle Using Batch Experimental Data. Chem. Eng. Commun. 2017, 204, 501–511. [Google Scholar] [CrossRef]
  28. Zhou, Y.; Zhang, Z.; Nakamoto, T.; Li, Y.; Yang, Y.; Utsumi, M.; Sugiura, N. Influence of substrate-to-inoculum ratio on the batch anaerobic digestion of bean curd refuse-okara under mesophilic conditions. Biomass Bioenergy 2011, 35, 3251–3256. [Google Scholar] [CrossRef]
  29. Haider, M.S.; Zeshan Yousaf, S.; Malik, R.N.; Visvanathan, C. Effect of mixing ratio of food waste and rice husk co-digestion and substrate to inoculum ratio on biogas production. Bioresour. Technol. 2015, 190, 451–457. [Google Scholar] [CrossRef]
  30. Xu, S.; Karthikeyan, O.P.; Selvam, A.; Wong, J.W.C. Effect of inoculum to substrate ratio on the hydrolysis and acidification of food waste in leach bed reactor. Bioresour. Technol. 2012, 126, 425–430. [Google Scholar] [CrossRef] [PubMed]
  31. Córdoba, V.; Fernández, M.J.; Santalla, E. The effect of substrate/inoculum ratio on the kinetics of methane production in swine wastewater anaerobic digestion. Environ. Sci. Pollut. Res. 2017, 25, 21308–21317. [Google Scholar] [CrossRef]
  32. Li, Y.; Li, Y.Y.; Zhang, D.; Li, G.; Lu, J.; Li, S. Solid state anaerobic co-digestion of tomato residues with dairy manure and corn stover for biogas production. Bioresour. Technol. 2016, 217, 50–55. [Google Scholar] [CrossRef]
  33. Valdez-Vazquez, I.; Torres-Aguirre, G.A.; Molina, C.A.; Ruiz-Aguilar, G.M.L. Characterization of a Lignocellulolytic Consortium and Methane Production from Untreated Wheat Straw: Dependence on Nitrogen and Phosphorous Content. Bioresources 2016, 11, 4237–4251. [Google Scholar] [CrossRef] [Green Version]
  34. Fang, H.H.P.; Liu, H. Effect of pH on hydrogen production from glucose by a mixed culture. Bioresour. Technol. 2002, 82, 87–93. [Google Scholar] [CrossRef]
Figure 1. Pareto chart for methane production yield (mL CH4/g VS). Green bars mean positive effect and blue bars mean negative effect. Blue line is reference line of significance.
Energies 16 05412 g001
Figure 2. Response surface (a) and contour plot (b) for methane production yield (mL CH4/L) depending on “S/I ratio” and “temperature”.
Energies 16 05412 g002
Figure 3. Response surface (a) and contour plot (b) for methane production yield (mL CH4/L) depending on “S/I ratio” and “inoculum (g VS/L)”.
Energies 16 05412 g003
Figure 4. Response surface (a) and contour plot (b) for methane production yield (mL CH4/L) depending on “temperature” and “inoculum (g VS/L)”.
Energies 16 05412 g004
Figure 5. Pareto chart for volatile solids removal (%). Green bars mean positive effect and blue bars mean negative effect. Blue line is reference line of significance.
Energies 16 05412 g005
Figure 6. Response surface (a) and contour plot (b) for volatile solids removal (%) depending on “S/I ratio” and “temperature”.
Energies 16 05412 g006
Figure 7. Response surface (a) and contour plot (b) for volatile solids removal (%) depending on “S/I ratio” and “inoculum (g VS/L)”.
Energies 16 05412 g007
Figure 8. Response surface (a) and contour plot (b) for volatile solids removal (%) depending on “temperature” and “inoculum (g VS/L)”.
Energies 16 05412 g008
Table 1. Central composite design 23 for evaluation of experimental parameters on methane production from TPW.
FactorsLevels
−2−10+1+2
A: Substrate/inoculum ratio0.320.480.720.961.12
B: Temperature (°C)27.0030.0035.0040.0043.00
C: Inoculum (g VS/L)10.3512.5015.6518.8020.95
Table 2. Fractional factorial design matrix for experimental VS predicted methane production yield and VS removal.
RunABCMethane Production Yield (mL/g VS)VS Removal (%)
ExperimentalPredictedExperimentalPredicted
10.964012.50158.1 ± 1.6152.731.0 ± 0.229.5
20.963012.50158.0 ± 1.9149.521.9 ± 0.622.9
30.484018.80210.8 ± 0.5 203.522.6 ± 1.920.9
40.483018.80179.4 ± 0.7169.120.2 ± 1.621.0
50.483012.50161.7 ± 3.7154.818.4 ± 1.617.9
60.964018.80182.2 ± 1.0173.332.8 ± 0.132.6
70.723515.65188.1 ± 2.5183.929.9 ± 1.829.7
80.723515.65176.4 ± 14.0183.931.2 ± 1.829.7
90.963018.80172.2 ± 7.8171.132.4 ± 1.230.8
100.484012.50204.8 ± 3.3190.221.6 ± 0.622.6
110.724315.65183.7 ± 1.6194.628.0 ± 0.628.8
120.723510.35142.4 ± 4.4152.816.3 ± 0.415.8
130.723515.65188.2 ± 1.2183.928.9 ± 2.529.7
140.723515.65175.5 ± 6.4183.928.8 ± 2.929.7
150.323515.65169.9 ± 11.0182.623.9 ± 0.423.6
161.123515.65149.2 ± 2.8152.736.9 ± 0.137.7
170.723520.95176.3 ± 1.3182.119.9 ± 2.620.9
180.722715.65157.6 ± 3.3163.023.6 ± 0.423.4
Table 3. Regression analysis of variance (ANOVA) of the model.
SourceSum of SquaresDegree of FreedomMean SquareF Valuep-Value Prob > F
Model8661.589962.4025.23 *<0.0001
A: S/I ratio2150.5812150.5856.38<0.0001
B: Temperature2414.7212414.7263.31<0.0001
C: Inoculum2076.2112076.2154.43<0.0001
AB1034.9011034.9027.13<0.0001
AC53.38153.381.400.2501
BC0.931310.93130.02440.8773
A2610.491610.4916.000.0006
B261.32161.321.610.2187
C2622.981622.9816.330.0006
Residual801.022138.14
Lack of fit463.71592.744.40 **0.0104
Pure error337.311621.08
Cor total10,886.0031
* Significant at 5% level; ** not significant.
Table 4. Response surface modeling.
Standard deviation = 6.18Mean = 173.39CV = 3.56
R2 = 0.9153Adj R2 = 0.8791Pred R2 = 0.8075
SCRP = 1821.66Adequate precision = 18.037
Table 5. Regression analysis of variance (ANOVA) of the model.
SourceSum of SquaresDegree of FreedomMean SquareF Valuep-Value Prob > F
Model1055.279117.2554.10 *<0.0001
A: S/I ratio478.571478.57220.82<0.0001
B: Temperature71.96171.9633.20<0.0001
C: Inoculum64.64164.6429.83<0.0001
AB3.8613.861.780.1962
AC23.11123.1110.660.0037
BC22.52122.5210.390.0041
A22.0212.020.93390.3448
B230.08130.0813.880.0013
C2296.021296.02136.59<0.0001
Residual45.51212.17
Lack of fit25.3955.084.04 **0.0147
Pure error20.13161.26
Cor total1101.9331
* Significant at 5% level; ** not significant.
Table 6. Response surface modeling.
Standard deviation = 1.47Mean = 25.53CV = 5.77
R2 = 0.9587Adj R2 = 0.9409Pred R2 = 0.9017
SCRP = 108.19Adequate precision = 25.4024
Table 7. Comparative table of studies for the optimization of biogas from lignocellulosic waste.
SubstrateVariables Evaluated
(Levels)
Optimal ConditionsYieldRef.
Palm oil mill effluent and fruit bunches as co-substrateTemperature (20–50 °C)
Co-substrate (0–6 g)
Substrate (50–100 mL)
47.8 °C, 50.4 mL substrate, 5.7 g co-substrate57.4 mL biogas/g COD[14]
Co-digestion between dairy manure (DM), chicken manure (CM), and wheat strawC/N (15:1–35:1)
DM/CM (100:0–0:100)
Initial feed load (9–21 g VS/L)
I/S 0.5–3.5)
C/N 26.31, DM/CM 42.96:57.04, Initial feed load 15.90 g VS/L, I/S 2.34394 mL CH4/g VS[12]
Co-digestion between dairy manure (DM), chicken manure (CM), and rice straw (RS)C/N (15–35),
DM/CM (0–100)
44.5% DM, 35.0% CM, 20.5% RS
C/N 24.7
343 mL CH4/g VS[7]
Municipal solid wasteSubstrate (83.0–115.0 g ST/L), initial pH (6–7), total organic carbon (TOC) (16.8–23.9)99 g ST/L substrate, pH 6.5, 20.32 g TOC/L53.4 mL biogas/g VS[16]
Cow manureOrganic loading rate (OLR) (0.82–4.2 kg VS/m3-d), temperature (8.1–66.9 °C)
Agitation (0–100 rpm)
OLR 3.15 kg VS/m3-d, 37.7 °C, 20.3 rpm/10 min every 2 h113 mL CH4/g VS[15]
Rice strawTemperature (40–60 °C), pH (6.8–7.6), substrate (90–130 kg), shaking time (2–10 s)50 °C, pH 7.5, 110.7 kg of substrate, 5 s shaking725 mL biogas/g VS[8]
Canola waste with cow manureTemperature (15–60 °C), substrate (5–11% ST), inoculum (0–50% ST), shaking time (1–5 min/d)40.4 °C, 7.4% TS substrate, 3.6 min/d shaking, 26.3% ST inoculum376.8 mL CH4/g VS[17]
Cotton stalk (CS)Organic loading (OL) (5.86–34.14 g VS/L), feed-to-inoculum (F/I) ratio (0.29–1.71)F/I of 0.79, OL 25.61 g VS/L70.2 mL CH4/g VS
[11]
Rice straw and Hydrilla verticillataC/N (14.89–40.11), food/microorganisms (F/M) (0.15–4.35), pH (6.16–7.84)C/N 29.7, F/M 2.15, pH 7.34287.60 mL CH4/g VS added[9]
Rice straw and food wasteInitial pH (6.43–7.57), F/M ratio (0.48–4.02)pH 7.32, F/M 1.87323.8 mL CH4/g VS added[10]
Oily biological sludge and sugarcane bagasseC/N (20–30), VS co-substrate/VS inoculum (0.06–0.18)C/N ratio of 30, VS co-substrate/VS inoculum 0.18 *63.5 mL CH4/g VS removed[13]
Tomato plant wasteTemperature (27–43 °C), S/I ratio (0.32–1.12), inoculum (10.35–20.95 g VS/L)S/I 0.48, 40 °C, 18.8 g VS/L *210.8 mL CH4/g VS *This study
* Maximum performance obtained in the DCC tests; the optimum was not found within the evaluated ranges of the variables.
Disclaimer/Publisher’s Note: The statements, opinions and data contained in all publications are solely those of the individual author(s) and contributor(s) and not of MDPI and/or the editor(s). MDPI and/or the editor(s) disclaim responsibility for any injury to people or property resulting from any ideas, methods, instructions or products referred to in the content.

