Article

A Joint Clearing Model of Energy-Frequency Modulation Based on Flexible Block Order

1
Department of Economics and Management, North China Electric Power University, Baoding 071003, China
2
Beijing Key Laboratory of New Energy and Low-Carbon Development, North China Electric Power University, Baoding 071003, China
*
Author to whom correspondence should be addressed.
Energies 2023, 16(14), 5413; https://doi.org/10.3390/en16145413
Submission received: 26 June 2023 / Revised: 10 July 2023 / Accepted: 15 July 2023 / Published: 16 July 2023
(This article belongs to the Section K: State-of-the-Art Energy Related Technologies)

Abstract

:
The large-scale integration of renewable energy into the grid has led to a gradual diversification of power generation trading units on the power-side, with varying operational characteristics, costs, and trading needs among diverse power generation trading units. Traditional power system clearing models face challenges. Block order is a bidding type that allows for multiple volume–price combinations. At the same time, the randomness and volatility of renewable energy poses challenges to the safe and stable operation of the system. Building a power system clearing model that meets the diverse and flexible needs of the power system has become an important consideration. Therefore, this paper considers the design of three flexible energy blocks: a sustaining block, flux block, and adjustment block to meet the differential needs of diverse trading units and establishes a flexible block order clearing model. Secondly, it establishes a joint clearing model of electrical energy and frequency modulation (FM) to ensure the stable and reliable operation of the system, and solves the model based on relevant constraints to determine the winning electrical energy price and FM price. The CPLEX and Yalmip algorithms are used to solve the model. Finally, a case study was conducted based on an improved IEEE 14-bus system. The results showed that the model proposed in this paper can satisfy the differential needs of diverse trading units, effectively improve the renewable energy consumption capacity, and reduce the prices of the energy market and frequency modulation market. Also, the standard deviation of the net load of the system is relatively low, which improves the reliability of the power system’s operation.

1. Introduction

In 2021, China proposed to build a new type of power system under the background of the “Dual Carbon” goal [1]. And, it is pointed out that efforts should be made to improve utilization efficiency, implement renewable energy substitution actions, and deepen the reform of the power system. Under this goal, renewable energy is rapidly developing and continues to be connected to the grid at a high proportion [2]. By the end of 2022, China’s renewable energy generation capacity reached 2.7 trillion kWh, accounting for 31.3% of the national power generation capacity and 81% of the country’s renewable power generation [3,4].
With the large-scale integration of renewable energy into the grid, the proportion of clean and low-carbon power sources continues to increase [5,6,7]. The power-side is facing a shift from being dominated by thermal power units to being dominated by renewable energy generation units, and gradually forming a diversified power generation system [8,9,10]. The operational characteristics, cost, and trading requirements of diversified power generation systems vary. The power-side faces diverse demands. The traditional clearing model cannot satisfy the differentiated needs of diversified power generation trading units. There is an urgent need to build a new clearing model to better achieve the optimal allocation of power resources. Also, renewable energy generation has strong uncertainty [11], which poses great challenges to the safe and stable operation of the power system. Ensuring the flexibility of the power system is crucial [12], and the demand for power flexibility resources such as frequency regulation, peak shaving, and slope climbing has significantly increased [13,14,15]. There is an urgent need to propose a joint clearing trading model for electricity energy and frequency modulation auxiliary services targeting a high proportion of renewable energy, ensuring the safe and stable operation of the system.
In order to solve the problems brought to the power system by the high proportion of renewable energy on the grid, scholars have carried out a series of studies and made some achievements. In the literature [16,17,18], considering the volatility and randomness of wind power, a higher level of rotating reserve is proposed to enhance the stability and security of power system operation. The authors in [19] proposed adding rolling models to flexibly adjust the start-down state of the units to cope with the uncertainty brought by large-scale renewable energy grid connection. The authors in [20] proposed to deal with the uncertainty brought by renewable energy power generation by increasing the number of response units. The authors in [21,22,23] proposed more accurate wind power forecasting technology to reduce the uncertainty of power system. The authors in [24] proposed an energy management strategy based on distributed elastic double gradient descent to solve the optimal energy trading path between energy hubs. The authors in [25] proposed a clearance model based on power transfer distribution factor correction. Real-time conductor temperature can be calculated more accurately. The authors in [26] considered the strategies of risk avoidance and risk seeking and proposed a two-stage mixed random information gap decision model based on the commitment framework of network constraint units. The above literature is based on the research and analysis of the power generation characteristics of a single type of renewable energy, giving studies to ensure system stability. In recent years, in the process of renewable energy grid integration, a diversified power generation system has been gradually formed. The research on power generation for a single type of renewable energy is difficult to fully adapt to the differentiated needs of multiple generation entities.
At present, the electrical energy clearing trading model in the spot market is essentially a time-sharing clearing model. It is difficult to fully adapt to multiple power generation units. Compared to the time-sharing bidding model, the segmented model is simpler to calculate and can also solve the start-up and shutdown problems of units [27,28]. The authors in [29] proposed to divide the load into basic load and fluctuating load, and establish a corresponding mixed clearing model with time division and segmentation. The European unified power market defines the load that lasts for a certain period of time as a block order (BO), which serves as a standardized trading target for the power market while bidding simultaneously [30,31,32,33]. The authors in [34,35] proposed an improved algorithm for clearing blocks, allowing market trading entities to declare output curves. However, current research on block order focuses on how to establish blocks to satisfy the comprehensive needs of system peak loads. The lack of research and analysis on the technical characteristics and development trends of the power supply main body cannot support the construction of the power-side of China’s new power system.
A frequency modulation (FM) auxiliary service handles real-time differences between predicted and actual net loads by reserving FM capacity by the winning bidder and adjusting the power generation output during real-time calls. Their response time is short, and they require a high FM performance from the provider. The large-scale grid connection of renewable energy has increased the workload and difficulty of frequency regulation in the power grid, and traditional frequency regulation methods are no longer able to better adapt to the frequency regulation needs of the system [36,37]. Due to the coupling relationship in the capacity, the spot market of electrical energy is highly correlated with the market clearing model of the FM auxiliary service. The joint clearing of the electrical energy market and auxiliary service market will obtain better overall economic benefits, which can fully reflect the opportunity cost of power flexibility resources [38]. In order to stimulate the improvement and development of the FM auxiliary service market, various countries have successively issued policies related to auxiliary service [39,40,41]. The United States has mainly adopted the joint optimization market model of energy-FM clearing [42,43], while Europe has mainly adopted the segmented clearing model in the balanced market. At present, the FM auxiliary service market in China is still in its early stages and is striving to improve [44,45,46]. At present, there are some studies in the literature on the optimization of FM services, and the authors in [47] studied the setting of FM performance indicators. Reference [48] proposed an FM auxiliary market design model for decomposing medium- to long-term electrical energy contracts and verified its overall effectiveness. In addition, some scholars have conducted research on the combination of power generation units in frequency regulation services. Reference [49] proposes a joint control strategy for primary frequency regulation, with the frequency regulation of thermal power units as the main control and wind turbine units as the auxiliary control. The clearing coordination mechanisms of electricity energy and FM auxiliary service markets in different domestic and foreign power markets are different. Because load aggregators have good FM performance and their operation has strong time-period coupling, there is no research and analysis on the clearing coordination mechanism of spot electricity energy and the FM ancillary service markets of load aggregators at present. In addition, China’s power spot market is still in the initial stage of construction and has not yet formed mature experience for reference. Therefore, studying the market mechanism of electricity energy and the frequency modulation auxiliary service including load aggregators and conducting frequency modulation cost analysis has important theoretical value and practical significance.
The above research did not conduct targeted analysis on the differentiated needs of diversified power generation trading units after a high proportion of renewable energy is connected to the grid. Meanwhile, the high proportion of renewable energy connected to the grid places higher demands on the flexibility of the power system. The electricity energy clearing model needs to enhance flexibility. Based on this, this paper established a two-stage joint clearing model for electric energy and frequency modulation based on block order. Firstly, based on the differentiated physical and economic characteristics of diversified power generation entities and diversified trading needs, this paper improved the existing block in the European market, designing three flexible blocks: sustaining block, flux block, and adjustment block, which are more in line with the development trend of the power system’s power-side. Also, this paper established a clearing model based on diversified flexible block order, allowing for simultaneous bidding of three blocks. Afterwards, a joint clearing model of electric energy and frequency modulation was established to enhance the flexibility of the power system.
The rest part of this paper is organized as follows. The trading mode and market framework of the power system is detailed in Section 2. Section 3 proposes a two-stage joint clearing model for electrical energy and frequency modulation based on flexible block order. Numerical case studies are conducted in Section 4. Finally, conclusions are drawn in Section 5.

2. Power System Trading Model and Market Framework

The high proportion of renewable energy connected to the grid poses a challenge to the stable operation of the power system. The main provider of power generation units on the power-side has shifted from thermal power units to renewable energy generation units and requires a reduction in wind and solar waste. The power-side is gradually becoming diversified, with varying demands for various types of generator units [10].
Therefore, this paper first introduces the block order model in the first stage, allowing blocks with multiple quantity–price combinations to bid simultaneously, satisfying the development trend of diversified power generation units on the power-side. First, set priority for the blocks. Ensure the electricity consumption of residents on the load-side. Priority should be given to ensuring the consumption of renewable energy. Then, in the second stage of market clearing, frequency modulation auxiliary services will be introduced, which will be provided by thermal power units and load aggregators to improve the flexibility requirements of the power system. Next, learn from the experience of the spot market of New York ISO (NYISO), establish a joint clearing mechanism of energy-FM, and effectively respond to frequent and large fluctuations in the frequency of the power system under the scenario of a high proportion of renewable energy being used [50].

2.1. Multiple Flexible Block Order

The block order designed by the European spot market is a bidding type that allows a variety of quantity price combinations, including conventional blocks, movable blocks, linked blocks, and extended linked blocks [10,20]. It allows generator units and load-side users to choose a suitable flexible block order for bidding based on the characteristics of the power generation technology and actual electricity demand, reflecting trading willingness, and participation in market competition, with all trading varieties being centrally auctioned and cleared [30,31]. To support the construction of the new power system and serve the construction of the new power market, this paper established a multiple flexible block order clearing model based on the physical and economic characteristics and trading needs of multiple market entities.

2.1.1. Trading Demand

In the new power system, renewable energy sources on the power-side will become the main body. Conventional thermal power units will shift from being “energy providers” to being “flexible resource providers”. Thermal generation will be used for system peaking through flexibility modification. Nuclear power, hydropower, and other zero-carbon energy sources with stable output are responsible for the base load of the system. Wind power and photovoltaic have strong uncertainty and high output volatility, and priority is given to overall clearing [51]. On the load-side, considering China’s basic national conditions, the dual track model of coexisting power system planning and market in China will still exist for a period of time. Residential electricity needs to be prioritized on the load-side, and industrial electricity has a large scale and stable load [52]. In addition, load aggregators are added to the load side. Compared to ordinary load-side users, load aggregators package and collaborate on a large scale, optimizing the flexibility of producers and consumers, and minimizing costs [53]. The loads are aggregated and the optimal quotation declared. Load aggregators represented by electric vehicles have high demand elasticity and strong regulation capabilities [54]. The technical and economic characteristics parameters of each trading unit are shown in Table 1 and Table 2 [55,56].

2.1.2. Trading Variety

In order to promote the high proportion consumption of renewable energy and comprehensively consider the diverse technical and economic characteristics of the trading units in the power market, this article proposes a multiple flexible block order model, and designs three types of flexible block order varieties: sustaining Block (SB), flux Block (FB), and adjustment Block (AB) for simultaneous bidding. The trading clearing rules are shown in Table 3.
The sustaining block consists of single power price, continuous power, start time, and end time. The start time and end time are set according to the load peak and load valley conditions. Continuous power reflects the continuity of electricity production and consumption. On the source-side, the sustaining block is responsible for the baseload portion of the power and is applicable to the main transaction offer for maintaining a stable load such as nuclear power and biomass power generation. On the load-side, commercial power and industrial power consumption is large, the load is stable and the declaration of continuity is fast.
The flux block consists of a single power price and different power segments. The flux block as a whole is prioritized for clearing to satisfy the uncertain needs of renewable energy power generation. At the same time, it is suitable for giving priority to the need of ensuring residential power consumption.
The adjustment block consists of prices and electricity for different periods. The price and power quantity in each period are independent of each other and are matched high and low, with uniform marginal clearing. The adjustment block is applicable to the traditional thermal power transaction quotation, where prices are bid centrally during peak and trough periods, reflecting the time value of power.

2.2. Energy-FM Joint Clearing Trading Framework

The high proportion of renewable energy in the power system is connected to the grid, and the system needs to operate stably, reliably, and economically, with a frequency regulation ability and climbing ability to cope with the uncertainty of load during peak and valley periods, and to ensure the priority consumption of renewable energy as much as possible. In order to solve the problems brought to the power system by the high proportion of renewable energy on the grid, scholars have carried out a series of studies and made some achievements. In the literature [16,17,18], considering the volatility and randomness of wind power, a higher level of rotating reserve was proposed to enhance the stability and security of power system operation. The authors in [19] proposed adding rolling models to flexibly adjust the start-down state of the units to cope with the uncertainty brought by large-scale renewable energy grid connection. This paper improves the flexibility of the power system through the joint operation of the electrical energy market and frequency modulation auxiliary service market. The electrical energy and FM auxiliary service market clearing coordination mechanisms in various countries’ markets are different. This paper takes the New York ISO (NYISO) market clearing mechanism for improvement, and uses energy-FM joint clearing trading. The overall trading framework is shown in Figure 1. The design idea is to comprehensively consider the constraints of the power grid and unit operation, with the goal of minimizing the total cost of the system and adopt a joint clearing method to determine the winning output curve of the unit and the winning frequency curve, solving real-time system balancing issues. Generators and load aggregators participate as trading units in the electrical energy market and frequency modulation market. The trading unit shall bid for the declared energy quantity and price in the electrical energy market and declare the FM capacity/mileage and corresponding price in the frequency modulation market. Independent system operation (ISO) conducts joint clearing of the electrical energy and frequency regulation market based on declared information and load demand.
In the electrical energy market, the unit on the power-side reports quantity and quotes, while the user in load-side only reports quantity. The trading units on the power-side include thermal power units, renewable energy units, and load aggregators. The unit shall declare corresponding operating parameters and output prediction curves to ISO based on operating costs and technical characteristics. With the load-side declaration load prediction curve, the goal is to minimize the cost of electrical energy according to the source of the system, and realize the centralized clearing of the electrical energy market, by calculating the local marginal price (LMP) of the system nodes and the unit output curve [57].
In the frequency modulation auxiliary service market, the system determines the FM demand based on the total load on the operating day. Based on the winning bid results obtained from the block order model, the FM auxiliary service trading unit applies for FM capacity/mileage and corresponding quotes to ISO. To determine the performance index parameters of each unit by the system, ISO focuses on clearing the FM market with the goal of minimizing system FM compensation based on system FM capacity requirements. Then, the bid winning capacity of each unit at each time period is calculated and the frequency regulation clearing price is determined.

3. A Joint Clearing Model of Energy-FM Based on Flexible Block Order

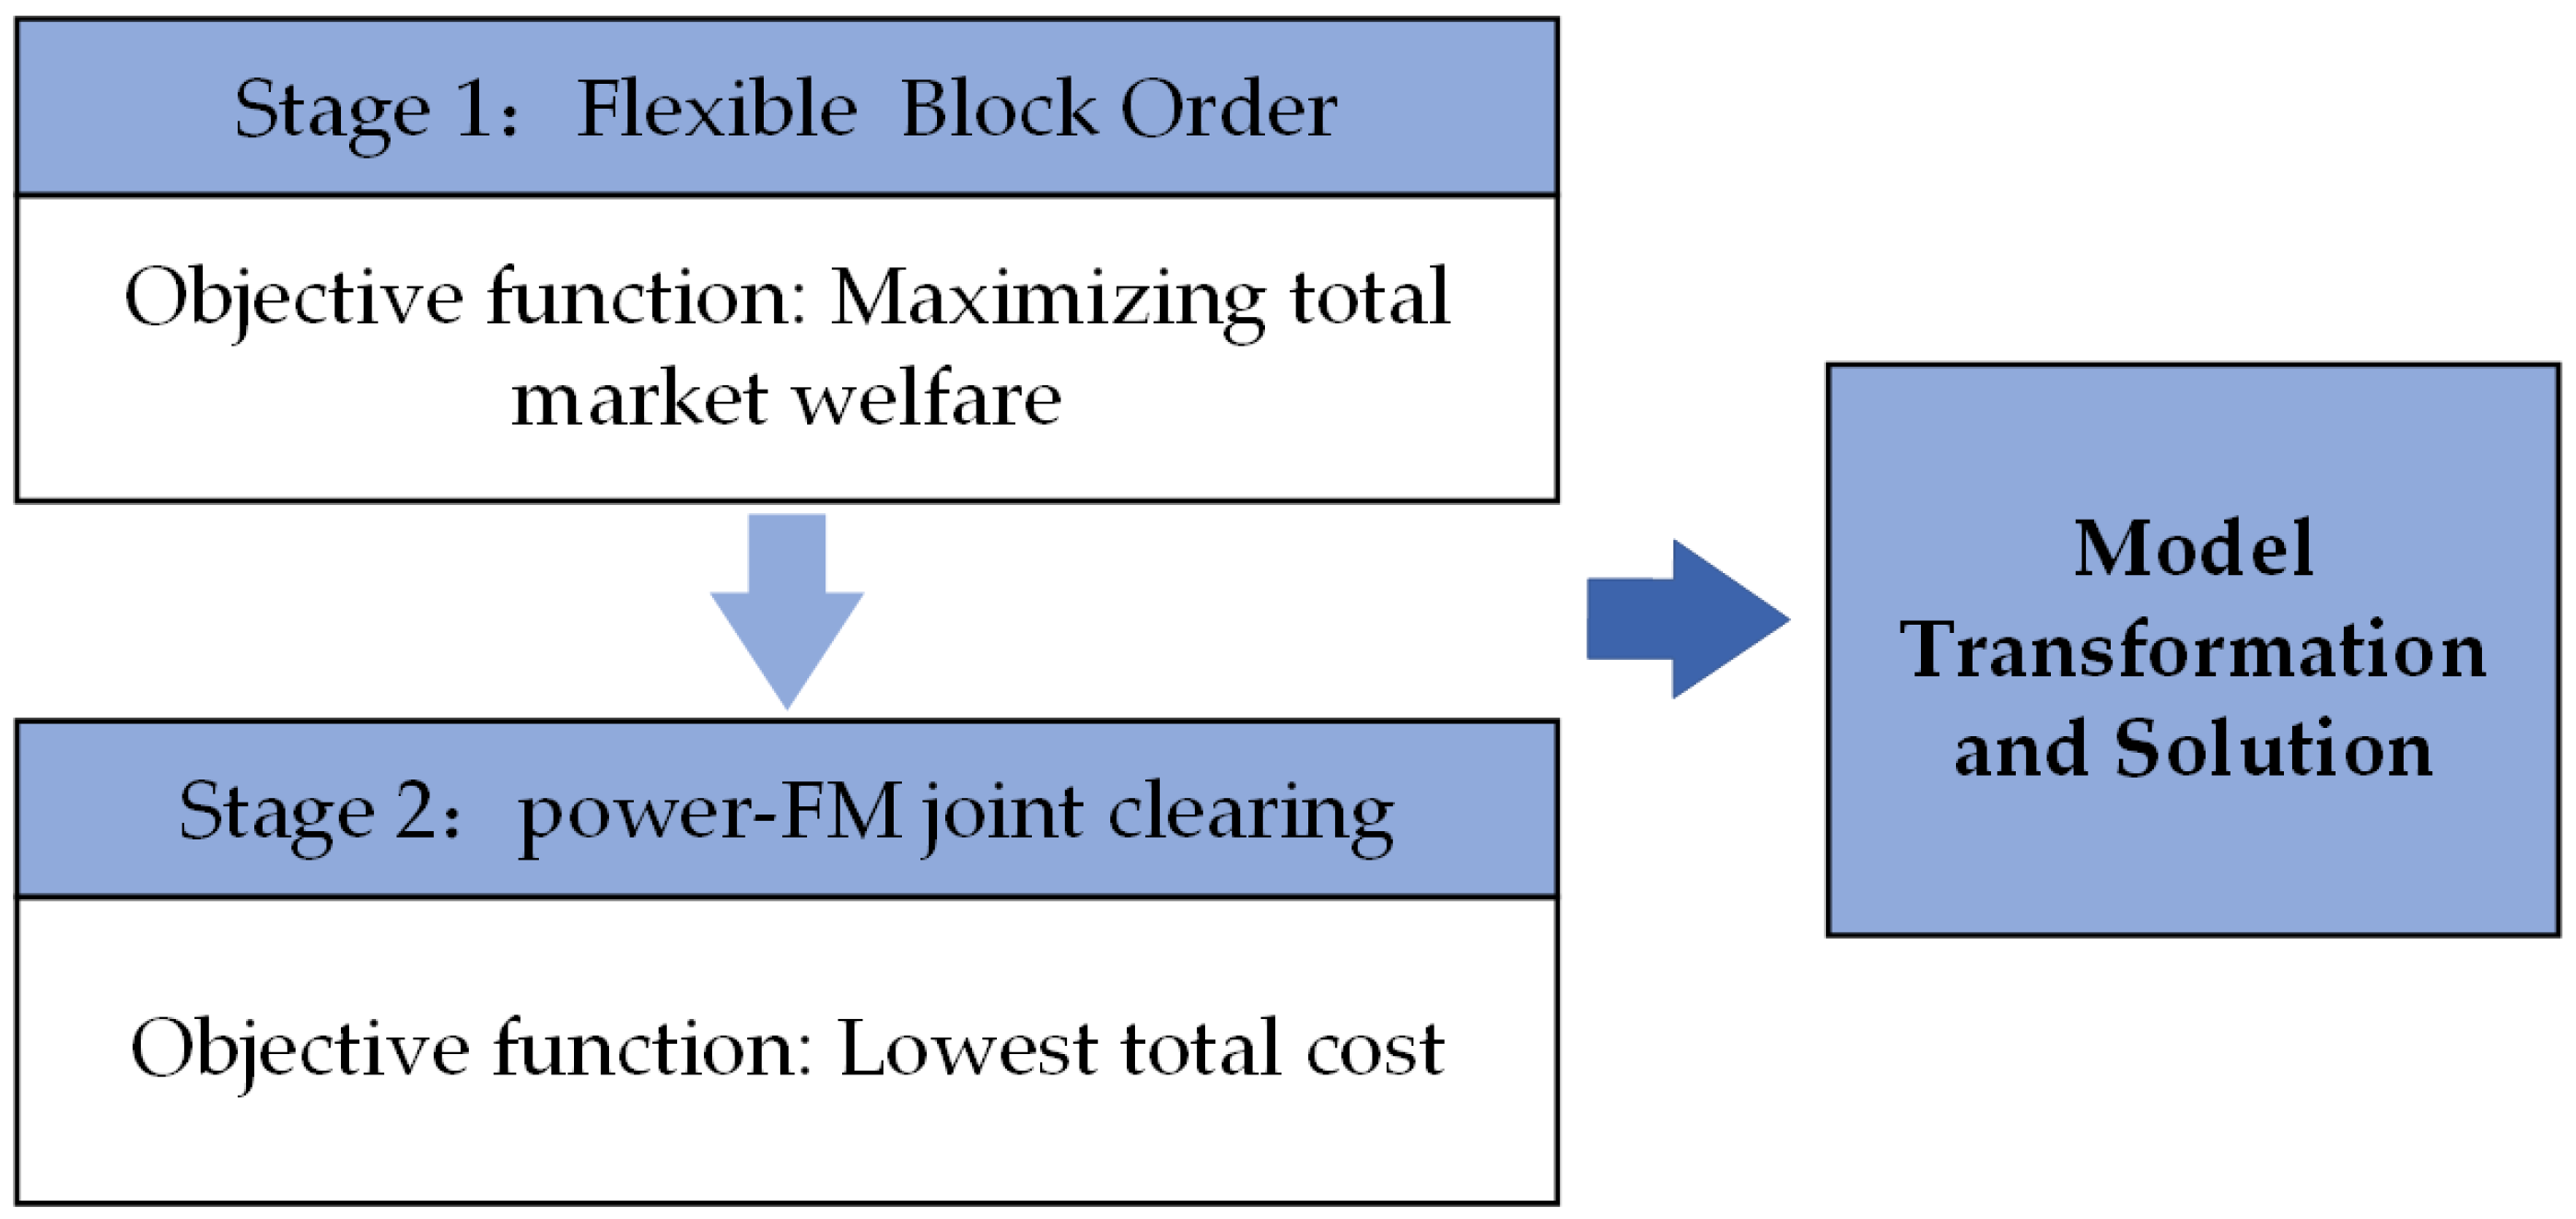
Based on the multiple flexible block order model and the energy-FM joint clearing trading framework, a two-stage clearing model was constructed, as shown in Figure 2. The first stage aims to build a flexible block order model with the goal of maximizing the total market welfare. The second stage aims to construct an energy-FM joint clearing model with the goal of minimizing the sum of electrical energy cost and FM auxiliary service cost.

3.1. Stage 1: Flexible Block Order Model

3.1.1. Objective Function

The flexible block order model takes the maximum total market welfare as the objective function. The input power is positive and the output power is negative. The objective function is as follows:
max W = i ( P i S B E i S B , C + P i F B E i F B , C + P i A B E i A B , C )
P i S B , P i F B , and P i A B are the power price vector set declared by trading unit i of the sustaining block, the flux block, and the adjustment block. E i S B , C , E i F B , C , and E i A B , C are the clearing power vector set of trading unit i of the sustaining block, the flux block, and the adjustment block.

3.1.2. Constraint Equation

The flexible block order model includes three parts: sustaining block (SB), flux block (FB), and adjustment block (AB) declaration data and constraints.
  • SB
The sustaining block consists of single power price, continuous power, start time, and end time. The start time and end time are set according to the load peak and load valley conditions.
Q i S B = { P i S B , E i S B , T i S B , S , T i S B , E }
P i S B = ( p i , 1 S B , p i , t S B )
P i S B = { E i S B T i S B , E T i S B , S T i S B , E t T i S B , S 0 t < T i S B , S , t > T i S B , E
E i S B = ( e i , 1 S B , , e i , t S B )
T i S B , S t T i S B , E
e i , t S B , C e i , t S B
E i S B , C = ( e i , 1 S B , C , , e i , t S B , C )
where Q i S B is the sustaining block quotation vector set of trading unit i. E i S B is the power consumption vector set declared by trading unit i of the sustaining block. T i S B , S and T i S B , E are the start time and the end time of trading unit i of the sustaining block. p i , t S B refers to the declared power price of trading unit i of the sustaining block in t period. e i , t S B refers to the declared power of trading unit i of the sustaining block in t period. e i , t S B , C is the clearing power of trading unit i of the sustaining block in t period.
2.
FB
The flux block consists of a single power price and different power segments, clearing together as a whole.
Q i F B = { P i F B , E i F B }
P i F B = ( p i , 1 F B , p i , t F B )
E i F B = ( e i , 1 F B , e i , t F B )
E i F B , C = ( e i , 1 F B , C , , e i , t F B , C )
e i , t F B , C = u i , t F B , C e i , t F B
0 e i , t F B , C e i , t F B
where Q i F B is the flux block quotation vector set of trading unit i. E i F B is the power consumption vector set declared by trading unit i of the flux block. p i , t F B refers to the declared power price of trading unit i of the flux block in t period. e i , t F B refers to the declared power of trading unit i of the flux block in t period. e i , t F B , C is the clearing power of trading unit i of the flux block in t period. u i , t F B , C is the 0–1 variable of the clearing status of trading unit i of the flux block in t period.
3.
AB
The adjustment block is composed of prices and power consumption at different time periods. The prices and power consumption of each time period are independent of each other.
Q i A B = { P i A B , E i A B }
P i A B = ( p i , 1 A B , , p i , t A B )
E i A B = ( e i , 1 A B , , e i , t A B )
e i , t A B , C e i , t A B
E i A B , C = ( e i , 1 A B , C , , e i , t A B , C )
where Q i A B is the adjustment block quotation vector set of trading unit i. E i A B is the power consumption vector set declared by trading unit i of the adjustment block. p i , t A B refers to the declared power price of trading unit i of the adjustment block in t period. e i , t A B refers to the declared power of trading unit i of the adjustment block in t period. e i , t A B , C is the clearing power of trading unit i of the adjustment block in t period.

3.2. A Joint Clearing Model of Energy-FM

3.2.1. Objective Function

The energy-FM joint clearing model aims to minimize the total system cost as the objective function. It simultaneously considers minimizing the total cost of purchasing electrical energy and the FM auxiliary service. The first item is the start-up and shutdown costs, maintenance costs, maintenance costs on the power-side and storage-side, and frequency FM costs during the power system clearing process. The second item is the cost of grid-side losses. The objective function is as follows:
min F = t T i I ( u i , t C c u , i , t + e i , t p i , t + e c o n , i , t c c o n , i , t + e e s c i , t c e s c , i , t + M i , t p i , t m i l s i m c A i + R i , t p i , t c a p A i ) + S L t T e t C
where u i , t C is the 0–1 variables of the shut-down of the generation unit i in t period. e i , t refers to the declared electrical energy of the generation unit i in t period. p i , t is the declared power prices of nuclear power, biomass power, PV, wind power, coal power, and gas power generation unit i in t period. e c o n , i , t is the installed capacity of unit i in t period. c c o n , i , t is the maintenance cost of unit i in t period. S L is the load loss cost coefficient. e t C is the total clearing power in t period. R i is the FM capacity. M i is the FM mileage. p i c a p is the FM capacity price. p i m i l is the FM mileage price. A i is the FM performance index. s i m c is the capacity ratio of FM.

3.2.2. Constraint Equation

The energy-FM joint clearing model mainly includes three types of constraint conditions: unit constraints, system constraints, and network power flow constraints. The following will provide a detailed introduction to the various constraints.
  • Unit Constraints
Unit constraints include unit power constraints, unit climbing constraints, and frequency FM capacity/mileage constraints. Formulas (21)–(23) are the unit power constraints. Formulas (24) and (25) are the unit climbing constraints. Formulas (26)–(31) are the FM capacity constraints and FM mileage constraints.
e i , t C = e i , t S B , C + e i , t F B , C + e i , t A B , C
e t C = i = 1 k e i , t C
e i C min e i , t C e i C max
e i , t C e i , t 1 C Δ e i U
e i , t C e i , t 1 C Δ e i D
R i = t T R i , t u p + t T R i , t d n
0 R i , t u p R i p
0 R i , t d n R i d
M i = t T M i , t u p + t T M i , t d n
R i , t u p M i , t u p s i m c R i , t u p
R i , t d n M i , t d n s i m c R i , t d n
where e i , t C is the clearing power quantity of the trading unit i in t period. e i C is the total clearing power in t period. e i C max and e i C min are the upper and lower power limits of trading unit i. Δ e i U and Δ e i D are the limit values of the corresponding rate of up and down adjustment of trading unit i. R i , t u p and R i , t d n are the upper and lower FM capacities of frequency modulation supplier i in t period. M i , t u p and M i , t d n are the upper and lower FM mileage of FM supplier i in t period.
2.
System Constraints
System constraints include system power balance constraints, reserve capacity constraints, and FM capacity/mileage constraints. Formula (32) is the unit power constraint. Formulas (33) and (34) are the crew climbing constraints. Formulas (35) and (36) are FM capacity constraints and FM mileage constraints.
i k + j e i , t C = 0
0 R t u i min ( Δ e i U , e i max e i , t C )
0 R t d i min ( Δ e i D , e i , t C e i min )
i N R i , t u p R s y s , t u p
i N R i , t d n R s y s , t d n
where R i u and R i d are the positive reserve capacity and negative reserve capacity requirements of trading unit i of the system. R s y s , t u p and R s y s , t d n are the upper and lower FM capacities of FM supplier i in t period.
3.
Network Power Flow Constraints
e v , t b d = δ b , t δ d , t x b d
e v b d , max e v , t b d e v b d , max
where e v , t b d is the power flow of line v in t period. δ b , t and δ d , t are the phase angles of node b and node d in t period. x b d is the reactance between node b and node d. e v b d , max is the power flow transmission limit of the line between node b and node d of line v.

3.3. Determine Energy Price

3.3.1. Electrical Energy Price

The price mechanism includes system marginal price (SMP), regional marginal price (ZMP), and node price (LMP) [57]. Among them, the node price is based on the optimal power flow and is affected by the marginal cost of generators, system capacity, network loss, and line congestion. In this paper, the pricing mechanism of the node price is adopted, and the LPC model is used to make the node marginal price of node i:
λ i = [ t T ( u i , t C c u , i , t + e i , t p i , t + e c o n , i , t c c o n , i , t + e e s c i , t c e s c , i , t ) + S L t T e t C ] , i I

3.3.2. Frequency Modulation Price

The FM clearing price will be decomposed into two parts: mileage clearing price and capacity clearing price. The capacity fee is settled based on the results of the previous settlement, and the deviation settlement is made in real-time, while the mileage fee is settled afterwards based on the actual FM mileage. First, calculate the comprehensive clearing price of FM from Equations (21)–(24), which is the comprehensive FM quotation of marginal FM units. Then, select the highest mileage quotation from the winning unit as the mileage clearing price. The difference between the comprehensive clearing price and the mileage clearing price is selected as the capacity clearing price, as shown in Equations (25) and (26), respectively. The market clearing of the FM auxiliary service is sorted according to the comprehensive quotation, as shown in Formulas (21)—(24).
p t A G C = [ i I ( M i , t p i , t m i l s i m c A i + R i , t p i , t c a p A i ) ] , t Γ
p t m i l = max i α i , t p i , t m i l , t Γ
p t c a p = p t A G C p t c a p , t Γ
where p t A G C is the comprehensive clearing price of FM in t period. α i , t is the 0–1 variable of generator set i in the bid state in t period.

3.4. Model Solving

To sum up, a joint clearing model of energy-FM based on flexible block order, including integer variables, continuous variables, and 0–1 variables, belongs to the mixed integer programming model, and is designed to solve the problem with a multi-objective decision-making model. This paper uses Matlab to program and uses the CPLEX and Yalmip algorithms to solve the problem. The market clearing result and node price are obtained.

4. Case Study

4.1. Test System Description

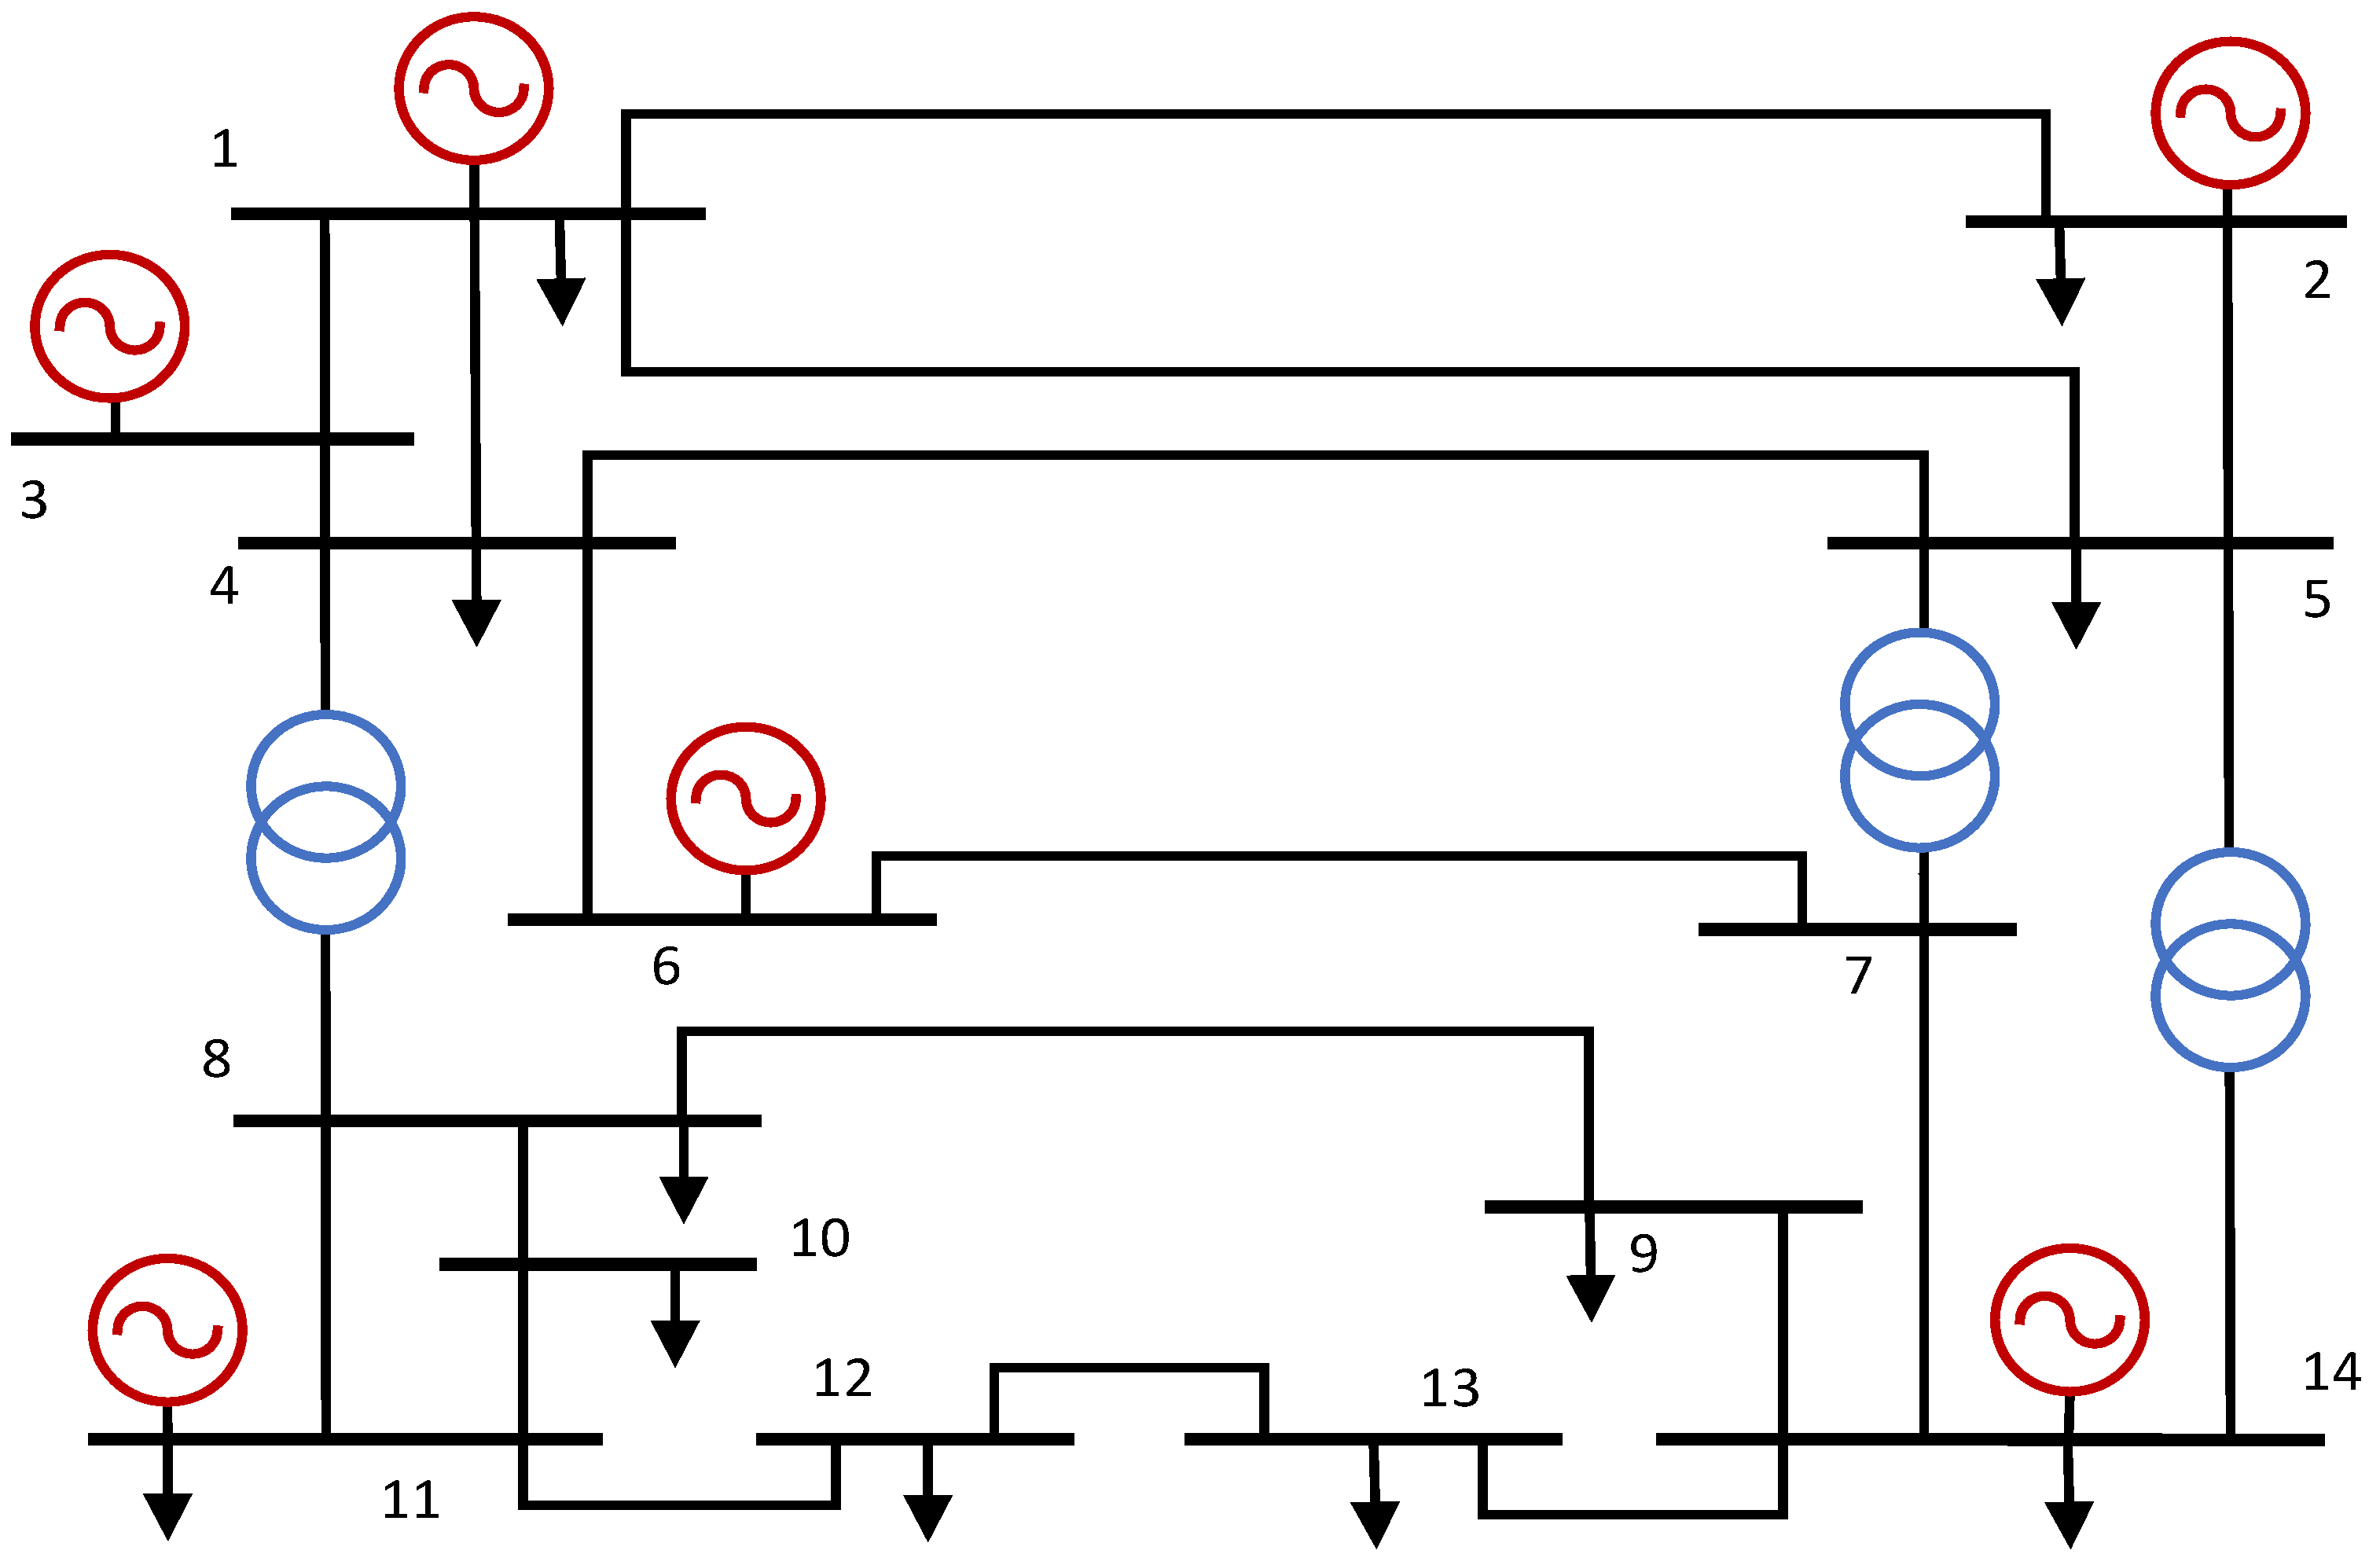
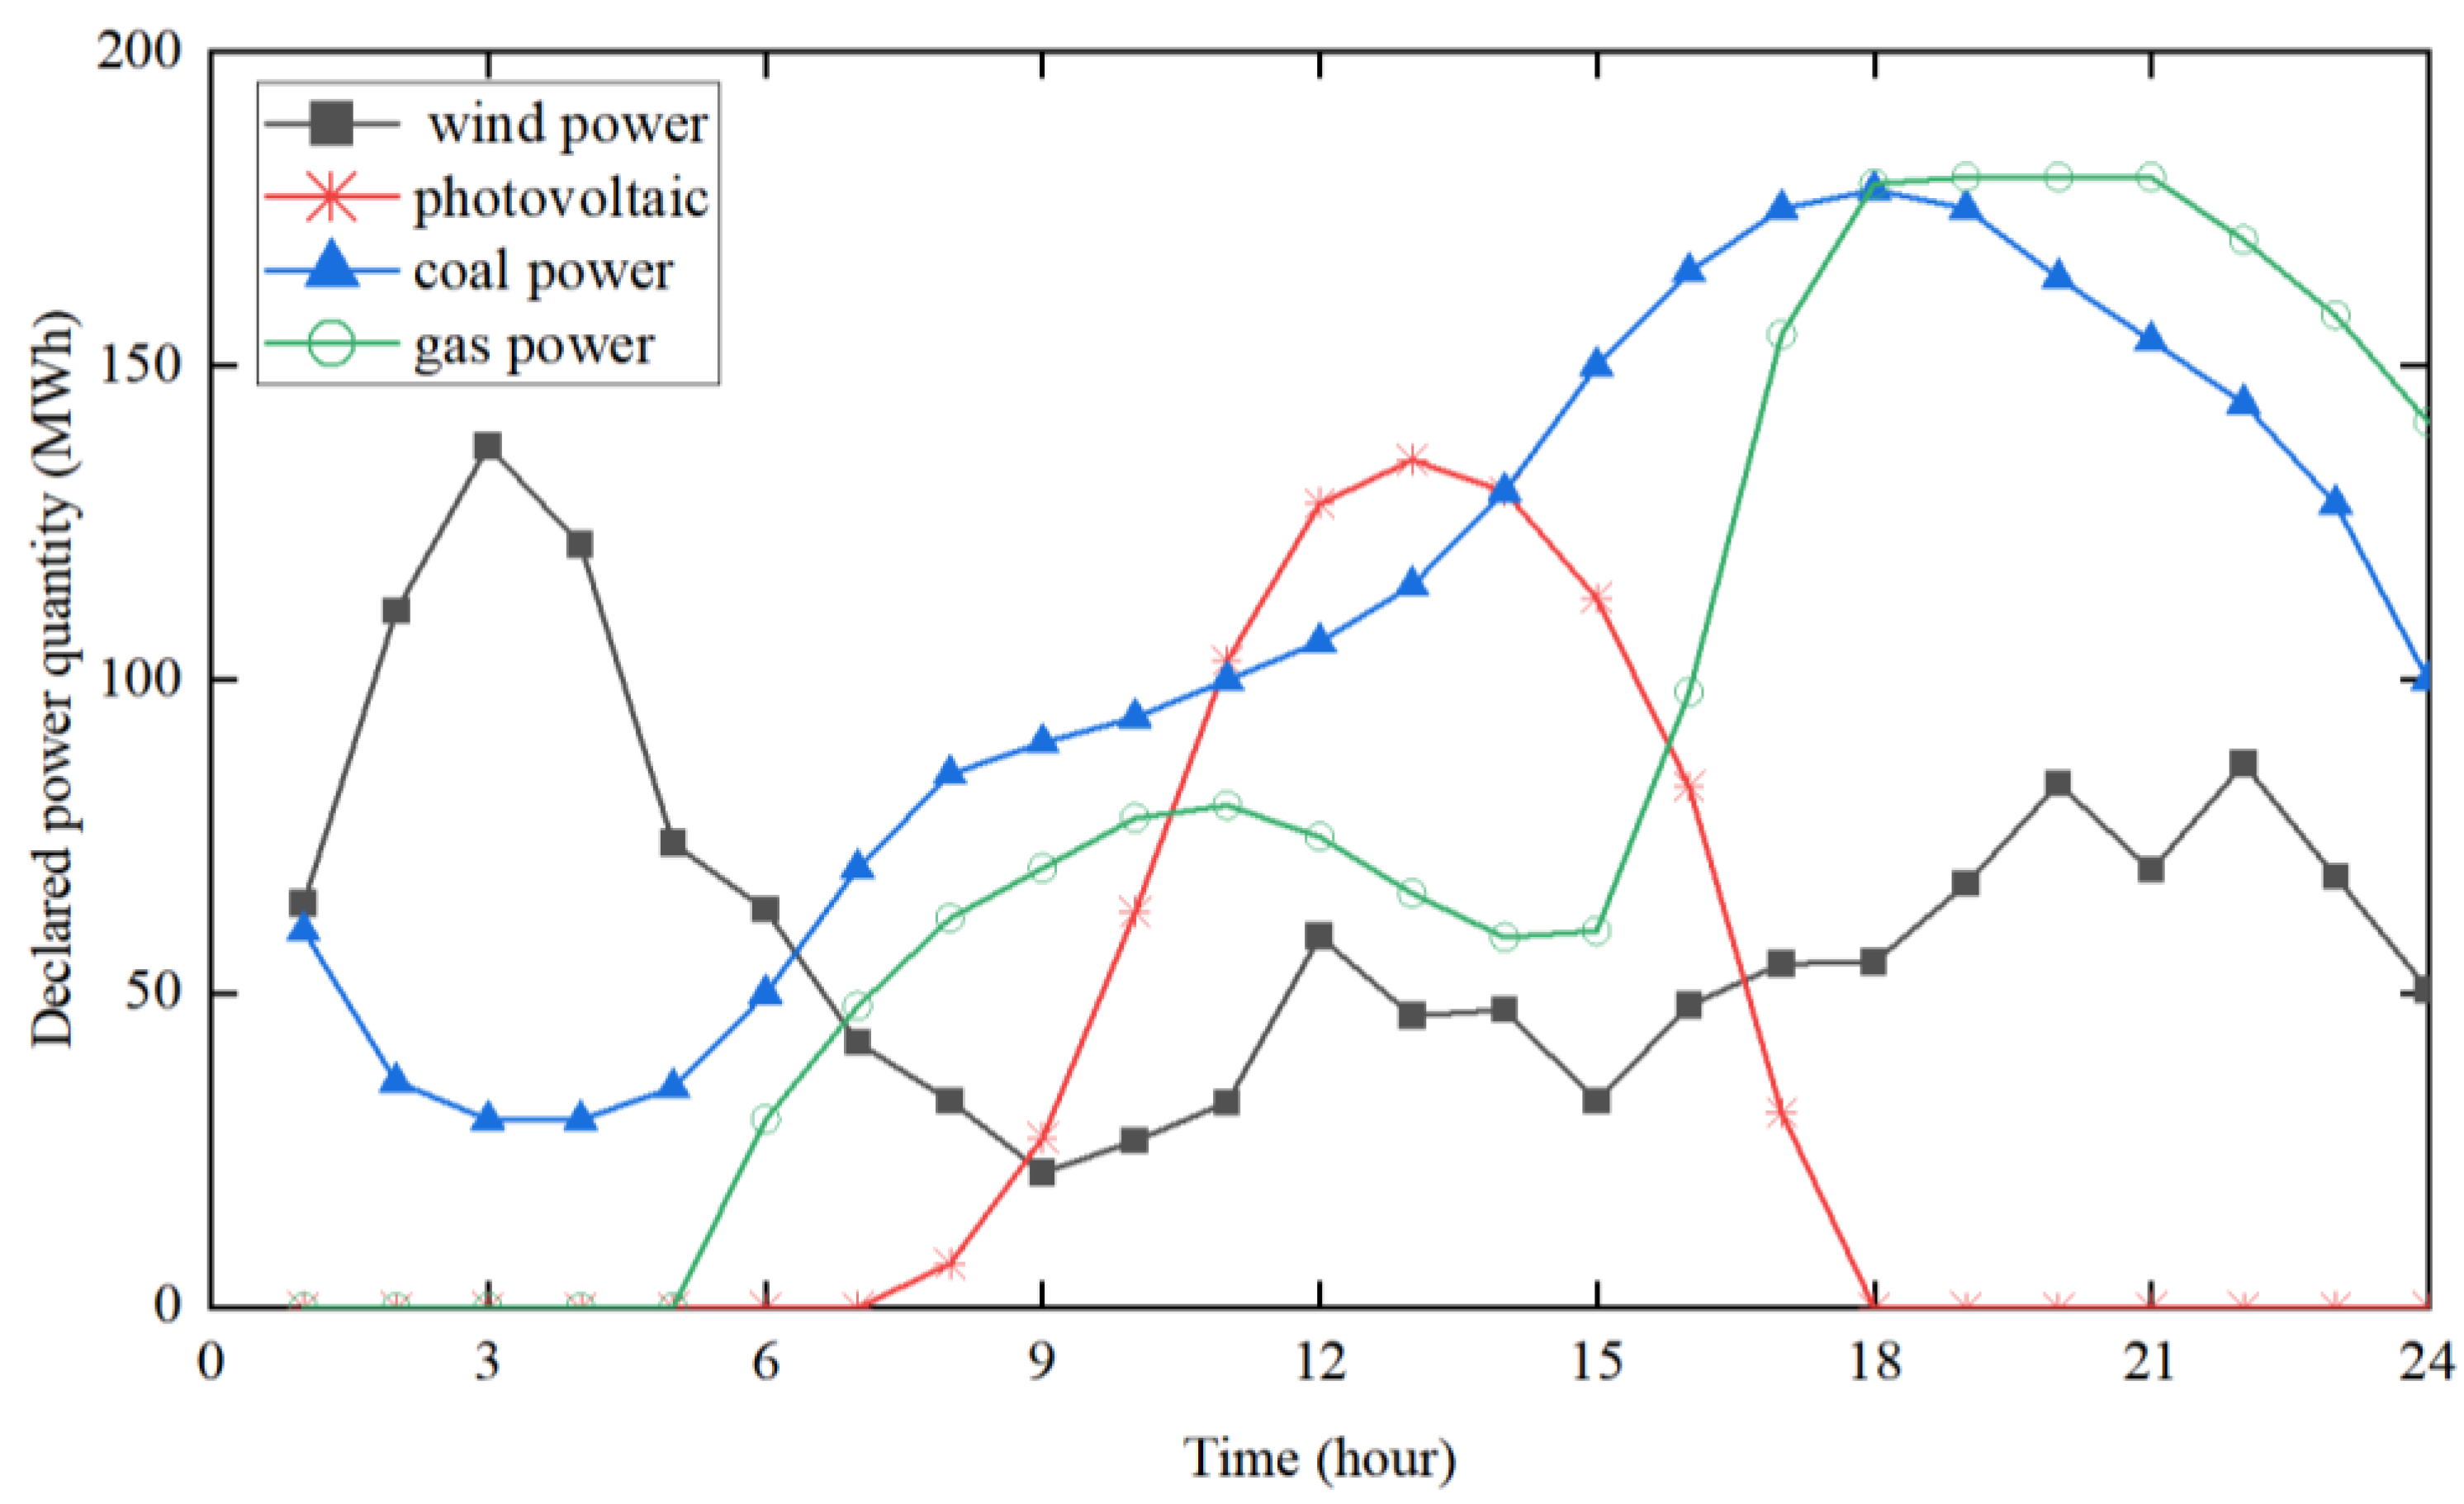
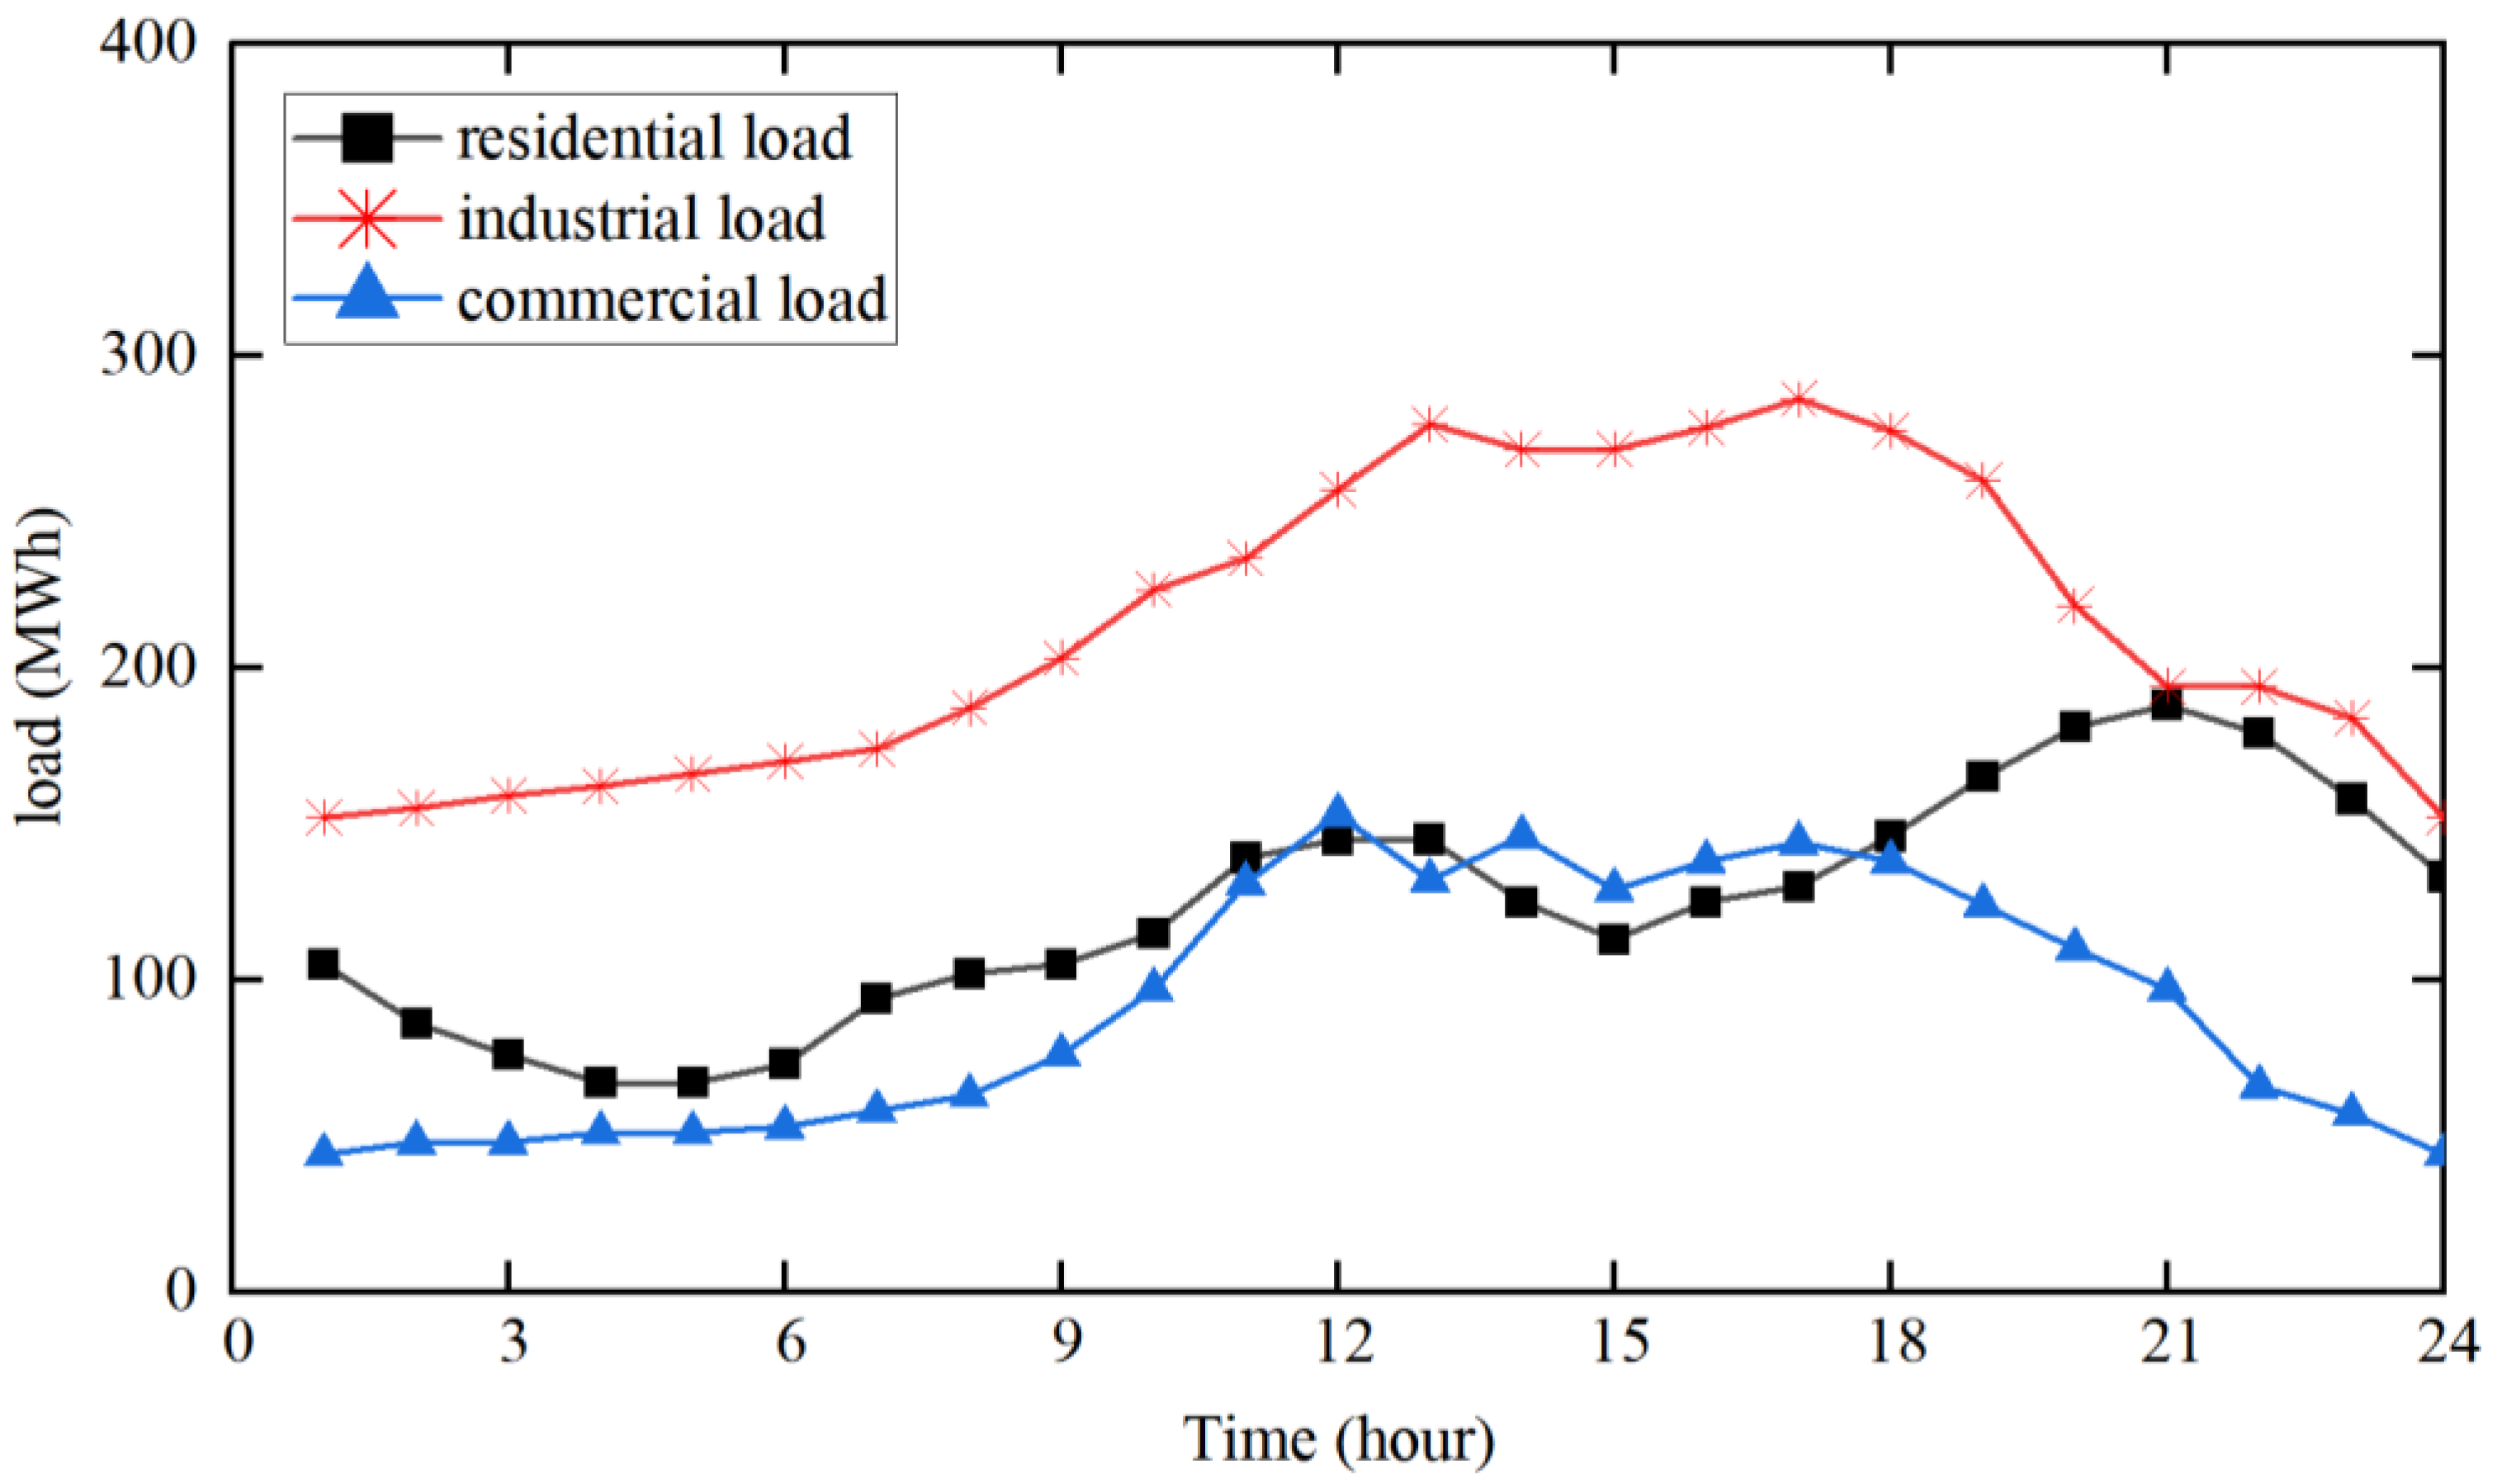
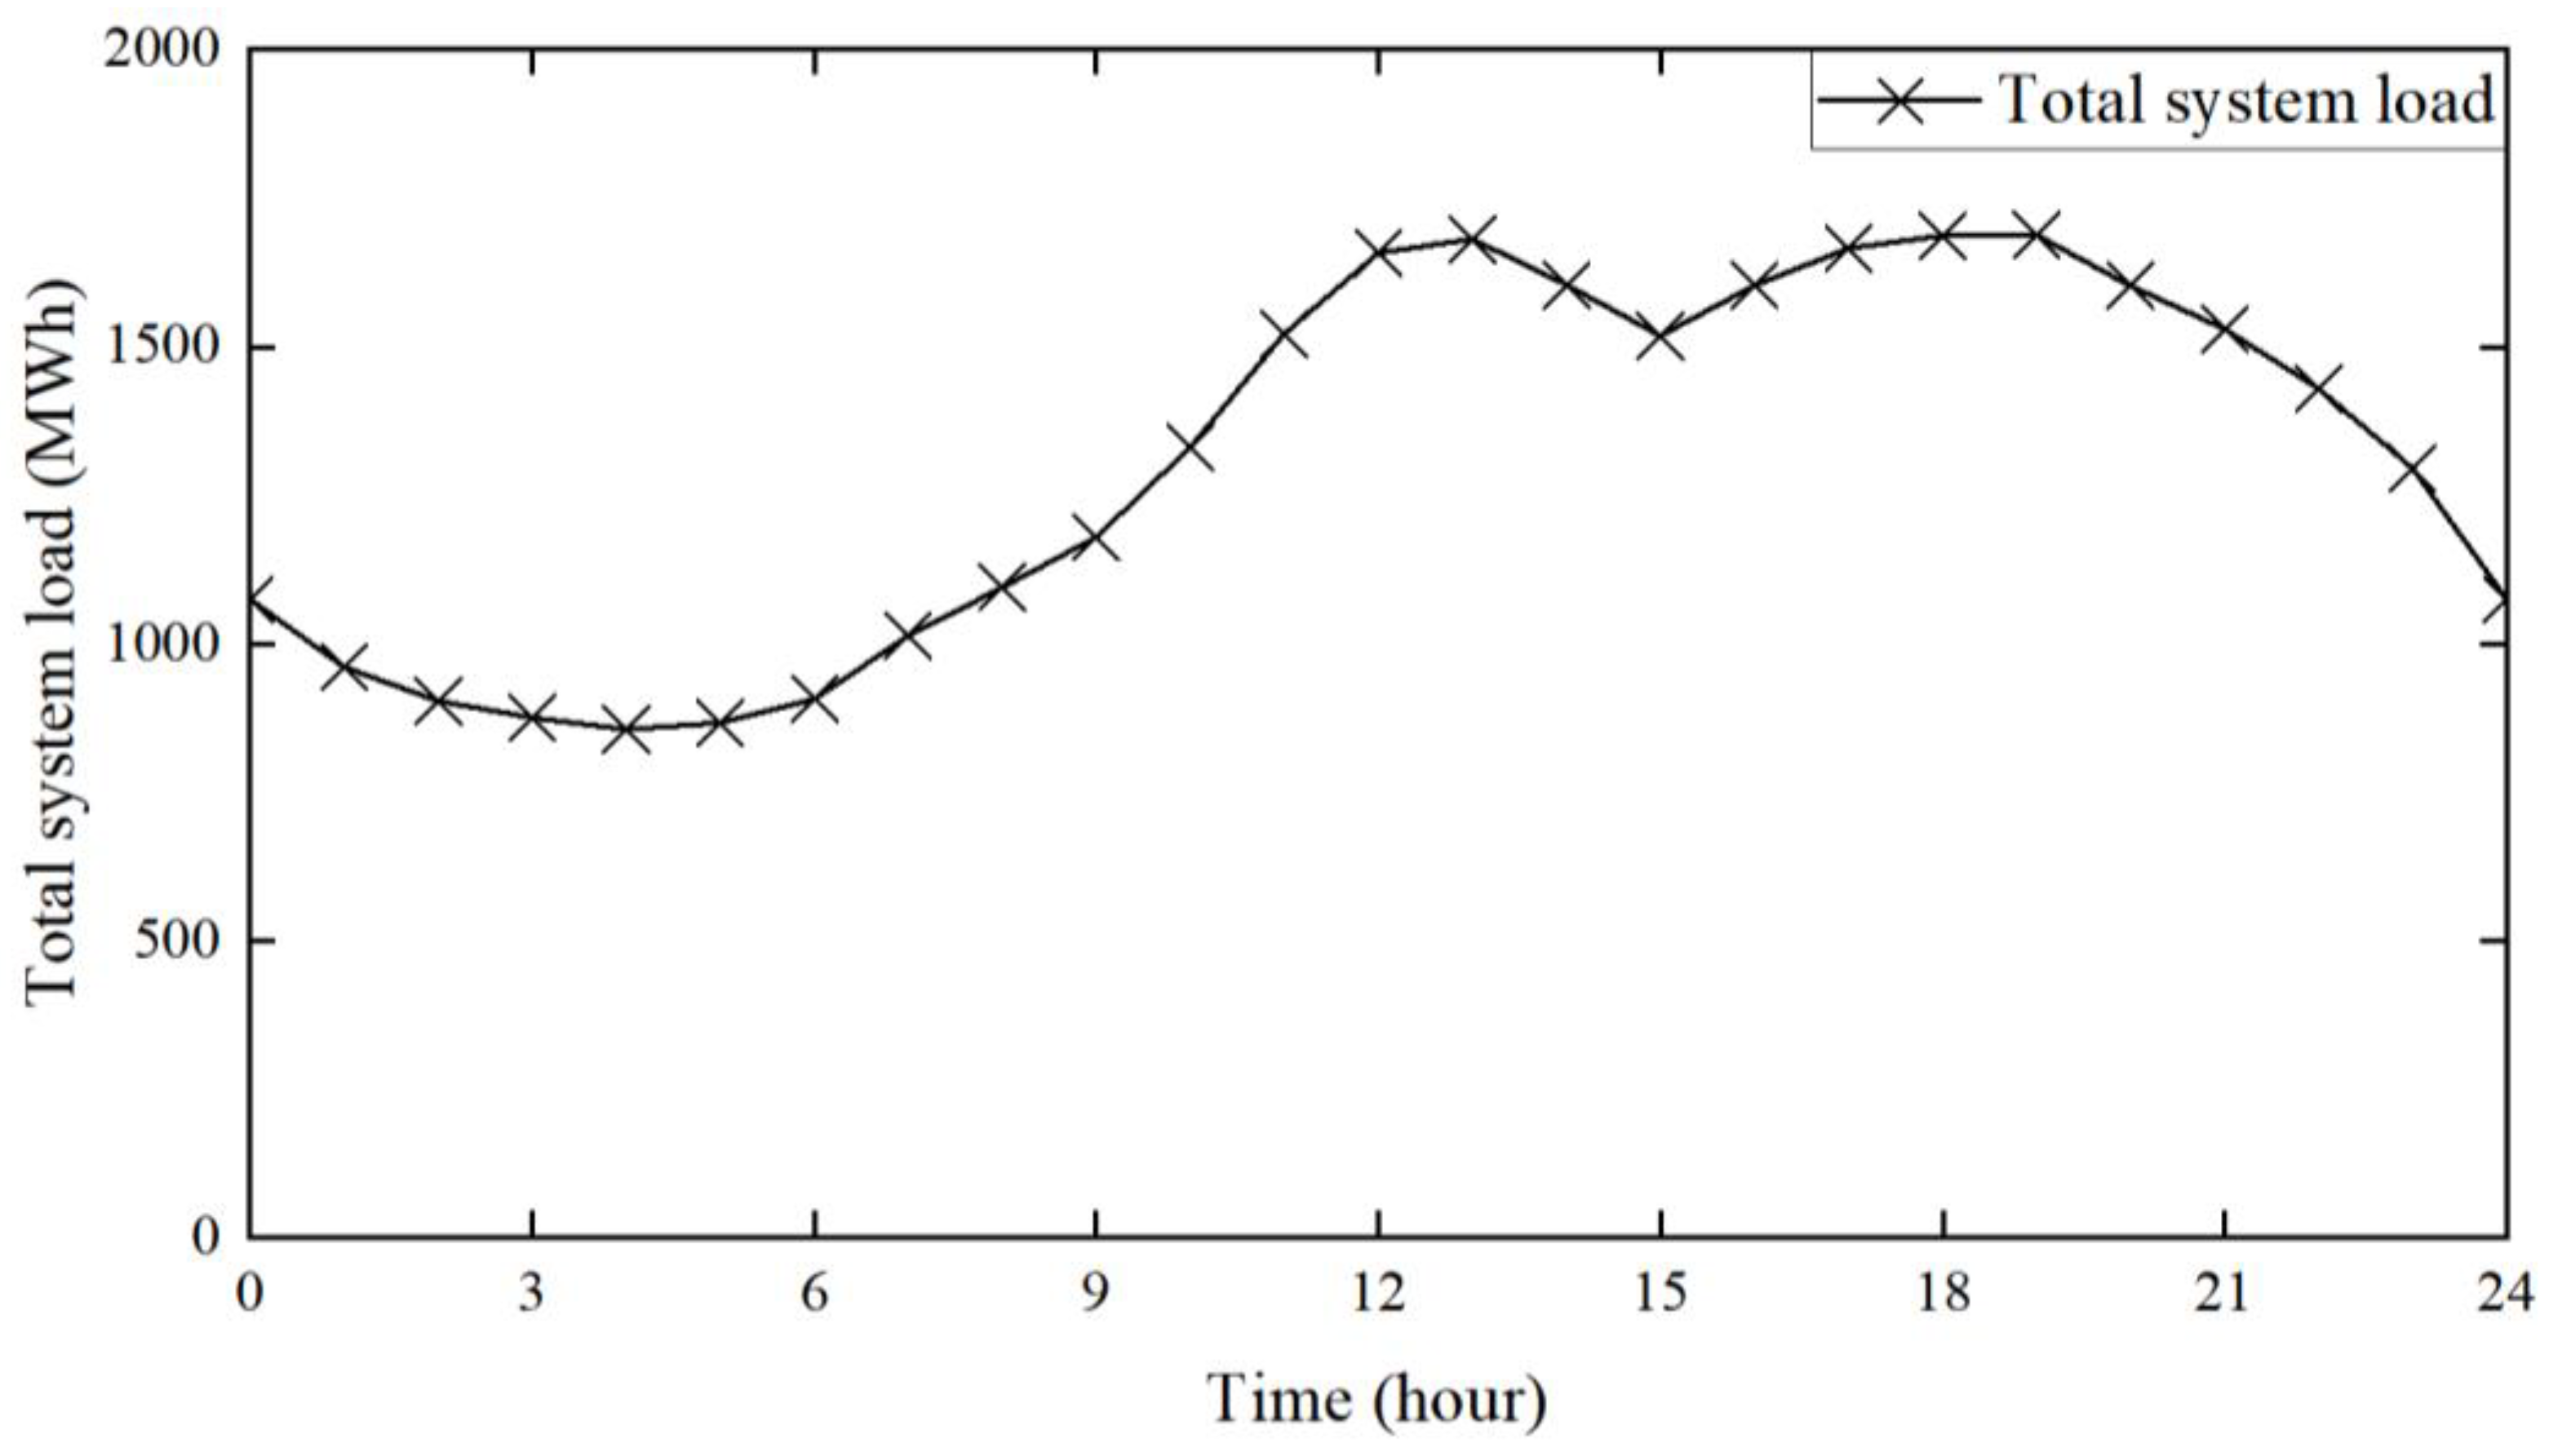
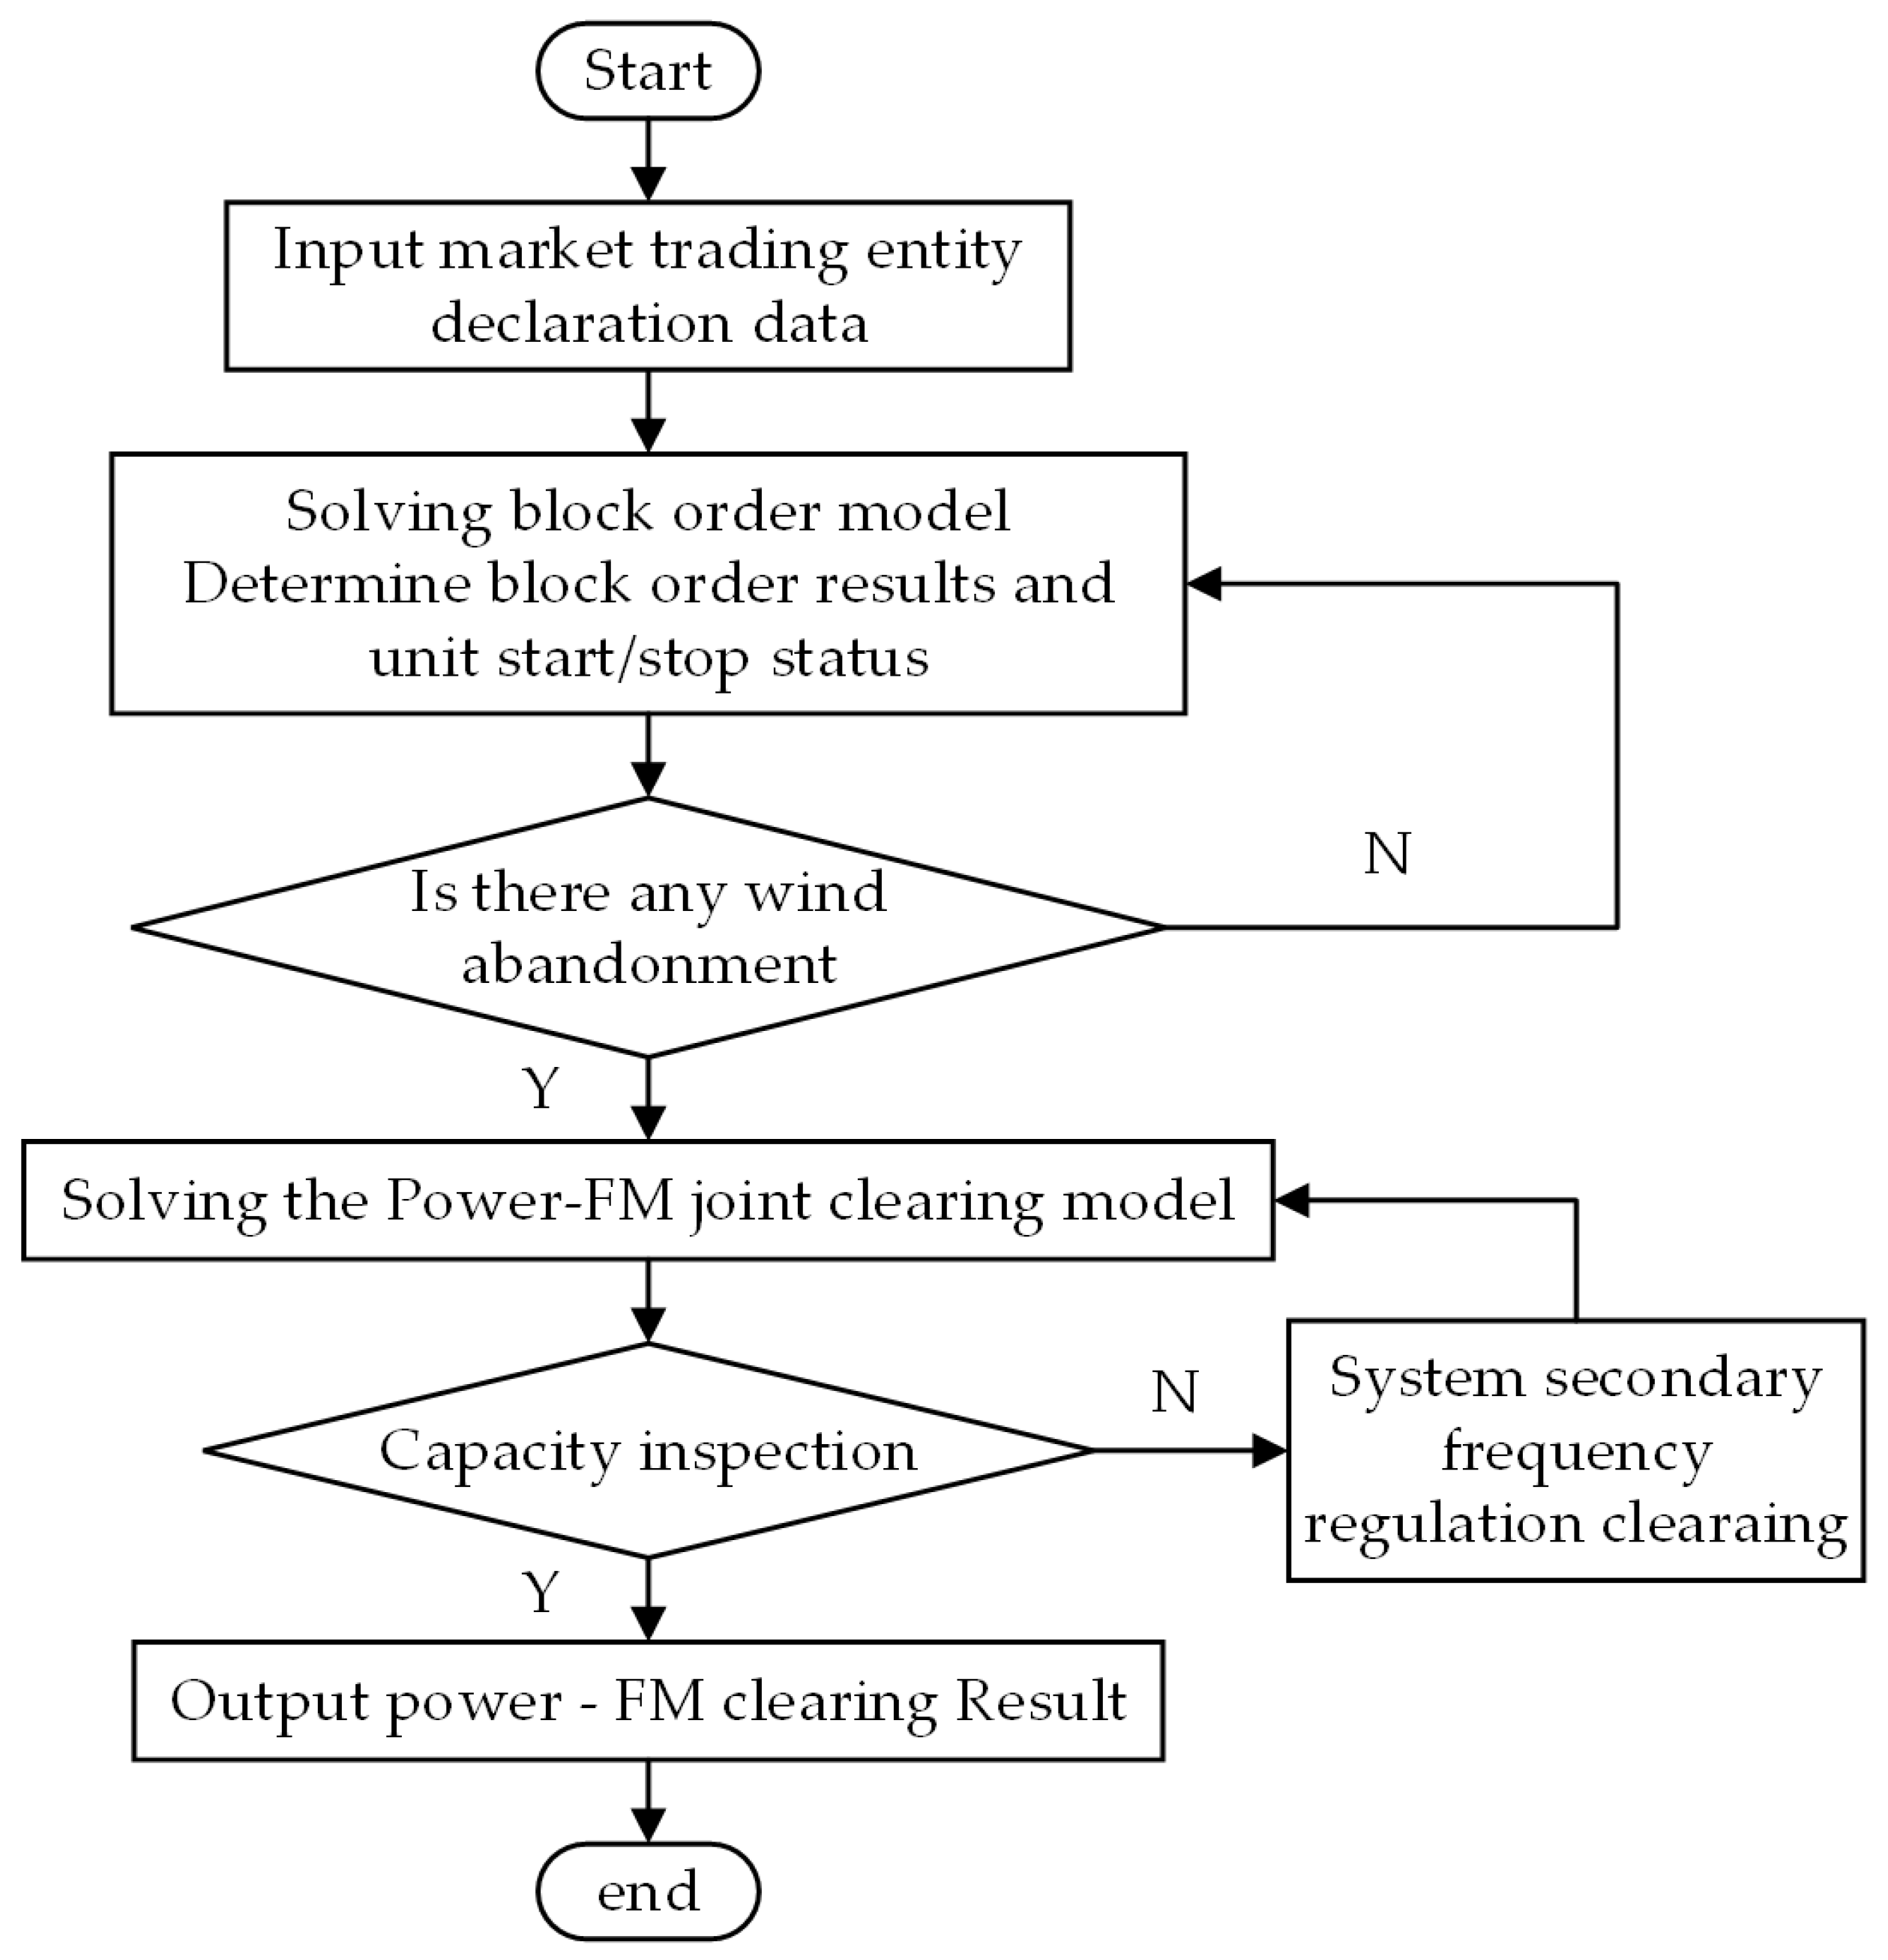
This article is based on an improved IEEE 14-bus system to simulate and analyze a two-stage energy-FM joint clearing model based on flexible block order to verify the practicality and effectiveness of the model. The topology of the improved IEEE 14-bus system is shown in Figure 3. The system includes 16 units, 6 power nodes, 11 load nodes, and 20 branches. The total installed capacity of the system is 2760 MW. Among them, power generation units include coal power, gas power, wind power, photovoltaic, and nuclear power generation units. The technical and cost parameters of a generator unit are shown in Table 4. The typical daily output curve of the power generator unit is shown in Figure 4. The load users include residents, factories, shopping malls, and load aggregators. The typical daily load curve of the load user declaration is shown in Figure 5. The structure and parameters of the power-side are shown in Table 5 and Table 6 and Figure 6. The FM capacity requirement of the system is 10% of the load. The total system load is shown in Figure 7. The bidding parameters for the FM auxiliary service are shown in Table 7. The simulation duration of the power system operation in this paper is 168 h. The simulation step size is 1 h. The clearing process is shown in Figure 8.

4.2. Scenario Settings

Based on the flexible block order model in Section 3.1 and the energy-FM joint clearing model in Section 3.2. The following three market scenarios were selected for analysis and comparison.
Scenario 1: Based on the multiple flexible block order model, the electrical energy and frequency modulation auxiliary service market in the power system are joint clearing.
Scenario 2: Based on a traditional trading model, the electrical energy market and frequency modulation auxiliary service market in the power system are joint clearing.
Scenario 3: Based on the multiple flexible block order model, only electrical energy is clearing in the power system.

4.3. Results and Analysis

Using the IEEE 14-bus system for simulation, various types of generator units participate in the joint clearing of electrical energy and frequency regulation auxiliary service markets in the power system based on the multiple flexible block order mode (Scenario 1), and the clearing results are shown below.
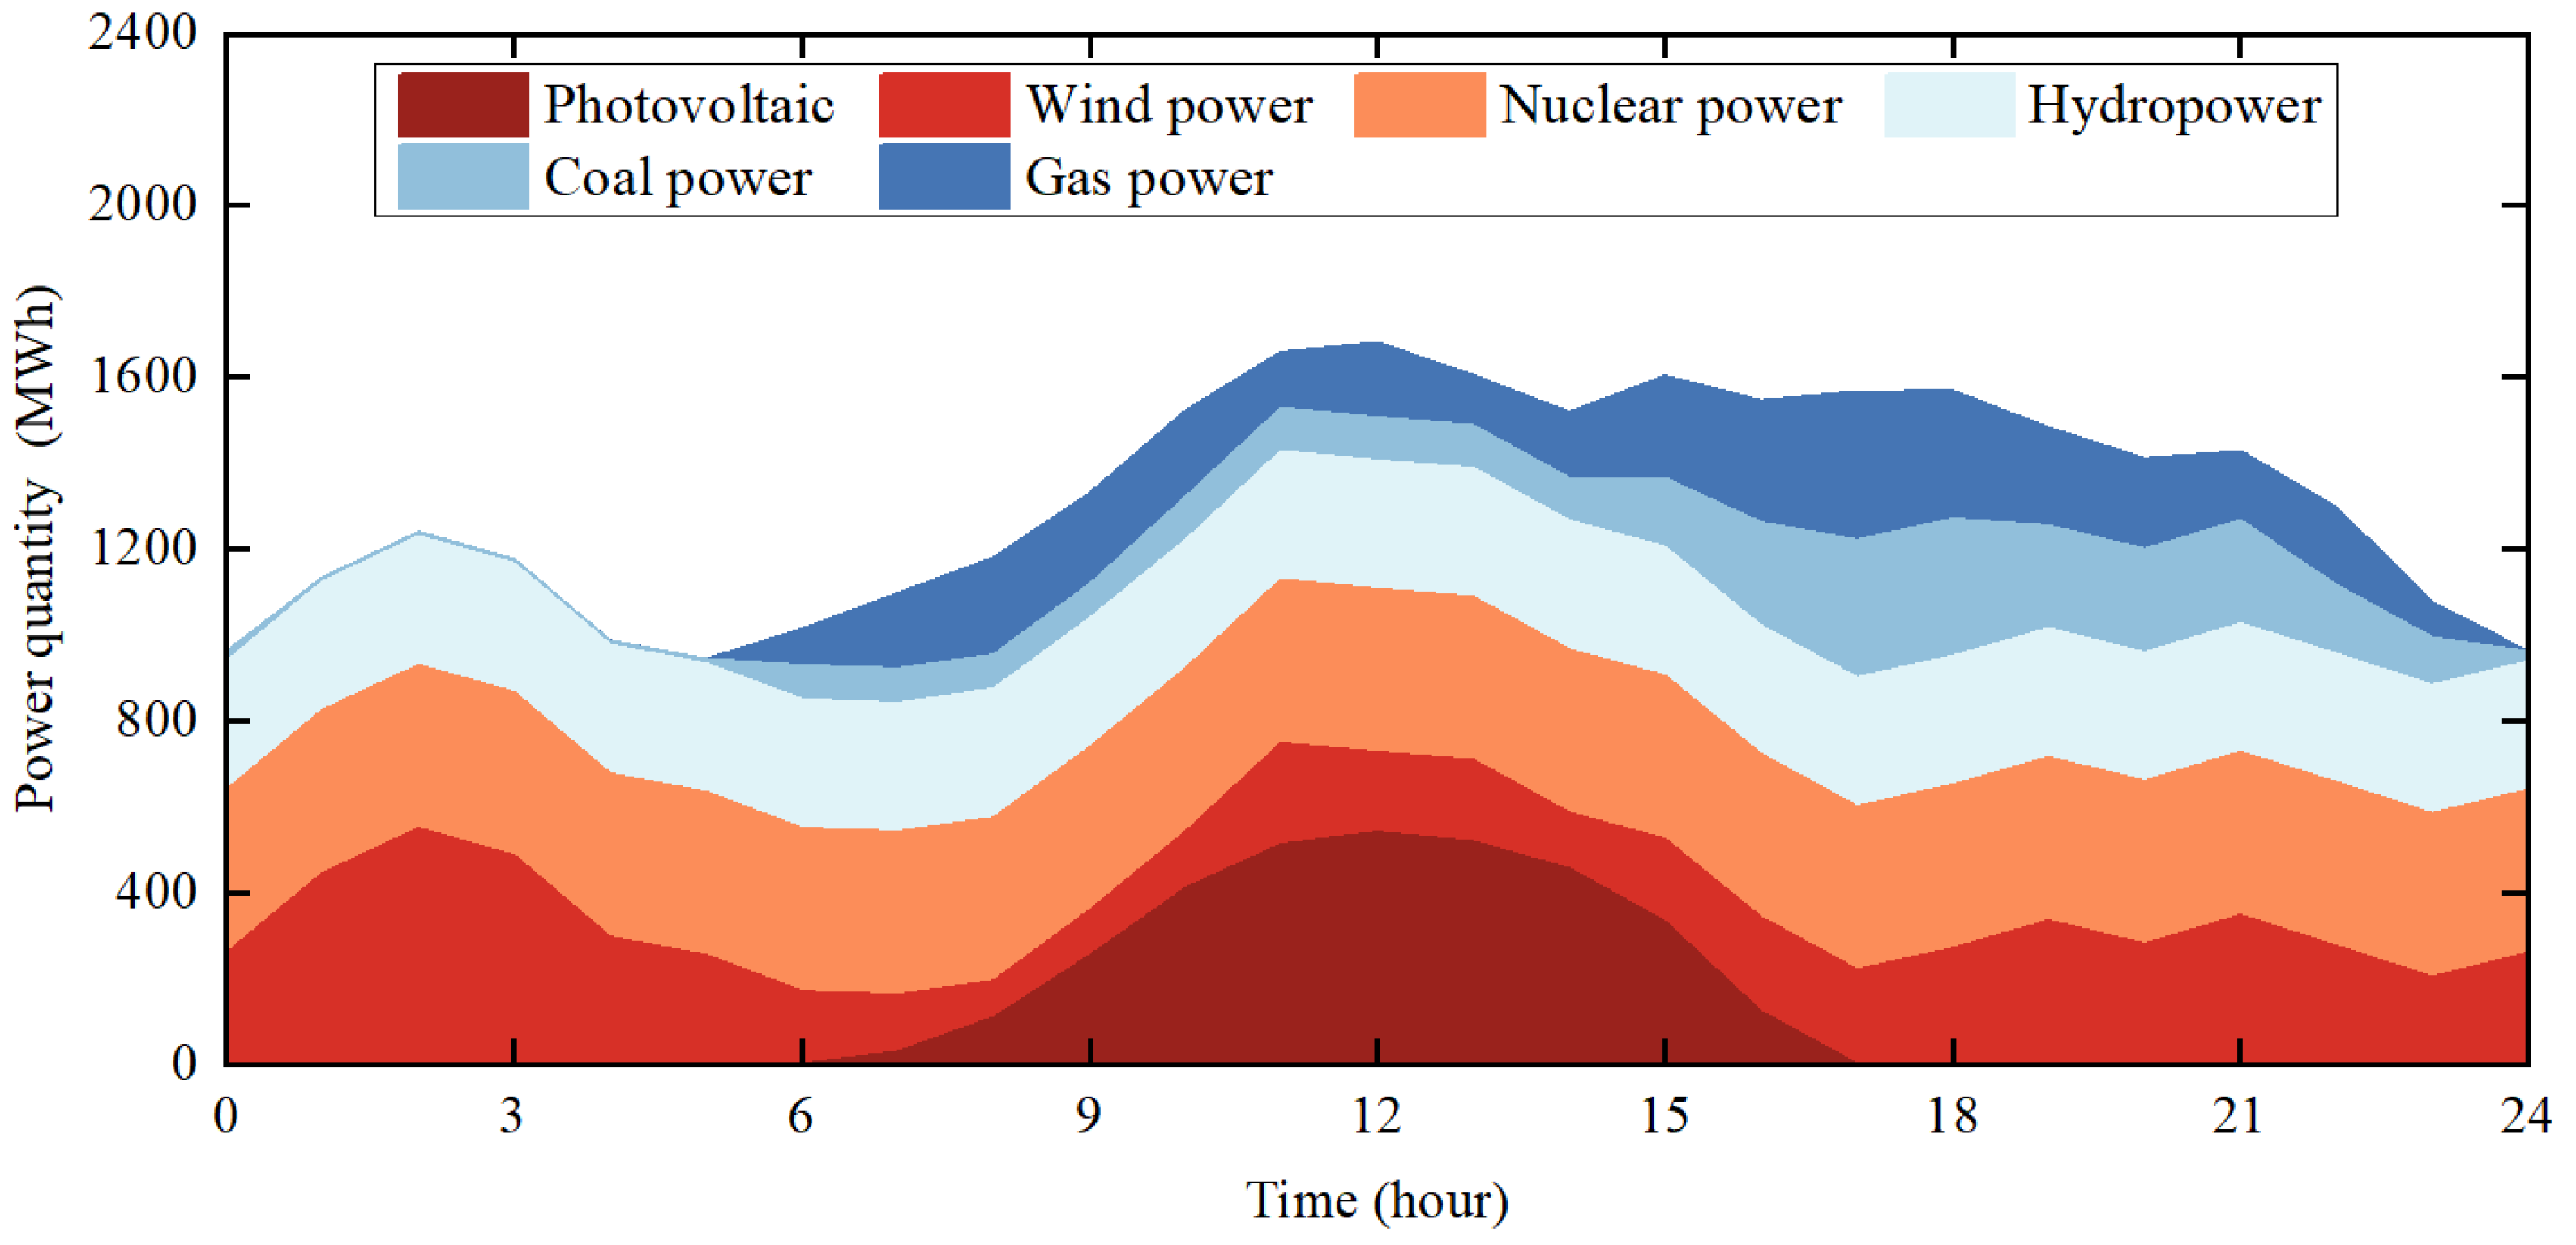
The bidding results in the electrical energy market are shown in Figure 9. Nuclear power and hydropower units are declared as a sustaining block, responsible for the basic load of the power system and prioritizing power generation. Wind power and photovoltaic are applied to the flux block and generate electrical energy after nuclear power and hydropower, when all renewable energy units reach the online output. They are supplemented by conventional thermal power units (coal and gas power units) to meet system load requirements, simultaneously addressing the uncertainty of wind and photovoltaic power generation. Figure 10 shows the proportion of winning bids for various types of generator units in the electrical energy market. From Figure 10, it can be seen that the cumulative output of renewable energy units in each typical day period reaches over 50% of the total power generation. Except for the high system load pressure from 16:00 to 23:00, renewable energy accounts for over 70% of the remaining periods. This indicates that the clearing model based on the flexible block order model has promoted the consumption of renewable energy.
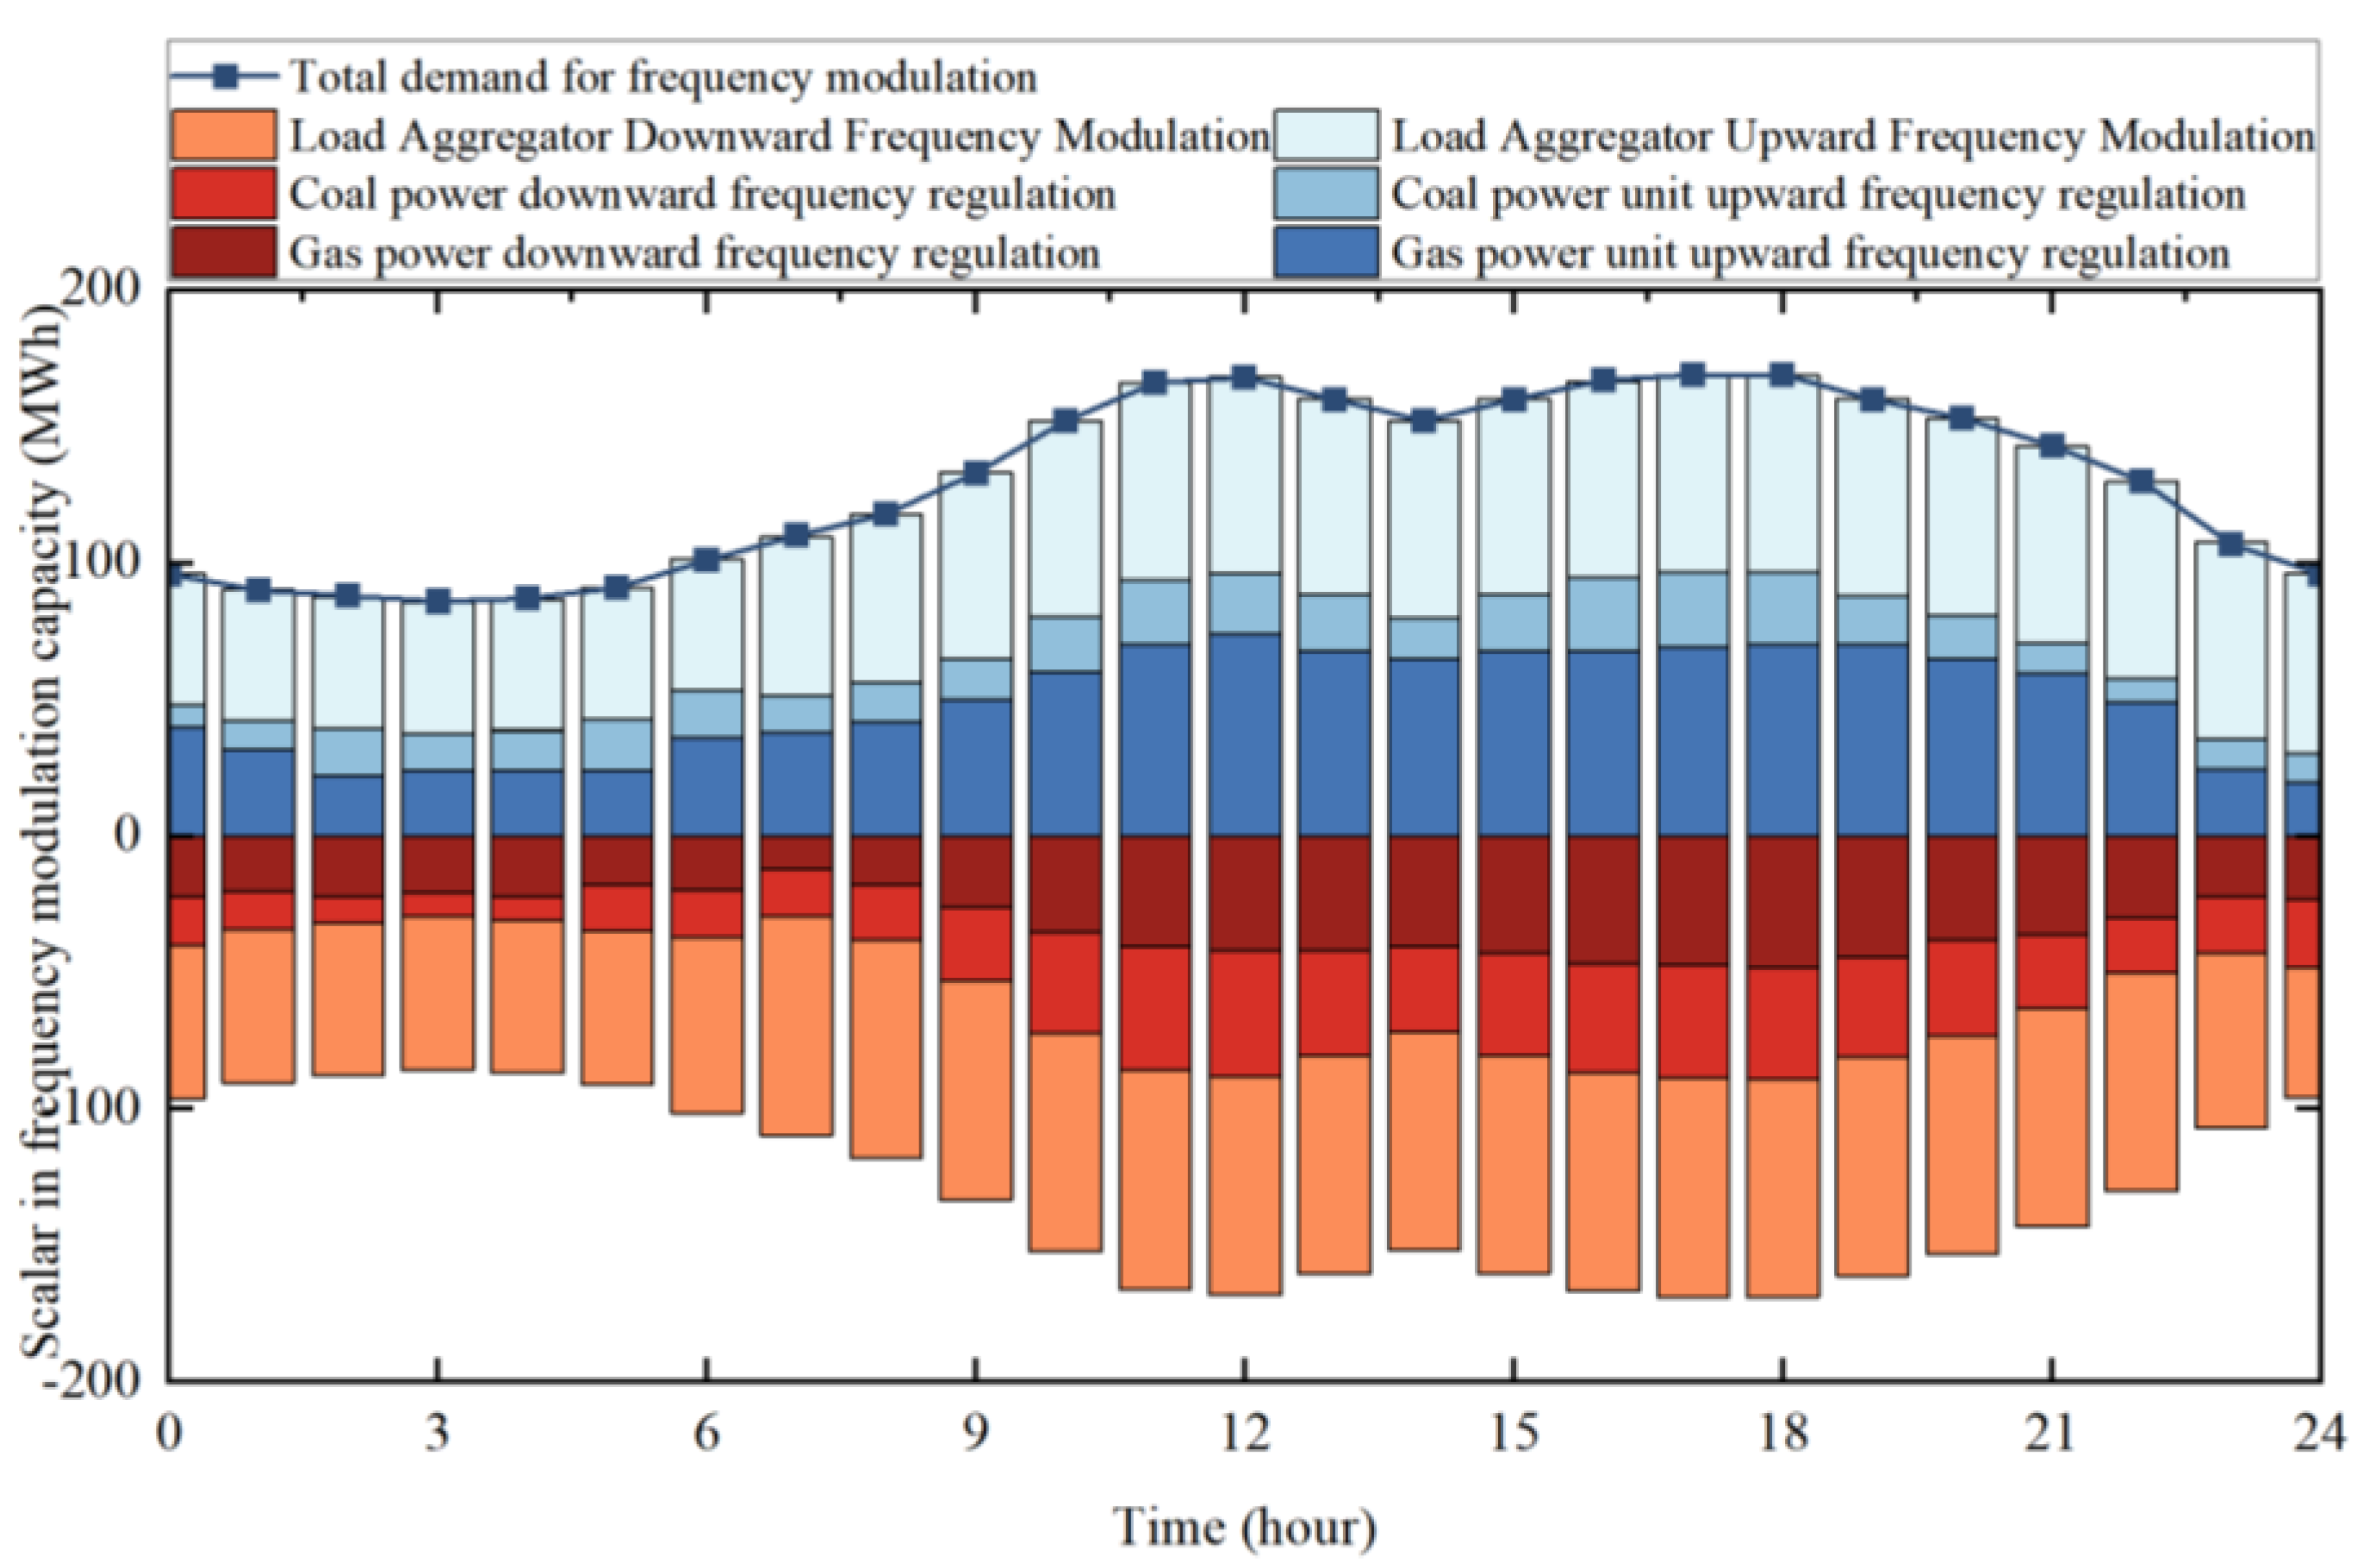
In the frequency modulation auxiliary service market, coal power units, gas power units, and load aggregators participate in bidding. The bid winning situation of each unit in the frequency modulation auxiliary service at different time periods is shown in Figure 11 and Figure 12. The comprehensive FM performance indicators of the load aggregator are good, and the cost is relatively low. They prioritize winning the bid in FM and undertake a large proportion of FM tasks, accounting for about 60% of the total FM capacity of the system. In addition, due to the higher frequency regulation history capacity ratio of the load aggregator, under the same frequency regulation capacity, compared to thermal power units, the load aggregator can provide more frequency regulation mileage and be prioritized for use. Therefore, the proportion of FM mileage awarded by load aggregators is about 70% (Figure 12). Compared to the proportion of the FM bid capacity, the proportion of FM bid mileage for load aggregators is larger. However, due to the relatively small capacity scale of the load aggregator and limited by the state of charge, coal power and gas power units still bear a certain proportion of frequency regulation tasks.
The marginal node electrical energy price and clearing electrical energy price in the electrical energy market are shown in Figure 13. Due to limitations in the transmission power of node system lines, the LMP of each node varies slightly. The electrical energy at each node and time period is roughly positively correlated with the load. During peak load periods, LMP significantly increases the clearing electrical energy price of the frequency modulation auxiliary service market as the load increases, as shown in Figure 14. Both conventional units and load aggregators have won the bid for each period of time, and the monthly clearing price for frequency modulation auxiliary services is equivalent to the marginal quotation for units providing frequency modulation auxiliary services. The clearing price of FM capacity/mileage is similar to the changing trend of the total demand for system FM.
The market clearing trading model (Scenario 1) proposed in this paper was compared with the other two scenarios, and the results are shown in Table 8.
Comparing scenario 1 and scenario 2, in terms of market total welfare, compared to traditional trading models, the market total welfare using flexible block order models is greater. The comprehensive unit price of the electric energy market is lower, and the clearing price of FM market clearing is slightly lower. In terms of system operation stability, the standard deviation of the net load of electricity is relatively small. In terms of green and low-carbon energy, renewable energy generation accounts for a higher proportion. In summary, the electricity system that adopts the flexible block order model (Scenario 1) has better economy and stability, and the system operates in a more green and low-carbon way.
Next, scenario 1 and scenario 3 were compared. Compared to scenario 3, where the power system only clears electrical energy, scenario 1 uses a combination of electrical energy and FM auxiliary services for clearing. In terms of total market welfare, the model proposed in this article (Scenario 1) has a larger total market welfare and a lower comprehensive unit price in the electricity market. In terms of system operation stability, scenario 1 adopts a lower standard deviation of the system net load, making the operation more stable and reliable. In terms of green and low-carbon aspects, in scenario 1, only thermal power units and load aggregators participate in frequency regulation auxiliary services, and thermal power units bear some of the frequency regulation needs. Therefore, the proportion of renewable energy generation in scenario 1 is relatively low, which can promote the development of load aggregators in the later stage, increase the proportion of load aggregators participating in frequency regulation, and increase the proportion of renewable energy. Overall, the power system in scenario 1 has good economic efficiency and stability.
Therefore, a joint clearing model based on the multiple block order model for the electrical energy market and frequency regulation auxiliary service market in the power system should be selected (Scenario 1), to achieve an economical and stable operation of the power system.

5. Conclusions

This article is based on the continuous large-scale grid connection of renewable energy, gradually forming a multiple power generation trading unit with renewable energy generation units as the main body. Multiple power generation trading units have differentiated needs, which traditional power system clearing models cannot meet. The flexible block order clearing model allows for multiple quantity price combinations of electrical energy bidding. In addition, the uncertainty of renewable energy poses challenges to the stable operation of the power system. The use of the energy-FM clearing model can enhance the flexibility of the power system. Based on this, this article constructed a joint clearing model for energy-FM based on a multiple flexible block order. Firstly, three types of flexible blocks were designed: a sustaining block, flux block, and adjustment block, allowing the three blocks to participate in bidding simultaneously. In the second stage, based on the bidding results of the flexible block order model, a joint clearing model of energy-FM was established. Yalmip and CPLEX solvers were used for solving. The winning electrical energy and its price, as well as the winning FM capacity/mileage and its price, were calculated. Based on an IEEE 14-bus system for simulation operation, the accuracy and effectiveness of the proposed model in this article were verified. The following conclusions were drawn:
(1) This article designed three types of flexible blocks: a sustaining block, flux block, and adjustment block, while bidding for clearing, satisfying the differentiated needs of future power generation trading units gradually diversifying. Nuclear power, hydropower, and other relatively stable renewable energy generation units are responsible for the basic load of the system. Wind turbines and photovoltaic have uncertainty, so priority should be given to clearing and reducing the phenomenon of wind and light abandonment. The thermal power unit supports the peak power generation demand of the system and is responsible for system regulation. The electricity demand of residential users is prioritized to be met in load-side, meeting the dual track model of China’s short-term power system planning and market coexistence.
(2) In order to give consideration to the economy and environmental protection of the trading model, this paper established a multi-objective market clearing optimization model with the optimization goal of maximizing market welfare, clearing price of electrical energy and frequency modulation, standard deviation of net load, and utilization efficiency of renewable energy.
(3) In the case study, the model established in this article was compared and analyzed with two scenarios: only clearing electrical energy and not using flexible block order. Through comparative analysis, it has been proven that the clearing trading model proposed in this article can better meet the differentiated needs of multiple trading units and improve the reliability of power system operation while also improving the utilization rate of renewable energy.
With the large-scale integration of renewable energy in China, the flexibility of the power system needs to be further improved. This paper introduces diversified and flexible block order in the electricity market to satisfy the diverse needs of diverse generation trading units, effectively avoiding frequent output adjustments and the start-up/shutdown of generator units. In the later stage, mobile block order can be introduced to further empower power users with the right to choose freely, which will to some extent help increase social welfare. Alternatively, introducing extended linked block order can increase the likelihood of power generation companies winning bids and avoid power losses. Also, this paper only mentions the transaction mode of the joint clearing of electric energy and frequency modulation services, and other flexible resources such as peak shaving and backup can be added in the future to improve power system clearing. The research results of this article are only intended as a starting point for further research and need to be continuously improved and updated in conjunction with the construction of China’s power system.

Author Contributions

Conceptualization, Q.W. and K.Q.; methodology, K.Q.; software, K.Q.; validation, Q.W. and K.Q.; investigation, Q.W.; resources, Q.W.; data curation, K.Q.; writing—original draft preparation, K.Q.; writing—review and editing, Q.W.; supervision, Q.W. All authors have read and agreed to the published version of the manuscript.

Funding

This research received no external funding.

Data Availability Statement

All data are contained within this article.

Conflicts of Interest

The authors declare no conflict of interest.

References

  1. Wu, Z.Y.; Zhou, M.; Yao, S.R.; Li, G.Y.; Zhang, Y.; Liu, X.J. Optimization operation strategy of wind-storage coalition in spot market based on cooperative game theory. Power Syst. Technol. 2019, 43, 2815–2824. [Google Scholar]
  2. Pan, X.D.; Huang, Y.; Tang, J.R.; Yang, L. Influencing factors and prospects for development of renewable energy power generation. Smart Power 2019, 47, 41–47. [Google Scholar]
  3. Bai, Q.F. Coordinative dispatch and development of renewable Energy and nuclear power generation. Electr. Power 2020, 53, 105–111. [Google Scholar]
  4. Dai, B.H.; Wang, D.L.; Cao, Y.; Liu, X.X.; Luo, D.Q.; Ding, X.S.; Wang, P.; Ma, L. China’s Energy Industry: 2022 Review and 2023 Prospect. Pet. Petrochem. Today 2023, 31, 2–9. [Google Scholar]
  5. Zhang, L.Y.; Ye, T.L.; Xin, Y.Z.; Han, F.; Fan, G.F. Problems and measures of power grid accommodating large scale wind power. Proc. CSEE 2010, 30, 1–9. [Google Scholar]
  6. Liu, J.; Yao, W.; Wen, J.Y.; Huang, Y.; Liu, Y.; Ma, R. Prospect of technology for large-scale wind farm participating into power grid frequency FM. Power Syst. Technol. 2014, 38, 638–646. [Google Scholar]
  7. Xie, M.; Luo, W.H.; Ji, X.; Cheng, P.J.; Ke, S.J.; Liu, M.B. Multi-scenario collaborative optimization for dynamic economic dispatch of power system with stochastic wind power integration. Electr. Power Autom. Equip. 2019, 39, 27–33. [Google Scholar]
  8. Shu, Y.B.; Zhang, L.Y.; Zhang, Y.Z.; Wang, Y.H.; Lu, G.; Yuan, B.; Xia, P. Carbon peak and carbon neutrality path for China’s power industry. Strateg. Study CAE 2021, 23, 1–14. [Google Scholar] [CrossRef]
  9. Zhang, Y.Z.; Shan, B.G. China’s power system development and operation: Main challenges and countermeasures. Electr. Power 2017, 50, 2–6. [Google Scholar]
  10. Zhang, Z.G.; Kang, C.Q. Challenges and prospects for constructing the new-type power system towards a carbon neutrality future. Proc. CSEE 2022, 42, 2806–2818. [Google Scholar]
  11. Yin, Q.L.; Qin, W.P.; Yu, H.; Yao, H.M.; Zhu, Y.J.; Jia, Y.B.; Han, X.Q. Transaction model for electricity spot market considering the volatility of wind power and the randomness of electric vehicles. Power Syst. Prot. Control 2020, 48, 118–127. [Google Scholar]
  12. Wu, J.; Xue, Y.S.; Shu, Y.B.; Xie, D.L.; Xue, F.; Xu, J.B. Adequacy optimization for a large-scale renewable energy integrated power system: Part one spinning-grade reserve optimization. Autom. Electr. Power Syst. 2019, 43, 101–109. [Google Scholar]
  13. Su, Y.; Shi, J.T.; Zhang, J.F.; Gong, L.L.; Guo, Y.; Shen, X.W. Review on planning and bidding strategy of energy storage considering frequency FM. Electr. Power Autom. Equip. 2021, 41, 191–198. [Google Scholar]
  14. Sun, W.Q.; Tian, K.P.; Tan, Y.M.; Ye, L. Power grid dispatching plan and evaluation considering spatial and temporal characteristics of flexibility demands. Electr. Power Autom. Equip. 2018, 38, 168–174. [Google Scholar]
  15. Xiao, D.Y.; Wang, C.M.; Zeng, P.L.; Sun, W.Q. Power source flexibility evaluation considering renewable energy generation uncertainty. Electr. Power Autom. Equip. 2015, 35, 120–125. [Google Scholar]
  16. Doherty, R.; OMalley, M. A new approach to quantify reserve demand in systems with significant installed wind capacity. IEEE Trans. Power Syst. 2005, 20, 587–595. [Google Scholar] [CrossRef]
  17. Wang, M.Q.; Gooi, H.B. Spinning Reserve Estimation in Microgrids. IEEE Trans. Power Syst. 2011, 26, 1164–1174. [Google Scholar] [CrossRef] [Green Version]
  18. Wang, M.Q.; Gooi, H.B.; Chen, S.X. Optimizing probabilistic spinning reserve using an analytical expected energy-not-supplied formulation. IET Gener. Transm. Distrib. 2011, 5, 772–780. [Google Scholar] [CrossRef]
  19. Warrington, J.; Hohl, C.; Goulart, P.J.; Morari, M. Rolling unit commitment and dispatch with multi-stage recourse policies for heterogeneous devices. IEEE Trans. Power Syst. 2016, 31, 187–197. [Google Scholar] [CrossRef]
  20. Xue, S.; Wang, Z.J.; Han, R.; Zeng, M.; Wang, Y.J. A Secure and Economic Planning Model for Fast Response Thermal Units Considering Grid-Integration of Large-Scale Wind Farm. Power Syst. Technol. 2013, 37, 2888–2895. [Google Scholar]
  21. Xue, Y.S.; Yu, Z.; Zhao, J.H.; Li, K.; Liu, X.Q.; Wu, Q.W.; Yang, G.Y. A Review on Short-term and Ultra-short-term Wind Power Prediction. Autom. Electr. Power Syst. 2015, 39, 141–151. [Google Scholar]
  22. Fan, S.; Liao, J.R.; Yokoyama, R.; Chen, L.; Lee, W. Forecasting the Wind Generation Using a Two-Stage Network Based on Meteorological Information. IEEE Trans. Energy Convers. 2009, 24, 474–482. [Google Scholar] [CrossRef]
  23. Sideratos, Q.; Hatziargyriou, N.D. An Advanced Statistical Method for Wind Power Forecastion. IEEE Trans. Power Syst. 2007, 22, 258–265. [Google Scholar] [CrossRef]
  24. Li, Y.S.; Li, T.Y.; Zhang, H.G.; Xie, X.P.; Sun, Q.Y. Distributed Resilient Double-Gradient-Descent Based Energy Management Strategy for Multi-Energy System Under DoS Attacks. IEEE Trans. Netw. Sci. Eng. 2022, 9, 2301–2316. [Google Scholar] [CrossRef]
  25. Pan, H.Y.; Chen, X.Y.; Jin, T.Y.; Bai, Y.; Chen, Z.F.; Wen, J.Y.; Wu, Q.W. Real-Time Power Market Clearing Model With Improved Network Constraints Considering PTDF Correction and Fast-Calculated Dynamic Line Rating. IEEE Trans. Ind. Appl. 2023, 59, 2130–2139. [Google Scholar] [CrossRef]
  26. Mirzaei, M.A.; Nazari-Heris, M.; Mohammadi-Ivatloo, B.; Zare, K.; Marzband, M.; Shafie-Khah, M.; Anvari-Moghaddam, A.; Catalão, J.P. Network-Constrained Joint Energy and Flexible Ramping Reserve Market Clearing of Power- and Heat-Based Energy Systems: A Two-Stage Hybrid IGDT–Stochastic Framework. IEEE Syst. J. 2021, 15, 1547–1556. [Google Scholar] [CrossRef]
  27. Wang, X.F. Block bidding model based energy market. Proc. CSEE 2001, 21, 1–6. [Google Scholar]
  28. Geng, J.; Wang, X.F.; Ding, X.Y.; Bai, X.Z.; Chen, H.Y. Models of block bidding in energy market and comparisons with hourly bidding. Proc. CSEE 2003, 23, 22–27. [Google Scholar]
  29. Wang, J.X.; Zhang, C.G.; Wang, X.L.; Chen, H.J. A mixed bidding mode and its clearing algorithm for electricity market applications. Autom. Electr. Power Syst. 2011, 35, 28–33. [Google Scholar]
  30. Bao, M.L.; Ding, Y.; Shao, C.Z.; Song, Y.H. Review of Nordic electricity market and its suggestions for China. Proc. CSEE 2017, 37, 4881–4892. [Google Scholar]
  31. Li, Z.; Pang, B.; Li, G.D.; Fan, M.H.; Qu, H.Y. Development of unified European electricity market and its implications for China. Autom. Electr. Power Syst. 2017, 41, 2–9. [Google Scholar]
  32. Zeng, M.; Liu, C.; Duan, J.H.; Li, N. The bilateral electricity market modes of typical countries and our reference from America and Nordic. East China Electr. Power 2013, 41, 5–10. [Google Scholar]
  33. Madrigal, M.; Quintana, V.H. Existence and determination of competitive equilibrium in unit commitment power poolauctions: Price setting and scheduling alternatives. IEEE Trans. Power Syst. 2001, 16, 380–388. [Google Scholar] [CrossRef] [PubMed]
  34. Lam, L.H.; Ilea, V.; Bovo, C. European day-ahead electricity market coupling: Discussion, modeling, and case study. Electr. Power Syst. Res. 2018, 155, 80–92. [Google Scholar] [CrossRef]
  35. Le, H.L.; Ilea, V.; Bovo, C. Integrated European intra-day electricity market: Rules, modeling and analysis. Appl. Energy 2019, 238, 258–273. [Google Scholar] [CrossRef]
  36. Jiang, H.L.; Cai, J.C.; Xiao, R.; Wang, A.H.; Xie, Y.; Tang, X.J. A wind- storage coordinated control strategy for improving system frequency response characteristics. Electr. Power Autom. Equip. 2021, 41, 44–51. [Google Scholar]
  37. Zhang, S.Q.; Yuan, B.; Xu, Q.S.; Zhao, J.F. Optimal control strategy of secondary frequency FM for power grid with large-scale energy storages. Electr. Power Autom. Equip. 2019, 39, 82–88. [Google Scholar]
  38. Li, S.J.; Xie, M.; Li, J.Z.; Huang, B.B.; Lin, S.Z. Study on the Joint Optimization Mode of Electric Energy and Regulation Market. South. Energy Constr. 2020, 7, 55–61. [Google Scholar]
  39. Zhang, H.Y.; Wang, Y. Mechanism experience of foreign grid-side storage participating in frequency FM auxiliary service market and its enlightenment to China. Energy Storage Sci. Technol. 2021, 10, 766–773. [Google Scholar]
  40. Chen, D.Y.; Zhang, L.Z.; Wang, S.; Mou, M.F. Development of energy storage in frequency FM market of united states and its enlightenment. Autom. Electr. Power Syst. 2013, 37, 9–13. [Google Scholar]
  41. Zhu, J.Z.; Ye, Q.Z.; Zou, J.; Xie, P.P.; Xuan, P.Z. Short-term operation service mechanism of auxiliary service in the UK electricity market and its enlightenment. Autom. Electr. Power Syst. 2018, 42, 1–8. [Google Scholar]
  42. Chen, D.P.; Jing, Z.X. Analysis of frequency modulation compensation mechanism in frequency modulation ancillary service market of United States. Autom. Electr. Power Syst. 2017, 41, 1–9. [Google Scholar]
  43. Chen, Z.F.; Jing, Z.X.; Chen, D.P.; Xie, W.J. Analysis on pricing mechanism in frequency FM auxiliary services market of United States. Autom. Electr. Power Syst. 2018, 42, 1–10. [Google Scholar]
  44. Chen, H.; Jia, Y.B.; Zheng, J.; Yan, Z.; Wang, J.H.; Chang, X. Research on market mechanism and scheduling strategy of frequency FM auxiliary service of large-scale energy storage. Power Syst. Technol. 2019, 43, 3606–3617. [Google Scholar]
  45. Hu, J.; Huang, B.B.; Jiang, L.P.; Feng, K.H.; Li, Q.H.; Xu, Z. Application and major issues of electrochemical energy storage under the environment of energy market. Electr. Power 2020, 53, 100–107. [Google Scholar]
  46. Liu, Y.Q.; Zou, P.; Yan, Z.S.; Li, M.D.; Zhao, X.Q.; Chen, Q.X. Mechanism design and operation practice of Shanxi power frequency FM market in China. Autom. Electr. Power Syst. 2019, 43, 175–182. [Google Scholar]
  47. Yi, S.M.; Chen, Q.S.; Wen, F.S.; Chen, M.H. A new method for regulator performance assessment of generation units. Autom. Electr. Power Syst. 2009, 33, 96–100. [Google Scholar]
  48. Dong, L.; Gao, C.W.; Yu, J.; Teng, X.L.; Tu, M.F.; Ding, Q.; Frequency, F.M. Reserve market mechanism considering decomposition of medium term and long-term electricity contact. Autom. Electr. Power Syst. 2018, 42, 61–66+74. [Google Scholar]
  49. Liu, J.Z.; Yao, Q.; Liu, Y.; Hu, Y. Wind farm primary frequency control strategy based on wind & thermal power joint control. Proc. CSEE 2017, 37, 3462–3469. [Google Scholar]
  50. Liu, G.Y.; Chen, N.S.; Pu, T.J.; Yang, Z.Y. Mathematical model and clearing price analysis of co-optimization of energy regulation and operating reserves. Autom. Electr. Power Syst. 2014, 38, 71–78. [Google Scholar]
  51. Zhang, X.Y.; Chen, Q.X.; Ge, R.; Zhao, X.Q.; Li, M.D.; Zou, P. Clearing Model of Electricity Spot Market Considering Flexible Block Order. Autom. Electr. Power Syst. 2017, 41, 35–41. [Google Scholar]
  52. Li, S.W.; Kong, X.Y.; Liu, C.; Yue, L.; Cao, S.N. Demand Side Management Pricing Method Considering Multi-user Behavior Characteristics. Power Syst. Technol. 2023, 47, 1942–1950. [Google Scholar]
  53. José, I.; Filipe, S.; Manuel, M. Optimal bidding strategy for an aggregator of prosumers in energy and secondary reserve markets. Appl. Energy 2019, 238, 1361–1372. [Google Scholar]
  54. Pang, H.Y. Research on Load Aggregator’s Participation in Wind-solar Consumption Scheduling Strategy. Mech. Electr. Eng. Technol. 2023, 52, 114–117. [Google Scholar]
  55. Chen, G.P.; Liang, Z.F.; Dong, Y. Analysis and reflection on the marketization construction of electric power with Chinese characteristics based on energy transformation. Proc. CSEE 2020, 40, 369–379. [Google Scholar]
  56. Zhang, X.; Shi, L.J. Future research areas and key technologies of electricity market in China. Autom. Electr. Power Syst. 2020, 44, 1–11. [Google Scholar]
  57. Fang, X.X.; Yang, Z.F.; Yu, J.; Zou, P.; Zhao, W.J.; Lai, X.W. Theoretical analysis and extension of locational marginal price. Proc. CSEE 2020, 40, 379–389. [Google Scholar]
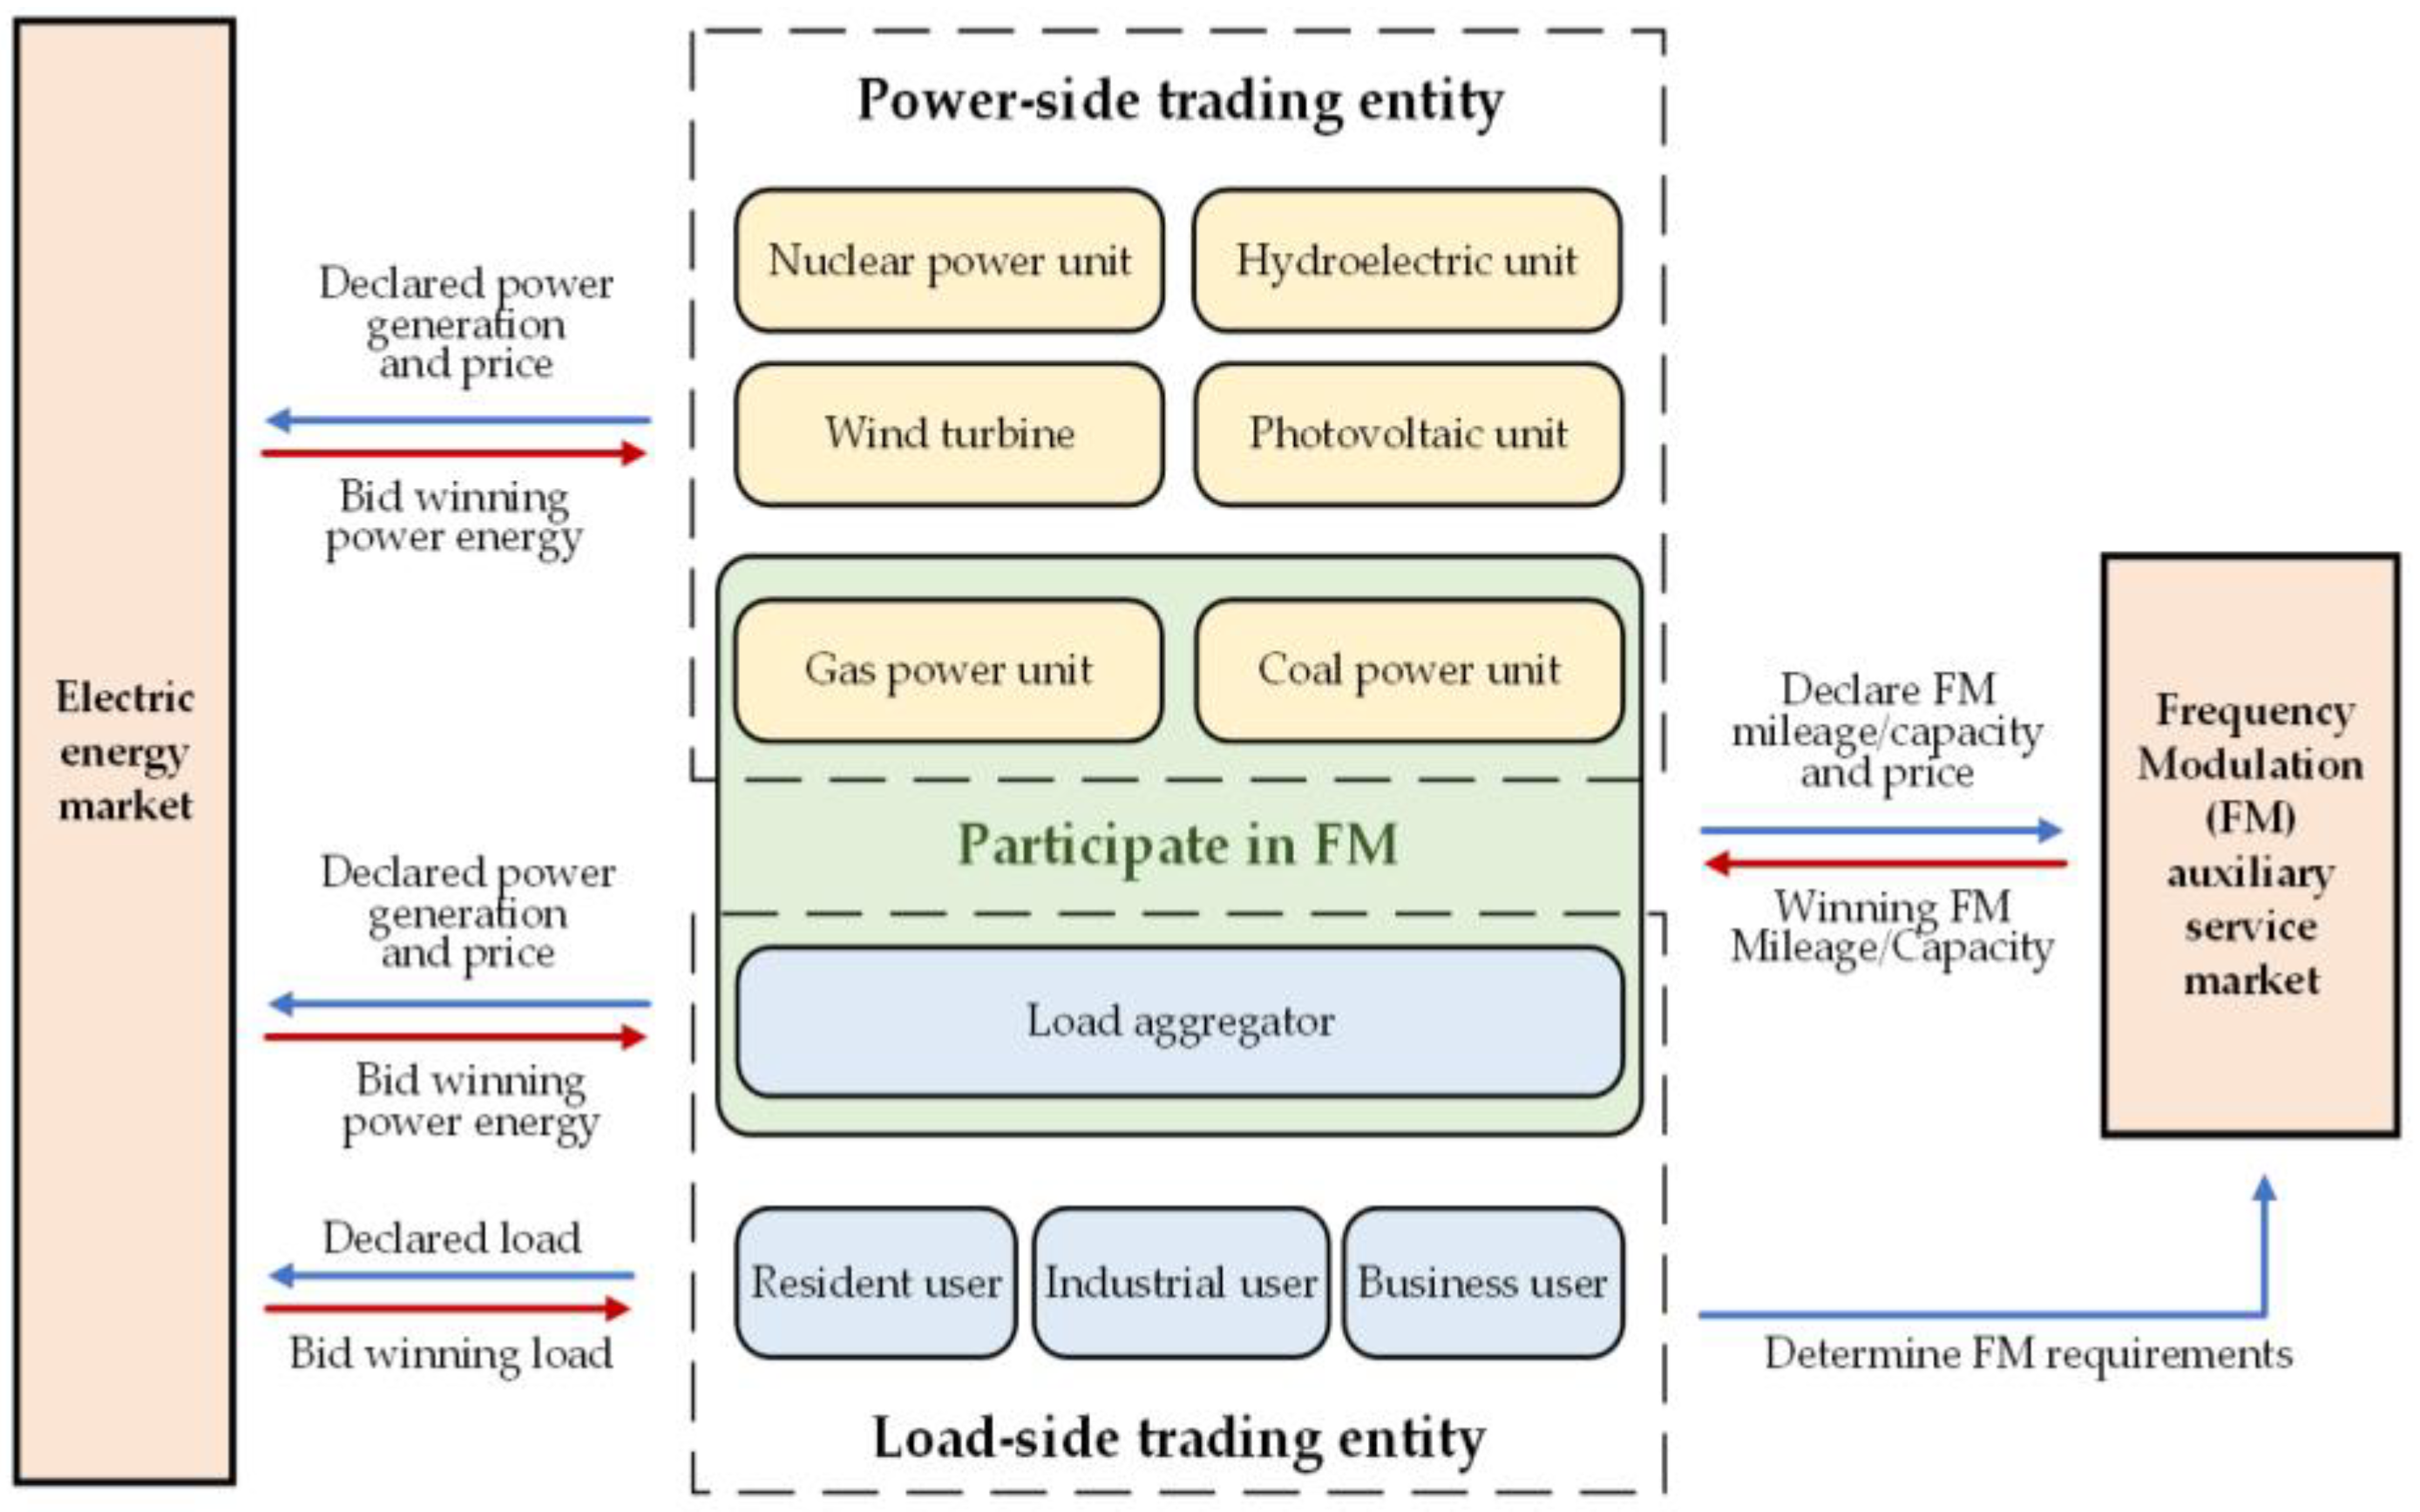
Figure 1. Energy-FM joint clearing trading framework.
Energies 16 05413 g001
Figure 2. Two-stage clearing trading model.
Energies 16 05413 g002
Figure 3. Improved network topology for IEEE 14-bus systems.
Energies 16 05413 g003
Figure 4. Typical daily output curve of power generator units.
Energies 16 05413 g004
Figure 5. Typical daily load curve of load user.
Energies 16 05413 g005
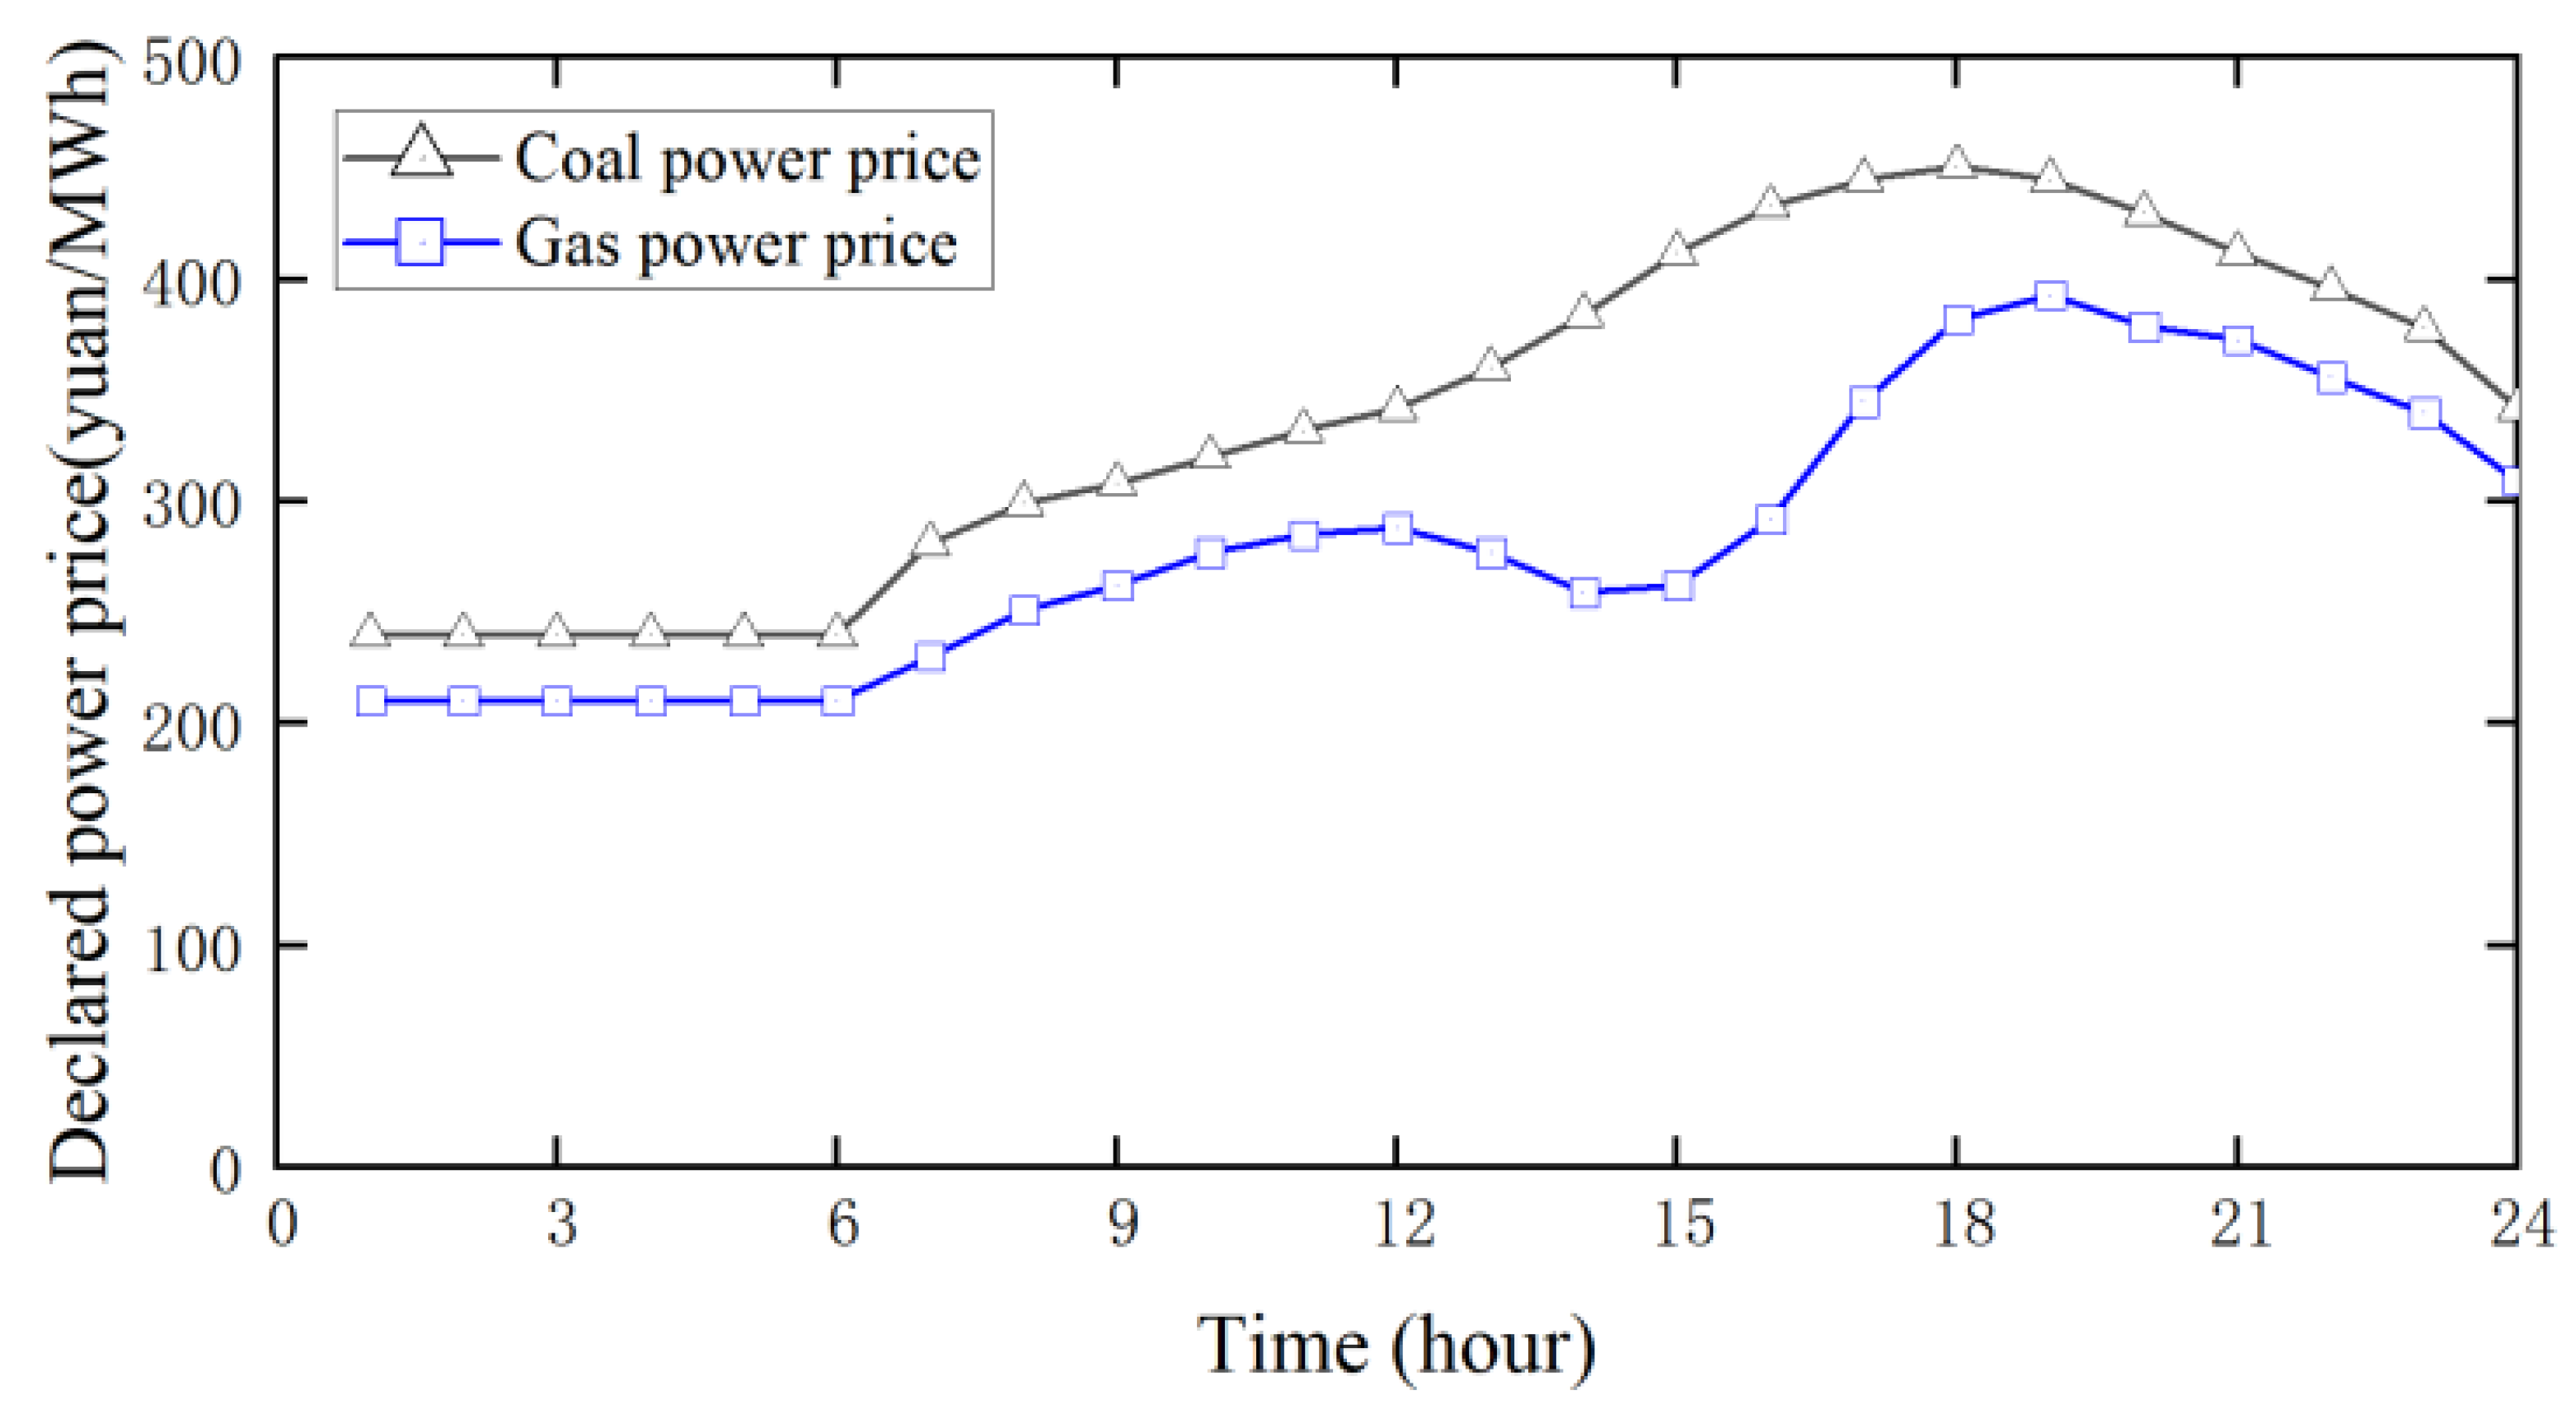
Figure 6. Declared power price of coal and gas.
Energies 16 05413 g006
Figure 7. Typical daily system total load.
Energies 16 05413 g007
Figure 8. Clearing process.
Energies 16 05413 g008
Figure 9. Bidding results in the electrical energy market.
Energies 16 05413 g009
Figure 10. Proportion of renewable energy generation.
Energies 16 05413 g010
Figure 11. Bidding results of FM capacity.
Energies 16 05413 g011
Figure 12. Bidding results of FM mileage.
Energies 16 05413 g012
Figure 13. Clearing price of the energy market.
Energies 16 05413 g013
Figure 14. Clearing price of the FM market.
Energies 16 05413 g014
Table 1. Physical and economic characteristics and trading demand of each trading unit on the power-side.
Trading SubjectPhysical CharacteristicsEconomic CharacteristicsTrading Demand
VolatilityRegulatory CapacityControl RateAdjust-
Ability
Nuclear powerLowSmallLowGoodHigh investment cost and low operation costStability
Biomass powerLowSmallmiddleBetterHigh investment cost and low operation costStable output
Hydro-energyLowLargeFastGoodHigh investment cost and low operation costStable output
Wind powerHighSmallLowpoorHigh investment cost and low operation costPriority clearing
Overall clearing
Photo-voltaicHighSmallFastpoorHigh investment cost and low operation cost
Coal powerLowLargemiddleGoodMedium investment cost and high operation costGeneration under high load
Reserve capacity
Table 2. Physical and economic characteristics and trading demand of each trading unit on the load-side.
Trading SubjectPhysical CharacteristicsTrading Demand
Load CapacityVolatilityDemand ElasticityInteractive Quality
Residential electricityLowHighSmall Priority guarantee
Industrial and commercial electricityHighLowSmall Low risk
Load aggregatorLowLowLarge√ *Flexible adjustment, peak cutting, and valley filling
* Only load aggregators have interactivity.
Table 3. Trading varieties of flexible block.
Flexible Block TypeDeclarationsClearing RulesTrading Demand
Sustaining BlockSingle price
Power continuity
Standardized power output curveUndertake baseload
Flux BlockSingle price
Variable power output
Flexible power output curve
Integral power out
Declared output curve
High volatility
Adjustment BlockMultiple prices
Power pairing
High and low power price matchingLoad adjustment
Peaking assistance
Table 4. Technical and cost parameters of generator units.
NodesPower GenerationInstalled Capacity/MWPower Ceiling/MWPower Limit/MWUpper Adjustment Rate/(MW/h)Lower Adjustment Rate/(MW/h)Maintenance Costs/(RMB 10,000/MW)
1Photovoltaic 12002000--0.4
1Photovoltaic 22002000--0.4
1Gas power 1180180201201201.0
2Wind power 11401400--0.5
2Wind power 21401400--0.5
2Coal power 11801802036360.9
3Nuclear power13803803001601600.6
6Hydro energy 1100100301001000.6
6Hydro energy 2100100301001000.6
6Hydro energy 3100100301001000.6
11Photovoltaic 32002000--0.4
11Photovoltaic 42002000--0.4
11Gas power 2180180201201201.0
14Wind power 31401400--0.5
14Wind power 41401400--0.5
14Coal power 21801802036360.9
Table 5. Declared power price of nuclear power and hydropower.
Power GenerationSingle Power Price (RMB/(MW·h))Power Consumption (MW h)
Nuclear power unit2807296
Hydroelectric unit2805760
Table 6. Load aggregator energy release quotation.
Power GenerationDischarging Power Price (RMB/(MW·h))Maximum Discharging Capacity (MW·h)Start TimeEnd Time
Load aggregator32012011:0021:00
Table 7. Bidding parameters for FM auxiliary service.
Power GenerationCoal Power UnitGas Power UnitLoad Aggregator
Total number of units226
Mileage quotation/(RMB/MW)18129
Capacity quotation/(RMB/MW)121521
Ratio of FM capacity to rated power0.0750.150.5
Historical mileage–capacity ratio71320
Comprehensive FM performance indicators0.220.590.96
Adjusting accuracy0.170.731.00
Response time0.430.811.00
Adjusting speed0.100.110.85
Table 8. Comparison results under different scenarios.
ScenarioScenario 1Scenario 2Scenario 3
Total market welfare (RMB 10,000)5889.125410.015608.68
Standard deviation of net load93.82102.45106.07
Proportion of renewable energy power generation (%)82.8672.1186.68
Comprehensive price of energy market/(RMB/(MW·h))304.36320.88319.58
Comprehensive price of FM market/(RMB/(MW·h))28.4929.61
Disclaimer/Publisher’s Note: The statements, opinions and data contained in all publications are solely those of the individual author(s) and contributor(s) and not of MDPI and/or the editor(s). MDPI and/or the editor(s) disclaim responsibility for any injury to people or property resulting from any ideas, methods, instructions or products referred to in the content.