1. Introduction
The modernization of services, globalization, and the development of various economic sectors have made society increasingly dependent on the use of electricity. Alongside this, the appeal of environmentalists and the commitment to the Paris Agreement have resulted in a growing demand for cleaner energy [
1]. Therefore, the service must be delivered with quality, safety, and reliability, which are closely linked to planned expansion and proper operation.
The transmission network refers to the transmission facilities of the national interconnected system that operate at a voltage level of 230 kV or higher [
2]. In addition to complying with the regulations set by Agência Nacional de Energia Elétrica, Brazil (ANEEL), these facilities are operated by power distribution companies in coordination with the National Electric System Operator (ONS) [
3]. Furthermore, they must comply with the network procedures established by the ONS, ensuring standardized operations and the efficient management of the grid [
4].
Among the documents that are part of the ONS’s network procedure, there is Sub-module 2.6, which establishes the minimum requirements for substations (SS) and their equipment [
5]. In this sub-module, regarding the auxiliary services of the substations, especially the alternating current power supply, which is the focus of this article, the substations must have at least two power sources (referred to as Source 1 and Source 2 in
Figure 1):
If the internal source option is chosen, these sources can be supplied either via the tertiary winding of the transformer or by using a specifically designated transformer explicitly for this purpose [
4].
However, if neither of these options is feasible for the considered substation, the responsible project agent must propose an alternative solution for evaluation by the ONS. If the proposed solution is deemed viable, it will be approved by the ONS. Typically, a diesel generator capable of supplying both essential and non-essential loads is the usual solution in such cases [
4].
In addition, a system must be provided that automatically transfers the load to Source 2 when there is a voltage failure at Source 1 [
4].
Finally, in case of failure of the two main sources, the use of the emergency DG is also foreseen, which must be able to automatically supply the essential loads, as shown in
Figure 1 [
4].
The substations are contemplated at several strategic points, and the impact generated is huge in the event of a fault that requires their shutdown. As mentioned above, several substations do not comply with the network procedures regarding the supply of auxiliary services, putting the supply of connected loads at risk.
This work is part of the R&D project entitled “Technical Arrangement to Increase Electrical Reliability and Safety Applying Energy Storage by Batteries and Photovoltaic Systems to the Auxiliary Service of 230/500 kV Substations”, which was approved in the Public Call of CHESF (Companhia Hidro Elétrica do São Francisco, Recife, Brazil)—R&D + I 02/2019, which was prepared and carried out by CHESF and regulated by ANEEL. This project uses, as a base, the Messias Substation (Messias SS, Messias, Brazil), located in Alagoas/Brazil.
The Messias Substation, located in Alagoas, is a transmission substation that performs two functions: (i) stepping down the voltage from 500 kV to 230 kV and (ii) sectioning a 500 kV transmission line. Its availability is crucial for the supply of the metropolitan region of Maceió (the capital of the state of Alagoas) and is vital for restoring the system under contingency conditions [
5].
However, the auxiliary services of the Messias Substation are fed by two sources: Source 1 is the local distribution network (Equatorial), supplied at 69 kV, and Source 2 is also the local distribution network from the same substation. Therefore, there is no independence between the sources. As a backup, there are two diesel generators [
5]. One is a 600 kVA DG that only operates upon request, and the other is a smaller 225 kVA DG with an automated startup. However, even with automation, they still experience interruptions in the supply of loads after detecting the absence of voltage in the AC bus. Furthermore, the bigger generator, which would function as the second independent source, does not have an automatic startup. Therefore, until the other generator is started, the second independent source is a DG that may not supply all essential loads due to its power capacity.
Thus, this substation is an example of a case in which there are inadequacies from the perspective of the ONS, specifically in Sub-module 2.6 of the Network Procedures. A reconfiguration of Source 2 is required in order to address these inadequacies.
To remedy this problem, studies were performed in order to replace the DGs (main source and emergency source) with a more sustainable and effective solution: Energy Storage Systems using batteries. These are gaining notoriety with regard to electrical systems and are more reliable solutions, mitigating possible power outages. Furthermore, they are associated with photovoltaic systems, a clean energy source.
For this article, considering, as a base, the data from the Messias SS, studies, simulations, and analyses were performed regarding the reliability, financial viability, and environmental impacts of implementing solutions using BESSs with or without the photovoltaic system. These solutions were compared with using the diesel generator for the same purpose (main source and emergency source).
1.1. Battery Energy Storage System—BESS
Battery Energy Storage Systems enable the storage of energy in some form so that it can be later converted into electrical energy and used for its intended purpose. There are various sources and storage technologies available, and each application may require a suitable solution. In this article, the focus will be on the electrochemical source, specifically the lead–acid technology, which is part of a BESS. The following are the main components of a BESS.
Batteries: This component is responsible for storing energy electrochemical and delivering it as electrical energy when required. Cells are connected in series and parallel to achieve the desired voltage and current level of the battery. Furthermore, the main classification characteristics of batteries include efficiency, lifespan (determined by the number of cycles), operational temperature, depth of discharge (DoD), self-discharge, and energy density. There are different types of batteries, such as lithium-ion and lead–acid, each with its characteristics and suitability for specific applications [
6].
PCS (Power Converter System): This component is responsible for the interface between the electrical grid and the batteries [
6]. The PCS safely converts direct current (DC) to alternating current and vice versa by configuring specific parameters within the system. Additionally, the PCS operates in all four quadrants, enabling battery charging and discharging, reactive power absorption, and injection into the grid [
7]. It is worth noting that depending on the application, the PCS can act as a grid follower, meaning that it follows the voltage and frequency reference of the connected electrical grid (on-grid operation), or it can act as a grid former by providing reference values for the voltage and frequency (off-grid operation) [
8].
BMS (Battery Management System): This system monitors the critical parameters of the batteries to ensure safe operation within their operational limits and to preserve their lifespan. The BMS controls the current and voltage during charging and discharging, manages the maximum depth of charge to maintain the expected state of charge, performs electrochemical cell balancing, and monitors the temperature [
9].
EMS (Energy Management System): This component collects and consolidates information from all the subsystems of the BESS to enable efficient and safe control. The EMS serves as the “brain” of the BESS, controlling its functions.
Auxiliary systems: These support the other components to operate safely and include HVAC systems (Heating, Ventilating, and Air Conditioning), fire suppression systems, Uninterruptible Power Supply (UPS), containers, and Closed-Circuit Television (CCTV) monitoring.
Concerning the applications of BESSs, this type of system can support generation, distribution/transmission networks, as well as loads (consumers), isolated systems, energy markets, and capacity markets, as its applications are diverse. Some examples of their applications will be briefly explained below:
Voltage regulation: By controlling reactive power, it is possible to increase the voltage (providing reactive power) or decrease the voltage (absorbing reactive power) so that the value at the analyzed point stays within predefined limits [
10].
Frequency regulation: By controlling the active power, it is possible to increase the frequency (discharging the BESS, i.e., supplying more energy to the system, acting as a generator) or decrease the frequency (recharging the BESS, which acts as a load) so that the frequency stays within the configured limits of the system [
11].
Contingency/islanding/backup: in case of failure in the main source or a lack in the production of energy from the photovoltaic/wind system (intermittent sources), the BESS acts as an emergency reserve, maintaining the supply of pre-established loads [
12].
Demand control: The BESS helps to maintain the demand within the contracted value. If the demand exceeds the predefined value (configured in the system), the BESS discharges to supply the excess to the load. Its recharge is performed during periods of lower load, is limited to the demand, and avoids its surpassing.
Energy shifting: Energy can be stored during periods of lower cost/demand to be used later when the cost/demand is higher [
11]. Another example is when it is associated with intermittent sources such as wind and solar. In this case, when the load is lower than the generation, the surplus energy can be stored for later use [
10,
12].
Power smoothing: When associated with intermittent sources that do not operate linearly and when power variation does not have a positive impact on the grid, the BESS can operate by reducing this variation in the short term by absorbing peaks and compensating valleys via the charging and discharging of the BESS batteries [
13].
Power factor (PF) correction: Through the power supply and the absorption of the PCS’s reactive power, the BESS keeps the connection point within the pre-established limits, avoiding negative impacts on the grid and penalty payments to the local utility company [
14].
Clipping Recapture: It is common to have AC power exceeding the DC power in photovoltaic systems, which is known as clipping. This means that the power available from the PV modules on the DC bus exceeds the rated power of the inverters to which the bus is connected. As a result, the system’s output power is limited, even if the modules have more power available for generation. If the batteries of the BESS are connected to the same bus as the PV modules via a DC/DC converter, this excess energy can be stored in the batteries, preventing it from being wasted [
15].
1.2. Main Contributions
The contribution of this research lies in the development of a solution that utilizes a BESS with or without a photovoltaic system and is intended to serve as the main and emergency source for supplying AC auxiliary services in high-voltage substations.
In this way, this solution will contribute to the following:
Enabling high-voltage substations that do not comply with the Network Procedure to adopt the solution, thereby enhancing the safety and reliability of the power supply;
Reducing the emission of pollutant gases due to lower diesel consumption by generators;
Utilizing sustainable solutions when aiming to reduce the energy consumption paid to the local distribution network.
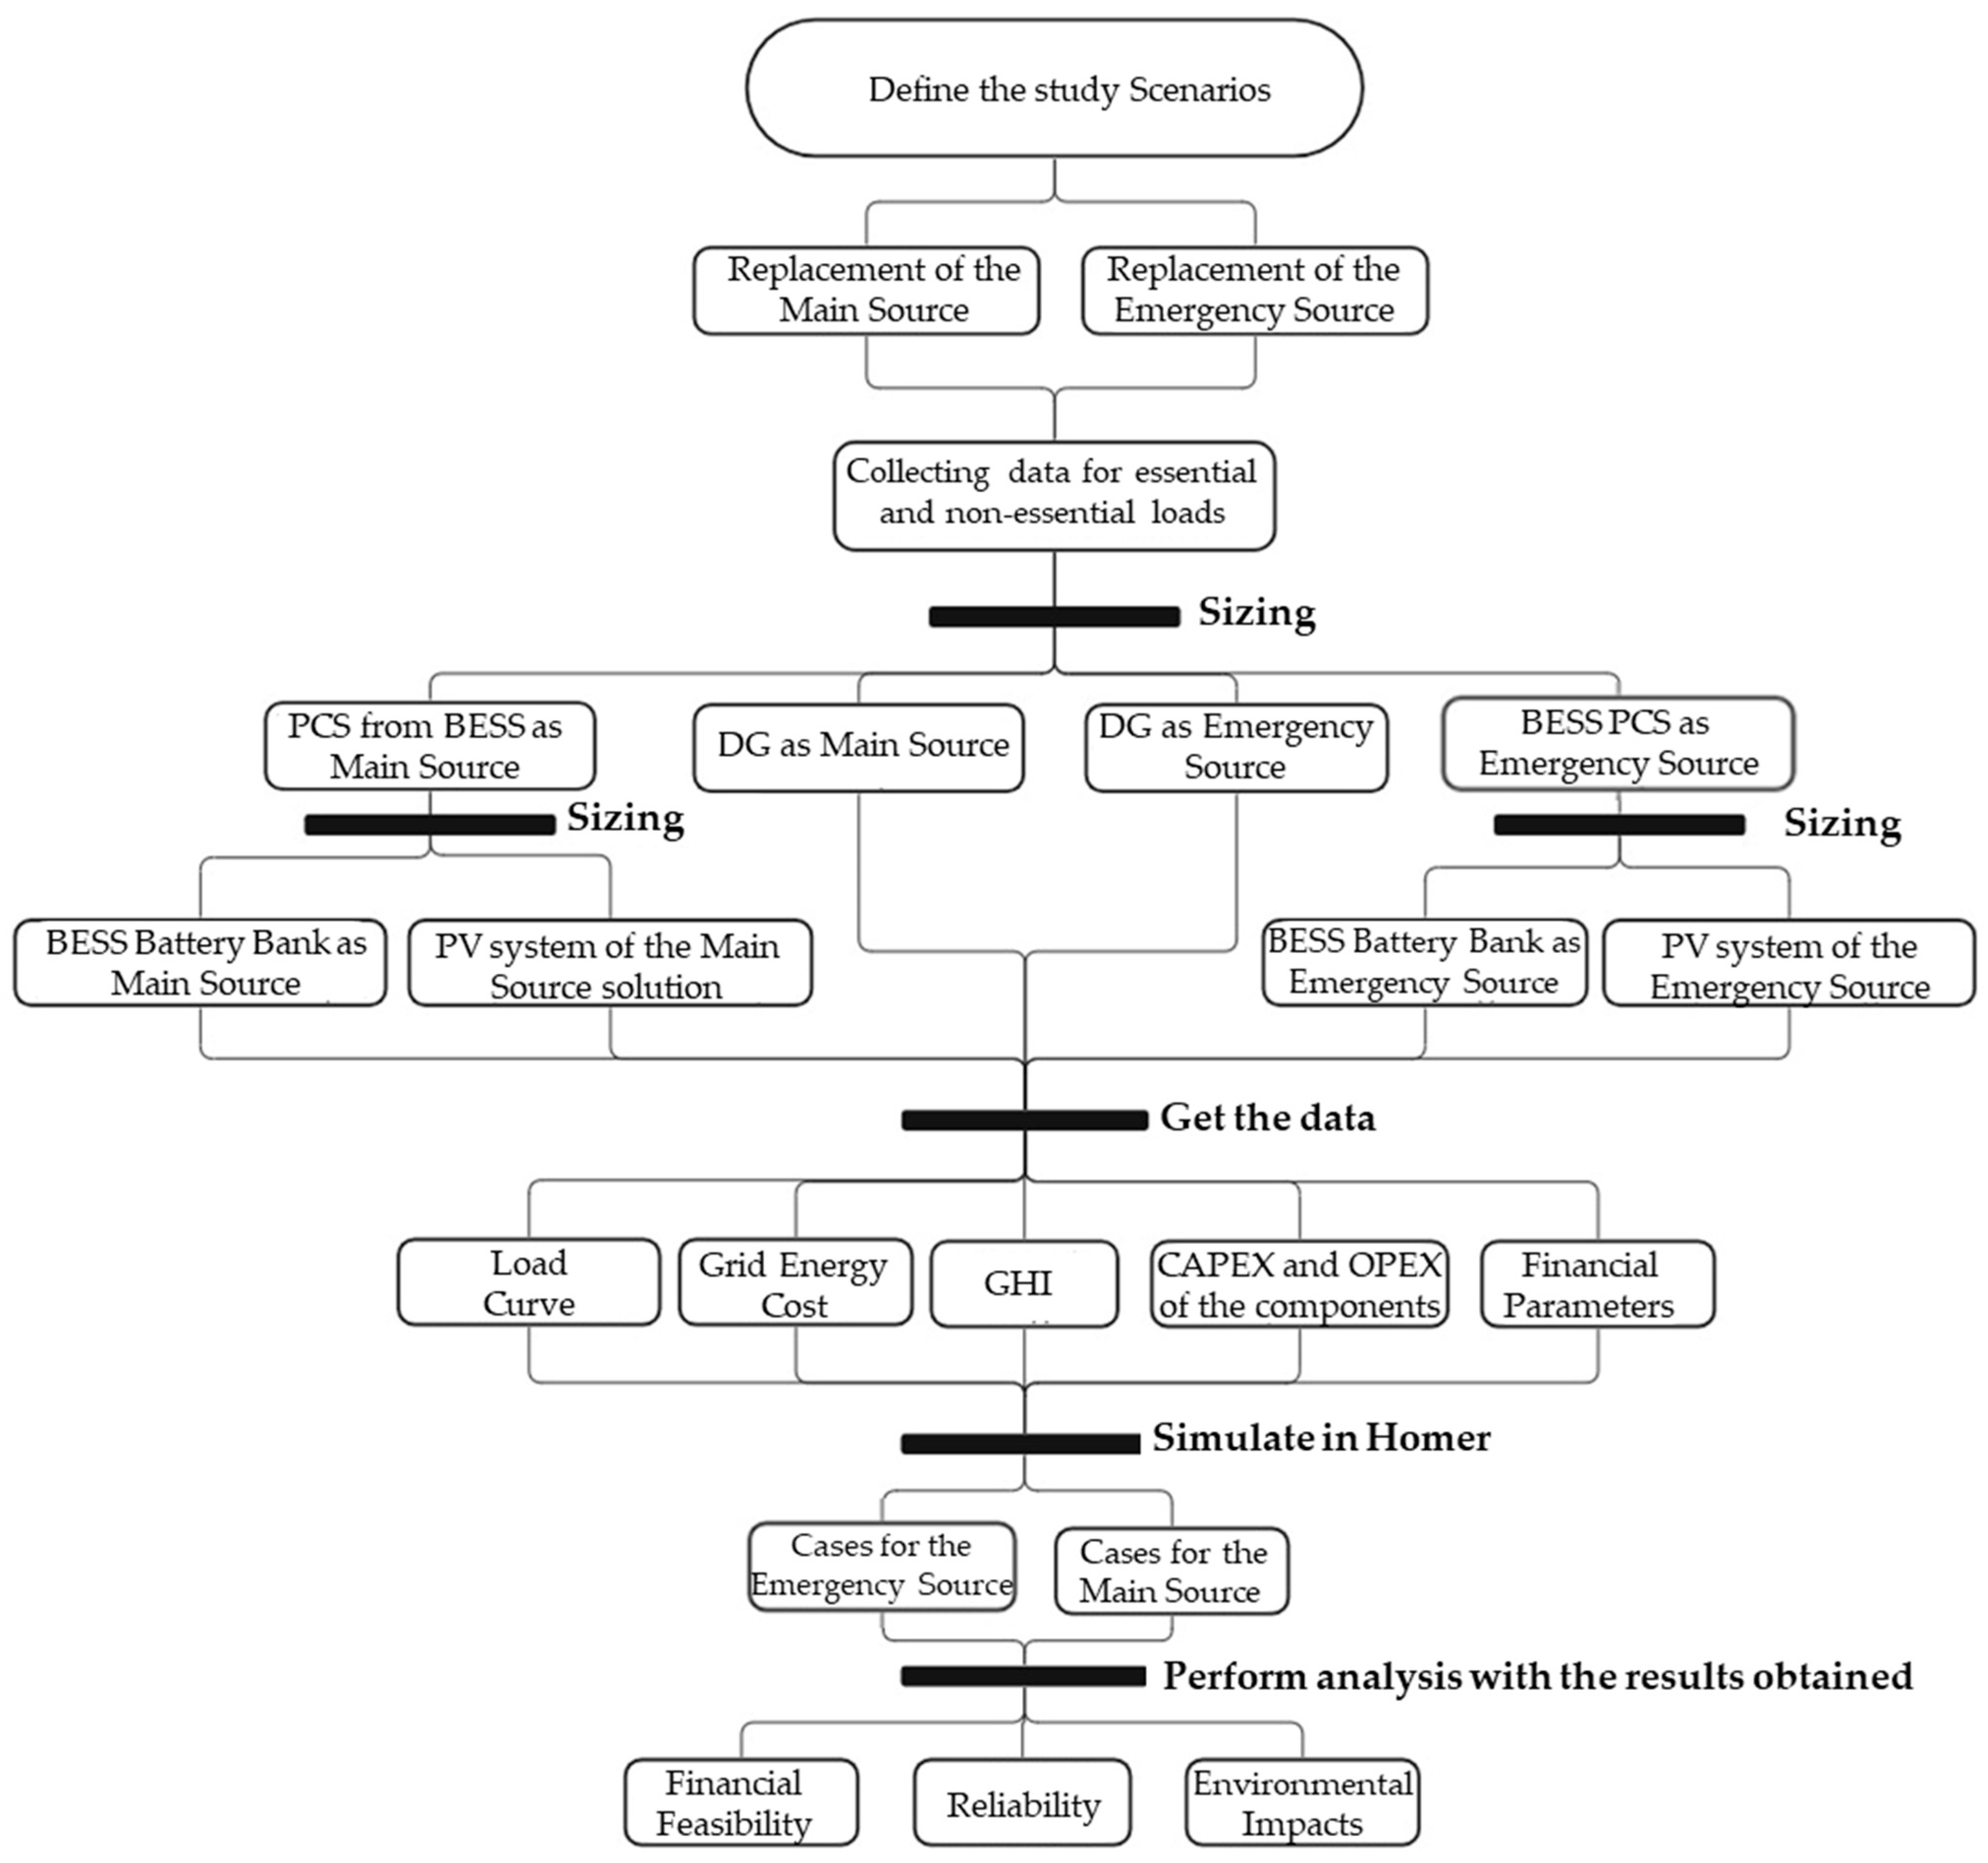
2. Materials and Methods
The methodology used in this article to study a more reliable, financially viable, and environmentally friendly solution that replaces the diesel generator used as the main and emergency source/backup is summarized in the flowchart in
Figure 2.
First, as suggested by the flowchart in
Figure 2, the study scenarios/cases for the replacement of the emergency source and the main source were defined, as follows:
Case 1: BESS (main source);
Case 2: BESS (main source) + PV system (main source);
Case 3: BESS (main source) + PV system (main source) + BESS (emergency source).
Case 4: BESS (emergency source);
Case 5: BESS (emergency source) + PV system (emergency source).
Cases 1, 2, and 3 are simulations for replacing the main source with BESS solutions, while cases 4 and 5 replace the emergency source. It should be noted that for Case 3, the BESS (emergency source) is used as a backup for the BESS (main source), and in this case, when activated, it will supply only the emergency loads.
Furthermore, in the cases in which a photovoltaic system is present, the BESS is recharged using solar energy from the photovoltaic system, rather than consuming from the electrical grid.
Subsequently, the essential and non-essential loads of the Messias SS were collected, enabling the sizing of all components of the BESS, photovoltaic system, and diesel generators for each study, as presented in
Section 2.1. The simulation using the Homer PRO version 3.14.5. software required the introduction of certain assumptions, including the load curve, Grid Energy Cost, Global Horizontal Irradiance (GHI), CAPEX, OPEX of the components, and other financial parameters, which are detailed in
Section 2.2. Finally, all cases were simulated, and their results were analyzed concerning their environmental impacts, reliability, and financial viability, in comparison to the use of diesel generators (DGs).
2.1. Sizing of the Solutions
The five cases presented were sized and analyzed based on data from the Messias Substation, which has Equatorial/Al as main source 1 and 2.
Table 1 presents the estimated essential and non-essential loads of the auxiliary services, which were provided by CHESF and are separated according to their use in Permanent (P), Intermittent (I), and Eventual (E) loads [
16].
Analyzing
Table 1, it can be observed that the majority of loads, based on their nominal values, are classified as non-essential, particularly the permanent loads. However, there is a higher proportion of intermittent loads that are considered essential compared to non-essential loads.
Based on the data from
Table 1, the two types of diesel generators were sized: one for emergency service, which only needs to provide power to essential loads, and another that acts as an internal/main source and needs to supply power to both the essential and non-essential loads when the other main source (Source 1) is unable to provide energy to the auxiliary services.
Equation (1) presents the formula used to calculate the nominal power of each generator.
where
PN = Nominal Power
PE = Permanent Loads
IE = Intermittent Loads
EE = Eventual Loads
SF = Safety Factor (typically ranging from 1 to 1.2)
Based on the calculations, the results obtained were 201.6 kVA for the emergency diesel generator and 616.5 kVA for the main-source DG. Considering market values, DGs with capacities of 225 kVA and 635 kVA were analyzed, respectively.
The dimensioning of the solutions using energy storage systems was performed considering that the BESS needs to have enough power to supply all the loads for which it was designed. In other words, the PCS of the BESS should have a minimum power equal to the sum of the essential loads for the case of the emergency BESS and one equal to the total loads (essential and non-essential) for the case of the main-source replacement.
Therefore, the PCS of the emergency BESS resulted in a minimum value of 167.66 kVA, and the PCS of the BESS used as the main source resulted in 513.75 kVA. Considering market values, the equipment capacities were approximately 200 kVA and 520 kVA, respectively.
Regarding the system’s energy, that is, the amount of battery the system needs to have, it was necessary to calculate the usage time of each load. This way, a demand factor was estimated, presented in
Table 2.
Knowing that the auxiliary services of the Messias Substation are supplied by the 69 kV network, according to Module 8 (Quality of Power Supply) of the Electric Power Distribution Procedures in the National Electric System—PRODIST, present in ANEEL Regulatory Resolution No. 956 of 7 December 2021, the maximum duration of continuous interruption per consumer unit or connection point cannot exceed 4 h.
Considering the limit of 4 h, the BESS replacing the main source had to have a useful energy capacity of approximately 1.5 MWh. For the calculation of the BESS for essential services, a duration of 3 h was considered, resulting in a required capacity of 296.13 kVA. Therefore, if the 4-h limit is reached or if, by chance, the BESS is not fully recharged during the outage from the main source, the emergency BESS can be used for an additional 3 h, supplying only the essential loads.
It is important to note that the batteries should not be completely discharged, and there are losses associated with the operation of the systems.
Table 3 presents the values that were considered for the calculation of the energy of the battery banks.
Considering the calculated useful energy and the losses presented in
Table 3, the BESS dimensioning is shown in
Table 4.
For the cases that also have a photovoltaic system, as there is the possibility of being in islanded mode (failure of the main source(s) and the PCS acting as a grid-forming voltage source), the system inverter (which has to be a hybrid type) should be smaller than the PCS; this is to avoid over-voltage and over-frequency at peak moments of photovoltaic generation. Thus, it was assumed that the inverters had approximately 70% of the power of each PCS and that the DC/AC ratio was 1.3 (market standard value) [
18]. The results of the sizing of the photovoltaic system that replaced the emergency source and the main source are presented in
Table 5.
2.2. Simulation Assumptions
For the use of the Homer Pro Version 3.14.5 software, as well as for the subsequent financial analysis, some assumptions were made. Below are the project input data and the values used according to the studied source.
2.2.1. Load
The load curve used for the case in which the source supplies all loads is presented in
Figure 3, which was based on the consumption data from 2018 and 2019. From the analysis, the maximum demand is approximately 118 kW and occurs at 18 h, while the minimum demand occurs at 9 h and is approximately 46 kW.
For the case of the BESS supplying only essential loads, there is no specific load curve because it would only occur in the event of a failure in the main sources. Therefore, a conservative factor of 0.7 was applied to the values presented in the load curve of
Figure 3. That is, the maximum demand became close to 83 kW and the minimum became close to 32 kW, indicating that 70% of the loads were essential.
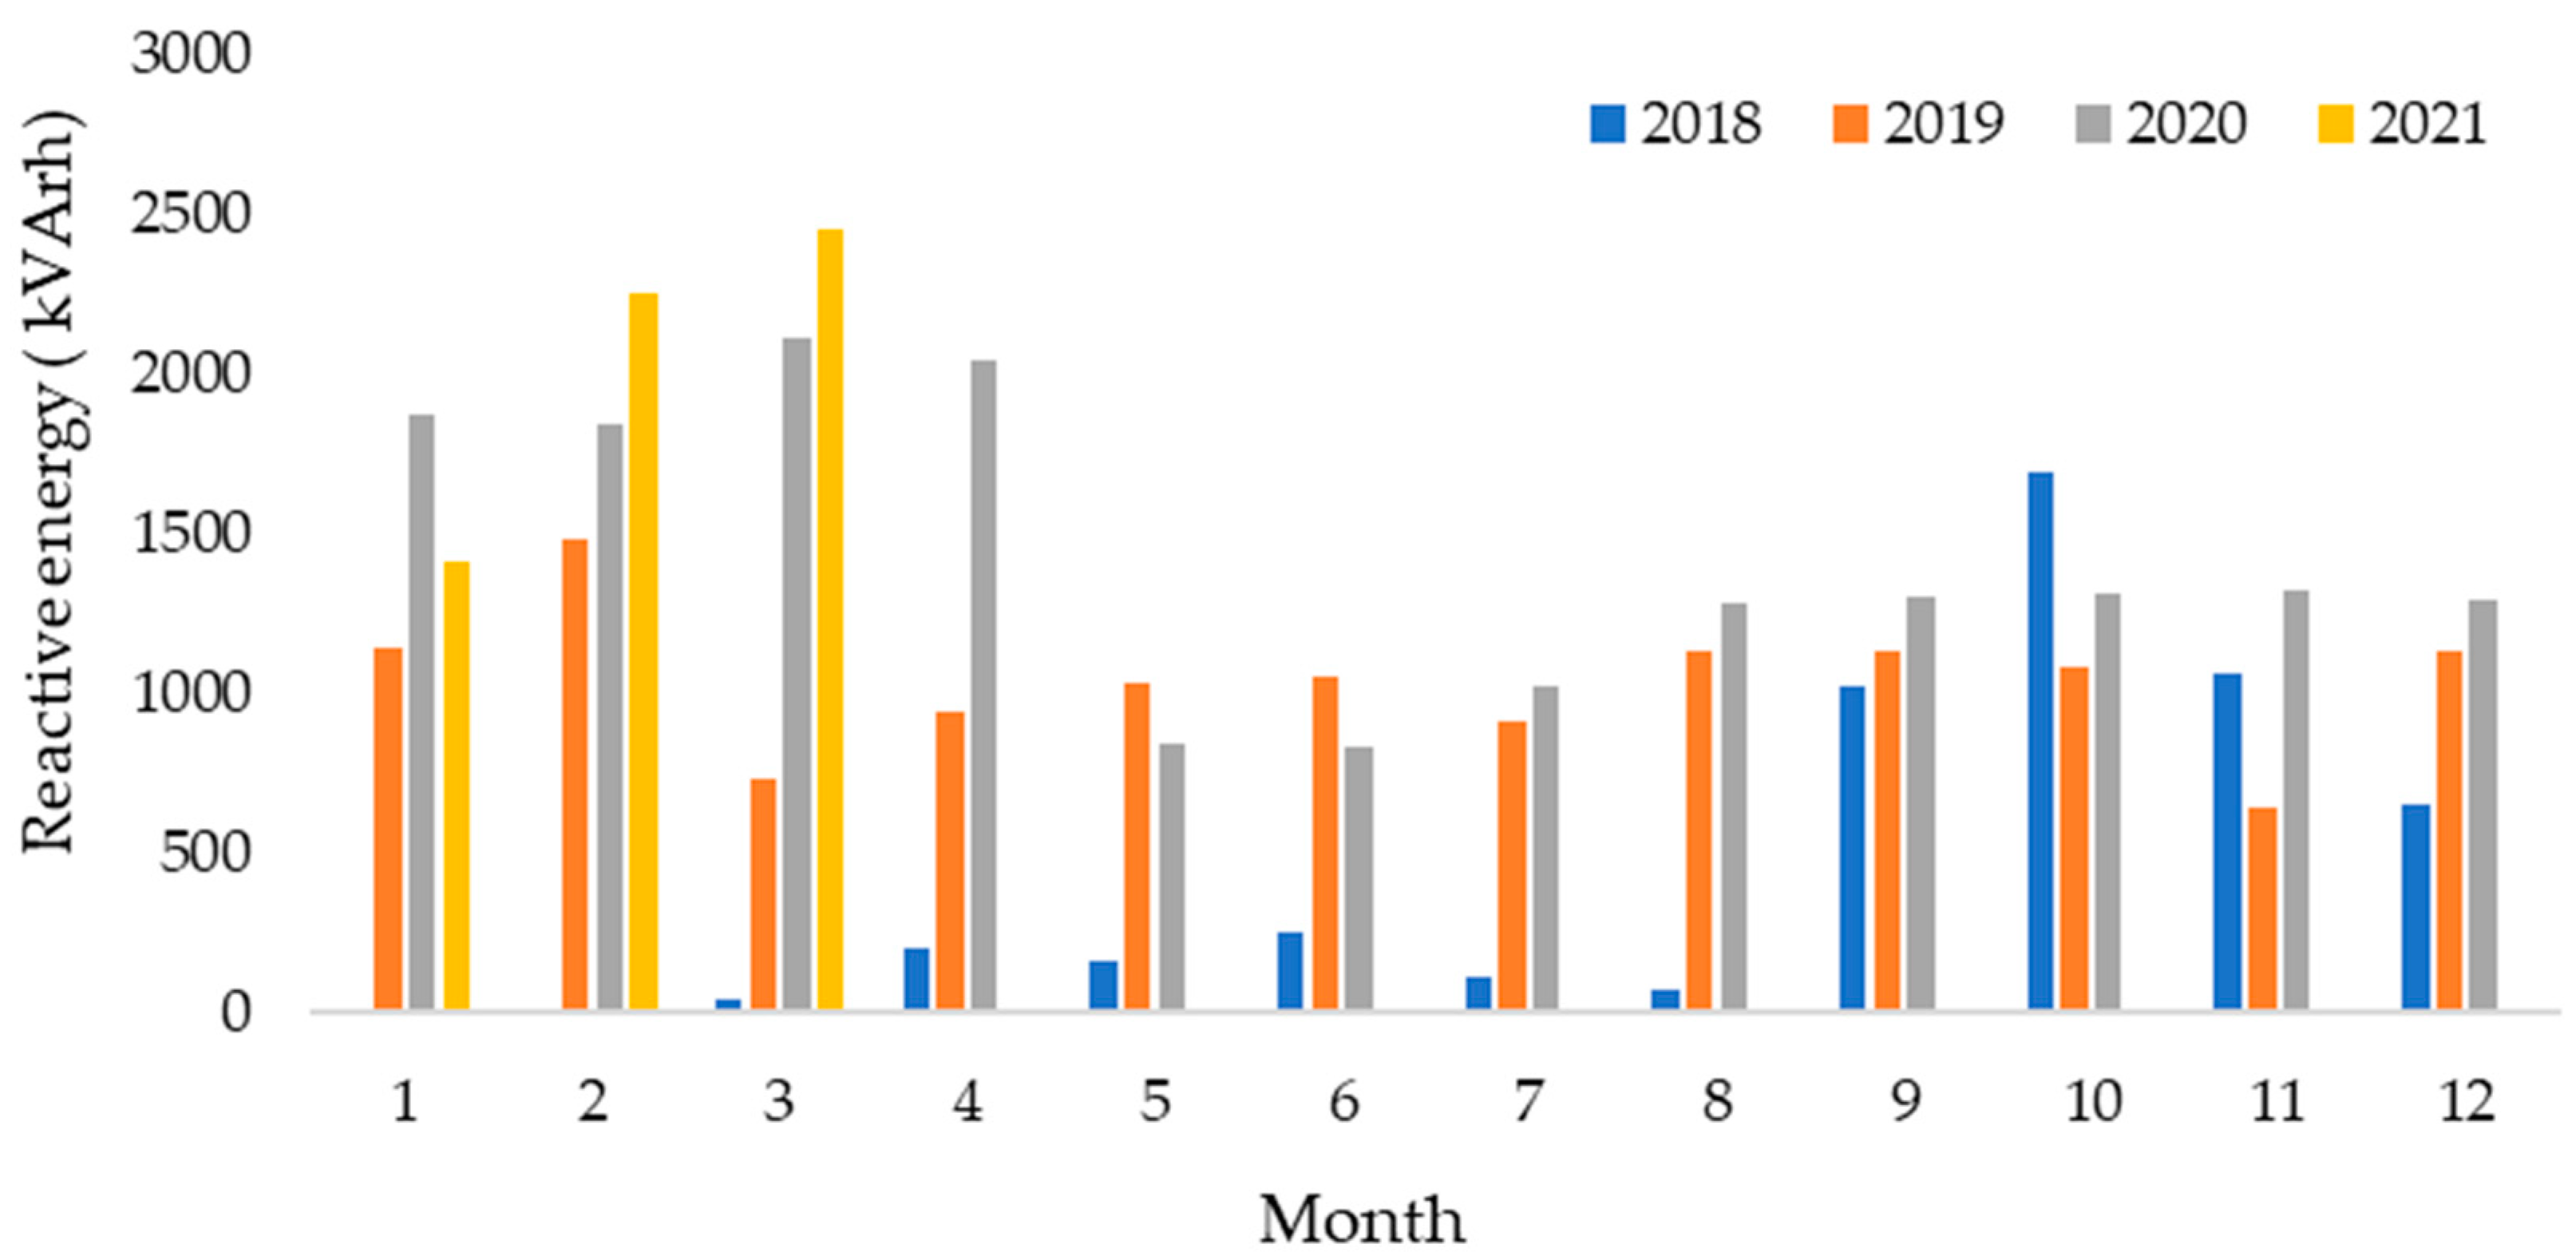
It is important to highlight that from March 2018 to March 2021, the data associated with the reactive energy consumed in the Messias SS were analyzed, and the results are displayed in
Figure 4. The noticeable growth in consumption from January to April of each year is evident, reaching a maximum of 2453 kVArh in March 2021. When compared to active energy consumption, this value does not raise major concerns.
2.2.2. Global Horizontal Irradiance—GHI
The Homer software requires the GHI (Global Horizontal Irradiance) to be entered as input data. For this, the solar irradiance data from CRESESB (Center for Solar and Wind Energy Reference Sergio de S Brito) were considered based on the geographical location of the city of Messias, AL. The data used are presented in
Table 6 [
19].
2.2.3. Diesel Generation
The following data were considered:
CAPEX (Capital Expenditure): BRL 1000.00/kW (ref. [
20]) + 20% for the automatic transfer switch, totaling approximately BRL 1200.00/kW.
Emergency DG: BRL 116,000.00 (power factor of 0.8).
Main Source DG: BRL 609,600.00 (power factor of 0.8).
Diesel Fuel Cost: BRL 5.50/liter (average value found in the National Agency of Petroleum, Natural Gas and Biofuels dynamic panel for the state of Alagoas [
21]).
O&M: 6% per year of CAPEX, but for the Homer software, it is requested per hour: (i) Emergency DG: BRL 1.47/hour; (ii) Main Source DG: BRL 4.18/hour.
Since the viability analysis was performed separately (after the results obtained by the Homer software) and the values presented above consider that the DG acts all hours of the year, the viability analysis is better calculated by adding a complementary fixed O&M so that the annual O&M results in the following:
2.2.4. BESS
In the viability analysis, after 10 years, there will be an additional cost equivalent to 50% of the current BESS solution. This value was considered because the trend expects BESSs to become increasingly affordable, with lower prices. Furthermore, not all the system components need to be replaced, and those replaced can be recycled, generating revenue.
2.2.5. Grid (Source 1)—Equatorial Alagoas
The energy cost for the customer: Considering an A3 blue-tariff customer served by Equatorial Alagoas, according to Regulatory Resolution No. 3033, dated 26 April 2022, the values of TUSD (Distribution System Usage Tariff) and TE (Energy Tariff) plus taxes are 5% for PIS (Program for Social Integration) and COFINS (Contribution for the Financing of Social Security), and 18% for ICMS (Broad National Consumer Price Index); these are presented in
Table 7.
2.2.6. Photovoltaic System
For the assessments of the PV (Photovoltaic) system values, the following assumptions were considered:
CAPEX: BRL/kW 3800.00 (reference value used in the market and in accordance with Ref. [
22], which has a maximum and minimum value range of BRL/kW 3000 to 5000).
O&M: BRL 50/kW/year [
22].
Lifetime: 25 years.
For the feasibility analysis, based on the market, it was considered that the system degradation is 2% in the first year and 0.5% in the following years.
2.2.7. Financial Parameters
For the financial analysis, the following rates were considered:
Inflation (IPCA): 4% [
23];
Discount rate: 11.03%—It was assumed that 50% of the system was financed (IPCA + 3%) and the remaining 50% was self-funded (pre-fixed treasury of 10 years, 12.43% [
24], +3%).
For the financial analysis, the inflation value mentioned above was used to readjust the energy bill values and the O&M of the systems.
2.3. Simulated Studies
For each of the 5 cases, the following simulations were performed:
Simulation 1: the electrical grid (Equatorial) is working 100%;
Simulation 2: a shortage during the peak hour;
Simulation 3: a shortage for the longest duration the solution can withstand (without failing to supply the load).
3. Results
After sizing the components, simulations were performed using the Homer Pro Version 3.14.5 software for each studied case. The results will be presented below, and subsequently, the analysis will be provided regarding their reliability, financial viability, and environmental impacts.
3.1. Results of Case Simulations
3.1.1. BESS Replacing Main Source
The results obtained in the simulations for Cases 1, 2, and 3 are presented in
Table 8,
Table 9 and
Table 10, respectively. As expected, for the first simulation, in which Equatorial’s power grid had no contingency, the solutions developed were not triggered due to financial issues. In practice, this is not possible due to reliability; although it burdens it, it is necessary to have two sources to maintain the supply of the substation loads served.
Starting from the premise that the solution must be acquired, the second simulation was tested, in which the solution would always come into operation at peak hours. In this way, it would not be unused, only worn out, and would help the supply at the time when the energy coming from Equatorial was pricier. For Case 1, although the rush hour had a higher value, this configuration was still more expensive because Homer considered that it would have to acquire the solution. For Cases 2 and 3, which included the PV system, the network was used less for simulation 1 because the PV system was injected into the network.
Regarding simulation 2, in all cases, the BESS was activated. The highest utilization of the electrical grid occurred in Case 1, where it was not complemented, even if little (since the peak time starts at the end of the day), by the PV system. It is important to emphasize that, for simulations 1 and 2, both Case 2 and Case 3 have the same result, differing only in the financial issue because Case 3 has a reserve BESS that does not need to be triggered in these situations.
Finally, for reliability, it was verified over the most extended period that each solution could support the supply of loads during a possible problem in the Equatorial network. The results were 15 h for Case 1, 20 h for Case 2, and 22 h for Case 3. It is important to note that in Case 3, in the last 2 h, the supply was carried out by the emergency BESS only for the emergency loads.
To enable the financial feasibility analysis, the worst situation found for Case 1 was also simulated for Cases 2 and 3. Since the maximum supply of Case 1 was the smallest of all (15 h), it was possible to simulate the three solutions in the same study to make a fair comparison. That is, the proposed solution would supply the entire period, independent of Equatorial’s network.
Regarding the use of the DG as the main source,
Table 11 presents the simulations similar to those tested for the cases mentioned above, where the cases of 15 h, 20 h, and 24 h were performed for simulation 3 during the days of the week.
As the system depends on Diesel, as long as it does not have any technical problems or lack fuel, all cases of power outage would be met. It is necessary to emphasize that it is important to evaluate the size of the generator tank.
Table 11 presents the minimum tank value the DG must have to meet the contingencies studied.
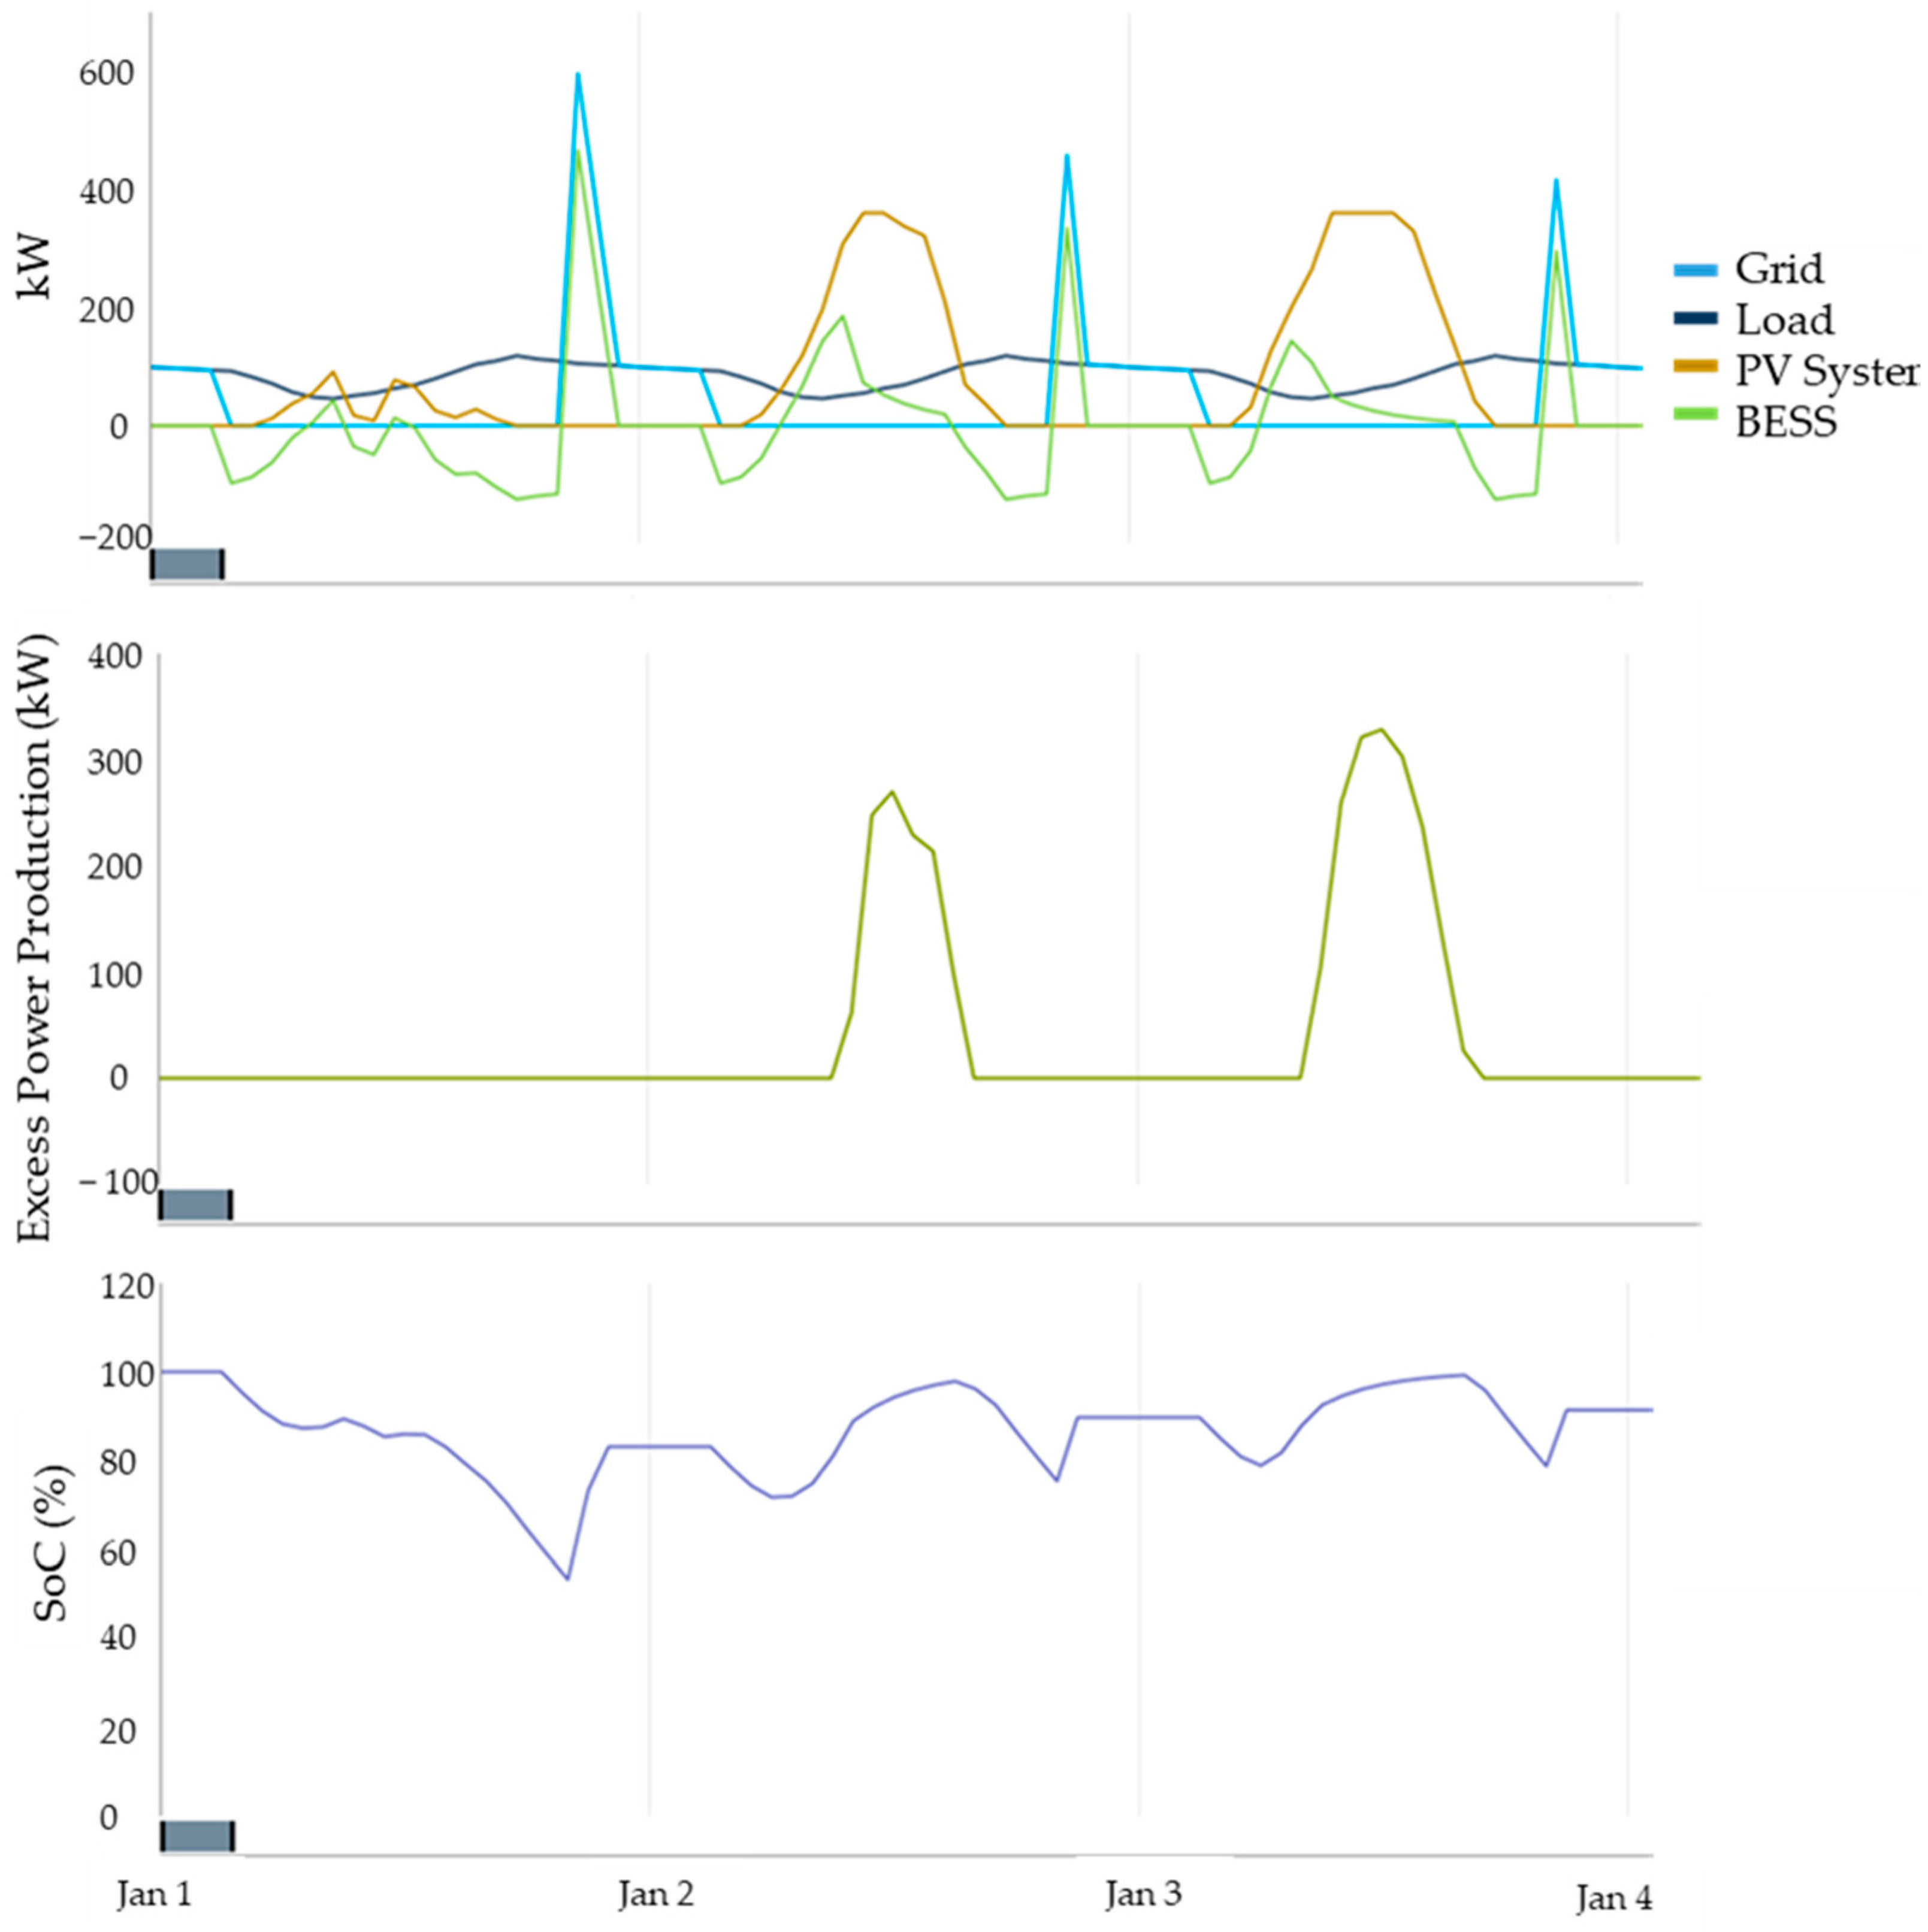
Finally, it is important to highlight that a significant amount of energy was wasted in certain cases: (i) when the solution involved the photovoltaic system and experienced a shortage during the day, and (ii) in cases in which the diesel generator was used. In these situations, the energy was not utilized by the load nor injected into the grid for later compensation purposes.
Figure 5 and
Figure 6 show examples of excess energy from the DG and PV systems, respectively. For the first case, the issue was operational. In the second case, the system operated on an island (without the utility’s grid), the load was lower than the solar generation, and the BESS was completely recharged.
3.1.2. BESS Replacing the Emergency DG
Table 12 and
Table 13 present the simulations of Cases 3 and 4. Again, as expected, the solutions are not used when there is no shortage. For simulation 2, in which the BESS would be used during peak hours, both for the case (i) BESS with PV and case (ii) BESS without PV, it was impossible to supply the entire emergency load during the 3 h. This occurs because this period is when the load is highest.
In relation to the third simulation, some cases were simulated because the load curve varies and, according to the time, there is a shortage; this means that the supply may be greater. Considering the peak hour, for Case 4, it would be possible to supply the demand for 2 h (17 h–19 h without power); meanwhile, for a time with a lower load, it was possible to supply the demand for 6 h, as shown in
Table 12.
For the case using the photovoltaic system (Case 5), two simulations were conducted: a scenario after peak hours, where the photovoltaic system can no longer meet the demand, and (ii) a scenario with a shortage during the day, while there is sunlight. For the first case, the solution lasted 3 h, while for the second, the solution could supply the demand for 8 h.
Analyzing the proposed solutions, Case 5 is more reliable because, depending on the time that there is a shortage, it allows the power source to last longer. It is important to emphasize that, to use the emergency source, the two main sources must be in contingency and that, for the simulation performed, as the curve of essential loads did not exist, a conservative percentage curve for the total auxiliary services (70% of the total curve) was used.
Regarding the emergency DG simulation, as presented in
Table 14, for simulation 3, the case in which there is no supply between 7 h and 13 h, that is, for 6 h, was also performed. In this case, the grid was used less than in Case 4, which was also used to recharge the BESS, and used more than in Case 5, where the PV system primarily recharged the BESS. Finally, the case in which the DG would be needed for 24 h was also analyzed to understand the tank size that would meet this situation, resulting in a 550 L compartment.
3.2. Financial Feasibility Analysis
The financial analysis was performed by comparing the same simulations for the cases studied. This way, what occurs besides the contingency period will not be considered since, theoretically, and it will also be supplied by the local utility.
In the cases in which the main source was the object of study, the simulation of the peak period and the simulation of the longest contingency period were selected for the case that was the least able to supply, that is, the period of 15 h without supply during the weekdays from 5 h to 20 h, because these cases were able to be performed by all cases.
As for emergency use, two analyses were performed, one for the peak time simulation and another for the simulation in which the supply would be performed for 6 h, from 7 h to 13 h. This was performed because, for the peak case, the solution could not supply the entire hour, so it would not be an equal comparison between them and the DG, which supplied the demand for 3 h.
In the analysis, the premises used were as follows:
No PV system, only a BESS: the cost of the network to recharge the BESS was considered (considering the system’s losses).
With the PV system: it was considered that the PV system would always recharge the BESS and that the rest of the solar energy would be revenue since the load would no longer be supplied by the grid both during the period that the solar generation is greater than or equal to the load and by the electric energy compensation system. Thus, when compared to the cases in which the grid will supply the demand (cost), this value becomes revenue;
For the proposed solutions, the costs are the CAPEX, the O&M of the BESS and PV system, when it exists, and the replacement of the BESS.
For the DG, the costs are CAPEX, O&M, and diesel.
The revenue only exists for cases in which there is a PV system.
The period of the analyses is 20 years;
The
NPV (Net Present Value) was calculated using Equation (2).
where
CF = Cash Flow.
MARR = Minimum Attractive Rate of Return.
j = Period of each cash flow.
Based on the above assumptions, the results of the NPV are presented in
Table 15 for the main source and
Table 16 for the backup replacement. Analyzing
Table 15, the DG presented itself as a much more viable solution for the case of use during peak hours only. However, when there was a longer contingency period, Case 2 presented itself as a slightly more attractive solution.
Case 2 was the most appropriate among all solutions proposed.
It is important to note that, as reliability is the focus of the solution, the systems were sized quite conservatively, which makes their cost higher than if the same sizing was performed for a load for which that the absence of its supply did not have as much impact. In addition, in the simulations of the 15 h contingency, the NPV significantly increased, but the substation would no longer pay the supply via concessionaire for that same period. Since this applies to all cases and the analysis is comparative for the same scenarios, considering this point does not affect the study.
As mentioned above, two analyses were performed for the emergency source, one for the peak period and the other for the simulation result involving 6 h of a lack of supply. The results were very similar (
Table 16), with the DG being the most feasible for peak hours and the solution involving the BESS and PV system being the most viable for daytime supply.
In summary, the solution using the BESS and PV best fits cases in which the emergency power source is taken to the limit. On the other hand, for low contingencies, the use of a DG is more feasible. This is due to the high CAPEX of the proposed solutions, while the DG has a low CAPEX; its operation is more expensive because, in addition to the cost of operation and maintenance, there is the fuel cost. In addition, associating a BESS with the PV system increases the solution’s reliability. It generates credits to be used in the energy compensation system and recharges the BESS without consuming more energy from the grid. That is, the photovoltaic system generates revenue and not an operating cost.
3.3. Reliability Analysis
For the reliability analysis, initially, a study was conducted on the continuity of the service offered by Equatorial Alagoas, which is the first main source of energy supply for the Messias Substation. In other words, the greater the lack of supply from this source, the greater the capacity of the solution to supply energy. Subsequently, the data found in the simulations were analyzed.
The closest data available that can be used to understand the lack of supply in the Messias Substation region are the DIC (Duration of Individual Interruption per Consumer Unit), FIC (Frequency of Individual Interruption per Consumer Unit) and DMIC (Maximum Duration of Continuous Interruption per Consumer Unit or Connection Point), referring to the group in which the Messias Substation falls, the Rio Largo Group.
Table 17 presents these monthly indicators for the years 2010 and 2022. Considering that the DMIC is the maximum duration of continuous interruption per consumer unit or connection point, this value is the most important for the study; the maximum value was 7 h in the year 2022.
After analyzing Equatorial Alagoas’ reliability indicators, the simulation results were analyzed and are summarized in
Table 18. Concerning the DG, it is capable of supplying energy during a longer period of absence of supply, depending on the size of its tank. Considering a 24 h period, for example, for the case of the DG acting as the main source, it would be necessary, according to the simulated values, to have a tank larger than 9001, which is a considered value. Conversely, a 5501 diesel tank can meet its load during this period for the emergency DG.
Regarding the response time and added values, the solutions studied, especially the cases involving the photovoltaic system, are more attractive, as shown in
Table 18. It is important to emphasize that the response time is important for the system’s reliability since sensitive loads would be turned off when being supplied via the DG and may take time to return to operation.
As shown in
Table 17, the DMIC for the worst performance year was 7 h, so all the solutions used for the main source meet this value.
In the case of replacing the emergency source, there must be a fault in both sources for it to begin to operate. That is, it is not common for its use to be extensive since, after the failure of Source 1, Source 2 should be able to supply with slack until the local concessionaire begins to operate again. Thus, the values obtained must also meet the needs of the substation.
It is important to emphasize that, as presented in the premises of the sizing of the systems, the load of the Messias SS has reactive energy consumption (
Figure 4), which could be avoided with the implementation of a solution involving a BESS; this is because the PCS (component that works in four quadrants) could provide/absorb the excess reactive energy. This would improve the quality of energy and correct possible power factor non-compliance using Brazilian regulations/standards.
Finally, regarding the aggregate values of each solution, Cases 2, 3, and 5, which include a BESS and the PV system, are the ones that most help the system. This is because, in addition to helping in the matter of energy quality, they also generate credits to be used in the compensation system.
3.4. Environmental Impacts
The analysis of the environmental impacts, considering the BESS, the Photovoltaic System, and the DG, was divided into two topics: (a) manufacturing and recycling; (b) implementation and operation. These are presented, respectively, in
Table 19 and
Table 20.
4. Discussion
A comparative analysis of the solutions proposed to replace the main source and the emergency source was performed, considering the three aspects studied: reliability, financial viability, and environmental impact.
For the main source substitution, based on Equatorial Alagoas’ supply absence parameters for the studied group (Rio Largo), all three solutions perform well. Compared to the DG, the solutions have a shorter response time and can help in other aspects, such as power factor correction, voltage control and reactive control.
Regarding financial viability, as the substation receives energy from Equatorial as its first main source, it will be the one most utilized for the supply. Therefore, the second main source will only be used when the first one goes into contingency or during peak hours, helping to save on the energy bill. For these cases in which the use of the solution lasts a short time, diesel generators (DGs) are the most viable option, but the BESS solution with PV stands out. The PV system generates credits that can be used to reduce costs from the distributor.
Furthermore, if the daily supply was required for a longer time, the solution of Case 2 (BESS plus PV system) would be more financially attractive than the use of a DG.
Considering all the above information, plus the fact that the proposed cases have a lower environmental impact than the diesel generator, the best solution is Case 2: BESS plus PV system.
Two cases were studied for the emergency source. In the first case, there is only one external source (Source 1), and the current internal source (Source 2) is a DG that could potentially be replaced by a BESS plus PV system, for example. The second case involves two power sources, one external from the local distribution company and another internal from the substation itself, or two internal sources from the substation itself (the sources must be provided via the tertiary winding of the transformer or a dedicated transformer for this purpose).
In the first case, since one of the main sources already has a limitation on its operating hours, despite the high cost, it is more reliable when aiming to maintain the emergency DG; this is because, in case of a very unusual blackout, the auxiliary services continue to be supplied for a long time until the diesel in the tank runs out. In the second case, it is unlikely that both main sources will have a joint and long-lasting problem, so the solutions involving a BESS can be used, especially the BESS with a photovoltaic system as it enables a long-lasting and clean energy supply if outages occur during the day. Furthermore, the photovoltaic system will contribute to the power compensation system, indirectly generating revenue.
5. Conclusions
The objective of the study was achieved via the development, simulation, and analysis of three solutions proposed to replace the main source and two solutions proposed to replace the emergency source of auxiliary alternating current systems in high-voltage substations. The conclusions for the replacement of each source will be described below.
For the main source, when conducting reliability, financial, and environmental analyses, the most viable solution is the use of an energy storage system alongside the photovoltaic system. This solution was able to supply the load for a long time (20 h), has a shorter response time (ms), can improve the quality of the supplied energy, and has a lower environmental impact compared to diesel generators (DGs), which emit polluting gases. In terms of the NPV, the result was lower than the cases using DGs in scenarios in which a long-term supply was required. However, it is expected that the most common scenario is the provision of energy only during peak hours, which makes it more financially viable to continue using DGs. It is important to emphasize that, despite the investment value being important, the parameter of reliability takes precedence. A low-reliability system can cause impacts with much greater losses.
For the second case, with regard to the emergency source, although the solution involving the use of the energy storage system with the photovoltaic system is competitive, if the power outage occurs during the night, this solution would not be able to supply the load for more than 3 h (off-peak) or more than 2 h (during peak hours). Therefore, it is recommended that diesel generators are maintained as the emergency source if the second main source is an energy storage system, or DGs. However, if the second main source is a system completely independent from the first source, the solution involving the use of the energy storage system with the photovoltaic system becomes interesting, as there is a considerable probability that one of the two sources is restored quickly. Additionally, the BESS solution has the benefit of a faster response time, avoiding interruptions in the power supply to the loads when the outage occurs and preventing unnecessary environmental pollution.
As a suggestion for future work, we propose conducting laboratory simulations on a smaller scale for the studied cases. Specifically, for the cases involving a photovoltaic system, a comparative analysis should be performed to evaluate the feasibility of directly coupling the system to the DC side of the Power Conversion System (PCS). Additionally, a more detailed study should be conducted in order to explore the potential improvements that BESS solutions could bring to ancillary services in substations and the power system. Lastly, the solution should be applied to high-voltage substations that are unable to comply with the current ONS Network Procedure.
Author Contributions
Conceptualization, M.d.M.C., T.C., A.C.P., E.B.J., J.B.d.M.F., E.B., M.A.M., A.I. and M.H.N.M.; Methodology, M.d.M.C., T.C., A.C.P., E.B.J., J.B.d.M.F., E.B., M.A.M., A.I. and M.H.N.M.; Software, M.d.M.C., T.C., A.C.P., E.B.J., M.A.M., A.I. and M.H.N.M.; Validation, M.d.M.C., J.B.d.M.F., E.B., M.A.M. and M.H.N.M.; Formal analysis, M.d.M.C., A.C.P., E.B.J., E.B., M.A.M., A.I. and M.H.N.M.; Resources, M.d.M.C.; Data curation, M.d.M.C. and M.H.N.M.; Writing–original draft, M.d.M.C., T.C., A.C.P., E.B.J., J.B.d.M.F., E.B., M.A.M., A.I. and M.H.N.M.; Writing–review & editing, M.d.M.C., T.C., A.C.P., E.B.J., J.B.d.M.F., E.B., M.A.M., A.I. and M.H.N.M.; Visualization, M.A.M.; Supervision, M.A.M., A.I. and M.H.N.M. All authors have read and agreed to the published version of the manuscript.
Funding
This research was funded by the Program of R&D of the Brazilian Electricity Regulatory Agency (ANEEL) and Companhia Hidro Elétrica do São Francisco—Eletrobras Chesf. This work is related to Project PD-0048-1320/2020 “Photovoltaic mini generation with Battery Energy Storage as an Autonomous Source of Supply of Auxiliary Systems of 230/500 kV Substations with Internal Source Constraints”.
Data Availability Statement
Not applicable.
Acknowledgments
The authors acknowledge the financial support given by the National Electric Energy Agency—ANEEL through Eletrobras—Chesf to execute the Research and Development Project entitled “Technical arrangement to increase reliability and electrical safety by applying energy storage by batteries and photovoltaic systems to the auxiliary service of 230/500 kV substations” under project number PD-0048-1320/2020, which belongs to the Public Call—R&D + I number 02/2019 of the Eletrobras—Chesf; the study was executed by the Edson Mororó Moura Technology Institute—ITEMM, the University of Pernambuco—UPE and Fundação Parque Tecnológico Itaipu—PTI. The authors also thank the Brazilian agencies Coordination for the Improvement of Higher Education Personnel (CAPES)—Financing Code 001, and the Brazilian National Council for Scientific and Technological Development (CNPq), process number 310862/2022-1.
Conflicts of Interest
The authors declare no conflict of interest.
Abbreviations
The following abbreviations are used in this manuscript:
| AC | Alternating Current |
| ANEEL | Brazilian electricity regulatory agency |
| BESS | Battery Energy Storage System |
| BMS | Battery Management System |
| CAPES | Brazilian Agencies Coordination for the Improvement of Higher Education Personnel |
| CAPEX | Capital Expenditure |
| CCEE | Chamber of Electric Energy Commercialization |
| CCTV | Closed-Circuit Television |
| CF | Cash Flow |
| CHESF | São Francisco Hydroelectric Company |
| CMSE | Electric Sector Monitoring Committee |
| CNPE | National Council of Energy Policy |
| CNPq | Brazilian National Council for Scientific and Techno-logical Development |
| COFINS | Contribution for the Financing of Social Security |
| CRESESB | Center for Solar and Wind Energy Reference Sergio de S Brito |
| DIC | Duration of Individual Interruption per Consumer Unit |
| DC | Direct Current |
| DG | Diesel Generator |
| DMIC | The maximum duration of continuous interruption per consumer unit or connection point |
| DoD | Depth of Discharge |
| EMS | Energy Management System |
| EPE | Brazilian Energy Research Office |
| FE 25 | Pentafluoroethane |
| FIC | Frequency of individual interruption per consumer unit |
| FME 200 | Heptafluoropropane |
| GHI | Global Horizontal Irradiance |
| HOMER | Hybrid optmization of multiple energy resources |
| HVAC | Heating, Ventilating, and Air Conditioning |
| ICMS | Broad National Consumer Price Index |
| ITEMM | Edson Mororó Moura Institute of Technology |
| MARR | Minimum Attractive Rate of Return |
| MME | Ministry of Mines and Energy |
| NPV | Net Present Value |
| PbC | Lead–carbon |
| PCS | Power conversion system |
| PF | Power Factor |
| O&M | Operations and Maintenance |
| ONS | Brazilian Electrical System Operator |
| OPEX | Operational Expenditure |
| PIS | Program for Social Integration |
| PPGES | PostGrad Program in Systems Engineering |
| PRODIST | Electric Power Distribution Procedures in the National Eletric System |
| PV | Photovoltaic |
| R&D | Research and Development |
| SS | Substation |
| TE | Energy Tariff |
| TUSD | Distribution System Usage Tariff |
| UPE | University of Pernambuco |
| UPS | Uninterruptible Power Supply |
References
- Meireles, T.; WWF. Available online: https://www.wwf.org.br/?77471/Acordo-de-Paris-completa-cinco-anos-com-licoes-aprendidas (accessed on 1 March 2022).
- Brazilian Electricity Regulatory Agency (ANEEL). Resolução Normativa ANEEL nº 67. 2004. Available online: https://www.legisweb.com.br/legislaI cofncao/?id=101119 (accessed on 1 March 2022).
- Abraceel. Available online: https://abraceel.com.br/blog/2021/07/instituicoes-do-setor-eletrico/ (accessed on 1 March 2022).
- Brazilian National Electric System Operator (ONS). Chapter 2.6—Minimum Requirements for Substations and Their Equipment. In ONS Network Procedures; ONS: Rio de Janeiro, Brazil, 2022. [Google Scholar]
- de Araujo Silva Júnior, W.; Vasconcelos, A.; Arcanjo, A.C.; Costa, T.; Nascimento, R.; Pereira, A.; Jatobá, E.; Filho, J.B.; Barreto, E.; Dias, R.; et al. Characterization of the Operation of a BESS with a Photovoltaic System as a Regular Source for the Auxiliary Systems of a High-Voltage Substation in Brazil. Energies 2023, 16, 1012. [Google Scholar] [CrossRef]
- Divya, K.C.; Østergaard, J. Battery Energy Storage Technology for Power Systems—An Overview; Elsevier: Amsterdam, The Netherlands, 2009; Volume 79, pp. 511–520. [Google Scholar] [CrossRef]
- Miller, N.W.; Zrebiec, R.S.; Delmerico, R.W.; Hunt, G. Battery energy storage systems for electric utility, industrial and commercial applications. In Proceedings of the 11th Annual Battery Conference on Applications and Advances, Long Beach, CA, USA, 9 January 1996; pp. 235–240. [Google Scholar] [CrossRef]
- Nascimento, R.; Ramos, F.; Pinheiro, A.; Junior, W.D.A.S.; Arcanjo, A.M.C.; Filho, R.F.D.; Mohamed, M.A.; Marinho, M.H.N. Case Study of Backup Application with Energy Storage in Microgrids. Energies 2022, 15, 9514. [Google Scholar] [CrossRef]
- Lawder, M.T.; Suthar, B.; Northrop, P.W.C.; De, S.; Hoff, C.M.; Leitermann, O.; Crow, M.L.; Santhanagopalan, S.; Subramanian, V.R. Battery Energy Storage System (BESS) and Battery Management System (BMS) for Grid-Scale Applications. Proc. IEEE 2014, 102, 1014–1030. [Google Scholar] [CrossRef]
- Beardsall, J.C.; Gould, C.A.; Al-Tai, M. Energy storage systems: A review of the technology and its application in power systems. In Proceedings of the 50th International Universities Power Engineering Conference (UPEC), Stoke on Trent, UK, 1 September 2015; pp. 1–6. [Google Scholar] [CrossRef]
- Asian Development Bank. Handbook On Battery Energy Storage System; Asian Development Bank: Mandaluyong, Philippines, 2018. [Google Scholar]
- Pontes, L.; Costa, T.; Souza, A.; Dantas, N.; Vasconcelos, A.; Rissi, G.; Dias, R.; Mohamed, M.A.; Siano, P.; Marinho, M. Operational Data Analysis of a Battery Energy Storage System to Support Wind Energy Generation. Energies 2023, 16, 1468. [Google Scholar] [CrossRef]
- Barra, P.H.A.; de Carvalho, W.C.; Menezes, T.S.; Fernandes, R.A.S.; Coury, D.V. A review on wind power smoothing using high-power energy storage systems. Renew. Sustain. Energy Rev. 2021, 137, 110455. [Google Scholar] [CrossRef]
- Haines, G. Power Factor Control with a Battery Energy Storage System (BESS); University of Adelaide: Adelaide, Australia, 2018. [Google Scholar]
- Ramos, F.; Pinheiro, A.; Nascimento, R.; de Araujo Silva Junior, W.; Mohamed, M.A.; Annuk, A.; Marinho, M.H.N. Development of Operation Strategy for Battery Energy Storage System into Hybrid AC Microgrids. Sustainability 2022, 14, 13765. [Google Scholar] [CrossRef]
- CHESF. Commissioning and Automation Department—DETA. Calculation Memory for sizing the transformers 13800/480V, 440/380V, 440/220V, and the motor-generator group 440V for the auxiliary alternating current services MC-PB-DETA-SE_MSI-2019_05, Recife, Brazil, 2019.
- Costa, T.S. Development of a Hybrid Battery energy Storage System (HBESS) for Powering Auxiliary Services in a High Voltage Substation. Ph.D. Thesis, UNICAMP Campinas State University, Campinas, Brazil, 2022. [Google Scholar]
- Costa, T.; Arcanjo, A.; Vasconcelos, A.; Silva, W.; Azevedo, C.; Pereira, A.; Jatobá, E.; Bione, J.F.; Barreto, E.; Villalva, M.G.; et al. Development of a Method for Sizing a Hybrid Battery Energy Storage System for Application in AC Microgrid. Energies 2023, 16, 1175. [Google Scholar] [CrossRef]
- Center for Solar and Wind Energy Reference Sergio de S Brito. Solar Potential—SunData v 3.0. Available online: http://www.cresesb.cepel.br/index.php#data (accessed on 7 March 2023).
- Brazilian Energy Research Office (EPE). Studies of the 2032 Ten-Year Energy Expansion Plan; EPE’: Rio de Janeiro, Brazil, 2022.
- ANP. Dynamic Panel—Resale Prices and Fuel Distribution. Available online: https://app.powerbi.com/view?r=eyJrIjoiMGM0NDhhMTUtMjQwZi00N2RlLTk1M2UtYjkxZTlkNzM1YzE5IiwidCI6IjQ0OTlmNGZmLTI0YTYtNGI0Mi1iN2VmLTEyNGFmY2FkYzkxMyJ9 (accessed on 26 March 2023).
- Brazilian Energy Research Office (EPE). Cost Parameters—Generation and Transmission, Studies of the 2030 Ten-Year Energy Expansion Plan; EPE’: Rio de Janeiro, Brazil, 2021.
- Central Bank of Brazil. FOCUS Market Report; Brazil, 2023.
- Tesouro Direto. Available online: https://www.tesourodireto.com.br/titulos/precos-e-taxas.htm (accessed on 12 April 2023).
- Brazilian Electricity Regulatory Agency (ANEEL). Continuity Indicators Panel. Available online: https://portalrelatorios.aneel.gov.br/hubDistribuicao/reportIndicadoresContinuidade (accessed on 14 May 2023).
- Liu, J.; Hu, C.; Kimber, A.; Wang, Z. Uses, Cost-Benefit Analysis, and Markets of Energy Storage Systems for Electric Grid Applications. J. Energy Storage 2020, 32, 101731. [Google Scholar] [CrossRef]
- Cashman. Transient Response. Available online: https://www.cashmanequipment.com/wp-content/uploads/2021/05/transient-response.pdf (accessed on 1 June 2023).
- Diesel Technology Forum. Geração de Energia. Available online: https://dieselforum.org/power-generation (accessed on 1 May 2023).
- Duthie Power Service. Available online: https://duthiepower.com/power-outage-how-long-it-takes-for-a-generator-to-start/ (accessed on 1 May 2023).
- Sechilariu, F.L.M. Backup Power Resources for Microgrid. Urban DC Microgrid; Elsevier: Amsterdam, The Netherlands, 2016; p. 118. [Google Scholar]
- Merlin, V.L. Associate Engineers. Available online: https://www.engenheirosassociados.com.br/grupos-geradores-diesel-eletricos-estacionarios/ (accessed on 21 February 2023).
- Andrade, Á.A.X.D.; Soares, E.M.B.; Cunha, D.A.D.; Oliveira, M.L.R.D. Risks and uncertainties: The post-extraction reality of lead ore in Boquira, BA. Interactions 2017, 18, 103–117. [Google Scholar] [CrossRef]
- Reciclagsampa. Available online: https://www.reciclasampa.com.br/artigo/99-do-chumbo-utilizado-nas-baterias-pode-ser-reciclado (accessed on 28 May 2023).
- Moura Batteries. Available online: https://www.moura.com.br/blog/10-coisas-que-voce-precisa-saber-sobre-como-moura-reaproveita-as-suas-baterias/ (accessed on 28 May 2023).
- Hidalgo-León, R.; Siguenza, D.; Sanchez, C.; León, J.; Jácome-Ruiz, P.; Wu, J.; Ortiz, D. A survey of battery energy storage system (BESS), applications and environmental impacts in power systems. In Proceedings of the IEEE Second Ecuador Technical Chapters Meeting (ETCM), Salinas, Ecuador, 16 October 2017; pp. 1–6. [Google Scholar] [CrossRef]
- EPRI. Recycling and Disposal of Battery-Based Grid Energy Storage Systems: A Preliminary Investigation; Electric Power Research Institute: Palo Alto, CA, USA, 2017; p. 3002006911. [Google Scholar]
- Materioteca UFSC. Available online: https://materioteca.paginas.ufsc.br/aco/ (accessed on 13 May 2023).
- Blue Solar Energia. Available online: https://blog.bluesol.com.br/energia-solar-impactos-ambientais/ (accessed on 4 March 2023).
- Benton, K. A Life Cycle Assessment of a Diesel Generator Set. Ph.D. Thesis, Montana Tech of The University of Montana, Butte, MT, USA, 2019. [Google Scholar]
- FM Generator. Available online: https://www.fmgenerator.com/blog/fm-generator-leading-the-way-on-industry-recycling (accessed on 2 June 2023).
- Tsoutsos, T.; Frantzeskaki, N.; Gekas, V. Environmental impacts from the solar energy technologies. Energy Policy 2005, 33, 289–296. [Google Scholar] [CrossRef]
- Portal Solar. Available online: https://www.portalsolar.com.br/vantagens-e-desvantagens-da-energia-solar.html (accessed on 5 March 2023).
- Kurek, R. Diagnóstico do uso de Grupos Geradores; UNAERP: Ribeirão Preto, Brazil, 2018. [Google Scholar]
Figure 1.
Supply of auxiliary services for substations of the basic network.
Figure 1.
Supply of auxiliary services for substations of the basic network.
Figure 2.
Flowchart illustrating the methodology employed in the case studies.
Figure 2.
Flowchart illustrating the methodology employed in the case studies.
Figure 3.
Load curve of auxiliary services at the Messias Substation.
Figure 3.
Load curve of auxiliary services at the Messias Substation.
Figure 4.
Reactive energy consumed by the Messias SS between 2018 and March 2021.
Figure 4.
Reactive energy consumed by the Messias SS between 2018 and March 2021.
Figure 5.
Example of DG energy surplus.
Figure 5.
Example of DG energy surplus.
Figure 6.
Example of excess generation of the PV system.
Figure 6.
Example of excess generation of the PV system.
Table 1.
Load estimation according to its usage.
Table 1.
Load estimation according to its usage.
| Essential Loads (kVA) | Non-Essential Loads (kVA) | Total (kVA) |
|---|
| P | I | E | P | I | E | P | I | E |
|---|
| 30.08 | 136.83 | 1.08 | 221.02 | 98.5 | 26.24 | 251.1 | 235.33 | 27.32 |
| 167.99 | 345.76 | 513.75 |
Table 2.
Demand factor according to the load type.
Table 2.
Demand factor according to the load type.
| | Essential Loads | Non-Essential Loads | Demand Factor |
|---|
| Permanent | 30.08 | 221.02 | 1 |
| Intermittent | 136.83 | 98.5 | 0.5 |
| Eventual | 1.08 | 26.24 | 0.2 |
Table 3.
Loss estimated for the battery bank [
17].
Table 3.
Loss estimated for the battery bank [
17].
| Conversion | Self-Discharge | Others | Depth of Discharge—DoD |
|---|
| 5% | 5% per month (0.166% per day) | 10% | 80% |
Table 4.
Sizing of Battery Energy Storage Systems.
Table 4.
Sizing of Battery Energy Storage Systems.
| Component | Backup BESS | Main-Source BESS |
|---|
| PCS (kVA) | 200 | 520 |
| Battery bank (kWh) | 440 | 2210 |
Table 5.
Sizing of PV System.
Table 5.
Sizing of PV System.
| Component | Backup PV System | Main-Source PV System |
|---|
| Hybrid inverter (kW) | 140 | 360 |
| Photovoltaic modules (kWp) | 182 | 468 |
Table 6.
GHI used in the simulation [kWh/m2·day].
Table 6.
GHI used in the simulation [kWh/m2·day].
| January | February | March | April | May | June | July | August | September | October | November | December |
|---|
| 5.87 | 5.83 | 5.84 | 5.06 | 4.23 | 3.9 | 4 | 4.57 | 5.39 | 5.67 | 6.16 | 6.11 |
Table 7.
The values of the tariffs considering PIS/COFINS and ICMS.
Table 7.
The values of the tariffs considering PIS/COFINS and ICMS.
| | TUSD | TE |
|---|
| | BRL/kW | BRL/kWh | BRL/kWh |
|---|
| Peak hours | 38.94737 | 0.097869 | 0.544159 |
| Off-peak hours | 20.97561 | 0.097869 | 0.348062 |
Table 8.
Case 1 Simulations: BESS (main source).
Table 8.
Case 1 Simulations: BESS (main source).
| Parameter | Simulation 1 | Simulation 2 | Simulation 3
(5 h to 20 h, 15 h) |
|---|
| Equatorial supply [kWh/year] | 751,904 | 772,285 | 821,902 |
| BESS supply [kWh/year] | 0 | 89,042 | 302,839 |
| Load [kWh/year] | 751,904 | 751,904 | 751,904 |
| Missing energy [kWh/year] | 0 | 0 | 0 |
| Nominal capacity—BESS [kWh] | - | 2212 | 2212 |
| Cost of capital—BESS | - | 8.84 M | 8.84 M |
| Maintenance cost—BESS [BRL/year] | - | 66,300 | 66,300 |
| Hours in operation—BESS | - | 783 | 3915 |
| Life expectancy—BESS [Years] | - | 10 | 5.26 |
| Autonomy—BESS [h] | - | 20.6 | 20.6 |
| Cost of using the network [BRL] | 437,886 | 478,885 | 517,667 |
Table 9.
Case 2 Simulations: BESS (main source) + PV system (main source).
Table 9.
Case 2 Simulations: BESS (main source) + PV system (main source).
| Parameter | Simulation 1 | Simulation 2 | Simulation 3
(5 h to 20 h, 15 h) | Simulation 3
(3 h to 23 h, 20 h) |
|---|
| Equatorial supply [kWh/year] | 510,866 | 428,593 | 428,535 | 418,725 |
| PV supply [kWh/year] | 673,537 | 673,537 | 673,537 | 673,537 |
| BESS supply [kWh/year] | - | 82,273 | 130,676 | 261,912 |
| Load [kWh/year] | 751,904 | 751,904 | 751,904 | 751,313 |
| Energy used for compensation [kWh/year] | 432,499 | 331,491 | 109,932 | 106,893 |
| Nominal capacity—PV [kWp/kW] | 468/360 | 468/360 | 468/360 | 468/360 |
| Hours in operation—PV [h/year] | 4380 | 4380 | 4380 | 4380 |
| Cost of capital—PV [BRL] | 1.78 M | 1.78 M | 1.78 M | 1.78 M |
| Maintenance cost—PV [BRL/year] | 23,400 | 23,400 | 23,400 | 23,400 |
| Annual energy production—PV [kWh/year] | 673,537 | 673,537 | 673,537 | 673,537 |
| Excess energy production—PV [kWh/year] | 3808 | 3808 | 204,495 | 158,069 |
| Nominal capacity—BESS [kWh] | - | 2212 | 2212 | 2212 |
| Cost of capital—BESS | - | 8.84 M | 8.84 M | 8.84 M |
| Maintenance cost—BESS [BRL/year] | - | 66,300 | 66,300 | 66,300 |
| Hours in operation—BESS | - | 786 | 1764 | 3069 |
| Life expectancy—BESS [Years] | - | 10 | 10 | 5.91 |
| Autonomy—BESS [h] | - | 20.6 | 20.6 | 20.6 |
| Cost of using the network [BRL] | 329,073 | 220,921 | 342,921 | 339,534 |
Table 10.
Case 3 simulations: BESS (main source) + PV system (main source) + BESS (emergency).
Table 10.
Case 3 simulations: BESS (main source) + PV system (main source) + BESS (emergency).
| Parameter | Simulation 1 | Simulation 2 | Simulation 3
(5 h to 20 h, 15 h) | Simulation 3
(3 h to 1 h, 22 h) |
|---|
| Equatorial supply [kWh/year] | 510,866 | 428,593 | 428,535 | 404,206 |
| PV supply [kWh/year] | 673,537 | 673,537 | 673,537 | 673,537 |
| BESS supply [kWh/year] | - | 82,273 | 130,676 | 301,980 |
| Load [kWh/year] | 751,904 | 751,904 | 751,904 | - |
| Energy used for compensation [kWh/year] | 432,499 | 331,491 | 109,932 | 109,970 |
| Nominal capacity—PV [kWp/kW] | 468/360 | 468/360 | 468/360 | 468/360 |
| Hours in operation—PV [h/year] | 4380 | 4380 | 4380 | 4380 |
| Cost of capital—PV [BRL] | 1.78 M | 1.78 M | 1.78 M | 1.78 M |
| Maintenance cost—PV [BRL/year] | 23,400 | 23,400 | 23,400 | 23,400 |
| Annual energy production—PV [kWh/year] | 673,537 | 673,537 | 673,537 | 673,537 |
| Excess energy production—PV [kWh/year] | 3808 | 3808 | 3808 | 150,098 |
| Nominal capacity—BESS [kWh] | - | 2212|440 | 2212|440 | 2212|440 |
| Cost of capital—BESS | - | 10.6 M | 10.6 M | 10.6 M |
| Maintenance cost—BESS [BRL/year] | - | 79,500 | 79,500 | 79,500 |
| Hours in operation—BESS | - | 3069|522 | 3069|522 | 3069|522 |
| Life expectancy—BESS [Years] | - | 6|7.6 | 6|7.6 | 6|7.6 |
| Autonomy—BESS [h] | - | 20.6|5.86 | 20.6|5.86 | 20.6|5.86 |
| Cost of using the network [BRL] | 329,073 | 220,921 | 342,921 | 349,269 |
Table 11.
Simulations with DG main source.
Table 11.
Simulations with DG main source.
| Parameter | Simulation 1 | Simulation 2 | Simulation 3
(5 h to 20 h, 15 h) | Simulation 3
(2 h to 22 h, 20 h) | Simulation 3
(24 h) |
|---|
| Equatorial supply [kWh/year] | 751,904 | 662,862 | 449,065 | 319,209 | 214,241 |
| DG supply [kWh/year] | 0 | 99,441 | 497,205 | 662,940 | 795,528 |
| Load [kWh/year] | 751,904 | 751,904 | 751,904 | 751,904 | 751,904 |
| Excess energy [kWh/year] | 0 | 10,399 | 194,366 | 230,246 | 257,865 |
| Amount of diesel consumed [l/year] | | 29,387 | 146,933 | 195,911 | 235,094 |
| Nominal capacity—DG [kW] | - | 508 | 508 | 508 | 508 |
| Cost of capital—DG [BRL] | - | 609,600 | 609,600 | 609,600 | 609,600 |
| Maintenance cost (considering the hours of use)—DG [BRL/year] | - | 3273 | 16,365 | 21,820 | 26,184 |
| Hours in operation—DG | - | 783 | 3915 | 5220 | 6264 |
| Minimum tank size required [l] | - | 115 | 565 | 765 | 910 |
| Life expectancy—DG [h] | - | 115 | 23 years | 17.2 | 14.4 (years) |
| Cost of using the network [BRL] | 437,886 | 325,389 | 230,050 | 172,144 | 125,335 |
Table 12.
Simulations of Case 4: BESS (emergency).
Table 12.
Simulations of Case 4: BESS (emergency).
| Parameter | Simulation 1 | Simulation 2 | Simulation 3
(17 h to 19 h, 2 h) | Simulation 3
(7 h to 13 h, 6 h) |
|---|
| Equatorial supply [kWh/year] | 526,349 | 535,610 | 535,970 | 539,890 |
| BESS supply [kWh/year] | - | 58,145 | 41,694 | 58,566 |
| Load [kWh/year] | 526,349 | 526,349 | 526,349 | 526,349 |
| Missing energy [kWh/year] | | 4186 | 0 | 0 |
| Nominal capacity—BESS [kWh] | - | 440 | 440 | 440 |
| Cost of capital—BESS | - | 1.76 M | 1.76 M | 1.76 M |
| Maintenance cost—BESS [BRL/year] | - | 13,200 | 13,200 | 13,200 |
| Hours in operation—BESS | - | 783 | 522 | 1566 |
| Life expectancy—BESS [Years] | - | 5.45 | 7.6 | 5.41 |
| Autonomy—BESS [h] | - | 5.86 | 5.86 | 5.86 |
| Cost of using the network [BRL] | 306,530 | 282,786 | 323,948 | 330,352 |
Table 13.
Simulations of Case 5: BESS (emergency).
Table 13.
Simulations of Case 5: BESS (emergency).
| Parameter | Simulation 1 | Simulation 2 | Simulation 3
(7 to 13, 6 h) | Simulation 3—no Sun
(20 h to 23 h, 3 h) | Simulation 3—with Sun
(9 h–17 h, 8 h) |
|---|
| Equatorial supply [kWh/year] | 381,096 | 321,397 | 375,412 | 377,440 | 372,667 |
| PV supply [kWh/year] | 261,931 | 261,931 | 261,931 | 261,931 | 261,931 |
| BESS supply [kWh/year] | - | 49,842 | 5515 | 58,118 | 19,190 |
| Load [kWh/year] | 526,349 | 516,492 | 526,180 | 526,276 | 526,138 |
| Energy used for compensation [kWh/year] | 116,678 | 55,531 | 52,462 | 99,758 | 35,642 |
| Nominal capacity—PV [kWp/kW] | 140/182 | 140/182 | 140/182 | 140/182 | 140/182 |
| Hours in operation—PV [h/year] | 4380 | 4380 | 4380 | 4380 | 4380 |
| Cost of capital—PV [BRL] | 691,600 | 691,600 | 691,600 | 691,600 | 691,600 |
| Maintenance cost—PV [BRL/year] | 9100 | 9100 | 9100 | 9100 | 9100 |
| Annual energy production—PV [kWh/year] | 261,931 | 261,931 | 261,931 | 261,931 | 261,931 |
| Excess energy production—PV [kWh/year] | 1481 | 1481 | 58,901 | 1481 | 69,889 |
| Missing energy [kWh/year] | - | 9857 | 169 | 73 | 211 |
| Nominal capacity—BESS [kWh] | - | 440 | 440 | 440 | 440 |
| Cost of capital—BESS [BRL] | - | 1.76 M | 1.76 M | 1.76 M | 1.76 M |
| Maintenance cost—BESS [BRL/year] | - | 13,200 | 13,200 | 13,200 | 13,200 |
| Hours in operation—BESS | - | 725 | 725 | 783 | 681 |
| Life expectancy—BESS [Years] | - | 6.36 | 10 | 5.46 | 10 |
| Autonomy—BESS [h] | - | 5.86 | 5.86 | 5.86 | 5.86 |
| Cost of using the network [BRL] | 241,241 | 164,181 | 238,706 | 261,305 | 260,336 |
Table 14.
Simulations using the emergency DG.
Table 14.
Simulations using the emergency DG.
| Parameter | Simulation 1 | Simulation 2 | Simulation 3
(7 h–13 h, 6 h) | Simulation 3
(24 h) |
|---|
| Equatorial supply [kWh/year] | 526,349 | 464,018 | 467,784 | 149,974 |
| DG supply [kWh/year] | - | 62,331 | 70,470 | 388,280 |
| Load [kWh/year] | 526,349 | 526,349 | 526,349 | 526,349 |
| Excess energy [kWh/year] | 0 | 0 | 11,904 | 11,904 |
| Amount of diesel consumed [l/year] | - | 20,855 | 29,687 | 142,354 |
| Nominal capacity—DG kW | - | 180 | 180 | 180 |
| Cost of capital—DG [BRL] | - | 116,000 | 116,000 | 116,000 |
| Maintenance cost (considering the hours of use)—DG [BRL/year] | - | 1151 | 2302 | 9208 |
| Hours in operation—DG | - | 783 | 1566 | 6264 |
| Minimum tank size required [l] | - | 80 | 115 | 550 |
| Life expectancy—DG [h] | - | 76 | 38.3 | 9.58 |
| Cost of using the network [BRL] | 306,530 | 227,780 | 280,414 | 87,738 |
Table 15.
NPV analysis for the case of the main source.
Table 15.
NPV analysis for the case of the main source.
| Case | NPV |
|---|
| Case 1—Peak hour | −BRL 10,054,909.19 |
| Case 2—Peak hour | −BRL 8,883,992.55 |
| Case 3—Peak hour | −BRL 10,781,004.29 |
| DG—Peak hour | −BRL 2,666,898.77 |
| Case 1—15 h | −BRL 11,322,922.21 |
| Case 2—15 h | −BRL 9,028,446.88 |
| Case 3—15 h | −BRL 11,014,004.94 |
| DG—15 h | −BRL 9,377,391.35 |
Table 16.
NPV analysis for the case of the emergency source.
Table 16.
NPV analysis for the case of the emergency source.
| Case | NPV |
|---|
| Case 4—Peak hour | −BRL 2,241,638.79 |
| Case 5—Peak hour | −BRL 2,040,872.25 |
| DG—Peak hour | −BRL 1,378,817.50 |
| Case 4 (6 h day) | −BRL 2,239,299.30 |
| Case 5 (6 h day) | −BRL 1,827,492.50 |
| DG (6 h day) | −BRL 1,883,020.71 |
Table 17.
Indicators of the Rio Largo/AL group [
25].
Table 17.
Indicators of the Rio Largo/AL group [
25].
| Year | Group | Monthly DIC (h) | Monthly FIC | DMIC
Monthly (h) |
|---|
| 2022 | RIO LARGO | 10 | 5 | 7 |
| 2021 | RIO LARGO | 5.19 | 3.42 | 2.94 |
| 2020 | RIO LARGO | 5.19 | 3.42 | 2.94 |
| 2019 | RIO LARGO | 5.19 | 3.42 | 2.94 |
| 2018 | RIO LARGO | 5.19 | 3.42 | 2.94 |
| 2017 | RIO LARGO | 5.07 | 3.3 | 2.86 |
| 2016 | RIO LARGO | 5.07 | 3.36 | 2.86 |
| 2015 | RIO LARGO | 5.19 | 3.42 | 2.94 |
| 2014 | RIO LARGO | 5.19 | 3.48 | 2.94 |
| 2013 | RIO LARGO | 5.19 | 3.55 | 2.94 |
| 2012 | RIO LARGO | 5.31 | 3.61 | 303 |
| 2011 | RIO LARGO | 5.31 | 3.67 | 3.03 |
| 2010 | RIO LARGO | 5.91 | 3.92 | 3.46 |
Table 18.
Comparative table of reliability analysis.
Table 18.
Comparative table of reliability analysis.
| Studies | Maximum
Supply Time | Response/
Startup Time | Aggregated Values (Extra Applications) |
|---|
| Case 1 | 15 h | ms [26] | - Demand control (reduce the concessionaire’s contracted demand);
PF correction;
Reactive control;
Energy Time Shift;
Voltage and frequency support; |
| Case 4—day, low load | 15 h |
| Case 4—night, high load | 6 h |
| Case 5—day, low load | 22 h | - Demand control (reduce the concessionaire’s contracted demand);
- PF correction;
- Reactive control;
- Energy Time Shift;
Voltage and frequency support.
Recharge of BESS by PV (independent of the power grid);
Solar power smoothing
Credits for the energy compensation system. |
| Case 5—night, high load | 8 h |
| Case 2 | 20 h |
| Case 3 | 22 h |
| DG | 24 h | 1 s to 20 s [27]
<10 s [28,29,30]
10 s to 30 s [31] | Power quality [28]
Continuous resilience (constant supply of energy, dealing with large oscillations) [28] |
Table 19.
Comparison between manufacturing and recycling for BESS, PV system, and DG.
Table 19.
Comparison between manufacturing and recycling for BESS, PV system, and DG.
| System/Equipment | Description |
|---|
| BESS | The extraction of lead in mines, a heavy metal, if not carried out in compliance with safety regulations, can cause soil contamination and contaminate the groundwater. This contamination can then be absorbed by plants and ultimately enter the food chain, posing a risk to human health [32].
Lead–acid batteries have a well-defined recycling chain and can be recycled nationally and profitably [33,34,35]. The recycling of batteries is the supplier’s responsibility and must follow Conama Resolution 401/2008 and Law 12.305/2010.
The containers and racks holding the batteries are made of steel, which is basically produced from iron ore, coal, and lime. This component is sustainable and ranks among the world’s most recycled and recyclable materials. Both can be reused or recycled as scrap [36,37].
The PCS and the control and communication systems are composed of several electronic components, which have, as raw materials, mainly metals, plastic, and other petroleum-based materials, ceramics, and silicon. These components can be recycled at the end of their life [36].
The firefighting system can be reused in other BESSs if used correctly. At the end of the equipment’s life, the metal tubing can be scrapped, and recycled [36]. |
| PV System | Energy use is high for manufacturing the modules, especially when it comes to poly-crystalline and mono-crystalline modules. Furthermore, a small amount of cadmium is used, which is toxic [38]. Regarding the inverters, they are manufactured similarly to the PCS of the BESS.
The largest portion of the system is made up of glass, polymers, and aluminum, which are recyclable. For the other components, such as silicon, studies are being developed [38]. |
| DG | The raw materials for these components are generally metals (iron, copper, aluminum, steel, nickel, tin, titanium, etc.), electronic materials (Printed Circuit Boards), and epoxy. In this way, it is possible to carry out the separation, processing, and proper recycling of a considerable part of the generator [39,40]. |
Table 20.
Comparison between implementation and operation for BESS, PV system, and DG.
Table 20.
Comparison between implementation and operation for BESS, PV system, and DG.
| System/Equipment | Description |
|---|
| BESS | Implementing this system does not have a significant impact because it occupies little space, without the need to suppress large areas of vegetation.
During the operation of the BESS, there is no emission of pollutant gases, but there may be some noise pollution.
The compounds used for fire suppression in the firefighting system are usually FME 200 (heptafluoropropane) and FE 25 (pentafluoroethane) gases, both of which do not destroy the ozone layer [36]. |
| PV System | During the implementation, according to the size of the system and the topography of the land that will be used, there may be an impact on the visual aspects of the site and the ecosystem. For the studies in this paper, where the system is small and will be installed in an area already affected due to substation construction, there are no significant impacts [41].
During the system’s operation, there is no emission of any polluting gas/liquid or noise pollution [41,42]. For maintenance, some systems use water, but robot solutions already do not use liquids. |
| DG | The installation does not cause major impacts since it affects a small area. However, during operation, there may be issues such as excessive noise, fuel leakage, explosion risks, and the emission of pollutants to the environment and humans [43]. |
| Disclaimer/Publisher’s Note: The statements, opinions and data contained in all publications are solely those of the individual author(s) and contributor(s) and not of MDPI and/or the editor(s). MDPI and/or the editor(s) disclaim responsibility for any injury to people or property resulting from any ideas, methods, instructions or products referred to in the content. |
© 2023 by the authors. Licensee MDPI, Basel, Switzerland. This article is an open access article distributed under the terms and conditions of the Creative Commons Attribution (CC BY) license (https://creativecommons.org/licenses/by/4.0/).


 ,
, 


