Review

An Updated Review of Solar Cooling Systems Driven by Photovoltaic–Thermal Collectors

1
School of Electric Power, South China University of Technology, Guangzhou 510640, China
2
Guangdong Province Key Laboratory of High Efficient and Clean Energy Utilization, South China University of Technology, Guangzhou 510640, China
3
Guangdong Province Engineering Research Center of High Efficient and Low Pollution Energy Conversion, Guangzhou 510640, China
*
Author to whom correspondence should be addressed.
Energies 2023, 16(14), 5331; https://doi.org/10.3390/en16145331
Submission received: 7 June 2023 / Revised: 29 June 2023 / Accepted: 10 July 2023 / Published: 12 July 2023
(This article belongs to the Section J: Thermal Management)

Abstract

:
Solar cooling systems are widely used in the building sector, as they can utilize low-grade solar energy to reduce carbon emissions. To improve the thermodynamic performance and economic performance of solar cooling systems, solar cooling systems driven by photovoltaic–thermal (PVT) collectors have been widely studied. This paper reviews the recent research on the technological improvement of PVT collectors, the development of thermally driven cooling cycles, and the performance of solar cooling systems driven by PVT collectors. Innovative heat sink structures and the utilization of a high-thermal-conductivity coolant are employed to increase the solar-energy-conversion efficiency of PVT collectors. The use of thermal and mechanical two-stage compression and cascade cooling expands the lower temperature limit of the heat source required for the solar cooling cycle. In addition, specific examples of solar cooling systems driven by PVT collectors are reviewed to explore their thermodynamic and economic performance. Finally, the technical developments in and prospects of different types of PVT collectors and solar cooling systems are explored in an attempt to provide some insight to researchers. This study shows that the PVT collector’s electrical and thermal efficiencies can be improved by 0.85–11% and 1.9–22.02%, compared to those of conventional PV systems and PVT systems based on water cooling, respectively. Furthermore, the lower limit of the heat source temperature for the new thermally driven cooling system expands by 4–20 °C. Finally, the performances of solar cooling systems driven by PVT collectors show a minimum payback period of 8.45–9.3 years, which proves favorable economic feasibility.

1. Introduction

With the increase in industrial manufacturing requirements and people’s demands for residential comfort, the energy consumption for refrigeration has reached a new high level. The International Institute of Refrigeration in Paris (IIF/IIR) has reported that refrigeration and air-conditioning processes consume about 15% of the electricity produced globally, while the energy consumption for air-conditioning systems in households and commercial buildings has accounted for up to 45% [1]. However, the main part of electricity consumption is non-renewable energy. It is reported by Our World In Data that 84% of global primary energy comes from fossil fuels [2]. Since these critical issues are caused by the use of fossil fuels, our dependence on them must be reduced.
Using renewable energy to replace fossil fuels is an effective way to reduce carbon emissions and slow down global warming. Among the many renewable energy sources, solar energy has received a lot of attention because of its cleanliness, large availability, and inexhaustible nature. Therefore, the collection, conversion, and utilization of solar energy to drive cooling systems can reduce energy consumption. Solar cooling systems consist of solar energy conversion systems and cooling systems. The most direct way to convert and utilize solar energy is by converting solar radiation into electricity through photovoltaic (PV) cells or by using solar thermal collectors to receive solar radiation to obtain heat. Therefore, the main configurations of solar cooling systems are electrical cooling systems based on PV generation and thermal cooling systems driven by the collected solar radiation. Among the mentioned thermal cooling systems, the most common are absorption cooling systems, adsorption cooling systems, injection cooling systems, and desiccant cooling systems. A common characteristic shared by these systems is the availability of low-grade heat sources, which makes them potentially compatible with the intermittent and inhomogeneous nature of solar radiation. However, solar thermal collectors can only utilize solar radiation to produce thermal energy for domestic hot water and industrial heat applications without electrical output. Meanwhile, in the process of photovoltaic power generation, less than 20% of the solar radiation energy is converted into electricity, while the remaining part is absorbed by PV cells in the form of heat or reflected into the environment [3]. Moreover, the conversion efficiency of PV cells decreases as the operating temperature increases [4]. All of the above options utilize the energy of solar radiation in only one way. Therefore, photovoltaic–thermal (PVT) collectors that can combine electrical and thermal energy output are known as a better choice for driving solar cooling systems.
A PVT collector consists of PV cells and a heat sink module and converts solar radiation into electricity while collecting solar heat through a cooling medium. This feature of the PVT collector significantly increases its efficiency in harnessing solar radiation. Many researchers have investigated different PVT heat sink modules. For example, Singh et al. [5] conducted a simulation study of a PVT system based on a spiral flow absorber. The results show that the electrical efficiency of the PVT system with cooling can be improved by 0.4–0.5% compared to the conventional PV system. Hocine et al. [6] comparatively studied two different types of PVT heat sink modules, and the maximum electrical and thermal efficiencies obtained were 12.7% and 36.32%. As a result, solar cooling systems based on PVT collectors have been widely studied and recognized by the industry and have proven to be an effective way to reduce energy consumption from cooling systems. Beccali et al. [7] investigated the performance of a desiccant cooling system driven by PVT collectors in two application scenarios. The results show that the maximum ratio of primary energy saved by the proposed system is 70–93%. Additionally, economic analysis shows that the proposed system exhibits decent economic benefits for a maximum public investment of 30% and doubled energy prices. Calise et al. [8] proposed a solar CCHP system based on PVT collectors and performed an energy and economic analysis. The economic analysis shows that the studied system has a minimum simple payback period of up to 5.4 years and is eligible for profitability when supported by appropriate policies and is able to deliver electricity to the grid. In addition, flat-plate PVT collectors have lower investment costs and easier maintenance requirements than concentrating PVT collectors or tower receivers due to their simpler structure. Although concentrating PVT collectors and tower receivers can significantly increase the temperature of the produced solar heat up to 1000 °C, the excessive temperature can lead to a sharp decline in the electrical efficiency of PV cells and a loss of performance. While the overall gain of PVT collectors is influenced by PV generation [9], PVT collectors that combine high electrical efficiency and decent solar thermal production capacity are a better choice as the prime mover in a solar cooling system.
In recent years, researchers have pointed out many directions for improving the performance and energy-saving benefits of solar cooling systems. Among them, researchers are interested in enhancing the efficiency of PVT collectors. Since photovoltaic power generation dominates the energy gains of PVT collectors, it is not desirable to sacrifice this gain in favor of attempts to improve the heat transfer performance of PVT collectors. In recent years, PVT collectors have been studied in an attempt to enhance their heat-transfer characteristics while maintaining their electricity generation, such as improving the tube and plate structure of PVT collectors and adding nanoparticles to the coolant to increase the thermal conductivity, while some researchers have combined various measures to maximize the solar energy utilization of PVT collectors. Additionally, there is the issue of the low solar heat temperature produced by PVT collectors, which is below 85 °C under most climatic conditions [10]. Therefore, thermally cooling systems driven by PVT collectors need to be equipped to operate at a low drive temperature [9]. Researchers have improved solar cooling systems driven by PVT collectors by reducing the source temperature required for thermally driven cooling systems via combining thermal and mechanical two-stage compression processes, cascade cooling, etc. As such, the technical improvements made to PVT collectors are introduced in Section 2, the thermally driven cooling systems utilizing low-temperature heat sources proposed by researchers in recent years are introduced in Section 3, and Section 4 will summarize the solar cooling systems driven by PVT collectors, while the primary concerns and challenges are concluded in Section 5. Additionally, recommendations and a future outlook are given in Section 6. Finally, the conclusions of this study are summarized in Section 7.

2. Photovoltaic–Thermal Collectors

PVT collectors serve as windows for collecting solar radiation and provide power as prime movers when combined with thermally driven cooling systems, so improving the efficiency of PVT collectors in utilizing solar radiation is the focus of current research. Studies in recent years have focused on improving the heat transfer characteristics of PVT collectors, including employing innovative heat exchange structures and improving the thermal conductivity of the coolant (e.g., adding nanoparticles to coolant), etc. Most of the improvement effects have been evaluated in terms of energy efficiency.

2.1. Photovoltaic–Thermal Collectors with Innovative Heat Exchange Structure

Researchers have enhanced the heat transfer performance of PVT collectors mainly by improving the shape and arrangement of flow channels, modifying the cross-sectional geometry of flow channels, and adding inserts into the flow channels.
Among all the cross-sectional geometries, the circle is the most conventional and widespread, and researchers have modified the shape of the flow channels to enhance the heat-transfer characteristics of PVT. Boumaaraf et al. [11] carried out numerical simulations and experimental verifications of the PVT system with serpentine tubes in a semi-arid region. The system had been proved to offer an efficient energy supply for individual homes in semi-arid areas. Ma et al. [12] used sheet-and-plain tubes to cool their PVT system, and iron filings were used as the filling material for the insulation. Kazem et al. [13] recommended spiral flow as the flow channel arrangement after comparing three kinds of flow channel shapes (direct flow, spiral flow, and web flow). The specific channel shapes are shown in Figure 1. Since the results show that the PVT system with spiral flow channels had an average PV temperature of 45.2 °C at a mass flow rate of 40 kg/h, which was lower than those of the rest of the flow channel configurations. Meanwhile, Misha et al. [14] designed a new type of dual oscillating tubes for the cooling of PVT systems. All of the above studies generally exhibited about 10% improvement in PV efficiency compared to conventional PV systems.
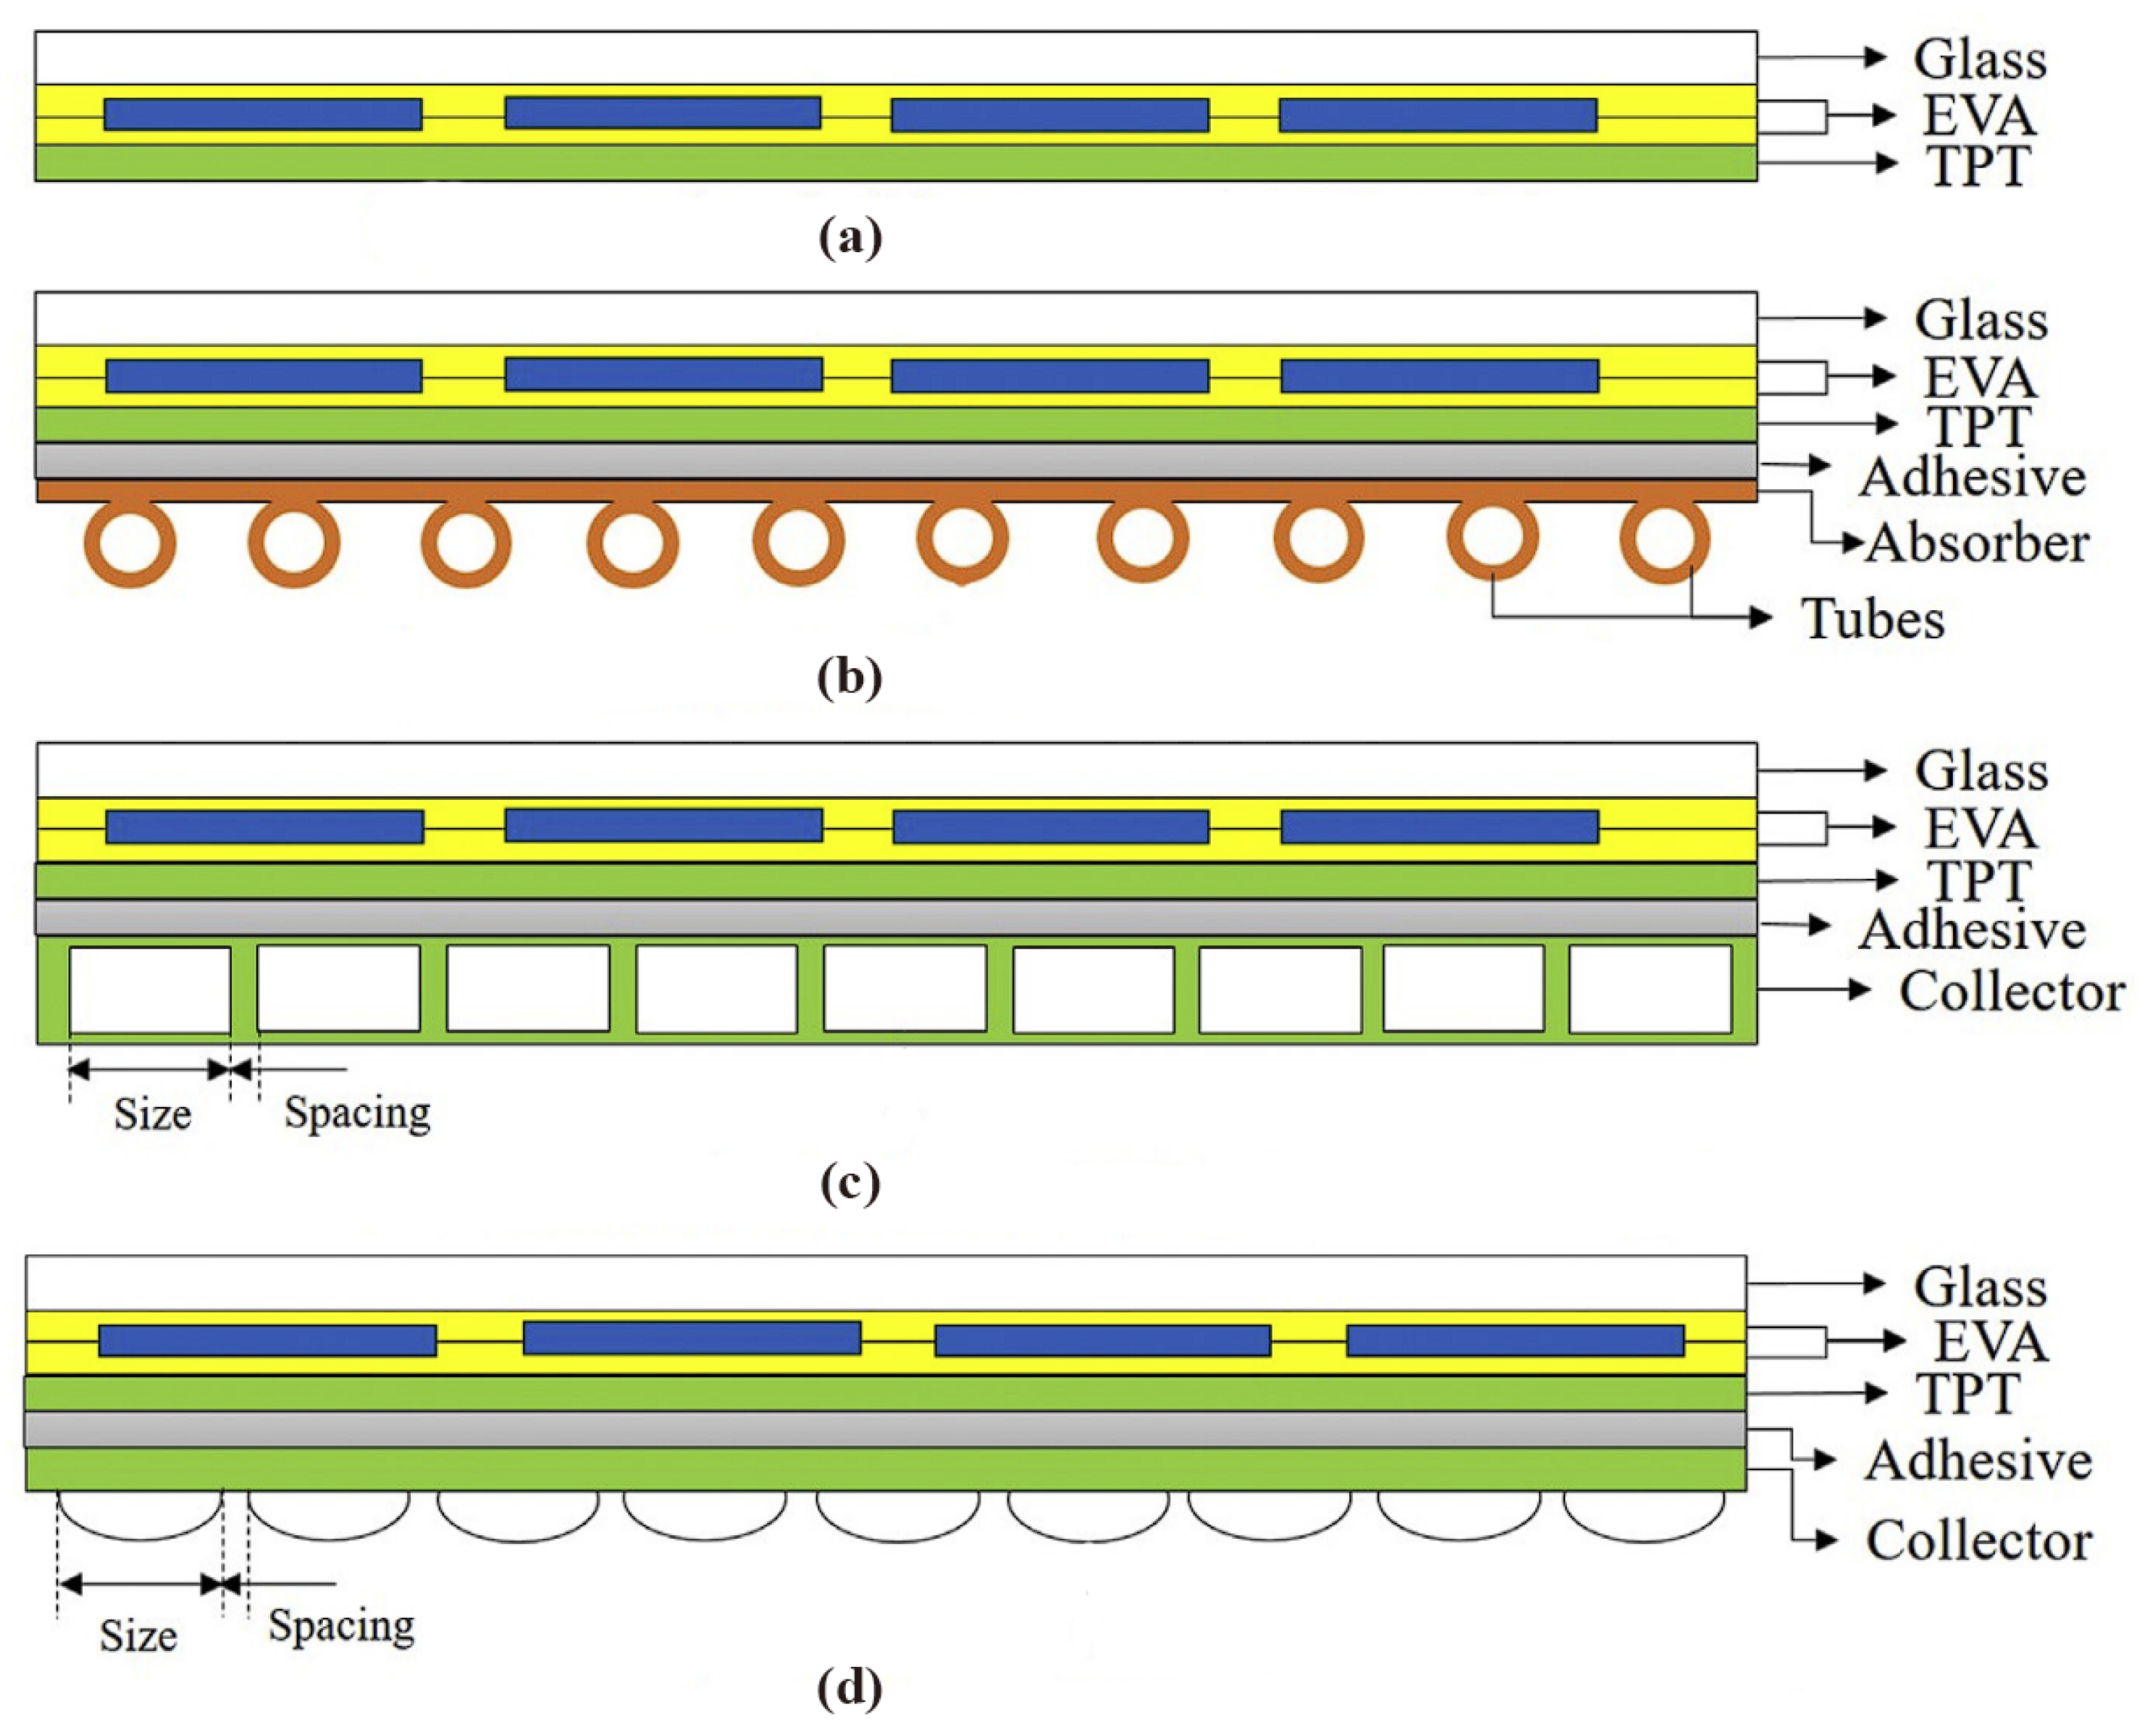
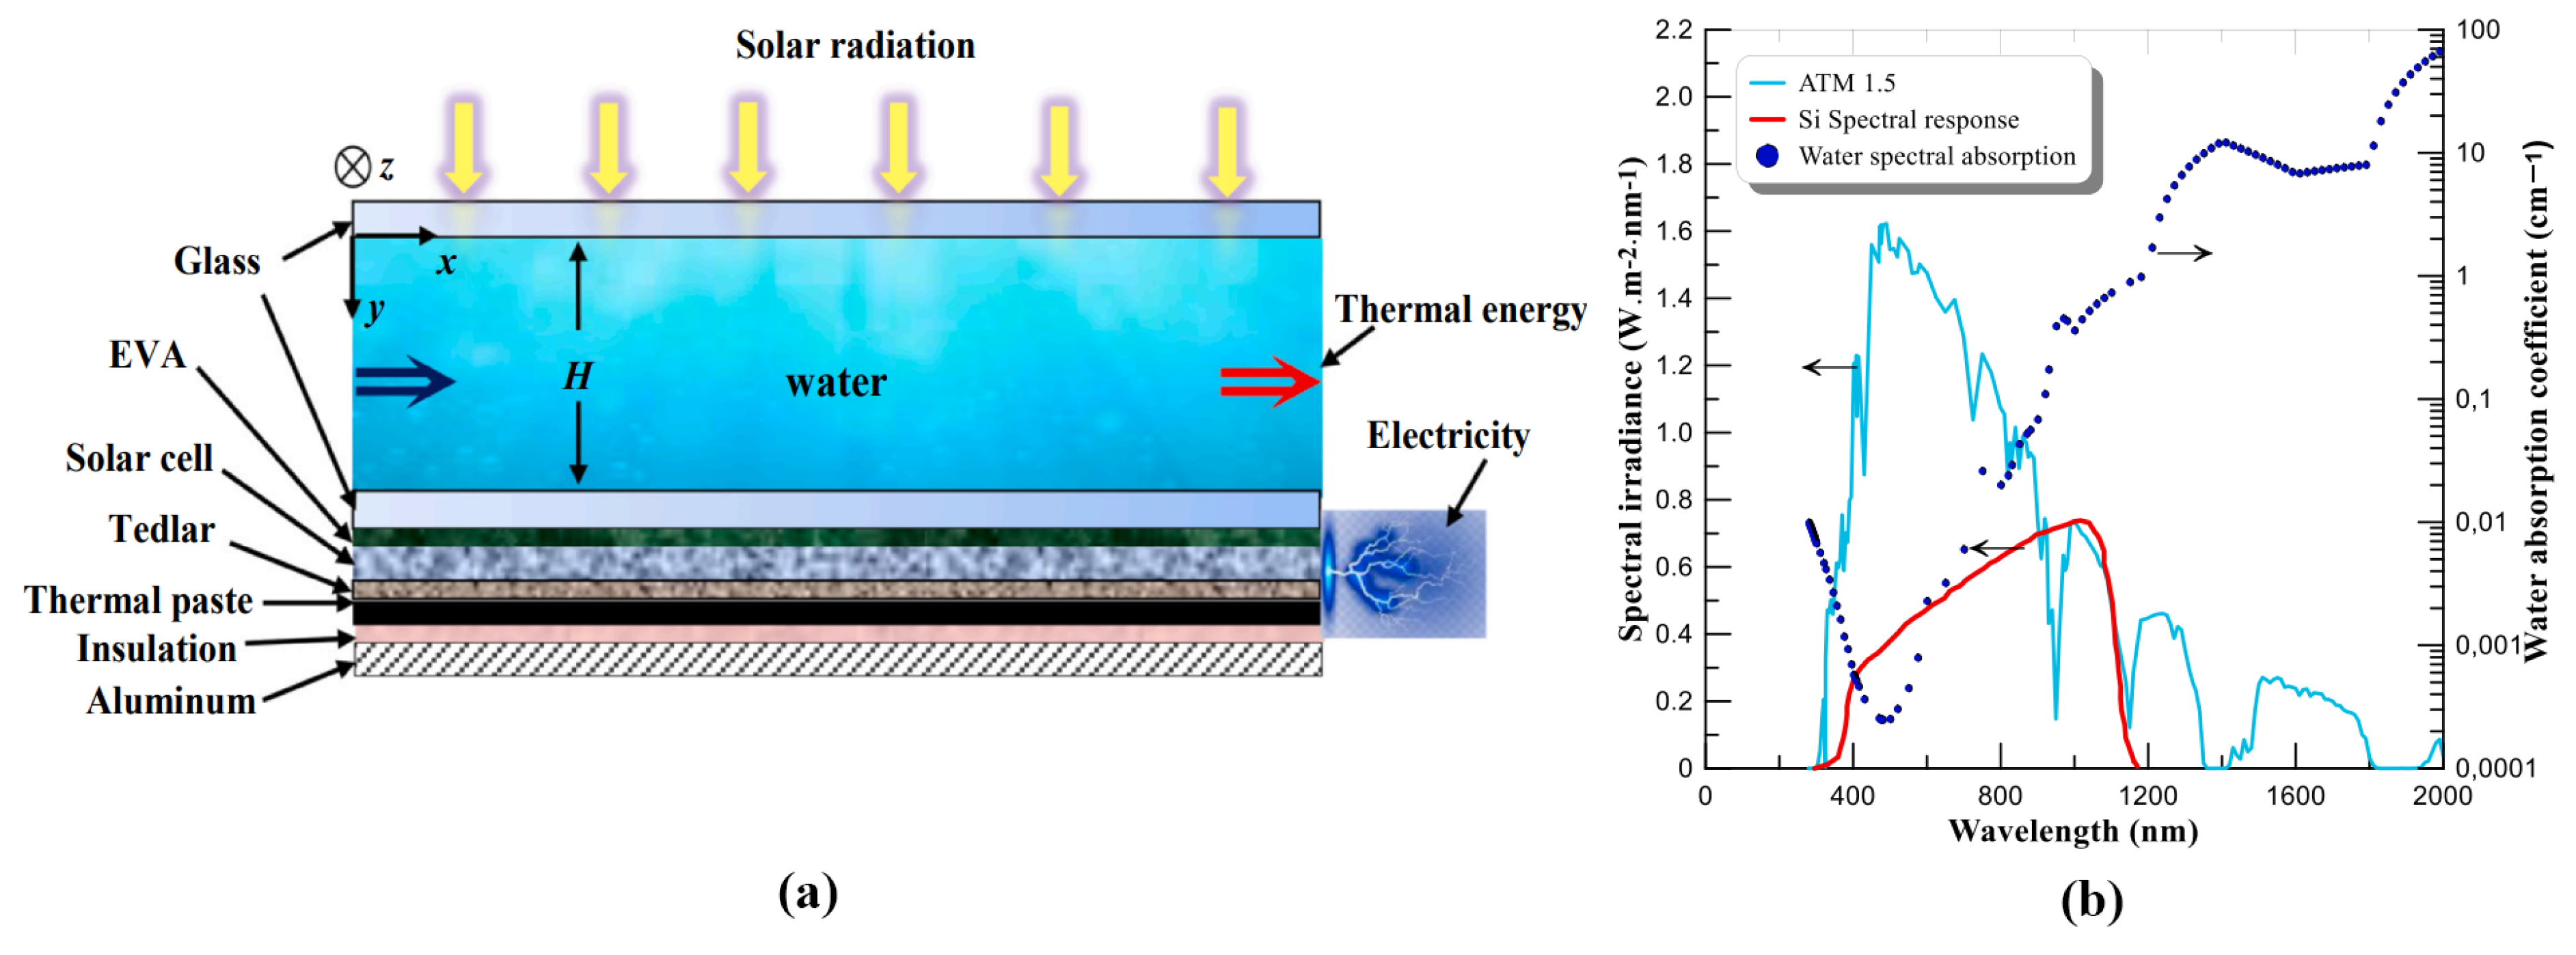
Beyond that, researchers have also explored the effect of other flow channel cross-section geometries on the heat transfer characteristics of PVT systems. Kianifard et al. [15] utilized a serpentine half-circular tube instead of a circular tube to cool their PVT system. The results indicate that increasing the number of pipe rows can significantly improve the thermal efficiency but reduces the electrical efficiency. Hissouf et al. [16] conducted a comparative study of circular, half-circular, and square tubes. The results all show the higher performance of the half-circular tubes compared to the circular one. Poredoš et al. [17] tested three types of roll-bond (serial, parallel, and bionic) heat exchangers, as shown in Figure 2. The results show that the bionic configuration enables a significantly lower pressure drop, of 385 Pa, than the parallel configuration, with an average pressure drop of 787 Pa. Pang et al. [18] investigated the heat transfer characteristics of rectangular and arch cross-section channels shown in Figure 3 and then obtained the optimum ratio of size and space. The results show that the arch cross-section was superior. In particular, a fluid channel with periodically varying cross-sectional shape was proposed by Shahsavar et al. [19] and demonstrated better thermal performance. In addition, Ramdani et al. [20] designed a rectangular fluid channel arranged above the PV cell, as shown in Figure 4a. As described in Figure 4b, the absorption coefficient of water increases within the radiation wavelength range of >750 nm, which corresponds to the wavelength range of infrared radiation. Thus, the fluid simultaneously functioned as a thermal energy transmitter and a filter. The results show that the PVT system with this design obtained a more uniform and lower PV cell temperature below 68 °C.
Finally, a series of inserts and twisted tubes are introduced to further enhance the fluid disturbance. Maadi et al. [21,22] investigated the effect of conical-leaf inserts and wavy inserts added into the tubes on the heat transfer characteristics of their PVT system by simulation, and the corresponding images of the inserts are shown in Figure 5a,b. Although the addition of these two inserts results in a 13.26–36.26-fold increase in pressure drops, the results of the studies indicate that the ratio of pumping power to PVT system electrical output power is negligible in the 10−6 order of magnitude. In particular, Kalateh et al. [23] welded twisted tapes (clockwise and counter-clockwise) into riser tubes to enhance the heat transfer performance of their PVT system. The schematic of the twisted tubes is shown in Figure 5c. The specific details of the above study are summarized in Table 1.

2.2. Photovoltaic–Thermal Collectors with Nanofluids

In addition, researchers are also aiming to modify the coolants used in PVT systems to lower the operating temperatures of PV cells, collect more thermal energy, and maximize the utilization of solar radiation. Among them, the addition of nanoparticles to the base fluid to enhance the thermal conductivity of the coolant has been a hot topic in recent research.
Water is a widely used and reliable coolant and has been widely studied and applied in the cooling processes of PVT systems. Therefore, in recent years, many researchers have focused on water as a base fluid to which various types of nanoparticles (metals and their oxides, nonmetals and their oxides, etc.) have been added to improve the heat transfer characteristics of the coolant. Ould-Lahoucine et al. [24] created numerical simulations of a PVT system configured with rectangular channels using TiO2/water nanofluid. The results of the study show that the use of TiO2/water nanofluid yields a very limited increase in the outlet temperature compared to pure water. Subsequently, Menon et al. [25] performed an experimental study on an unglazed PVT system to compare the effects of water and CuO/water nanofluid on the performance of the system and obtained an average of 20.78% and 35.67% improvement in electrical and thermal efficiencies. Shahsavar et al. [26] added magnetite nanoparticles to water to enhance the thermal conductivity of the coolant. It was revealed that the nanoparticle concentration and mass flow rate have a positive effect on the thermal efficiency and thermal exergy efficiency of the PVT system. Furthermore, comparative studies between metal nanoparticles have been carried out to provide some guidelines. In a study by Hissouf et al. [27], Cu and Al2O3 were added to a base fluid (water) to test and analyze the energy performance of the PVT system. It suggested that the Cu/water nanofluid was more effective compared to the Al2O3/water nanofluid. Jia et al. [28] conducted a numerical analysis of PVT systems using Al2O3/water and TiO2/water nanofluids. The results show that the performance of Al2O3/water nanofluid was superior, and the thermal power of the PVT collector increased with the increase in nanoparticle volume concentration, which showed a positive correlation. Alsalame et al. [29] conducted a comparative study to determine the performance of systems using CuO/water and Al2O3/water nanofluids as coolants. The results show the superiority of CuO/water nanofluid. The above study demonstrates that among metal nanoparticles, the oxides of Cu and Cu can lead to superior performance improvement in nanofluids due to their good thermal conductivity.
For non-metallic nanoparticles, Esmaeilinasab et al. [30] and Gelis et al. [31] both chose SiO2 as nanoparticles to be added to water and achieved decent performance of PVT systems. Notably, Sreekumar et al. [32] tested the performance of the MXene(Ti3C2)/water nanofluid. The results show that although the pressure drop yielded by MXene/water nanofluid was up to 88% higher than that of water, the pump’s power was low, and the heat transfer performance of the nanofluid was significantly improved (up to 17% of the thermal efficiency). Rahmanian et al. [33] performed a numerical simulation of a PVT system employing a water–multiwalled carbon nanotube (CNT) nanofluid as a coolant. A coefficient of cooling efficiency (CCE) was also introduced for the relationship between the additional electrical energy gain from the pumping system and its energy consumption. The results show that the CCE can be enhanced by increasing the thermal conductivity of the nanofluid. Besides this, the electrical efficiency of the nanofluid with a flow rate of 50 L/h was enhanced by 11% at a CNT concentration of 0.1 vol%, compared to the PV system.
To address the problem of insufficient heat output of a single nanofluid, some researchers have analyzed the heat transfer improvement performance of hybrid nanofluids. The effects of using a single nanofluid (CuO/water) and a hybrid nanofluid (CuO + Fe/water) on the performance of the PVT systems were numerically simulated by Karaaslan et al. [34]. The results show that using the nanofluid leads to a higher pressure drop than using pure water, while the maximum electrical efficiency values of pure water, CuO/water, and CuO + Fe/water nanofluids showed little difference. Hooshmandzade et al. [35] conducted indoor and outdoor experiments to investigate the effects of different concentrations of single (SiO2 or Al2O3) and hybrid (SiO2 + Al2O3) nanofluids on the performance of PVT systems. It was shown that the hybrid nanofluid (0.5–0.5 wt. %) manifested the most significant improvement in electrical and thermal efficiency for both systems, with values of 1.99% and 9.09%, and 2.32% and 14.33%, respectively. Kazemian et al. [36] conducted numerical simulations of a novel PVT-ST serial system and investigated the application of four nanofluids in this system, including multiwall carbon–aluminum oxide (MWCNT-Al2O3), multiwall carbon nanotube–silicon carbide (MWCNT-SiC), graphene–aluminum oxide (Gr-Al2O3), and graphene–aluminum oxide (Gr-SiC). Among the results, the highest overall efficiency of 77.40% was achieved by MWCNT-SiC with a 2% volume concentration. Furthermore, Adun et al. [37] prepared Al2O3 + ZnO + Fe3O4/water ternary nanofluid and applied it in a PVT system. The results show that the best economic was achieved using 0.5 vol% ternary nanofluid under laminar and turbulent flow.
The type of nanoparticles has a significant impact on the effectiveness of improvement in nanofluid physical properties, but exploring suitable base fluids is also a goal of researchers. Rubbi et al. [38] prepared nanofluids by adding MXene particles to soybean oil (SO) for the cooling of PVT systems. The results indicate that the thermal conductivity of Ti3C2/SO nanofluid at 55 °C was increased by 60.82% at 0.125 wt. % compared to the pure soybean oil. At an irradiance of 1000 W/m2 and a mass flow rate of 0.07 kg/s, the electrical output of the PVT system with nanofluid was improved by 15.44% compared with that of the Al2O3/water nanofluid, and the total thermal efficiency of PVT at this time reached 84.25%. Samylingam et al. [39] investigated the thermal and energetic properties of PVT systems based on MXene/pure olein palm oil (OPO) nanofluid using Comsol. A comparative study with Al2O3/water nanofluid was undertaken. The results of the study show that the use of MXene instead of Al2O3/water nanofluid could lead to an increase in the thermal efficiency of the system by about 16% at a mass flow rate of 0.07 kg/s. More specific details about the above studies are listed in Table 2.

3. Thermally Driven Cooling Systems Utilizing Low Temperature Heat Sources

In order to match the thermal output of PVT collectors, the temperature of the driven heat source must be as low as possible. Several studies have been carried out by researchers for this purpose.
Wu et al. [40] proposed two compression-assisted absorption cooling cycles in which the refrigerant is compressed at the high-pressure and low-pressure sides, respectively. The scheme of the proposed system is shown in Figure 6. In addition, conventional and low-GWP refrigerants were used in the cycle, and a thermodynamic performance model was developed. The results show that the proposed system can achieve a maximum coefficient of performance (COP) of 0.670 when employing R32 as the working pair. Simultaneously, the driving temperature range of the proposed system is 45–85 °C, with the lower limit extended from 60 °C to 45 °C.
Subsequently, Wu et al. [41] developed another novel solar-powered flexible hybrid-energy heat pump with the structure as shown in Figure 7. The heat pump can be adjusted by adjusting the allocation of refrigerant entering the absorption section, thus enabling it to respond to varying solar radiation and building cooling loads, resulting in three modes of system operation. When the allocation of refrigerant entering the absorption section was in the range of 0.2 to 0.8, the cooling capacity decreased from 170.3 to 71.0 kW, and the COP increased from 7.1 to 38.4, under operating conditions with a condenser inlet temperature of 25 °C and a generator inlet temperature of 90 °C.
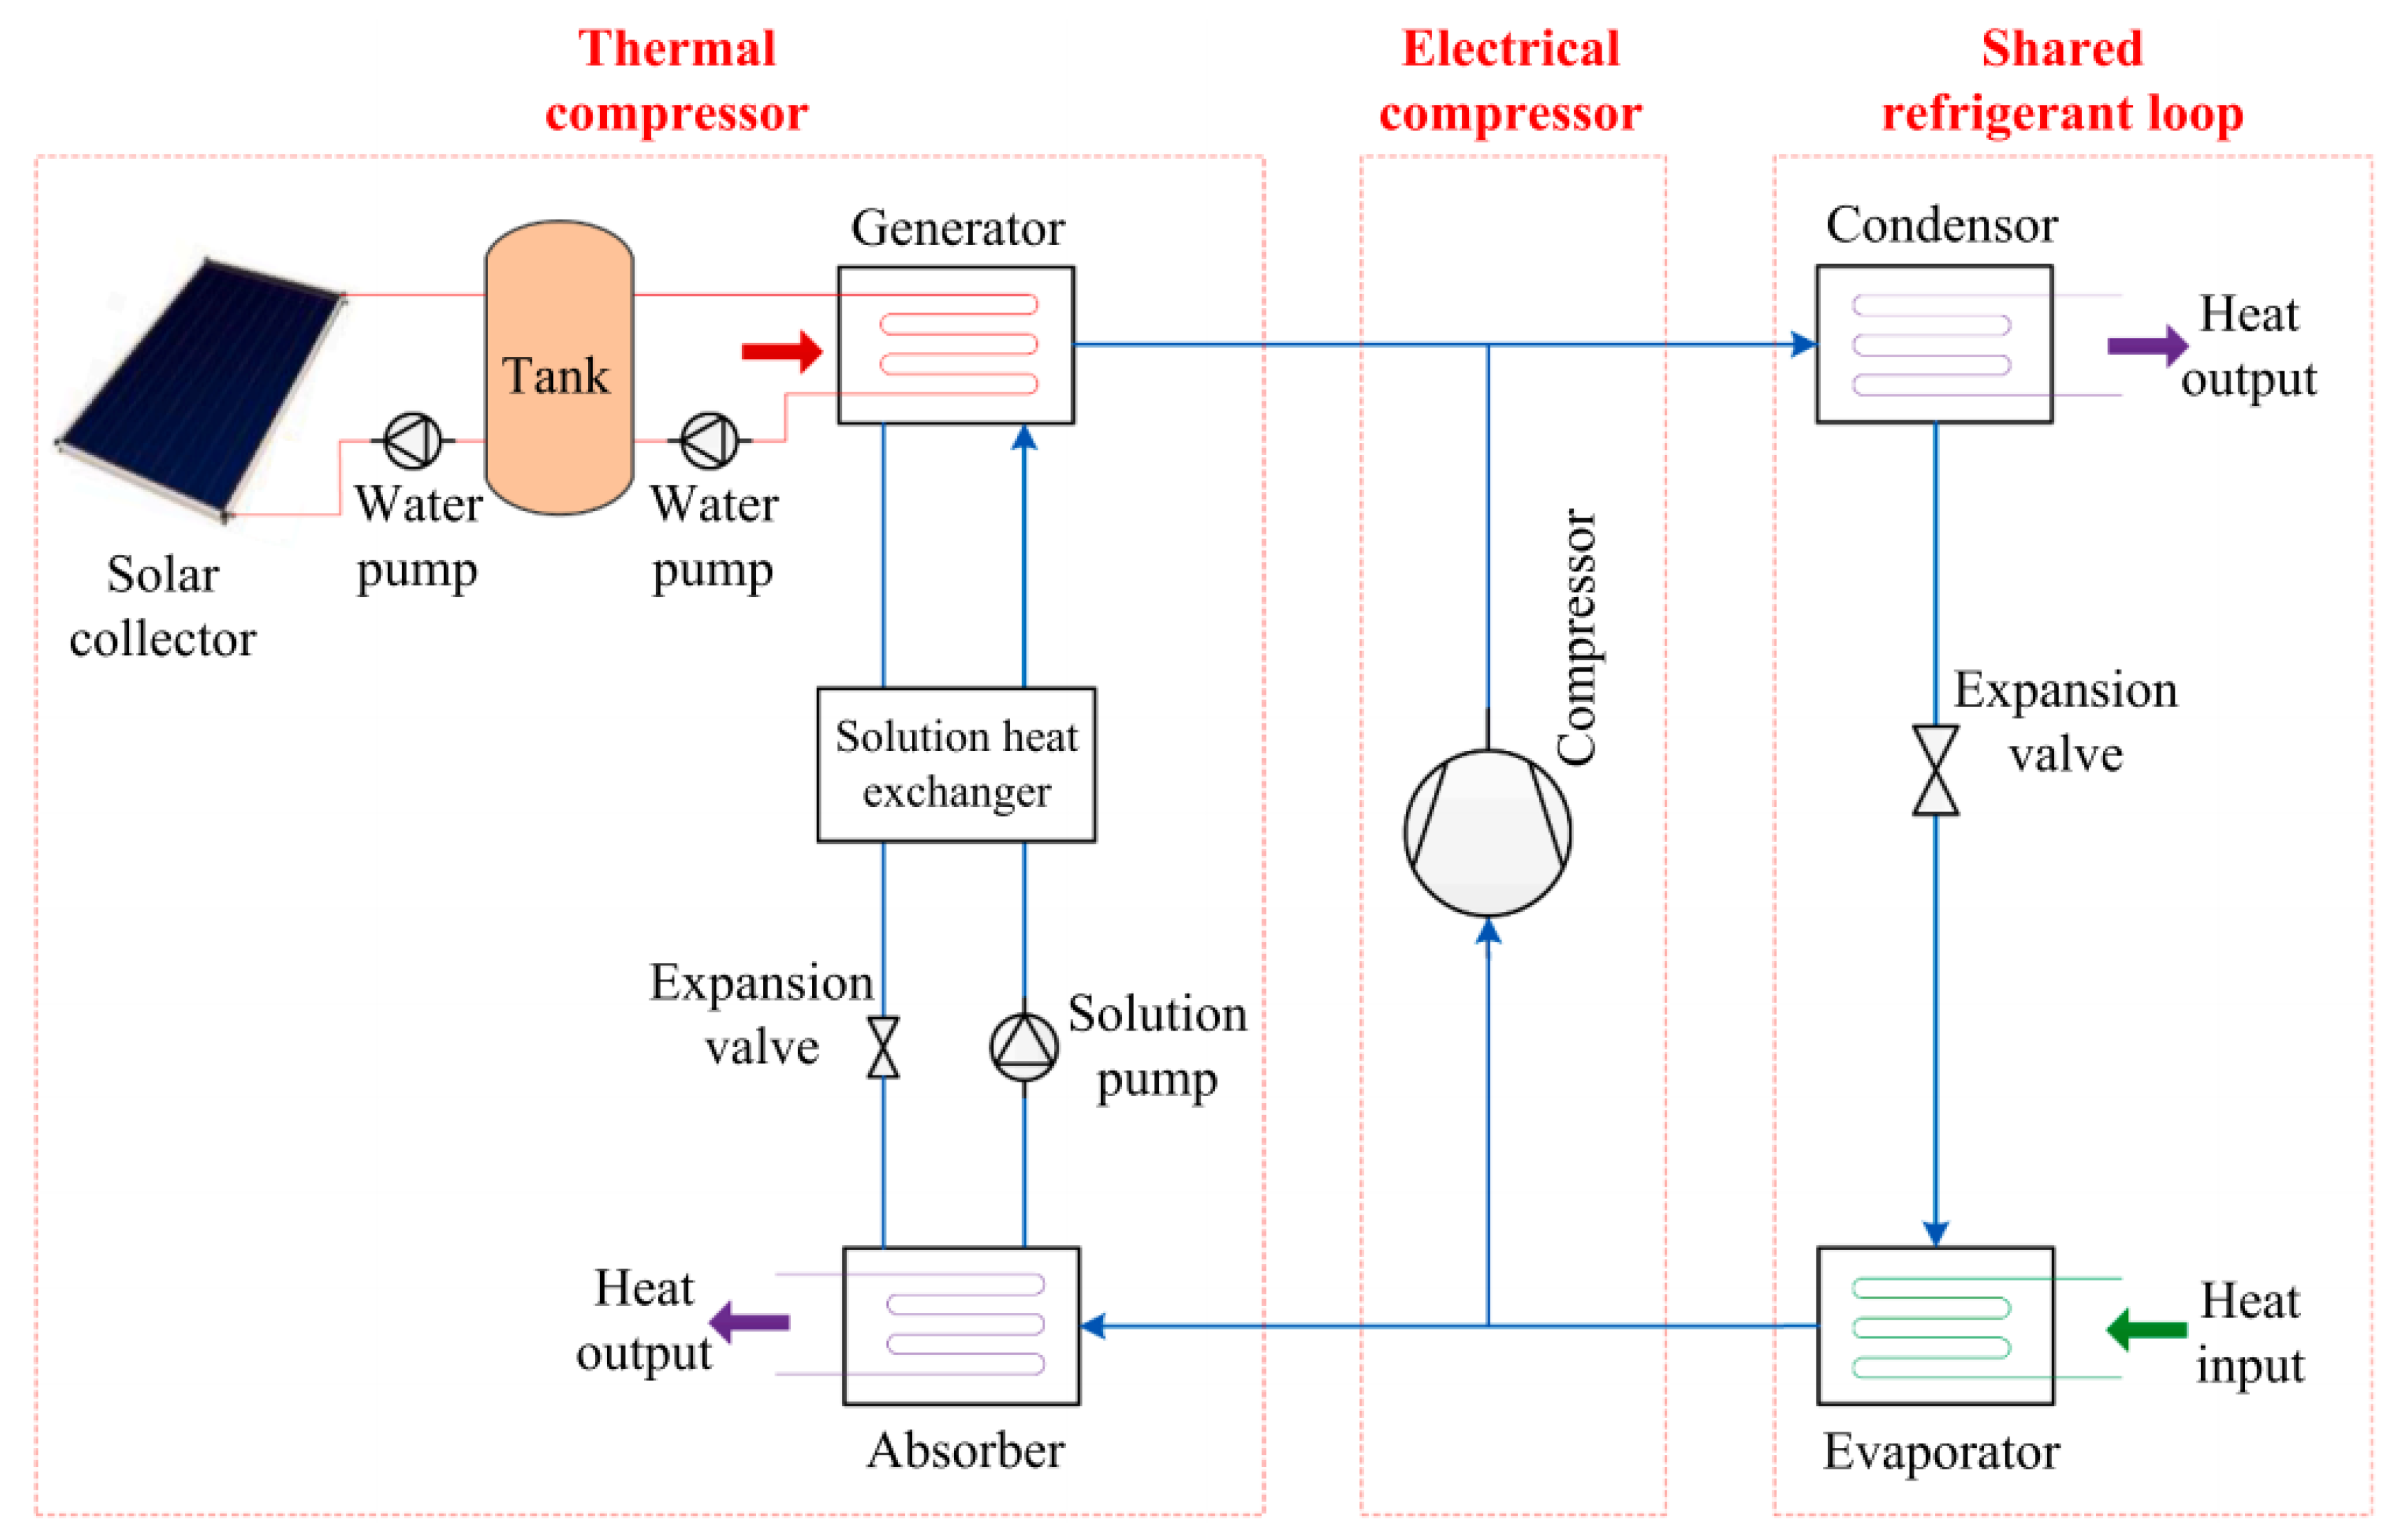
Sun et al. [42] proposed a compression-assisted absorption cooling cycle in which the compressor is between the evaporator and the absorber, as shown in Figure 8. In addition, a new R1234yf/ionic liquid working pair here replaces the conventional working pair. The effects of different operating conditions (generation, evaporation, condensation and absorption temperatures, and compression ratios) on the cooling performance of the cooling cycle were investigated in this study. The results show that the minimum generation temperature required by the compression-assisted cooling cycle with the new workpiece pairs is about 62–70 °C, with a corresponding COP of about 0.2. In addition, it was pointed out that although using the new working pair requires a lower COP than using the conventional working pair, the size of the cooling equipment is much smaller, which can further reduce investment costs.
He et al. [43] proposed a novel cooling system consisting of a two-stage vapor-absorption cooling subsystem (VAS) and a vapor-compression cooling subsystem (VCS). In this system, shown in Figure 9, the VAS employs a LiBr/H2O working pair, while the VCS uses R1234yf and R1234ze (E) refrigerants. The results show that this new system can generate 7 °C of cooling output using low-grade thermal heat. This system significantly reduces the available heat source temperature from 90 °C to 45 °C. Optimal generator 1 (GEN1) and evaporator subcooling unit (ESU) temperatures, which together maximize COPnet, are achieved.
Nikbakhti et al. [44] theoretically evaluated the thermal characteristics of a novel integrated adsorption–absorption cooling system, the schematic diagram of which is shown in Figure 10. The authors studied the combined system with two layouts by changing the positions of the adsorption and absorption subsystems. The results show that the COP and cooling capacity of the absorption-bottom–adsorption-top system were about 5% and 15% higher than those of the adsorption-bottom–absorption-top system at a heat source temperature of 65 °C, respectively. Meanwhile, the required heat source temperature is extended to a minimum of 50 °C.
Subsequently, the integrated absorption-bottom–adsorption-top system was further investigated by Nikbakhti et al. [45]. In this system, shown in Figure 11, the condenser in the conventional absorption subsystem is replaced by the adsorber in the adsorption subsystem. The authors in this study investigated two layouts (with and without a water storage tank) to buffer the effects of intermittent solar radiation. The results show that the system with a water storage tank achieved a more consistent cooling output, with an average daily cooling capacity improvement of 15% and a COP of 0.37, compared to 0.32 for the system without a water storage tank.
Zeng et al. [46] developed a thermodynamic model for a solar absorption-subcooled compression hybrid cooling system and performed an advanced exergy analysis of the system to investigate the effects of heat source temperature, heat sink temperature, and absorption subsystem size on the exergy destructions of this new system. The system’s structure is shown in detail in Figure 12. The cooling capacity of the absorption subsystem is employed to subcool the refrigerant of the compression subsystem, which raises the evaporation temperature of the absorption subcycle and reduces the required heat source temperature. The results show that when the cooling capacity of the absorption subsystem was increased from 5 kw to 45 kw, and the avoidable endogenous exergy destructions taking place inside condenser 2 and the compressor were reduced by 12.3% and 12.8%, respectively. The study suggests the priorities of the main components that require improvement to be ranked as condenser 2, compressor, evaporator, and subcooler.
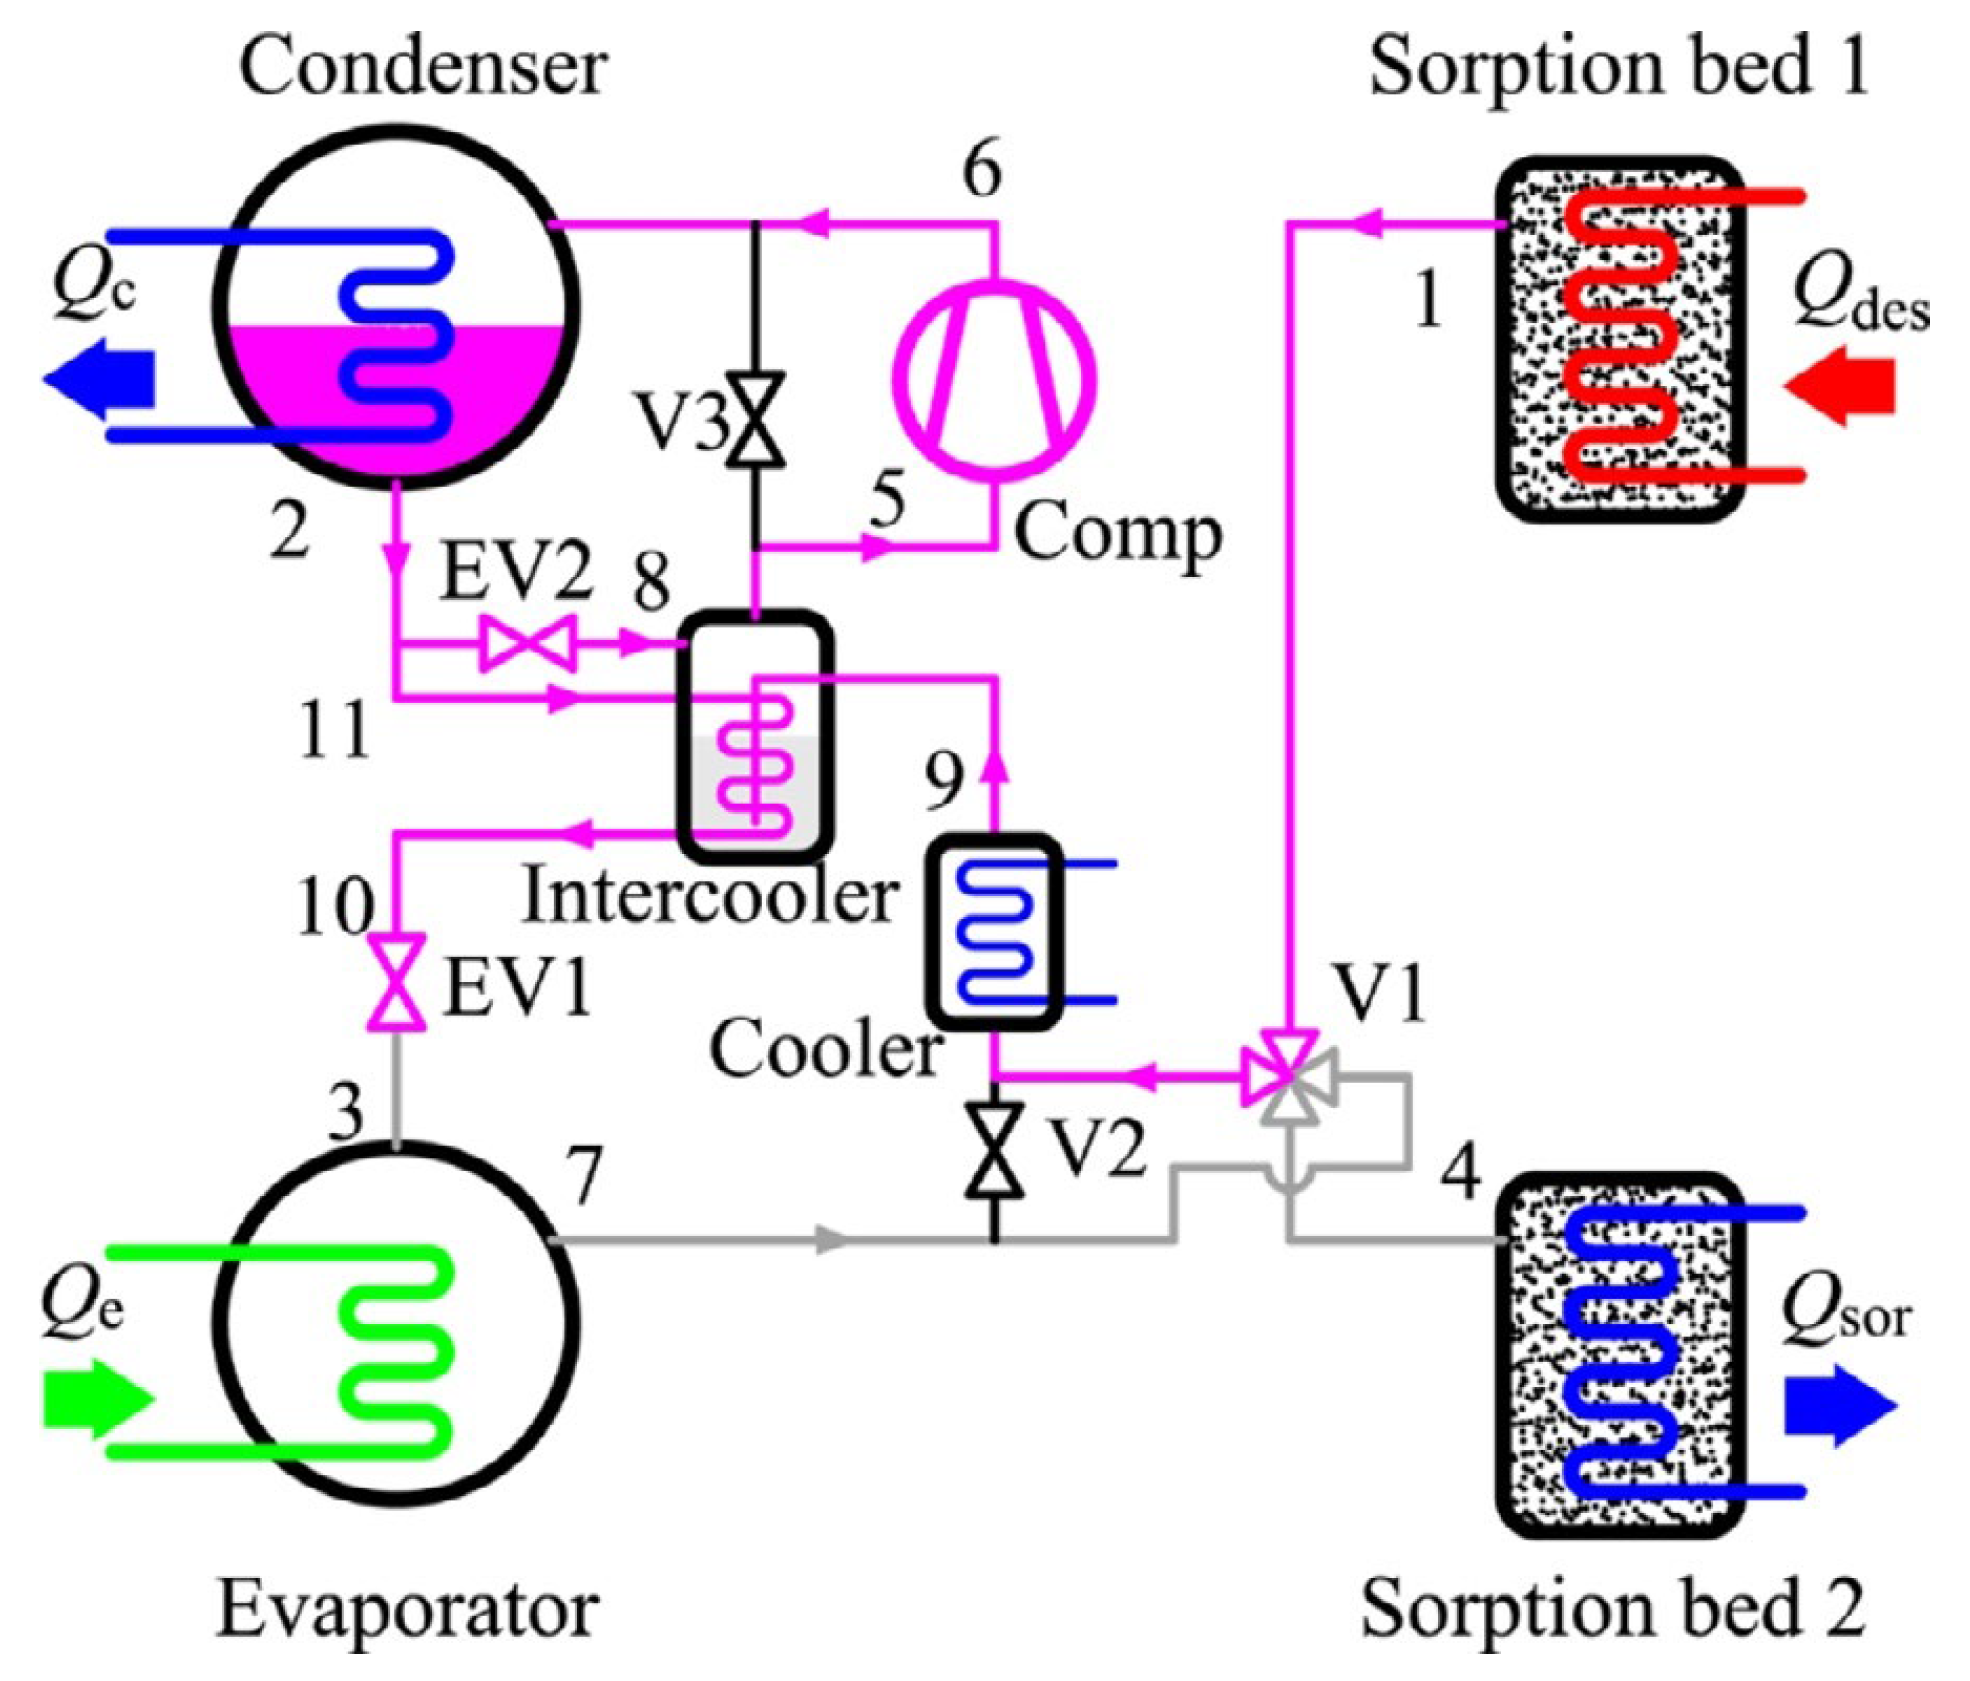
Gao et al. [47] designed a novel hybrid solid sorption-compression refrigeration cycle for refrigerated warehouses, as shown in Figure 13, which lowers the desorption temperature of the sorption bed by adding a compressor between the sorption bed and the condenser, thus reducing the required heat source temperature and enabling the utilization of low-temperature heat sources. The results show that SrCl2-(8–1) NH3 is the most suitable working pair for this new system when the heat source temperature is below 90 °C and the minimum heat source temperature required for the system is 60 °C. At a condensing temperature of 40 °C and an evaporating temperature of −25 °C, the maximum COP obtained for the new system is about 7.0.
Zhang et al. [48] modified the kalina cycle within the classical mode of the kalina power cycle coupled with a compression-assisted absorption cooling cycle by adding liquefaction, distribution, recuperating, and pressurization processes. The system shown in Figure 14 uses a low-GWP HFC/ionic liquid working pair, and the operating mode of the system can be changed by varying the flow rate of the refrigerant to the power and cooling subcycles, such that the new system achieves a cold, dual-output power mode. The results show that the power generated by the new system is 81.03% greater than that of the reference system under base conditions. Additionally, the study points out that both the cooling load and the network increase as the heat source inlet temperature increases.
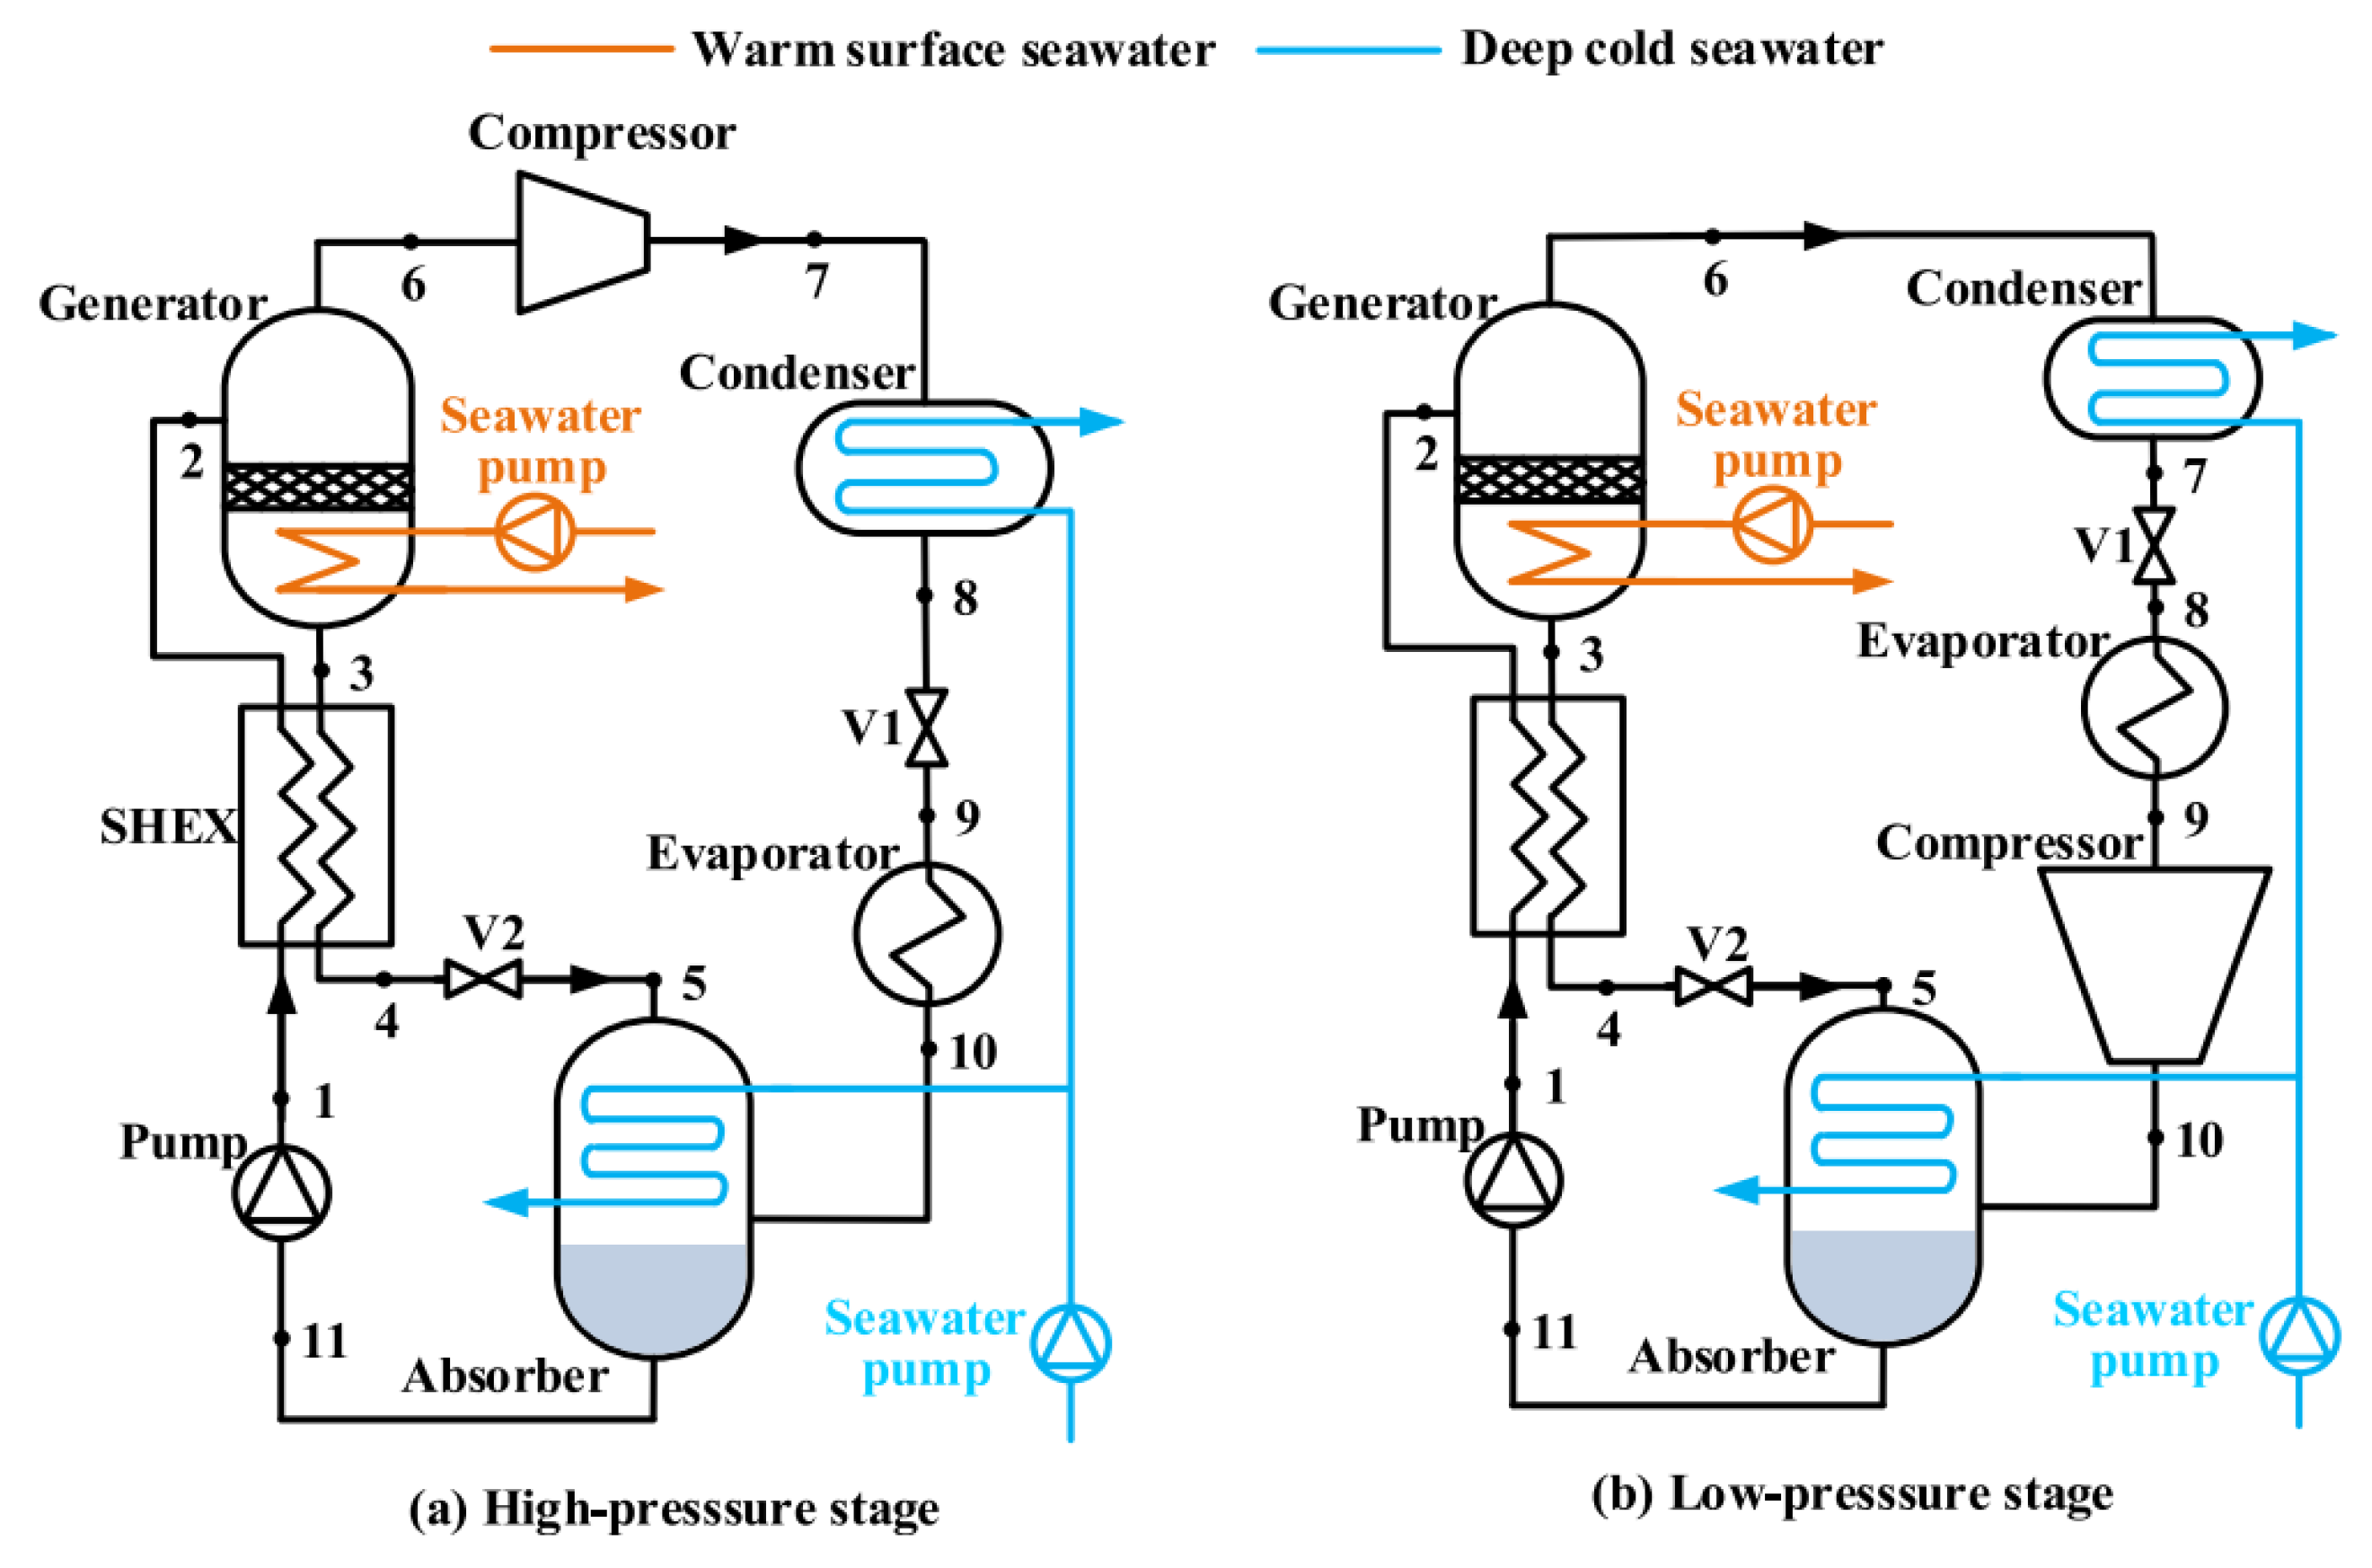
Hu et al. [49] proposed a compression-assisted absorption cooling cycle using surface and deep seawater, and two configurations were proposed in this study, with compressors in the low-pressure and high-pressure sections, respectively. The schematic of the proposed system is shown in Figure 15. The effects of intermediate pressure on exergy efficiency and primary energy rate ratio were analyzed in the study. The results of the study show that the low-pressure compression-assisted absorption cooling cycle has a higher primary energy rate ratio of 1.392, which indicates that compression in the low-pressure section increases the energy-saving capacity of the system. In addition, the primary energy rate ratio showed a positive correlation with the surface seawater temperature. The primary energy rate of the low-pressure compression-assisted cooling cycle was increased by 1.62 when the surface temperature of seawater increased from 29 to 49 °C.
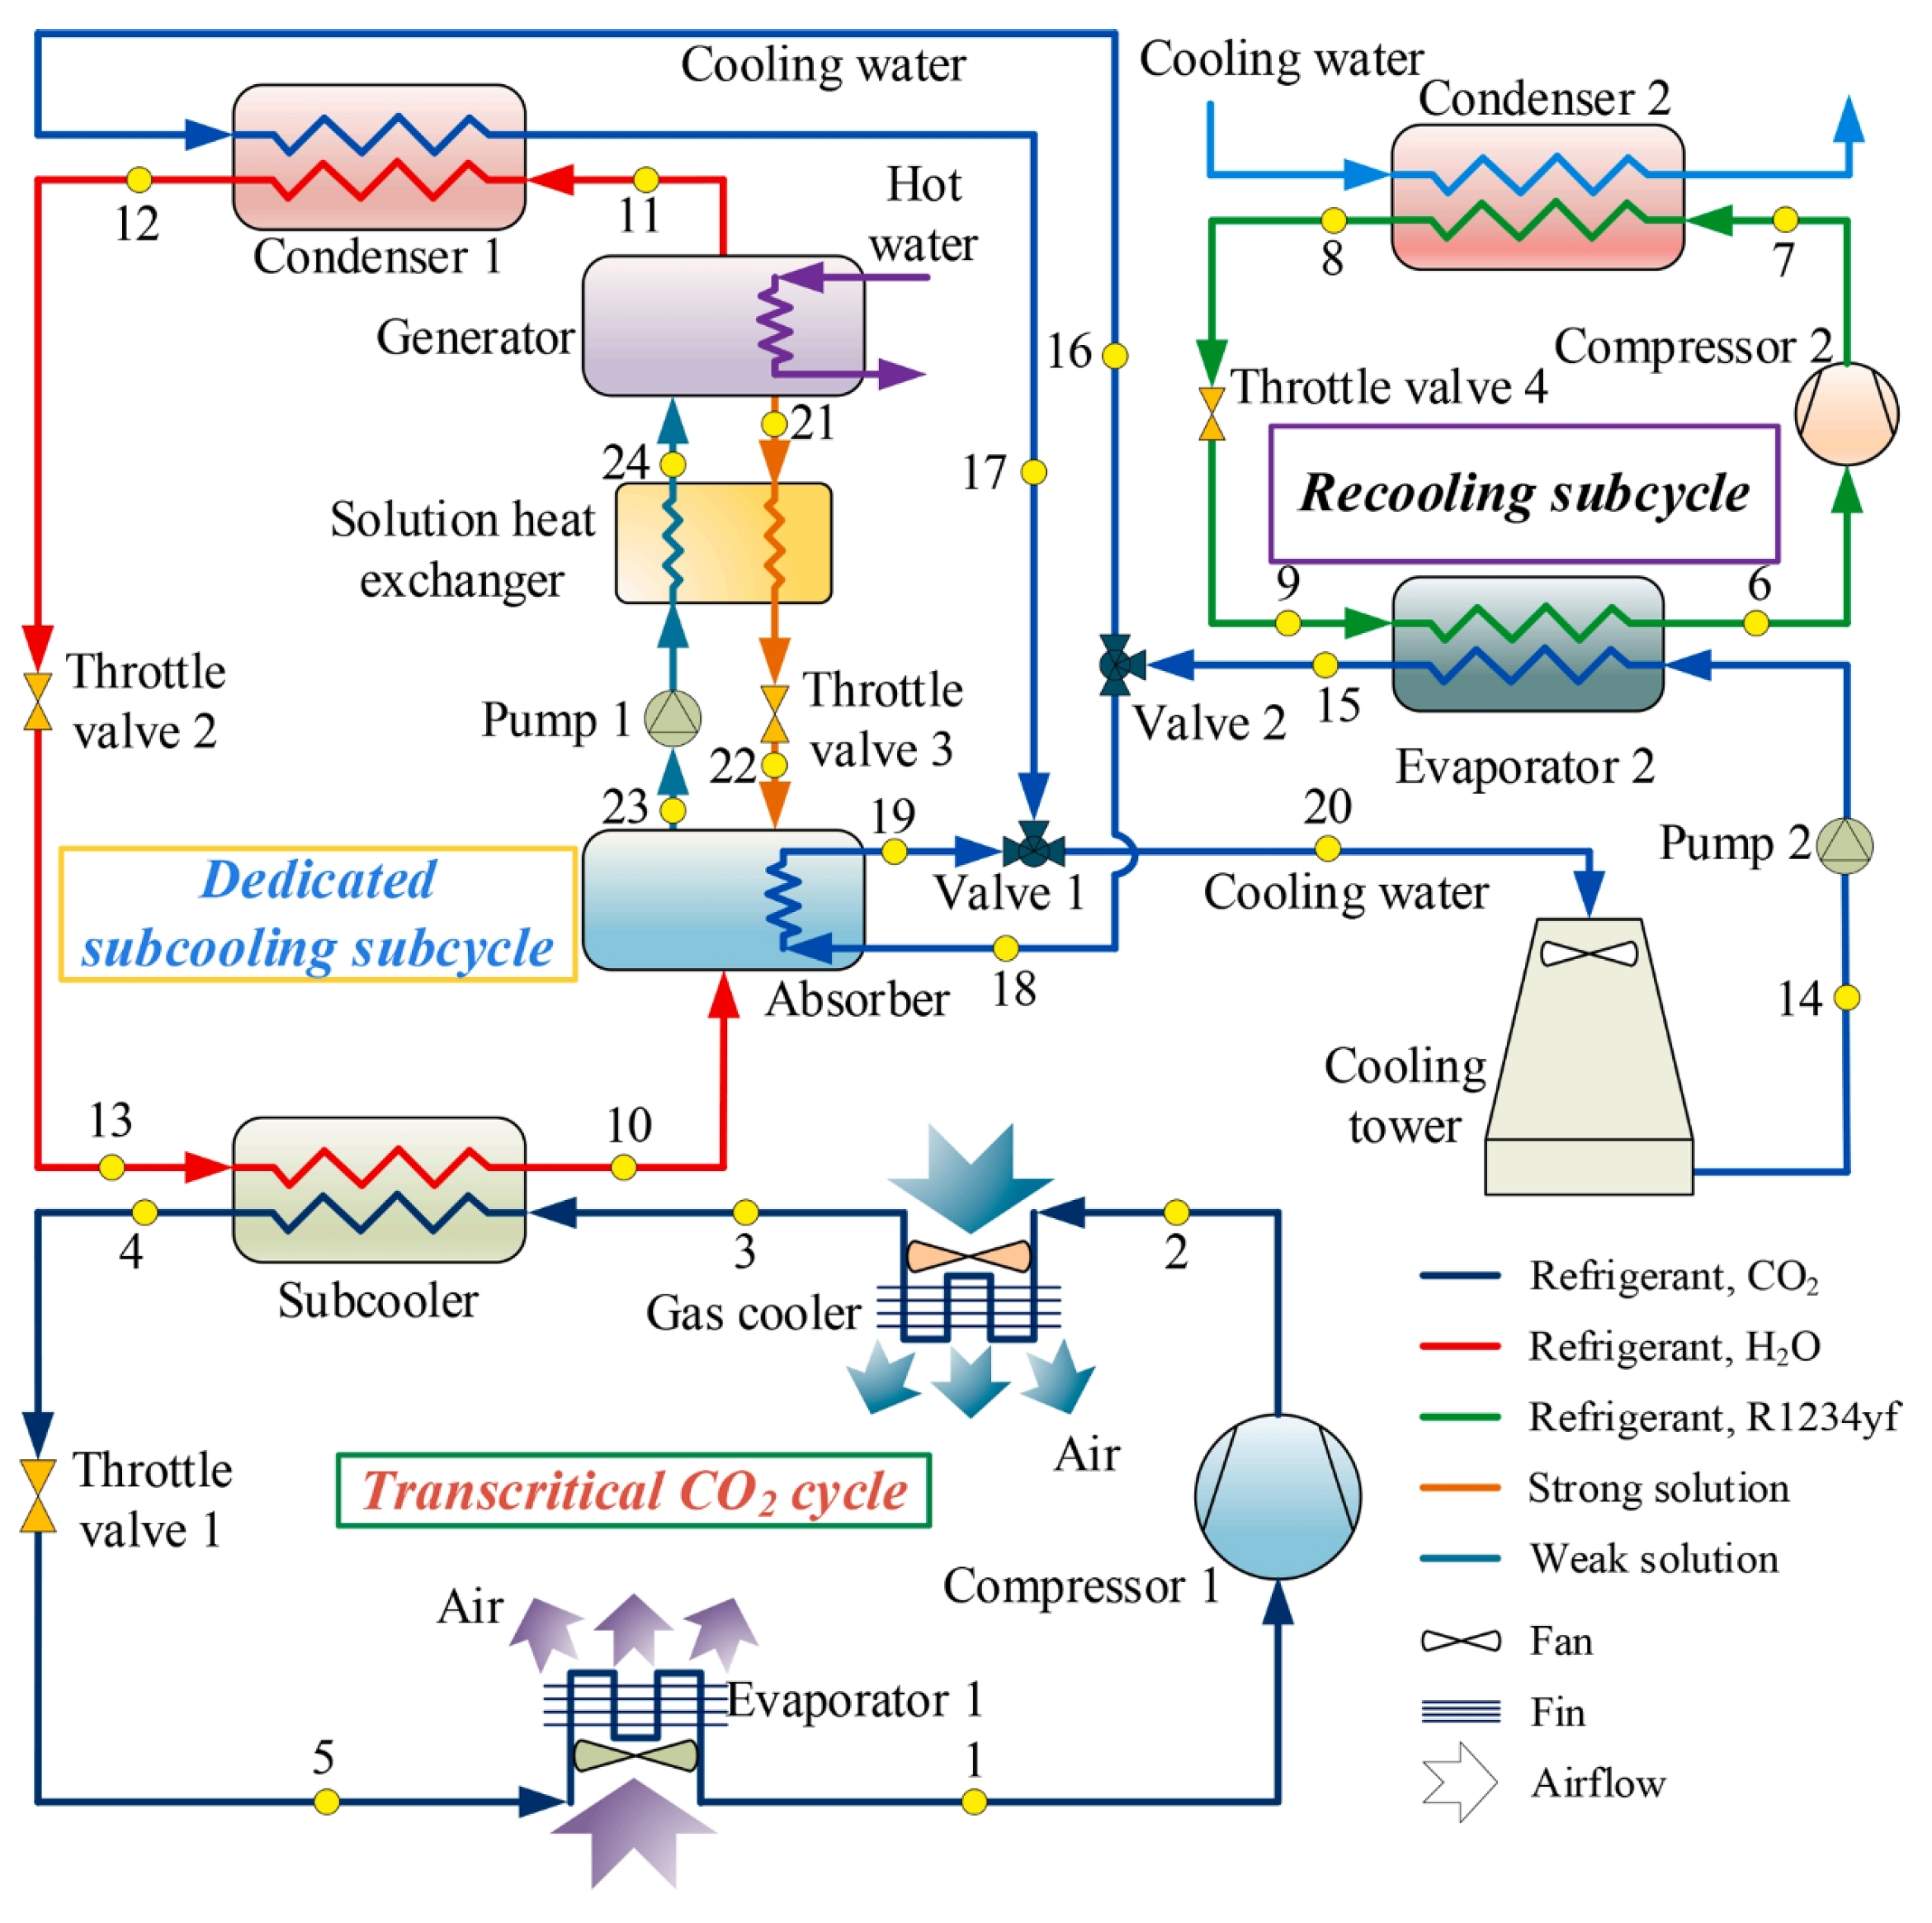
Huang et al. [50] added a recooling subcycle to a CO2 transcritical cooling cycle with a dedicated subcooling subcycle to reduce the power consumption of the compressor and to improve the utilization of the heat source temperature. The proposed cooling cycle is shown in Figure 16. The modified cooling cycle utilizes the cooling capacity generated by the recooling subcycle to recool the condenser and absorber in the dedicated subcooling subcycle, so as to reduce its exhaust heat temperature and thus extend the operating range of the heat source temperature. The results of the study show that the mechanical work of the proposed cooling cycle is 0.95 kW, which is 28.5% lower compared to the mechanical work of the reference system (1.33 kW). In addition, the lower limit of the heat source temperature of the proposed system is extended by 4 °C from 73 °C to 69 °C.
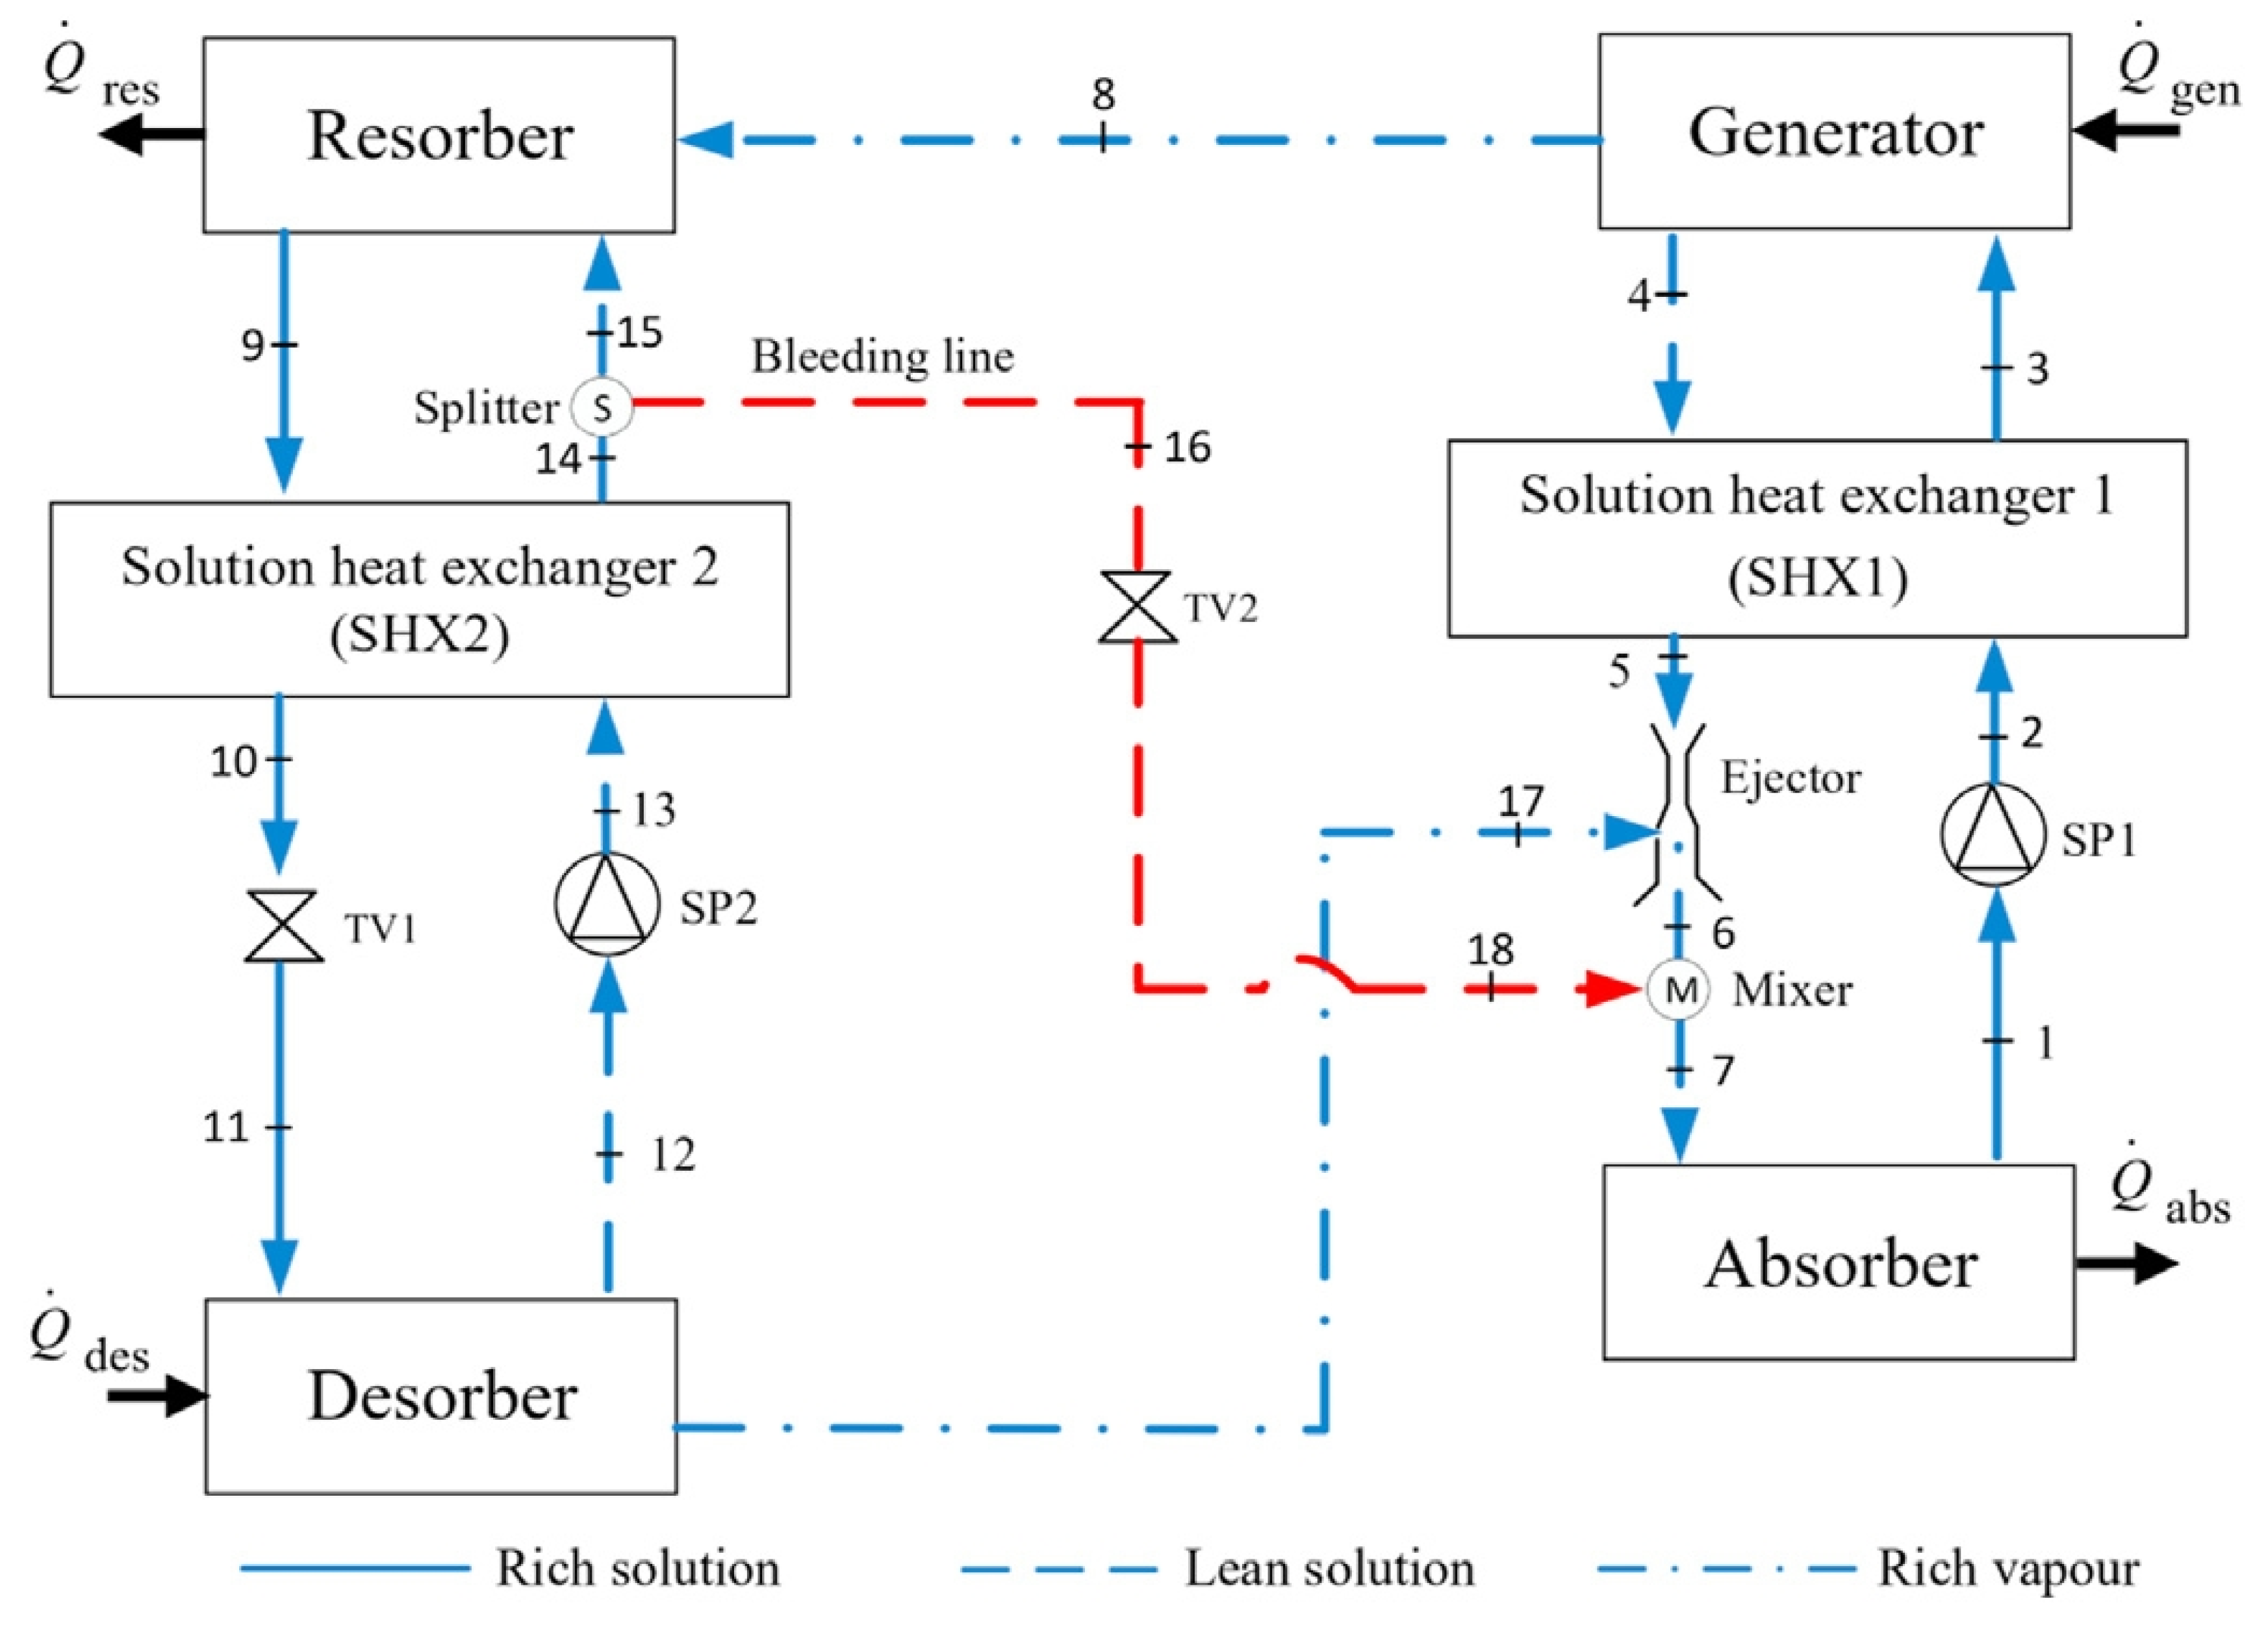
Kumar et al. [51] modified a conventional vapor absorption–resorption (VAR) cooling system by replacing the throttle valve in the system with an ejector, thus allowing the new system to operate at lower pressures. The three layouts of the proposed system are shown in the figure, and the classification is based on the secondary flow to the ejector, as shown in Figure 17, Figure 18 and Figure 19. The results of the study indicate that the third configuration’s COP is 15% higher than that of the conventional VAR system at a resorber pressure of 6 bar, and the heat source temperature required will range from 75 °C to 70 °C. A comparison of the novel thermally driven cooling cycles is presented in Table 3.

4. Solar Cooling Systems Driven by Photovoltaic–Thermal Collectors

Considering the intermittent and unstable nature of solar radiation, the electrical and thermal energy output of PVT collectors may not be stable, so solar cooling systems often require the aid of power grids and thermal energy buffers, as well as the assistance of electric chillers in scenarios with high cooling loads such as high-rise buildings. In recent years, researchers have conducted many studies on the key parameters and operating strategies of solar cooling systems.
Hassan et al. [52] conducted a theoretical study of a solar cooling system consisting of PVT collectors and adsorption cooling units for different Middle Eastern climatic conditions, and the system’s structure is shown in detail in Figure 20. The results show that the proposed system has a maximum cooling capacity of 7.439–8.1 kW, a COP of 0.42–0.43, and a maximum power generation of 10.77–12.55 kW in the three cities studied.
In addition, Hassan et al. [53] modified the PVT- and ETC-driven adsorption cooling system to form a combined cooling, heat, and power (CCHP) system and conducted a theoretical study under the climate conditions of Alexandria. The schematic of the proposed system is shown in Figure 21. The authors used different combinations of PVT and ETC in series and parallel to combine the advantages of both, resulting in five system layouts. The results of the study show that the system with parallel PVT (Conf-1) achieved greater power production, with a total of 81.7 kWh per day in July. Conf-1 and Conf-5 achieved the best average system efficiencies in August, at 0.315 and 0.313, respectively.
Later on, Hassan et al. [54] introduced the ORC unit into the proposed trigeneration system and studied four configurations with the hot water supply sequence as a variable to determine the optimal operation. The results of the study show that the system without an ORC unit achieved the largest average cooling capacity and COP in summer, with 9.6 kW and 0.41, respectively, while it achieved the best net present value (NPV) and payback period, at USD 16,877.9 and 8.45 years, respectively.
Gado et al. [55] proposed a renewable biomass–solar–wind energy system driving a cascade adsorption–compression cooling system, as shown in Figure 22, to analyze its potential for application in cold storage at specified freezing temperatures. The results show that the biomass–PVT–battery system and biomass–PVT–wind–battery system can both provide all the electrical energy required for the operation of the system in summer, with a surplus of 16.6 kWh and 15 kWh, respectively. The excess power is used to heat the thermal storage tank with an electric heater. However, in the proposed system, the heat generated from biomass accounts for 80–100% of the system’s heat requirement and provides the majority of the heat demand. At the same time, an economic analysis shows that scenario 1 (biomass–PVT–battery system) is more attractive [56]. The levelized cost of refrigeration for scenario 1 is USD 0.235/kWh, compared to USD 0.237/kWh for scenario 2. This is due to the higher initial investment, operation, and maintenance costs of the wind turbine.
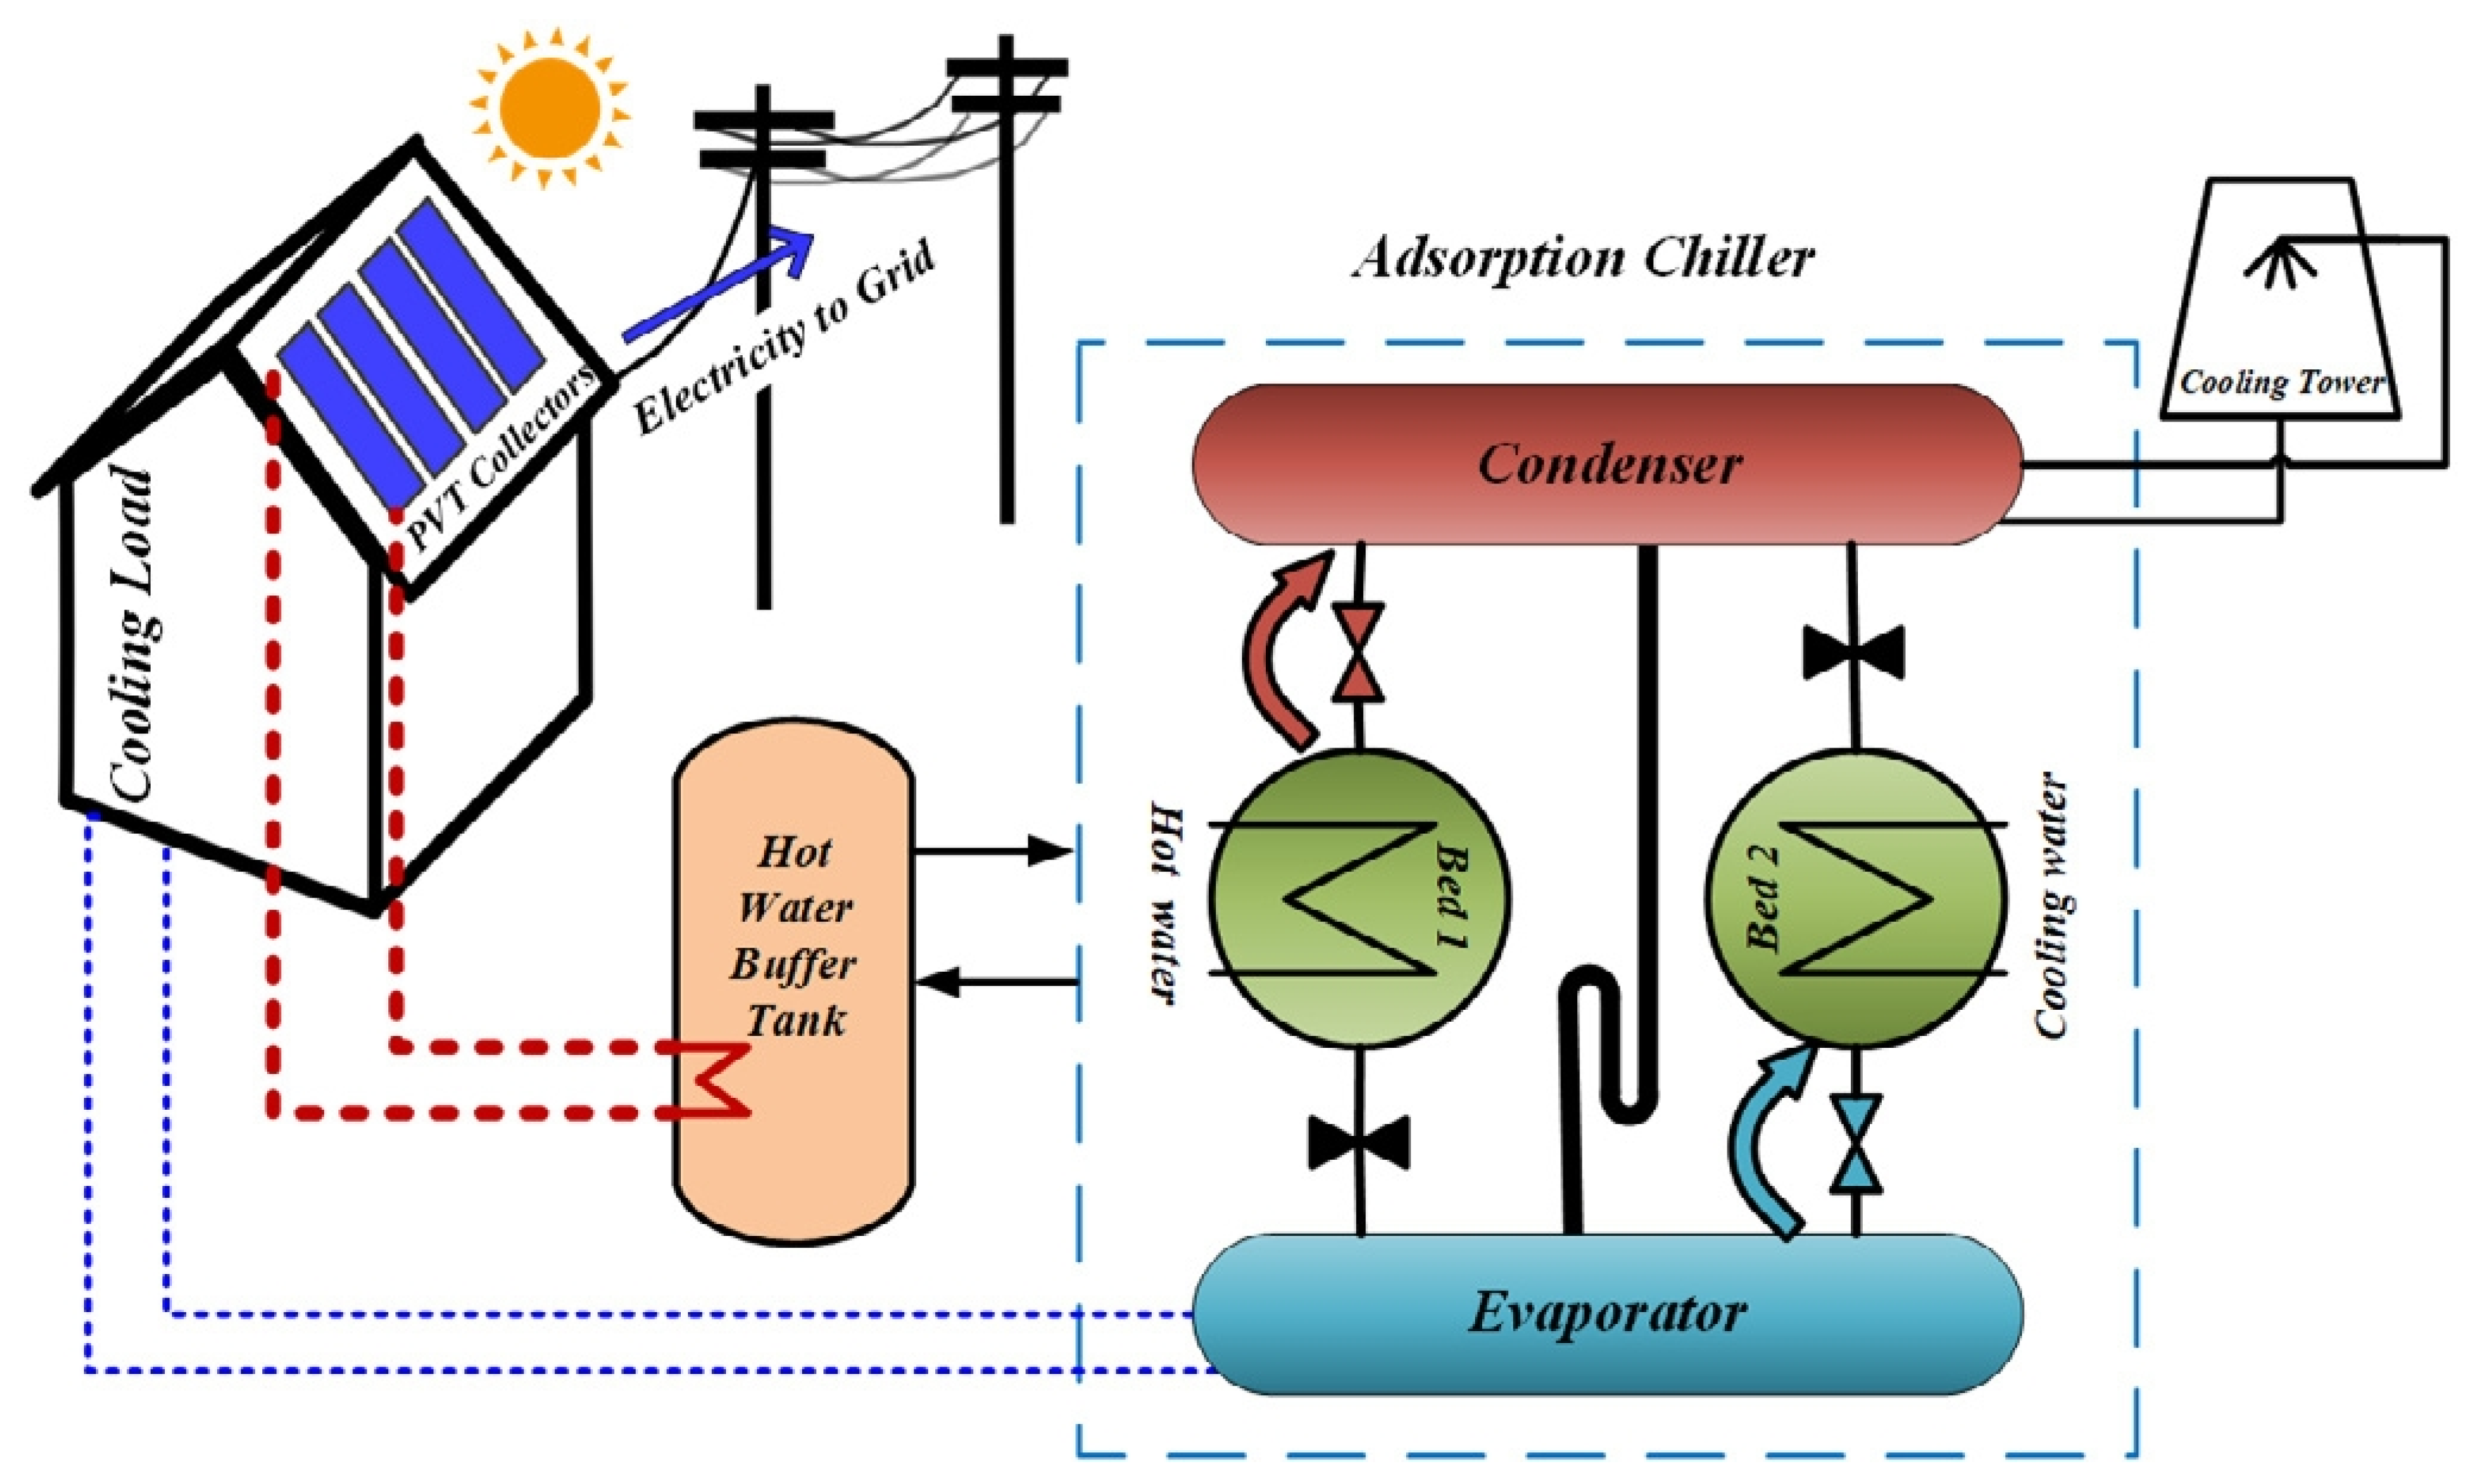
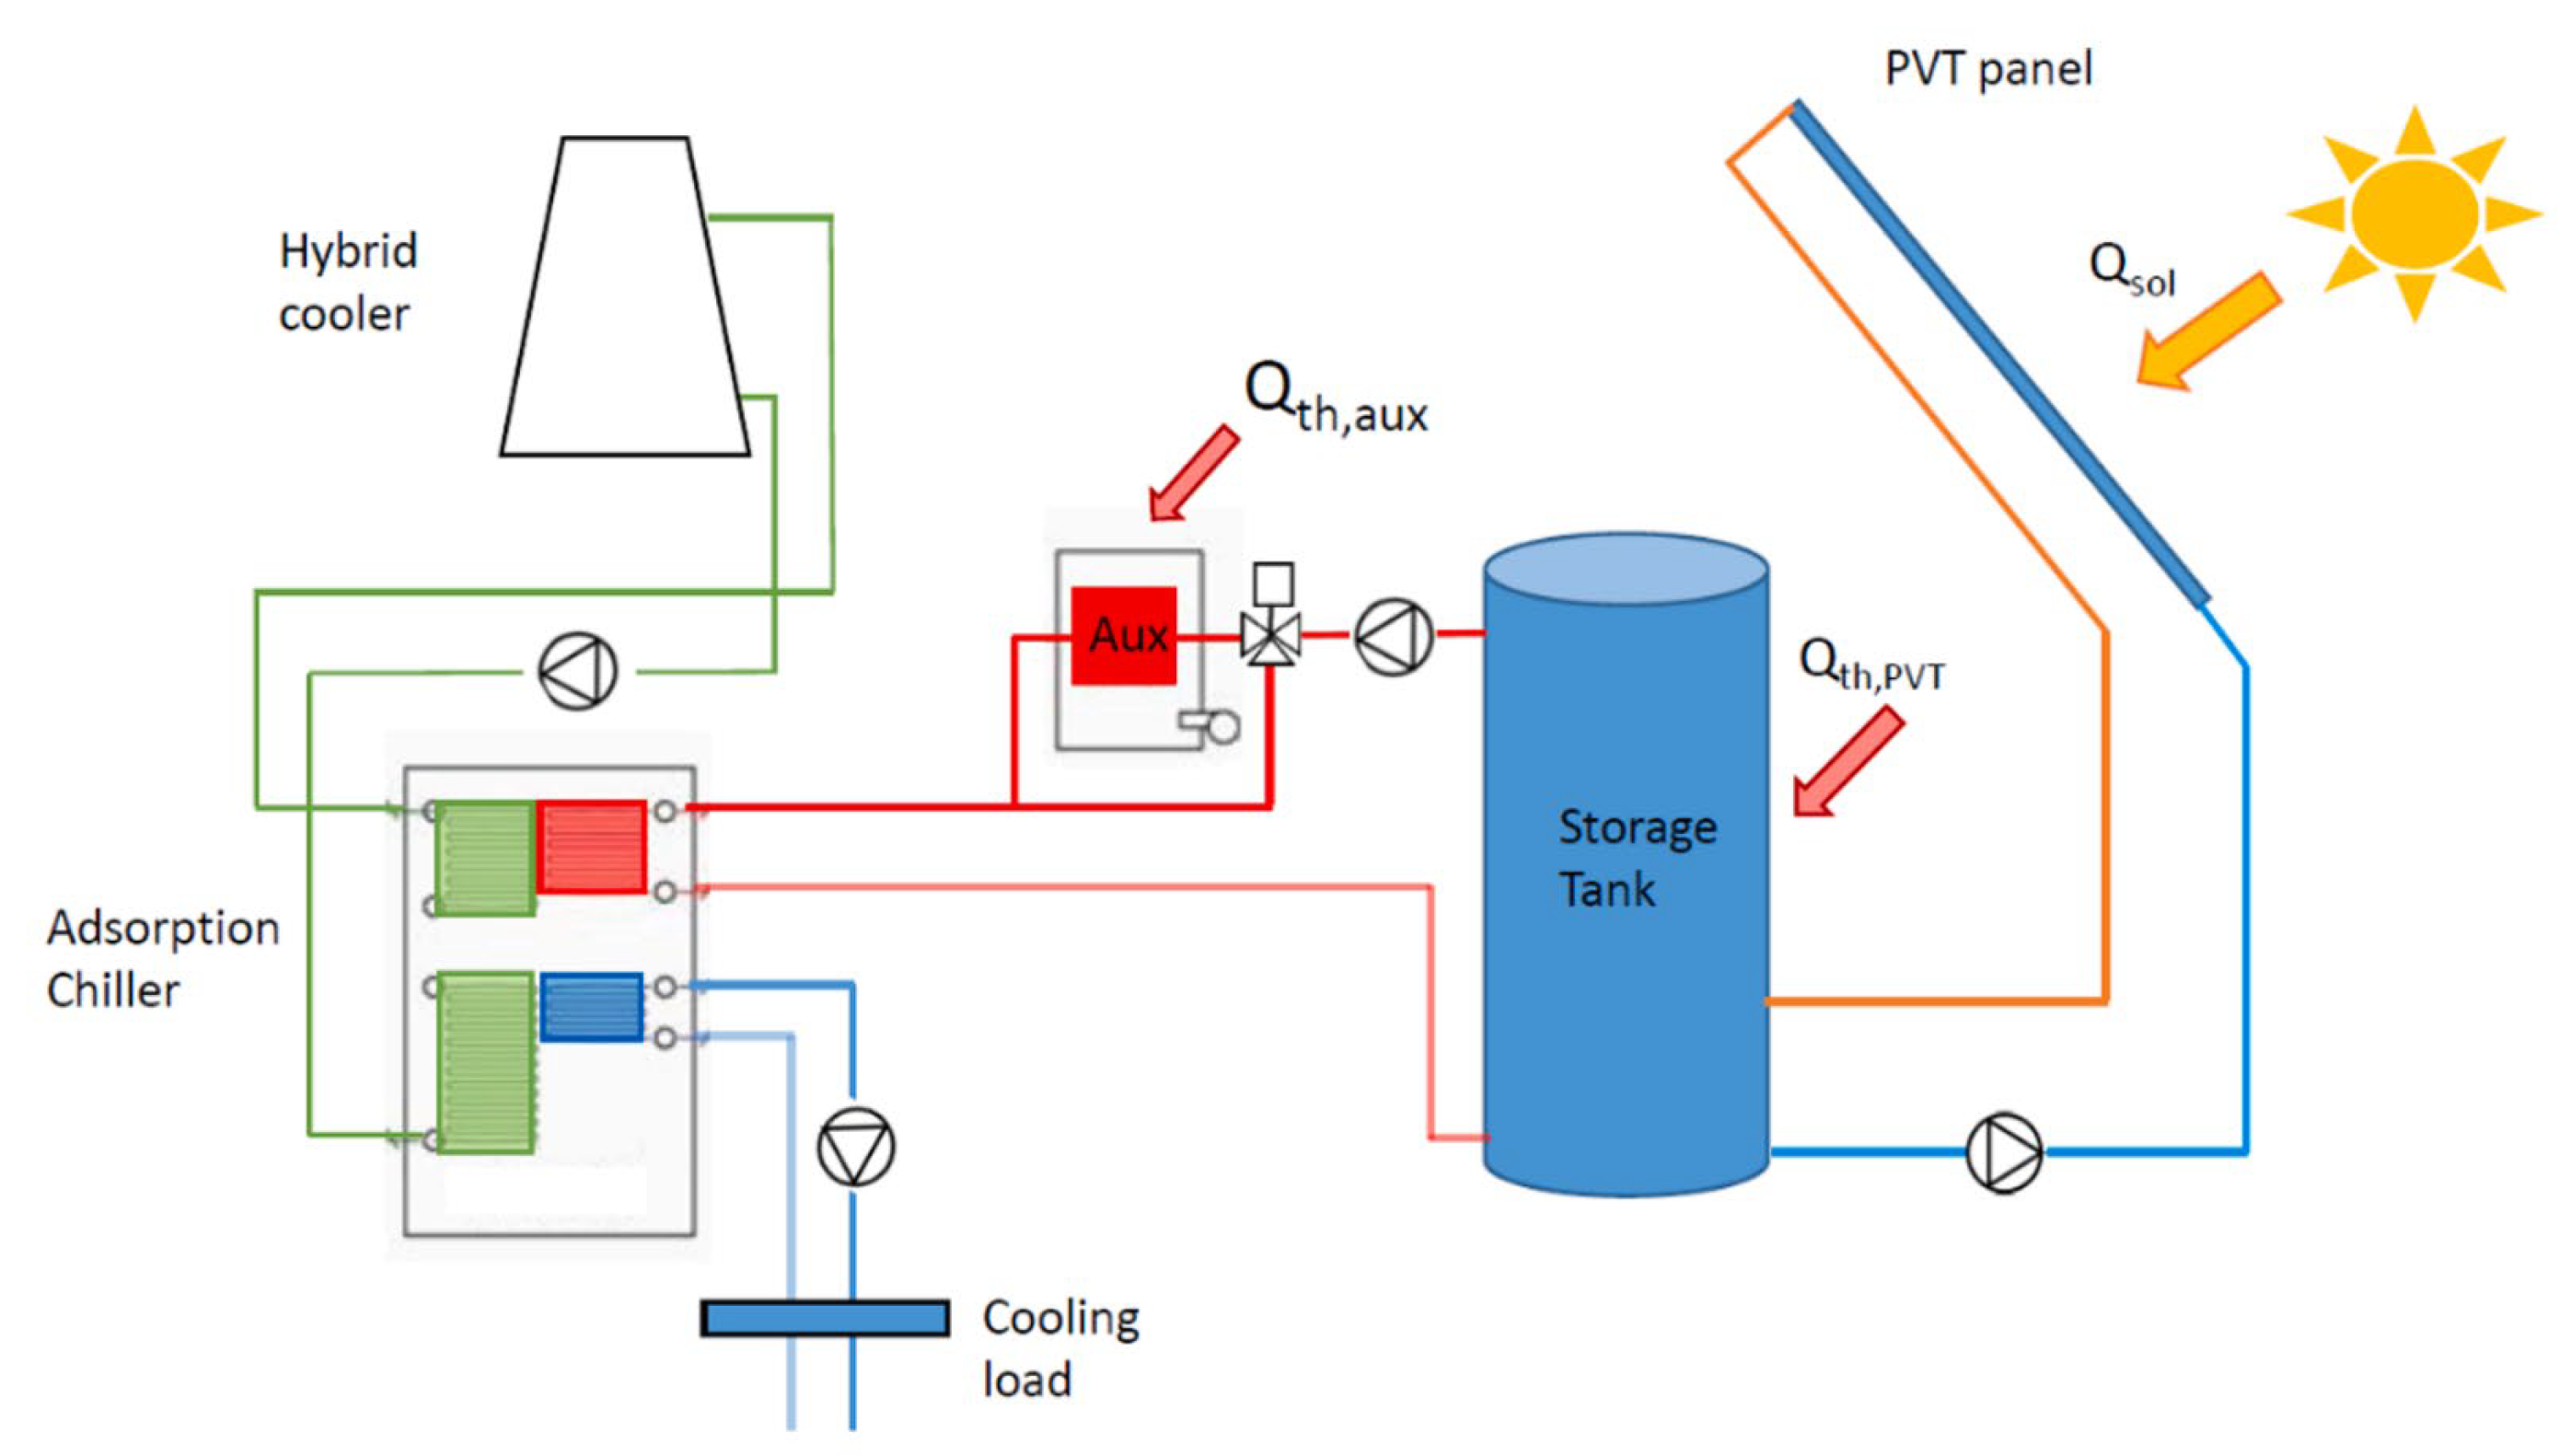
Aneli et al. [57] proposed an adsorption cooling system based on a PVT collector for the climatic conditions of the Mediterranean region and introduced an auxiliary heat source into the solar heating circuit to provide stable input when the solar irradiation is low. The schematic of the proposed system is shown in Figure 23. The results of the study show that the proposed system produces 2.3 to 4.5 kWh more electric power and 2.9 kWh less cooling capacity compared to the reference system.
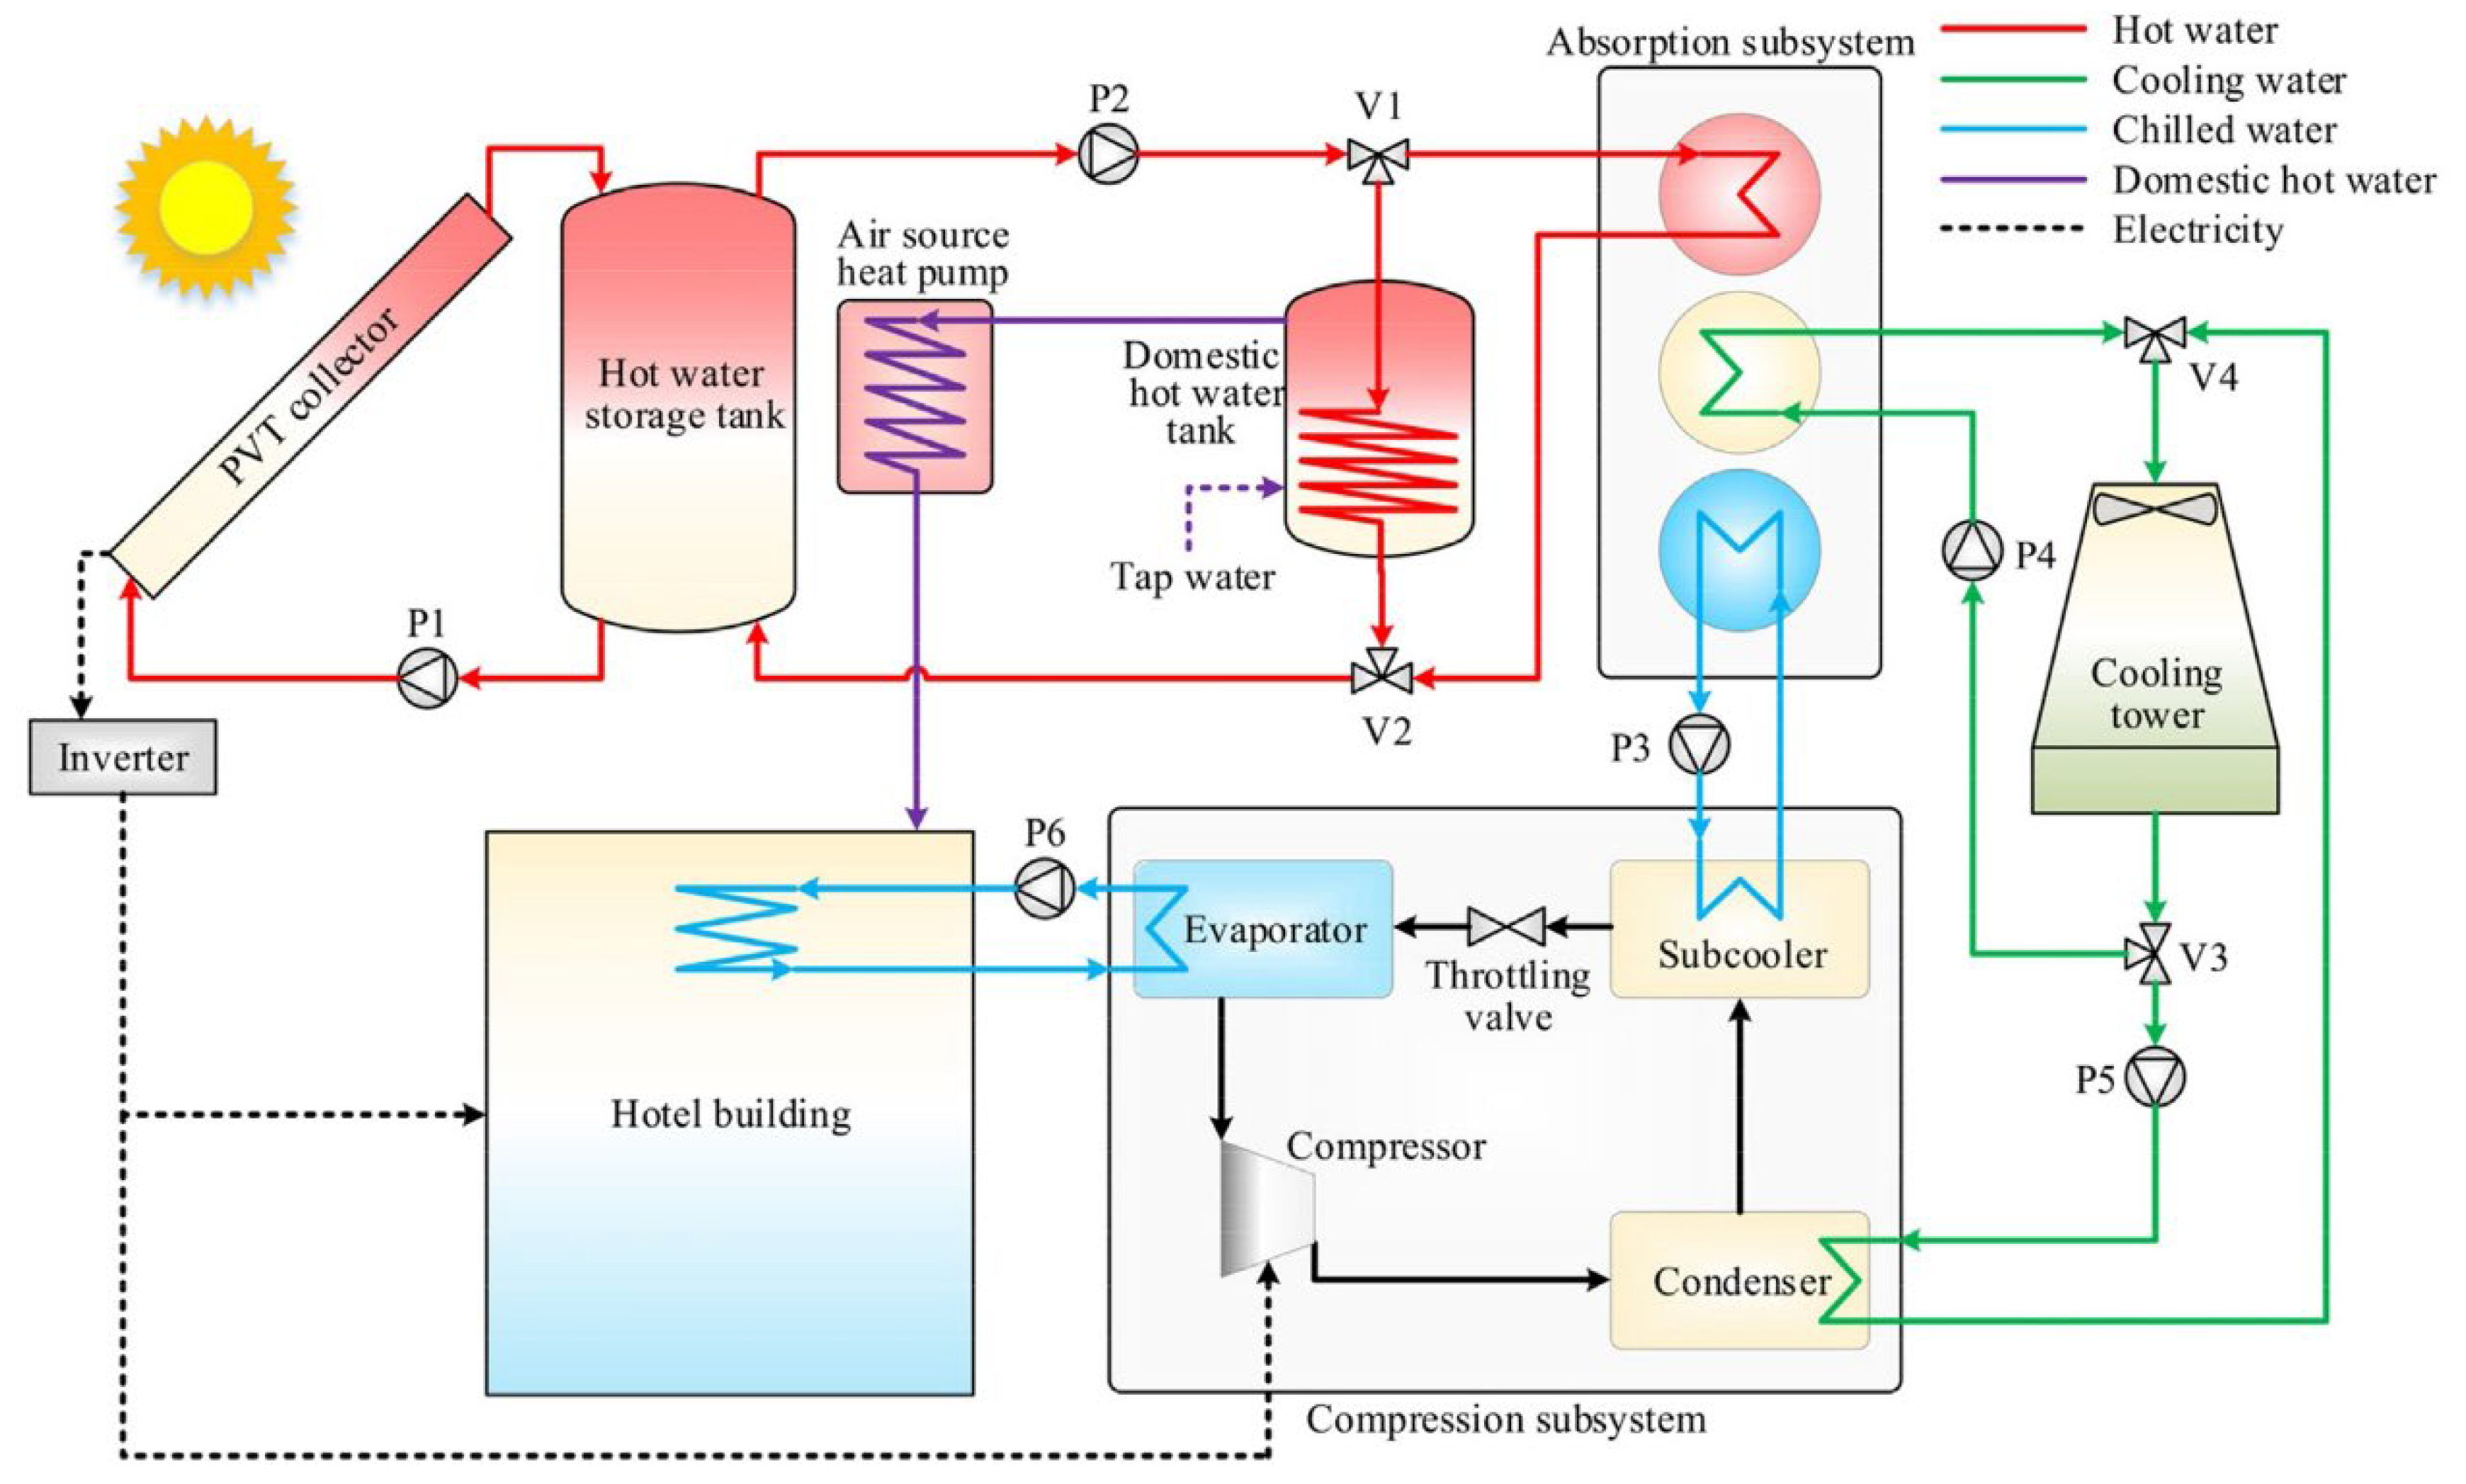
Li et al. [58] proposed a PVT-based absorption–subcooled compression trigeneration system applicable in three subtropical cities in China. The structure of the system is shown in Figure 24. During the cooling period and when the water temperature in the hot water storage tank is high enough (70 °C), the heat collected by the PVT collector is used to drive the absorption subsystem, and the cooling capacity produced is used to subcool the refrigerant in the compression subsystem, reducing the power consumption of the compressor. In addition, the compression subsystem is used to provide steady cooling to compensate for the intermittent operation of the absorption subsystem, while the power generated by the PVT collector is used to power the compressor. The results show that the absorption subsystem of the proposed system achieves an average annual COP of up to 0.615 and annual specific electricity savings of up to 170.6 kWh/m2, of which PV generation accounts for 108 kWh/m2.
Subsequently, Chen et al. [59] proposed three operation schemes (conventional, thermal storage, and cold storage) based on the trigeneration system in conjunction with time-of-use electricity pricing to achieve greater economic benefits. The structure of the system is shown in Figure 25 and Figure 26. The thermal storage scheme has the same structure as the conventional scheme, but the thermal storage scheme stores the heat collected by the PVT collector in the hot water storage tank and releases it during peak periods to drive an absorption chiller. The cold storage solution stores the cooling capacity produced by the absorption chillers in a cool water storage tank and releases it during peak electricity prices. This study shows that the system with the cold storage scheme has a significant advantage in terms of collector electrical efficiency, which is 17% higher than that of the system with the conventional scheme, and 10% higher than that of the conventional PV system. A comparison of the solar cooling systems driven by photovoltaic–thermal collectors is shown in Table 4.

5. Primary Concerns and Challenges

Solar cooling systems driven by photovoltaic-thermal collectors are becoming increasingly popular, owing to the wide-spread use of PV technologies, remarkable enhancement of solar energy utilization, and extensive cooling demand in summer. In addition, it will be cost-effective with the development of technology. A large amount of effort is being made to overcome the challenges of such systems, aiming to promote the large-scale commercial application.

5.1. Photovoltaic–Thermal Collectors

Photovoltaic-thermal collectors are one of the critical components of the system. They serve as the main power source for the entire layout, and hence the corresponding concern and challenge lies in the heat transfer enhancement.

5.1.1. Photovoltaic–Thermal Collectors with Innovative Heat Exchange Structure

The improvement of heat exchange structure is reducing the boundary layer and increasing the fluid mixing. Considering that increasing the contact area between the fluid and the absorber plate can enhance the heat transfer process, the main improvement is increasing the flow distance of fluid in the tube and modifying the cross-sectional geometry. For example, the shape and arrangement of flow channels have been developed by using spiral flow tubes and the new dual oscillating tubes. At the same time, geometries such as roll-bond, rectangle, and half-circle are applied to increase the contact area with the absorber plate. In addition, adding inserts to the flow channels increases fluid turbulence and intensifies partial fluid mixing to carry more heat.
One of the primary challenges is the lack of clarity in the evaluation of the enhanced electrical and thermal energy output of PVT systems due to structural improvements, because the structural modifications will lead to an increase in fluid turbulence, which will inevitably lead to an increase in fluid flow resistance, manifested as an increase in pumping power. It is particularly critical to evaluate how the incremental pumping power is relative to the incremental energy output of the PVT system after structural improvements are performed.
The second challenge is that when PVT collectors are applied to drive a thermally driven cooling system, it is not clear how the corresponding improvements in PVT collectors lead to the evaluation of the overall system in electrical, thermal, and cooling capacity. Because such systems contain multiple energy-conversion processes, the increase in thermal output of PVT collectors needs to undergo multiple energy conversions before it can be easily evaluated by researchers.

5.1.2. Photovoltaic–Thermal Collectors with Nanofluids

The addition of various nanofluids enhances the fluid characteristics. The physical properties of the nanoparticles and the base fluid determine the heat transfer characteristics of the configured nanofluid, so the mainstream nanoparticles are currently metals and their oxides and carbon nanotubes, etc., which have high thermal conductivity. Meanwhile, to further enhance the thermal output of nanofluids, hybrid nanofluids have attracted much attention. Researchers have added two or three types of nanoparticles to the base fluid to prepare hybrid nanofluids, and hybrid nanofluids have shown higher heat transfer performance. In addition, base fluids also severely affect the stability and absorption rate of nanofluids, and various types of vegetable oils are also employed as alternatives to conventional base fluids due to their higher thermal conductivity and environmental compatibility with biodegradability.
The first major challenge in the development of PVT systems using nanofluids is their unavoidable safety issue. Most nanofluids are toxic, which places limitations on their use in applications such as the food processing industry and large cold storage, which are the main applications for solar cooling systems.
Another challenge with nanofluids is their stability over long operating times. As the working time increases, the nanofluid will decompose internally and its uniformity will be affected, further affecting the thermal conductivity. At the same time, nanofluids are more corrosive to pipes than pure fluids; thus, this increases the risk of use and maintenance costs.

5.2. Thermally Driven Cooling Systems Utilizing Low-Temperature Heat Sources

Thermally driven cooling systems, involving the provision of cooling capacity by heat, are highly important for the layout performance. The efforts are made in two respects: one is to lower the heat source operation temperature and the other deals with the performance improvement via the internal heat recuperation. Considering the heat-rejection temperature depends on the environment one, the main approach to reducing the heat source’s working temperature lies in decreasing the pressure difference between evaporation and condensation processes and increasing the evaporator temperature, e.g., by supplementing the mechanical compressor between the evaporator/condenser and absorber/generator, as well as coupling the evaporation process of thermally driven chillers with the subcooling process of the vapor compression one. Along with the above-mentioned approach, mechanical recooling is employed to reduce the dissipated heat temperature to some extent, which is proposed by Huang et al. [50]. Additionally, the discharge heat of mechanical compressors is usually recovered by the generator to lower the heat consumption, e.g., like the layout presented by He et al. [43].
One of the primary challenges regarding the development of thermally driven chillers is the comprehensive assessment of thermodynamic performance, structure complexity, and investment cost. In other words, the system with moderate complexity and relatively low cost is promising. The considerable solution is based on the combined cycle consisting of an absorption and compression cooling portion, because it is easily available from the market. In this regard, the cycle based on the mass and energy coupling is favorable, since it is able to reduce the system complexity and cost, while the cycle based on the energy coupling is beneficial from the standpoint of system integration.
Another challenge of thermally driven chillers lies in their flexible operation. Since the installation area of PVT collectors is restricted by the building roof size, the cooling output produced through the solar heat is relatively small. Therefore, from the economic viewpoint, the utilization of solar heat in terms of the time-of-use electricity price is beneficial; i.e., the priority follows the peak, flat, and valley one. Consequently, it is required that the working fluid entering the heat-driven process is flexible in the chiller, as displayed by the system proposed by Wu et al. [41]. Nevertheless, the above-mentioned issue lacks adequate attention, and a such cycle is still rare.

5.3. Solar Cooling Systems Driven by Photovoltaic–Thermal Collectors

A large amount effort contributes to the optimization of design and operation, such as setting the key parameters, as well as working strategy, with respect to the fact that the performance of solar refrigeration systems coupled with PVT collectors seriously relies on it. In this regard, much attention is paid to the scale of the collector and storage tank, chiller set point temperature, and size, as well as hot water flow rate, which aims to achieve a reasonable tradeoff of incomes from the solar heat and PV utilization. Note that the coordination of solar heat and PV utilization is difficult because both are dependent upon the PV cell temperature; i.e., the elevated temperature is favorable for the solar heat utilization but adverse for the PV process. In addition to the above-mentioned issue, the study also concerns the system feasibility and potential for different cities.
The first challenge lies in lacking the prototype experiment and the poor amount of operation data. It is found that most investigations regarding the solar refrigeration system coupled with PVT collectors is performed theoretically, which is incapable of realizing and understanding the system working characteristic exactly. Accordingly, it is difficult to make a really reasonable control strategy due to the lack of operation experience. The second challenge is the unsure cost of PVT collectors, leading to the fact that the evaluation data of the system deviates from the actual situation to some extent. PVT collectors are not mature products in the market, and their prices mainly come from various sources. In this regard, it is inevitable that the cost for different sources deviates from each other, because of the difference in local market price and labor cost. The layout potential is likely to be overestimated in the case of notable differences in the local situation and the cited source.

6. Recommendations and Future Outlook

  • Since electrical energy is a high-grade energy source and the energy output of PVT collectors is primarily determined by PV generation, the goal of PVT collector modifications should be to increase the thermal energy output as much as possible while not sacrificing electrical energy output. Additionally, when the PVT collector is employed to drive a thermally driven cooling system, the performance improvement in the modified PVT collectors for the overall cooling system is ultimately reflected in the electrical energy savings.
  • Since the solar cooling layout driven by PVT collectors usually serves as the distributed system and the collector installation area is limited by building roof size, the cooling demand is inevitably met with the aid of the power grid. Thereby, the combination of the heat-driven process and the vapor compression one in the entire cycle is necessary. In this regard, the mass and energy coupling of the heat-driven process and the vapor compression one is beneficial to reduce the complexity of thermally driven hybrid chillers. Taking into account the coordination of the PV and thermal efficiencies, the heat source’s working temperature of the refrigeration cycle must come down to below 60 °C. Furthermore, the refrigeration cycle with the flexible allocation of heat consumption in a certain cooling demand is favorable from the economic viewpoint, e.g., through the time-of-use electricity price, to enhance the profitability.
  • There is an urgent need to develop the prototype and exactly analyze the operation characteristic by means of experiment. The system design and operation optimization should be carried out based on the experiment data. Additionally, the cost of PVT collectors should be considered exactly in the assessment of system potential in order to avoid overestimation.

7. Conclusions

This paper provides an updated review of recent developments in solar cooling systems, focusing on the technological improvements made to PVT collectors, performance improvements, the expansion of the lower temperature limits of thermally driven cooling systems, and energy savings achieved by PVT collector-based solar cooling systems, which together help researchers to select the most appropriate solar cooling system configuration. Therefore, the following findings were made.
  • The utilization of a coolant with high thermal conductivity and the proposed heat sink structure resulted in a more uniform temperature distribution of the PVT collector and the maintenance of a stable electrical energy conversion efficiency, with a thermal efficiency improvement of 12.2–68.5%. Although certain designs lead to an increase in pressure drop, this does not have a large impact on the electrical efficiency of the PVT collector in the range of operating conditions studied.
  • The hybrid nanofluid used, due to its higher thermal conductivity, can transfer heat from the PV module more efficiently, which helps the PVT to achieve higher electrical and thermal outputs. In the reviewed literature, PVT systems with nanofluids have displayed improvements in electrical efficiency of 1.9–11% and thermal efficiency by 1.9–22.02%, compared to conventional PV systems and water-based PVT systems, respectively.
  • The lower limit of the driving temperature of the novel thermally driven cooling system has been extended by 4–20 °C, depending on the type of thermally driven cooling system under study, which was mainly achieved using thermal and mechanical two-stage compression or cascade cooling. Here, the lower limit of the driving temperature of the adsorption cycle was extended by 20 °C, reaching 40–50 °C. In contrast, the lower limit of the driving temperature of the absorption cycle was extended by 4 °C, reaching 70 °C.
  • Solar cooling systems are mainly PVT-driven adsorption cooling systems and PVT-driven absorption systems. The adsorptive system driven by PVT collectors has a maximum power production of 81.7 kWh per day, a maximum COP of 2.1, and a minimum payback period of 8.45 years. The absorption system driven by the PVT system, on the other hand, achieves a better cooling performance, with a maximum COP of 0.615 and annual electricity cost savings of CNY 109,080, and with a minimum payback period of 9.3 years.
  • The improved economic features and adaptability to solar radiation of absorption–subcooled compression cooling systems make their further development in solar cooling systems more promising.

Author Contributions

Investigation, C.J.; writing—original draft, C.J.; writing—review and editing, Z.L. All authors have read and agreed to the published version of the manuscript.

Funding

This research was funded by (National Foreign Expert Project) grant number (G2022163009L), (Natural Science Foundation of Guangdong Province) grant number (2023A1515011337), (Zhuhai Industry-University-Research Cooperation Project) grant number (ZH22017001210017PWC), and (Key Laboratory of Efficient and Clean Energy Utilization of Guangdong Higher Education Institutes) grant number (KLB10004).

Data Availability Statement

Data are contained within the articles.

Conflicts of Interest

The authors declare no conflict of interest.

References

  1. Sur, A.; Das, R.K. Review on solar adsorption refrigeration cycle. Int. J. Mech. Eng. Technol. 2010, 1, 190–226. [Google Scholar]
  2. Ritchie, H.; Roser, M.; Rosado, P. Energy. Available online: https://ourworldindata.org/energy (accessed on 1 March 2022).
  3. Browne, M.C.; Norton, B.; McCormack, S.J. Heat retention of a photovoltaic/thermal collector with PCM. Sol. Energy 2016, 133, 533–548. [Google Scholar] [CrossRef] [Green Version]
  4. Skoplaki, E.; Palyvos, J.A. On the temperature dependence of photovoltaic module electrical performance: A review of efficiency/power correlations. Sol. Energy 2009, 83, 614–624. [Google Scholar] [CrossRef]
  5. Singh, I.; Singh, D.; Singh, M. Thermal Modeling and Performance Evaluation of Photovoltaic Thermal (PV/T) Systems: A Parametric Study. Int. J. Green Energy 2019, 16, 483–489. [Google Scholar] [CrossRef]
  6. Hocine, H.; Touafek, K.; Kerrour, F. Theoretical and experimental study of new configuration of PVT collector. J. Sol. Energy Eng. 2016, 139, 021012. [Google Scholar] [CrossRef]
  7. Beccali, M.; Finocchiaro, P.; Nocke, B. Energy and economic assessment of desiccant cooling systems coupled with single glazed air and hybrid PV/thermal solar collectors for applications in hot and humid climate. Sol. Energy 2009, 83, 1828–1846. [Google Scholar] [CrossRef]
  8. Calise, F.; d’Accadia, M.D.; Vanoli, L. Design and dynamic simulation of a novel solar trigeneration system based on hybrid photovoltaic/thermal collectors (PVT). Energy Convers. Manag. 2012, 60, 214–225. [Google Scholar] [CrossRef]
  9. Buonomano, A.; Calise, F.; Palombo, A. Solar heating and cooling systems by absorption and adsorption chillers driven by stationary and concentrating photovoltaic/thermal solar collectors: Modelling and simulation. Renew. Sustain. Energy Rev. 2018, 81, 1112–1146. [Google Scholar] [CrossRef]
  10. Al-Waeli, A.H.A.; Kazem, H.A.; Chaichan, M.T.; Sopian, K. The Impact of Climatic Conditions on PV/PVT Outcomes. In Photovoltaic/Thermal (PV/T) Systems: Principles, Design, and Applications; Springer International Publishing: Cham, Switzerland, 2019; pp. 173–222. [Google Scholar]
  11. Boumaaraf, B.; Boumaaraf, H.; Slimani, M.E.-A.; Tchoketch-Kebir, S.; Ait-Cheikh, M.S.; Touafek, K. Performance evaluation of a locally modified PV module to a PV/T solar collector under climatic conditions of semi-arid region. Math. Comput. Simul. 2020, 167, 135–154. [Google Scholar] [CrossRef]
  12. Ma, X.; Qiu, T.; Lv, J.; Shi, Q.; Meng, D. Performance investigation of an iron scrap filled tube-plate PV/T system. Energy Sustain. Dev. 2020, 58, 196–208. [Google Scholar] [CrossRef]
  13. Kazem, H.A.; Al-Waeli, A.H.A.; Chaichan, M.T.; Al-Waeli, K.H.; Al-Aasam, A.B.; Sopian, K. Evaluation and comparison of different flow configurations PVT systems in Oman: A numerical and experimental investigation. Sol. Energy 2020, 208, 58–88. [Google Scholar] [CrossRef]
  14. Misha, S.; Abdullah, A.L.; Tamaldin, N.; Rosli, M.A.M.; Sachit, F.A. Simulation CFD and experimental investigation of PVT water system under natural Malaysian weather conditions. Energy Rep. 2020, 6, 28–44. [Google Scholar] [CrossRef]
  15. Kianifard, S.; Zamen, M.; Nejad, A.A. Modeling, designing and fabrication of a novel PV/T cooling system using half pipe. J. Clean. Prod. 2020, 253, 119972. [Google Scholar] [CrossRef]
  16. Hissouf, M.; Feddaoui, M.; Najim, M.; Charef, A. Performance of a photovoltaic–thermal solar collector using two types of working fluids at different fluid channels geometry. Renew. Energy 2020, 162, 1723–1734. [Google Scholar] [CrossRef]
  17. Poredos, P.; Tomc, U.; Petelin, N.; Vidrih, B.; Flisar, U.; Kitanovski, A. Numerical and experimental investigation of the energy and exergy performance of solar thermal, photovoltaic and photovoltaic–thermal modules based on roll-bond heat exchangers. Energy Convers. Manag. 2020, 210, 112674. [Google Scholar] [CrossRef]
  18. Pang, W.; Zhang, Y.; Duck, B.C.; Yu, H.; Song, X.; Yan, H. Cross sectional geometries effect on the energy efficiency of a photovoltaic thermal module: Numerical simulation and experimental validation. Energy 2020, 209, 118439. [Google Scholar] [CrossRef]
  19. Shahsavar, A.; Jha, P.; Arici, M.; Nizetic, S.; Ma, Z. Energetic and exergetic performances of a nanofluid-based photovoltaic/thermal system equipped with a sheet-and-grooved serpentine tube collector: Indoor experimental tests. Sol. Energy 2021, 225, 918–933. [Google Scholar] [CrossRef]
  20. Ramdani, H.; Ould-Lahoucine, C. Study on the overall energy and exergy performances of a novel water-based hybrid photovoltaic–thermal solar collector. Energy Convers. Manag. 2020, 222, 113238. [Google Scholar] [CrossRef]
  21. Maadi, S.R.; Sabzali, H.; Kolahan, A.; Wood, D. Improving the performance of PV/T systems by using conical-leaf inserts in the coolant tubes. Sol. Energy 2020, 212, 84–100. [Google Scholar] [CrossRef]
  22. Maadi, S.R.; Navegi, A.; Solomin, E.; Ahn, H.S.; Wongwises, S.; Mahian, O. Performance improvement of a photovoltaic–thermal system using a wavy-strip insert with and without nanofluid. Energy 2021, 234, 121190. [Google Scholar] [CrossRef]
  23. Kalateh, M.R.; Kianifar, A.; Sardarabadi, M. Energy, exergy, and entropy generation analyses of a water-based photovoltaic thermal system, equipped with clockwise counter-clockwise twisted tapes: An indoor experimental study. Appl. Therm. Eng. 2022, 215, 118906. [Google Scholar] [CrossRef]
  24. Ould-Lahoucine, C.; Ramdani, H.; Zied, D. Energy and exergy performances of a TiO2-water nanofluid-based hybrid photovoltaic/thermal collector and a proposed new method to determine the optimal height of the rectangular cooling channel. Sol. Energy 2021, 221, 292–306. [Google Scholar] [CrossRef]
  25. Menon, G.S.; Murali, S.; Elias, J.; Delfiya, D.A.; Alfiya, P.; Samuel, M.P. Experimental investigations on unglazed photovoltaic–thermal (PVT) system using water and nanofluid cooling medium. Renew. Energy 2022, 188, 986–996. [Google Scholar] [CrossRef]
  26. Shahsavar, A.; Jha, P.; Arici, M.; Kefayati, G. A comparative experimental investigation of energetic and exergetic performances of water/magnetite nanofluid-based photovoltaic/thermal system equipped with finned and unfinned collectors. Energy 2021, 220, 119714. [Google Scholar] [CrossRef]
  27. Hissouf, M.; Feddaoui, M.; Najim, M.; Charef, A. Numerical study of a covered Photovoltaic–thermal Collector (PVT) enhancement using nanofluids. Sol. Energy 2020, 199, 115–127. [Google Scholar] [CrossRef]
  28. Jia, Y.; Ran, F.; Zhu, C.; Fang, G. Numerical analysis of photovoltaic–thermal collector using nanofluid as a coolant. Sol. Energy 2020, 196, 625–636. [Google Scholar] [CrossRef]
  29. Alsalame, H.A.M.; Lee, J.H.; Lee, G.H. Performance Evaluation of a Photovoltaic Thermal (PVT) system using nanofluids. Energies 2021, 14, 301. [Google Scholar] [CrossRef]
  30. Moravej, M.; Noghrehabadi, A.; Esmaeilinasab, A.; Khajehpour, E. The effect of SiO2 nanoparticle on the performance of photovoltaic thermal system: Experimental and Theoretical approach. J. Heat Mass Transf. Res. 2020, 7, 11–24. [Google Scholar]
  31. Gelis, K.; Celik, A.N.; Ozbek, K.; Ozyurt, O. Experimental investigation into efficiency of SiO2/water-based nanofluids in photovoltaic thermal systems using response surface methodology. Sol. Energy 2022, 235, 229–241. [Google Scholar] [CrossRef]
  32. Sreekumar, S.; Shah, N.; Mondol, J.D.; Hewitt, N.; Chakrabarti, S. Numerical investigation and feasibility study on MXene/water nanofluid based photovoltaic/thermal system. Clean. Energy Syst. 2022, 2, 100010. [Google Scholar] [CrossRef]
  33. Rahmanian, S.; Hamzavi, A. Effects of pump power on performance analysis of photovoltaic thermal system using CNT nanofluid. Sol. Energy 2020, 201, 787–797. [Google Scholar] [CrossRef]
  34. Karaaslan, I.; Menlik, T. Numerical study of a photovoltaic thermal (PV/T) system using mono and hybrid nanofluid. Sol. Energy 2021, 224, 1260–1270. [Google Scholar] [CrossRef]
  35. Hooshmandzade, N.; Motevali, A.; Seyedi, S.R.M.; Biparva, P. Influence of single and hybrid water-based nanofluids on performance of microgrid photovoltaic/thermal system. Appl. Energy 2021, 304, 117769. [Google Scholar] [CrossRef]
  36. Kazemian, A.; Salari, A.; Ma, T.; Lu, H. Application of hybrid nanofluids in a novel combined photovoltaic/thermal and solar collector system. Sol. Energy 2022, 239, 102–116. [Google Scholar] [CrossRef]
  37. Adun, H.; Adedeji, M.; Ruwa, T.; Senol, M.; Kavaz, D.; Dagbasi, M. Energy, exergy, economic, environmental (4E) approach to assessing the performance of a photovoltaic–thermal system using a novel ternary nanofluid. Sustain. Energy Technol. Assess. 2022, 50, 101804. [Google Scholar] [CrossRef]
  38. Rubbi, F.; Habib, K.; Saidur, R.; Aslfattahi, N.; Yahya, S.M.; Das, L. Performance optimization of a hybrid PV/T solar system using Soybean oil/MXene nanofluids as a new class of heat transfer fluids. Sol. Energy 2020, 208, 124–138. [Google Scholar] [CrossRef]
  39. Samylingam, L.; Aslfattahi, N.; Saidur, R.; Yahya, S.M.; Afzal, A.; Arifutzzaman, A.; Tan, K.H.; Kadirgama, K. Thermal and energy performance improvement of hybrid PV/T system by using olein palm oil with MXene as a new class of heat transfer fluid. Sol. Energy Mater. Sol. Cells 2020, 218, 110754. [Google Scholar] [CrossRef]
  40. Wu, W.; Leung, M.; Ding, Z.; Huang, H.; Bai, Y.; Deng, L. Comparative analysis of conventional and low-GWP refrigerants with ionic liquid used for compression-assisted absorption cooling cycles. Appl. Therm. Eng. 2020, 172, 115145. [Google Scholar] [CrossRef]
  41. Wu, W.; Leung, M. Transient and seasonal performance evaluation of a novel flexible heat pump for solar cooling. Energy Convers. Manag. 2020, 223, 113269. [Google Scholar] [CrossRef]
  42. Sun, Y.; Di, G.; Wang, J.; Wang, X.; Wu, W. Performance analysis of R1234yf/ionic liquid working fluids for single-effect and compression-assisted absorption refrigeration systems. Int. J. Refrig. 2020, 109, 25–36. [Google Scholar] [CrossRef]
  43. He, Y.; Jiang, Y.; Fan, Y.; Chen, G.; Tang, L. Utilization of ultra-low temperature heat by a novel cascade refrigeration system with environmentally-friendly refrigerants. Renew. Energy 2020, 157, 204–213. [Google Scholar] [CrossRef]
  44. Nikbakhti, R.; Wang, X.; Chan, A. Performance optimization of an integrated adsorption-absorption cooling system driven by low-grade thermal energy. Appl. Therm. Eng. 2021, 193, 117035. [Google Scholar] [CrossRef]
  45. Nikbakhti, R.; Iranmanesh, A. Potential application of a novel integrated adsorption–absorption refrigeration system powered with solar energy in Australia. Appl. Therm. Eng. 2021, 194, 117114. [Google Scholar] [CrossRef]
  46. Zeng, J.; Li, Z.; Peng, Z. Advanced exergy analysis of solar absorption-subcooled compression hybrid cooling system. Int. J. Green Energy 2022, 19, 219–241. [Google Scholar] [CrossRef]
  47. Gao, P.; Wang, L.; Zhu, F. A novel hybrid solid sorption-compression refrigeration technology for refrigerated transportation and storage. Int. J. Refrig. 2021, 122, 1–10. [Google Scholar] [CrossRef]
  48. Zhang, X.; Cai, L.; Chen, T.; Zhang, X. Performance analysis of a novel compression-assisted absorption power and refrigeration system with selected 1, 1-difluoroethane/ionic liquid. J. Clean. Prod. 2022, 340, 130856. [Google Scholar] [CrossRef]
  49. Hu, Z.; Wan, Y.; Zhang, C.; Chen, Y. Compression-assisted absorption refrigeration using ocean thermal energy. Renew. Energy 2022, 186, 755–768. [Google Scholar] [CrossRef]
  50. Huang, C.; Li, Z.; Ye, Z.; Wang, R. Thermodynamic study of carbon dioxide transcritical refrigeration cycle with dedicated subcooling and cascade recooling. Int. J. Refrig. 2022, 137, 80–90. [Google Scholar] [CrossRef]
  51. Kumar, A.; Modi, A. Thermodynamic analysis of novel ejector-assisted vapour absorption-resorption refrigeration systems. Energy 2022, 244, 123154. [Google Scholar] [CrossRef]
  52. Hassan, A.A.; Elwardany, A.E.; Ookawara, S.; El-Sharkawy, I.I. Performance investigation of integrated PVT/adsorption cooling system under the climate conditions of Middle East. Energy Rep. 2020, 6, 168–173. [Google Scholar] [CrossRef]
  53. Hassan, A.A.; Elwardany, A.E.; Ookawara, S.; El-Sharkawy, I.I. Performance investigation of a solar-powered adsorption-based trigeneration system for cooling, electricity, and domestic hot water production. Appl. Therm. Eng. 2021, 199, 117553. [Google Scholar] [CrossRef]
  54. Hassan, A.A.; Elwardany, A.E.; Ookawara, S.; Sekiguchi, H.; Hassan, H. Energy, exergy, economic and environmental (4E) assessment of hybrid solar system powering adsorption-parallel/series ORC multigeneration system. Process Saf. Environ. Prot. 2022, 164, 761–780. [Google Scholar] [CrossRef]
  55. Gado, M.G.; Nada, S.; Ookawara, S.; Hassan, H. Energy management of standalone cascaded adsorption-compression refrigeration system using hybrid biomass-solar-wind energies. Energy Convers. Manag. 2022, 258, 115387. [Google Scholar] [CrossRef]
  56. Gado, M.G.; Ookawara, S.; Nada, S.; Hassan, H. Renewable energy-based cascade adsorption-compression refrigeration system: Energy, exergy, exergoeconomic and enviroeconomic perspectives. Energy 2022, 253, 124127. [Google Scholar] [CrossRef]
  57. Aneli, S.; Gagliano, A.; Tina, G.M.; Ilis, G.G.; Demir, H. Effectiveness and constraints of using PV/Thermal collectors for heat-driven chillers. Appl. Therm. Eng. 2022, 210, 118330. [Google Scholar] [CrossRef]
  58. Li, Z.; Chen, H.; Xu, Y.; Ooi, K.T. Comprehensive evaluation of low-grade solar trigeneration system by photovoltaic-thermal collectors. Energy Convers. Manag. 2020, 215, 112895. [Google Scholar] [CrossRef]
  59. Chen, H.; Li, Z.; Xu, Y. Assessment and parametric analysis of solar trigeneration system integrating photovoltaic thermal collectors with thermal energy storage under time-of-use electricity pricing. Sol. Energy 2020, 206, 875–899. [Google Scholar] [CrossRef]
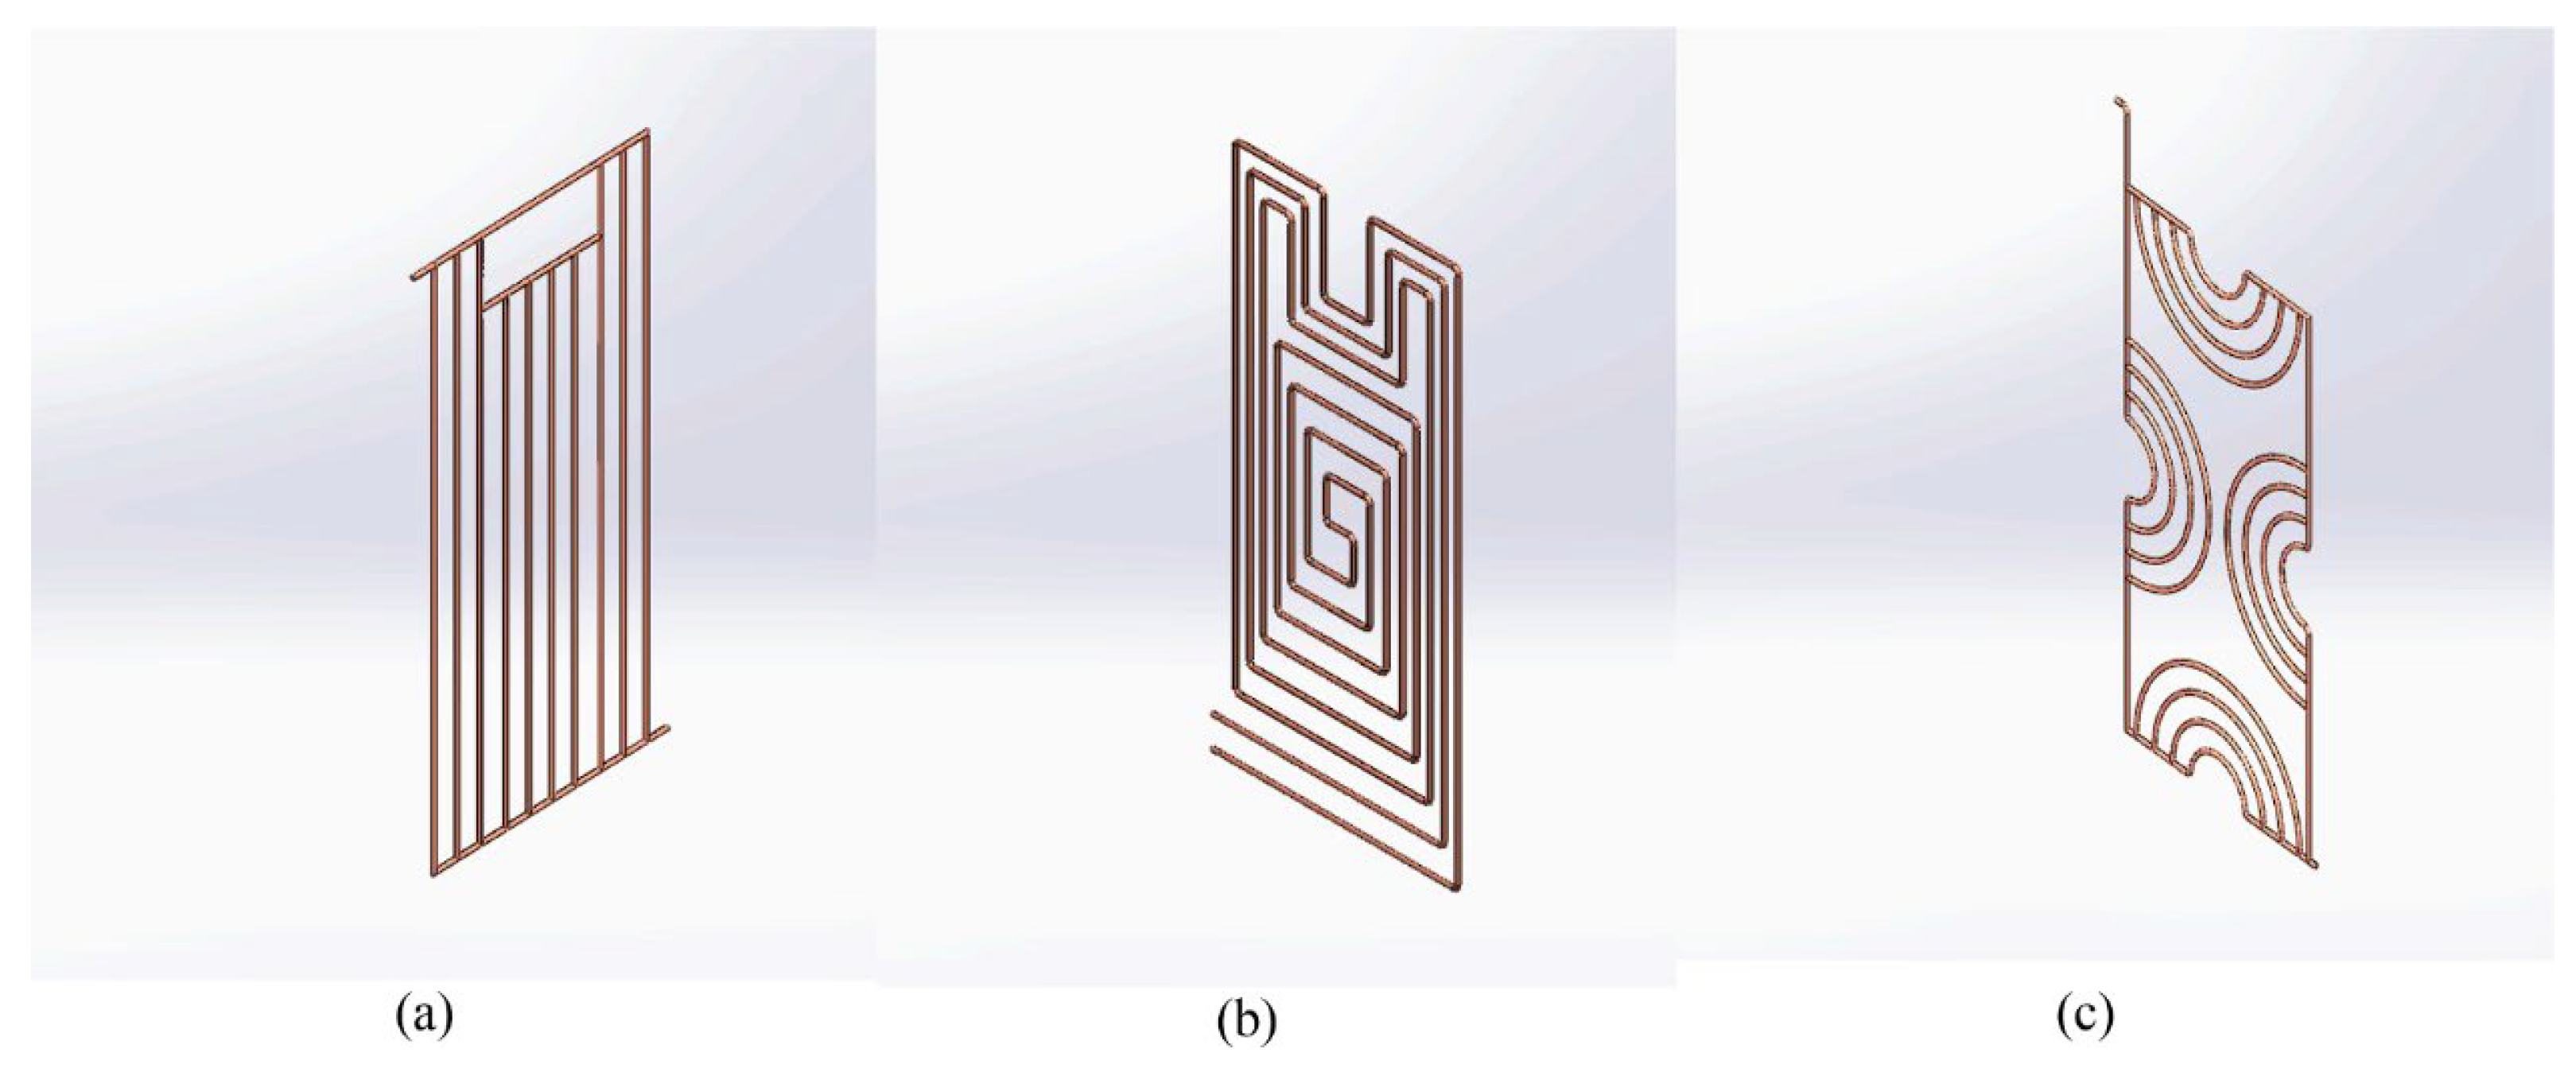
Figure 1. (a) Direct flow tube, (b) spiral flow tube, and (c) web flow tube [13]. Reprinted with permission from Ref. [13]. 2020, Hussein A. Kazem.
Energies 16 05331 g001
Figure 2. Schematic diagram of three flow channel of the PVT system. (a) Serial, (b) parallel, and (c) bionic. (d) The dimensions of the absorbers. Reproduced from [17], Elsevier 2020.
Energies 16 05331 g002
Figure 3. Cross-sections of the PV and PVT modules: (a) commercial PV module; (b) conventional PVT module; (c) new PVT module with rectangle geometry; (d) new PVT module with arch geometry. Reproduced from [18], Elsevier 2020.
Energies 16 05331 g003
Figure 4. (a) Cross-sectional view of the new hybrid water-based PVT solar collector and (b) spectral variations in the solar ATM 1.5, single-crystalline Si response, and water absorption coefficient. Reproduced from [20], Elsevier 2020.
Energies 16 05331 g004
Figure 5. (a) Schematic diagram of the base conical-leaf insert in the tube [21], (b) the wavy insert used in [22], (c) and the twisted tapes used in [23]. Reproduced from [23], Elsevier 2022.
Energies 16 05331 g005
Figure 6. Scheme of the compression-assisted absorption cooling cycles proposed in [40]. Reproduced from [40], Elsevier 2020.
Energies 16 05331 g006
Figure 7. Schematic diagram of the novel solar-powered flexible hybrid-energy heat pump [41]. Reproduced from [41], Elsevier 2020.
Energies 16 05331 g007
Figure 8. The principle of compression-assisted absorption cooling cycles. Reproduced from [42], Elsevier 2020.
Energies 16 05331 g008
Figure 9. Schematic diagram of the novel VAS and VCS cascade cooling system. Reproduced from [43], Elsevier 2020.
Energies 16 05331 g009
Figure 10. Schematic diagram of the integrated adsorption–absorption cooling system. Reproduced from [44], Elsevier 2021.
Energies 16 05331 g010
Figure 11. Schematic diagram of the novel integrated adsorption–absorption cooling system. Reproduced from [45], Elsevier 2021.
Energies 16 05331 g011
Figure 12. The principle of the solar absorption-subcooled compression hybrid cooling system. Reproduced from [46], Taylor and Francis Ltd. 2022.
Energies 16 05331 g012
Figure 13. Schematic diagram of the novel hybrid solid sorption-compression refrigeration cycle with intercooler. Reproduced from [47], Elsevier 2021.
Energies 16 05331 g013
Figure 14. Schematic diagram of the novel compression-assisted absorption cooling system with a kalina cycle. Reproduced from [48], Elsevier 2022.
Energies 16 05331 g014
Figure 15. Schematic diagram of the compression-assisted absorption cooling systems. Reproduced from [49], Elsevier 2022.
Energies 16 05331 g015
Figure 16. Schematic diagram of the CO2 transcritical cooling cycle integrated dedicated subcooling subcycle and recooling subcycle. Reproduced from [50], Elsevier 2022.
Energies 16 05331 g016
Figure 17. Schematic diagram of the first configuration (C1) of the ejector-assisted VAR cooling cycle. Reproduced from [51], Elsevier 2022.
Energies 16 05331 g017
Figure 18. Schematic diagram of the second configuration (C2) of the ejector-assisted VAR cooling cycle. Reproduced from [51], Elsevier 2022.
Energies 16 05331 g018
Figure 19. Schematic diagram of the third configuration (C3) of the ejector-assisted VAR cooling cycle. Reproduced from [51], Elsevier 2022.
Energies 16 05331 g019
Figure 20. Schematic diagram of the integrated solar-powered cooling system. Reproduced from [52], Elsevier 2020.
Energies 16 05331 g020
Figure 21. Schematic diagram of the solar-powered adsorption-based trigeneration system. Reproduced from [53], Elsevier 2021.
Energies 16 05331 g021
Figure 22. Schematic diagram of the cascade adsorption–compression cooling system based on biomass–solar–wind energy system. Reproduced from [55], Elsevier 2021.
Energies 16 05331 g022
Figure 23. Schematic diagram adsorption chiller based on PVT collector. Reproduced from [57], Elsevier 2022.
Energies 16 05331 g023
Figure 24. Schematic diagram of the absorption–subcooled compression trigeneration system driven by PVT collectors. Reproduced from [58], Elsevier 2020.
Energies 16 05331 g024
Figure 25. Schematic diagram of the absorption–subcooled compression trigeneration system layout using conventional operation scheme and heat energy storage scheme. Reproduced from [59], Elsevier 2020.
Energies 16 05331 g025
Figure 26. Schematic diagram of the absorption–subcooled compression trigeneration system layout using cool energy storage scheme. Reproduced from [59], Elsevier 2020.
Energies 16 05331 g026
Table 1. Comparison of improvements yielded by PVT collector heat sink structures.
Ref.N/EFlow Channel TypeCross-Sectional Shape/Insert TypeEfficiencyWorking FluidFlow RateKey Findings
ElectricalThermalTotal
[11]NSerpentineCircle7%61%79.43%Water-
  • The thermal power is up to 261 W, and the electrical power is 30.23 W.
[12]NSheet-and-plainCircle15.5%49.1%-Water240 L/h
  • The annual average electrical efficiency is 15.5% and the annual average thermal efficiency is 49.1%.
[13]N and EDirect, Spiral, WebCircle7.1% for direct-PVT, 8.5% for web-PVT, 9.1% for spiral-PVT9.8% for direct-PVT, 19.4% for web-PVT, 26% for spiral-PVT-Water40 kg/h
  • Spiral-PVT collectors and direct-PVT collectors reach the highest overall efficiencies of 35% and 27.5%, respectively.
[14]N and EA new dual oscillatingCircle11.71%59.6%-Water2–6 L/min
  • The maximum cell temperature is 329.1 K.
  • Compared with the conventional PV panel, the electrical efficiency of the proposed PVT system is improved by 0.85%.
[15]NSerpentineHalf-circle12.6%71%-Water0.5–4 L/min
  • When the flow rate is increased from 0.5 L/min to 4 L/min, the pressure drop increases by approximately 16 kPa.
[16]NSheet-and-plainCircle, half-circle and square---Water,
Ethanol–water
0–0.06 kg/s
  • At a mass flow rate of 0.04 kg/s, the thermal and electrical efficiencies when using water as a coolant were increased by 4.5% and 1.85%, respectively, compared to the ethanol–water mixture.
[17]N and ESerial, parallel and bionic.Roll-bond14.5%33.5%-Water0.5, 0.25, 0.125, 0.0625 m/s
  • The serial absorber plate had the highest outlet water temperature (average 46.5 °C) and the bionic absorber plate had the lowest (average 44.1 °C).
  • The bionic absorber has the lowest pressure loss (385 Pa on average), lower than the parallel absorber (778 Pa on average).
  • The parallel absorber has a non-uniform velocity within each parallel channel, whereas the bionic absorber has a more uniform velocity distribution over all branches.
[18]N and ESheet-and-plainRectangle andarch16.03% for conventional PV, 16.98% for arch-PVT, 16.52% for rectangle-PVT39.81% for arch-PVT
35.39% for rectangle-PVT
54.83% for arch-PVT
50.83% for rectangle-PVT
Water75 kg/(m2·h)
  • The performance of the system reaches near-optimal value when the dimension spacing ratio is 1:2.
[19]ESerpentineGrooved12.38%50.88%83.47%Fe3O4–water10–40 kg/h
  • The maximum electrical exergy efficiency is 13.02% and the maximum thermal exergy efficiency is 1.41%.
[20]NChannelRectangular11.7–12.3%-0.87Water0.0003–0.0007 (m/s)
  • Exergy efficiency of PVT collectors is in the range of 13.5–15.0%.
[21]NSheet-and-plainConical-leaf inserts13.1–14.1%55.1–69.4%-Water-
  • Average PV cell temperature reduced by 4.6 °C.
  • Compared to plain tubes, thermal and electrical efficiencies are increased by 10.2–14.1% and 0.9–3.4%, respectively.
[22]NSheet-and-plainWavy inserts12.86%65.95%-Al2O3–water-
  • Under the studied conditions, the increase in the pumping power due to the introduction of wavy inserts has a negligible impact on PV generation.
  • With a tube count of 16, the new PVT system has the highest efficiency.
[23]ESheet-and-plainThe twisted tapes (clockwise and counter-clockwise)12.51%67.49%-Water0.019–0.036 kg/s
  • With the use of twisted tubes, the resulting increase in pumping power is negligible and the PVT system’s PV cell surface temperature is reduced by 0.6–1.7 °C. The proposed system has an overall electrical efficiency of 14.86%, which is higher than 13.57% of conventional PVT systems and 11.57% of conventional PV cells.
Table 2. Comparison of nanoparticles associated with the thermal properties and key findings.
Ref.N/EFlow Channel TypeBase FluidNanoparticle TypeNanoparticle FractionParticle Size (nm)Flow RateKey Findings
[24]NRectangular channelWaterTiO20, 0.2, 4.127 wt. %--
  • The proposed PVT system has an electrical efficiency of up to 13.82% and a thermal efficiency of up to 36.68%.
[25]ESerpentineWaterCuO0.05 wt. %<500.067 kg/s
  • The PVT system with nanofluid cooling has an average electrical efficiency of 17.61% and an average thermal efficiency of 71.71%.
[26]EFinned serpentine tubeWatermagnetite0–2 wt. %1320–80 kg/h
  • The PVT system with 8-finned serpentine tubes achieved a maximum electrical efficiency of 12.265%, a thermal efficiency of 51.7%, and a total energy efficiency of 84.13%.
[27]NSheet and tubesWaterCu, Al2O32 vol%100–0.012 kg/s
  • The Cu/water nanofluid performs better than Al2O3.
  • The maximum electrical efficiency of the Cu/water nanofluid is 12.78% and the maximum thermal efficiency is 52.22% at a solar radiation of 1000 W/m2.
[28]NSheet and tubesWaterTiO2, Al2O30, 3, 6 vol%210.0005, 0.001, 0.01,
0.03 kg/s
  • The Al2O3/water nanofluid achieves better performance than the TiO2/water nanofluid.
[29]N and ESheet and tubesWaterCuO, Al2O30.5 wt. %-0.05 kg/s
  • The electrical efficiency of the CuO/water nanofluid is 13.09%, and the thermal efficiency is 38.13%.
  • The electrical efficiency of the Al2O3/water nanofluid is 12.49%, and the thermal efficiency is 35.96%.
[30]N and ESheet and tubesWaterSiO21, 3 wt. %11–14, 60–7040, 50, 70 L/h
  • The PVT system using SiO2/water nanofluid achieved a maximum electrical efficiency of 8.57% and a maximum thermal efficiency of 54.18%.
[31]N and ECooler blocksWaterSiO20.1, 0.2, 0.3 vol%13–230.55–1.65 L/min
  • The maximum electrical and thermal efficiencies measured experimentally were 19.8% and 48.99%, respectively.
[32]NSheet and tubesWaterMXene (Ti3C2)0.01, 0.1, 0.2 wt. %-30–90 kg/h
  • The highest electrical efficiency achieved by the PVT system based on MXene/water nanofluid was 15.94%, and the maximum thermal efficiency was 67.49%.
[33]NSheet and tubesWaterMultiwalled carbon nanotube (CNT)0–0.1 vol%3025–400 L/h
  • The electrical and thermal efficiency of the PVT system increased from 13.76% and 63.87% of pure water to 13.80% and 64.87%, respectively, using 0.1 vol% CNT nanofluid.
[34]NSerpentineWaterCuO, CuO + Fe2 vol%-0.02–0.08 m/s
  • The PVT systems using pure water, CuO/water nanofluid, and CuO + Fe/water nanofluid achieved total efficiencies of up to 57.2%, 58.8%, and 59.9%, respectively.
[35]ESheet and tubesWaterSiO2, Al2O3, SiO2 +
Al2O3
0.1–0.5 wt. %-3 L/min
  • The most significant performance improvements were achieved with hybrid nanofluids.
  • The highest total energy efficiency of the indoor PVT system with mixed nanofluids was 68.09%, compared to 75.26% in the outdoor area.
[36]NSheet and tubesWaterMWCNT-Al2O3,
MWCNT-SiC,
Gr-Al2O3,Gr-SiC
2 vol%-30–70 kg/h
  • The average electrical efficiency of the proposed PVT system is 13.79–18.85%, and the average thermal efficiency is 54.81–56.55%.
[37]NSheet and tubesWaterAl2O3 +
ZnO +
Fe3O4
0.4–1.3 vol%Average of 900.008–0.1 kg/s
  • The optimal electrical and thermal efficiencies of the PVT system based on ternary nanofluid were 13.74% and 59.24%, respectively.
  • The payback period for the ternary nanofluid-based PVT system is 2.63 years, compared to 0.85 years for the water-based PVT system.
[38]NSerpentineSoybean oilMXene (Ti3C2)0.025–0.125 wt. %Lateral size of 1–10 µm, thickness 1 nm0.01–0.07 kg/s
  • The surface temperature of the PV cell using Mxene/Soybean oil nanofluid was reduced by up to 14 °C compared to water.
  • The maximum electrical efficiency is 14.20% and the maximum thermal efficiency is 84.25%.
[39]NSerpentineOlein palm oilMXene (Ti3C2)0.01, 0.03, 0.05, 0.08, 0.1, 0.2 wt. %-0.01–0.07 kg/s
  • The maximum electrical efficiency is 13.15% and the maximum thermal efficiency is 79.13%.
  • The addition of different concentrations of MXene (Ti3C2) nanoparticles can increase the thermal conductivity of the base liquid by 21–68.5%.
Table 3. Comparison of novel thermally driven cooling cycles.
RefN/EOperating Temperature (°C)COPWorking PairsHeat Source Temperature (°C)Cooling Cycle CategoriesKey Findings
TcTe
[40]N3050.670R32/[HMIM][Tf2N]70Thermal and mechanical compression
  • In the proposed system, R32 achieves the highest COP, while R1234yf has the lowest COP.
[41]N257Seasonal COP is 8.9NH3/LiNO370–90Thermal and mechanical compression
  • Energy saving ratio ranges from 21.2 to 31.8%.
[42]N3050.35R1234yf/Ionic liquid62–70Thermal and mechanical compression
  • Compressor pressure ratios in the range of 1.0–2.4 provide good economic returns.
[43]N357COPnet is 0.311–0.567LiBr/H2O for VAS
R1234yf, and R1234ze(E) for VCS
45–60Cascade layout
  • There exist an optimum ESU temperature and generator 1 temperature to derive the best performance from the system.
[44]N--0.4silica gel/H2O for adsorption
LiBr/H2O for absorption
50Cascade layout
  • The cooling water and hot water, when arranged in parallel flow, result in around a 20% higher cooling capacity than when flowing in series.
[45]N--0.37silica gel/H2O for adsorption
LiBr/H2O for absorption
60Cascade layout
  • The maximum cooling capacity that can be achieved by the system is 16 kW.
[46]N404-LiBr/H2O for absorption
R410a for compression
80Cascade layout
  • The condenser in the compression subsystem is of the highest priority for improvement.
[47]N40−257SrCl2-NH360Thermal and mechanical compression
  • The COP of the cycle is almost constant when the temperature of the heat source is given.
[48]N3570.205–0.376R152a/[HMIM]Tf2N70Thermal and mechanical compression + kalina
  • At a compression pressure ratio of 1.6, the system has an optimum exergy efficiency of 39.23% in terms of the assembly.
[49]N---LiBr/H2O25–45Thermal and mechanical compression
  • The low-pressure compression-assisted absorption cooling cycle has a primary energy rate ratio of up to 1.392.
[50]N--0.47CO2
R1234yf
LiBr/H2O
69Cascade layout
  • The lower limit of the heat source temperature has been extended by 4 °C.
  • The payback period for the new arrangement is 10.1 years.
[51]N25−50.62-70VAR
  • The COP of the system under the third structure is 15% higher than that of the reference system.
Table 4. Comparison of solar cooling systems driven by photovoltaic–thermal collectors.
Ref.N/ECOPWorking PairsKey Findings
[52]N0.42–0.43silica gel/H2O
  • The maximum power generation capacity of the proposed system is 12.55 kW.
  • The proposed system achieves a maximum cooling capacity of 8.1 kW.
[53]N0.28–0.384silica gel/H2O
  • The maximum cooling capacity is 3.59–7.66 W in the proposed systems with different layouts.
  • The maximum electric power production is 39.9–81.7 kWh per day in the proposed system with different layouts.
[54]N0.41silica gel/H2O
  • The proposed system reaches its maximum average cooling capacity of 9.6 kW during the summer.
  • The minimum payback period of the proposed system reaches 8.45 years.
[55]N1.8–2.1silica gel/H2O
  • The proposed system can cover all the power requirements for system operation.
  • The levelized cost of refrigeration for the proposed system is 0.235–0.237 USD/kWh.
[56]N0.122–0.124silica gel/H2O
  • The COP is improved by 41.6% compared to conventional compression systems.
  • The exergoeconomic parameter is 0.69–0.70 kWh/USD.
[57]N0.6–0.7silica gel/H2O
  • Compared to the PV-based vapor compression cooling system, the proposed system can produce 4.5 kWh more electricity and 2.9 kWh less cooling capacity on a typical day.
[58]N0.615LiBr/H2O
R410a
  • The proposed system provides an annual energy saving of 102,360 kWh in Guangzhou, which is 1.73 times that of conventional PV systems.
  • The system proposed for use in Zhuhai can achieve an optimal payback period of 11.8 years while generating a maximum NPV of USD 23,600.
[59]N-LiBr/H2O
NH3
  • The minimum payback period of the proposed system is 9.3 years.
  • The maximum specific total electricity cost saving of the system is 192.6 CNY/(m2·year).
Disclaimer/Publisher’s Note: The statements, opinions and data contained in all publications are solely those of the individual author(s) and contributor(s) and not of MDPI and/or the editor(s). MDPI and/or the editor(s) disclaim responsibility for any injury to people or property resulting from any ideas, methods, instructions or products referred to in the content.