1. Introduction
The maritime industry is a critical pillar of global trade and transportation, facilitating the movement of goods and resources across the world’s oceans [
1]. However, this industry’s significant growth and reliance on conventional energy sources have raised pressing environmental concerns, particularly regarding energy consumption and emissions during vessel berthing in waterfront areas. The impact of these emissions on coastal regions is a matter of great importance due to their vulnerability and the potential consequences for both the environment and local communities [
2].
The maritime sector heavily depends on fossil fuels, including diesel and heavy oil, leading to substantial greenhouse gas emissions, air pollution, and contributions to climate change. Notably, the emissions generated during vessel berthing have emerged as a significant source of pollution in coastal areas. Statistical data highlights the gravity of this issue, with a study revealing that ships at berth can produce more pollutants per unit of fuel consumed than when they are sailing [
3]. The International Maritime Organization (IMO) reports that around 2.5% of worldwide greenhouse gas emissions come from vessel emissions. Coastal areas, due to their proximity to maritime operations, experience the most significant impact from these emissions [
4].
Coastal areas are renowned for their diverse ecosystems, delicate marine life, and vibrant communities, making them highly susceptible to the adverse effects of vessel emissions. The pollutants released during berthing, such as Sulphur dioxide (SO
2), nitrogen oxides (NOx), and particulate matter, can contaminate the air and water, endangering marine life, compromising air quality, and posing health risks to local populations [
5]. Research shows that air pollution from ships contributes to respiratory diseases and cardiovascular problems in coastal communities, impacting both human health and the natural environment [
6].
Adopting cold ironing, also known as shore-to-ship power, has emerged as a crucial mitigation strategy to address these urgent environmental challenges. Cold ironing involves connecting docked vessels to the local electrical grid, allowing them to shut down their engines and rely on clean energy sources during their stay at port. This practice reduces energy consumption and eliminates harmful emissions, thereby alleviating the negative impacts on both waterfront areas and coastal environments [
7].
The importance of utilizing clean energy for shore power cannot be understated. Port infrastructure is increasingly incorporating renewable energy sources such as solar and wind power to supply electricity to ships during their docking periods [
8]. According to a World Ports Sustainability Program report, several ports worldwide have already implemented shore power facilities, resulting in significant reductions in air pollution and greenhouse gas emissions. For example, the Port of Los Angeles in the United States estimates that using shore power has reduced emissions by over 30,000 metric tons of greenhouse gases and almost 200 tons of NOx since 2014. These statistics underscore the favorable effects that clean energy solutions can bring to coastal areas, guaranteeing a more sustainable and eco-friendly future for the maritime sector [
9].
Furthermore, the concept of Nuclear-Renewable Hybrid Energy Systems (N-R HES) has emerged as a promising approach to tackle the challenges associated with vessel emissions. These systems combine nuclear energy’s reliable and continuous power generation with the flexibility and renewable attributes of sources such as wind and solar. Integrating various energy sources in a Nuclear-Renewable Hybrid Energy System can deliver a reliable and environmentally friendly electricity supply for cold-ironing operations. This integration helps reduce energy expenses and environmental harm. Implementing such systems can significantly improve the maritime industry’s sustainability and support global climate change efforts [
10].
Furthermore, the growing concern among environmentalists in the marine community is directed towards the alarming buildup of plastic waste in the ocean. In a recent study [
11], the author emphasizes various prospective uses of nuclear power, one of which involves utilizing nuclear-powered ships to address areas that are heavily contaminated with plastic debris. The idea is to capture and transport the litter to these vessels, where it can be recycled onboard.
However, implementing Nuclear-Renewable Hybrid Energy Systems (N-R HES) in seaports faces several key challenges that need to be addressed. One significant challenge in integrating nuclear and renewable energy sources into existing grid infrastructure is grid integration. Advanced grid management strategies and energy storage solutions are necessary [
12]. Incorporating energy storage technologies such as battery systems into nuclear-renewable hybrid systems can enhance grid stability by up to 30%. The statistical analysis emphasizes the importance of these measures to ensure seamless integration and optimize system performance.
Another challenge is space constraints, particularly in seaports and waterfront areas with limited available land. To overcome this challenge, researchers should explore compact and modular designs for nuclear reactors. Additionally, innovative solutions such as floating nuclear power plants or offshore wind farms can be considered to optimize space utilization. Implementing offshore wind farms, for example, can increase the power generation capacity of hybrid systems by up to 15% compared to onshore installations, highlighting the potential benefits of exploring alternative approaches to address space limitations [
13].
Environmental considerations, particularly safety and the impact of nuclear energy are crucial. Research should focus on advanced reactor designs prioritizing safety, waste reduction, and passive cooling systems. For instance, by implementing passive cooling systems, water consumption can be reduced by up to 60% compared to traditional cooling methods. These advancements can help mitigate environmental impacts and ensure the sustainable use of nuclear energy [
14].
Supportive policy frameworks and regulatory mechanisms are vital in successfully deploying nuclear-renewable hybrid energy systems. Research should analyze existing policy barriers, propose economic incentives, and facilitate public acceptance through effective communication and stakeholder engagement. Statistical analysis indicates that countries with favorable policies and incentives for renewable energy have experienced a 25% increase in adopting hybrid systems, creating an enabling environment through appropriate policies and regulations [
15].
Addressing these challenges and implementing the potential solutions outlined above can contribute to the effective integration of nuclear and renewable energy sources, leading to a more sustainable and resilient energy system. By prioritizing advanced grid management, compact designs, environmental considerations, and supportive policy frameworks, we can unlock the full potential of nuclear-renewable hybrid energy systems and move towards a cleaner and more sustainable future.
Hence, this paper aims to assess the feasibility of implementing a Nuclear-Renewable Hybrid Energy System (NRHES) in an Indonesian seaport. It includes estimating seaport energy consumption, emissions, and carbon tax implications, conducting a case study, and performing a comprehensive technical and economic analysis. The aim is to offer valuable information about the possibilities of incorporating sustainable energy in seaports and to educate decision-makers about the advantages and obstacles associated with adopting a Nuclear-Renewable Hybrid Energy System (NRHES).
2. Methodology
This paper aims to evaluate the potential of seaports as energy-intensive entities and investigate the feasibility of implementing a Nuclear-Renewable Hybrid Energy System (NRHES) in an Indonesian seaport. The methodology consists of three phases.
In the first phase, the paper estimates seaport operations’ energy consumption, emissions, and carbon tax implications. By quantifying these factors, the study seeks to provide insights into the energy requirements, environmental impact, and potential costs related to carbon taxation in seaports.
The second phase involves conducting a case study in an Indonesian seaport. The case study examines energy consumption during berthing activities, calculates the corresponding emissions, estimates the actual costs based on average electricity prices, and analyzes potential carbon tax expenses by drawing upon examples from other countries. This localized analysis provides valuable information on energy usage, cost implications, and carbon tax considerations specific to seaport operations in Indonesia.
Lastly, a comprehensive technical and economic feasibility analysis of implementing an NRHES in the seaport case study is performed in the third phase. The analysis employs the HOMER software to simulate the required resources and components for the NRHES. The technical analysis determines the optimal sizing and composition of components, considering the proportion of nuclear and renewable energy sources. Concurrently, the economic analysis considers the energy cost and evaluates the net present cost of the proposed NRHES, incorporating factors such as cash flow, return on investment, and internal rate of return.
2.1. Seaport Energy Consumption, Emissions, and Carbon Tax Implications
Estimating the energy consumption and emissions of seaports is a complex endeavor due to several factors, including the port’s size, the types and quantities of vessels utilizing the port, and the equipment utilized for loading and unloading operations.
One practical approach to estimating energy consumption in a port is by measuring them per Twenty-foot Equivalent Unit (TEU). A TEU serves as a standardized unit of measurement for cargo capacity in the shipping industry [
16]. By quantifying the energy consumption per TEU, a port can gain insights into the environmental implications of its operations and actively track its progress in reducing its carbon footprint over time. It is essential to recognize that the average energy consumption per TEU in seaports can vary significantly. This variability is influenced by various factors, such as the type and size of vessels navigating the port, the nature of the cargo being handled, the specific equipment utilized during operations, and the overall efficiency of the port’s logistical processes.
For instance, larger vessels consume more energy than smaller ones. The type of cargo being transported also plays a role, as certain goods may require specialized equipment or handling procedures that consume additional energy. Moreover, the efficiency of port operations, including optimized routing and streamlined logistics, can significantly reduce energy consumption and emissions per TEU.
To accurately estimate seaports’ energy consumption and emissions, it is essential to consider these diverse factors and implement comprehensive data collection and analysis methods. The International Association of Ports and Harbors (IAPH) conducted a global survey for their Port Emissions Toolkit project. This study aimed to provide port operators with valuable insights into the average carbon dioxide (CO
2) emissions and energy consumption per Twenty-foot Equivalent Unit (TEU) associated with different types of ships during their berthing activities at seaports [
17].
The IAPH Port Emissions Toolkit offers estimates considering emissions from a ship’s auxiliary engines. These engines power various onboard equipment, lighting, heating, and air conditioning, while the ship is docked at the berth.
Based on the findings of the IAPH Port Emissions Toolkit, the average energy consumption per TEU for different ship types during berthing in seaports is as follows:
Container ships: 12 kWh/TEU
Ro-Ro ships: 3.5 kWh/TEU
Bulk carriers: 2.5 kWh/TEU
General cargo ships: 3.5 kWh/TEU
Tankers: 2.5 kWh/TEU
These values provide port operators with valuable reference points regarding the energy consumption levels associated with specific ship categories while docking them at seaports. By utilizing this information, port authorities can gain insights into the environmental impact of different vessel types and work towards implementing strategies to reduce emissions and enhance energy efficiency in their operations.
In analyzing the environmental impact of maritime transportation during berthing activities through the implementation of cold ironing, this study specifically focuses on assessing emissions associated with the use of electricity sourced from the grid. Estimating emissions resulting from energy consumption poses a complex challenge due to the intricate nature of energy systems, fluctuating emission factors, and limited data availability [
18].
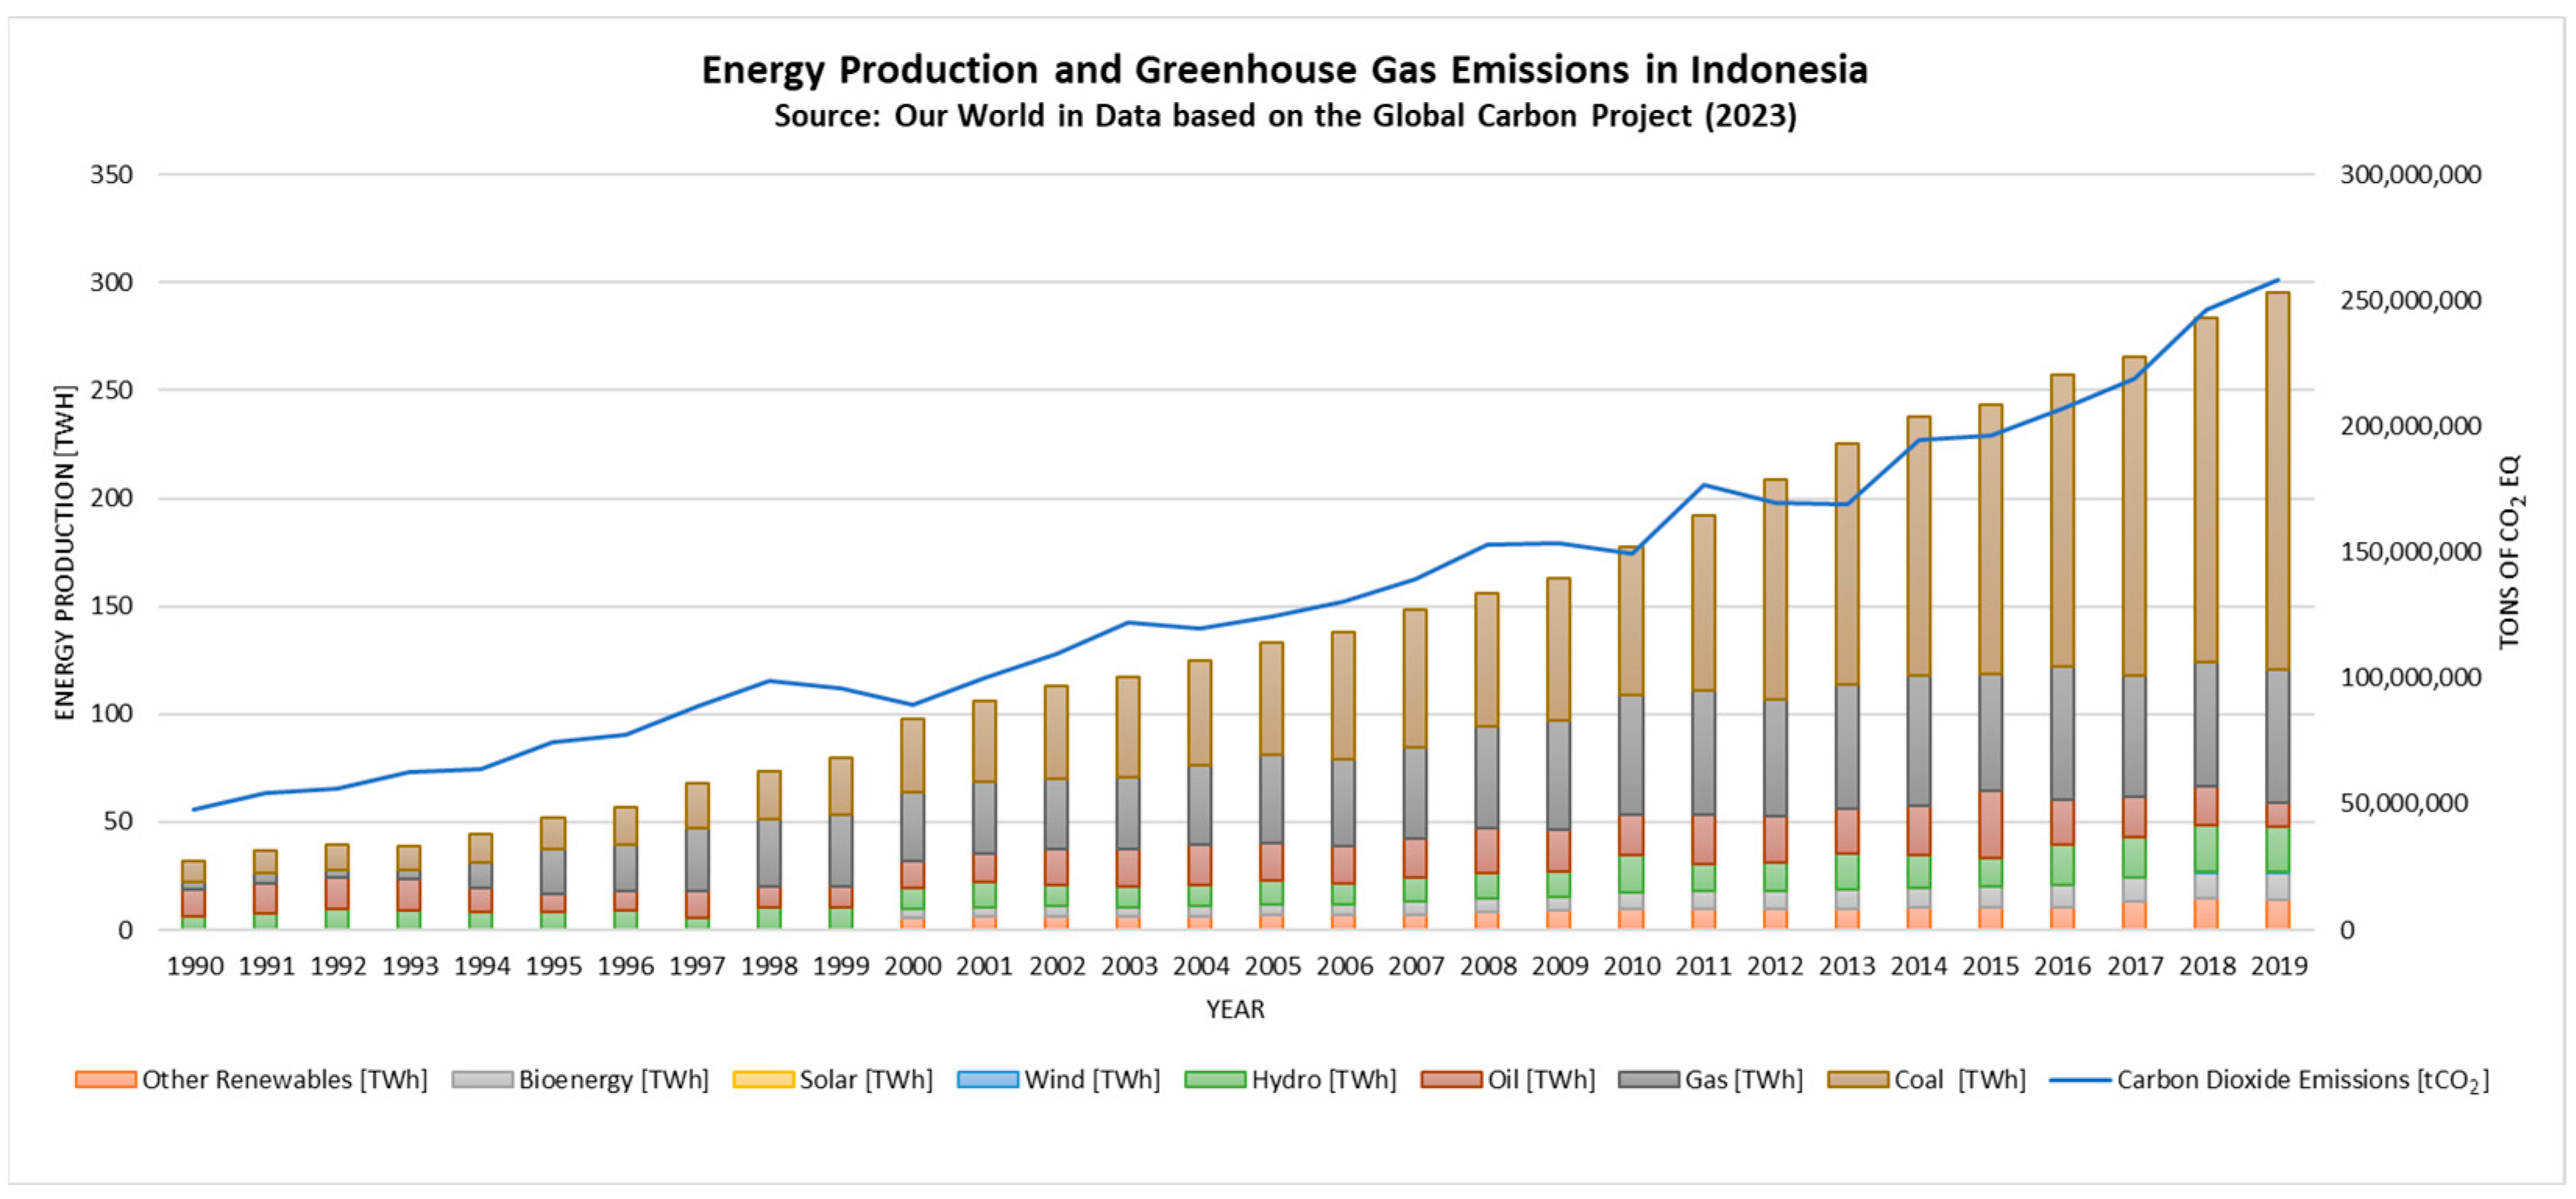
A diverse combination of energy sources characterizes Indonesia’s electricity mix. This mix encompasses fossil fuels, renewable energy, and hydroelectric power. The inclusion of fossil fuels such as coal, oil, and natural gas, alongside renewable sources such as solar, wind, and biomass, contributes to the overall composition of the country’s energy production. Furthermore, Indonesia has effectively harnessed hydroelectric power generation potential using its abundant water resources [
19].
Figure 1, presented in this paper, showcases historical data spanning the past 30 years, illustrating the energy production mix in Indonesia. It depicts the proportion of each source technology and provides an overview of the total greenhouse gas emissions generated within the energy sector.
In order to estimate the emission factor, which quantifies the greenhouse gas emissions per kilowatt-hour consumed, this study took into account the latest updated values corresponding to the year 2019.
Figure 2 provides a detailed overview of the energy mix in Indonesia in 2019, indicating the percentage of each energy source. According to the Ember Yearly Electricity Data (2020), Indonesia’s total energy production in 2019 was 295 billion kWh [
19], with emissions associated with this production reaching 258 million tons of CO
2eq [
20]. As a result, the emission factor calculated was 0.875 kg of CO
2 equivalent per kilowatt-hour.
In order to tackle the environmental consequences associated with energy consumption, policymakers and economists have put forward different approaches, including implementing a carbon tax. A carbon tax involves charging a fee based on the carbon content of fossil fuels or the carbon dioxide emissions produced during combustion. The objective is to ensure that the cost of goods and services accurately reflects the societal impact of their carbon emissions.
The fundamental idea behind a carbon tax is to create a financial incentive for individuals, businesses, and industries to reduce their carbon footprint. Putting a price on carbon emissions encourages the adoption of cleaner and more sustainable energy sources and promotes energy efficiency measures [
21].
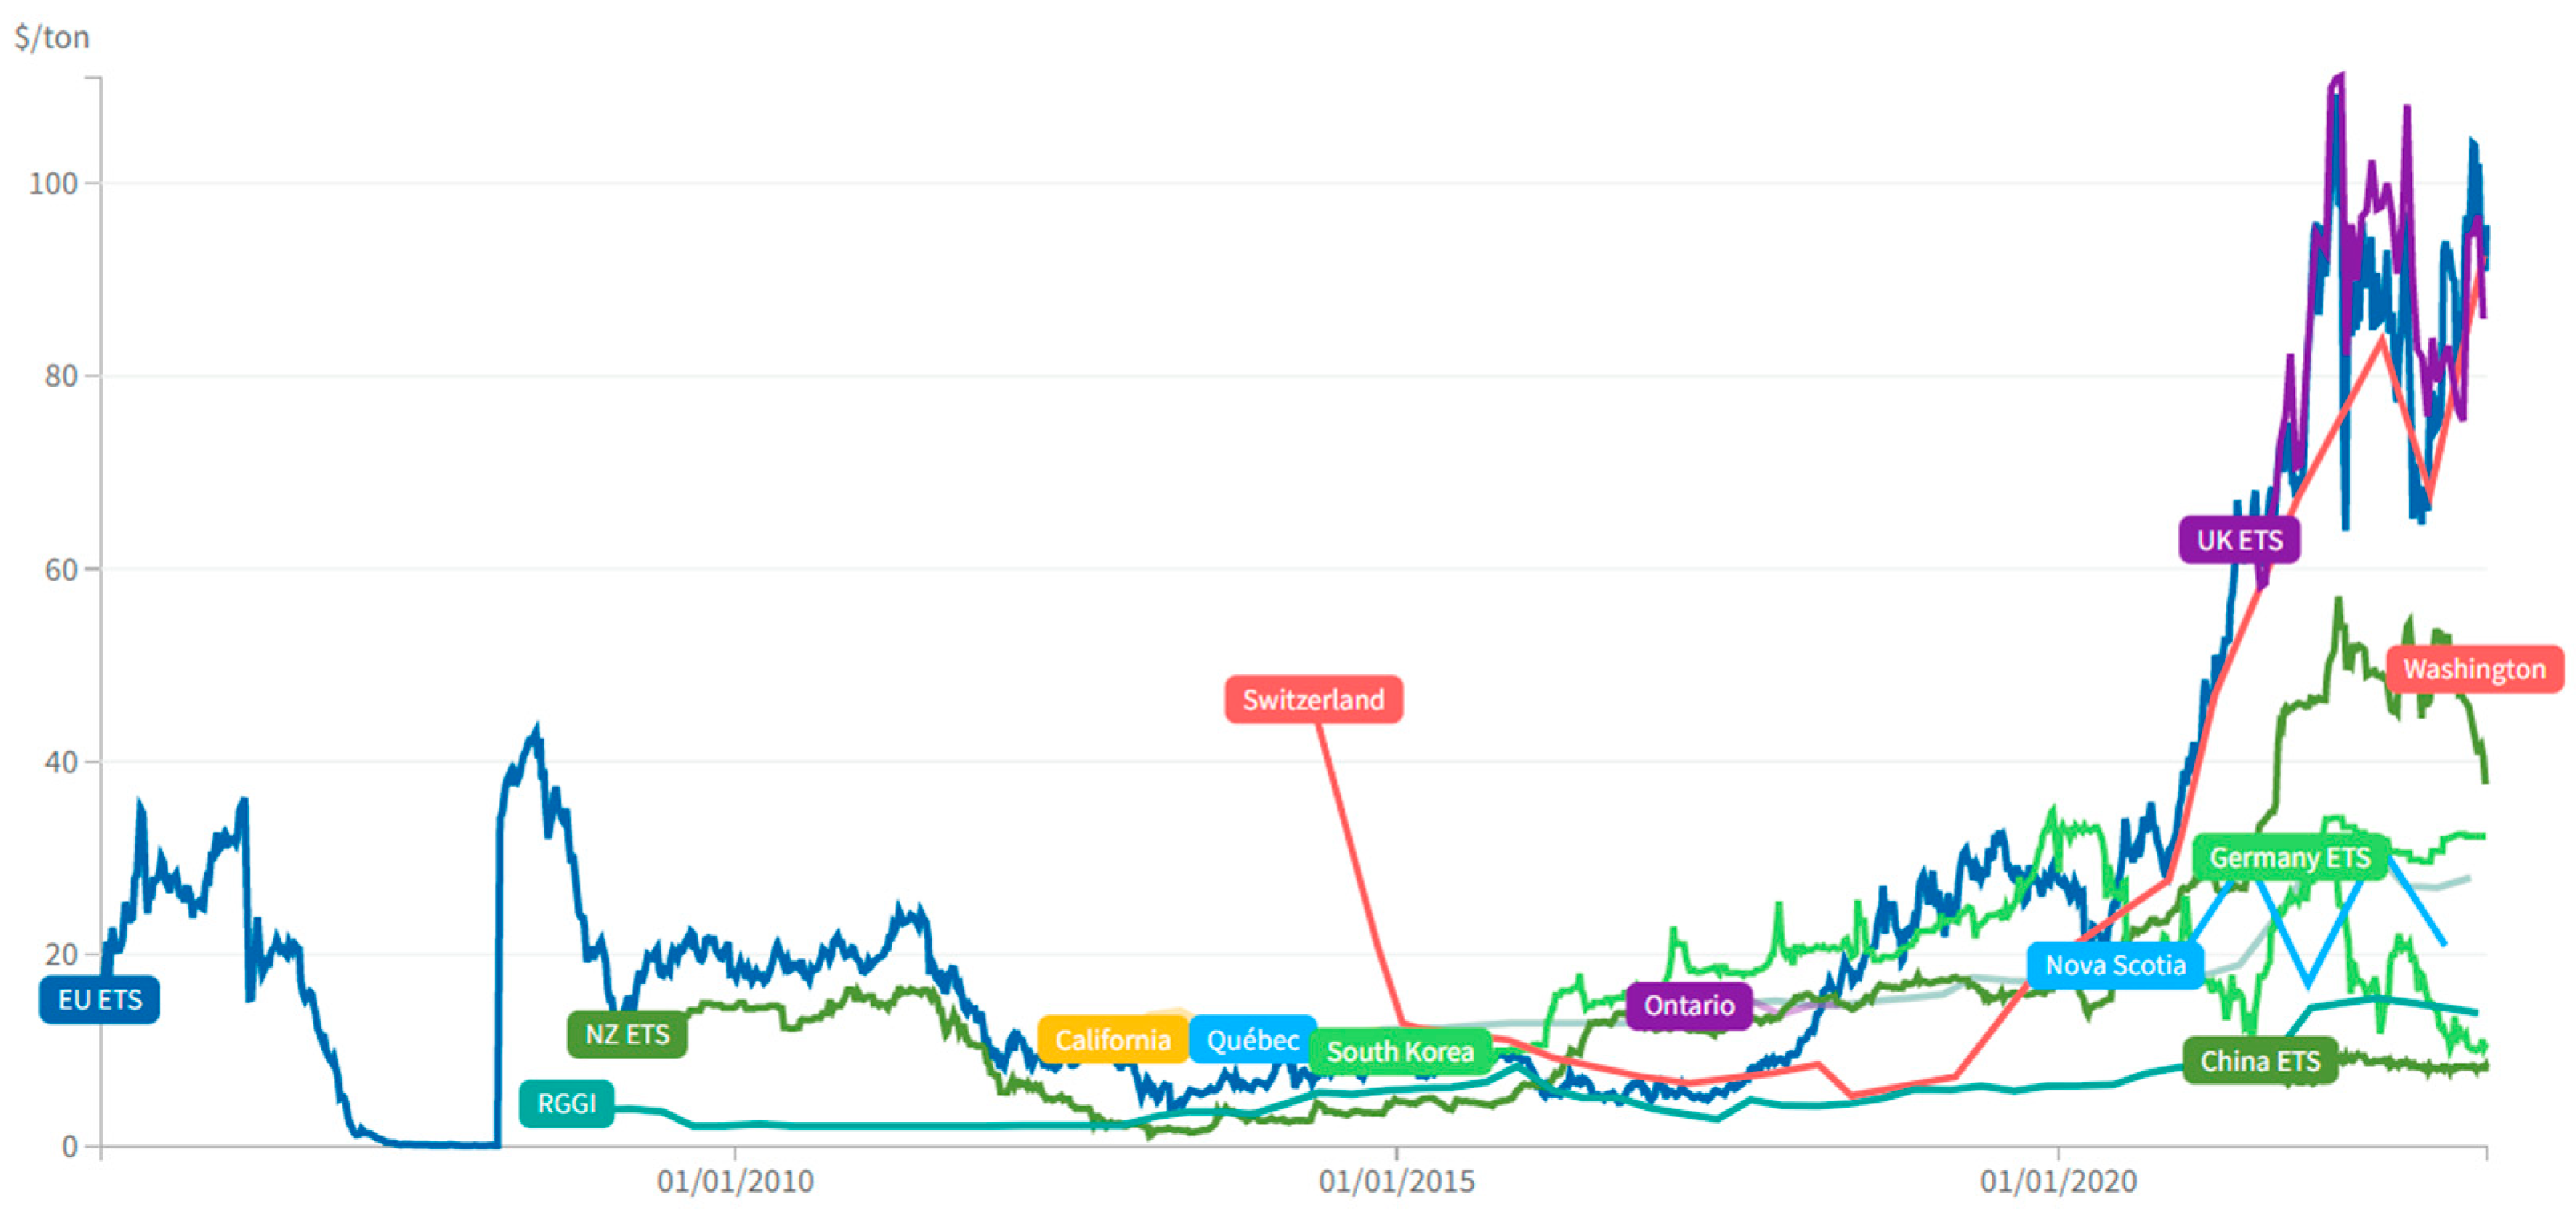
Carbon taxes have been implemented in several countries and regions around the world. For example, Sweden introduced a carbon tax in the early 1990s, which has helped the country reduce its carbon emissions while maintaining economic growth. British Columbia in Canada and the European Union have also implemented carbon pricing mechanisms.
Figure 3 shows a graph depicting the evolution of carbon tax in several energy systems over the past years, while
Table 1 presents the minimum, maximum, and average prices of these systems [
22].
2.2. Case Study: Energy Usage and Cost Considerations in an Indonesian Seaport
Case studies hold significant importance in energy systems for various reasons. They provide valuable insights into the complexities of real-world energy systems, shedding light on the interactions between different components and factors. By examining actual scenarios, case studies offer a deeper understanding of the challenges and opportunities specific to different energy systems, technologies, and regions.
In this study, we focused on the Tanjung Priok Port, one of Southeast Asia’s busiest ports. It handles a significant cargo volume and serves as a vital economic hub for the region. However, the port heavily relies on conventional energy sources, such as fossil fuels, leading to air pollution, greenhouse gas emissions, and energy vulnerability.
According to the Indonesia Port Corporation, an expansion project is in progress aiming to increase the total annual capacity to 15.2 million TEUs. Additionally, the port has facilities to handle various types of cargo, including RoRo, bulk, general cargo, and liquid cargo [
23]. Based on the characteristics of the port and historical operations, certain assumptions were made to determine the percentage of each vessel type used in the port:
Container ships: the most common type of vessel calling at seaports worldwide, and it makes up a significant share of the throughput at a port with a capacity of 15.2 million TEUs. Assuming container ships account for 80% of the port’s throughput, they would handle approximately 12.16 million TEUs annually.
RoRo ships: are commonly used to transport vehicles, heavy equipment, and other rolling stock, and they would likely make up a smaller share of the port’s throughput compared to container ships. Assuming that RoRo ships account for 5% of the port’s throughput, they would handle approximately 760,000 units annually.
Bulk carriers: are typically used to transport raw materials such as iron ore, coal, and grain, and they would likely make up a smaller share of the port’s throughput compared to container ships and RoRo ships. Assuming that bulk carriers account for 10% of the port’s throughput, they would handle approximately 1.52 million metric tons annually.
General cargo ships: are used to transport a range of non-containerized goods, including project cargo and breakbulk cargo. Assuming general cargo ships account for 4% of the port’s throughput, they would handle approximately 608,000 metric tons annually.
Tankers: are used to transport liquid bulk cargoes such as petroleum and crude oil products, and they would likely make up a smaller share of the port’s throughput compared to container ships and bulk carriers. Assuming tankers account for 1% of the port’s throughput, they would handle approximately 152,000 metric tons annually.
Using the capacity of 15.2 million TEUs per year, we can estimate the annual energy consumption for each ship type based on the given shares and the factors from the IAPH Port Emissions Toolkit, presented in
Table 2.
Furthermore, to evaluate an economic analysis, this study considered the mean electricity price in Indonesia. Based on data from GlobalPetrolPrices, the average cost of electricity in Indonesia for large businesses in 2022 was recorded as 0.075 US Dollars per kilowatt-hour (kWh), encompassing all elements of the electricity bill, including power generation, distribution, and taxes [
24].
For comparison with the proposed system, this paper examines the Actual System, which assumes the absence of an N-R HES installation. In this scenario, all the energy supplied to the port is sourced solely from the existing energy grid in Indonesia. By considering the previously determined emission factor, the average electricity price, and the estimated annual energy consumption of the Tanjung Priok Port, it becomes feasible to calculate the total greenhouse gas emissions generated by the port and the corresponding annual cost paid to the grid for the consumed energy.
The calculation of the total greenhouse gas emissions follows a specific formula, which is (1):
where:
: Total emission of greenhouse gases;
: Annual energy consumption;
: Greenhouse Gas Emission factor.
: Total cost paid to the utility grid;
: Annual energy consumption;
: Electricity price.
By employing numerical values in Equation (1), it can be determined that the cumulative emission of greenhouse gases amounts to 136.5 million metric tons of carbon dioxide equivalent. Additionally, the overall expense incurred concerning the utility grid company amounts to 11.7 million USD, which is calculated using Equation (2).
2.3. Nuclear-Renewable Hybrid Energy System in the Seaport Case Study
This case study aims to examine the feasibility and potential advantages of combining nuclear power with renewable energy sources to establish a Hybrid Energy System for Tanjung Priok Port. This integrated system aims to offer a reliable, clean, and cost-effective energy supply for the port’s operations while minimizing its environmental impact.
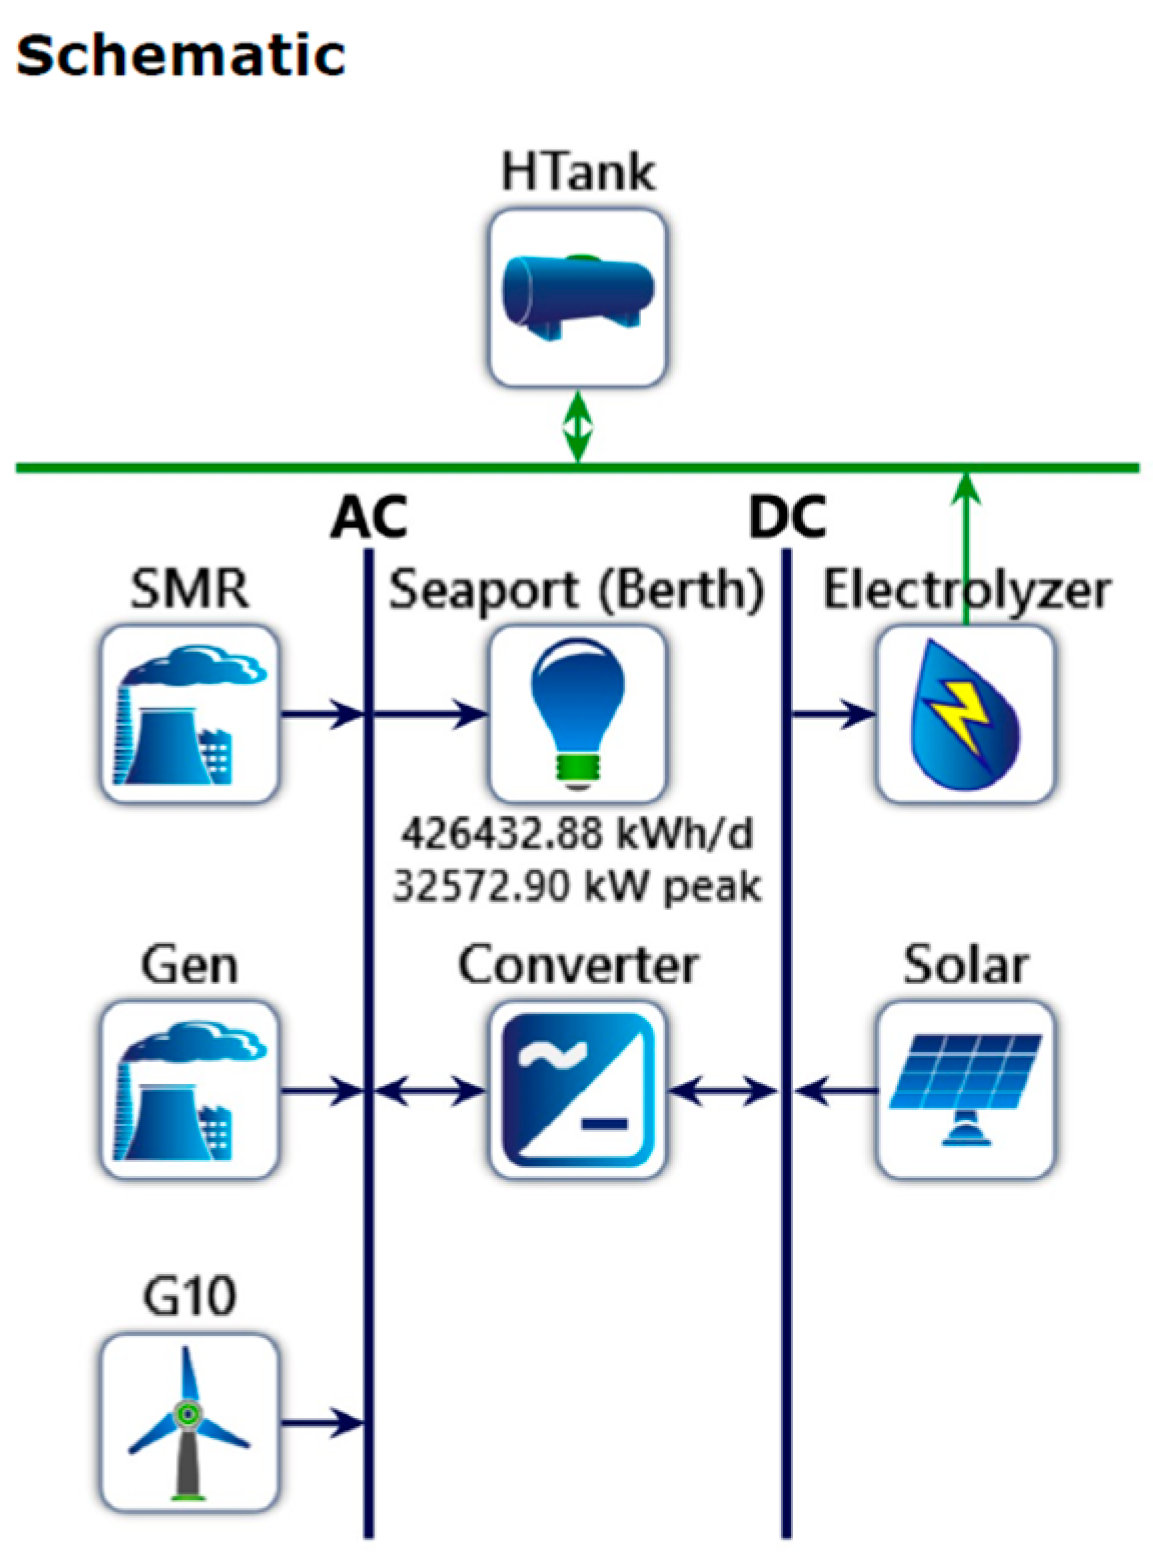
Figure 4 depicts the schematic of the system, comprising a Small Modular Reactor as the primary baseload energy source. Additionally, auxiliary renewable sources such as wind and solar systems and a hydrogen production system through electrolysis are incorporated. This hydrogen production system stores excess energy and provides power when needed.
2.3.1. Nuclear Power Plant
Nuclear power stands as a reliable and environmentally friendly energy solution, offering a constant supply of baseload power. In the context of this case study, we will delve into the potential of constructing a Small Modular Reactor (SMR) at Tanjung Priok Port, exploring its feasibility and advantages in greater detail. SMRs present an innovative approach to nuclear energy, as they can be scaled and adjusted in size according to the specific energy requirements of a given location. This adaptability not only allows for a more precise match between energy demand and supply but also enhances safety measures. SMRs are designed with safety as a top priority, incorporating advanced features and inherent safety mechanisms. These characteristics, coupled with their modular nature, make SMRs an appealing choice for localized applications such as Tanjung Priok Port. Estimating the cost of implementing Small Modular Reactors (SMRs) presents several challenges due to various factors. The diverse design options of SMRs make it difficult to provide generalized cost estimates. Each SMR design, size, and configuration has unique cost drivers and complexities. Additionally, the lack of historical cost data due to limited operating experience with SMRs further complicates accurate cost estimation based on past performance.
Including licensing and regulatory procedures for Small Modular Reactors (SMRs) brings uncertainties that compound the difficulties in estimating costs. Furthermore, site-specific factors play a significant role in the variations in costs. Considerations such as land acquisition, site preparation, infrastructure availability, and environmental assessments require comprehensive site evaluations to attain accurate estimations. Furthermore, financing and project management pose challenges due to the perceived risks associated with new technologies. Effectively financing SMR projects and managing capital costs, interest rates, and financing terms require careful consideration to overcome these challenges.
Addressing these challenges requires collaboration among various industry stakeholders, including reactor vendors, engineering firms, regulators, and project developers. Through continuous research, development, and deployment of SMRs, coupled with operational experience gained from early projects, we can improve cost estimation models and better understand the specific cost drivers involved in SMR implementation.
Emphasizing the significance, it should be noted that this study employed specific parameters from larger nuclear plants [
25] and modified them to develop a generic model based on the proposed power capacity, as outlined in
Table 3. The costs, presented in terms of USD per kW for the purpose of standardization with other sources, are utilized to calculate the final investment when simulating different sizes of the energy source. However, it is important to recognize that these values are estimates meant for illustrative purposes only and may not accurately reflect the actual costs associated with a Small Modular Reactor (SMR).
2.3.2. Additional Components
The case study will also assess the integration of various renewable energy technologies to complement the nuclear power component. Indonesia’s abundant solar and wind resources present a promising opportunity for the deployment of these renewable sources. Solar panels can be installed on the port’s rooftops and open areas, while wind turbines can be strategically positioned to harness the coastal winds.
In addition, effective integration of a Nuclear-Renewable Hybrid Energy System requires viable energy storage and grid integration solutions. The case study will assess the utilization of hydrogen as an energy storage medium, which utilizes excess energy generated by nuclear and renewable sources to operate an electrolyzer, which produces hydrogen from water. The hydrogen is subsequently stored in a tank and can be converted back into electricity using a fuel cell.
The technical and economic parameters of the components employed in this study were derived from literature sources. These values were utilized to determine the optimal scenario by considering crucial indicators such as Present Net Cost and Cost of Energy.
Table 4 presents the parameters for the Solar and Wind Systems, encompassing the maximum size limit for each system, along with investment cost, replacement cost, maintenance cost, and expected lifetime.
Table 5 provides the parameters for the hydrogen system, including those for the fuel cell generator and the DC converter.
2.3.3. Economic Analysis
The study utilized the HOMER Pro software [
26], a valuable tool for sizing power generation systems incorporating multiple energy sources. This software enables accurate optimization procedures by conducting hourly simulations of energy flow for the load and other system components. It also provides estimates for initial installation and operating costs and recommended economic indicators for proper economic analysis. Factors such as project lifespan, prices, and power ratio of solar modules, inverters, and wind turbines are considered in the analysis. These features make HOMER Pro a reliable choice for sizing power generation systems. The software calculates various economic factors, including the Net Present Cost (NPC), which represents the combined cost of installing and operating the system over its expected lifetime, and the Cost of Energy (COE), which indicates the average cost per kilowatt-hour of electrical energy generated by the system [
25].
Additionally, this paper presents the Cash flow analysis, an essential tool in investment analysis. Cash flow analysis examines the inflows and outflows of cash associated with an investment project, providing insights into profitability, liquidity, capital expenditure, and return on investment (ROI). It evaluates the project’s financial performance, helping to determine its profitability and liquidity and enabling better financial planning and risk management.
3. Simulation and Results
The proposed microgrid design was first simulated using HOMER Pro software, which offers a variety of simulation outcomes for assessing its performance. This software generates comprehensive reports and graphical representations, summarizing the simulation results and offering valuable insights into the microgrid’s functionality. These insights include energy balance, cost analysis, performance metrics, and sensitivity analysis.
Figure 5 shows the system schematic used in this work, where the acronym ‘Gen’ represents the fuel cell generator and ‘G10’ represents the wind energy system.
Based on the economic and technical input presented previously in
Table 3,
Table 4 and
Table 5, the software presented several possible scenarios that vary each energy source’s capacity power, affecting the economic analysis.
Figure 6 presents a graph that displays five scenarios, with the best scenario on the left and progressing toward the right. It represents different combinations of Solar, Wind, and Nuclear energy sources. The best scenario, located on the left side of the graph, is determined based on its energy cost, which is
$0.105 per kilowatt-hour (kWh). It is the most cost-effective option among the five scenarios.
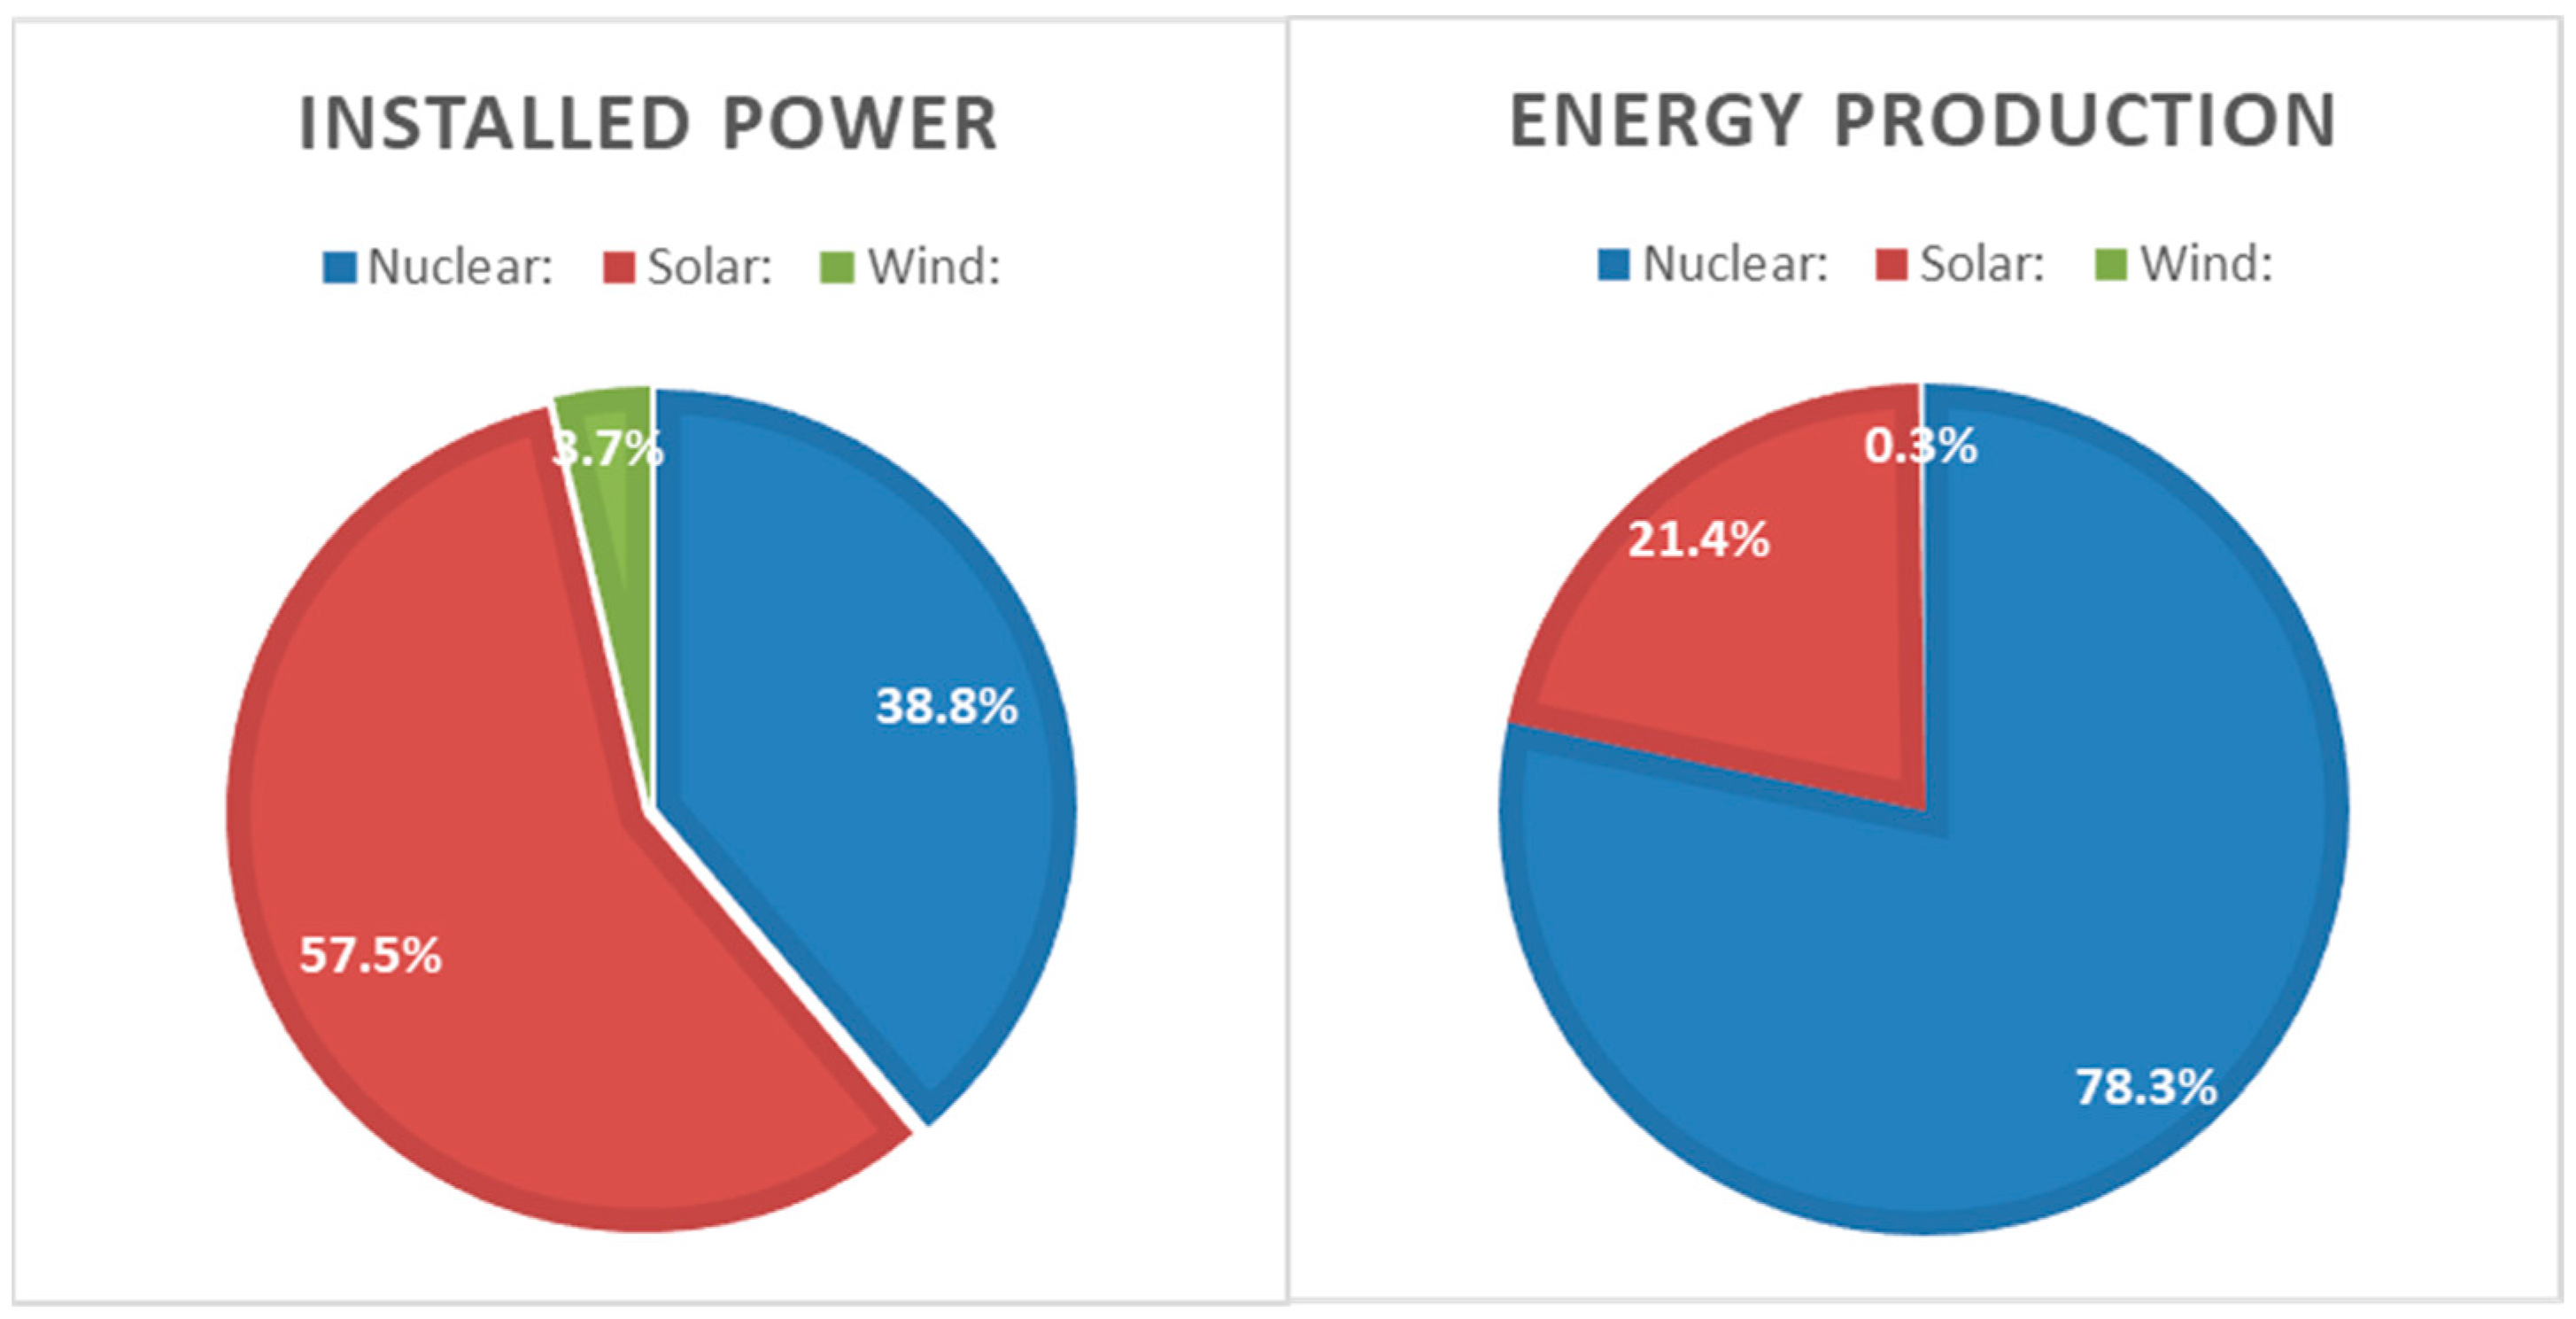
In terms of installed power distribution, the best scenario consists of 38.8% nuclear, 57.5% solar, and 3.7% wind energy. This configuration reflects the optimal mix of energy sources for power generation. Considering the production capacity share, the best scenario shows that 78.3% of the total energy production capacity comes from nuclear energy, followed by 21.4% from solar energy, and 0.3% from wind energy, as shown in
Figure 7.
The graphs allow for a visual comparison of the different scenarios, helping decision-makers assess each option’s cost-effectiveness, installed power, and production capacity. It aids in selecting the most suitable energy system option based on these factors.
The chosen scenario was identified as the most effective option for further analysis in this study. Detailed parameters for each component of the selected system are presented in
Table 6.
Based on the energy system schematic and the simulation results, it can be concluded that the wind energy share in the system is significantly lower compared to solar energy. This disparity is primarily due to the low effectiveness of wind power generation in the specific location of the system in Indonesia, as indicated by the inadequate wind speeds.
The low wind speeds in the area likely result in insufficient generation capacity from wind turbines, leading to a smaller contribution of wind energy to the overall energy mix. In contrast, solar energy appears to be more favorable in this location, possibly due to the abundance of sunlight and suitable conditions for solar panels.
Cash Flow Analysis
Cash flow analysis is vital for evaluating the economic feasibility of energy systems. It considers the time value of money and enables decision-makers to assess cash flow variability, mitigate risks, and make informed choices. Stakeholders can select the most economically attractive and sustainable energy system option by considering financial and technical aspects.
For comparison, we will use a hypothetical scenario called the Conventional Scenario, which does not incorporate the proposed system. In this scenario, the Tanjung Priok Port consumes electricity directly from the utility grid, resulting in a cost for the port. Additionally, this energy consumption from the grid contributes to greenhouse gas emissions. The values of the electricity price and emission factor were previously presented in the methodology. To create a cash flow for this scenario, we considered a hypothetical annual inflation rate of 4.5% and included carbon taxation. Various values for carbon taxation were simulated to observe their impact on the outcome.
On the other hand, for the cash flow of the proposed system, we considered all costs associated with each component, including capital costs, operation and maintenance costs, and replacements. In creating the cash flow, this paper considered the income generated by the system, which represents the reduced need to consume electricity from the grid and potentially eliminates the need to pay any carbon taxation. The same inflation rate of 4.5% was also applied to the proposed system.
This work considered three different analyses over 40 years. The first analysis, as depicted in
Figure 8, disregards carbon taxation. In this scenario, the system yielded a return on investment of 14 years. From the investor’s perspective, maintaining the conventional system would result in an expenditure of over 1.32 billion USD by the end of the analyzed period. Conversely, if the proposed system is implemented, the investment would have returned after 14 years, resulting in a positive cash flow of 925 million USD at the end of the period.
Another scenario was considered, which incorporates a carbon tax of
$30 per kWh, as illustrated in
Figure 9. The introduction of carbon taxation leads to an increase in the cost of consuming electricity directly from the grid. In this scenario, the investment shows a return on investment of 11 years, resulting in a positive cash flow of 1.8 billion USD at the end of the period. Conversely, if the conventional system is considered, the port would have incurred expenditures of over 2.2 billion USD by the end of the period.
Table 7 provides detailed values for both scenarios.
4. Conclusions
Reducing maritime sector emissions is paramount, and one promising solution is cold ironing, which eliminates emissions while ships are berthed. However, for this approach to be truly impactful, it must ensure that emission-free energy sources supply shore power. The Nuclear-Renewable Hybrid Energy System (N-RHES) emerges as an up-and-coming alternative capable of providing reliable and sustainable energy.
Although the implementation of N-RHES offers numerous benefits, there are specific challenges that need to be addressed. These challenges encompass grid integration, the development of an appropriate regulatory framework, space limitations, and the establishment of an efficient management system. Overcoming these obstacles is crucial for the successful deployment of N-RHES projects. Moreover, while the deployment of N-RHES provides reliable and low-carbon energy, safety concerns related to nuclear power, such as accidents and radiation leaks, become more pronounced due to their proximity to densely populated areas. Public perception and acceptance of nuclear energy can also present challenges, as well as potential environmental impacts stemming from the construction and operation of renewable energy infrastructure. Finding suitable locations and balancing competing uses can be complex, and the economic feasibility of such systems must be carefully evaluated. Considering the security of critical infrastructure and implementing robust risk assessments and safety measures are also imperative.
A case study conducted in a port in Indonesia demonstrated the feasibility of implementing an N-RHES. The proposed system utilized nuclear power as a base load, supplemented by solar and wind as flexible energy sources. Moreover, surplus energy from the system was converted into hydrogen using an electrolyzer, providing an energy storage solution. The case study results indicated that the proposed N-RHES was technically feasible, and from an economic perspective, it presented a promising investment opportunity.
Although the proposed system’s energy cost was slightly higher than the current electricity price ($0.10 compared to $0.075), considering the cash flow and the economic benefits derived from not relying on the utility grid, the system proved highly profitable. Furthermore, an additional scenario was considered by incorporating the future possibility of a carbon tax. This analysis demonstrated that the proposed system would become even more attractive and financially viable if such a tax were implemented.
Finally, it is crucial to highlight the environmental importance of the proposed N-RHES. By avoiding using the utility grid and the associated emissions from fossil fuel consumption, this system significantly reduces carbon emissions and promotes a cleaner and more sustainable maritime sector.
To sum up, implementing an N-RHES offers a viable and promising solution for decreasing emissions in the maritime sector. Although challenges exist, the case study showcased such a system’s technical feasibility and economic viability. With its potential for reliable and sustainable energy generation, the N-RHES represents a critical step towards a greener future for the maritime industry.
To further enhance our understanding and inform future analyses, it is highly recommended to undertake comprehensive investigations involving the variation of investment costs in the proposed Nuclear-Renewable Hybrid Energy System (N-RHES). The cost of implementing an energy system is intricately influenced by many factors, including but not limited to equipment procurement, construction expenses, technological advancements, regulatory requirements, and operational and maintenance costs. By delving into the sensitivity analysis of these cost-related factors, we can gain invaluable insights into the financial viability and long-term sustainability of the N-RHES.


