Article

Analysis of Flow and Pressure Drop on Tube Side of Spiral Tube Heat Exchanger under Sloshing Conditions

1
Key Laboratory of Cold Region Urban and Rural Human Settlement Environment Science and Technology, Ministry of Industry and Information Technology, School of Architecture, Harbin Institute of Technology, Harbin 150000, China
2
China National Offshore Oil Corporation Gas and Power Group, Beijing 100028, China
3
School of Marine Science and Technology, Northwestern Polytechnical University, Box 24, Xi’an 710072, China
*
Authors to whom correspondence should be addressed.
Energies 2023, 16(14), 5263; https://doi.org/10.3390/en16145263
Submission received: 6 June 2023 / Revised: 5 July 2023 / Accepted: 7 July 2023 / Published: 9 July 2023
(This article belongs to the Special Issue Clean Heating and Energy Efficient Use)

Abstract

:
The utilization of the spiral tube heat exchanger (SHE) has become increasingly prevalent in large-scale liquefaction processes. However, the flow pattern and frictional pressure drop of two-phase flow in the spiral tube have been scarcely studied, particularly under offshore sloshing conditions. An experimental system had been developed to explore the flow pattern and frictional pressure drop characteristics of mixed hydrocarbon fluid in a spiral tube. Moreover, these have been developed in order to examine the effects of sloshing style (roll, pitch, heave), sloshing period (5–15 s), sloshing amplitude (5–15° or 50–150 mm), mass flux (200–800 kg/(m2·s)), vapor quality (0–1), and saturation pressure (2–4 MPa) on the frictional pressure drop of methane/ethane mixture in the spiral tube. The results indicated that sloshing conditions reduce the frictional pressure drop, thereby enhancing fluid flow. A correlation was established to predict the sloshing factor of frictional pressure drop, and the MARD under verification conditions was 6.04%. Furthermore, three flow pattern boundaries were proposed based on We* as an indicator.

1. Introduction

As economic development has been leaping forward, the conflict between energy and the environment has become increasingly acute. The rising living standards of residents have prompted a surge in energy consumption intensity, particularly in the construction sector [1,2]. Current data indicate that building energy consumption in developed nations accounts for 40% of total social energy consumption, and this proportion is on the rise with the deepening of urbanization [3]. Natural gas, with its high hydrogen–carbon ratio and calorific value, possesses the advantages of being a cleaner and more efficient fuel compared to other fossil fuels. The exploitation of clean energy natural gas and the vigorous development of urban gas have been identified as effective methods for balancing resources and environmental challenges.
In light of the low-carbon trend and energy security, the production and trade of liquefied natural gas (LNG) have garnered increasing attention in recent times [4]. Considering the abundance of marine natural resources, natural gas development has emerged as the next frontier in the natural gas industry. However, due to geographical and spatial constraints, floating liquefied natural gas (FLNG) plants have become the primary option for offshore natural gas development [5]. FLNG is a mobile composite equipment that enables the production, refining, storage, loading, and unloading of LNG at sea. As a self-contained production device from drilling to liquefaction, FLNG obviates the need for land storage equipment or submarine pipelines, thereby offering the advantage of protecting the submarine ecosystem. The spiral tube heat exchanger (SHE) is the core component of natural gas liquefaction, and the liquefaction process is completed internally. Because the internal two-phase flow heat transfer process is complex and variable and the mechanism is still unclear, SHE is the highest cost and the most difficult section in the FLNG system. The small footprint, high heat transfer efficiency, and ability to facilitate cross heat transfer of multiple streams have rendered the SHE a popular choice for use in large-scale liquefaction plants [6]. The SHE comprises several groups of spiral tubes. During the natural gas liquefaction process, the hot fluid (hydrocarbon refrigerant) flows from bottom to top within the tubes, while the cold fluid on the shell side flows from top to bottom between the respective layers of spiral tubes, allowing for countercurrent heat transfer. Typically, during the flow process in the tube side of SHE, the condensation of hydrocarbon refrigerant will occur. Additionally, in the typical flow process of phase transition in the tube, notably for the non-azeotropic mixed working fluids, the temperature slip results in the complexity of the heat transfer [7].
During two-phase flow in a tube, the gas–liquid interface undergoes shape changes that result in distinct flow patterns. These patterns are influenced by momentum and heat transfer during the condensation process, and the two-phase flow exhibits significant chaotic characteristics [8,9]. To define these flow patterns conveniently, the flow pattern map method is commonly employed. In 1954, Baker et al. [10] introduced a flow pattern map for two-phase flow in a horizontal tube, which categorized the flow regimes into bubble flow, slug flow, stratified flow, wavy flow, and mist flow. Mandhane [11] expanded on the work of Govier and Aziz [12] by using the gas–liquid phase superficial velocity as the coordinate system for the flow pattern map. Moreover, the researcher also proposed a presently extensively used flow pattern map. A flow pattern map was also proposed by the researcher, which has become extensively utilized at present. This map effectively elucidated the impact of flow velocity and pipe size on the flow pattern. However, it cannot account for the influence of fluid physical properties. To address this limitation, Weisman [13] conducted a study on the effect of physical parameters and pipe diameter on the flow pattern. He employed a combination of observation method and pressure signal to distinguish the flow pattern and selected a modified gas–liquid phase superficial velocity as the coordinate. Subsequently, Taitel [14] introduced a theoretical criterion based on the actual transition physical mechanism of the flow pattern. Barnea [15] then conducted experiments to verify the flow pattern map proposed by Taitel. In comparison to the horizontal tube, the study of flow patterns in the spiral tube had been relatively delayed. Whalley et al. [16] conducted research on stratified and annular flow in air–water two-phase flow in the spiral tube. However, they did not consider the secondary flow in the spiral tube, resulting in significant differences between the pressure drop data and experimental data. Mujawar [17] extended Lockhart and Martinelli’s correlations to spiral tubes. The findings indicated that slug flow was the most common flow pattern in the spiral tube, and the flow pattern in the tube was consistent with the one in the horizontal tube. Chen et al. [18,19] conducted a systematic analysis of the flow pattern in the spiral tube and developed a flow pattern map. Simultaneously, the Weber number and liquid Dean number were introduced to characterize the effect of surface tension and secondary flow. Yan [20] analyzed air–water and R113 gas–liquid two-phase flow in a spiral tube using a high-speed framing camera and identified plug flow, slug flow, and annular flow in the tube. According to Yan’s findings, the stratified flow was unlikely to occur in the spiral rising tube, and the slug flow occupied the original region in the flow pattern map. Murai [21] conducted a study on two-phase flow in the helical tube using two high-speed framing cameras (front and vertical). The results showed that the stratified flow did not appear in the spiral tube, and the bubble flow region became narrower with a decrease in the spiral diameter. However, it should be noted that the range of gas velocity was limited in Murai’s experiment, and the wavy flow and annular flow were not considered.
When SHE is utilized in the FLNG industry, the heat exchanger is subject to tilting, swaying, and fluctuation due to the influence of oceanic conditions. This can have a significant impact on the stability and internal flow of SHE, and the existing correlations of frictional pressure drop are inadequate in predicting the frictional pressure drop in the tube [22]. To ensure the proper functioning of the equipment, it is necessary to conduct research on the two-phase flow characteristics under offshore conditions. Currently, there is limited research on the effect of offshore sloshing on the frictional pressure drop of two-phase flow in a spiral tube. Zhu et al. [23] analyzed the uniform distribution characteristics in the plate-fin heat exchanger during sloshing conditions and found that sloshing reduces the uniform distribution of the flow. Yu et al. [24] explored the impact of rolling on the flow characteristics of the working medium in a rectangular channel and concluded that the angular velocity of rolling was the most significant factor affecting the flow rate. Zhang et al. [25] conducted a study on the impact of rolling motion on the frictional pressure drop of single-phase working medium in a horizontal tube, and developed a frictional factor to indicate the effect of rolling motion on the frictional pressure drop. Extensive research has been conducted on the classification of condensing two-phase flow patterns through the study of horizontal tube, inclined tube, and spiral tube, resulting in the development of various dimensionless numbers. While many scholars have studied the distribution [26,27,28], flow pattern division [29,30,31], and transformation criteria [21,32] of two-phase flow in the tube, research on the two-phase flow in the helical tube of mixed hydrocarbon refrigerant remains relatively scarce.
At present, the effect of offshore sloshing on the two-phase flow and pressure drop in the SHE for FLNG remains unclear. Given the operation characteristics of the FLNG unit, it is crucial to analyze the effect of operation and sloshing conditions on the condensation pressure drop of mixed hydrocarbon medium in spiral tubes. Through experimental analysis, the effects of operation and sloshing conditions on frictional pressure drop were quantitatively evaluated, providing valuable guidance for the study of condensation flow in this type of spiral tube.

2. Experimental System Design

2.1. System Design

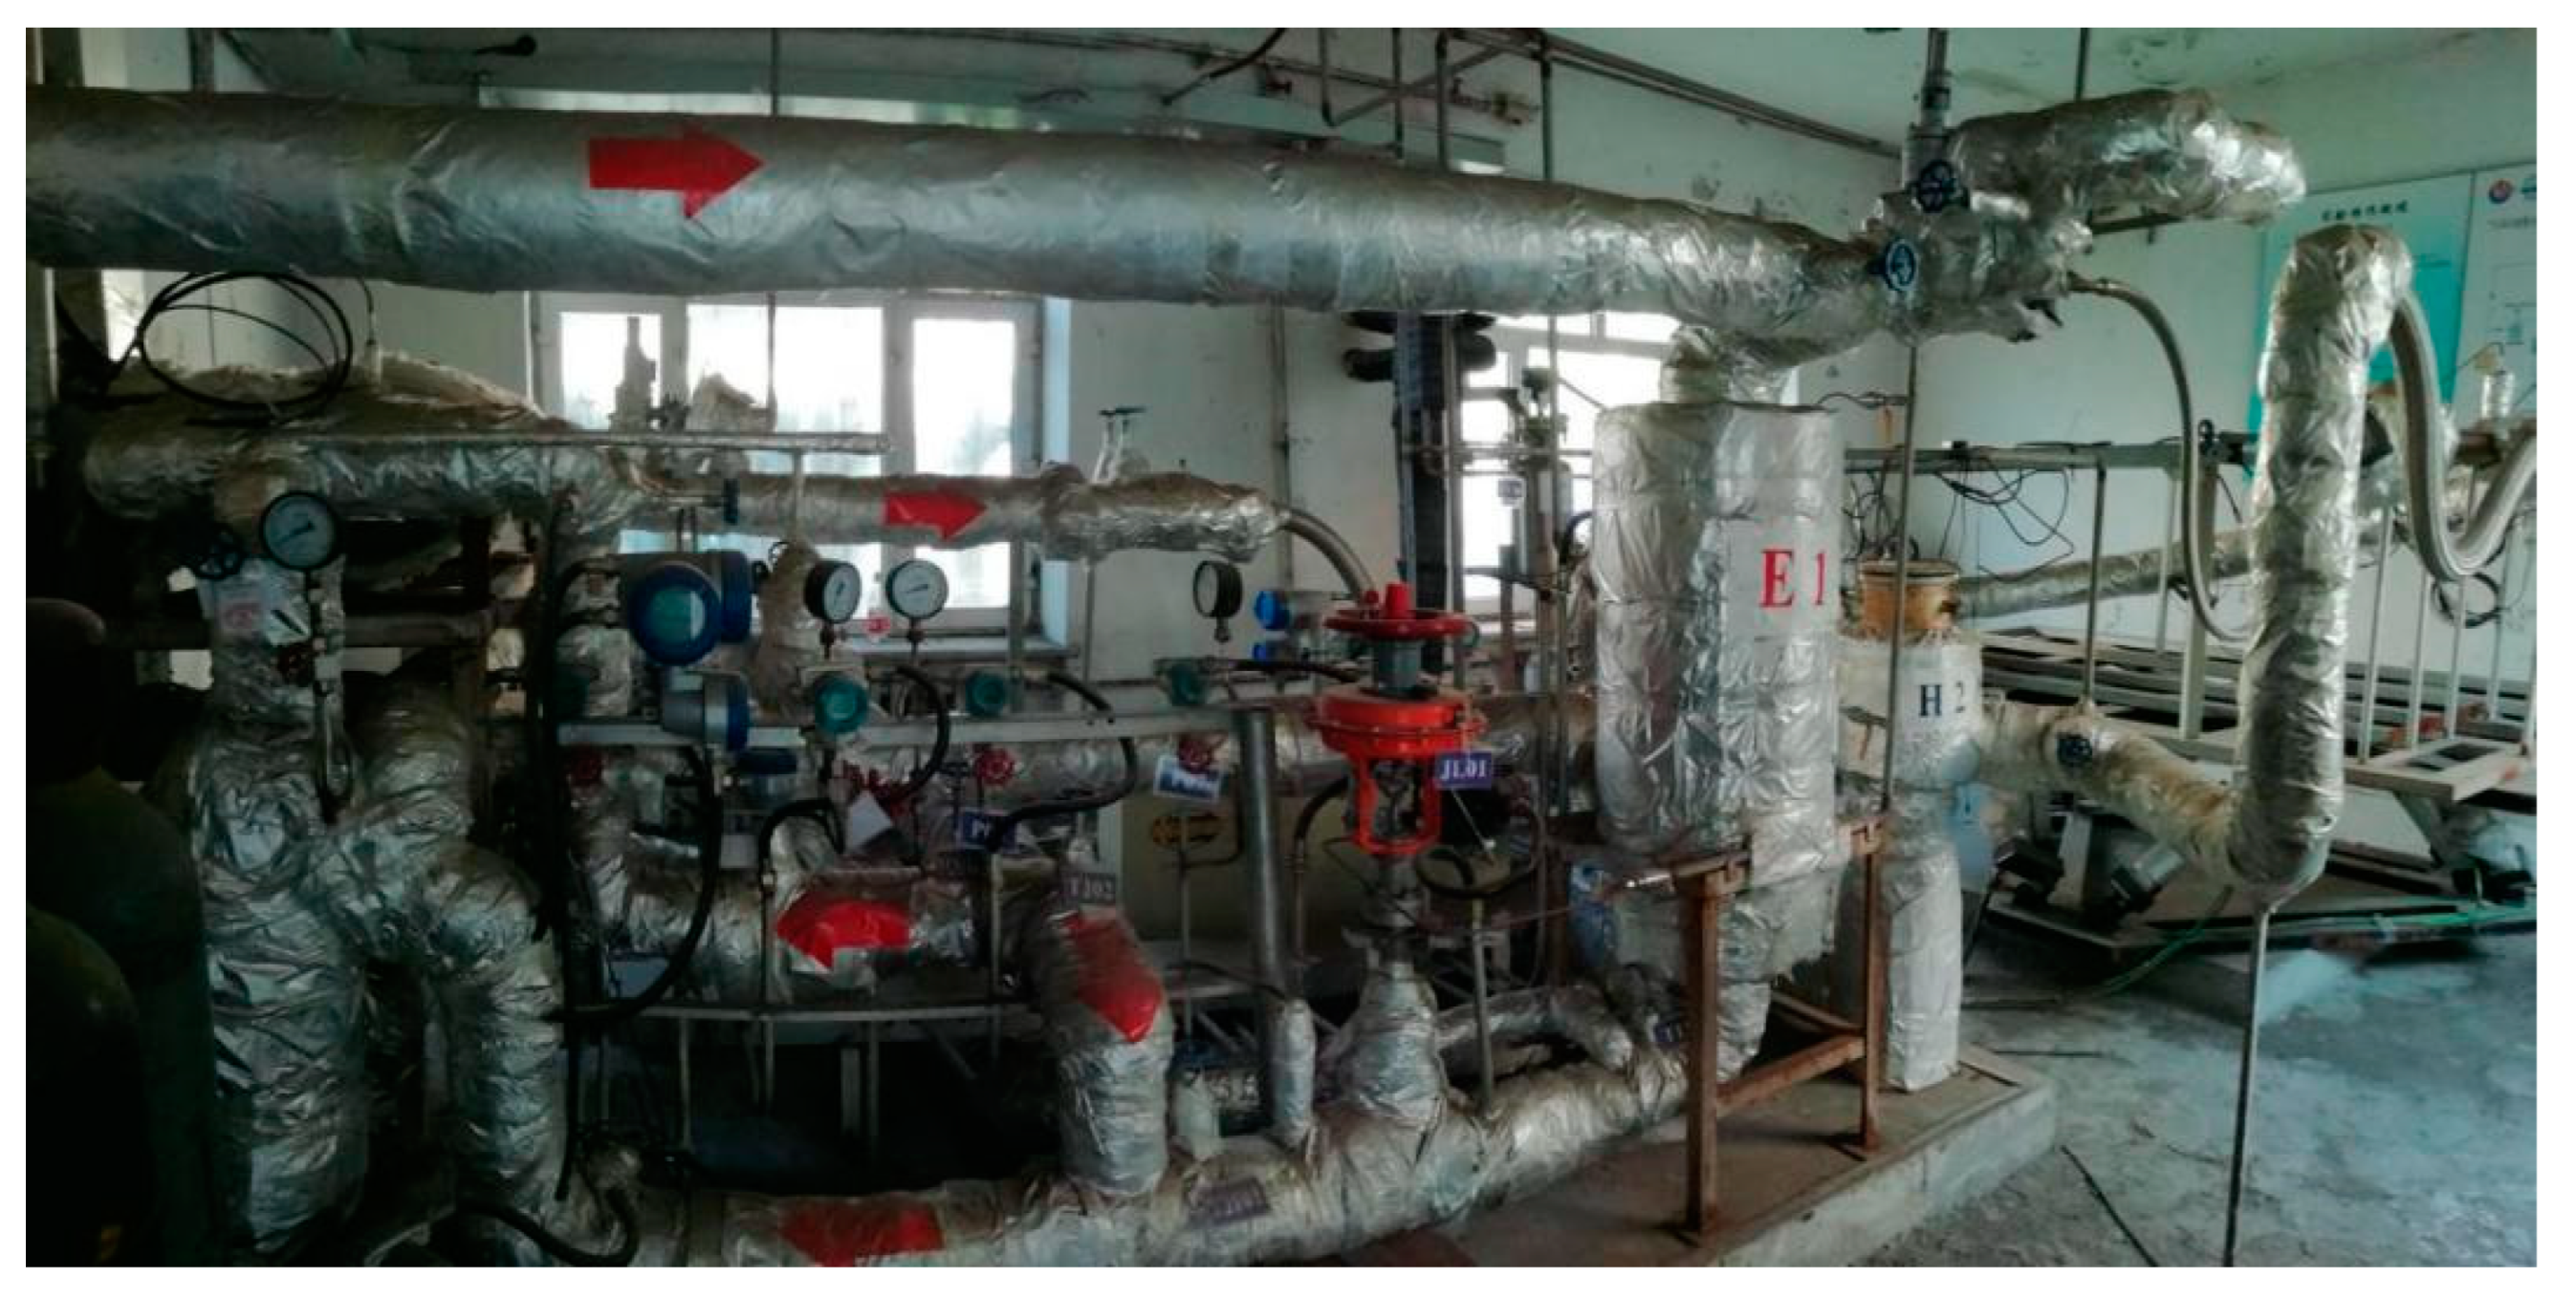
The experimental system comprises three components: a measuring system, a cooling system, and an external cold source system. Figure 1 illustrates the flow chart of the experimental system, while Figure 2 presents its physical diagram. The primary equipment utilized in the system is detailed in Table 1.

2.1.1. Measuring System

The measuring system comprises various equipment, including the test sample, heat exchanger, regulating valve, buffer tank, observation window, pump, and heater. The mixed refrigerant (C1/C2) flows through the test sample (U) and then enters the heat exchanger (E1) for the purpose of cooling. Subsequently, the supercooled mixed refrigerant undergoes throttling and depressurization via the regulating valve (V). Following the throttling process, C1/C2 is further cooled through the buffer tank (C) and heat exchanger (E2), ensuring that the mixed refrigerant remains in a supercooled state. The low-pressure and low-temperature C1/C2 is directed to the pump (P), which elevates the pressure and maintains a consistent mass flux. Subsequently, the mixed refrigerant undergoes heating via the heater (H1) to adjust the vapor quality. To ensure precise temperature measurement of the mixed refrigerant, a stirring device is installed at the outlet of H1. This device facilitates thorough mixing of the gas–liquid phase, thereby ensuring the accuracy of temperature measurement at the T7 point, which is affected by temperature variations between the gas and liquid phases. Once the flow pattern reaches full development, the mixed refrigerant enters U through the observation window (S1), thereby completing the cycle.
To attain the desired offshore sloshing conditions, the test sample is placed on the sloshing platform. The static and sloshing components of the measurement system are interconnected via vacuum hoses, thereby enhancing the safety of the experimental apparatus. Observation windows are positioned at both the inlet and outlet of the test specimen to facilitate the visualization of the flow patterns exhibited by the mixed refrigerant within. In addition, the flow pattern images can be remotely transmitted for analysis purposes.

2.1.2. Cooling System

The cooling system comprises various components, including a pump, cryogenic refrigerator, heater, and other equipment. The working medium utilized in this system is liquid isobutane. Upon passing through the pump (P2), the isobutane experiences an increase in pressure. Subsequently, it undergoes cooling via the cryogenic refrigerator (R). To ensure precise temperature control of the isobutane, it is directed to the heater (H2) after passing through R for temperature regulation. Once the isobutane meets the experimental conditions, it enters U to complete the cycle. In order to accommodate the sloshing conditions, the static and sloshing components of the cooling system are interconnected using vacuum hoses.

2.1.3. External Cold Source System

The external cold source system comprises a tank and a heat exchanger, utilizing liquid nitrogen as the working fluid. Liquid nitrogen serves as the cooling agent for the measuring system, enabling rapid cooling of C1/C2 and ensuring the absence of any gaseous refrigerant at the pump inlet. Liquid nitrogen is introduced into E1 to cool C1/C2, resulting in the supercooling of the outflowing C1/C2 from the test sample. Subsequently, the liquid nitrogen continues its cooling process by entering E2, further reducing the temperature of the throttled mixed refrigerant and maintaining it in a supercooled state. By adjusting the flow rate of liquid nitrogen through the regulating valve located at the outlet of the external cold source system, precise temperature control of the mixed refrigerant is achieved.

2.2. Measuring System

In this experimental system, the working fluid employed is the C1/C2 mixture, which operates at significantly low temperatures. To ensure precise data acquisition, the sensor configuration and arrangement of measuring points are subjected to more stringent requirements.

2.2.1. Measuring Point

The test sample, which serves as the central component of the experimental system, is a double-layer sleeve heat exchanger. It consists of an inner tube, made of a copper spiral tube with dimensions of 14 × 2 mm, and an outer tube, composed of a copper tube with dimensions of 32 × 1 mm. Within the test sample, temperature sensors T1–T3 and T4–T6 are positioned at the middle and outlet locations, respectively, to measure the outer wall temperature of the inner tube. These sensors are wall temperature sensors. With the exception of T1–T6, all other temperature sensors are plug-in fluid sensors. T7 and T8 represent the inlet and outlet temperatures of the mixed refrigerant within the test sample, while T9 and T10 correspond to the inlet and outlet temperatures of the isobutane within the test sample. This paper focuses on the analysis of two-phase flow patterns and incorporates observation windows at the inlet and outlet of the test sample to facilitate flow pattern visualization. These observation windows are constructed using double-layer quartz glass to minimize the impact of external temperature on the observed flow patterns. The flow pattern data utilized in this analysis are derived from observations made through the designated observation window (S2).
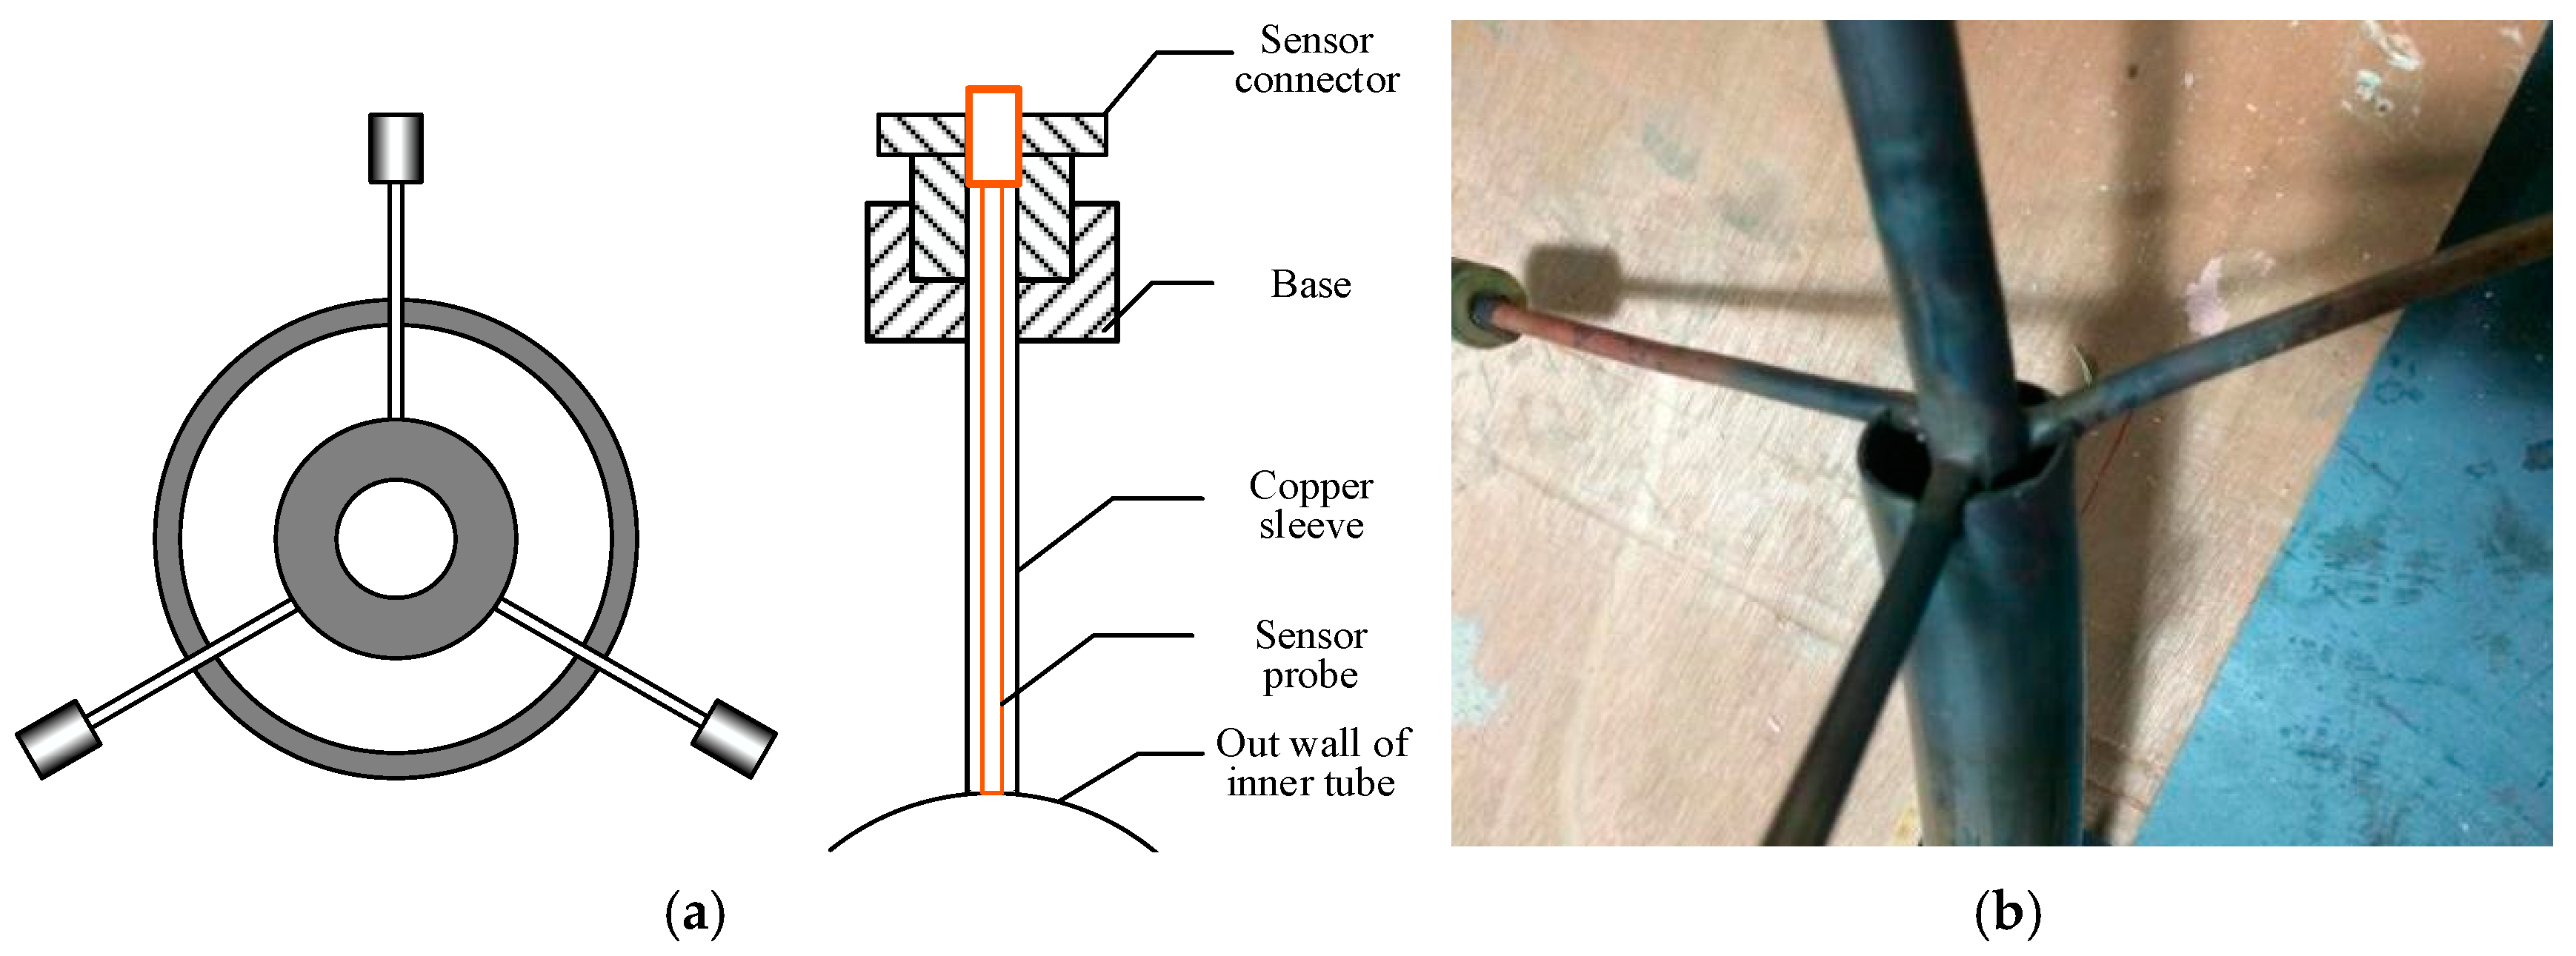
To ensure accurate measurement of the outer wall temperature of the inner tube in the test sample, temperature sensors are established at the middle and outlet positions of the test sample. Each measuring point is equipped with three sensors, which are uniformly distributed on the cross-section of the tube, with one sensor placed every 120°. The outer wall temperature of inner tube at each point is determined by calculating the average value of the three measured values. The inner wall temperature of inner tube can be obtained through thermal conductivity calculation. The arrangement of the sensors is illustrated in Figure 3.

2.2.2. Data Collection System

The acquisition of experimental data is conducted using a programmable logic controller (PLC) equipped with a CPU 224XP. Simultaneously, the EM231 module is connected to facilitate the simultaneous acquisition of multiple data sets. The experimental parameters under study encompass pressure, pressure difference, temperature, and mass flow. These are measured using a pressure sensor, a pressure difference sensor, a platinum resistance temperature sensor (Pt100), and a mass flowmeter. The performance characteristics of the sensors are detailed in Table 2.

2.2.3. Sloshing Platform

The sloshing platform was specifically designed to simulate offshore sloshing conditions, and is capable of sloshing in three styles: roll, pitch, and heave. The operation parameters of the sloshing platform are detailed in Table 3.

2.2.4. Experimental Conditions

The experimental conditions are presented in Table 4. To effectively design the experiment, the experimental conditions must be tailored to encompass four key aspects: working fluid composition, pressure, vapor quality, and flow rate. Additionally, the impact of sloshing parameters on the experimental results must be taken into account.

2.2.5. Frictional Pressure Drop Calculation Method and Error Analysis

The total pressure drop (∆Ptot) observed in the experiment comprises three distinct components: frictional pressure drop (∆Pf), gravity pressure drop (∆Pg), and accelerated pressure drop (∆Pacc). The pressure drop described in this paper is the pressure drop per unit length, Pa/m. Specifically, ∆Pf can be calculated with Equation (1). During the experiment, ∆Ptot is measured and calculated using a pressure difference sensor located at both the inlet and outlet of the experimental section.
Δ P f = Δ P t o t Δ P g Δ P a c c
The accelerated pressure drop ∆Pacc can be obtained by Equation (2).
Δ P a c c = m 2 L [ ( 1 x o u t ) 2 ( 1 ε o u t ) ρ l , o u t + x o u t 2 ε o u t ρ g , o u t ( 1 x i n ) 2 ( 1 ε i n ) ρ l , i n x i n 2 ε i n ρ g , i n ]
where m denotes the mass flux, kg/(m2 s); ρg and ρl represent the density of the gas and liquid, respectively, measured in kg/m3; εin and εout express the volume fraction of the mixture medium at the inlet and outlet, respectively, while xin and xout denote the vapor quality at the inlet and outlet of the mixture medium. To determine the volume fraction in the experimental system, the equation proposed by Rouhani and Axelsson [33] is utilized, with the specific form being as follows:
ε = x ρ g 1 + 0.12 ( 1 x ) x ρ g + 1 x ρ l + 1.18 ( 1 x ) g σ ( ρ l ρ g 0.25 m ρ l 0.5 1
where σ denotes the surface tension, measured in N/m. The gravity pressure drop ∆Pg observed in the measuring medium flowing through the experimental section can be expressed as:
Δ P g = ρ m × g × sin β
where ρm is the average density, which can be calculated by:
ρ m = ρ g , m ε m + ρ l , m 1 ε m x m = 0.5 x i n + x o u t
The pressure difference observed during the experimental test is directly measured using a pressure difference transmitter, which has an accuracy of ±0.1% and an absolute error of 30 Pa. Based on the experimental results, the minimum frictional pressure of the test sample is estimated to be approximately 2000 Pa. Therefore, the calculation error of the frictional pressure drop can be expressed using the following equation:
δ Δ P f Δ P f × 100 % = ± 30 2000 = ± 1.5 %

3. Results and Discussion

3.1. Flow Pattern Transition

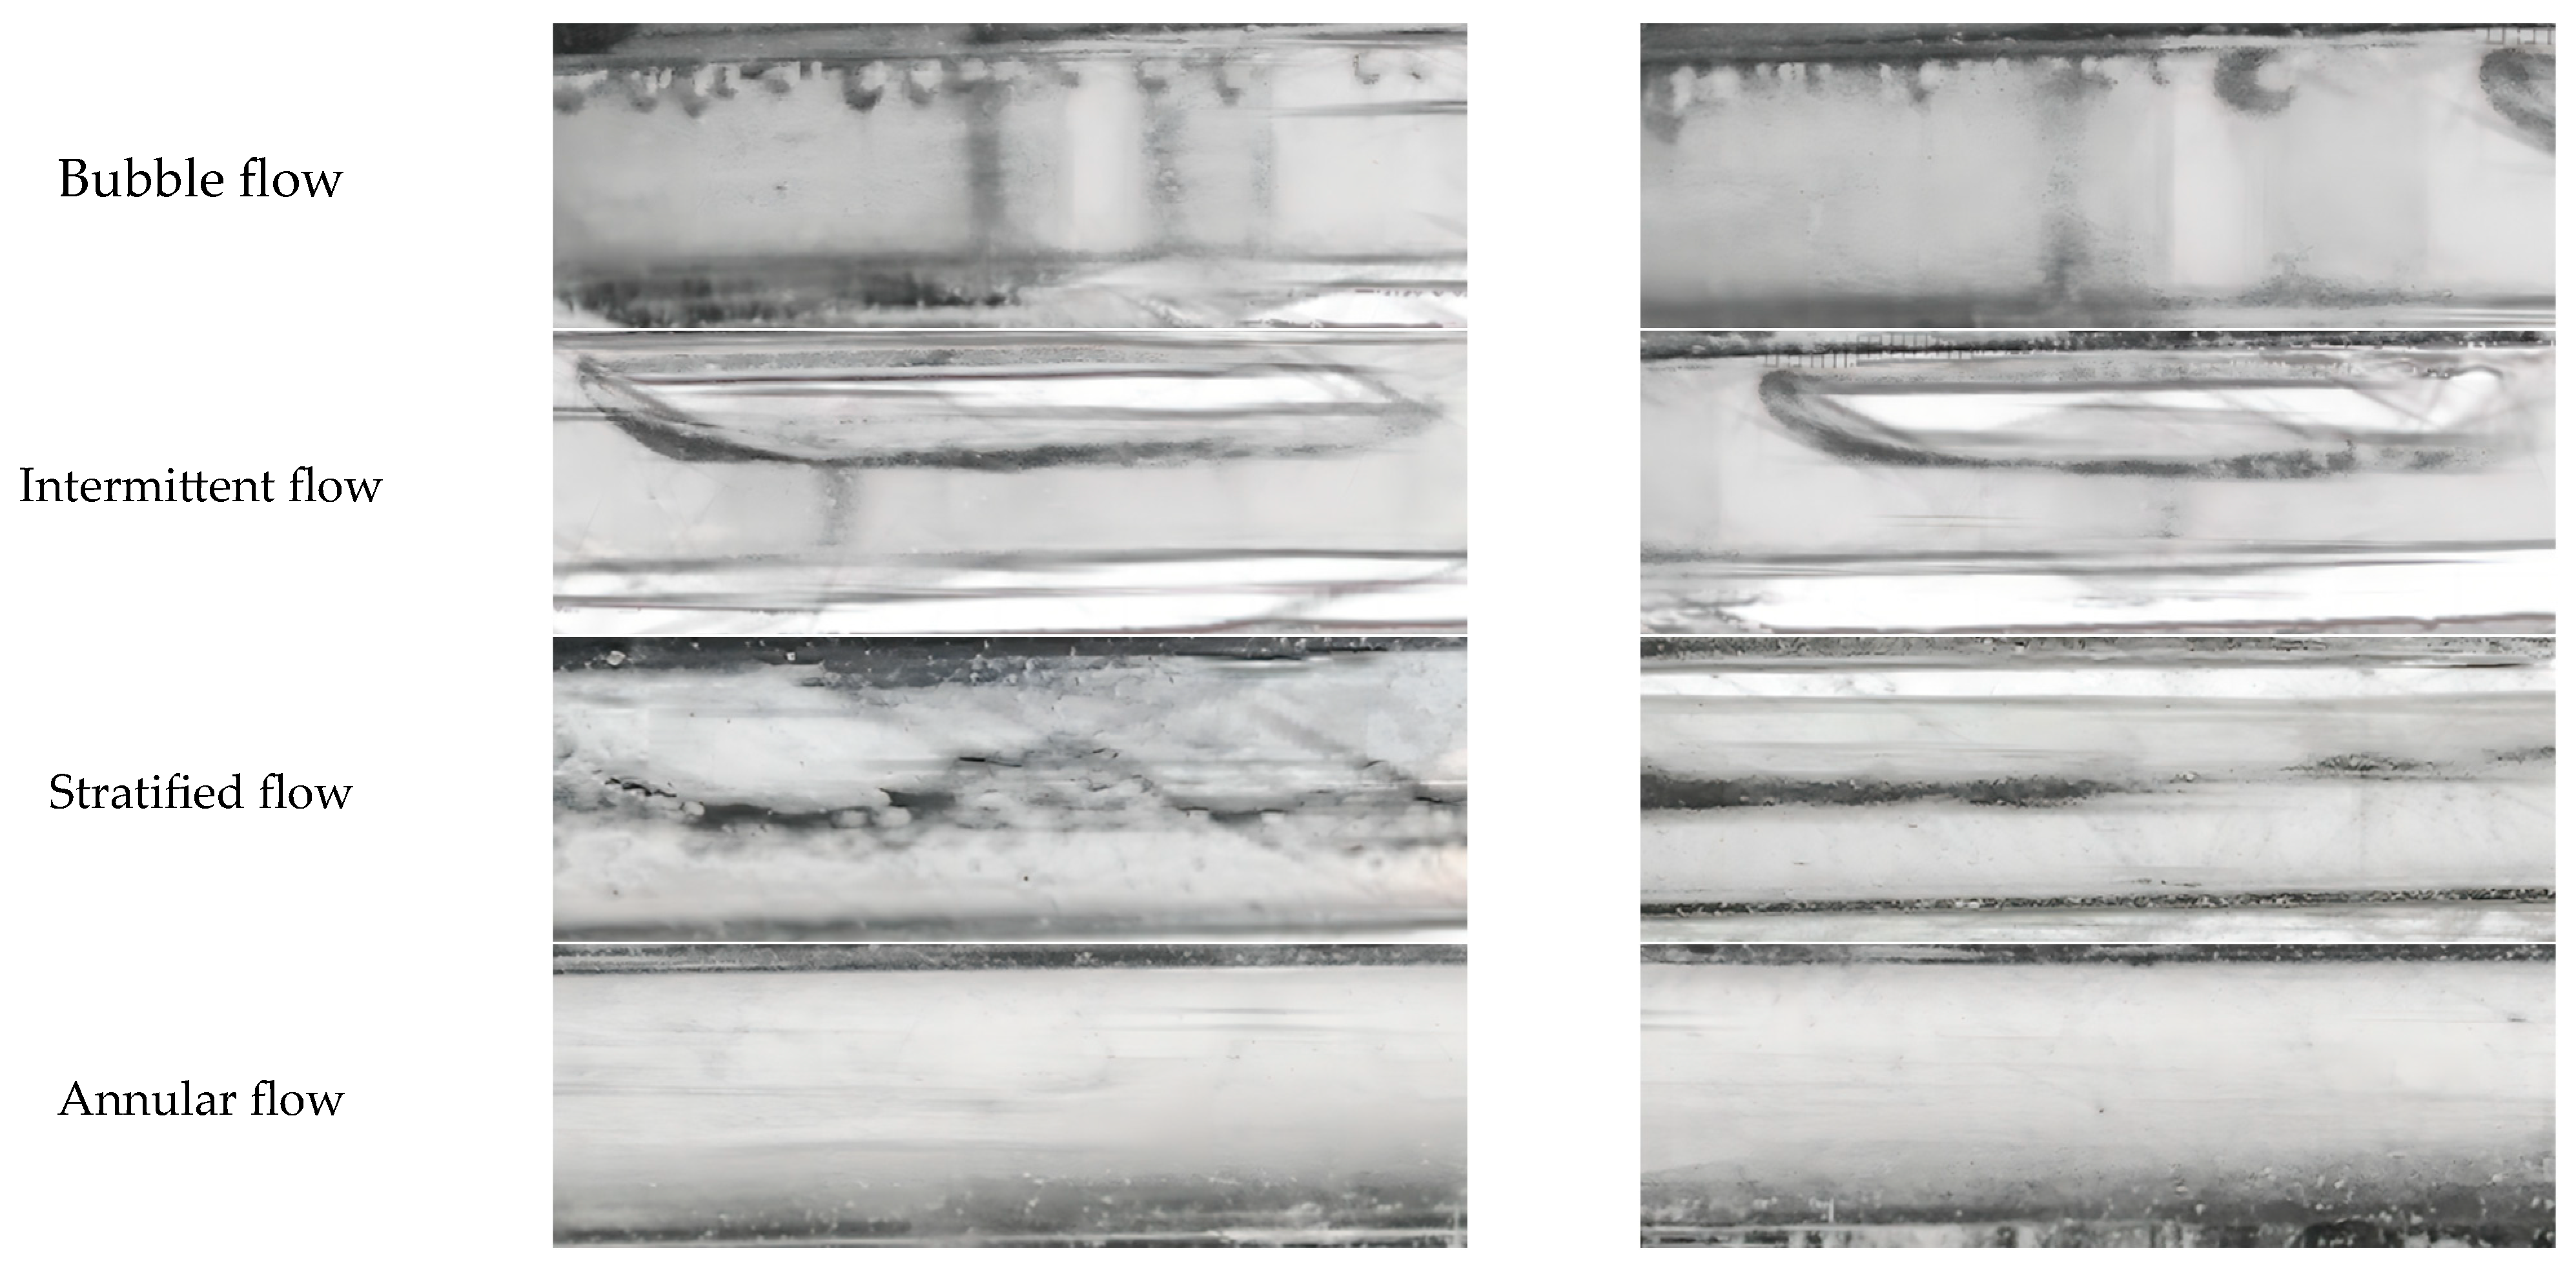
In the course of the experiment, four distinct flow patterns were observed, namely bubble flow, intermittent flow, stratified flow, and annular flow. The flow pattern diagrams are depicted in Figure 4. It was observed that, at constant pressure and flow rate, the aforementioned flow patterns manifest sequentially with the augmentation of vapor quality.
As posited by Soliman [34], the primary hindrances to entrainment are the liquid viscous force and surface tension, while the principal driving force behind mist flow formation is the gas shear force. To predict the transition from mist flow to annular flow, he introduced a modified Weber number, which can be mathematically expressed as:
W e * = 2.45 R e g 0.64 S u g 0.3 1 + 1.09 X t t 0.039 0.4        R e l 1250
W e * = 0.85 R e g 0.79 X t t 0.157 S u g 0.3 1 + 1.09 X t t 0.039 0.4 μ g μ l 2 ρ l ρ g 0.084        R e l > 1250
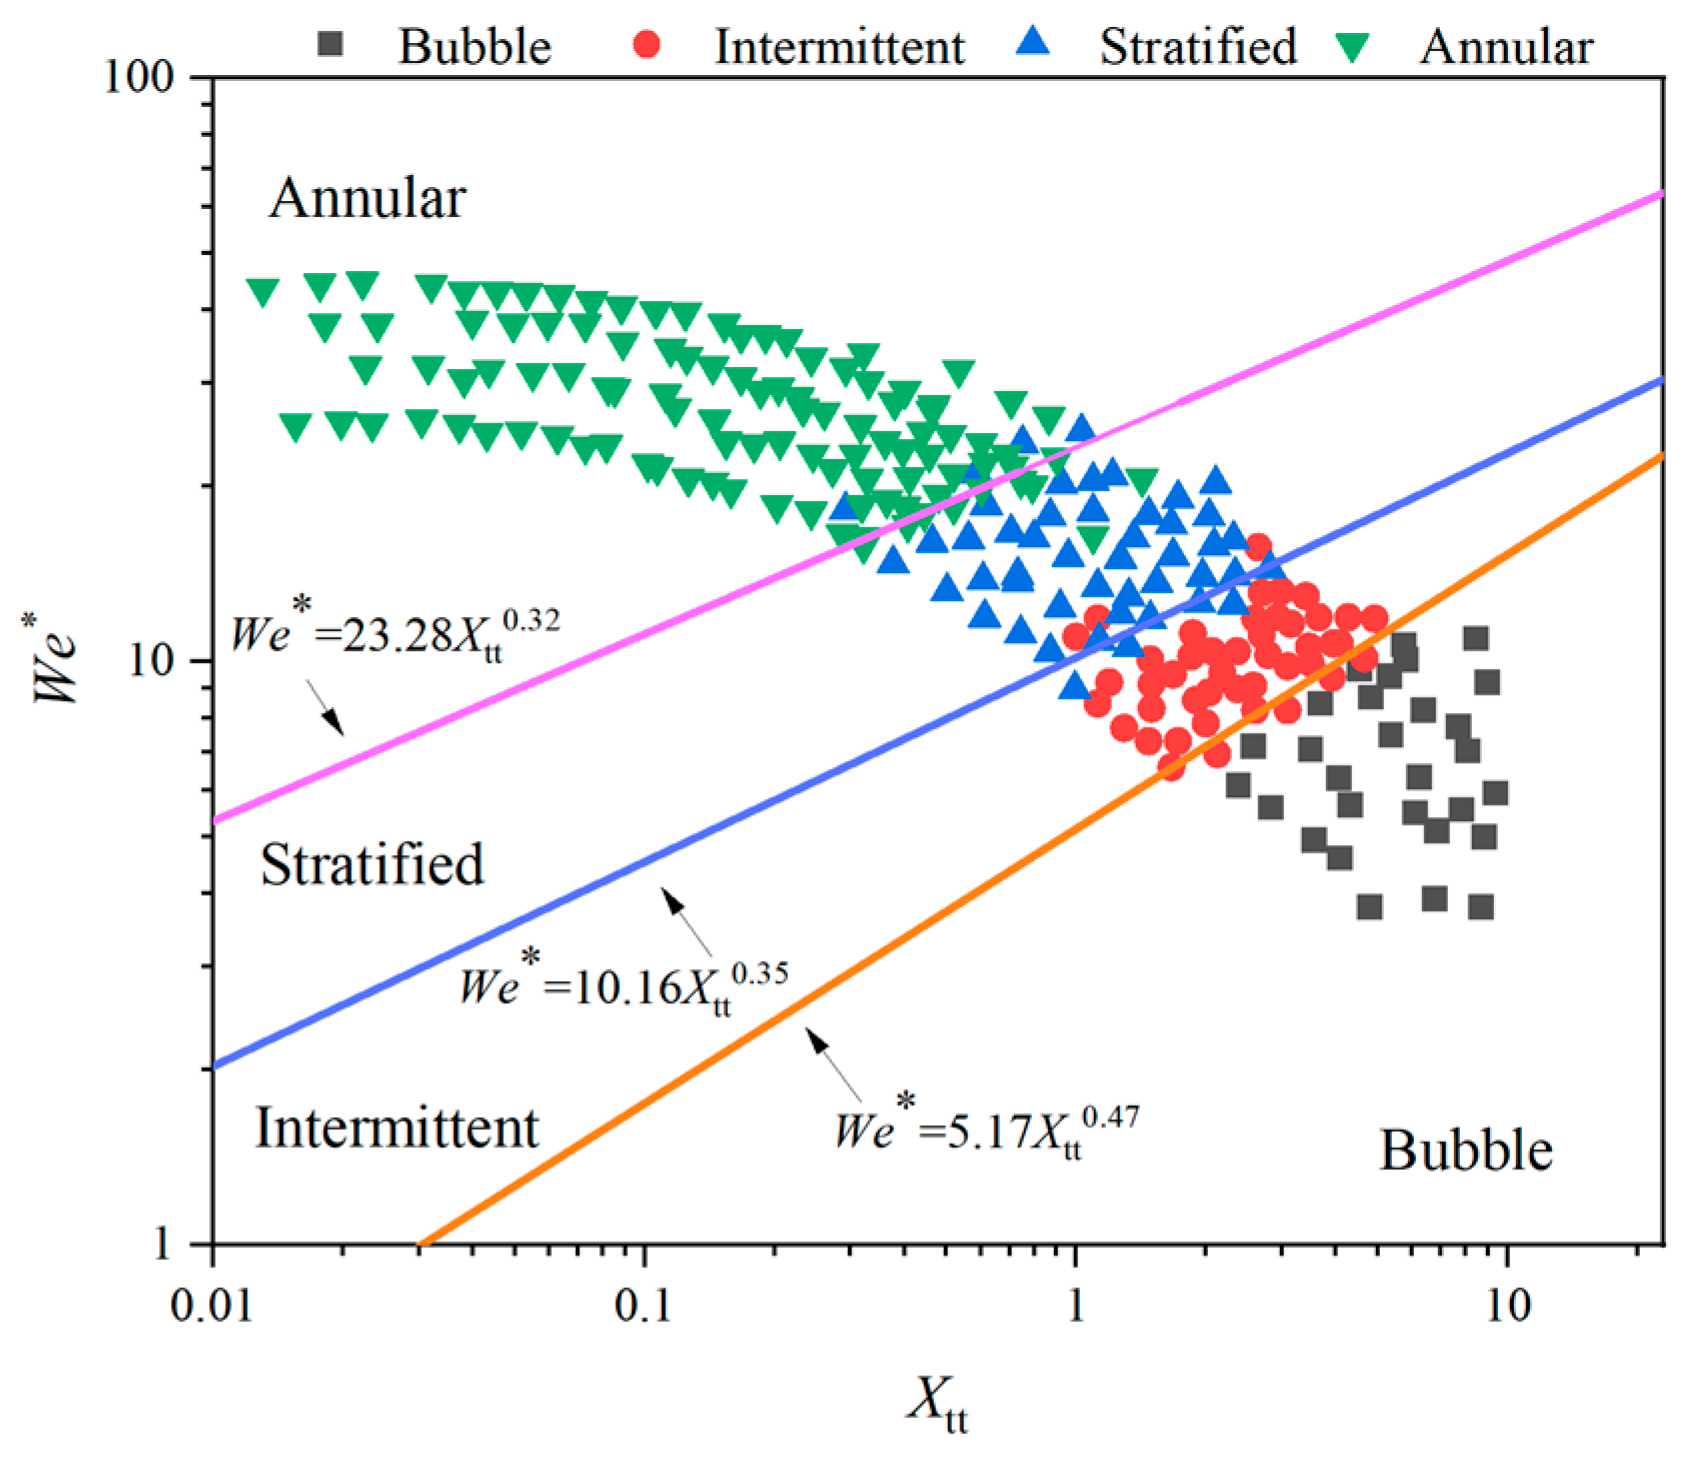
where the Martinelli number (Xtt) is X t t = 1 x x 0.9 μ l μ g 0.1 ρ g ρ l 0.5 , and the Suratman number (Sug) is S u g = ρ g σ d / μ g 2 . He suggested that for We* < 20, the primary flow pattern is annular, while mist flow predominantly occurs in the range of We* > 30. The conversion relationship of annular flow, stratified-wavy flow, and plug flow in a horizontal tube has been defined by Chen et al. [35,36] based on Soliman’s dimensionless parameters. Similarly, Kim et al. [37] proposed the condensation flow pattern transition curve of FC-72 using Soliman’s dimensionless parameters. In accordance with the research findings of Soliman, Chen, Kim, and others, the flow pattern conversion curve for this experiment has been proposed.
Annular   flow   to   stratified   flow   W e * = 23.28 X t t 0.32
Stratified   flow   to   intermittent   flow   W e * = 10.16 X t t 0.35
Intermittent   flow   to   bubble   flow   W e * = 5.17 X t t 0.47
Figure 5 displays the newly plotted flow pattern transition curves. These updated curves have proven to be effective in distinguishing between various flow patterns, thereby establishing a foundation for future research efforts.

3.2. Frictional Pressure Drop

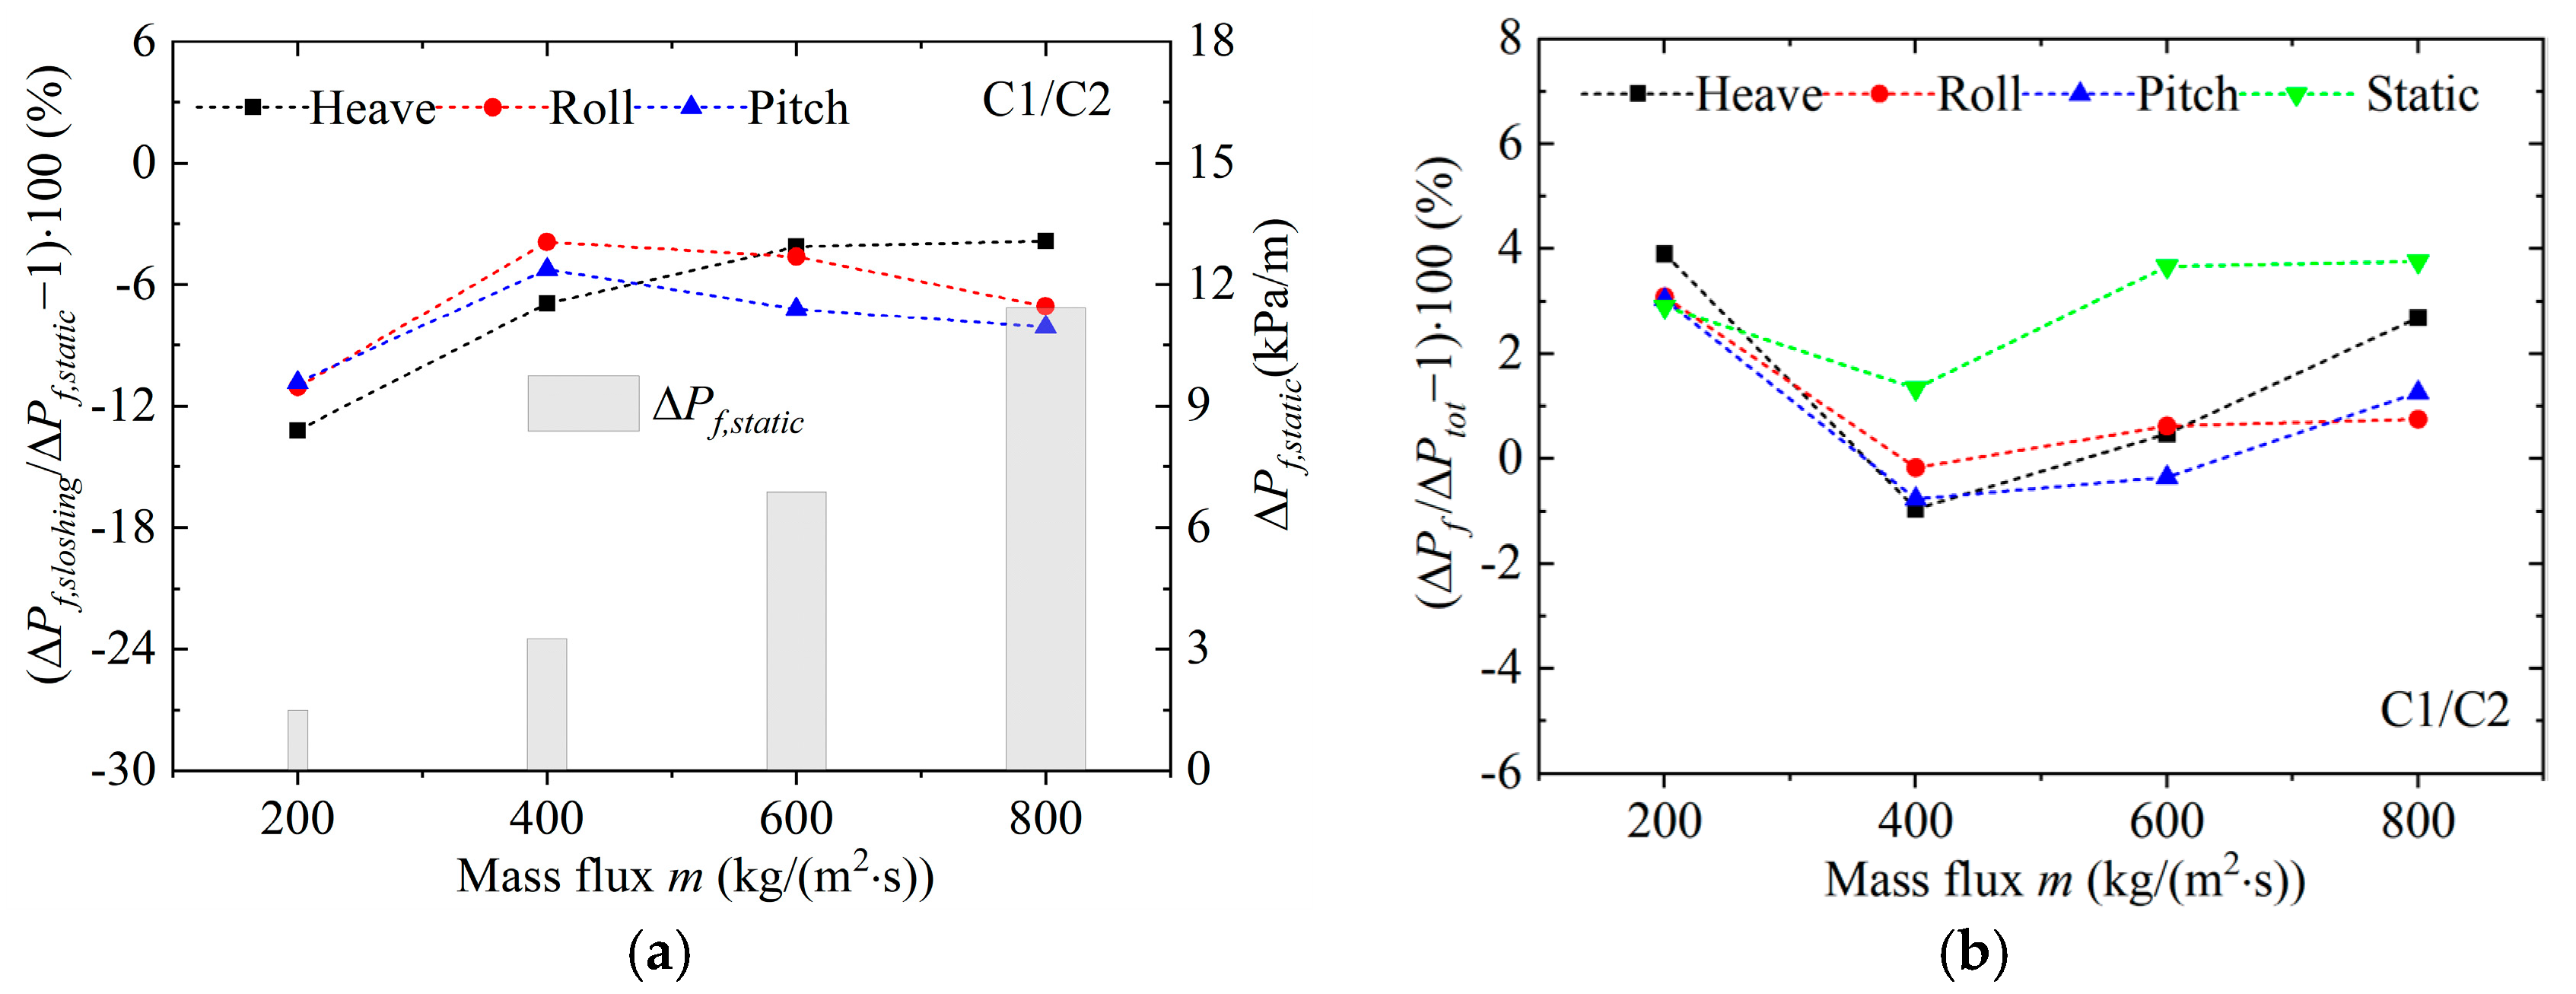
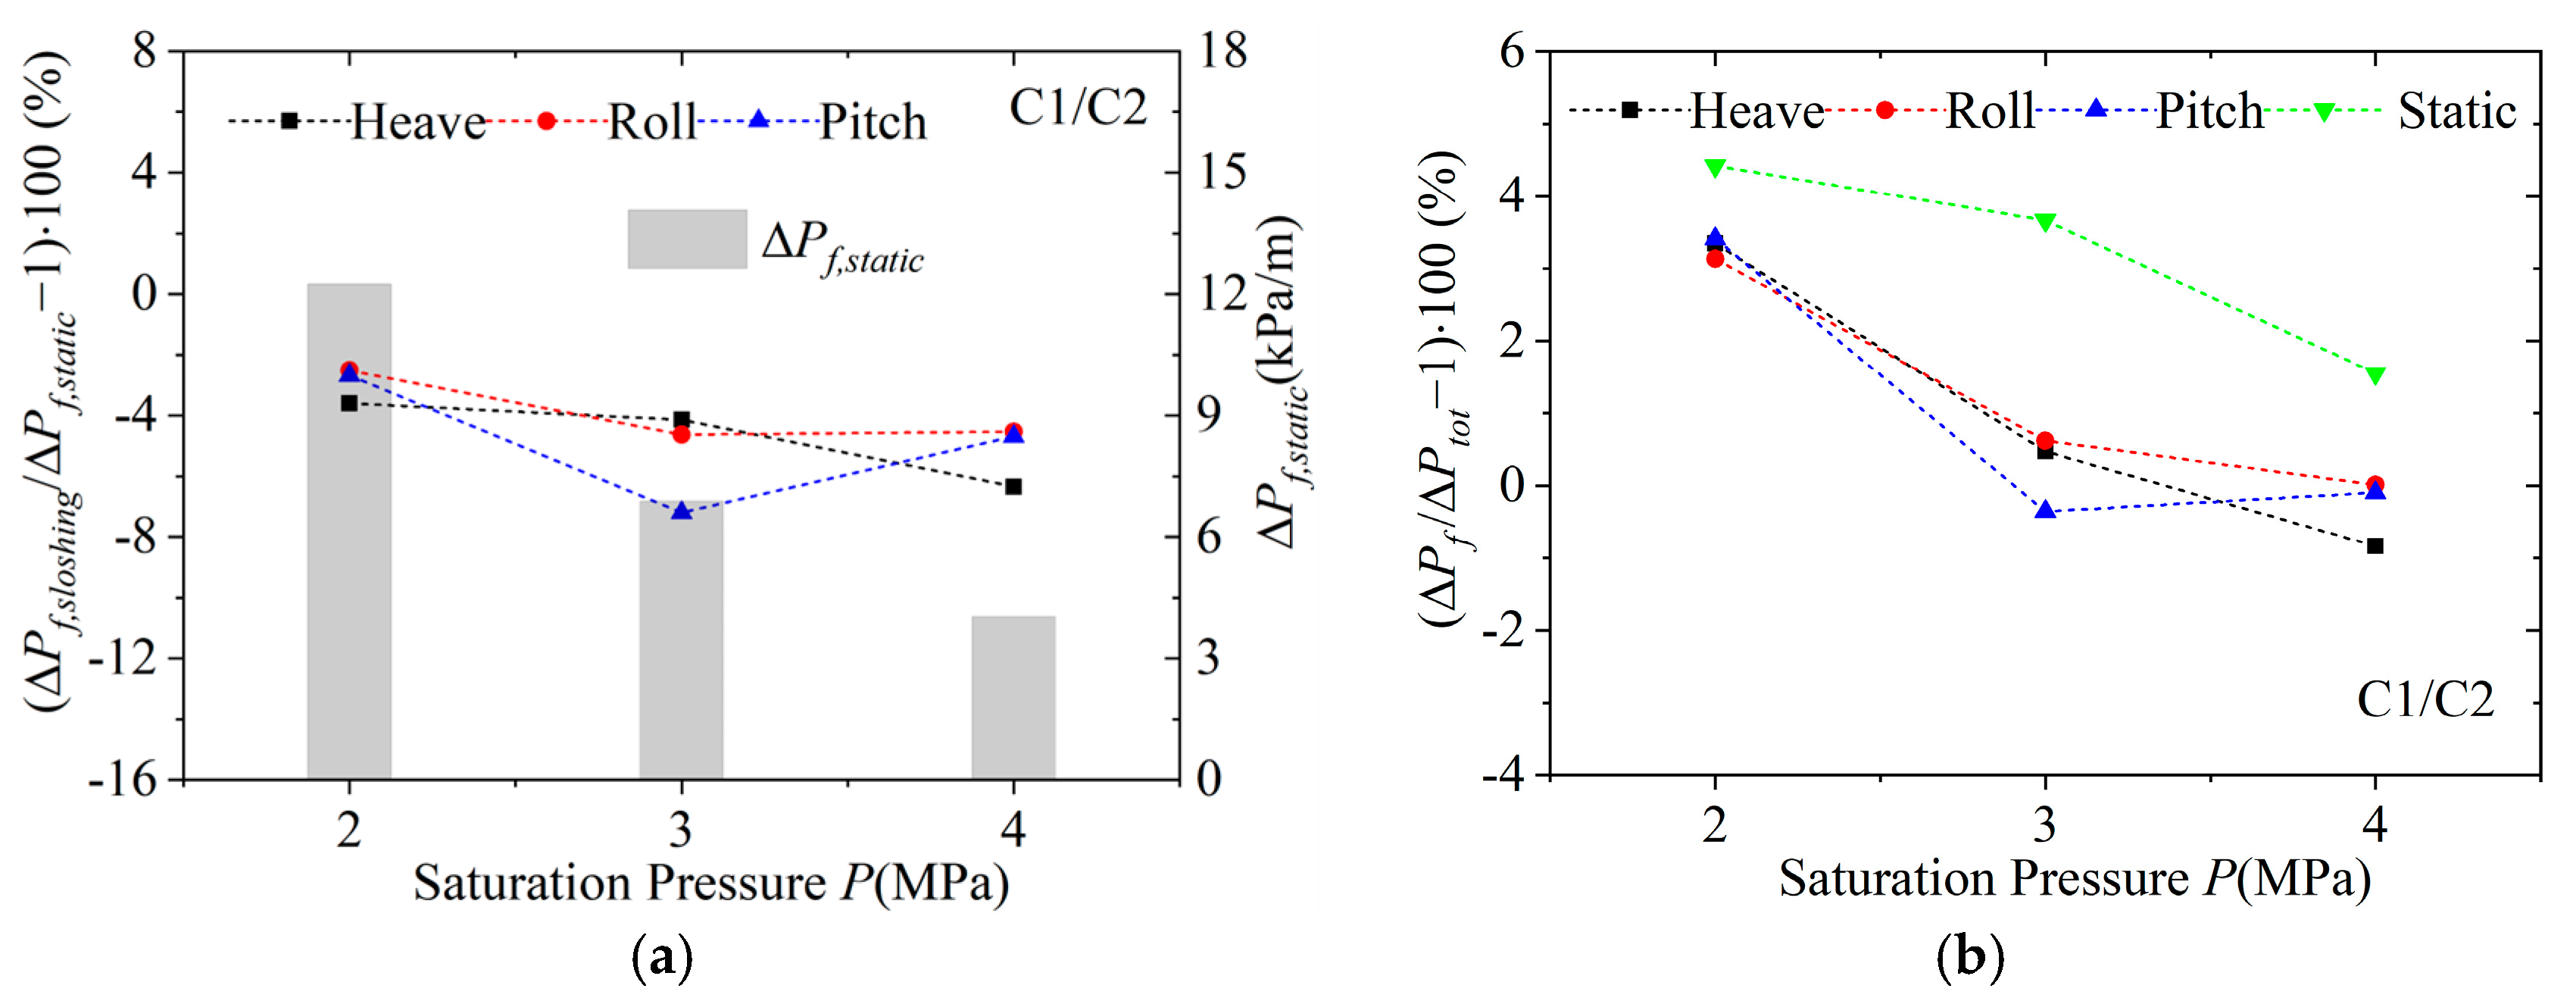
In this study, the effects of sloshing conditions (sloshing amplitude (zmax or θmax) and sloshing period (tc)), as well as operation conditions (mass flux (m), saturation pressure (P), and vapor quality (x), on the frictional pressure drop of C1/C2 in the spiral tube are thoroughly analyzed. In the diagrams of the present section, the bar chart illustrates the frictional pressure drop in static conditions (ΔPf,static), solely presenting a comparison of the outcomes under sloshing conditions. To express the effect of sloshing on the frictional pressure drop, the sloshing factor of frictional pressure drop (ΔPf,sloshingPf,static) is defined.
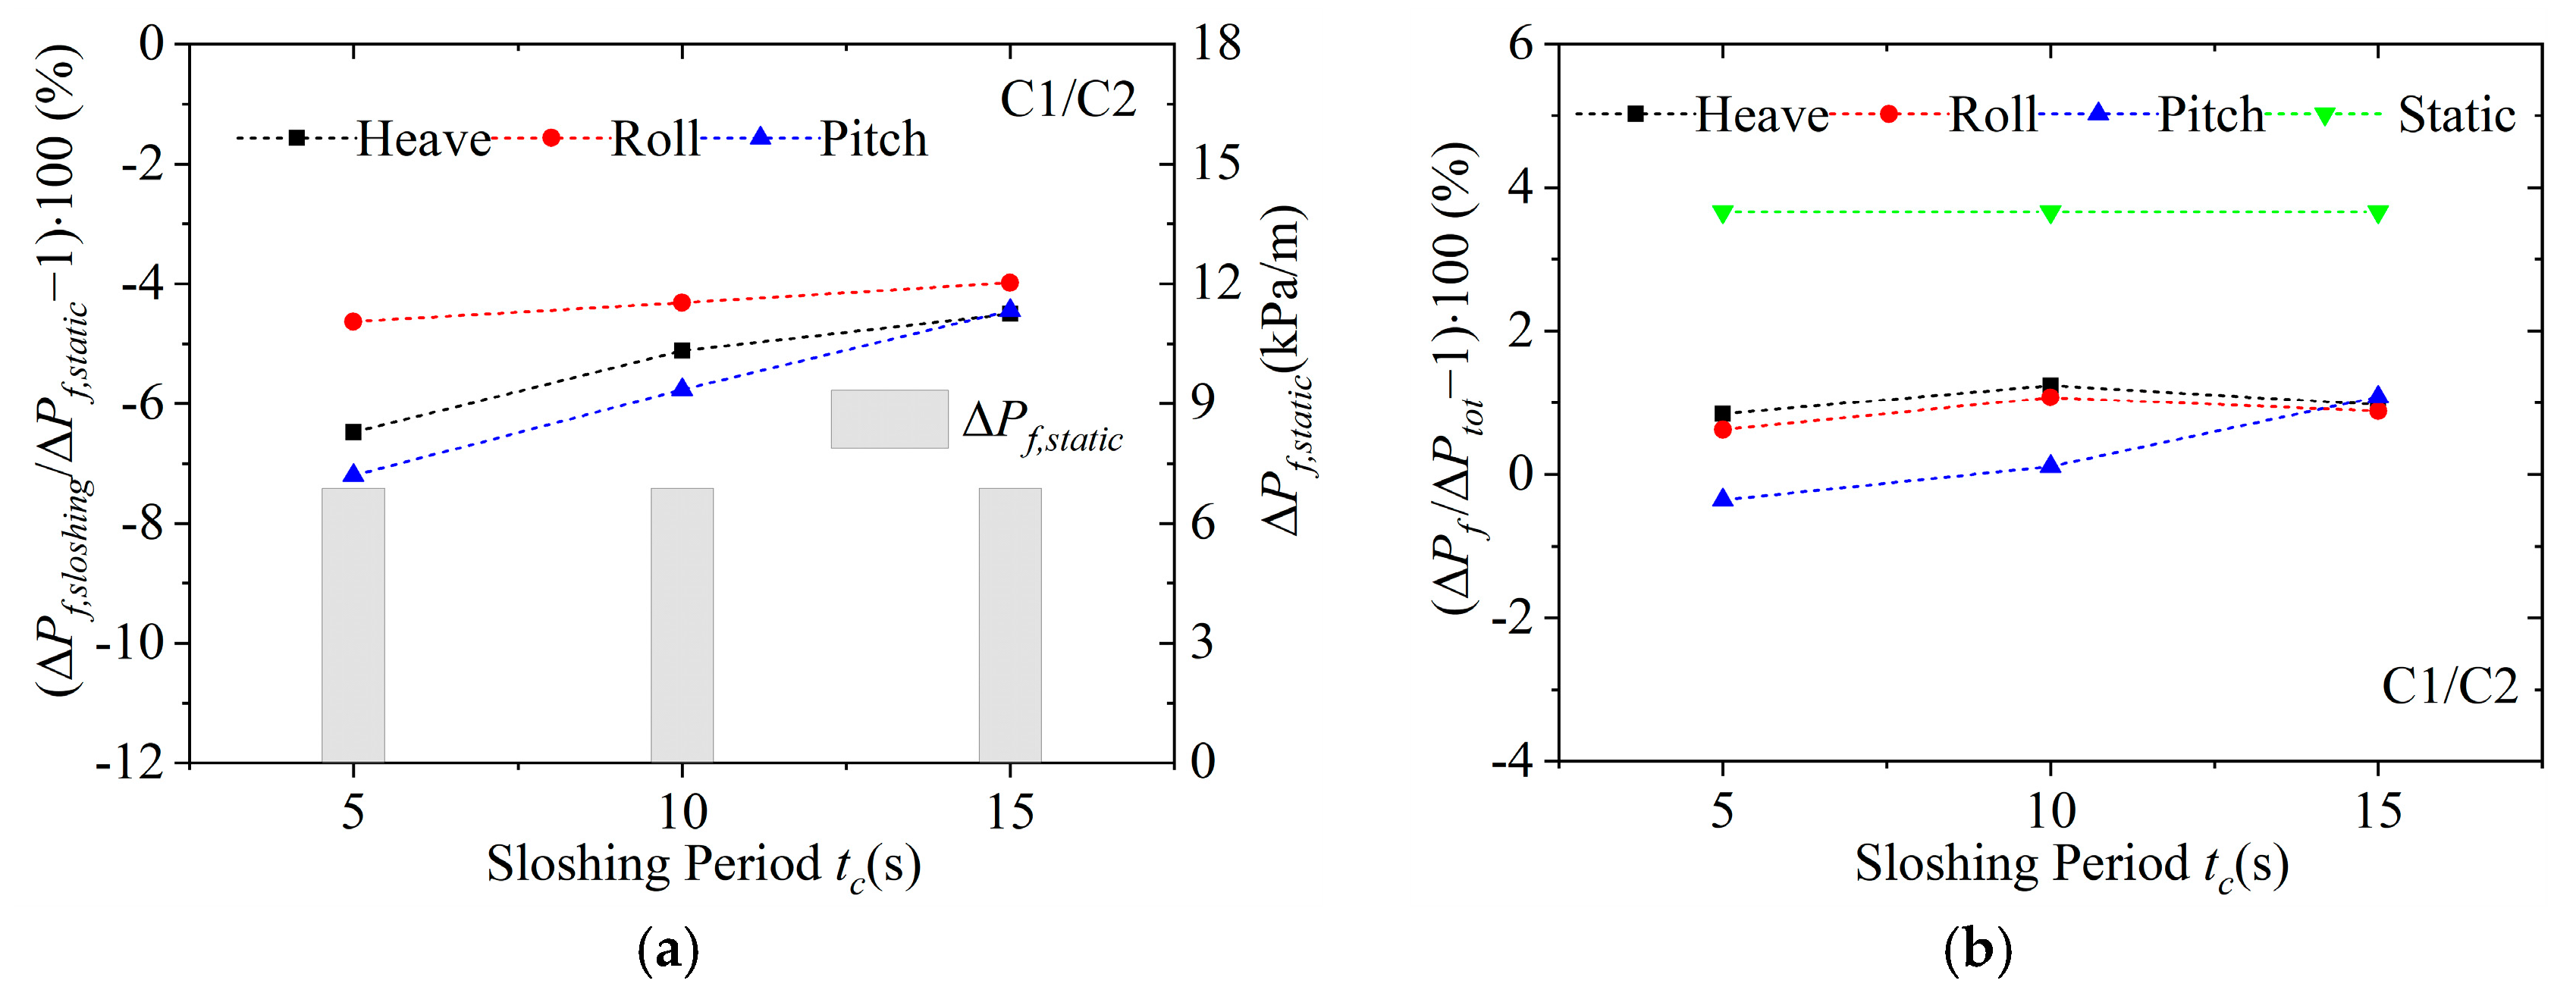
As depicted in Figure 6a, Figure 7a, Figure 8a, Figure 9a and Figure 10a, the sloshing conditions lead to a decrease in the frictional pressure drop, indicating a favorable impact on fluid flow. The even mixing of gas and liquid phases caused by sloshing results in a reduction in the velocity difference between the two phases, thereby lowering the frictional pressure drop. Additionally, sloshing can cause a detachment of a portion of the liquid film, further contributing to the reduction in the frictional pressure drop. Notably, among the examined conditions, pitch exhibits the most significant influence on the frictional pressure drop. As depicted in Figure 6b, Figure 7b, Figure 8b, Figure 9b and Figure 10b, under the static and sloshing conditions, the ratio of frictional pressure drop to total pressure drop (ΔPfPtot) ranges from 98.09% to 104.43%, with an average value of 101.06%. ΔPf is almost the same as ΔPtot.

3.2.1. Effect of Sloshing Conditions

Figure 6 and Figure 7 illustrate the variation of the frictional pressure drop concerning sloshing amplitude (zmax or θmax) and sloshing period (tc) while maintaining constant operation conditions (P = 3 MPa, m = 600 kg/(m2·s), x = 0.6). As the sloshing amplitude increases and the sloshing period decreases, the additional force of sloshing increases, thereby intensifying the impact of sloshing on the fluid. Accordingly, the variation in the frictional pressure drop increases.
Figure 6. Relative difference on frictional pressure drop between sloshing and static conditions vs. sloshing amplitude. (P = 3 MPa, m = 600 kg/(m2·s), x = 0.6, tc = 5 s). (a) The variation of (ΔPf,sloshingPf,static − 1); (b) The variation of (ΔPfPtot − 1).
Energies 16 05263 g006
Figure 7. Relative difference on frictional pressure drop between sloshing and static conditions vs. sloshing period. (P = 3 MPa, m = 600 kg/(m2·s), x = 0.6, zmax = 0.15 m or θmax = 10°). (a) The variation of (ΔPf,sloshingPf,static − 1); (b) The variation of (ΔPfPtot − 1).
Energies 16 05263 g007

3.2.2. Effect of Operation Conditions

Figure 8, Figure 9 and Figure 10 depict the evolution of frictional pressure drop with operation parameters under constant sloshing conditions (tc = 5 s, zmax = 0.1 m or θmax = 10°). Figure 8 reveals that, under static conditions, an increase in mass flux leads to an increase in gas and liquid phase velocity, an increase in shear force between the liquid film and the wall, and an increase in frictional pressure drop, based on the calculation of the thermophysical properties and force analysis of the working fluid inside the tube. Conversely, under sloshing conditions, an increase in mass flux results in an increase in the inertia force of the fluid, an enhancement of the fluid’s ability to maintain its original flow state, and a reduction in the impact of sloshing on the fluid, leading to a decrease in the change in frictional pressure drop.
Figure 8. Relative difference on frictional pressure drop between sloshing and static conditions vs. mass flux. (P = 3 MPa, x = 0.6, tc = 5 s, zmax = 0.1 m or θmax = 10°). (a) The variation of (ΔPf,sloshingPf,static − 1); (b) The variation of (ΔPfPtot − 1).
Energies 16 05263 g008
Figure 9 illustrates that, in static conditions, an increase in vapor quality results in a decrease in average density, while the fluid average velocity and gas–liquid slip ratio both increase, based on the calculation of the thermophysical properties and force analysis of the working fluid inside the tube. This leads to an intensified shear effect between the gas and liquid phases, as well as between the wall and the liquid film, eventually resulting in an increase in frictional pressure drop. Conversely, under sloshing conditions, an increase in vapor quality leads to a decrease in fluid average density and an increase in average velocity, resulting in an increase in inertial force. Simultaneously, the shear force between the gas and liquid phases also increases, leading to a weakening of the effect of additional force of sloshing.
Figure 9. Relative difference on frictional pressure drop between sloshing and static conditions vs. vapor quality. (P = 3 MPa, m = 600 kg/(m2·s), tc = 5 s, zmax = 0.1 m or θmax = 10°). (a) The variation of (ΔPf,sloshingPf,static − 1); (b) The variation of (ΔPfPtot − 1).
Energies 16 05263 g009
Figure 10 depicts the impact of saturation pressure on the gas–liquid slip ratio and gas–liquid phase shear force under static conditions. Based on the calculation of the thermophysical properties and force analysis of the working fluid inside the tube, as the saturation pressure rises, the gas phase density increases while the liquid phase density decreases. This results in a decrease in gas–liquid slip ratio and a weakening of gas–liquid phase shear force. Additionally, the decrease in liquid viscosity further weakens the shear effect between the liquid film and the wall, leading to a decrease in frictional pressure drop. Under sloshing conditions, an increase in saturation pressure leads to an increase in the average density of the fluid and a decrease in the average velocity, resulting in a decrease in inertial force. Accordingly, the effect of additional force of sloshing increases, leading to an increase in the variation of frictional pressure drop.
Figure 10. Relative difference on frictional pressure drop between sloshing and static conditions vs. saturation pressure. (m = 600 kg/(m2·s), x = 0.6, tc = 5 s, zmax = 0.1 m or θmax = 10°). (a) The variation of (ΔPf,sloshingPf,static − 1); (b) The variation of (ΔPfPtot − 1).
Energies 16 05263 g010
Table 5 presents a comprehensive summary of the relative difference in frictional pressure drop observed under varying sloshing styles. In order to enhance the accuracy of predicting frictional pressure drop under such conditions, a sloshing factor for frictional pressure drop (ΔPf,sloshingPf,static) has been introduced for correction purposes.
Δ P f , s l o s h i n g Δ P f , s t a t i c = a ( Z max T ρ l m ) b X t t c x d _ _ _ _ H e a v e a ( π θ max 180 T ρ l m ) b X t t c x d _ _ _ _ R o l l / P i t c h
where Z max T ρ l m and π θ max 180 T ρ l m represent the effect of the inertial force and the additional force of sloshing.
As depicted in Figure 11 and Table 5, it is evident that heave, roll, and pitch can all lead to a reduction in flow drag. Specifically, the alteration rate of frictional pressure drop caused by heave ranges from −14.54% to −1.26%. Moreover, the drag reduction resulting from roll and pitch falls within the range of −17.37% to −0.61% and −16.26% to −1.01%, respectively. Under sloshing conditions, the overall change in the frictional pressure drop ranges from −17.37% to −0.61%. After fitting the experimental data, verification experiments are conducted to validate the new correlation. The fitting coefficients for the sloshing factor of frictional pressure drop under sloshing conditions are obtained and presented in Table 6.
To analyze the predictive capability of the correlation, the average absolute relative deviation (MARD) is chosen as the evaluation metric. The calculation is performed as follows:
MARD = 1 n i = 1 n X p r e ( i ) X e x p ( i ) 1 × 100 %
where Xpre is the prediction value of correlation; Xexp expresses the experiment value.
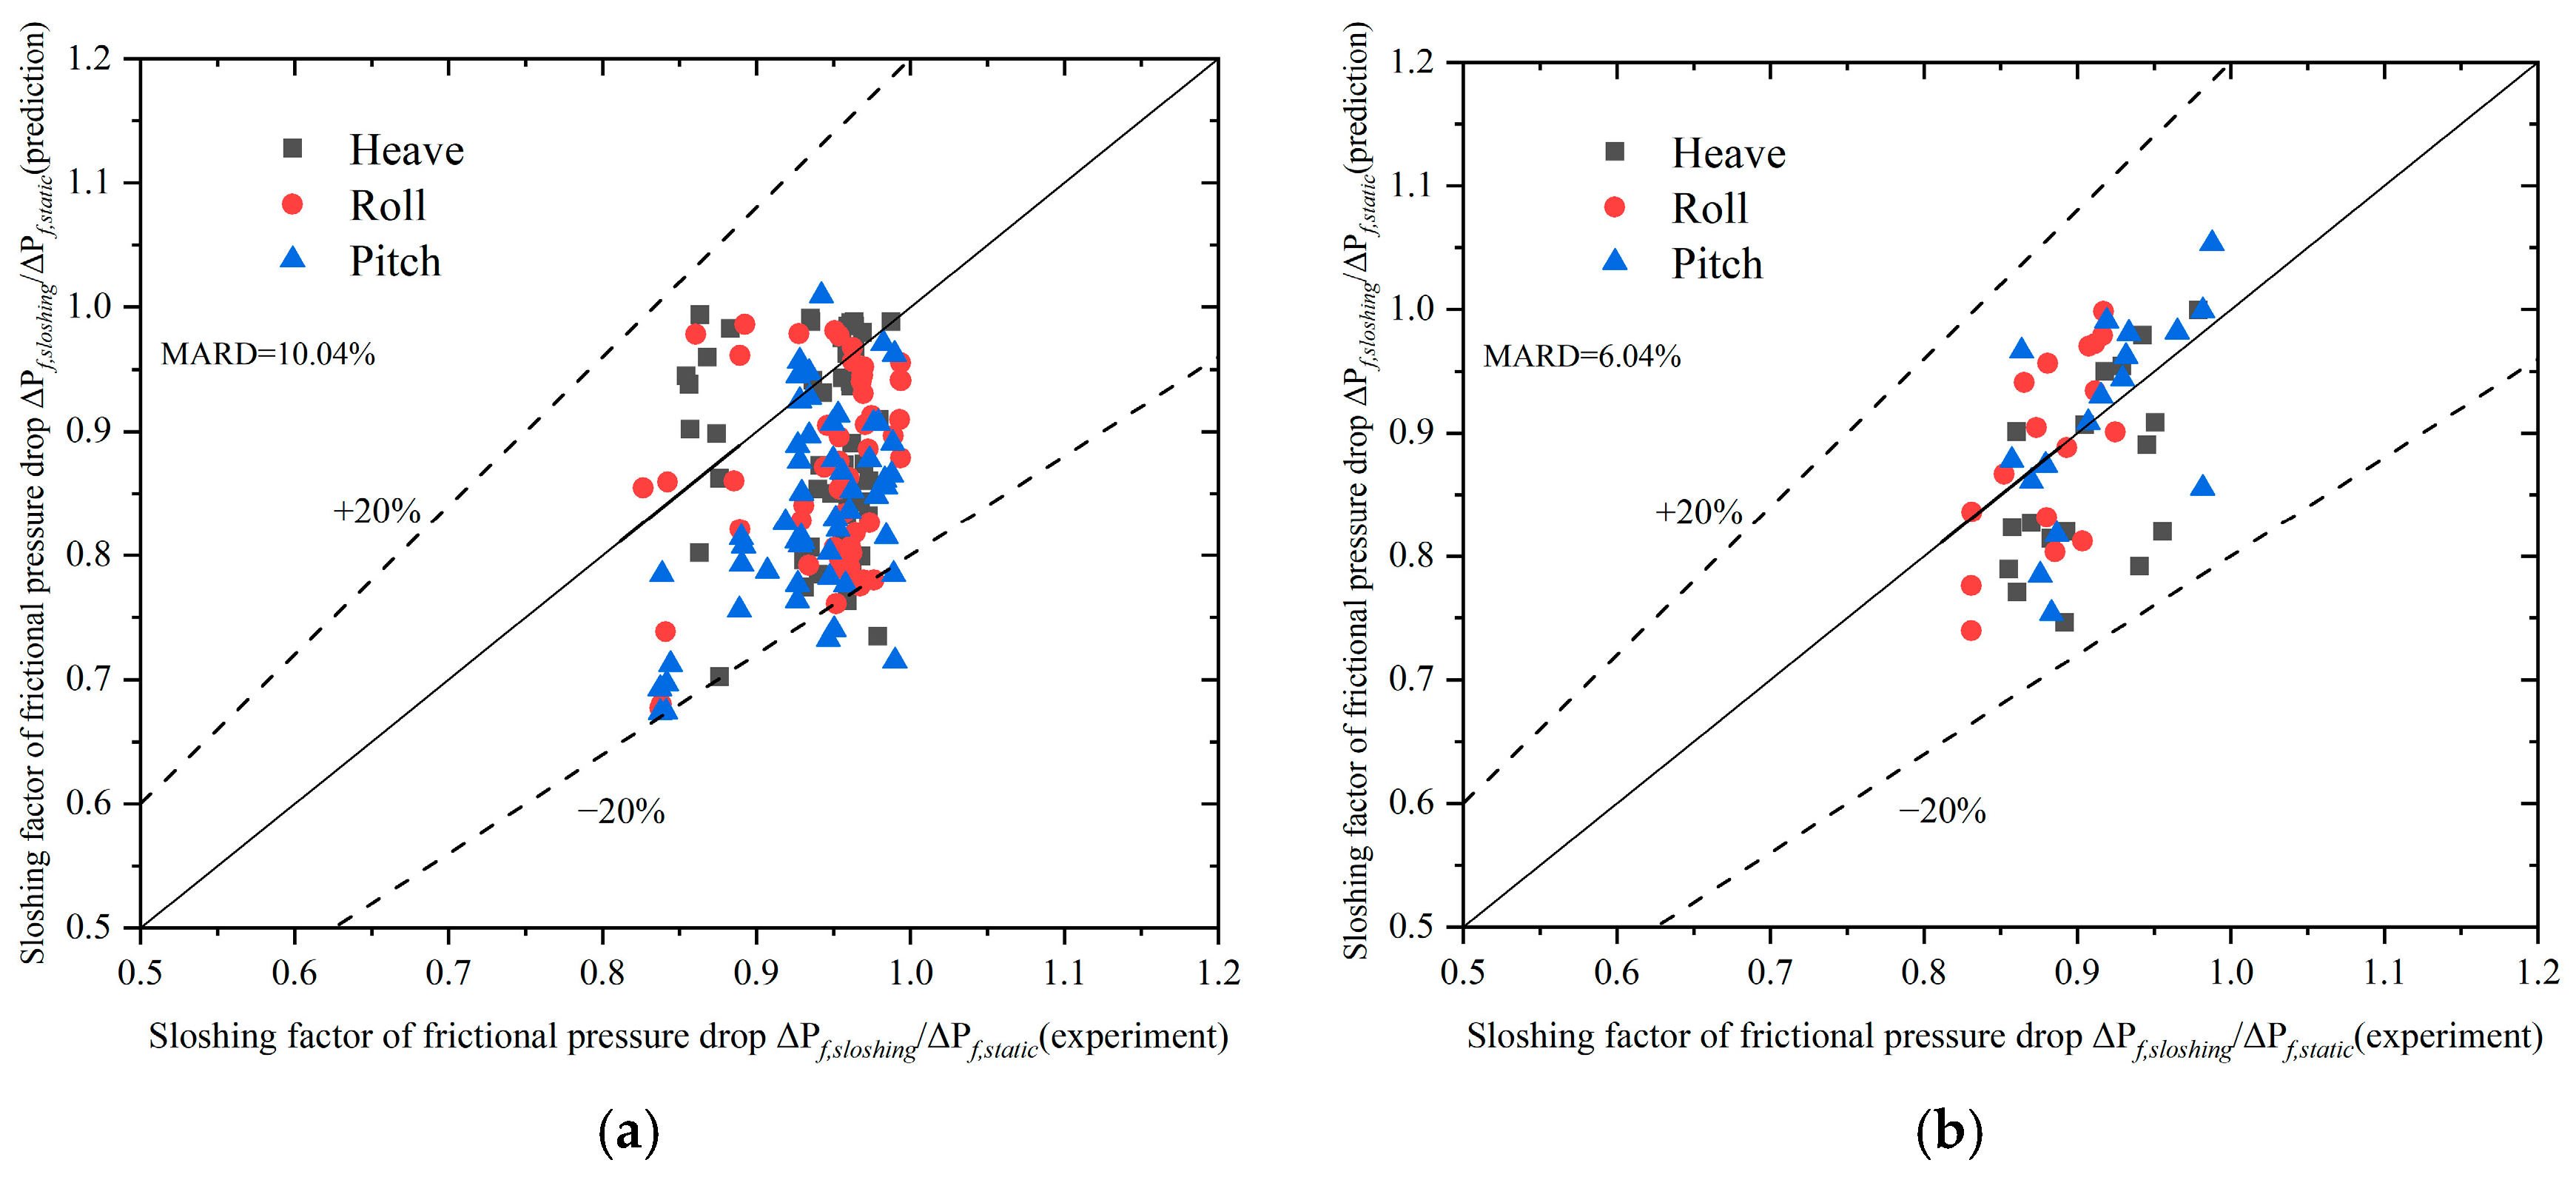
Figure 12 illustrates a comparison between the predicted and experiment values of the sloshing factor of frictional pressure drop under sloshing conditions. As shown in the figure, both the fitting and verification data exhibit a deviation between the predicted and experimental sloshing factor of frictional pressure drop that is generally within the range of ±20%. The MARD values under fitting and verification conditions are 10.04% and 6.04%, respectively, indicating that the correlation is capable of more accurately predicting the sloshing factor of frictional pressure drop under sloshing conditions.

4. Conclusions

An experimental system has been developed to explore the flow pattern and frictional pressure drop characteristics of mixed hydrocarbon fluid in a spiral tube. Moreover, the study has emphasized the analysis of the effects of sloshing styles (e.g., heave, roll, and pitch) on the change in the frictional pressure drop. The study has concluded the following:
(1)
Based on the observation results of flow pattern visualization system, bubble flow, intermittent flow, stratified flow, and annular flow appear in sequence, as the vapor quality increases. Additionally, three flow pattern boundaries are proposed using We* as an index.
(2)
Under static conditions, the frictional pressure drop increases with the decrease in saturation pressure and the increase in mass flux and vapor quality. Under sloshing conditions, the change in the frictional pressure drop increases with the increase in sloshing amplitude and saturation pressure, and the decrease in sloshing period, mass flux, and vapor quality.
(3)
Sloshing reduces the frictional pressure drop, indicating its beneficial effect on fluid flow. A correlation has been developed to predict the sloshing factor of frictional pressure drop, the MARD values under fitting and verification conditions are 10.04% and 6.04%, respectively.

Author Contributions

Conceptualization, F.L.; Methodology, F.L.; Software, Z.T.; Validation, W.Z.; Formal analysis, J.C.; Investigation, S.L.; Resources, Y.J.; Data curation, F.L.; Writing—original draft preparation, F.L.; Writing—review and editing, F.L.; Visualization, Z.T.; Supervision, Y.J.; Project administration, J.C.; Funding acquisition, Y.J. and S.L. All authors have read and agreed to the published version of the manuscript.

Funding

This research was funded by National Natural Science Foundation of China (52106113), and Natural Science Basic Research Plan in Shaanxi Province of China (2021JQ-104).

Data Availability Statement

Data available on request due to restrictions eg privacy or ethical. The data presented in this study are available on request from the corresponding author. The data are not publicly available due to the data will be used in engineering manufacturing.

Conflicts of Interest

The authors declare no conflict of interest.

Nomenclature

cpspecific heat, kJ/(kg·K)
dinner diameter, m
Dspiral diameter, m
ggravity acceleration, m/s2
Llength, m
mmass flux, kg/(m2·s)
Ppressure, MPa
ReReynolds number
SuSuratman number
Ttemperature, °C
We*modified Weber number
xvapor quality
XttMartinelli number
Zsloshing height, m
Greek symbols
βinclination angle, °
εvolume fraction
θsloshing angle, °
ρdensity, kg/m3
σsurface tension, N/m
Pffrictional pressure drop per unit length, Pa/m.
Suberscripts
accaccelerated
expexperiment value
ffriction
maverage value
preprediction value
tottotal
Abbreviations
C1methane
C2ethane
FLNGfloating liquefied natural gas
HEheat exchanger
LNGliquefied natural gas
M1, M2mass flow meter
S1, S2observation window
SHEspiral tube heat exchanger

References

  1. Luo, Y.; Cui, D.; Hu, L.; Ochs, F.; Tosatto, A.; Xu, G.; Tian, Z.; Dahash, A.; Yu, J.; Yuan, G.; et al. Semi-analytical modeling of large-scale water tank for seasonal thermal storage applications. Energy Build. 2023, 278, 112620. [Google Scholar] [CrossRef]
  2. Zhang, Y.; Shan, K.; Li, X.; Li, H.; Wang, S. Research and technologies for next-generation high-temperature data centers-state-of-the-arts and future perspectives. Renew. Sustain. Energy Rev. 2023, 171, 112991. [Google Scholar] [CrossRef]
  3. Luo, Y.; Cheng, N.; Zhang, S.; Tian, Z.; Xu, G.; Yang, X.; Fan, J. Comprehensive energy, economic, environmental assessment of a building integrated photovoltaic-thermoelectric system with battery storage for net zero energy building. Build. Simul. 2022, 15, 1923–1941. [Google Scholar] [CrossRef]
  4. BP. Statistical Review of World Energy 2022; Beijing Hengruixing Information Consulting Co., Ltd.: Beijing, China, 2022. [Google Scholar]
  5. Tian, Z.Y.; Zheng, W.K.; Guo, J.W.; Wang, Y.; Wang, Y.; Jiang, Y. Thermodynamic analysis of structural parameters during condensation in spiral tubes. Int. J. Heat Mass Transf. 2022, 189, 122677. [Google Scholar] [CrossRef]
  6. Li, S.L.; Cai, W.H.; Chen, J.; Zhang, H.; Jiang, Y. Numerical study on the flow and heat transfer characteristics of forced convective condensation with propane in a spiral pipe. Int. J. Heat Mass Transf. 2018, 117, 1169–1187. [Google Scholar] [CrossRef]
  7. Poredos, P.; Petelin, N.; Zel, T.; Vidrih, B.; Gatarić, P.; Kitanovski, A. Performance of the condensation process for water vapour in the presence of a non-condensable gas on vertical plates and horizontal tubes. Energies 2021, 14, 2291. [Google Scholar] [CrossRef]
  8. Song, M.J.; Dang, C.B.; Hihara, E. Experimental investigation on the heat transfer characteristics of novel rectangle radial microchannel heat exchangers in two-phase flow cooling system for data centers. J. Therm. Anal. Calorim. 2020, 141, 199–211. [Google Scholar]
  9. Song, M.J.; Jiang, Z.Y.; Chaobin, D.; Shen, J.; Xiaoyan, L. Mathematical modeling investigation on flow boiling and high efficiency heat dissipation of two rectangular radial microchannel heat exchangers. Int. J. Heat Mass Transf. 2022, 190, 122736. [Google Scholar] [CrossRef]
  10. Baker, O. Simultaneous flow of oil and gas. Oil Gas. J. 1954, 26, 185–195. [Google Scholar]
  11. Mandhane, J.M.; Gregory, G.A.; Aziz, K. A flow pattern map for gas-liquid flow in horizontal pipes. Int. J. Multiph. Flow 1974, 1, 537–553. [Google Scholar] [CrossRef]
  12. Govier, G.W.; Aziz, K.; Schowalter, W.R. The flow of complex mixtures in pipes. J. Appl. Mech. 1973, 40, 404. [Google Scholar] [CrossRef]
  13. Weisman, J.; Duncan, D.; Gibson, J.; Crawford, T. Effects of fluid properties and pipe diameter on two-phase flow patterns in horizontal lines. Int. J. Multiph. Flow. 1979, 5, 437–462. [Google Scholar] [CrossRef]
  14. Taitel, Y.; Dukler, A.E. A model for predicting flow regime transitions in horizontal and near horizontal gas-liquid flow. AIChE J. 1976, 22, 47–55. [Google Scholar] [CrossRef]
  15. Barnea, D.; Shoham, O.; Taitel, Y. Flow pattern transition for downward inclined two phase flow; horizontal to vertical. Chem. Eng. Sci. 1982, 37, 735–740. [Google Scholar] [CrossRef]
  16. Whalley, P.B. Air-water two-phase flow in a helically coiled tube. Int. J. Multiph. Flow 1980, 6, 345–356. [Google Scholar] [CrossRef]
  17. Mujawar, B.A.; Rao, M.R. Gas-non-newtonian liquid two-phase flow in helical coils. Ind. Eng. Chem. Process. Des. Dev. 1981, 20, 391–397. [Google Scholar] [CrossRef]
  18. Zhang, M.Y.; Chen, X.J. An investigation on flow pattern transitions for air-water two-phase flow in helical coils. Chin. J. Nucl. Sci. Eng. 1983, 3, 298–304. [Google Scholar]
  19. Chen, X.J.; Zhou, F.D.; Guo, L.J. Investigations on flow pattern transition of gas-liquid two-phase downflow in vertical helical coils. Chin. J. Eng. Thermophys. 1987, 8, 55–59. [Google Scholar]
  20. Yan, A. Study of Two-Phase Flow Patterns and Frictional Pressure Drop in Helical and Spiral Coils; University of Tennessee: Knoxville, TN, USA, 1992. [Google Scholar]
  21. Murai, Y.; Yoshikawa, S.; Toda, S.; Ishikawa, M.-A.; Yamamoto, F. Structure of air-water two-phase flow in helically coiled tubes. Nucl. Eng. Des. 2005, 236, 94–106. [Google Scholar] [CrossRef]
  22. Dong, L.; Wu, X.; Liu, K.; Sun, Q. Influence of sloshing conditions on the pressure drop and heat transfer of a single-layer spiral-wound LNG heat exchanger. ACS Omega 2023, 8, 11310–11317. [Google Scholar] [CrossRef]
  23. Zhu, J.L.; Zhang, W.; Li, Y.X.; Ji, P.; Wang, W. Experimental study of flow distribution in plate-fin heat exchanger and its influence on natural gas liquefaction performance. Appl. Therm. Eng. 2019, 155, 398–417. [Google Scholar] [CrossRef]
  24. Yu, S.Z.; Wang, J.J.; Yan, M.; Yan, C.; Cao, X. Experimental and numerical study on single-phase flow characteristics of natural circulation system with heated narrow rectangular channel under rolling motion condition. Ann. Nucl. Energy 2017, 103, 97–113. [Google Scholar] [CrossRef]
  25. Zhang, J.H.; Yan, C.Q.; Gao, P.Z. Characteristics of pressure drop and correlation of friction factors for single-phase flow in rolling horizontal pipe. J. Hydrodyn. 2009, 21, 614–621. [Google Scholar] [CrossRef]
  26. Xue, Y.; Li, H.; Hao, C.; Yao, C. Investigation on the void fraction of gas-liquid two-phase flows in vertically-downward pipes. Int. Commun. Heat Mass Transf. 2016, 77, 1–8. [Google Scholar] [CrossRef]
  27. Milkie, J.A.; Garimella, S.; Macdonald, M.P. Flow regimes and void fractions during condensation of hydrocarbons in horizontal smooth tubes. Int. J. Heat Mass Transf. 2016, 92, 252–267. [Google Scholar] [CrossRef]
  28. Gupta, A.; Kumar, R.; Gupta, A. Condensation of R-134a inside a helically coiled tube-in-shell heat exchanger. Exp. Therm. Fluid. Sci. 2014, 54, 279–289. [Google Scholar] [CrossRef]
  29. Talley, J.D.; Worosz, T.; Kim, S.; Buchanan, J.R. Characterization of horizontal air-water two-phase flow in a round pipe part I: Flow visualization. Int. J. Multiph. Flow. 2015, 76, 212–222. [Google Scholar] [CrossRef] [Green Version]
  30. Lips, S.; Meyer, J.P. Experimental study of convective condensation in an inclined smooth tube. Part I: Inclination effect on flow pattern and heat transfer coefficient. Int. J. Heat Mass Transf. 2011, 55, 395–404. [Google Scholar] [CrossRef]
  31. Kong, R.; Kim, S. Characterization of horizontal air-water two-phase flow. Nucl. Eng. Des. 2016, 312, 266–276. [Google Scholar] [CrossRef]
  32. Spedding, P.L.; Nguyen, V.T. Regime maps for air water two phase flow. Chem. Eng. Sci. 1980, 35, 779–793. [Google Scholar] [CrossRef]
  33. Rouhani, S.Z.; Axelsson, E. Calculation of void volume fraction in the subcooled and quality boiling regions. Int. J. Heat Mass Transf. 1970, 13, 383–393. [Google Scholar] [CrossRef]
  34. Soliman, H.M. The mist-annular transition during condensation and its influence on the heat transfer mechanism. Int. J. Multiph. Flow 1986, 12, 277–288. [Google Scholar] [CrossRef]
  35. Chen, Q.; Amano, R.S.; Xin, M. Experimental study of R134a condensation heat transfer inside the horizontal micro-fin tubes. Heat Mass Transf. 2005, 41, 785–791. [Google Scholar] [CrossRef]
  36. Chen, Q.; Amano, R.S.; Xin, M. Experimental study of flow patterns and regimes of condensation in horizontal three-dimensional micro-fin tubes. Heat Mass Transf. 2006, 43, 201–206. [Google Scholar] [CrossRef]
  37. Kim, S.M.; Mudawar, I. Flow condensation in parallel micro-channels—Part 2: Heat transfer results and correlation technique. Int. J. Heat Mass Transf. 2012, 55, 984–994. [Google Scholar] [CrossRef]
Figure 1. Flow chart of the experimental system.
Energies 16 05263 g001
Figure 2. Experimental device diagram.
Energies 16 05263 g002
Figure 3. Layout of temperature sensor. (a) Schematic diagram; (b) Device diagram.
Energies 16 05263 g003
Figure 4. Experimental flow pattern diagrams.
Energies 16 05263 g004
Figure 5. Flow pattern map.
Energies 16 05263 g005
Figure 11. The change in sloshing factor of frictional pressure drop with static frictional pressure drop under sloshing conditions.
Energies 16 05263 g011
Figure 12. Comparison between the prediction value and the experiment value of sloshing factor of frictional pressure drop under the sloshing conditions. (a) Data for fitting; (b) Data for verification.
Energies 16 05263 g012
Table 1. Main installations of system.
NumberSymbolEquipment Name
1UTest sample
2M1, M2Mass flow meter
3T1-T15Temperature sensor
4P01-P07Pressure sensor
5dPPressure difference sensor
6P1, P2Pump
7E1, E2Heat exchanger
8H1, H2Heater
9CBuffer tank
10S1, S2Observation window
11RCryogenic refrigerator
12NContainer
13VRegulating valve
Table 2. Performance parameters of sensor.
NumberMeasuring InstrumentsRangeUncertainty
1Mass flow meter0–200 kg/h±0.1%
2Mass flow meter0–320 kg/h±0.1%
3Temperature sensor−200–50 °C±0.1 °C
4Pressure sensor0–6 MPa±0.1%
5Pressure sensor0–6 MPa±0.5%
6Pressure sensor0–1.6 MPa±0.1%
7Pressure difference sensor0–30 kPa±0.1%
Table 3. The parameters of sloshing platform.
NumberSloshing StylesDisplacementMax VelocityAcceleration
1Pitch±15°±10°/s±20°/s2
2Roll±15°±10°/s±20°/s2
3Pitch (X)±0.2 m0.1 m/s±0.2 m/s2
4Roll (Y)±0.2 m0.1 m/s±0.2 m/s2
5Heave (Z)±0.15 m0.1 m/s±0.2 m/s2
Table 4. Experimental conditions.
NumberNameValue
1CompositionC1:C2 = 0.65:0.35 (mole fraction)
2Pressure2–4 MPa
3Vapor quality0–1
4Mass flux200–800 kg/(m2·s)
5Sloshing period5 s, 10 s, 15 s
6Sloshing angle5°, 10°, 15°
7Sloshing height50 mm, 100 mm, 150 mm
Table 5. Relative difference on frictional pressure drop under different sloshing styles.
MixtureHeaveRollPitchOverall
Δ P f , s l o s h i n g /   Δ P f , s t a t i c 1 100 %
RangeRangeRangeRange
C1/C2−14.54–−1.26−17.37–−0.61−16.26–−1.01−17.37–−0.61
Table 6. Correlation fitting coefficients of sloshing factor of frictional pressure drop.
NumberSloshing Stylesabcd
1Heave0.83260.0153−0.02060.0112
2Roll0.85060.0062−0.00850.0155
3Pitch0.85110.0126−0.01040.0124
Disclaimer/Publisher’s Note: The statements, opinions and data contained in all publications are solely those of the individual author(s) and contributor(s) and not of MDPI and/or the editor(s). MDPI and/or the editor(s) disclaim responsibility for any injury to people or property resulting from any ideas, methods, instructions or products referred to in the content.