Abstract
Atmospheric water generation (AWG) is a technological innovation that facilitates the extraction of water from the atmosphere using various techniques. In response to mounting concerns regarding water scarcity in multiple regions globally, AWG has emerged as a promising solution for providing potable water in areas where conventional water sources are limited or contaminated. AWG systems can be implemented across diverse settings, ranging from individual households to large-scale industrial operations, and can be powered by renewable energy sources. Despite the inherent challenges associated with upscaling AWG technology to ensure its affordability and reliability, it possesses the potential to make a significant contribution towards meeting the water requirements of communities in both developed and developing nations. This study aimed to investigate the performance and limitations of a commercially available dehumidifier, namely, the Trotec TTK140S (Heinsberg, Germany), through experimental analysis. Additionally, the feasibility of integrating this dehumidifier with a photovoltaic energy source was explored. Initially, the dehumidifier’s water production and energy consumption were assessed under specific conditions. Subsequently, a comparison was conducted across three different locations (Lisbon, Pretoria, and Riyadh) to evaluate the dehumidifier’s operation and ascertain the photovoltaic module area necessary for it to function independently. This approach effectively addresses one of the main drawbacks of the technology, namely, its substantial energy consumption.
1. Introduction
In contemporary society, access to clean and drinkable water is considered a privilege that is, unfortunately, not enjoyed by everyone. Clean water is a vital resource for consumption, personal hygiene, and food production. Water scarcity is an increasingly prevalent global problem that, if left unresolved, could result in other issues, such as food scarcity and, in some regions, power outages. According to a study conducted by the United Nations (UN) and the United Nations International Children’s Emergency Fund (UNICEF) in 2020, approximately 2 billion people lacked access to properly treated drinking water, while around 2.3 billion people lacked access to clean water for personal hygiene [1]. Droughts are a worldwide problem that affect different regions at various times of the year, depending on the season. Mekonnen and Hoekstra [2] estimate that at least 4 billion people suffer from drought for at least one month per year, with half of them residing in India and China. Due to the ongoing increase in population and, consequently, the increase in natural resource consumption, it is projected that, by the year 2050, at least half of the world’s population will experience extreme droughts [2]. In some areas, the demand for clean and fresh water exceeds the supply capacity, which is a phenomenon known as water stress. North Africa and the Middle East are the regions with the highest levels of water stress, and even some developed European countries rank high on this list [3]. Addressing water scarcity is a crucial issue, and new sustainable methods for producing fresh water must be developed.
As noted by Xu et al. [4], desalination has emerged as a popular method for significantly augmenting freshwater resources for communities in coastal and arid regions. However, this approach is restricted to coastal areas and necessitates significant infrastructure, thereby rendering it impractical in regions without access to the sea. In areas where there is little to no precipitation and no access to seawater, water production is challenging. Atmospheric water harvesting methods capitalize on the existing humidity in the air to produce clean water that can be treated and used for human consumption. This technique is considered sustainable, can be utilized in any location without relying on an existing water source, and does not necessitate any infrastructure, although significant installations can be employed for large-scale production; for instance, in Kothara, India, a dew harvesting plant was constructed that produced water ranging from 1500 L per day to 3200 L per day [5].
Water in the atmosphere exists primarily as vapor, although in specific circumstances, fog or dew may form. The latter two are more easily converted into clean water, since they are already in liquid form, although not all regions are conducive to their formation. In contrast, water vapor must undergo condensation before it can be collected. For condensation to occur, the air must be cooled to a temperature below its dew point, and, therefore, the primary method used for this process is vapor compression cooling.
The underlying principles of vapor compression cooling are well-established and have been applied to a wide range of refrigeration systems, including refrigerators, freezers, and heating, ventilation, and air conditioning systems (HVAC systems) [6]. For atmospheric water harvesting, the primary system employed is the dehumidifier. In this system, atmospheric air is drawn into an evaporator by a fan, where it is cooled below its dew point, thus resulting in condensation. The dry air is expelled from the system, while the water production is collected for use. The effectiveness of these systems is dependent not only on their refrigeration capacity, but also on the psychometric conditions of the inlet air, such as temperature, relative humidity, and dew point. Energy consumption is a significant concern for dehumidification systems, particularly under unfavorable conditions. When the relative humidity is low, the dehumidifier must cool a larger volume of air to produce water, while lower dew point temperatures necessitate more energy to cool the inlet air. In some instances, the dew point may be so low that it causes the water vapor to freeze. Therefore, the dehumidifier, or any other system utilizing vapor compression cooling, is more effective in hot and humid conditions [7].
To determine the optimal conditions for atmospheric water harvesting systems, Gido et al. [8] have introduced the Humidity Harvest Index, which allows for the prediction of whether the atmospheric conditions in a given region are conducive to water production. This index is calculated based on the thermodynamic properties of the air, including the dry bulb temperature, as well as the temperature of the water production produced in the system. Additionally, a mathematical model developed in the same study predicts the ideal conditions for operating a water harvesting system, as well as identifying when it may be appropriate to switch to an alternate method.
The principle of vapor compression cooling in HVAC systems can be optimized for water production. A recent study conducted in a hot and humid region of Saudi Arabia tested a 1.5-ton air conditioning system in temperatures ranging from 25 °C to 50 °C and air relative humidity (RH) values ranging from 15% to 90% [9]. The study was conducted during the summer months of June, July, August, and September, and the system produced 1.26 tons of water production in June (the lowest value) and 2.50 tons in August (the highest value). Chemical analysis of the produced water production showed that it was safe for human consumption.
To test the ability to produce water from a big air conditioning unit, a study was conducted on an installation on a rooftop hotel in Abu Dhabi [10,11,12]. The goal was to compare the water production of a standard HVAC system and an improved one, with the aim of increasing the amount of water production. The study was conducted for a temperature of 35 °C and a relative humidity of 60%. The conventional system produced 77.4 m3 of water per day while consuming 37,956 kWh in the same period. The improved system produced 84.6 m3 per day while consuming 42,060 kWh in the same period. Although the improved system consumed more energy, it was more economically viable, according to an economic analysis.
A very similar study was conducted in November 2015 at a hotel in Mexico [13]. The study involved real experiments and computer simulations to compare the results. The average temperature and relative humidity were 27.3 °C and 86%, respectively, with an air intake of around 8000 m3/h. The system produced 80 L/h and 40 L/h for its maximum and minimum values, respectively, with a minimum and maximum energy consumption of 0.35 kWh/L and 0.8 kWh/L, respectively. The computer simulation results were similar to the real experiment, with an error range of 2% to 5% for water production. The simulation was extended to the remaining months of the year, with the results producing an average of 1600 L/day with energy consumption of 800 kWh/day. An economic viability study was also conducted to consider energy costs and water savings. For the month of November, the system produced a saving of 7700 USD, while, for the entire year, including maintenance costs, the saving was expected to be over 80,000 USD.
Previous studies focused on testing larger units for large scale production, but they neglected one of the significant advantages of vapor compression systems, which is their portability for smaller scale water production. To address this gap, Bagheri [14] examined the efficiency of three small commercially available dehumidifiers as an additional water source for households. The study assessed the dehumidifiers’ performance in various climatic conditions using a climatic chamber. The findings revealed that, on average, the dehumidifiers produced 0.65 L/h of water, with an energy consumption of 1.02 kWh for each liter of water produced, when operating in hot and humid conditions (30 °C and 62% RH). However, when operating in cold and humid conditions (6 °C and 80% RH), the dehumidifiers only produced, on average, 0.05 L/h, with an energy consumption of 6.23 kWh per liter of water produced. The results indicated that the dehumidifiers performed better under higher temperatures and relative humidity levels by producing more water while using less energy. Thus, the study concludes that small and portable dehumidifiers have great potential to serve as a supplemental water source for households, especially in areas with high temperatures and relative humidity.
Ahmad et al. [15] conducted a study that examined a commercially available system, the Drinkable Air C-8, in the Sharjah region of the United Arab Emirates over a period of one year. The unit’s performance was evaluated in various climate conditions, and the results were compared to those obtained from the study conducted by Bagheri [14]. The findings indicated that the Drinkable Air C-8 system performed better during the month of February, when the average temperature and relative humidity were 22 °C and 60%, respectively. On average, the unit produced 0.36 L/h of water throughout the year, with an energy consumption of 2.25 kWh per liter of water produced. This resulted in a cost of production of 0.18 $/L, on average. The study highlights the potential of the Drinkable Air C-8 system as a reliable water source, especially in regions with similar climatic conditions to Sharjah. However, the cost of production was relatively higher than that obtained from Bagheri’s study, indicating the need for further improvements in the technology to reduce its production cost.
High energy consumption is a major drawback of dehumidifiers and vapor compression cooling systems. To overcome what is probably its biggest disadvantage, the AWG systems can be paired with an independent source of energy, such as a photovoltaic module or by applying the Peltier effect. Some solar-powered AWGs are able to produce around 24 L of water per day, without the use of any chlorofluorocarbons nor the consumption of electricity [16]. By pairing the AWG system with a solar-powered system such as a photovoltaic module, the whole system becomes a mobile independent source of water, making this one of its strongest advantages, along with the ability to work under several air conditions and being an environmentally friendly technology [17]. One of the drawbacks of this technology is the high cost of the system, along with the fact that, although the AWG system is able to work under several weather conditions, if it is paired with a PV panel as its source of energy, this source is only available during the daytime and does not work on rainy days. If placed in remote areas, where it is usually harder to have access to clean water, there can be a lack of maintenance [17].
To test the possibility of pairing both the AWG system and an independent source of energy, Ferwati [18] proposed and developed an independent prototype that could produce water from atmospheric air while utilizing said solar energy. The prototype consisted of two dehumidifiers, solar panels for providing the necessary energy to operate the dehumidifiers, a battery for storing energy for night operations, and a water storage unit, all compacted in a 1 m × 1 m × 1 m cube. The design of this prototype enabled it to be installed on the roof of a house or in an outdoor area with sun exposure, thereby serving as an additional water source for the household. Although the prototype shows promise, no practical studies have been conducted to assess its feasibility and potential for commercial availability. However, the design of this prototype presents a viable solution for reducing the energy consumption associated with conventional water production systems, and further studies are needed to validate its practicality and performance under different environmental conditions.
The pairing of this these two technologies in a prototype similar to one the presented before is not new, although it is a promising pair with studies done on the subject. A similar prototype was designed that had the novelty of including a battery system [19]. This prototype included a solar panel that connected to a 12 V battery that worked as a power source for the condenser and evaporator system, thereby making it capable of producing water. An additional ultraviolet (UV) filter was added to the system for the purpose of filtering the water. After the tests were conducted in ideal conditions, the system was capable of producing 23.30 L of clean drinkable water at an average consumption of 150 Watts.
Similarly, a study was conducted that paired an AWG system with a solar tracking photovoltaic system [20]. The system, by being controlled by an Arduino Uno and several sensors, could vary the angle of the solar panel to maximize the amount of energy that the module could produce. This way, the system could power, not only the AWG system, but also charge a battery for nighttime function. The system itself was also equipped with a high-end purifier, including a reverse osmosis (RO) filter and an UV filter, and it was capable of producing 1 L of clean drinkable water in the span of 4.5 h in high humidity areas.
Cabacungan et al. developed the Solar-Powered Atmospheric Water Generation and Purification System (SAWGAPS) [21]. This system, similarly to the last two presented, included a water generation system made up of car air-conditioning parts, a dehumidifier, a car compressor powered by grid electricity, and a water treatment system made up of a ceramic filter and a UV filter. The system was subjected to a 24 h continuous test in which the system was capable of producing, on average, 763 mL of water per hour (18.3 L per day), at an average relative humidity of 69.2% while consuming 2 kWh per liter of water generated. Although the system showed promise, the pairing of the solar power source with the dehumidification was not tested in the study, but the authors believed there was a great possibility that the system could be powered by a solar power source.
The compactness and portability of dehumidification systems make them a valuable tool for producing water in emergency situations. In response to this need, Runze et al. [22] developed and tested a portable dehumidification system that also incorporated a photovoltaic panel, which was designed specifically for producing water in maritime rescue operations. The system was designed to function in the high seas, as well as any location with high humidity. The system utilized a vapor compression system to produce water from the high humidity of maritime air. Additionally, the system was equipped with a purification module ensuring that the water produced was safe for human consumption, as well as a buoyancy module that enabled it to float in the water. The system was tested under controlled conditions with an inlet air volume of 600 m3/h, 27 °C temperature, and 92% relative humidity. The tests resulted in the production of 0.46 L/h of clean and safe-to-consume water. This innovative system has promising applications for emergency water production in a variety of contexts, including maritime rescue operations.
The primary objective of this study is to evaluate the performance of a commercial dehumidifier, Trotec TTK 140S, as a water production system for several weather conditions. To accomplish this, a climatic chamber was used to set different air temperatures and relative humidity values. In addition to evaluating the performance of the dehumidifier, this study also explored the possibility of coupling the dehumidifier with a photovoltaic system, thereby allowing it to function as an independent source of water production.
2. Materials and Methods
In this article, the practical study focused on using a commercially available dehumidifier, the Trotec TTK 140 S, which utilizes vapor compression cooling for water production.
The condensation process in a dehumidifier, such as the one mentioned, involves several steps. Firstly, ambient air is drawn in with the assistance of a fan. To minimize the presence of dust and particles, the incoming air undergoes filtration. The filtered air is then directed towards the cooling system, which comprises cooling coils and a compressor. The compressor pressurizes the refrigerant, in this case, R290, to transform it into a hot, high-pressure gas that flows into the cooling coils. Being designed to dissipate heat into the surrounding environment, the cooling coils facilitate the cooling of the refrigerant, thereby leading to a significant decrease in its temperature. As the cooling coils cool down, they become much colder than the incoming air. When the air passes over these chilled coils, the temperature difference causes the moisture present in the air to condense into liquid water droplets. These water droplets form on the coils and, due to gravity, begin to drip. They are collected in a tank that was pre-filled at the start of the experiment, thereby allowing all the water produced during the process to flow into a hose connected to a scale. This setup enables precise measurement of the amount of water generated.
The experimental setup used for this study is described in this chapter. To evaluate the efficiency of the system more precisely for water production, the dehumidifier was tested under various air temperatures and relative humidity conditions while maintaining a consistent volume of air. In addition to measuring the quantity of water produced, the amount of energy consumed by the system was also monitored.
2.1. Experimental Setup
It is important to note that this experimental setup allowed for precise and accurate measurements of the conditions and performance of the dehumidifier. The use of a climatic chamber provided a controlled environment where the variables could be manipulated to simulate different conditions. The measurement of the psychometric conditions at different points in the system also allowed for a comprehensive analysis of the dehumidifier’s performance. The use of a scale to measure the amount of water produced and a device to measure the energy consumption of the dehumidifier ensured accurate measurement of these values. Overall, the experimental setup was designed to provide reliable and accurate data to assess the efficiency of the Trotec TTK 140 S dehumidifier in different conditions. A scheme of the setup is shown in Figure 1. Note that all the schemes were drawn by the authors, and all photos taken by them, except where it is written otherwise.
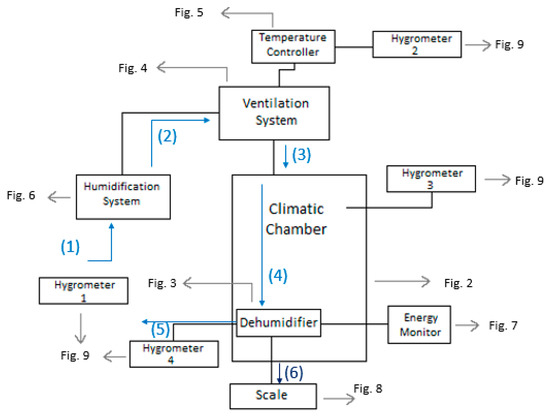
Figure 1.
Scheme of the setup for the experiment.
The diagram illustrates the air flow path through the entire system. At the first stage (1), the psychometric conditions of the atmospheric air are measured using hygrometer 1. The air is then humidified using the boiler incorporated in the ventilation system. After the humidification process, the air flows into the ventilation system (2), where its temperature is controlled by the temperature controller. Subsequently, the conditioned air enters the climatic chamber, and its psychometric conditions are measured once more using hygrometer 2. Inside the climatic chamber (3), the air undergoes further conditioning, and its psychometric conditions are measured again with hygrometer 3. The dehumidifier continuously absorbs the air in the chamber (4), where it undergoes cooling and condensation. Upon exiting the dehumidifier through its ventilation system (5), the air’s psychometric conditions are measured for the fourth and final time using hygrometer 4. The amount of water produced by the dehumidifier is collected through a hose and measured using a scale (6). The experimental setup involved the use of a climatic chamber, which had external dimensions of 1.576 m in width, 1.207 m in length, and 1.876 m in height. However, the chamber also had a thickness of 0.188 m on some sides, thus resulting in internal dimensions of 1.2 m in width, 1.019 m in length, and 1.5 m in height. The dimensions of the chamber and its internal structure are illustrated in Figure 2. The air enters the climatic chamber through a ventilation tube connected to the air conditioner unit, which is labeled as (A) in the figure. The air then enters the dehumidifier with the help of a fan incorporated in the unit, which is labeled as (B) in the figure. After being cooled and dehumidified, the air exits the dehumidifier through the ventilation system, which is labeled as (C) in the figure. The water produced during the dehumidification process is collected and weighed on a scale, which is labeled as (D) in the figure. It is important to note that the dimensions of the climatic chamber presented in this figure refer to the internal dimensions, wherein we considered the thickness of the chamber walls.
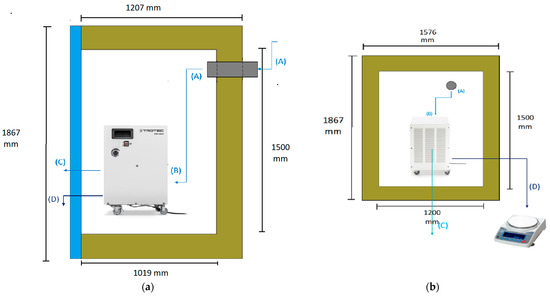
Figure 2.
Scheme of the climatic chamber and its measurements: (a) Side view. (b) Front view.
The dehumidifier under investigation is the TTK 140S, which was designed and produced by Trotec. As illustrated in Figure 3, the dehumidifier features a compact and robust design, with a user-friendly interface for easy operation. Table 1 presents the technical specifications of the TTK 140S, as were detailed on the manufacturer’s website.
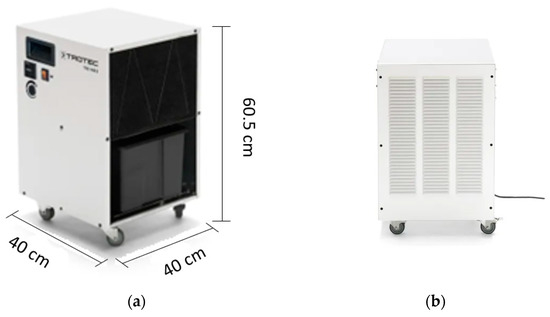
Figure 3.
Dehumidifier used (TTK 140S): (a,b) Pictures provided by the manufacturer.

Table 1.
Dehumidifier TTK 140S specifications.
The ventilation system employed in this study is the Air Conditioning Laboratory Unit A573 (P.A. Hilton Ltd.; Andover, UK), which was designed and manufactured by P.A. Hilton Ltd. (U.K.). The system is connected to the climatic chamber via aluminum tubes. It comprises a primary fan responsible for introducing and regulating the airflow into the climatic chamber, several resistances that function as air pre-heaters or after-heaters, a cooling unit, an electric boiler controlled by resistances, and the control panel. Figure 4 illustrates the system utilized in the experiment, along with the schematic for its structure. In order to regulate the inlet air temperature, the system includes two 0.5 kW resistances, with one of them connected to a temperature controller. The resistance connected to the temperature controller was used to maintain the temperature constant, while the other one was used solely for the higher temperature tests when only one resistance was insufficient. The Digi-Sense Temperature Controller, model 89000-15 (Antylia Scientific, Vernon Hills, IL, USA), displayed in Figure 5, was used for this purpose.
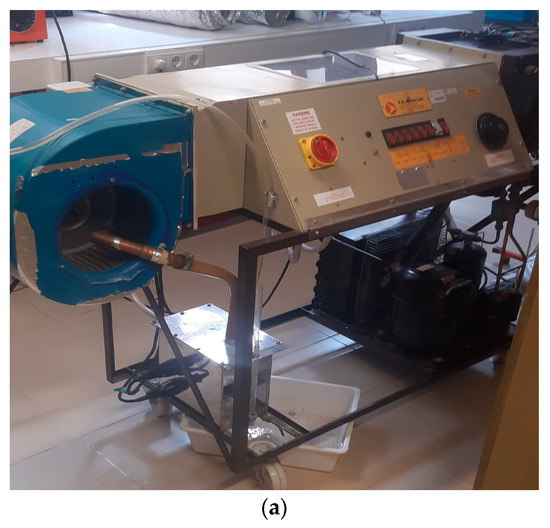
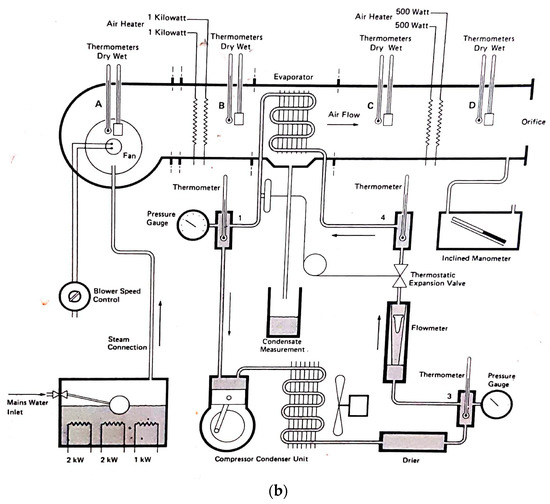
Figure 4.
Air Conditioning Laboratory Unit A573: (a) Photo of the ventilation system used. (b) Scheme of the ventilation system used. The photo of the scheme was taken from the unit itself.
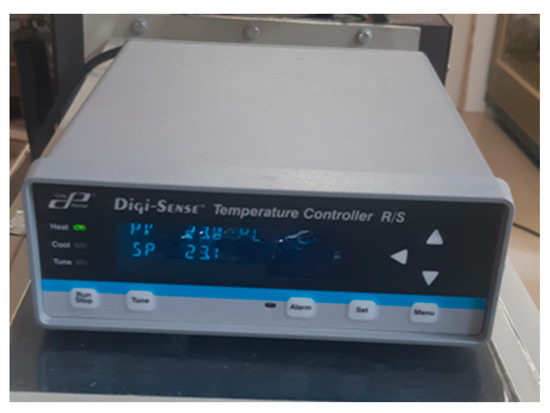
Figure 5.
Temperature controller used in the experiment.
In addition to controlling the temperature, the study also aimed to regulate the relative humidity. This was accomplished by utilizing the boiler integrated into the air conditioning unit, which contained three electric resistances—one 1 kW and two 2 kW resistances. One of the 2 kW resistances was connected to a power controller. The process involved heating up water inside the boiler with the resistances, creating steam that was directed to the fan of the ventilation system, and consequently increasing both the temperature and relative humidity. To regulate the steam production and, thus, the relative humidity, the total electric power of the resistances was adjusted from test to test by turning on and off the required resistances and controlling the power provided to the 2 kW resistance that could be regulated. This procedure enabled the study to achieve consistent relative humidity levels. The boiler and steam tube used in the study are presented in Figure 6.
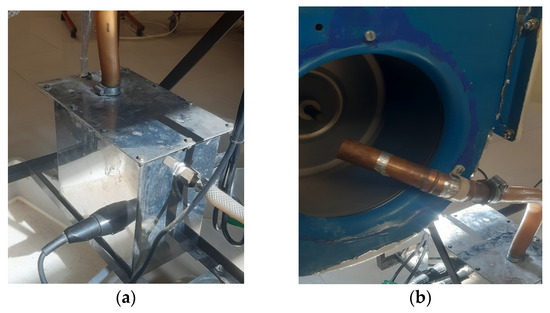
Figure 6.
Humidification system used: (a) The boiler incorporated in the air conditioning unit. (b) Steam pipe coming from the boiler.
2.2. Error and Data Acquisition
The experimental testing of the dehumidifier involved collecting several data to accurately study the system’s performance. To achieve this, it was necessary to measure the amount of energy used by the dehumidifier during the test, as well as to record the conditions of operation. To accomplish this goal, an energy monitor manufactured by Efergy (Sheffield, UK) was employed. The kit consisted of an electricity monitoring transmitter (Efergy, Sheffield, UK) connected to the power supply and a monitor that communicated with the transmitter via Bluetooth. The monitor displayed several parameters, including the instantaneous power consumption of the dehumidifier, which was the required parameter for the experiment. Power measurements were taken every 15 min, and by multiplying the average power consumption value for that time period by the duration of 15 min (or 0.25 h), the energy used during that time period could be calculated. The measurements were taken every 15 min so that the measurements could be accurately tracked. The total energy consumption during the experiment was obtained by summing up all the values obtained using this approach. Both the transmitter and the monitor are depicted in Figure 7.
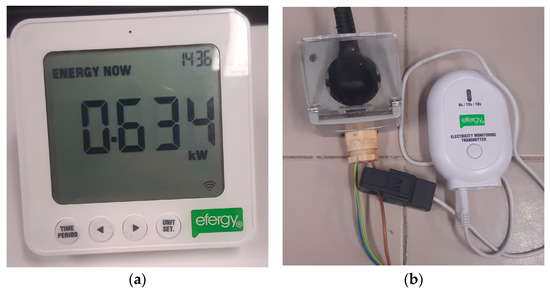
Figure 7.
Energy consumption monitor system: (a) The transmitter connected to the power supply. (b) The monitor showing the power used.
Another parameter that was monitored during the tests was the amount of water generated by the dehumidifier. To measure this, the water was directed to a hose that was connected to a scale, which weighed the amount of water produced. Figure 8 illustrates the scale and hose system that were employed for this purpose. Similar to the energy consumption measurement, the water weight was also recorded at 15 min intervals for a more accurate tracking precision.
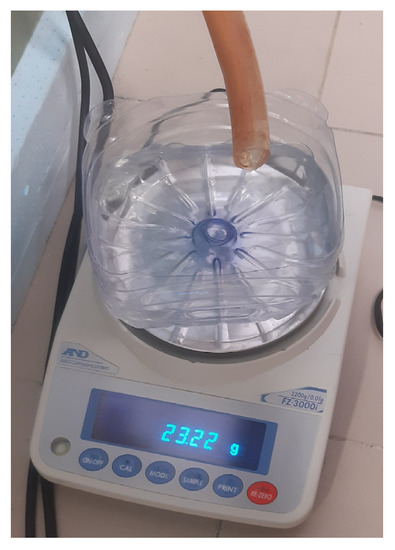
Figure 8.
Photo of the scale.
The final set of measurements taken during the experiment involved assessing the psychometric conditions of the air at four different locations within the system, as previously mentioned in this chapter. This was accomplished through the use of several hygrometers, including two Easy-Log USB (version 6.1.0.0; Lascar Electronics; Whiteparish, UK) hygrometers to monitor the psychometric conditions inside the climatic chamber and at the exit of the humidifier. The data obtained by these loggers was extracted by connecting them to a computer using the Easy-Log USB software. The Easy-Log USB hygrometers (Lascar Electronics; Whiteparish, UK) measured the temperature, relative humidity, and dew point of the air every 5 min. In addition, two other hygrometers were used to measure the ambient conditions of the laboratory and the conditions of the insufflation air, respectively. These hygrometers were connected to a Rotronic HydroLog (Rotronic; Zurich Switzerland), which was also connected to a computer to extract the data. The Rotronic HydroLog hygrometers measured the temperature, relative humidity, and dew point of the air every 30 s, thus providing more precise measurements than the Easy-Log USB hygrometers. Figure 9 displays all four hygrometers, and Figure 10 displays the Rotronic HydroLog device.
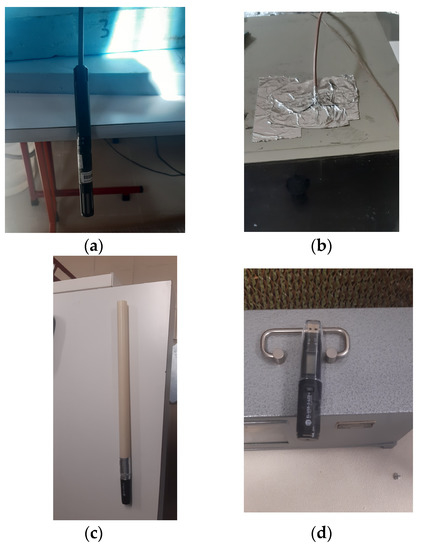
Figure 9.
Hygrometer measuring system: (a) Hygrometer 1. (b) Hygrometer 2. (c) Hygrometer 3. (d) Hygrometer 4.
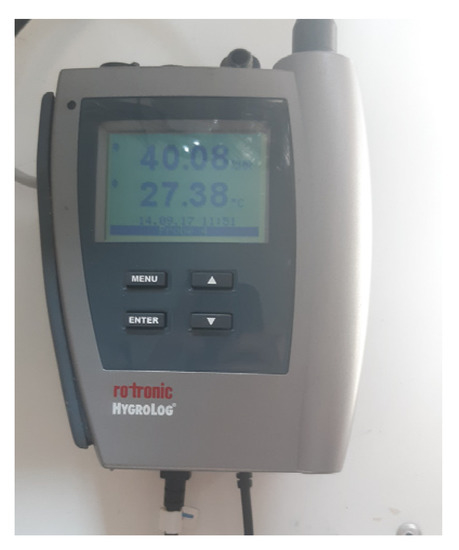
Figure 10.
Rotronic HydroLog.
For each result obtained using any instrument, there exists a level of uncertainty that can be calculated through error analysis. Table 2 provides information on the accuracy of each of the instruments utilized in the study.
Table 2.
Accuracy of instruments used.
2.3. Experimental Procedure
To ensure a fair comparison among the tests, a standardized process was implemented. The laboratory’s atmospheric conditions were kept relatively constant throughout the test, with minor fluctuations in response to external factors. The experiments were conducted over a five-hour period, from 10:00 a.m. to 3:00 p.m. To ensure consistent water production during the test, the dehumidifier was activated prior to the commencement of the experiment. The climatic chamber was preconditioned to establish a stable internal environment in which the dehumidifier could operate. The hygrometers were programmed, and the scale and energy monitor were configured to record data at 15 min intervals. After the experiment concluded, all data collected by the loggers were retrieved and analyzed. This information, along with the water production and energy consumption data, was processed to produce tables and graphs, which are presented in the subsequent chapter and discussed in detail.
2.4. Location Study
This study also focuses on the study for water production in three different locations, all with different weather conditions, for a more realistic study. The three locations chosen were Lisbon, Pretoria, and Riyadh. The values for the temperature and relative humidity for all three locations are shown in Figure 11, Figure 12, Figure 13 and Figure 14, which show values for 2 reference days throughout the year—the 15th of January and the 15th of July. The data obtained from the experimental study were utilized to assess the water production in the three selected locations when the dehumidifier operated under those specific conditions.
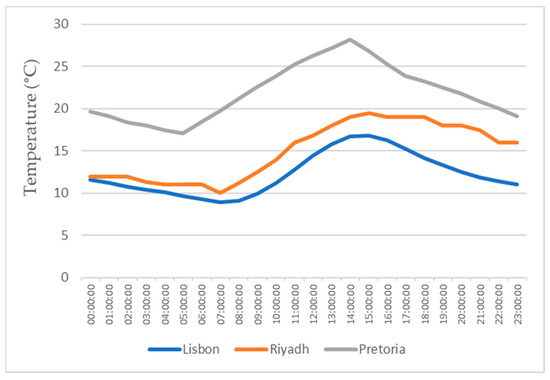
Figure 11.
Air temperatures for the 15th of January.
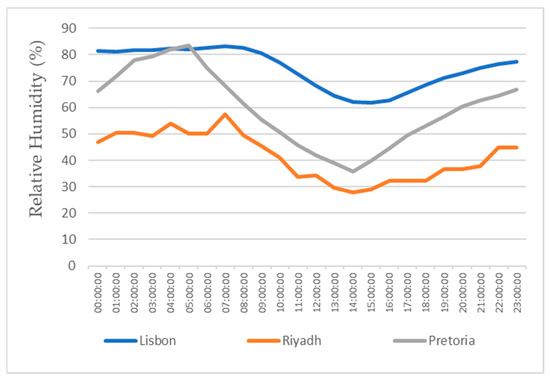
Figure 12.
Air relative humidity for the 15th of January.
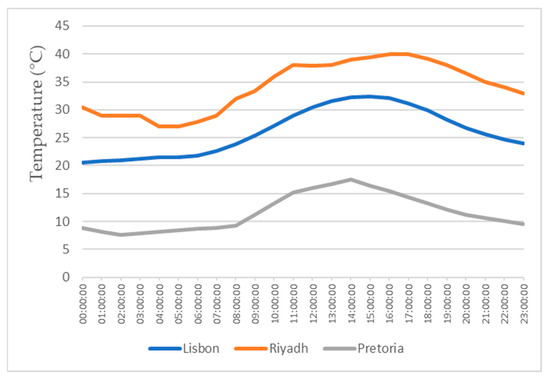
Figure 13.
Air temperatures for the 15th of July.
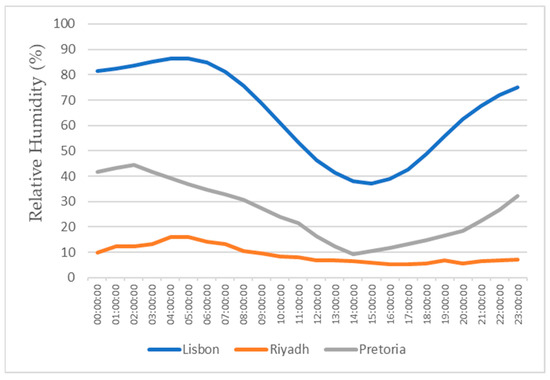
Figure 14.
Air relative humidity for the 15th of July.
All of the three cities are located on the Northern Hemisphere, so on the 15th of January, all of the three locations were in the winter season, and on the 15th of July, all three locations were on summer season. Based on the figures for the ambient temperature and relative humidity for the 15th of January, Figure 11 and Figure 12, the hottest location was Pretoria, while the coldest was Lisbon. Lisbon was the most humid location, and Riyadh was the driest. Based on the graphs for the ambient temperature and relative humidity for the 15th of July, Figure 13 and Figure 14, the hottest and coldest regions changed. The hottest location was Riyadh, while the coldest was Pretoria. For relative humidity, Lisbon remained the most humid location, and Riyadh remained the driest one.
2.5. Photovoltaic Modulation
As mentioned before, one of the greatest challenges of the AWG technologies through vapor compression cooling is the amount of energy required by the machines, such as the dehumidifier, which are not that energy efficient. So, in this study, we evaluated the possibility of pairing a photovoltaic system with the dehumidifier so it would operate independently. For that purpose, as seen in the previous chapter, we measured the energy required to operate and produce water.
Since, in this study, we evaluated the production in 3 different cities, all with different weather conditions, it was required to know the solar radiation throughout the year in those locations. Through PVGIS, we could easily get this information. In Figure 15 and Figure 16, the graphs show the daily radiation for the 15th of January and the 15th of July for all three locations.
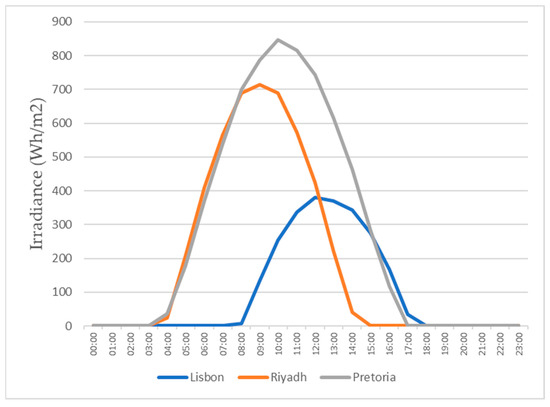
Figure 15.
Daily irradiance for the 15th of January.
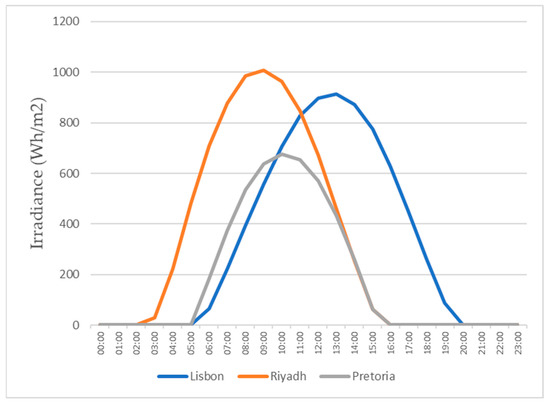
Figure 16.
Daily irradiance for the 15th of July.
In order to assess the most suitable city and climate for efficient water production using the tested dehumidifier, this study evaluated the minimum area required to generate 1 L of water per day. Initially, this calculation involved determining the daily output of a single photovoltaic panel. The selected module for this purpose was the Haitai Solar HTM535~555MH5-72, whose specifications are presented in Table 3. To begin the calculation, we multiplied the average daily radiation in the specific location, as provided by PVGIS (for instance, in January, Lisbon experienced an average radiation of 3.81 kWh/m2), by the peak power of the chosen panel (550 Wp). By combining the average production of one panel with the energy required to produce 1 L of water, we could ascertain the number of panels necessary to generate 1 L of water over the course of a day. This value, when multiplied by the panel area in square meters, yielded the total area required to produce 1 L of water within a 24 h period. These calculations were performed using the average radiation values for each month across all three locations.
Table 3.
Haitai Solar HTM535~555MH5-72 (550W) specifications.
3. Results and Discussion
The primary objective of this study was to assess the Trotec TTK 140S dehumidifier’s water production performance under varying weather conditions and to determine its compatibility with a photovoltaic system as an energy source. The study involved investigating the amount of water produced within a given time frame and the corresponding energy consumption. To provide a comprehensive understanding of the system’s capabilities, tests were conducted under a range of climatic conditions, including low to high relative humidity and cold to hot temperatures. According to the manufacturer, the temperature range for optimal operation is 5 °C to 32 °C, while the air relative humidity range is 50% to 90%. Despite some tests being conducted under sub-optimal conditions, such as tests 1 and 2, where the temperature and relative humidity deviated from the optimal ranges, the dehumidifier still produced water. Table 4 presents the test results obtained from the dehumidifier under varying climatic conditions.
Table 4.
Test results.
3.1. Water Production
When comparing the quantities of water produced by the system at the same temperature, the graphs shown in Figure 17, it was consistently observed that higher relative humidity resulted in a greater amount of water produced due to a greater concentration of water vapor in the air. The examination of individual temperatures revealed that, at 22 °C, the volume of water production per hour increased by 314% when comparing 40% RH and 70% RH. Similarly, at 25 °C, the water production increased by 209%. At 27 °C, it increased by 254%. At 30 °C, it increased by 225%. At 32 °C, it increased by 234%, and, lastly, at 35 °C, it increased by 146%.
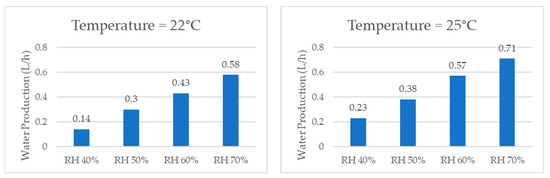
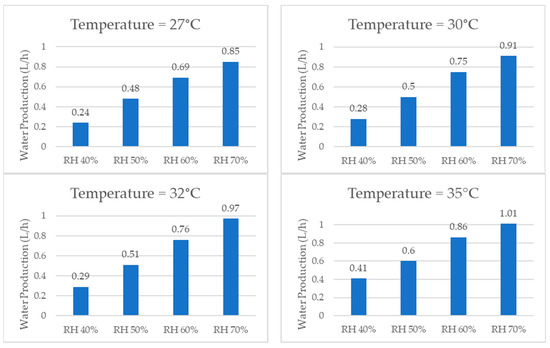
Figure 17.
Water production for same temperature and different relative humidity values.
When comparing the water production results for the same relative humidity values, the graphs shown in Figure 18, it was observed that the system consistently produced more water at higher temperatures. This was due to the fact that, according to the psychometric chart, the air at higher temperatures contains a greater amount of vapor than that at lower temperatures, even at the same relative humidity. At 70% relative humidity, for instance, the amount of water produced in one hour increased by 74% when the temperature changed from 22 °C to 35 °C. For the other relative humidity values tested, the hourly water production increased by 100% for 60% RH, by 100% for 50% RH, and finally by 193% for 40% RH.
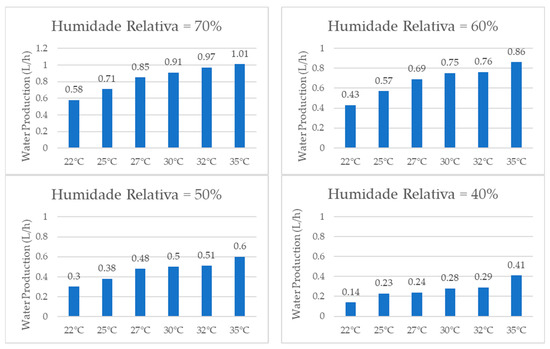
Figure 18.
Water production for same relative humidity and different temperatures.
3.2. Energy Consumption and Specific Energy Consumption
Merely comparing the specific energy consumption is insufficient to determine the optimal operating conditions for the TTK 140S, as the energy consumption may vary with both temperature and relative humidity. Therefore, it is necessary to compare both the energy consumption and specific energy consumption, specifically the amount of energy required to produce one liter of water production.
When analyzing the energy consumption results, as shown in Figure 19 for the same temperature, the system required more energy as the relative humidity increased, although the difference was not significant. Specifically, when the relative humidity increased from 40% RH to 70% RH, the energy consumption increased by only 5% at 22 °C. At the other temperatures, the increase in energy consumption was also low, wherein it rose by 2% at 25 °C, 4% at 27 °C, 7% at 30 °C, 9% at 32 °C, and finally by 8% at 35 °C.
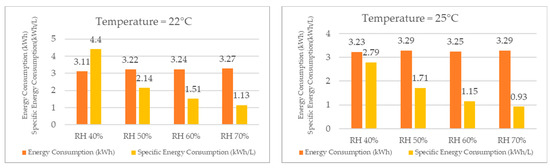
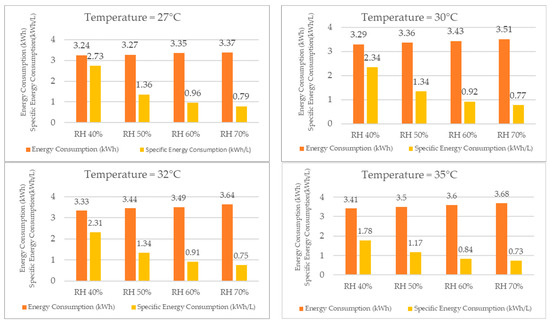
Figure 19.
Energy consumption and specific energy consumption for different temperatures.
Despite the increase in energy consumption, the increase in water production was significantly higher, thereby resulting in a lower specific energy consumption for higher relative humidity values at the same temperature. For example, at 22 °C, the specific energy consumption decreased by 289% when the relative humidity increased from 40% to 70%. At the other temperatures, the specific energy consumption decreased by 200% at 25 °C, 246% at 27 °C, 204% at 30 °C, 208% at 32 °C, and finally by 144% at 35 °C.
As the reduction in the specific energy consumption leads to a decrease in the energy cost required to produce one liter of water, the economic feasibility of using the dehumidifier for water production increases with an increase in relative humidity.
When comparing the results for energy consumption in the TTK 140S, as presented in Figure 20, it was observed that, for a constant relative humidity, the system required more energy as the temperature increased, although the difference was not substantial. The energy consumption increased by only 13% for 70% relative humidity when the temperature varied from 22 °C to 35 °C. The increase in energy consumption was also modest for the other relative humidity values, with an 11% increase for 60% RH, a 9% increase for 50% RH, and a 10% increase for 40% RH.
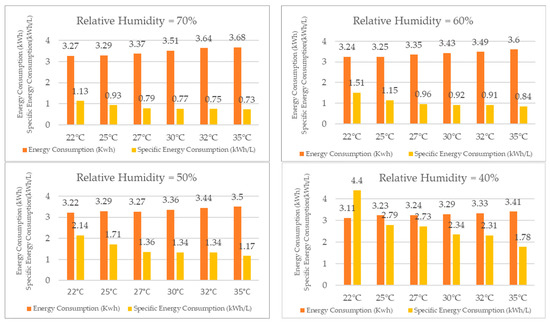
Figure 20.
Energy consumption and specific energy consumption for different relative humidity values.
Despite the modest increase in energy consumption, the water production increased more significantly with increasing temperature, for a constant relative humidity, following the principles of other vapor compression refrigeration systems. Conversely, for a constant temperature, the water production increased with higher relative humidity, while the energy required to produce one liter of water decreased.
For instance, for 70% RH, the specific energy consumption decreased by 54% when the temperature rose from 22 °C to 35 °C. The decrease was even more significant for the other relative humidity values, with a reduction of 80% for 60% RH, 83% for 50% RH, and 147% for 40% RH.
Thus, the reduction in specific energy consumption resulted in a decrease in energy cost per liter of water produced, and the economic feasibility of the TTK 140S as a dehumidifier for water production increased with increasing temperature.
3.3. Functional Curves for Water Production and Energy Consumption
Based on the comprehensive test results obtained, it was possible to develop a functional curve for the dehumidifier, which provided insights into its performance based on variations in relative humidity and temperature. These curves, illustrating water production and energy consumption, are depicted in Figure 21 and Figure 22, respectively.
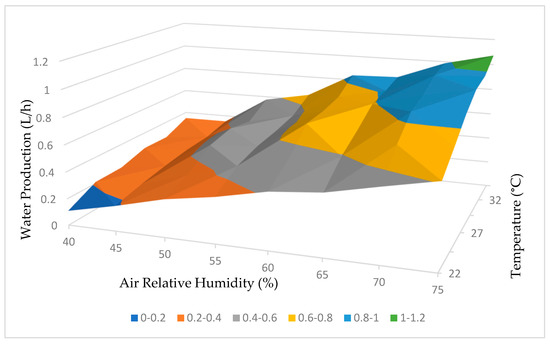
Figure 21.
Water production working curve.
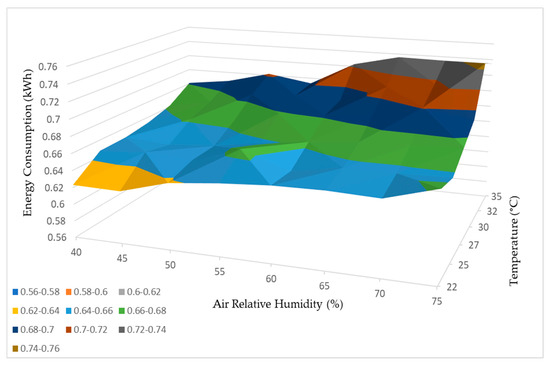
Figure 22.
Energy consumption working curve.3.4. Geographical Study.
The analysis of the curves presented in Figure 21 confirms our initial expectation that higher temperatures and relative humidity levels would result in increased water production by the dehumidifier. This relationship suggests that the dehumidifier is more efficient at extracting water from the atmosphere under these conditions.
Furthermore, the findings from Figure 22 support the observation that higher temperatures and relative humidity levels correspond to higher energy consumption by the dehumidifier. This indicates that the dehumidifier requires additional energy input to operate effectively and produce more water when faced with elevated temperature and humidity levels.
In summary, both the water production and energy consumption curves in Figure 21 and Figure 22 demonstrate a positive correlation between temperature, relative humidity, and the performance of the dehumidifier. These conclusions emphasize the influence of environmental factors on the efficiency and energy requirements of the dehumidification process.
As mentioned previously, for a more realistic case study on the water production of the Trotec TTK 140S dehumidifier, three distinct locations were chosen: Lisbon, Pretoria, and Riyadh. To calculate the monthly water production, the prevailing temperature and relative humidity conditions were recorded at these locations throughout the year. The chosen conditions for testing the dehumidifier were based on a study conducted in a similar region with the aim to simulate the same conditions as the aforementioned study [8,23]. The selected conditions ranged from 22 °C to 35 °C for temperature and from 40% to 70% for air relative humidity, as shown in Table 4. These values were used to perform interpolations for the chosen regions using the Wolfram Mathematica software ( Version 13.1; Wofram Research; Champaign, IL, USA).
However, it should be noted that during certain periods of the year, the conditions in these locations exceeded the range of available data, including hotter or colder temperatures and more humid or drier conditions. In such scenarios, interpolation was not possible, and, therefore, the software extrapolated the values based on the provided data. This approach allowed us to estimate the water production based on the desired temperature and relative humidity values.
Figure 23 and Figure 24 provide visual representations of the projected water production from the dehumidifier, the average daily energy consumption, and the energy required to produce 1 L of water, respectively, for all three locations.
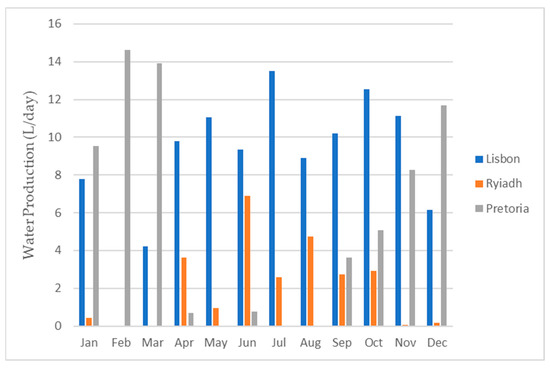
Figure 23.
Water production for each month for all three locations.
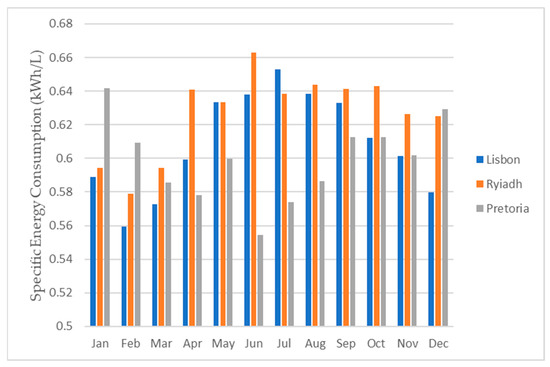
Figure 24.
Daily specific energy consumption for each month for all three locations.
As depicted in Figure 24, the energy requirements exhibited minimal variations among the different locations. This was primarily due to the consistent energy demand for the operation of the dehumidifier. Consequently, the energy needed to produce 1 L of water predominantly hinged on the dehumidifier’s water production capacity. To obtain the total water production for each month and for the entire year, one can multiply the respective daily value by the number of days in each month.
Based on the information presented in Table 5, it can be inferred that Lisbon offered the most favorable conditions, as it yielded the highest water production, followed by Pretoria and, finally, Riyadh.
Table 5.
Total water production per month and for the year (represented in liters [L]).
Regarding the application of photovoltaic panels, calculations were conducted to determine the minimum area required for the chosen photovoltaic panel to produce 1 L of water. To determine the required area, we first calculated the energy produced by a single photovoltaic panel in each month for all three locations. That calculation was done according to the formula:
where EP represents the energy production of one panel per day, PMAX represents the peak power of the photovoltaic module (550 Wp), Ei represents the daily radiation levels, whose data were taken form PVGIS, and PR represents the performance ratio, which was considered to be 0.8 (80%).
Subsequently, the number of panels needed was determined by dividing the energy required to produce one liter of water per day by the energy produced by a single panel. This calculation employed the following equation:
Here, N represents the number of panels required, ER represents the energy required to produce one liter of water, and EP represents, as before, the energy produced by a singular panel for 1 day.
To obtain the final result, which is the area necessary to produce one liter of water per day, we multiplied the previously obtained value by the area of each photovoltaic panel. For this specific module, the panel area is defined as follows:
Thus, to calculate the area required to produce one liter of water per day, the following equation used was:
APVM represents the area of photovoltaic modules required, and A and N, as before, represent the area for one photovoltaic module and the number of modules required, respectively.
By performing this calculation, we obtained the precise area required to produce one liter of water per day. This analysis allowed us to assess the minimum area needed to meet a specific water production requirement, such as supplying water for a building’s consumption. Figure 25 illustrates the minimal area required to produce 1 L of water per day for each month and for all three locations.
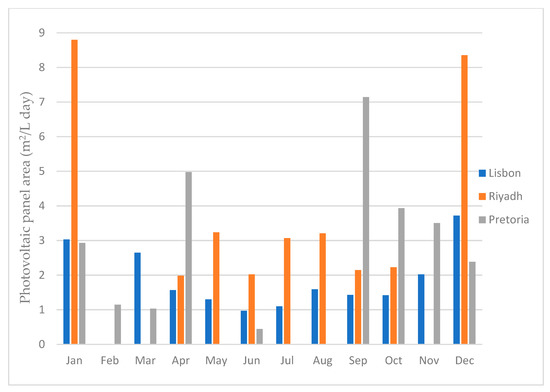
Figure 25.
Photovoltaic panel area required to produce 1 Liter of water per day.
As illustrated in Figure 25, the city of Riyadh exhibited the highest area requirement for producing one liter of water, followed by the city of Pretoria, and Lisbon was the least demanding. These calculations were performed based on the energy necessary to generate one liter of water for each location in every month. The months where the bar did not show were the months were there was no water production.
The photovoltaic module area needed to produce 1 L of water per day is directly related to dehumidifier performance for different atmospheric air properties. When comparing the results of the water production with the minimal area required, in general, the better the dehumidifier performs, the less area that is required, and the worse the dehumidifier performs, the more area that is required. This is due to the fact that the dehumidifier always uses around the same amount of energy, no matter the air conditions. Thus, the more water it produces, the faster it will reach the 1 L mark, and the less energy it will consume. The dehumidifier performance is not the only deciding factor, however. If the dehumidifier performs really well under certain conditions, but the solar radiation for those conditions is low, a larger PV module area will be required.
4. Conclusions
The laboratory test results provided valuable insights into atmospheric water generation techniques utilizing vapor compression cooling. These findings confirmed the initial assumption that higher temperatures and relative humidity levels would lead to increased water production. However, it is important to consider the trade-off with energy consumption. Thus, a comparative analysis was necessary. By comparing the water production rate, which represents the amount of energy required to generate one liter of water, we deduced that the increase in energy consumption was not a significant concern. This was due to the substantial increase in water production associated with higher temperatures and relative humidity. Consequently, the water production rate decreased, thereby indicating that less energy was needed to produce one liter of water.
Regarding the location analysis, as presented in Table 5, Lisbon emerged as the city with the highest water production in a year. If we consider the months where it is possible to have water production, excluding February, Lisbon required, on average, 1.89 m2 of PV area. However, the average should not be the value to consider, since, by considering the average of 1.89 m2, then, in the months were the minimum area required was higher, such as January for example, the dehumidifier would not be able to have enough energy to produce 1 L of water per day. Thus, the value that was considered was the highest one, which for Lisbon was 3.72 m2 for December. This was still the lowest value for all three cities, followed by 7.14 m2 for Pretoria for the month of April and 8.80 m2 for Riyadh for the month of January. When looking at this data, it is easy to conclude that the best city for the dehumidifier to work is Lisbon, since it is, not only the city in which it would produce the highest amount of water, but it is also the city that requires the least amount of PV module area, followed by Pretoria, and the worst out of the three is Riyadh.
5. Future Work
This study leaves various options for continuous work on this subject. The water produced by the dehumidifier was not tested for its potability, so it is not possible to know whether the water was safe for human consumption or not. However, there are chemical tests that can be done to test its potability and, in the case where these tests are not available, there are mineralization and filtration processes that can be done to make this water ready for human consumption. A filtration system can be a modification made to this dehumidifier to make it fully functional to produce safe and clean water for consumption.
Although this is a promising solution for water scarcity, it is a good solution for a small-scale production. This dehumidifier has limited water production, even in perfect weather conditions. Thus, this is probably not a good and viable solution for large-scale production.
Finally, the study locations were determined with calculations, and these were mostly theoretical. However, this dehumidifier could be tested in the locations mentioned, and a comparison of the theoretical and practical studies can be performed. Also, the implementation of the photovoltaic modules was not tested, so this can be another line of possible future work to test the compatibility of the chosen module, or any other, with the dehumidifier.
Author Contributions
Conceptualization, P.D.S. and L.C.P.; methodology, P.D.S. and L.C.P.; validation, P.D.S. and L.C.P.; formal analysis, V.C., P.D.S. and L.C.P.; investigation, V.C.; resources, P.D.S. and L.C.P.; data curation, V.C., P.D.S. and L.C.P.; writing—original draft preparation, V.C.; writing—review and editing, P.D.S. and L.C.P.; supervision, P.D.S. and L.C.P.; project administration, P.D.S. and L.C.P.; funding acquisition, P.D.S. and L.C.P. All authors have read and agreed to the published version of the manuscript.
Funding
The authors thank the opportunity and financial support provided to carry out this project by the Fundação para a Ciência e Tecnologia (FCT) and the R&D Unit “Centre for Mechanical and Aerospace Science and Technologies” (C-MAST), under project UIDB/00151/2020.
Data Availability Statement
The data presented in this study are available on request from the corresponding author. The data are not publicly available due to privacy.
Conflicts of Interest
The authors declare no conflict of interest.
References
- HO/UNICEF. Five Years into The SDGs Progress on Household Drinking Water, Sanitation and Hygiene Who/Unicef Joint Monitoring Programme for Water Supply, Sanitation and Hygiene. 2021. Available online: http://apps.who.int/bookorders (accessed on 12 April 2023).
- Mekonnen, M.M.; Hoekstra, A.Y. Sustainability: Four billion people facing severe water scarcity. Sci. Adv. 2016, 2, 6. [Google Scholar] [CrossRef] [PubMed]
- Maddocks, A.; Young, R.S.; Reig, P. Ranking the World’s Most Water-Stressed Countries in 2040 (World Resources Institute). World Resour. Institute. 2015, p. 8. Available online: https://www.wri.org/blog/2015/08/ranking-world-s-most-water-stressed-countries-2040 (accessed on 9 February 2023).
- Xu, P.; Wang, G.; Cath, T.; Drewes, J.E.; Ruetten, J. Consider the Pros and Cons of Desalination. Am. Water Work. Assoc. 2009, 35, 10–13. [Google Scholar] [CrossRef]
- Sharan, G.; Roy, A.K.; Royon, L.; Mongruel, A.; Beysens, D. Dew plant for bottling water. J. Clean. Prod. 2017, 155, 83–92. [Google Scholar] [CrossRef]
- Raveesh, G.; Goyal, R.; Tyagi, S. Advances in atmospheric water generation technologies. Energy Convers. Manag. 2021, 239, 114226. [Google Scholar] [CrossRef]
- Peeters, R.; Vanderschaeghe, H.; Rongé, J.; Martens, J.A. Energy performance and climate dependency of technologies for fresh water production from atmospheric water vapour. Royal Society of Chemistry. Environ. Sci. Water Res. Technol. 2020, 6, 2016–2034. [Google Scholar] [CrossRef]
- Gido, B.; Friedler, E.; Broday, D.M. Assessment of atmospheric moisture harvesting by direct cooling. Atmos. Res. 2016, 182, 156–162. [Google Scholar] [CrossRef]
- Al-Farayedhi, A.A.; Ibrahim, N.I.; Gandhidasan, P. Condensate as a water source from vapor compression systems in hot and humid regions. Desalination 2014, 349, 60–67. [Google Scholar] [CrossRef]
- Magrini, A.; Cartesegna, M.; Magnani, L.; Cattani, L. Production of Water from the Air: The Environmental Sustainability of Air-conditioning Systems through a More Intelligent Use of Resources. The Advantages of an Integrated System. Energy Procedia 2015, 78, 1153–1158. [Google Scholar] [CrossRef]
- Magrini, A.; Cattani, L.; Cartesegna, M.; Magnani, L. Integrated Systems for Air Conditioning and Production of Drinking Water—Preliminary Considerations. Energy Procedia 2015, 75, 1659–1665. [Google Scholar] [CrossRef]
- Magrini, A.; Cattani, L.; Cartesegna, M.; Magnani, L. Water Production from Air Conditioning Systems: Some Evaluations about a Sustainable Use of Resources. Sustainability 2017, 9, 1309. [Google Scholar] [CrossRef]
- Cattani, L.; Magrini, A.; Cattani, P. Water Extraction from Air by Refrigeration—Experimental Results from an Integrated System Application. Appl. Sci. 2018, 8, 2262. [Google Scholar] [CrossRef]
- Bagheri, F. Performance investigation of atmospheric water harvesting systems. Water Resour. Ind. 2018, 20, 23–28. [Google Scholar] [CrossRef]
- Ahmad, F.F.; Ghenai, C.; Al Bardan, M.; Bourgon, M.; Shanableh, A. Performance analysis of atmospheric water generator under hot and humid climate conditions: Drinkable water production and system energy consumption. Case Stud. Chem. Environ. Eng. 2022, 6, 100270. [Google Scholar] [CrossRef]
- Ekad, A.; Pawar, T.; Yeole, N.; Taksale, A.; Gajjar, A. Solar Powered Atmospheric Water Generator and overview on AWG technologies. Int. J. Innov. Res. Sci. Eng. Technol. 2018, 7, 71–79. [Google Scholar]
- Nguyen, A.Q.; Nguyen, M.H.N.; Mai, T.H.; Dang, T.H. Atmospheric Water Harvesting Using Solar Energy Technology. In Proceedings of the 8th Annual Multi-Stakeholder Forum on Science, Technology and Innovation for the Sustainable Development Goals (STI Forum), Geneva, Switzerland, 3 May 2023. [Google Scholar]
- Ferwati, M.S. Water harvesting cube. SN Appl. Sci. 2019, 1, 779. [Google Scholar] [CrossRef]
- Fainsan, D.S.; Exito, J.A.; Tabi, J.N.D.; Fainsan, J.S.; Pedralvez, J.F.; Calaycay, J.H.; Dimapilis, J.K.W.; Amboy, E.L.; Tercenio, L.P.; Rosas, J.A.; et al. The development of solar-powered atmospheric drinking generator with charging bay. Lect. Notes Eng. Comput. Sci. 2016, 2224, 661–665. [Google Scholar]
- Sachin, P.R.; Rahul, G.R.; Gangadharmath, U.; Brahmaraj, K.; Jamuna, S. Development of Solar Powered Atmospheric Water Generation and Purification System. IJCRT 2021, 9, 877–882. [Google Scholar]
- Cabacungan, P.M.; Cheng, J.C.; Landoy, D.L.; Silang, A.C.; Buenafe, R.A.; Tangonan, G.L.; Libatique, N.J.C.; Calasanz, T.H. Solar-Powered Atmospheric Water Generation and Purification System. In Proceedings of the 4th International Conference on Humanoid, Nanotechnology, Information Technology, Communication and Control, Environment, And Management, Manila, Philippines, 2009; pp. 1–6. [Google Scholar]
- Runze, D.; Qingfen, M.; Hui, L.; Gaoping, W.; Wei, Y.; Guangfu, C.; Yifan, C. Experimental investigations on a portable atmospheric water generator for maritime rescue. J. Water Reuse Desalination 2020, 10, 30–44. [Google Scholar] [CrossRef]
- Lebre, B.; Silva, P.D.; Pires, L.C.; Gaspar, P.D. Computational Modeling of the Thermal Behavior of a Greenhouse. Appl. Sci. 2021, 11, 11816. [Google Scholar] [CrossRef]


Disclaimer/Publisher’s Note: The statements, opinions and data contained in all publications are solely those of the individual author(s) and contributor(s) and not of MDPI and/or the editor(s). MDPI and/or the editor(s) disclaim responsibility for any injury to people or property resulting from any ideas, methods, instructions or products referred to in the content. |
© 2023 by the authors. Licensee MDPI, Basel, Switzerland. This article is an open access article distributed under the terms and conditions of the Creative Commons Attribution (CC BY) license (https://creativecommons.org/licenses/by/4.0/).