
The Effect of Spread Spectrum Modulation on Power Line Communications


Abstract
1. Introduction
2. G3-PLC
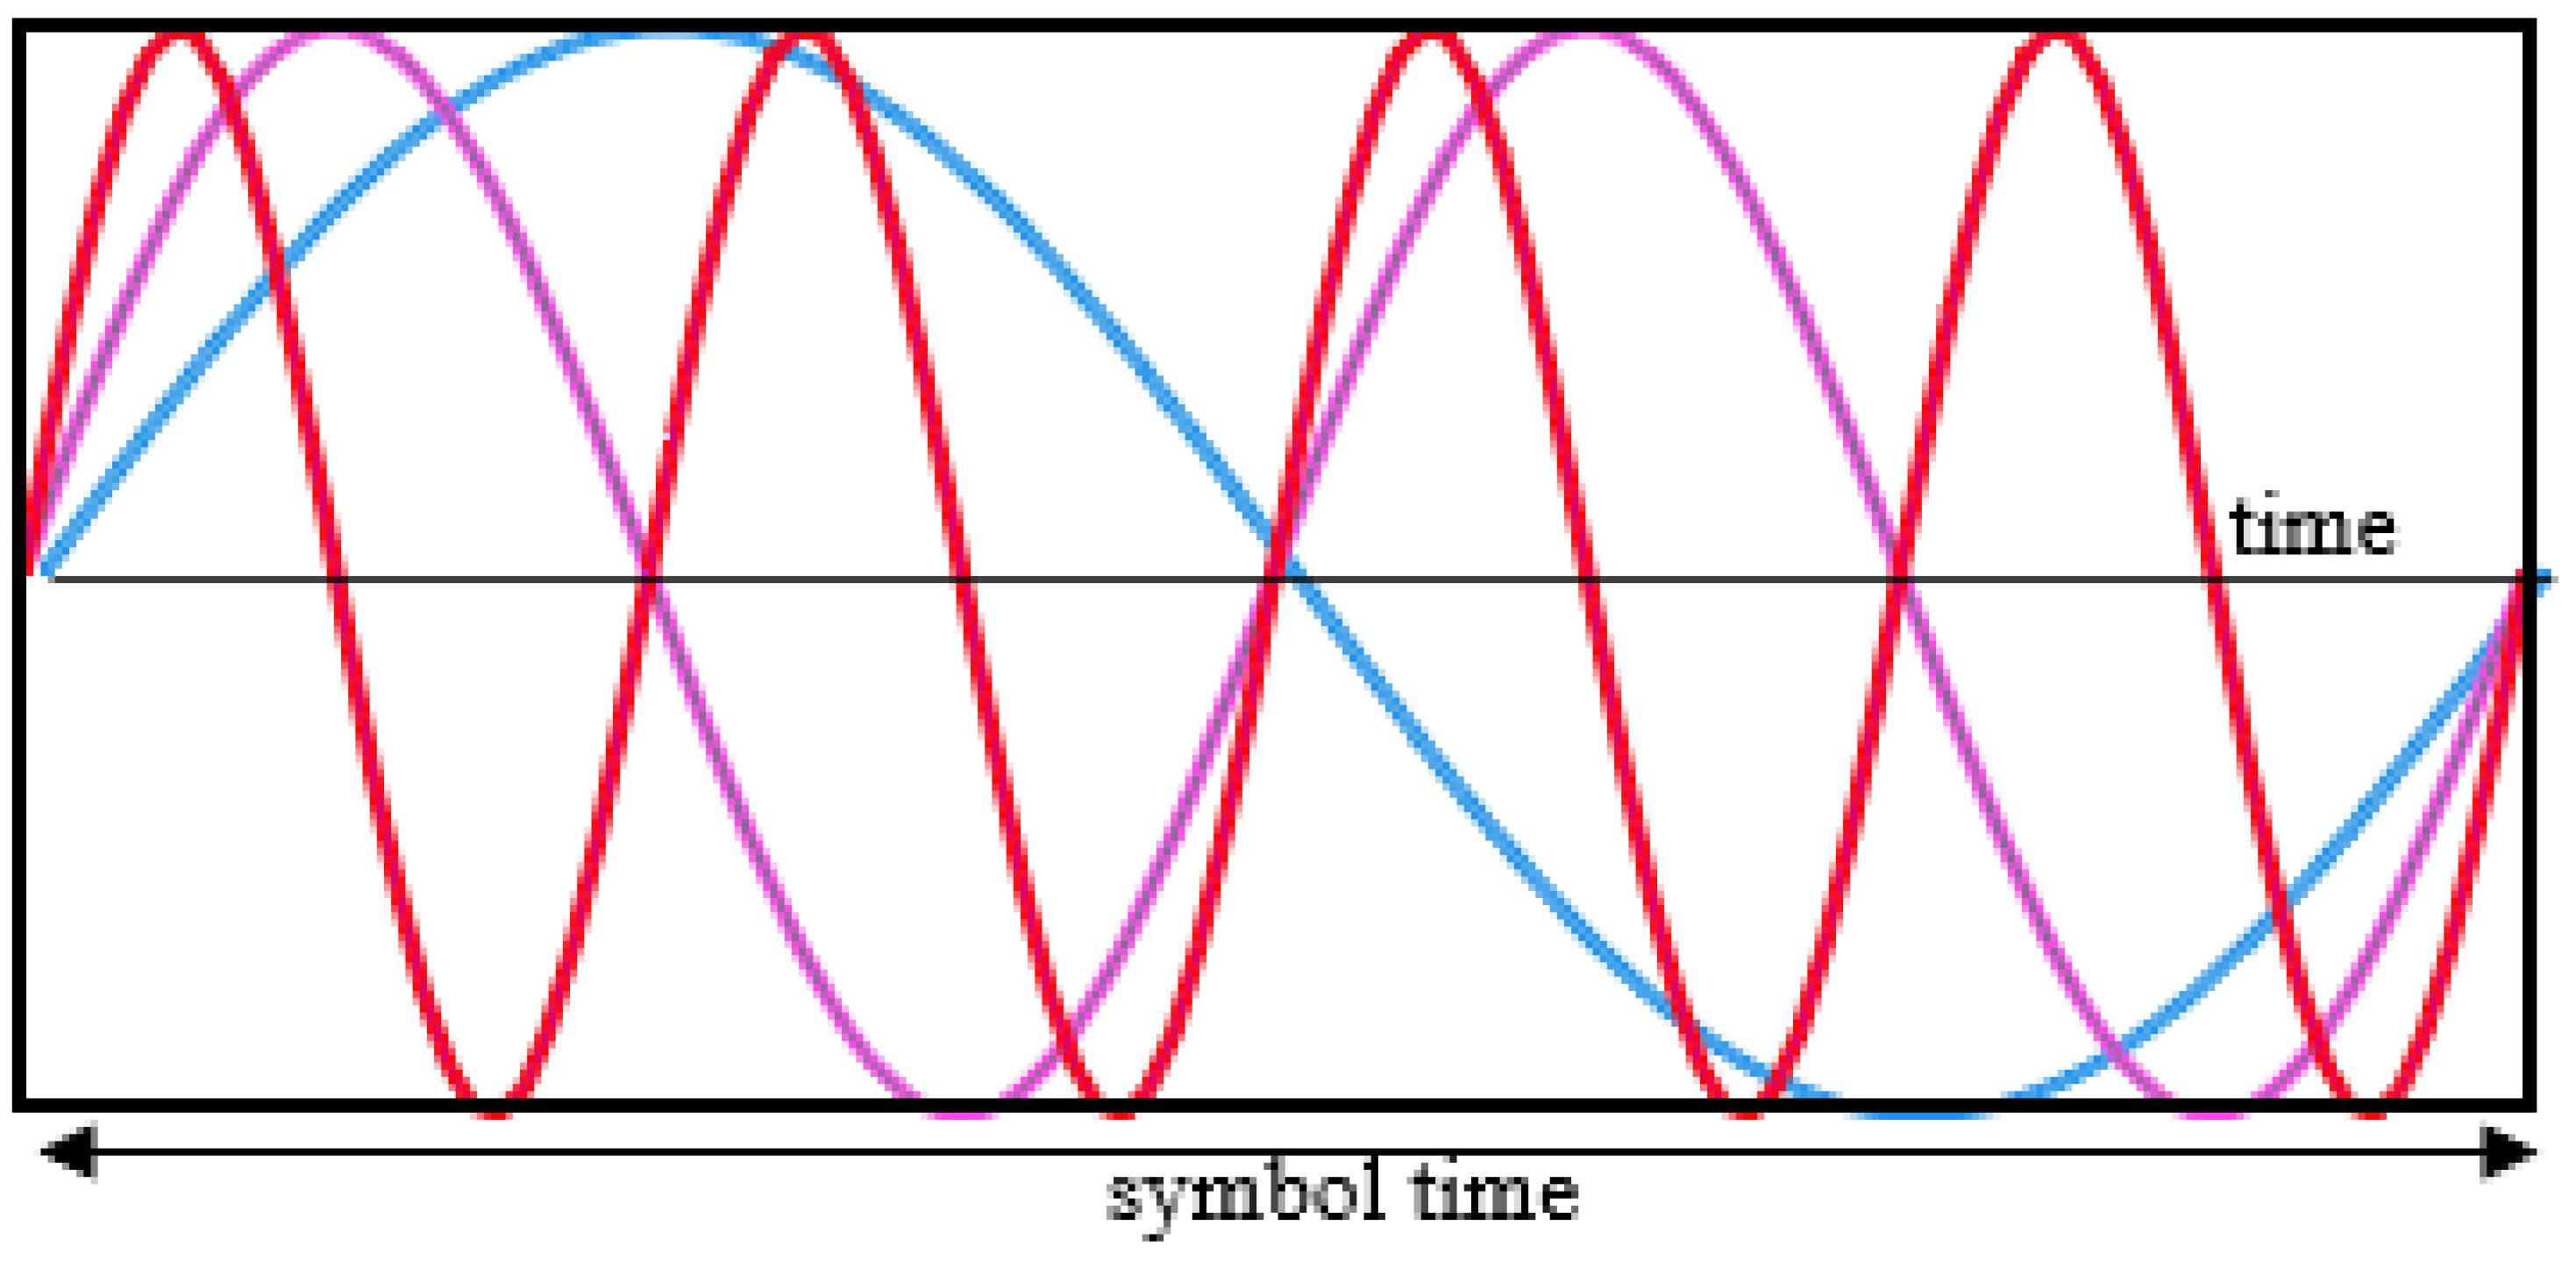
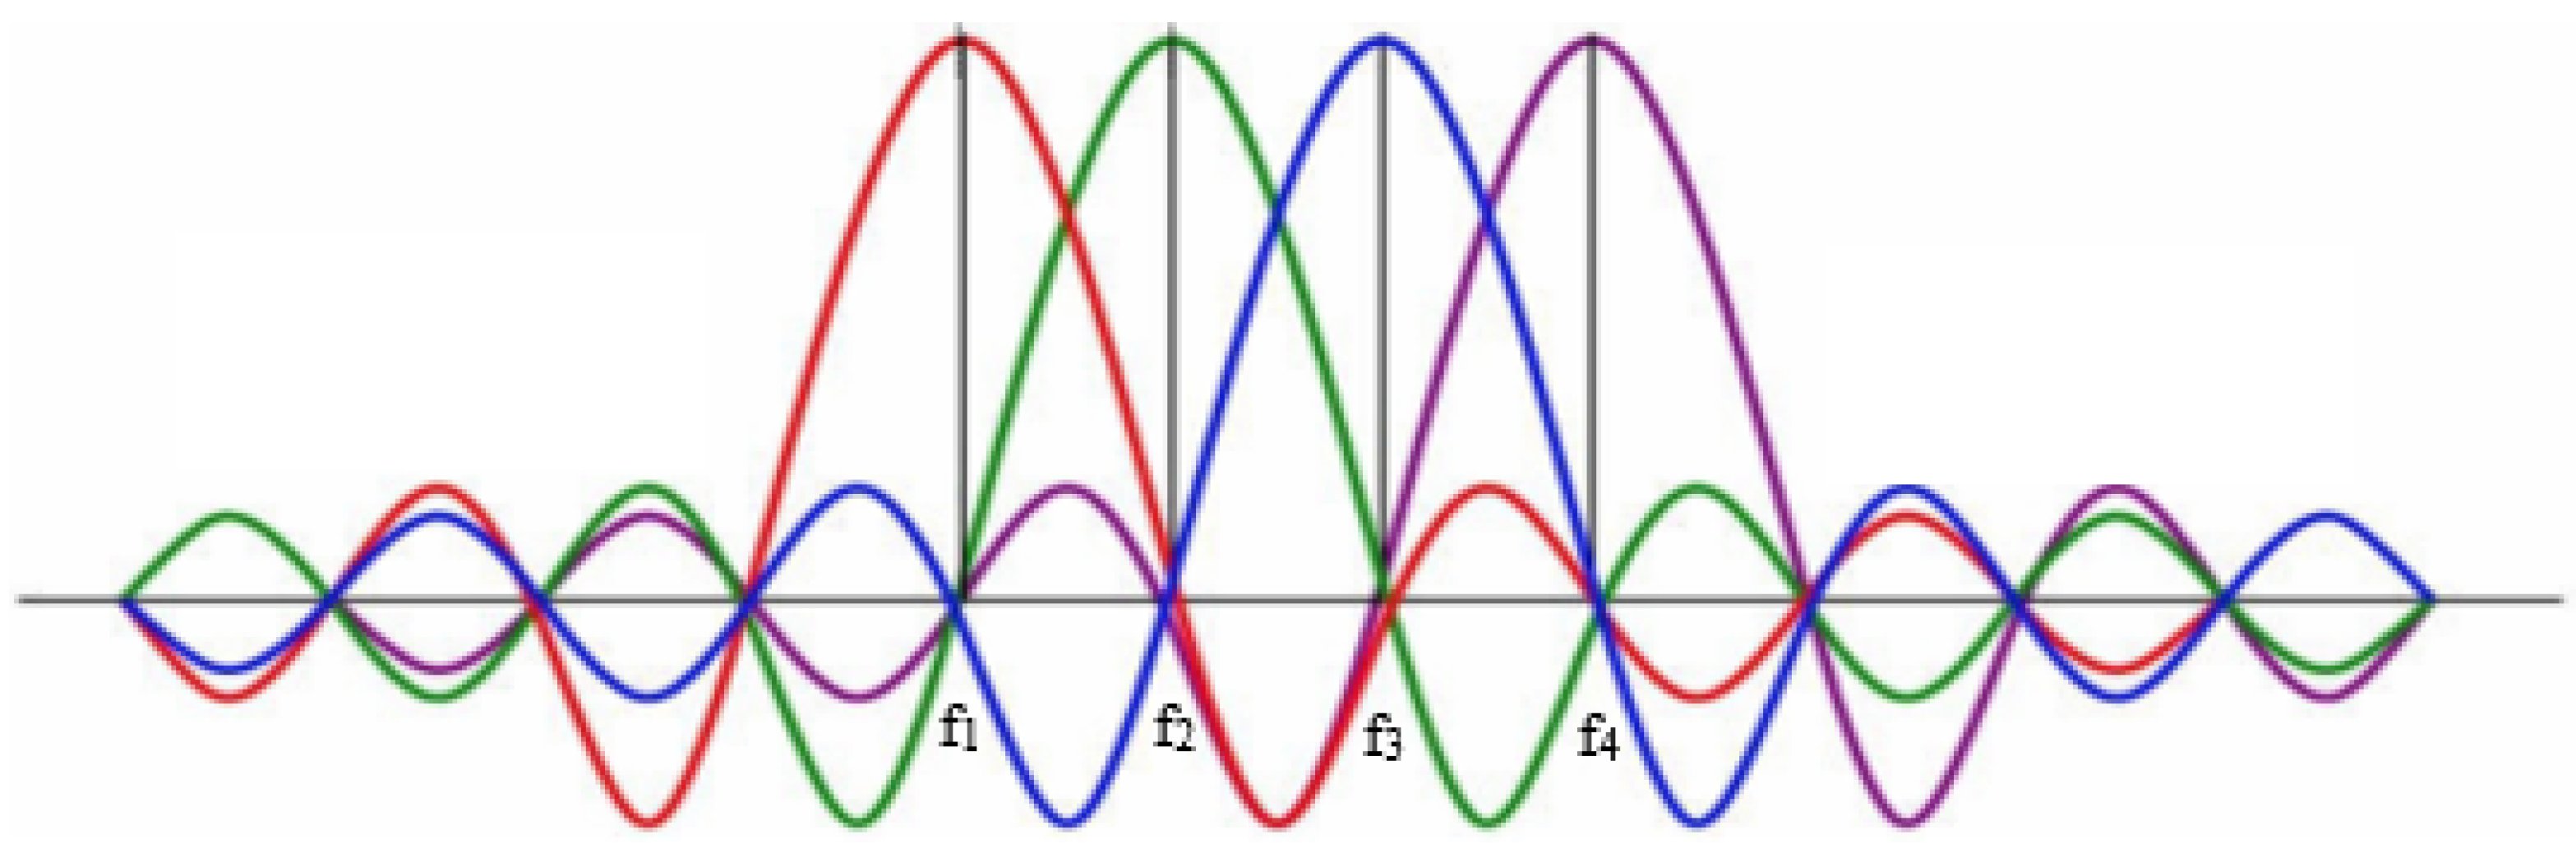
3. Orthogonal Frequency Division Multiplexing
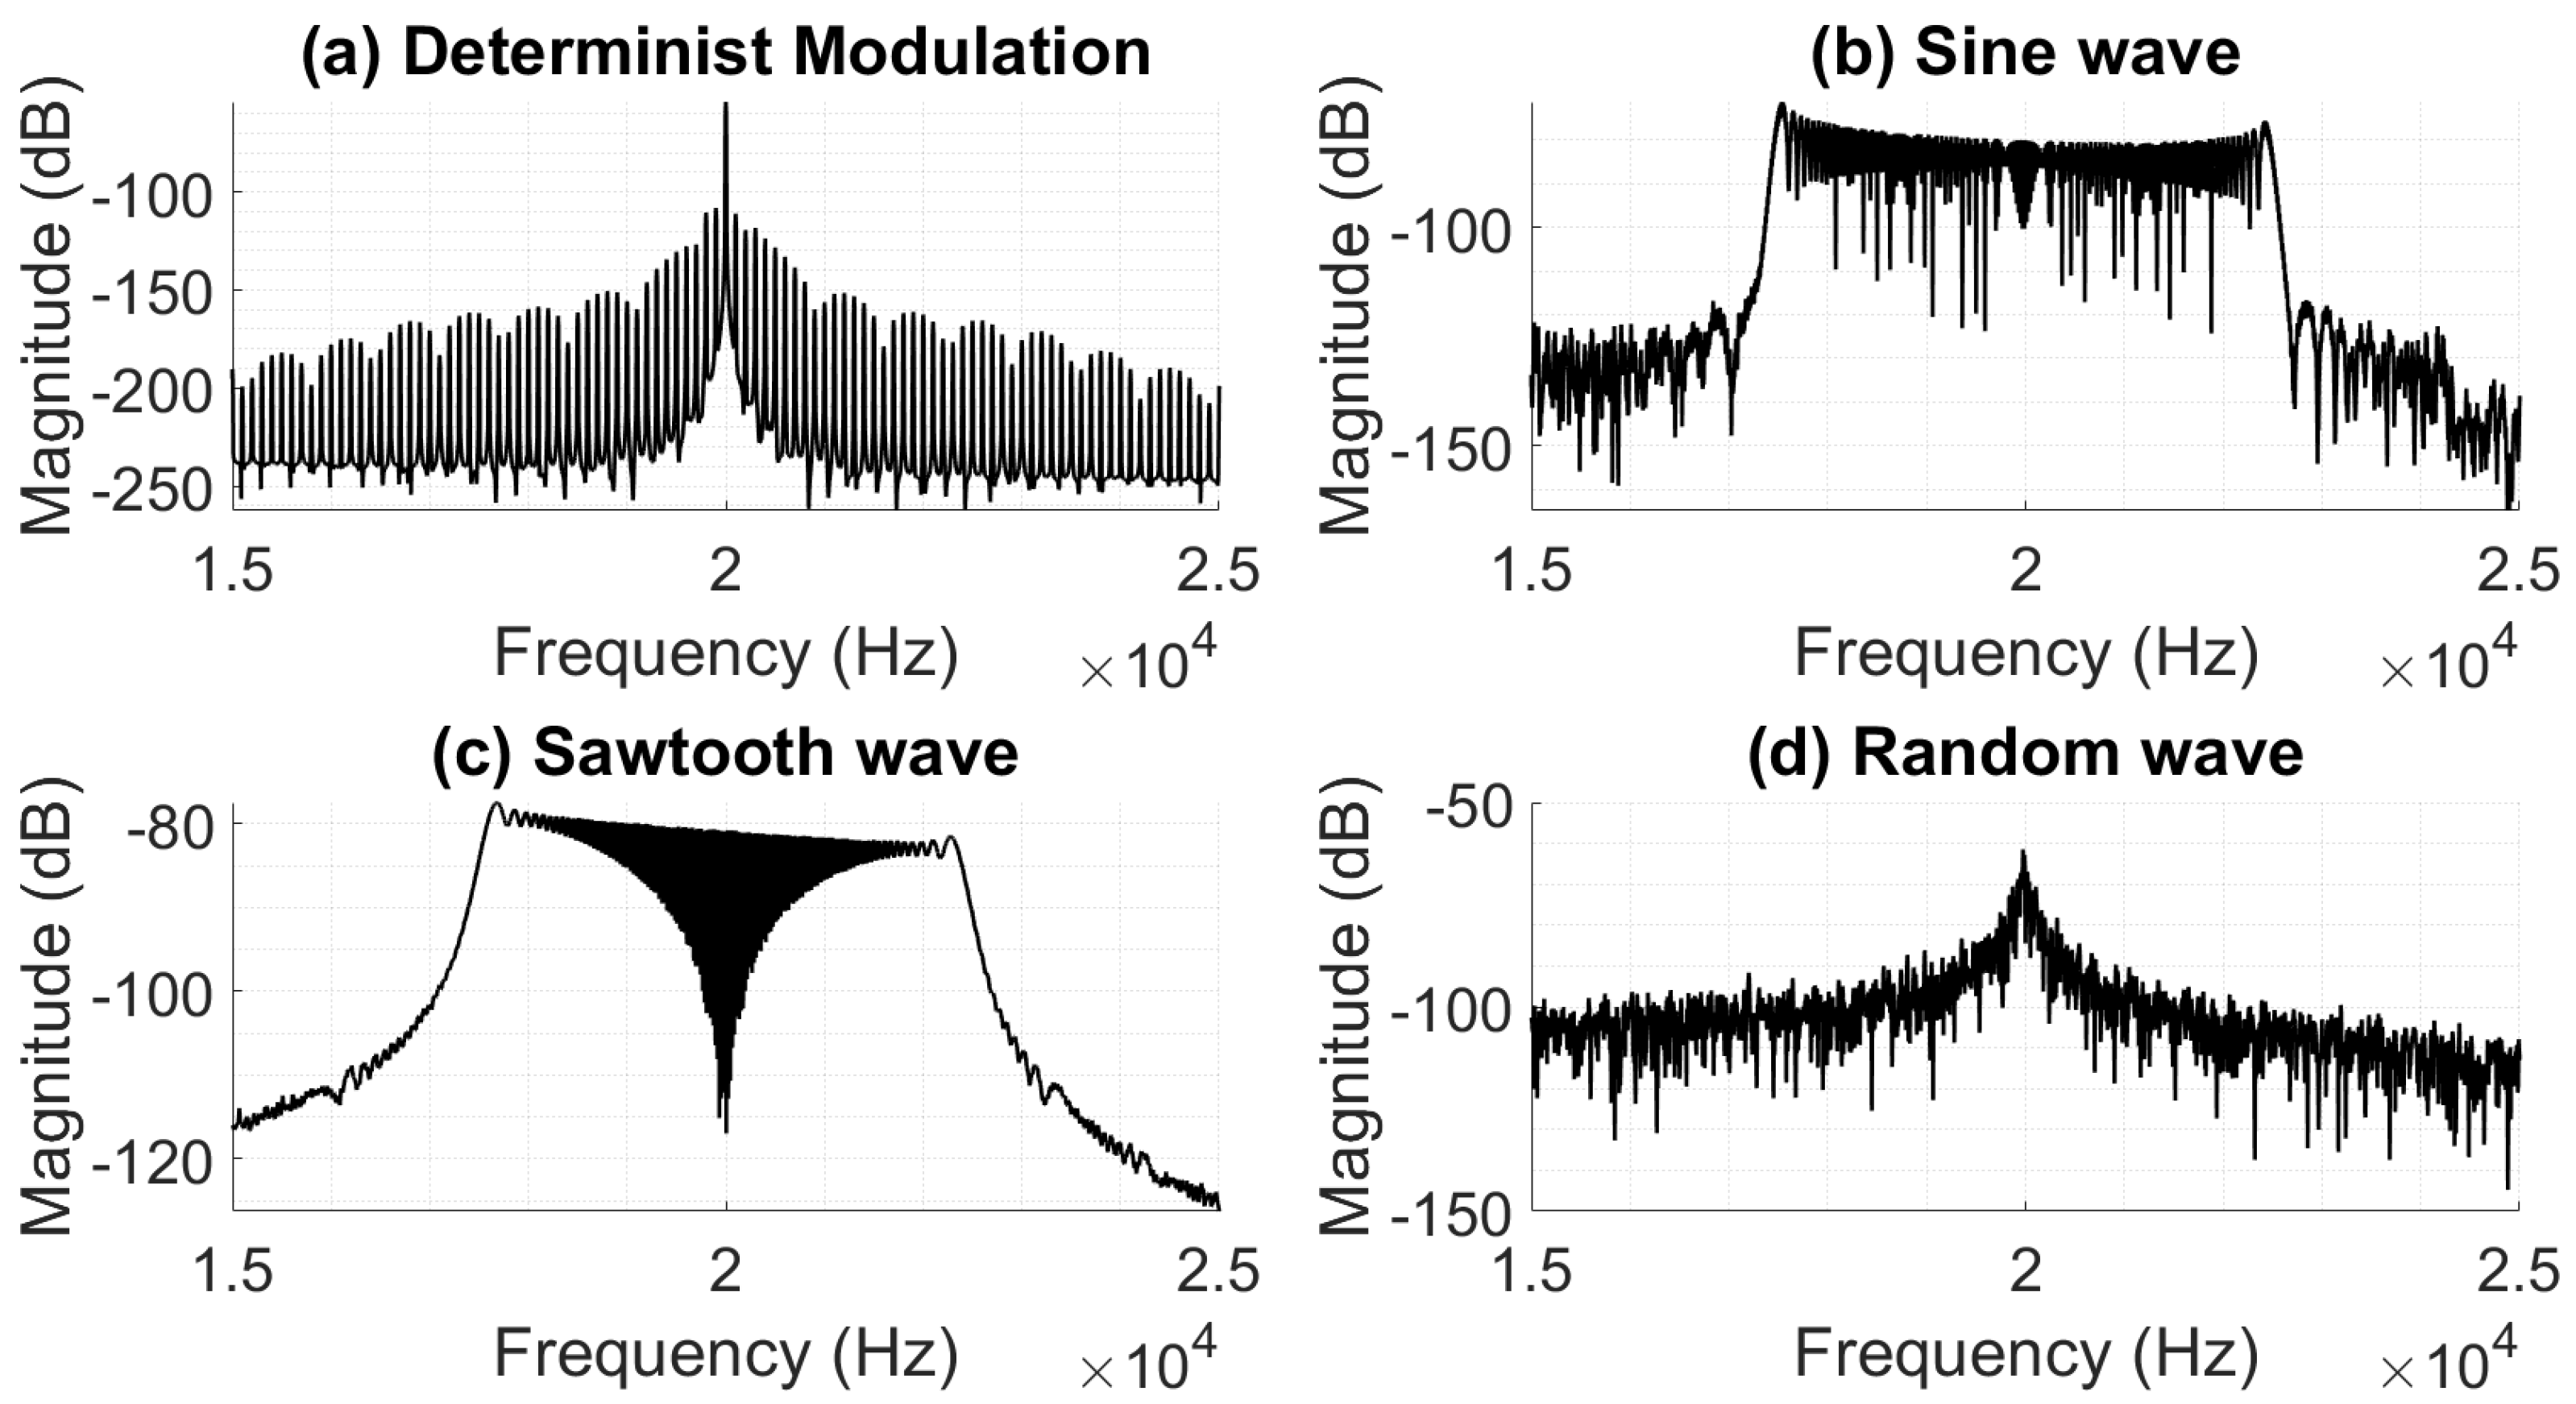
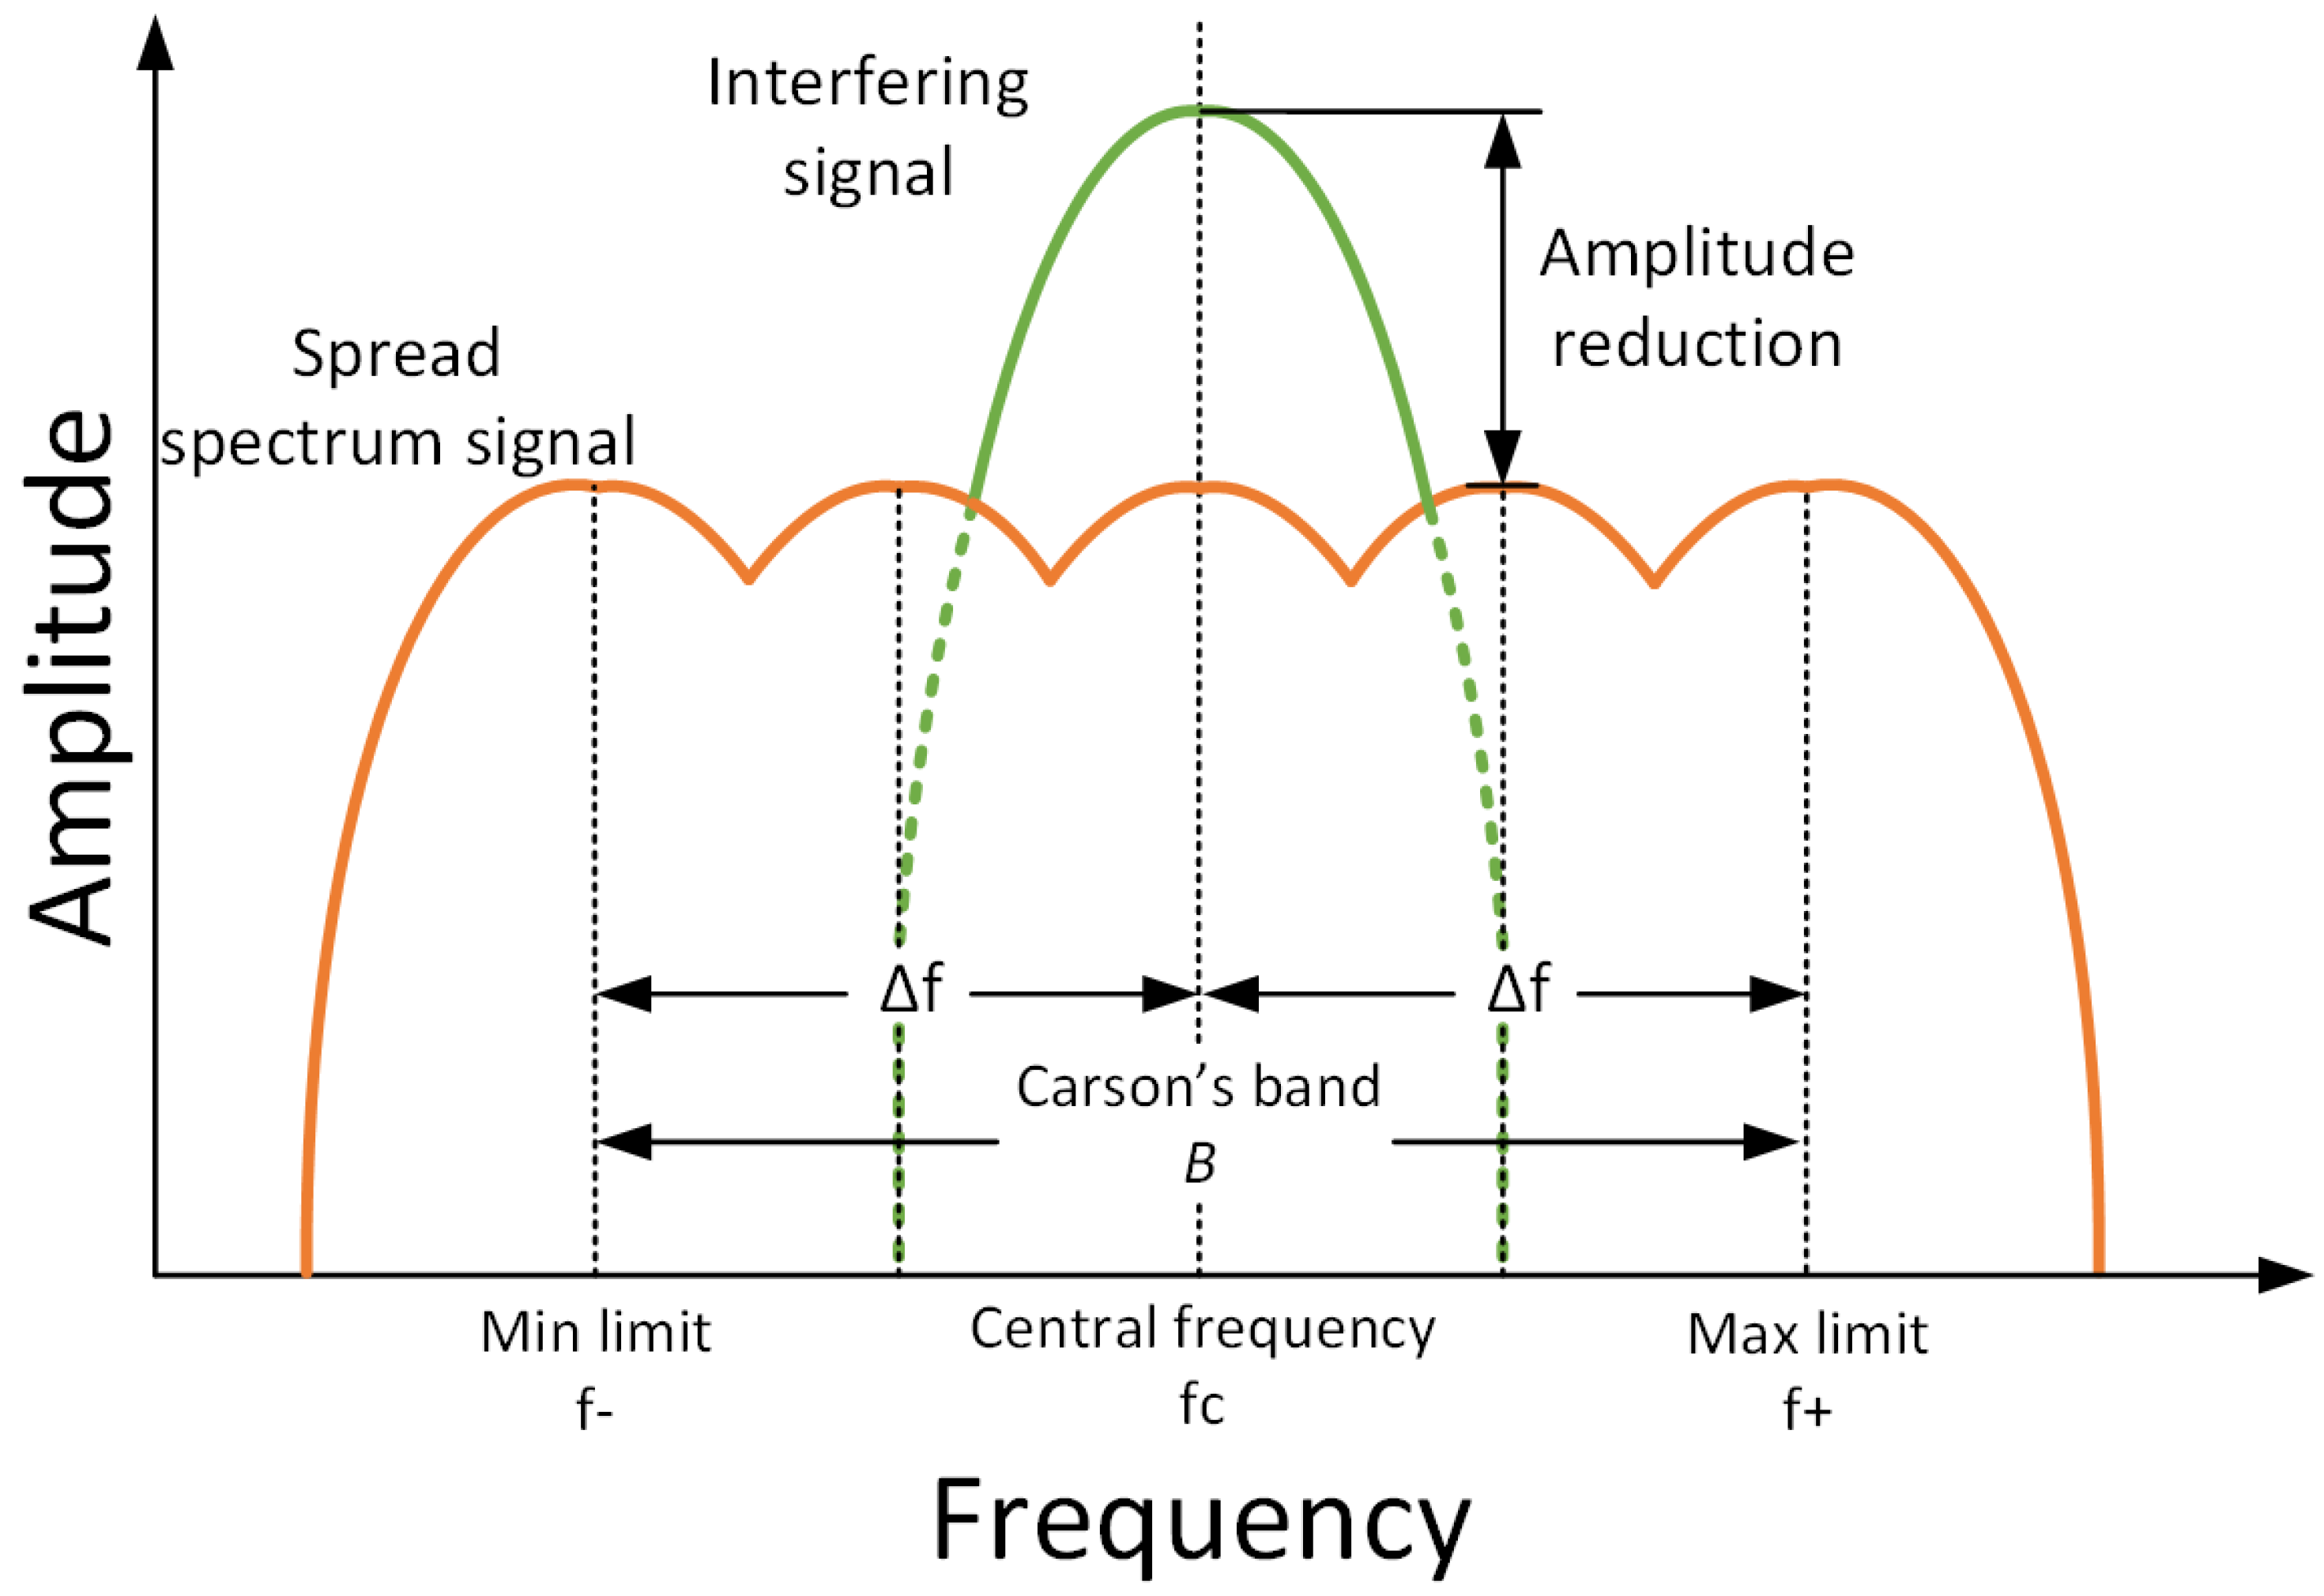
4. Spread Spectrum Modulation
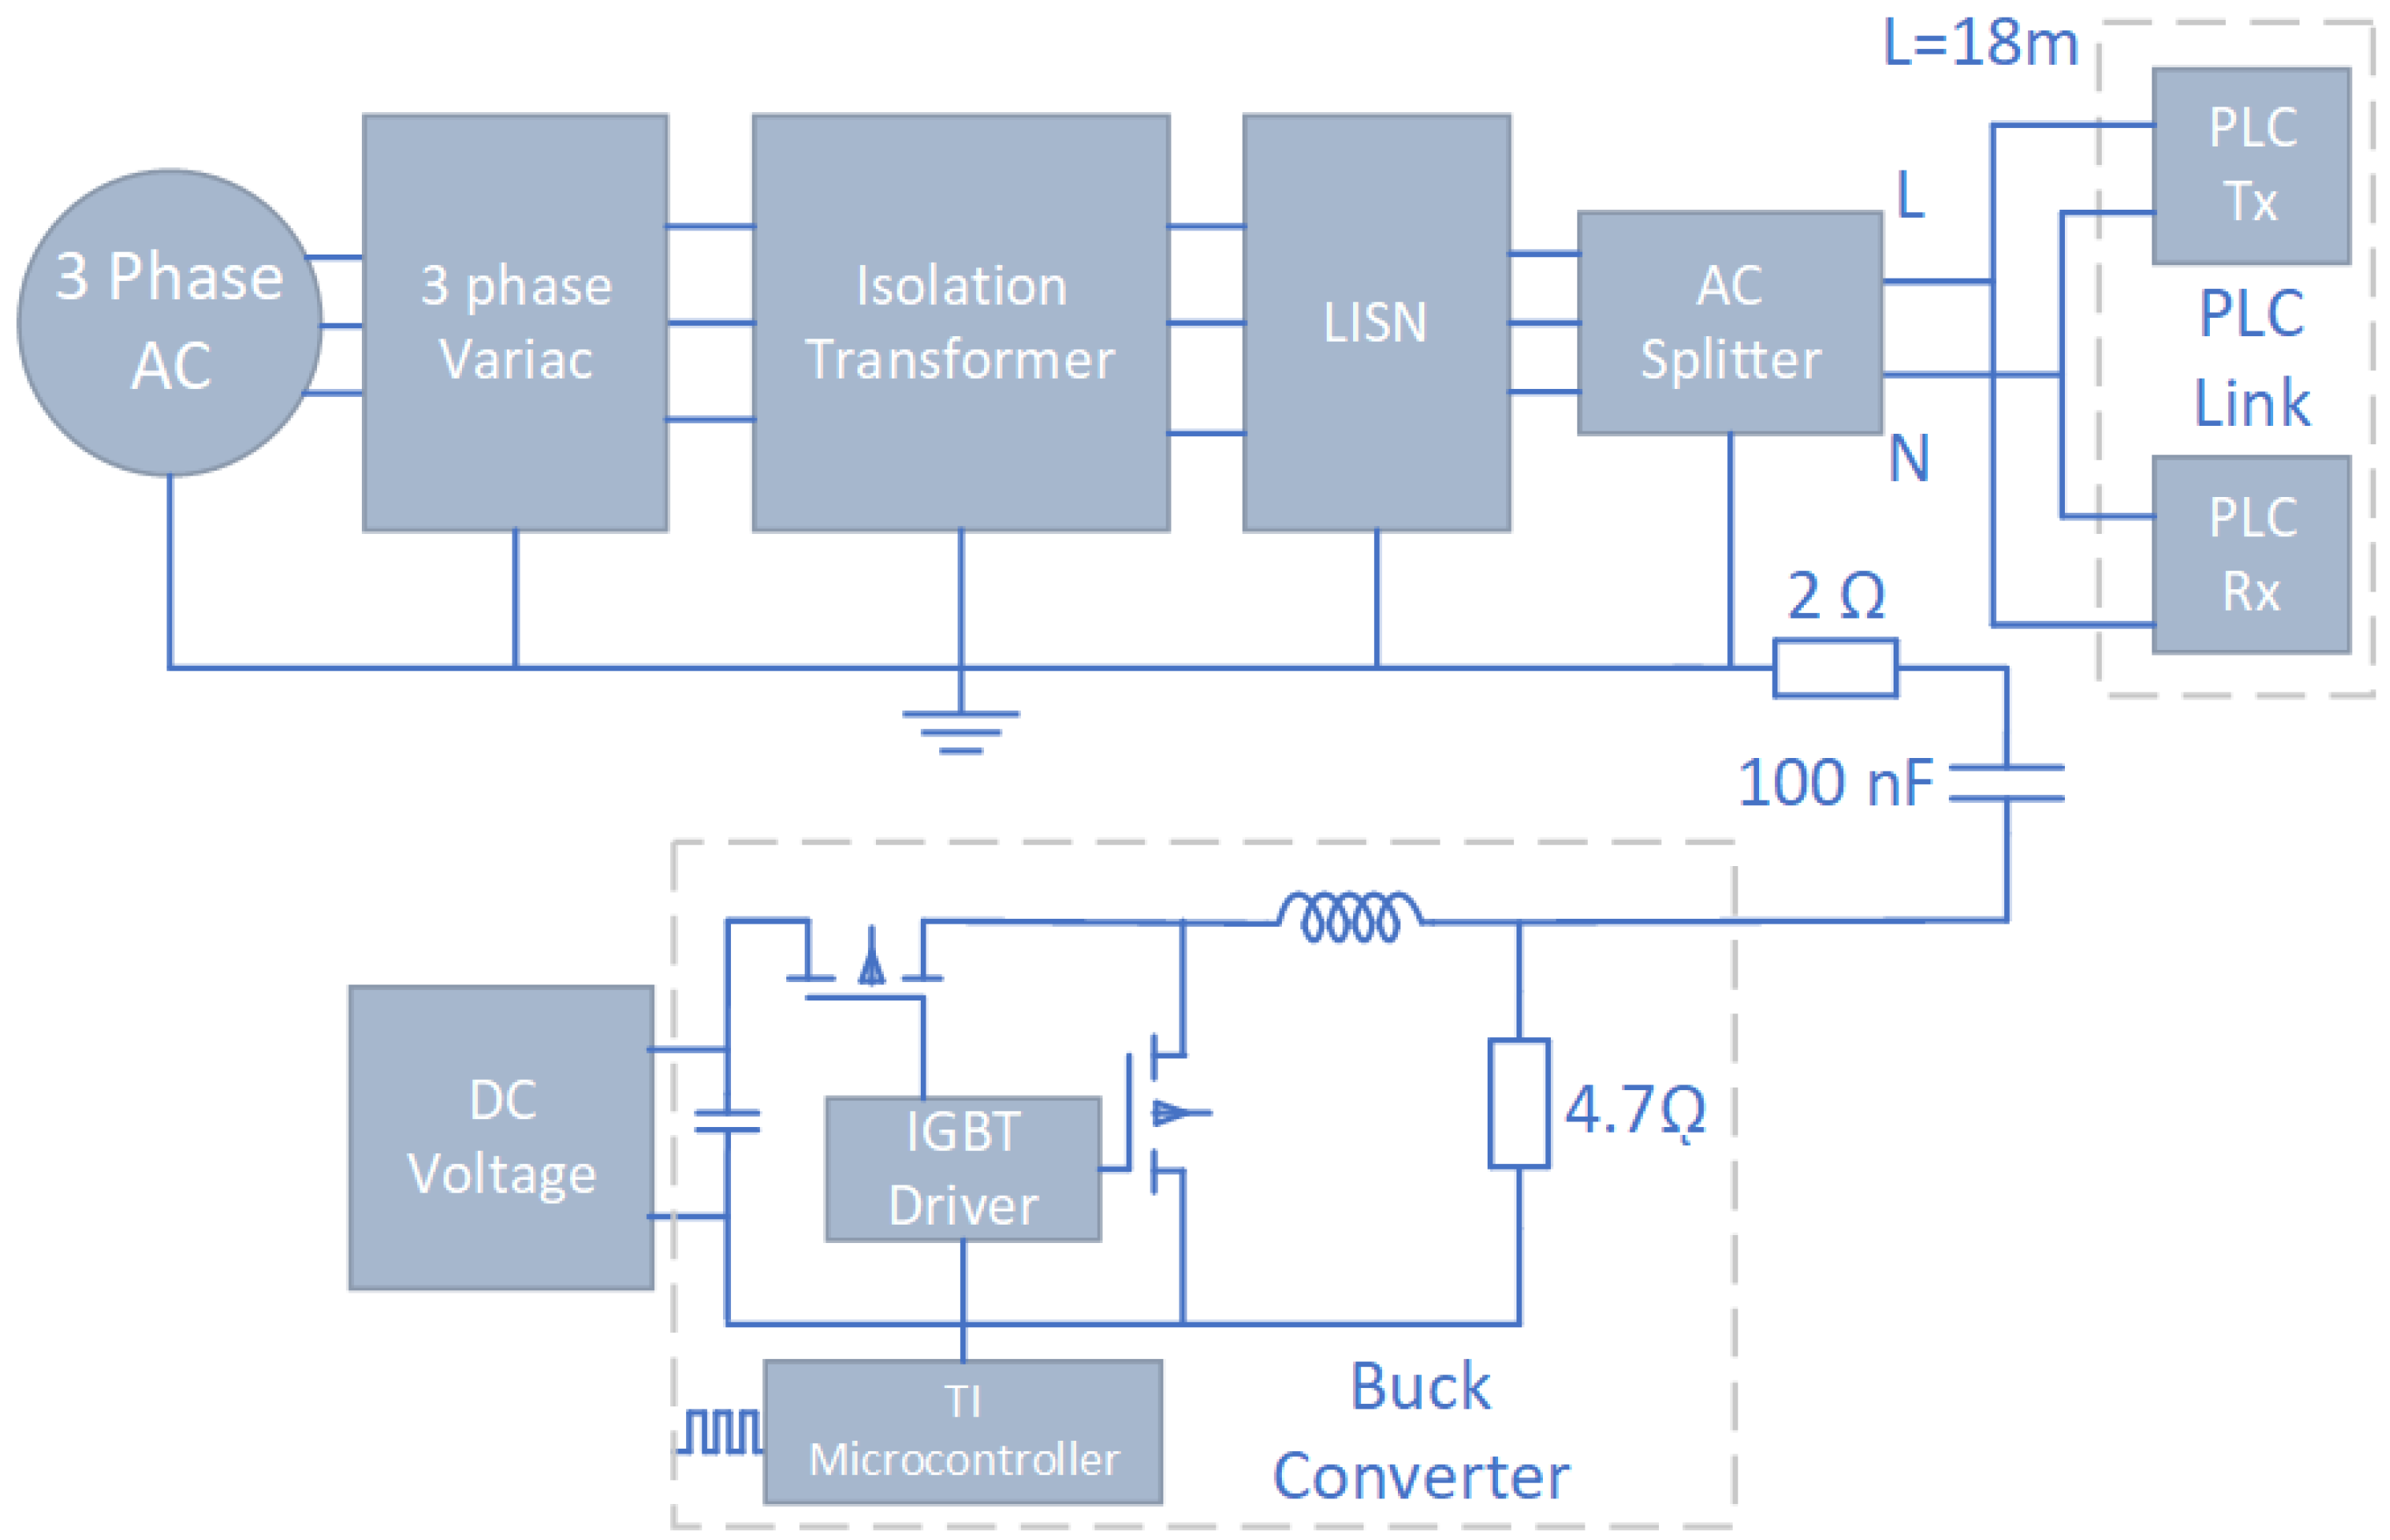
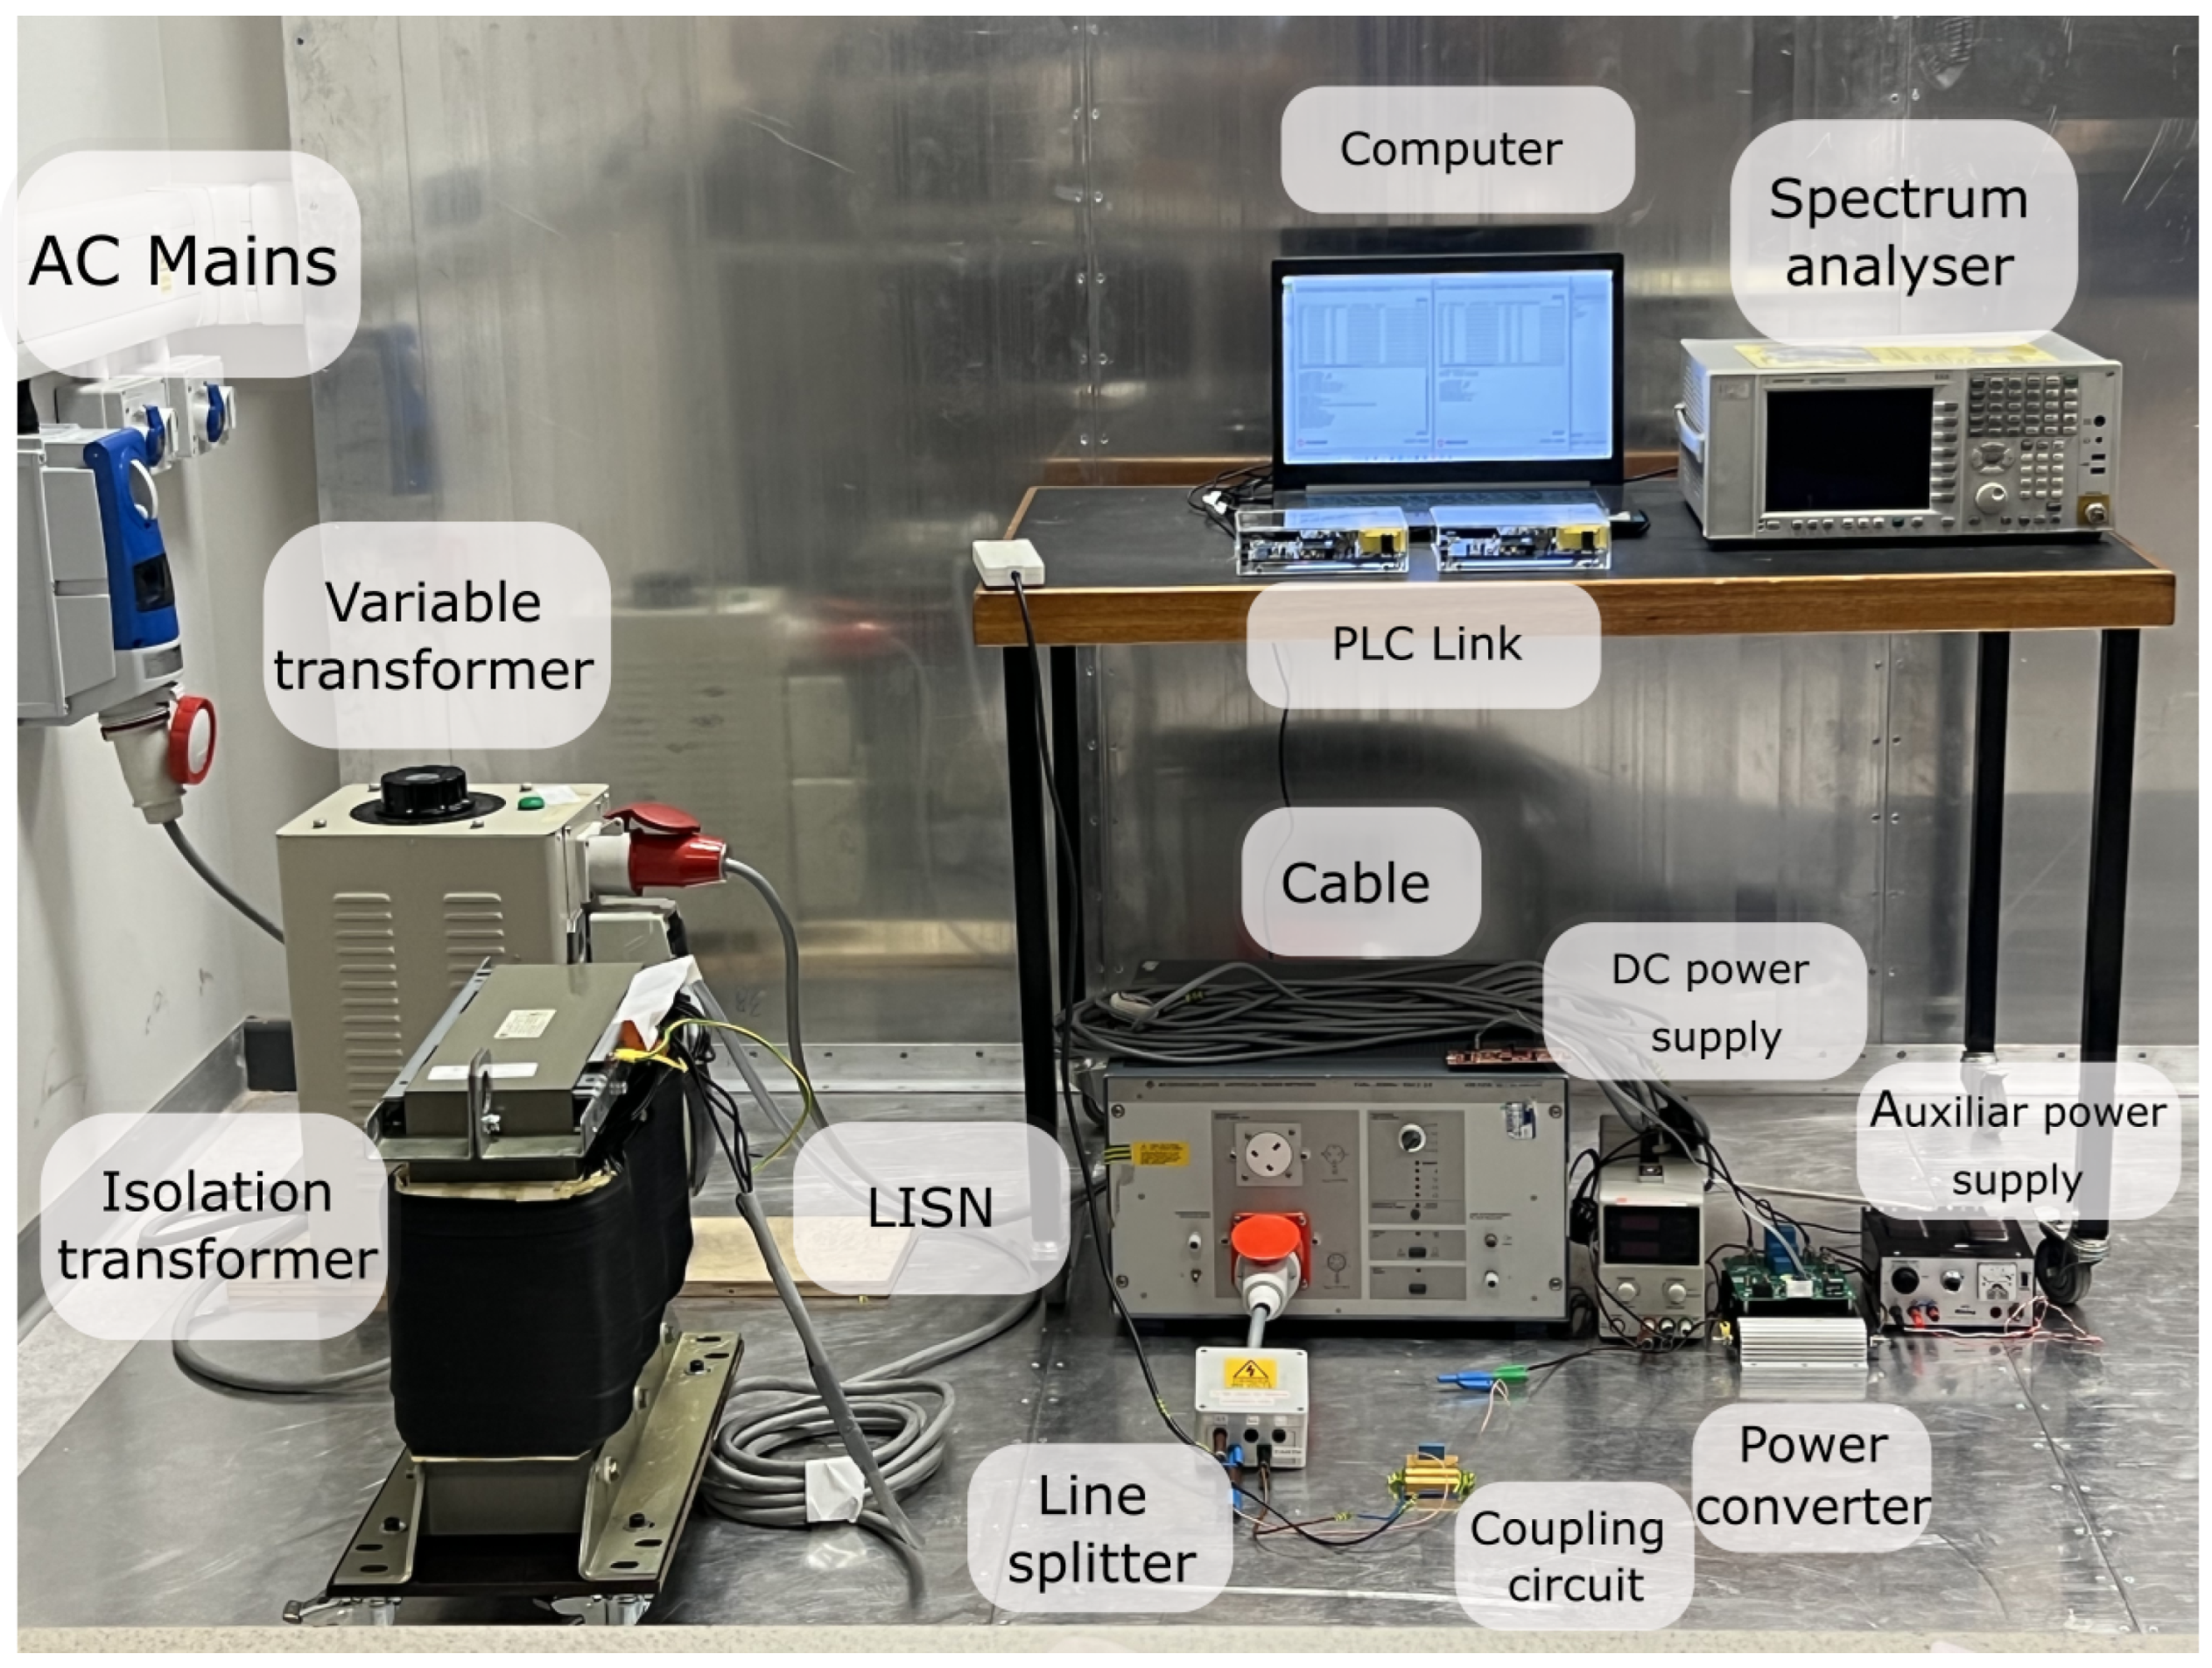
5. Experimental Setup
- PLC Modems. Two PL360 modems from Microchip, one of which is the transmitter and one of which is the receiver, in G3 PLC standard were used. They make it possible to assess the effectiveness of point-to-point PLC.
- Power Supply. The power supply provides 60 V with a maximum current of 6 A.
- LISN. The LISN used is the Schwarzbeck NSLK 8127. This LISN is CISPR-16 compliant with a frequency range from 9 kHz to 30 MHz.
- Spectrum Analyser. The configured parameters are given by the RBW of 200 Hz; the frequency bandwidth to be analysed is from 9 kHz to 150 kHz to account for the low-frequency band.
- EMI Receiver. The EMI receiver is the Rohde & Schwarz ESR3 with a frequency range from 9 kHz to 3.6 GHz (CISPR-16 compliant)
- Power Converter. The DC-DC converter is a half-bridge converter with SiC-based Mosfet transistors (manufactured by Wolfspeed). The converter topology is a Synchronous Buck Converter with a base switching frequency of 50 kHz. The converter uses an input capacitor of 5.1 F, and the output capacitor is 470 F to decrease the ripple generated and to provide a steady voltage at the output. The switching frequency of the DC converter is set to 63 kHz, which is the intermediate operating frequency of the G3-PLC. The Texas Instruments C2000 board is used to generate the SSM patterns, for all of the cases, a 50% of the duty cycle is used. The output load of the converter is 10 Ω.
6. Results
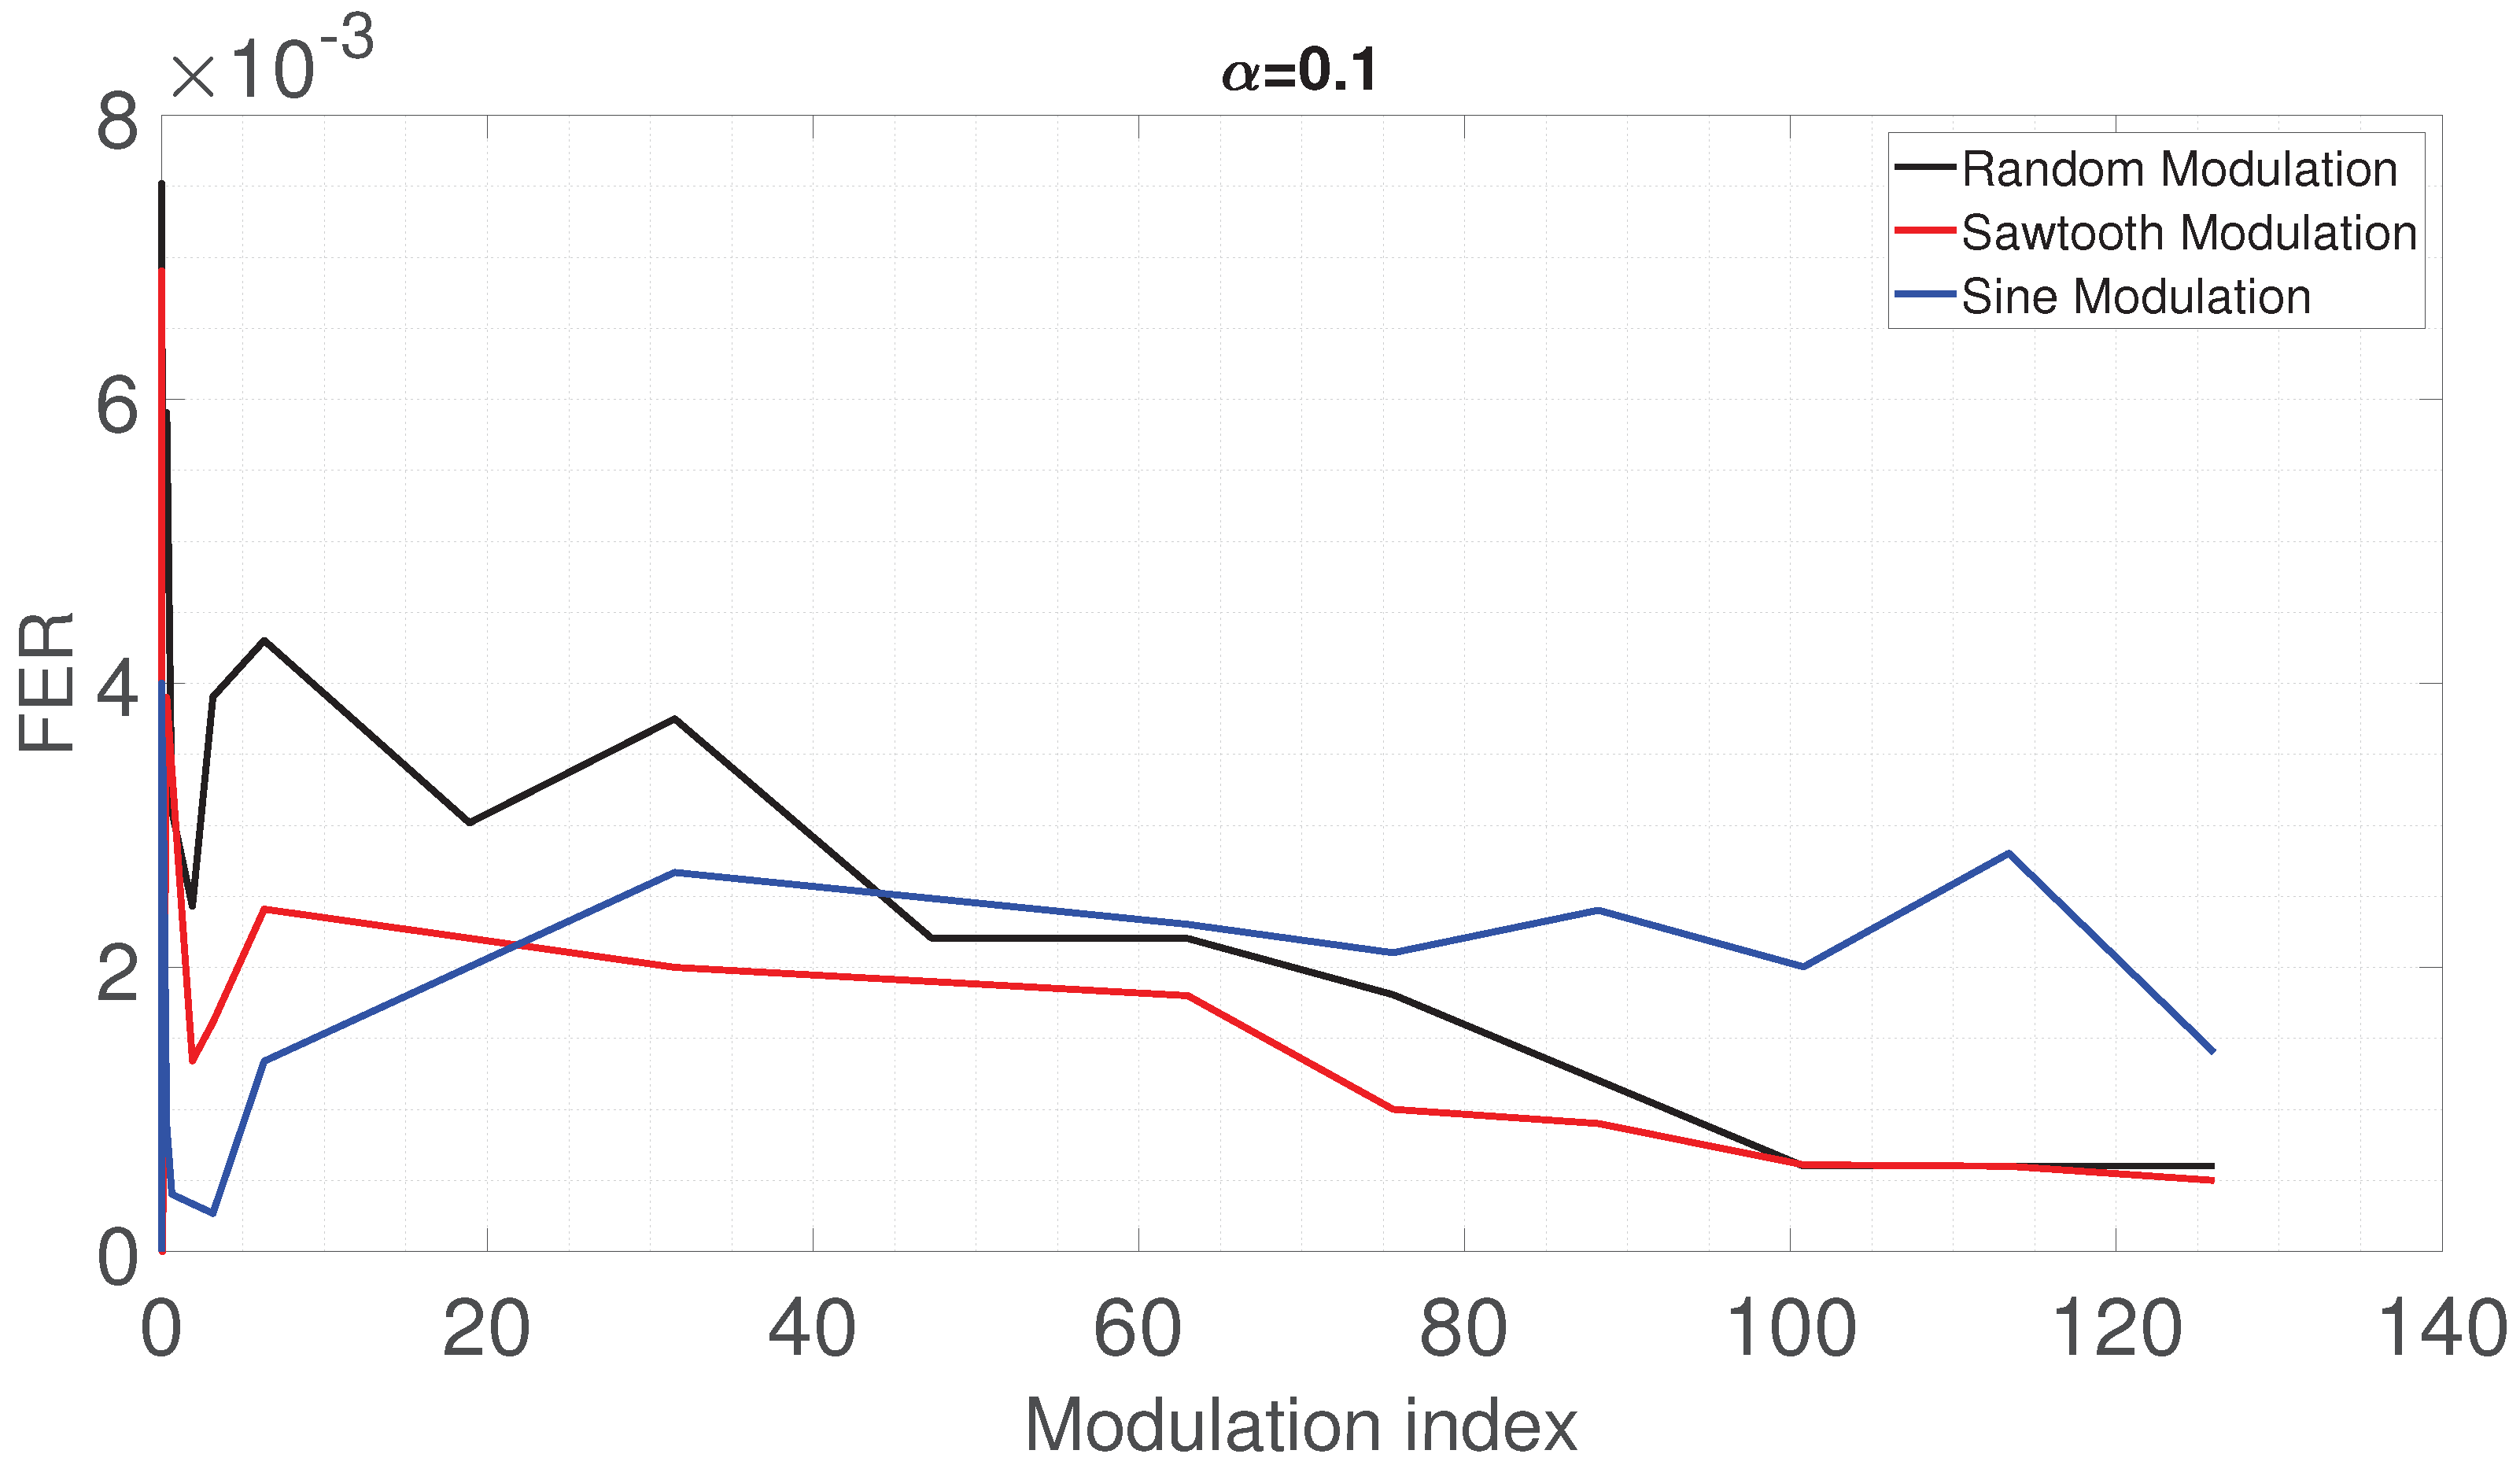
6.1. Results for = 0.1
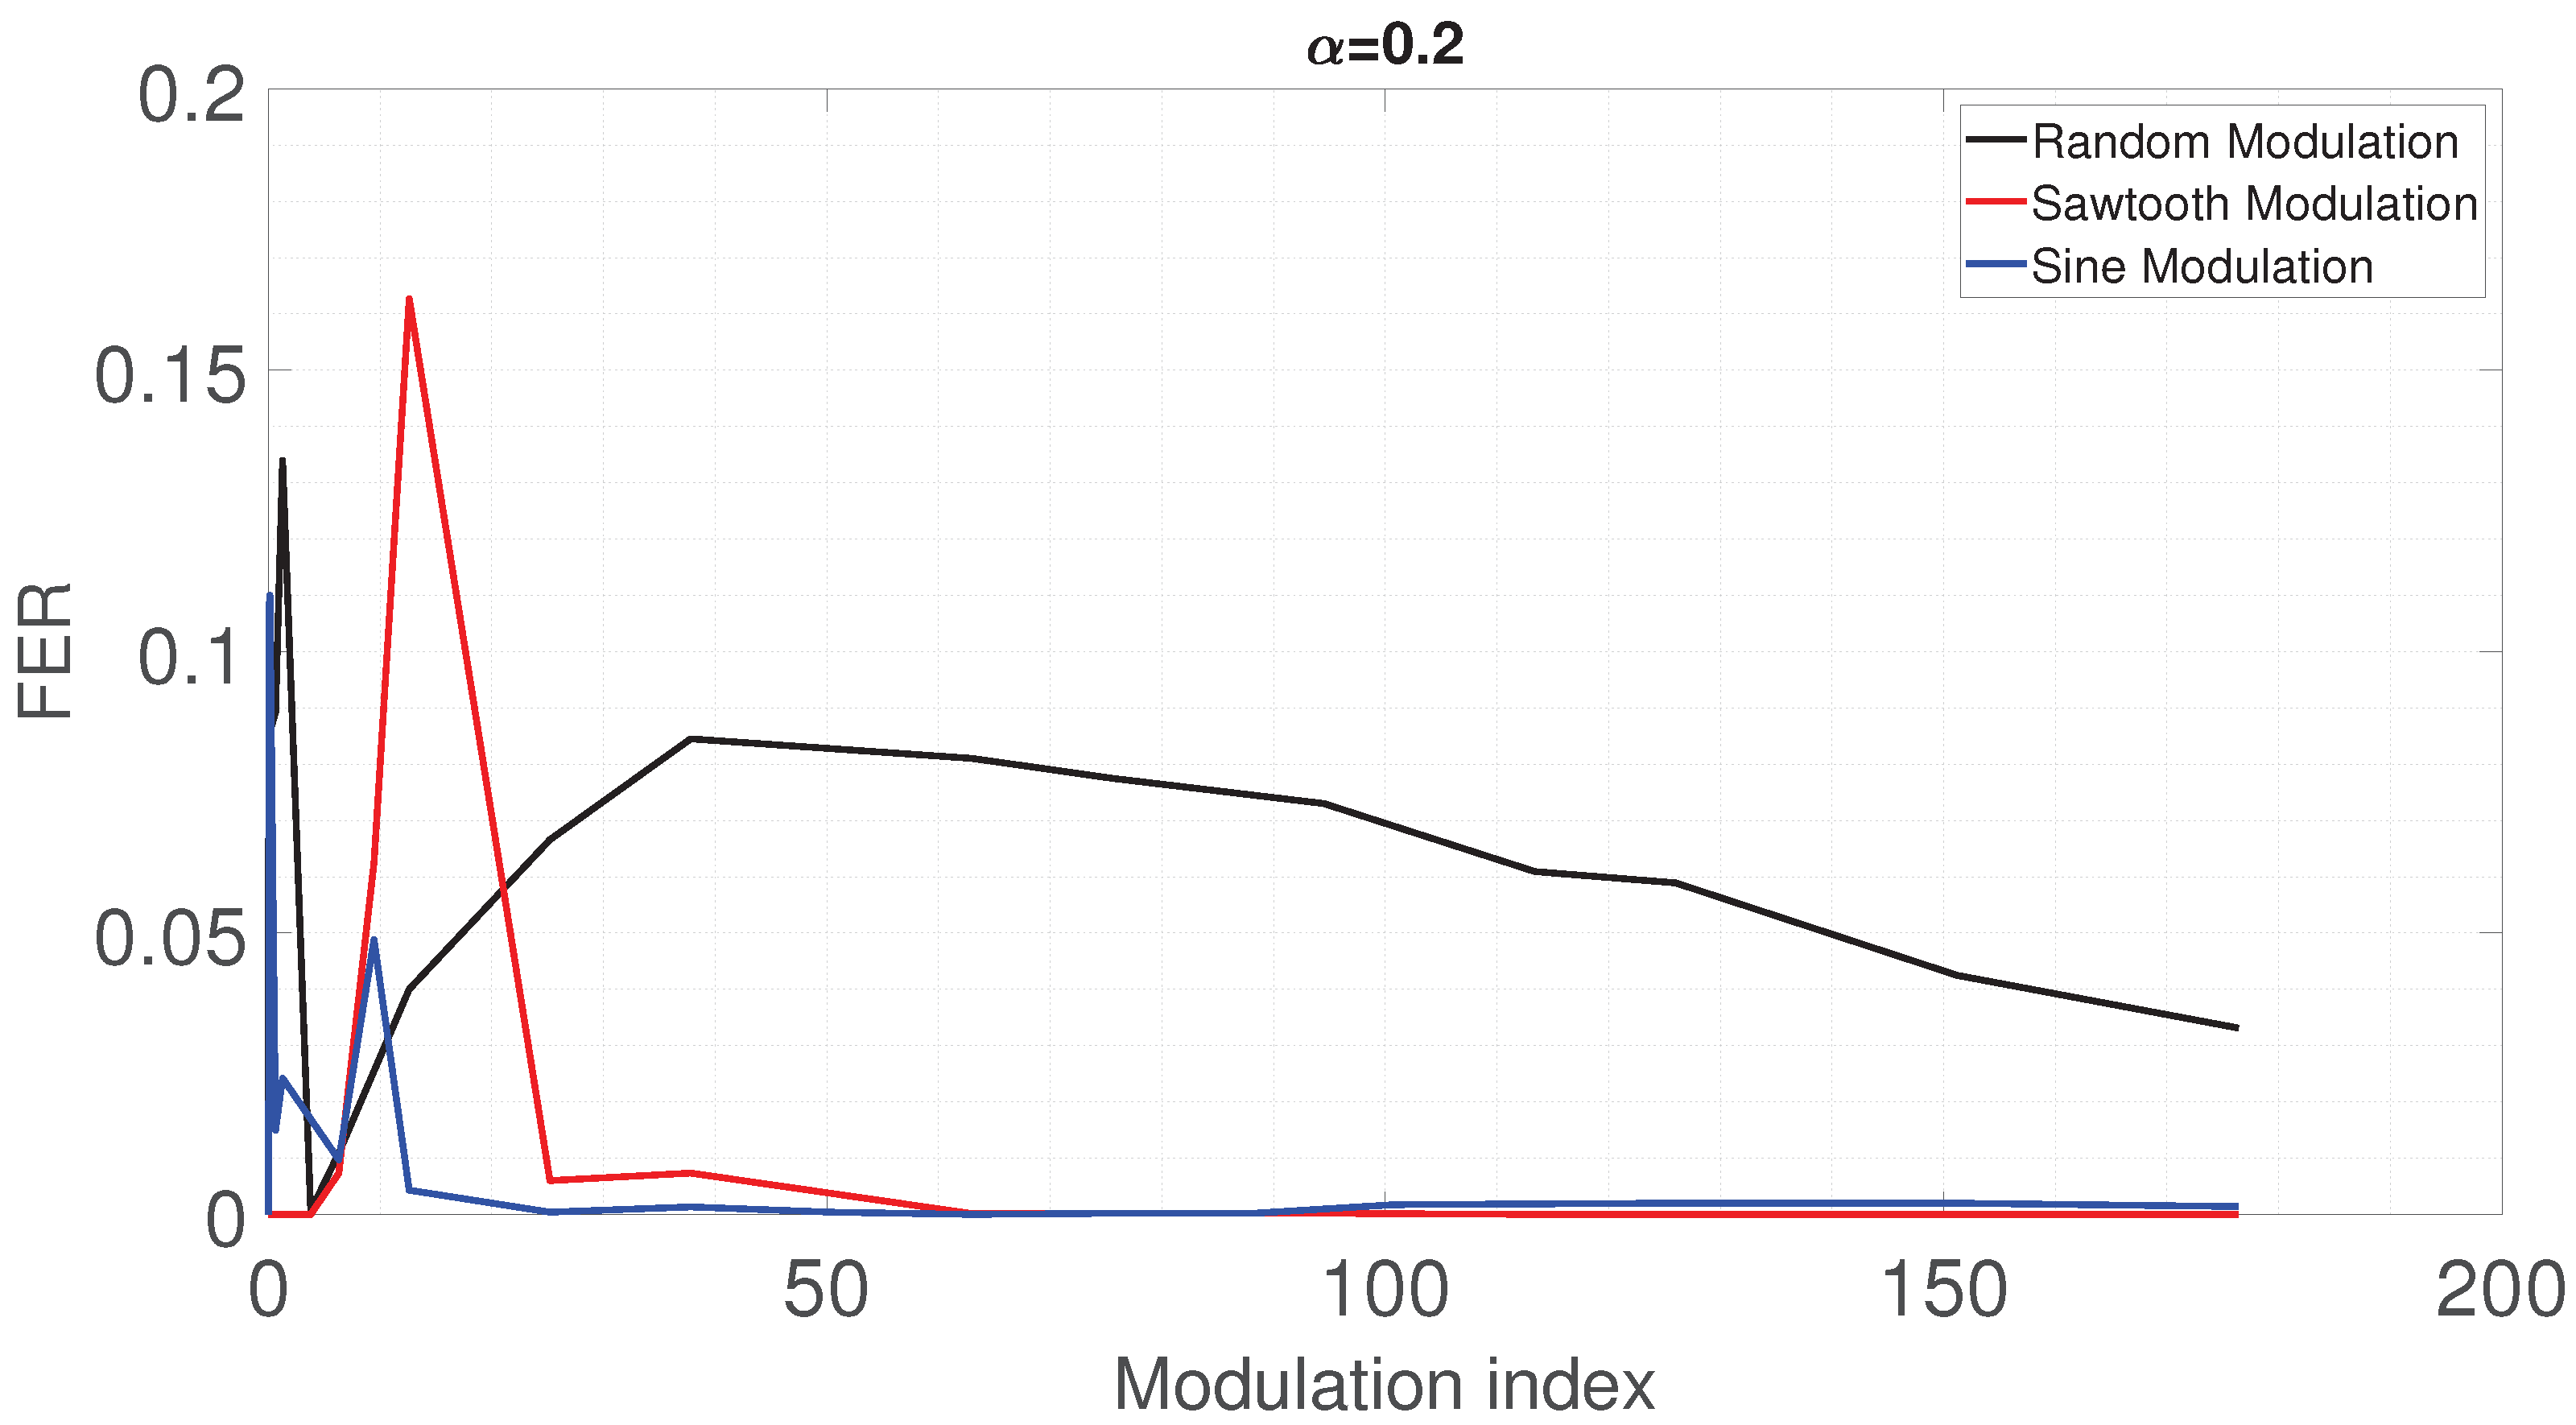
6.2. Results for = 0.2
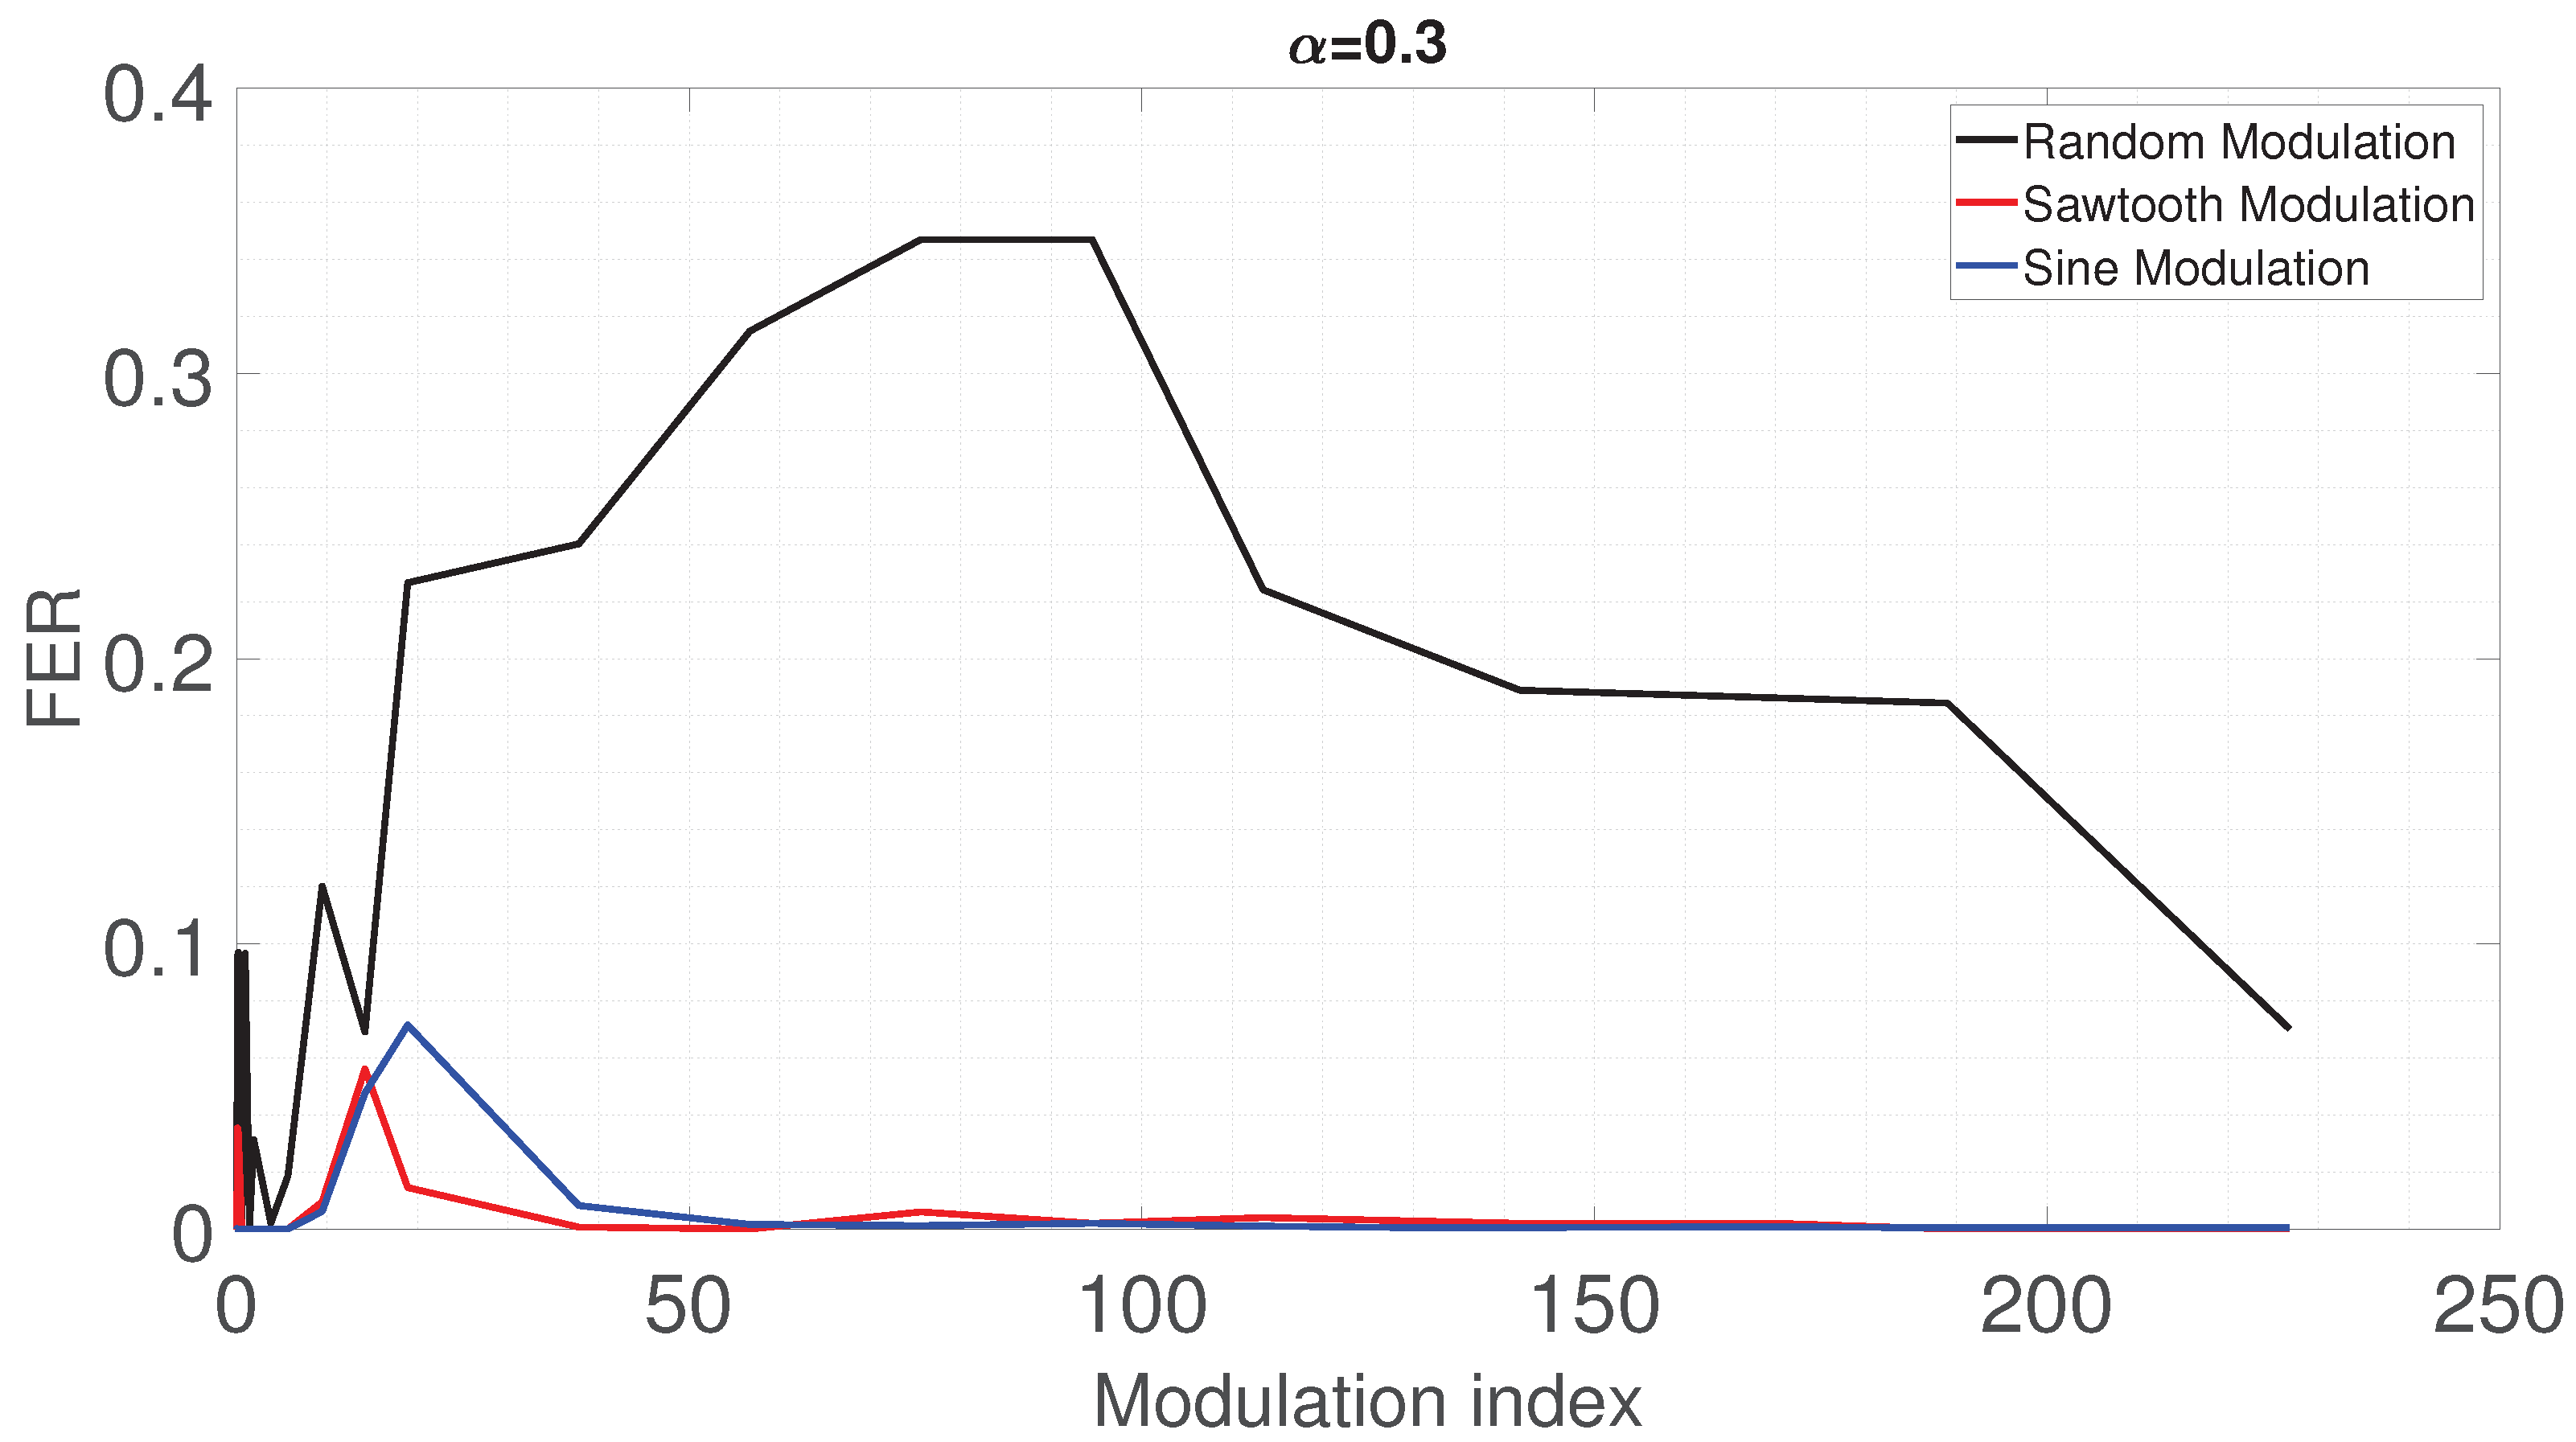
6.3. Results for = 0.3
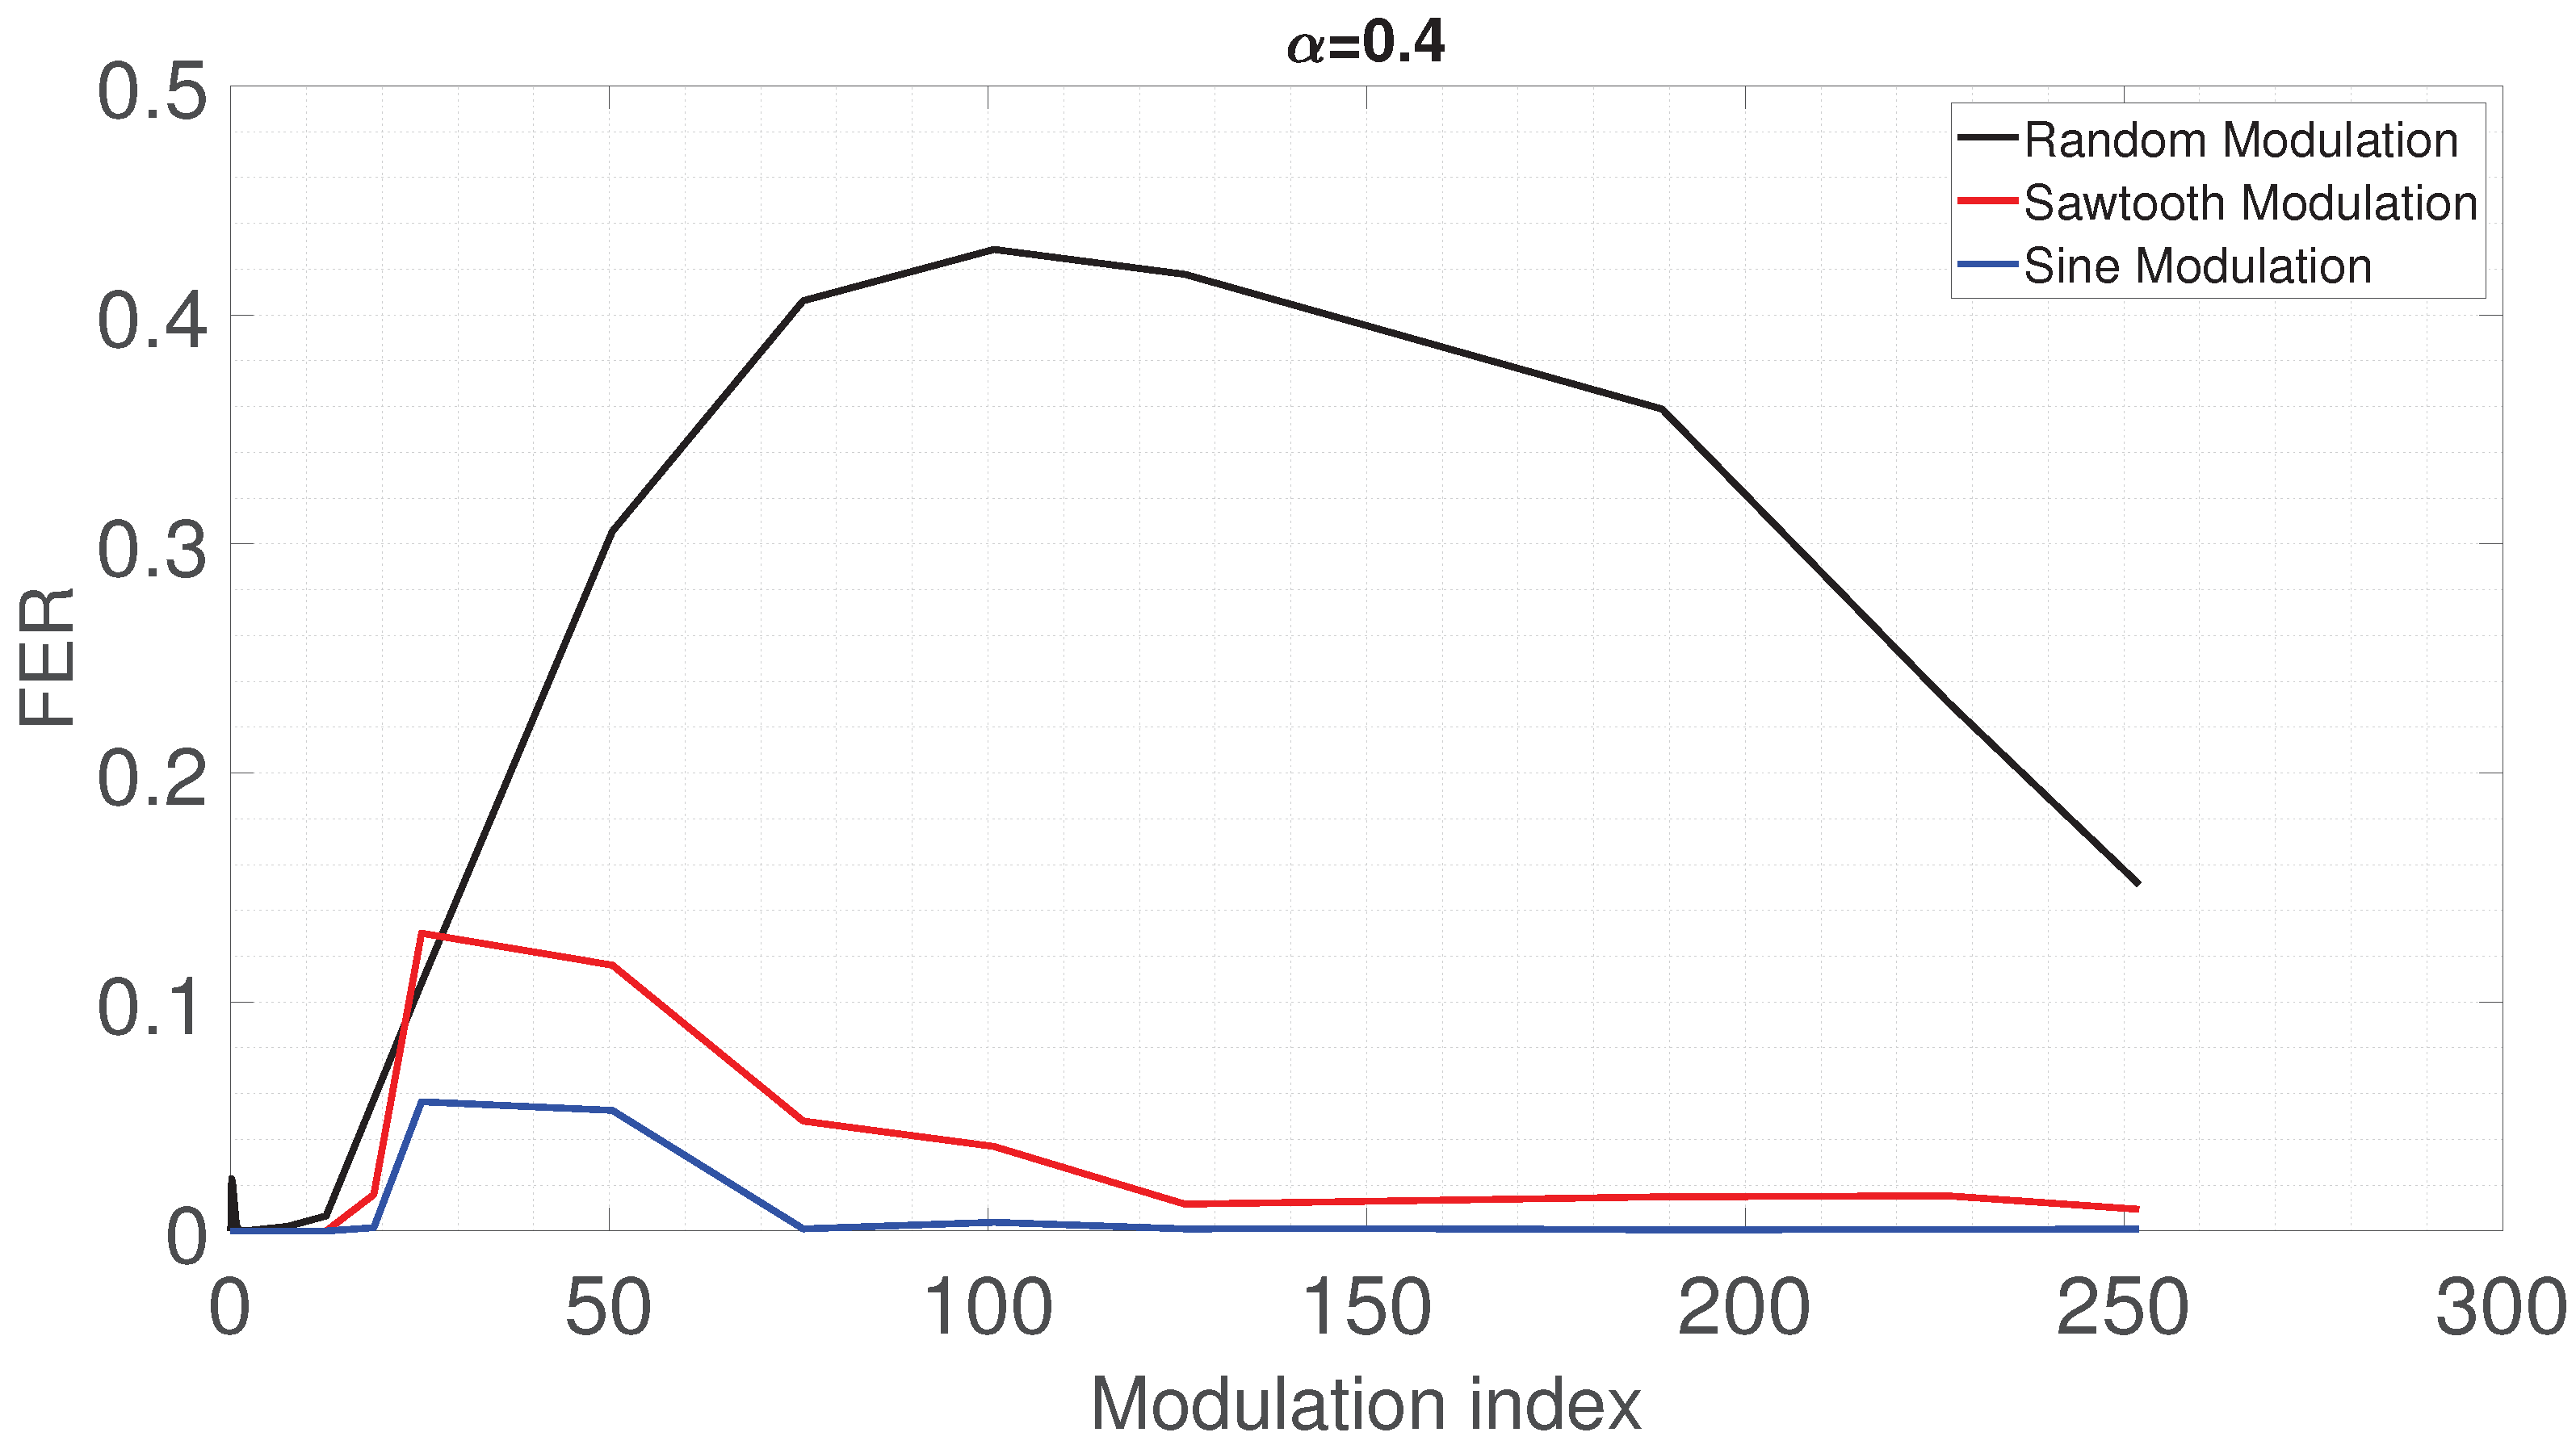
6.4. Results for = 0.4
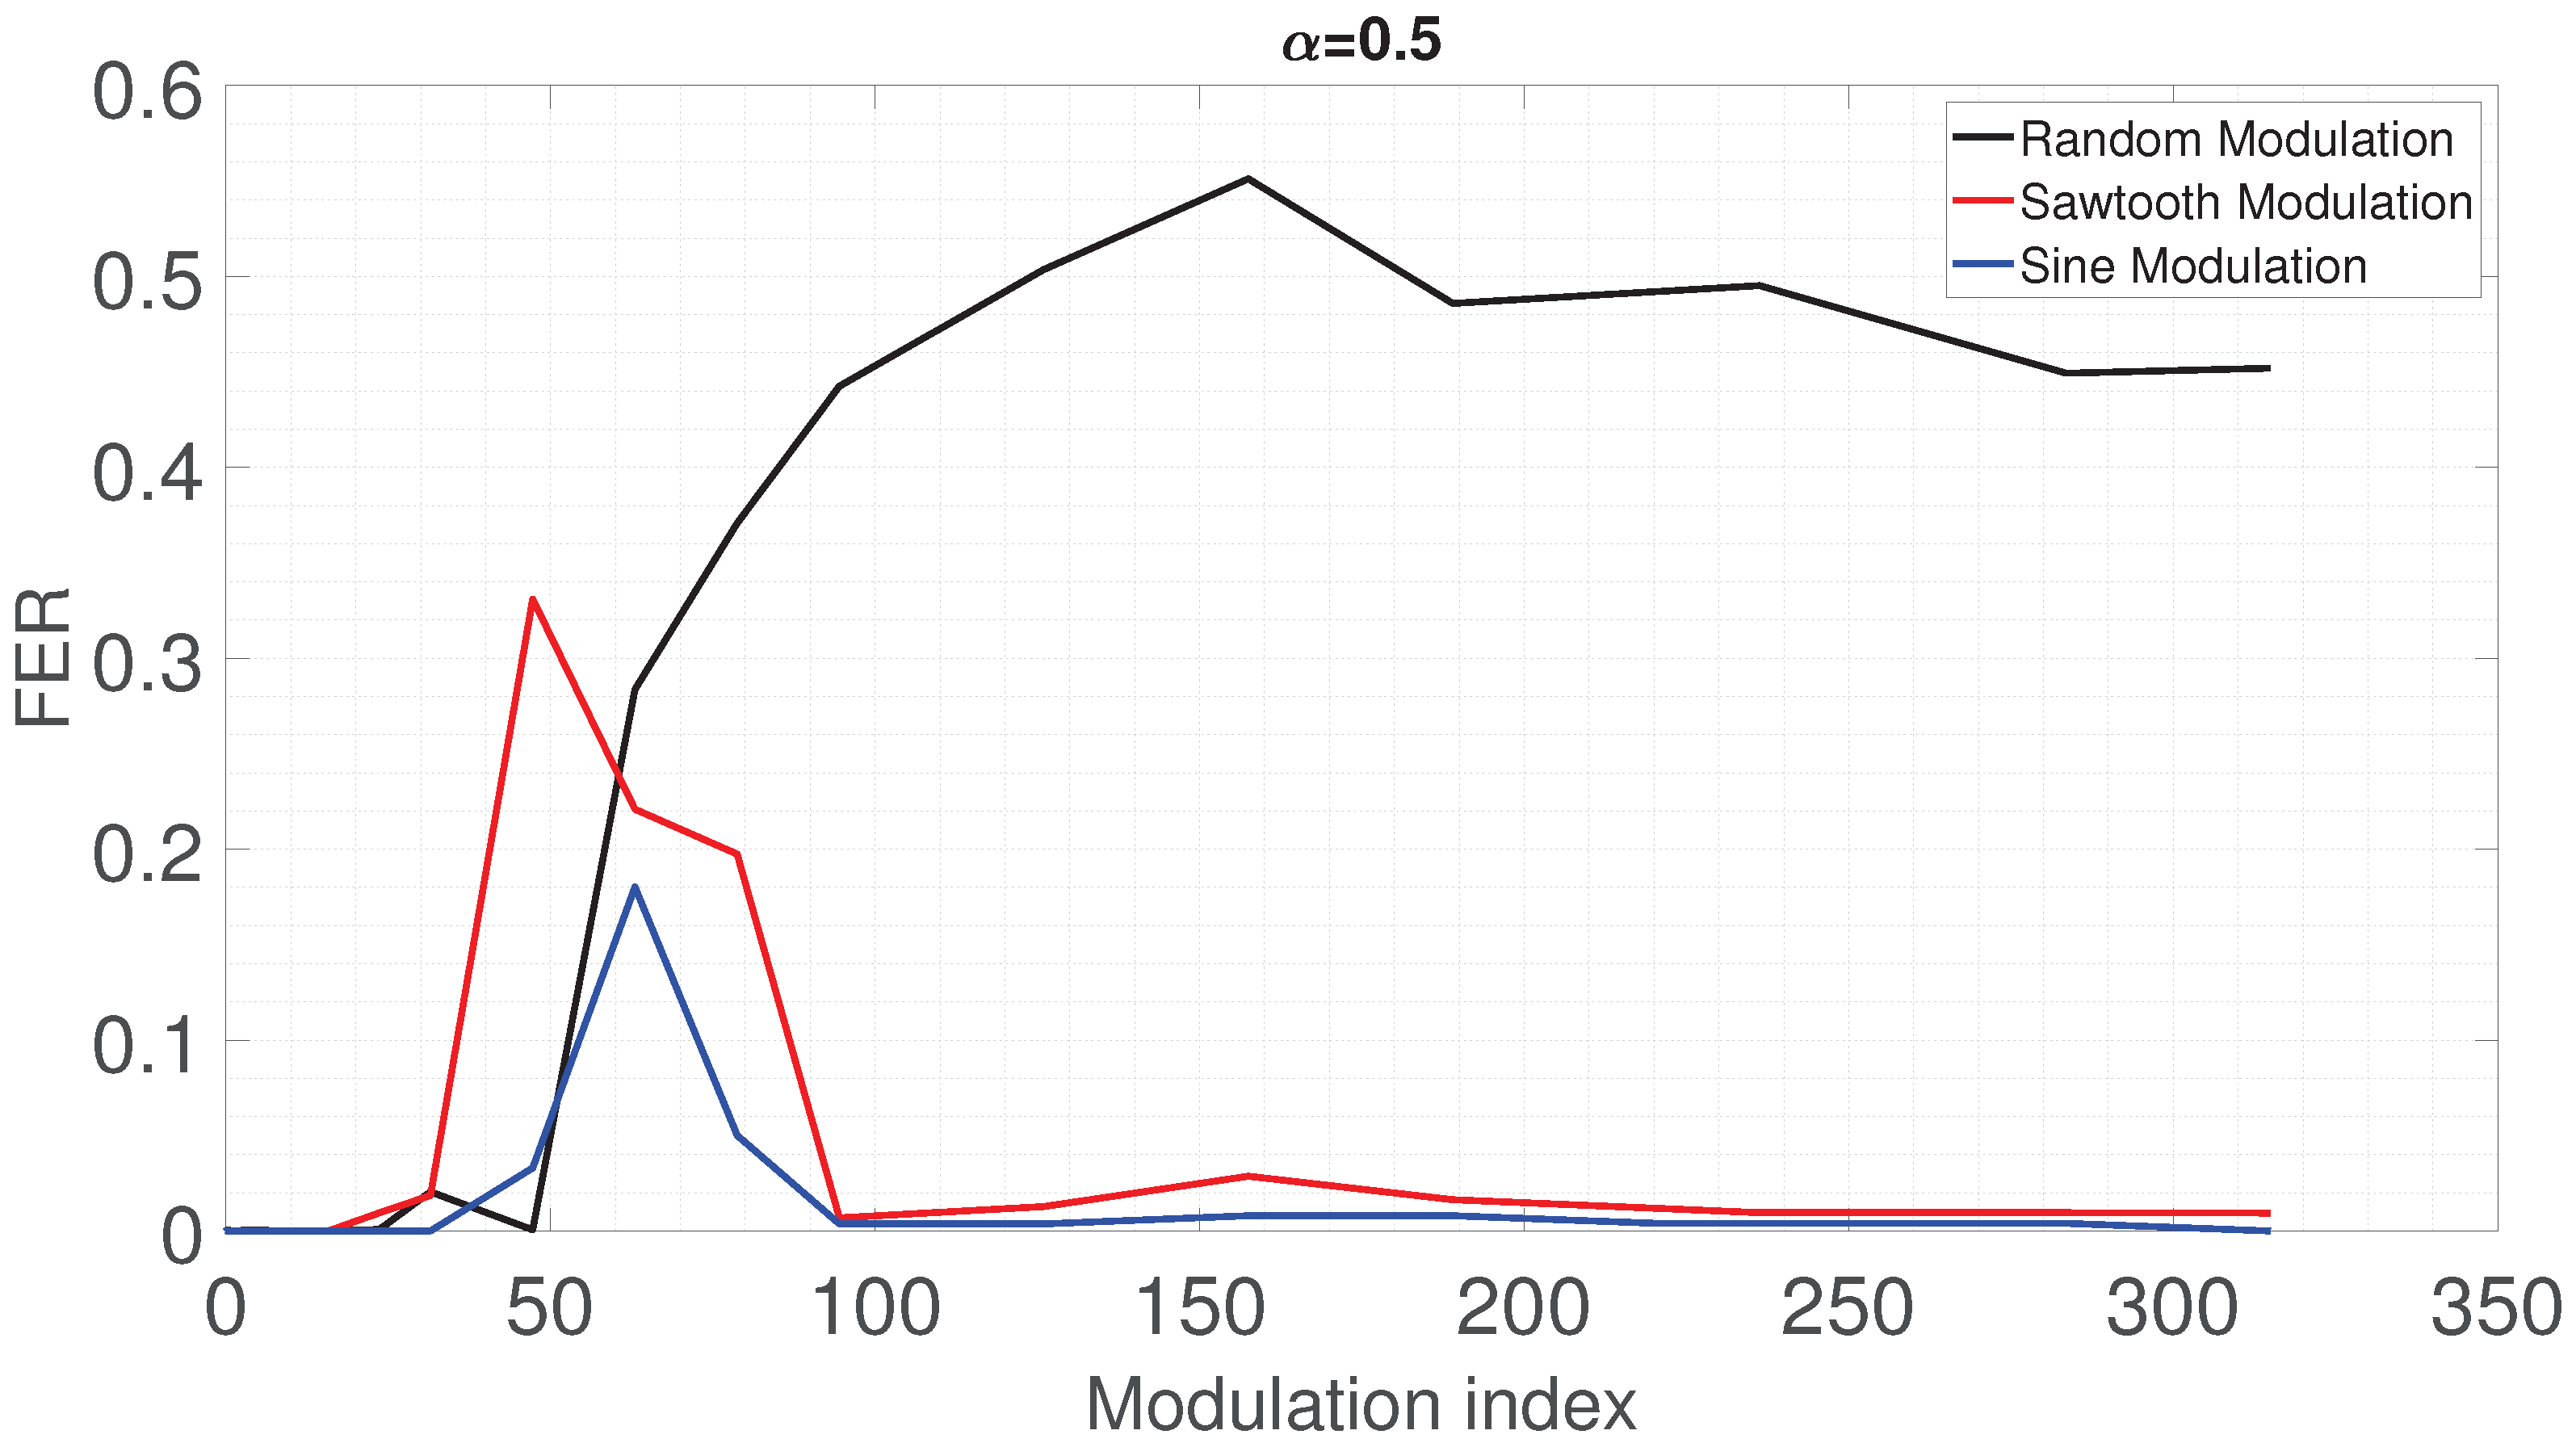
6.5. Results for = 0.5
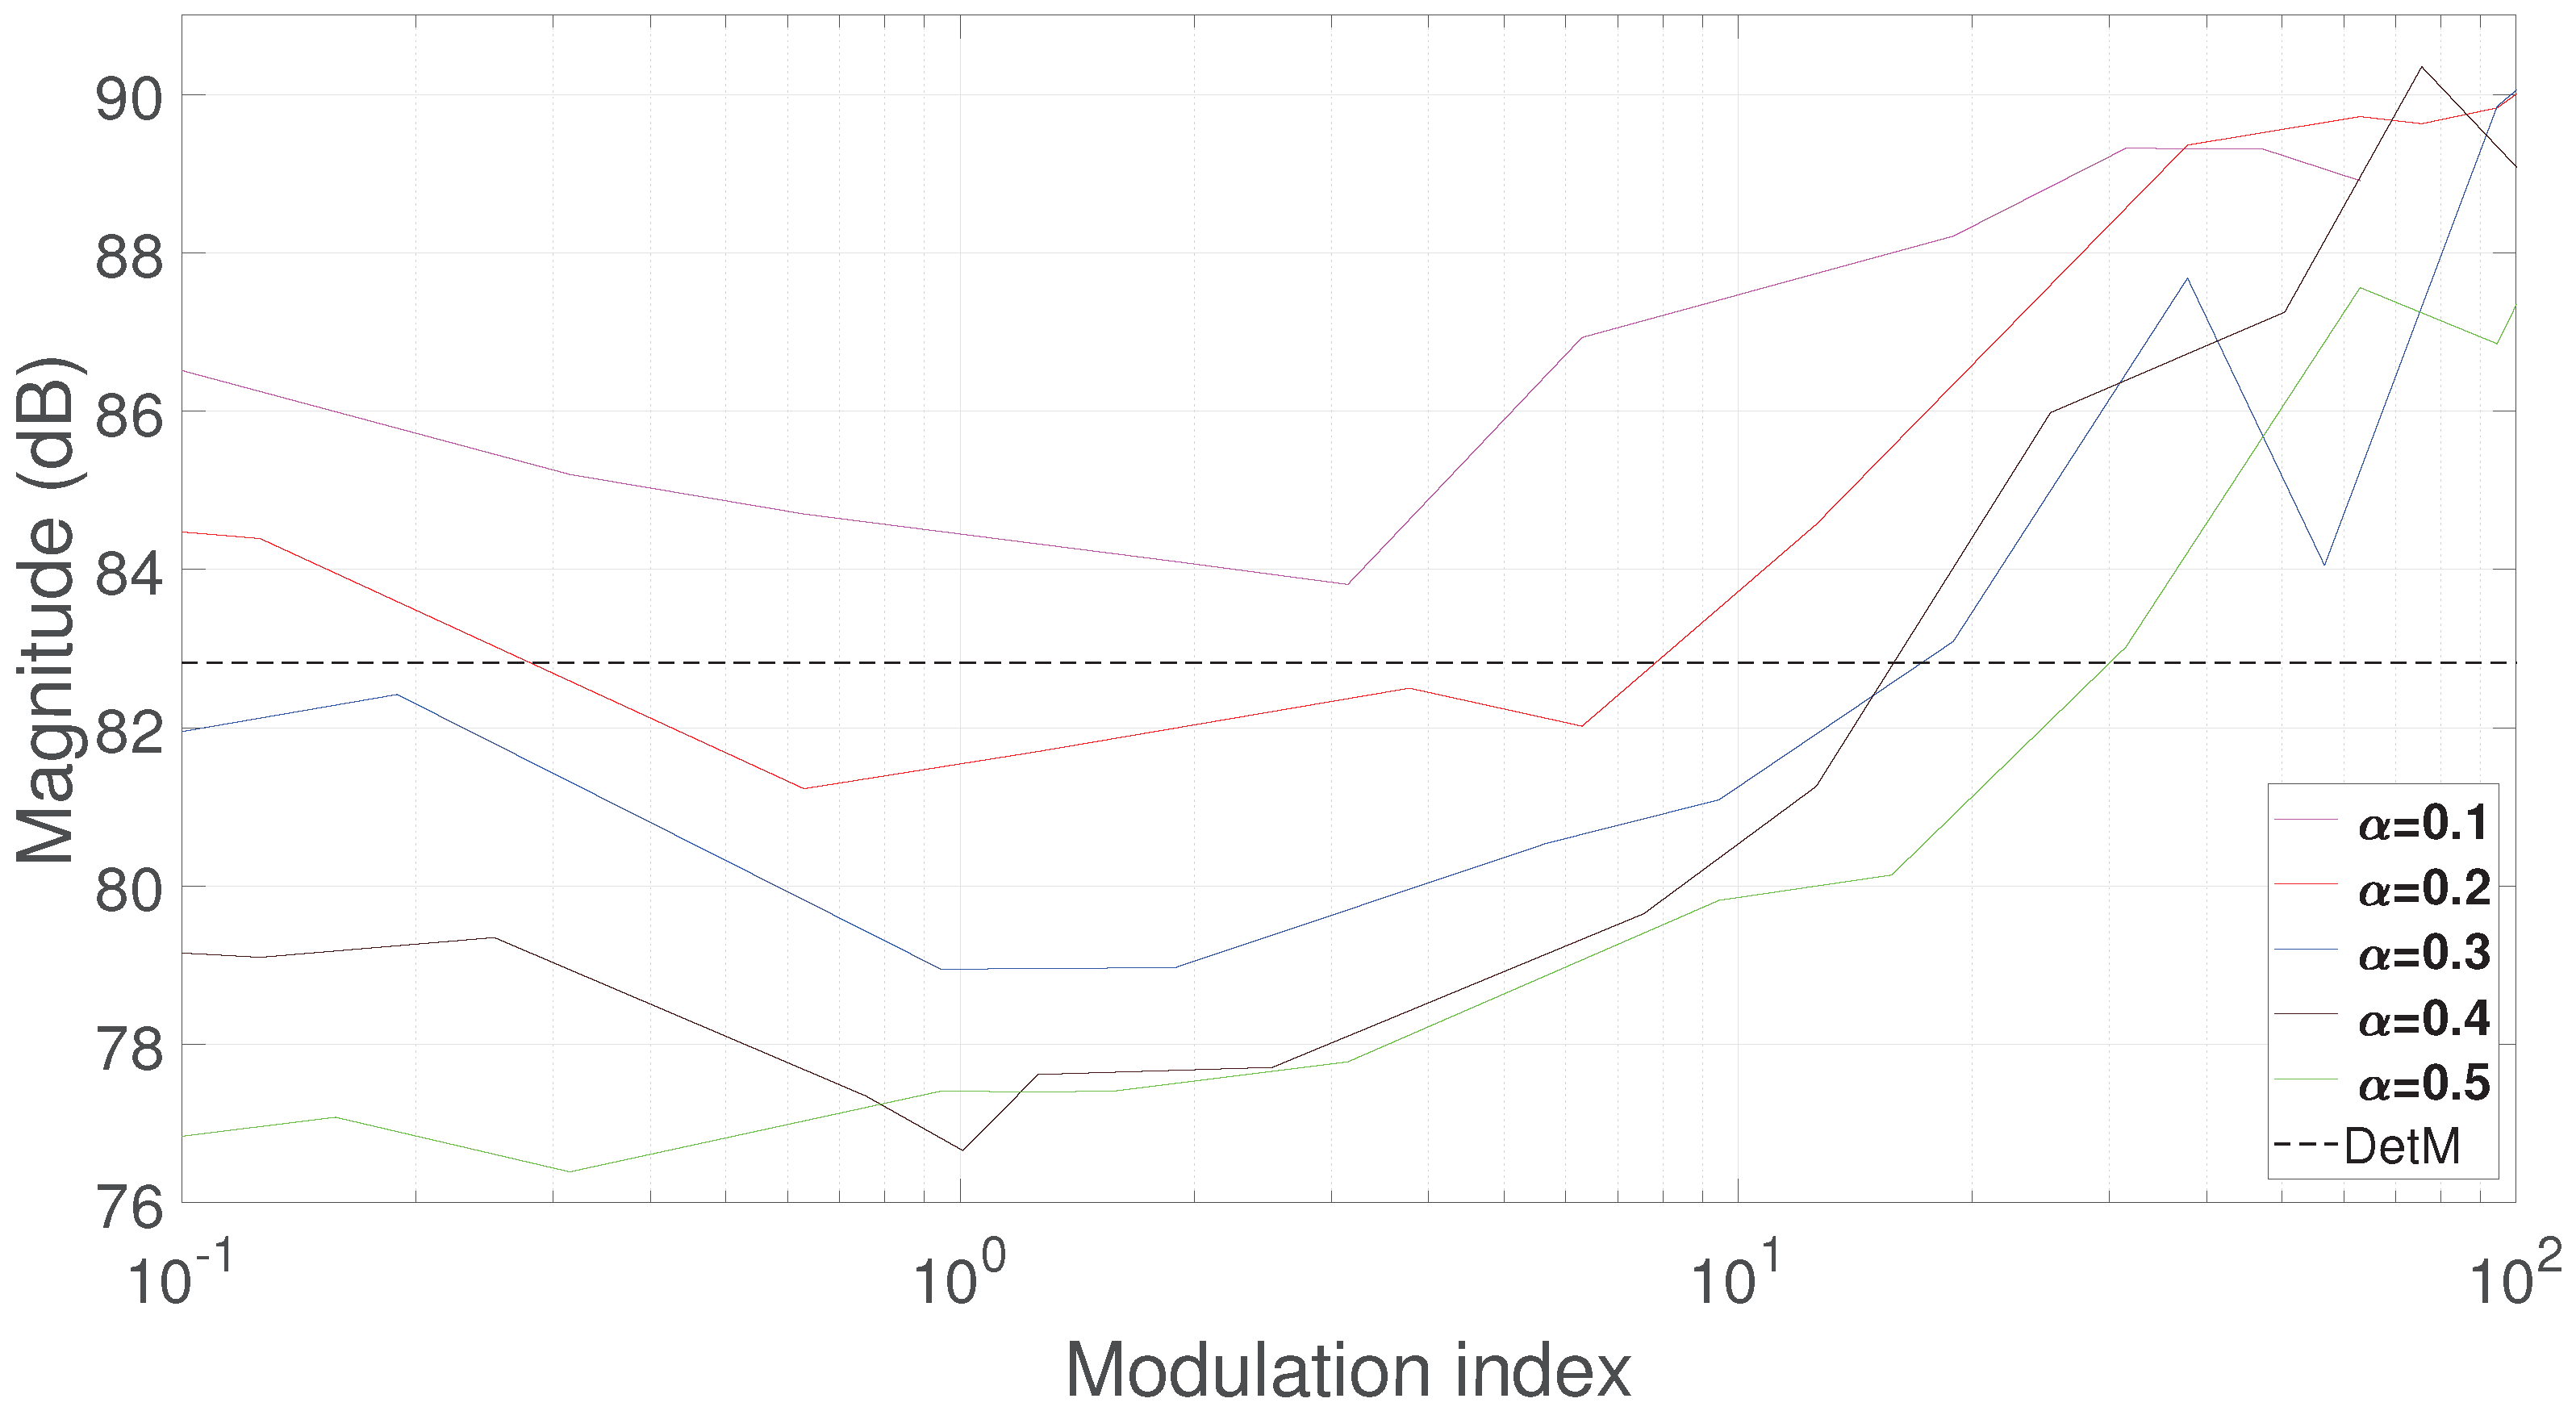
6.6. EMI for Random Modulation
7. Discussion
- The usage of a Random modulating signal starts to generate a considerable degradation of the quality of the PLC communication with a spreading factor bigger than or equal to 30%.
- The minimum value of the FER is zero at all values except = 0.1.
- Very low values of the FER are measured when the modulation index exceeds a value of 50 for values of 0.3, 0.4 and 0.5.
- The maximum FER values obtained for increasing values are examined. It is clearly seen that the FER values increase for all three modulation methods.
- The Random modulation gives the largest FER value.
- In this study, unlike in other studies, three different modulation types used for switching DC-DC converters are emphasised. Again, the effects of the modulation index, spreading factor and sampling frequency of the signal parameters, which were not considered in other studies, on the communication system were examined.
- Thus, depending on how much the EMI decreases in the time domain for each modulation type due to the changing values, the modulation index and, accordingly, the coefficient must be decided, taking into account the residual in the FER.
8. Conclusions
Author Contributions
Funding
Informed Consent Statement
Data Availability Statement
Conflicts of Interest
Abbreviations
| CENELEC | The European Committee for Electrotechnical Standardization |
| CISPR | International Special Committee on Radio Interference |
| DUT | Device Under Test |
| DetM | Deterministic Modulation |
| EMI | Electromagnetic Interference |
| EN | European Norm |
| FDM | Frequency Division Multiplexing |
| FER | Frame Error Rate |
| FPGA | Field Programmable Gate Array |
| LSIN | Line Stabilisation Impedance Network |
| NB | Narrow Band |
| OFDM | Orthogonal Frequency Division Multiplexing |
| PLC | Power Line Communication |
| PRIME | Power-line Related Intelligent Metering Evolution |
| RanM | Random Modulation |
| RCFMD | Random Carrier Frequency Modulation with Fixed Duty cycle |
| RBW | Resolution Bandwidth |
| SiC | Silicon Carbide |
| SNR | Signal-to-Noise Ratio |
| SSM | Spread Spectrum Modulation |
References
- Wibisono, M.A.; Moonen, N.; Leferink, F. Interference of LED Lamps on Narrowband Power Line Communication. In Proceedings of the 2020 IEEE International Symposium on Electromagnetic Compatibility and Signal/Power Integrity (EM-CSI), Reno, NV, USA, 28 July–28 August 2020; pp. 219–221. [Google Scholar]
- Goyal, A. Performance Enhancement of Power Line Communication Using OFDM and CDMA. Master’s Thesis, Department of Electronics and Communication Engineering National Institute of Technology Rourkela, Rourkela, India, 2013. [Google Scholar]
- Routin, J.; ve Brown, C.E.L. Power Line Signaling Electricity Meters. British Patent No. 24833, 12 August 1897. [Google Scholar]
- Loubery, C.R. Einrichtung zur Elektrishen Zeichengebung an Die Theilnehmer Eines Starkstromnetzes. German Patent 118717, 15 March 1901. [Google Scholar]
- Cano, C.; Pittolo, A.; Malone, D.; Lampe, L.; Tonello, A.M.; Dabak, A. State-of-the-art in Power Line Communications: From the Applications to the Medium. IEEE J. Sel. Areas Commun. 2016, 34, 1935–1952. [Google Scholar] [CrossRef]
- Hoch, M. Comparison of PLC G3 and PRIME. In Proceedings of the 2011 IEEE International Symposium on Power Line Communications and Its Applications, Udine, Italy, 3–6 April 2011; pp. 165–169. [Google Scholar]
- Matanza, J.; Alexandres, S.; Rodriguez-Morcillo, C. Performance evaluation of two narrowband PLC systems: PRIME and G3. Comput. Stand. Interfaces 2013, 36, 1. [Google Scholar] [CrossRef]
- Specification for Radio Disturbance and Immunity Measuring Apparatus and Methods—Part 1–1: Radio Disturbance and Immunity Measuring Apparatus Measuring Apparatus; Document CISPR 16-1-1, CISPR; IEC: London, UK, 2019.
- Rönnberg, S.K.; Bollen, M.H.; Amaris, H.; Chang, G.W.; Gu, I.Y.; Kocewiak, Ł.H.; Meyer, J.; Olofsson, M.; Ribeiro, P.F.; Desmet, J. On waveform distortion in the frequency range of 2 kHz–150 kHz—Review and research challenges. Electr. Power Syst. Res. 2017, 150, 1–10. [Google Scholar] [CrossRef]
- Meyer, J.; Khokhlov, V.; Klatt, M.; Blum, J.; Waniek, C.; Wohlfahrt, T.; Myrzik, J. Overview and Classification of Interferences in the Frequency Range 2–150 kHz (Supraharmonics). In Proceedings of the International Symposium on Power Electronics, Electrical Drives, Automation and Motion (SPEEDAM 2018), Amalfi, Italy, 20–22 June 2018; pp. 165–170. [Google Scholar]
- Kumar, D.; Zare, F.; Ghosh, A. DC Microgrid Technology: System Architectures, AC Grid Interfaces, Grounding Schemes, Power Quality, Communication Networks, Applications, and Standardizations Aspects. IEEE Access 2017, 5, 12230–12256. [Google Scholar] [CrossRef]
- Thomas, D. Conducted emissions in distribution systems (1 kHz–1 MHz). IEEE Electromagn. Compat. Mag. 2013, 2, 101–104. [Google Scholar] [CrossRef]
- Mainali, K.; Oruganti, R. Conducted EMI Mitigation Techniques for Switch-Mode Power Converters: A Survey. IEEE Trans. Power Electron. 2010, 25, 2344–2356. [Google Scholar] [CrossRef]
- Deutschmann, B.; Auinger, B.; Winkler, G. Spread spectrum parameter optimization to suppress certain frequency spectral components. In Proceedings of the 2017 11th International Workshop on the Electromagnetic Compatibility of Integrated Circuits (EMCCompo), Saint Petersburg, Russia, 4–8 July 2017; pp. 39–44. [Google Scholar] [CrossRef]
- Pareschi, F.; Rovatti, R.; Setti, G. EMI Reduction via Spread Spectrum in DC/DC Converters: State of the Art, Optimization, and Tradeoffs. IEEE Access 2015, 3, 2857–2874. [Google Scholar] [CrossRef]
- Sayed, W.E.; Crovetti, P.; Moonen, N.; Lezynski, P.; Smolenski, R.; Leferink, F. Electromagnetic Interference of Spread-Spectrum Modulated Power Converters in G3-PLC Power Line Communication Systems. IEEE Lett. Electromagn. Compat. Pract. Appl. 2021, 3, 118–122. [Google Scholar] [CrossRef]
- Sayed, W.E.; Lezynski, P.; Smolenski, R.; Moonen, N.; Crovetti, P.; Thomas, D.W. The effect of EMI generated from spread-spectrum-modulated sic-based buck converter on the G3-Plc channel. Electronics 2021, 10, 1416. [Google Scholar] [CrossRef]
- Sayed, W.E.; Lezynski, P.; Smolenski, R.; Madi, A.; Pazera, M.; Kempski, A. Deterministic Vs. random modulated interference on G3 power line communication. Energies 2021, 14, 3257. [Google Scholar] [CrossRef]
- G3-PLC User Guidelines. Available online: https://g3-plc.com/g3-plc/specifications-user-guidelines/ (accessed on 25 October 2021).
- Berger, L.A.; Schwager, A.; Garzas, J.J.E. Power line communications for smart grid applications. J. Electr. Comput. Eng. 2013, 2013, 712376. [Google Scholar] [CrossRef]
- Available online: https://ww1.microchip.com/downloads/en/DeviceDoc/PL360-EK-User-Guide-DS50002730B.pdf (accessed on 20 May 2023).
- Nee, R.V.; Prasad, R. OFDM for Wireless Multimedia Communications; Artech House: Norwood, MA, USA, 2000. [Google Scholar]
- Li, Y.; Winters, J.; Sollenberger, N. MIMO-OFDM for wireless communications: Signal detection with enhanced channel estimation. IEEE Trans. Commun. 2002, 50, 1471–1477. [Google Scholar] [CrossRef]
- Cimini, L.J. Analysis and Simulation of Digital Mobile Channel Using Orthogonal Frequency Division Multiplexing. IEEE Trans. Commun. 1994, 42, 2908–2914. [Google Scholar] [CrossRef]
- Balcells, J.; Santolaria, A.; Orlandi, A.; Gonzalez, D.; Gago, J. EMI reduction in switched power converters using frequency Modulation techniques. IEEE Trans. Electromagn. Compat. 2005, 47, 569–576. [Google Scholar] [CrossRef]
- Pena-Quintal, A.; Sayed, W.E.; Sumner, M.; Ercan, S.U.; Greedy, S.; Thomas, D.; Smolenski, R. On Spread Spectrum for DC Grids: Low-Frequency Conducted EMI Mitigation and Signal Integrity Disruption in Serial Communication Links. IEEE Trans. Electromagn. Compat. 2023, 1–10. [Google Scholar] [CrossRef]
- Hermes, L.; Lezynski, P.; Smolenski, R.; Nascimento, D.; Sleszynski, W. FPGA-Based System for Electromagnetic Interference Evaluation in Random Modulated DC/DC Converters. Energies 2020, 13, 2389. [Google Scholar] [CrossRef]
- Sudhakar, N.; Rajasekar, N.; Shanmuga Sundari, A. FPGA based Chaotic PWM combined with soft switching for effective EMI mitigation in boost converter. In Proceedings of the 2016 International Conference on Energy Efficient Technologies for Sustainability (ICEETS), Nagercoil, India, 7–8 April 2016; pp. 148–152. [Google Scholar] [CrossRef]
- Marsala, G.; Ragusa, A. Chaos PWM for EMI reduction in a high boost DC-DC converter with coupled inductors. In Proceedings of the 2017 IEEE 5th International Symposium on Electromagnetic Compatibility (EMC-Beijing), Beijing, China, 28–31 October 2017; pp. 1–6. [Google Scholar] [CrossRef]
- Pena-Quintal, A.; Loschi, H.; Smolenski, R.; Sumner, M.; Thomas, D.; Greedy, S.; Lezynski, P.; Leferink, F. Impact of Pseudo-Random Modulation on Measured Conducted EMI. IEEE Electromagn. Compat. Mag. 2022, 11, 84–92. [Google Scholar] [CrossRef]


| Parameter | G3-PLC Standart | Frequency |
|---|---|---|
| EUROPEAN | CENELEC | 3–148.5 kHz |
| ABD | FEC | 10–490 kHz |
| JAPAN | ARIB | 10–450 kHz |
| CENELEC Frequency Band | Frequency Range |
|---|---|
| Band A | 9–95 kHz |
| Band B | 95–125 kHz |
| Band C | 125–140 kHz |
| Band D | 140–148.5 kHz |
| Parameter | G3-PLC |
|---|---|
| Type of Modulation | OFDM |
| Sampling Frequency | 400 kHz |
| Number of FFT Points | 256 |
| Max. Data Rate | 33.4 kbps |
| First Frequency | 35.9 kHz |
| Last Frequency | 90.6 kHz |
| Number of Cyclic Prefix Samples | 30 |
| Sub-Carrier Spacing | 1.5625 |
| Parameter | Value |
|---|---|
| Frequency Range | 9–150 kHz |
| IF Bandwidth | 200 Hz |
| Dwell Time | 100 ms |
| Sine | Sine | Sawtooth | Sawtooth | Random | Random | |
|---|---|---|---|---|---|---|
| min FER | max FER | min FER | max FER | min FER | max FER | |
| 0.1 | 0.0026% | 0.28% | 0.05% | 0.2% | 0.06% | 0.43% |
| 0.2 | 0% | 11% | 0% | 16.2% | 0% | 8.4% |
| 0.3 | 0% | 7.1% | 0% | 5.6% | 0% | 34.7% |
| 0.4 | 0% | 5.6% | 0% | 13% | 0% | 42.8% |
| 0.5 | 0% | 18% | 0% | 33.1% | 0% | 55.1% |
Disclaimer/Publisher’s Note: The statements, opinions and data contained in all publications are solely those of the individual author(s) and contributor(s) and not of MDPI and/or the editor(s). MDPI and/or the editor(s) disclaim responsibility for any injury to people or property resulting from any ideas, methods, instructions or products referred to in the content. |
© 2023 by the authors. Licensee MDPI, Basel, Switzerland. This article is an open access article distributed under the terms and conditions of the Creative Commons Attribution (CC BY) license (https://creativecommons.org/licenses/by/4.0/).
Share and Cite
Ustun Ercan, S.; Pena-Quintal, A.; Thomas, D. The Effect of Spread Spectrum Modulation on Power Line Communications. Energies 2023, 16, 5197. https://doi.org/10.3390/en16135197
Ustun Ercan S, Pena-Quintal A, Thomas D. The Effect of Spread Spectrum Modulation on Power Line Communications. Energies. 2023; 16(13):5197. https://doi.org/10.3390/en16135197
Chicago/Turabian StyleUstun Ercan, Seda, Angel Pena-Quintal, and Dave Thomas. 2023. "The Effect of Spread Spectrum Modulation on Power Line Communications" Energies 16, no. 13: 5197. https://doi.org/10.3390/en16135197
APA StyleUstun Ercan, S., Pena-Quintal, A., & Thomas, D. (2023). The Effect of Spread Spectrum Modulation on Power Line Communications. Energies, 16(13), 5197. https://doi.org/10.3390/en16135197