Abstract
To explore and optimize the process of hydrogen production from plasma-assisted ammonia-cracking, a tubular ammonia-cracking on-site hydrogen production device with plasma-assisted ammonia combustion flue gas as the heat source was developed. Using the Temkin–Pyzhev kinetic model and the local thermal equilibrium (LTE) hypothesis, the effects of operating conditions, such as combustion flue gas temperature and ammonia flow rates, on ammonia-cracking efficiency were investigated. The numerical results are quantitatively consistent with the experiment. Ammonia cracking efficiency is notably influenced by the initial combustion gas temperature. When the gas velocity of the cracking system is less than or equal to 0.03 m/s, the cracking rate increases by 63% when the inlet temperature of the heat pipe changes from 700 K to 800 K. The cracking rate of ammonia decreased with the increase of ammonia flow rate, and this trend reached the maximum and began to weaken when the flow rate was 0.3 m/s. Longer catalyst bed length does not always mean higher cracking efficiency; the length of the cracking tube over 0.6 m shows little effect on cracking efficiency. Response surface methodology was used to conduct multi-factor analysis of the three main factors affecting the cracking rate of the cracker, namely, the temperature of the heating tube, the flow rate of flue gas in the heating process, and the inlet flow rate of the catalytic bed. It was found that the flow rate of the catalytic bed was the most significant factor affecting the cracking rate, which could be used as the main control method. The numerical results would provide technical guidance for industrial applications of on-site hydrogen production devices from ammonia decomposition.
1. Introduction
Hydrogen is considered one of the ideal clean energy resources due to its high calorific value, having only H2O as a combustion product, fast flame propagation, and high energy density. However, whether it is liquid hydrogen storage at low temperature (−253 °C) or gaseous hydrogen storage at high pressure (~70 MPa), there are stringent requirements for the pressure or temperature resistance of storage vessels [1,2,3,4]. The safety and economy of storage and transportation process need to be improved. Ammonia (NH3) is an important chemical product and has important applications in agriculture and industry. The synthetic ammonia produced from renewable energy such as wind and solar is considered a promising new green energy and an ideal hydrogen storage source [5,6,7,8,9]. Ammonia is also a new zero-carbon fuel with high octane number, high hydrogen storage density, and high energy density. Pure ammonia fuel requires high ignition energy when burning, and its flame propagation speed (~10 cm/s) and combustion temperature are much lower than that of methane and hydrogen [4]. For the use of ammonia fuel in the combustion process, the ignition energy can be reduced by partially decomposing ammonia into hydrogen to improve its combustion characteristic in combustors and reduce exhaust NOx emissions. The need to develop small-scale, efficient, and low-delay ammonia fuel pyrolysis equipment is urgent. In many application scenarios where hydrogen is used as reducing agent and other chemical raw materials, online hydrogen production from easily stored and transported ammonia is also a competitive hydrogen supply technology route.
The methods of ammonia decomposition to produce hydrogen can be roughly divided into electrothermal pyrolysis, combustion pyrolysis, plasma direct ammonia pyrolysis, and electrocatalytic ammonia oxidation decomposition [1,6,10,11,12]. Due to the endothermic reaction and hindrance of reaction kinetics during ammonia decomposition, high temperatures above 773 °C, depending on the catalyst, are required for complete conversion [13]. Because of the high-energy electrons it generate and the large number of active substances that promote the chemical process of ammonia decomposition, plasma technology is a promising instantaneous (<μs) ammonia decomposition technology [14]. However, its high energy consumption, the lifespan of plasma electrodes, and the stability of special applications still need to be improved. The theoretical energy consumption of ammonia electrolysis is 2.79 kJ/mol∙H2, which also has good decomposition performance at low voltage. However, the unstable performance of electrocatalysts and requisite large noble metal loads seriously hinder the wide application of electrocatalytic ammonia decomposition technology [15]. Ammonia pyrolysis technology is the most mature ammonia pyrolysis scheme in industry. The industrial ammonia pyrolysis reactor includes a packed bed reactor, microchannel reactor, and membrane reactor [16,17]. The heat sources for the reactor are mainly electric heating and natural gas combustion heat pipes [3]. However, electric heating equipment generally involves high power consumption and large energy losses, while natural gas combustion heat pipes need another complete gas supply and combustion tail gas contains large amounts of CO2, which hinders the clean utilization of on-site hydrogen production equipment and ammonia energy. If ammonia combustion assisted by low-temperature plasma to provide a heat source for the ammonia pyrolysis reaction is used, the consumption of electric energy will be greatly reduced and no CO2 will be emitted during the combustion and pyrolysis process [18]. This technology provides a new direction and candidate for online hydrogen generation based on ammonia pyrolysis. Experimental kinetic modeling studies on ammonia decomposition have also gathered much attention. Chein et al. were the first to apply computational fluid dynamics (CFD) modeling to NH3 catalytic decomposition with a packed (Ni Pt/Al2O3) catalytic bed [19]. Chein et al. only studied the corresponding working conditions when ammonia can be completely cracked. A simple chemical reaction model was established based on the experimental data from the catalyst. The theoretical results of NH3 decomposition show that the decomposition reaction of NH3 is very similar to the chemical model of the methanol-reforming reaction. Andrea et al. studied the ammonia decomposition process of hydrogen production in a small-scale membrane reactor with a Ni/Al2O3 catalyst via numerical simulation [20]. The maximum ammonia flow rate is only 2 cm/s.
Current studies and simulation calculations mainly concentrate on low-flow reactors, micro-reactors, and membrane reactors as well as reactors with rare metal elements. Numerical studies on ammonia reforming using high-temperature flue gas heating in a large-scale reactor have not been recently conducted. However, for ammonia crackers in ammonia-fuel power plants, partial cracking, fast response, and simple and reliable design are required. To this end, we have designed and improved a new ammonia cracker using plasma-assisted ammonia combustion as the heat source. At the same time, in order to optimize cracking efficiency and further explore its operating mechanism, we established a three-dimensional CFD model of the cracking reactor based on the local heat balance assumptions. The effects of internal temperature field, the influence of flow boundary and temperature boundary, and the size of the cracking reactor on the performance of ammonia-cracking were studied.
2. Experimental Platform and Ammonia Cracker
The ammonia-cracking experimental platform is shown in Figure 1a. Cracked ammonia gas is vaporized from liquid ammonia via a water bath heating device, and the combustion ammonia gas for the heating pipe is generated via a compressed ammonia gas bottle. Compressed air can be selected to supply oxygen for combustion. Each gas path is equipped with a pressure-regulating valve and a mass flow controller (mass flow controller: MFC, model: Seven Star Huachuang, Beijing, China, d07-9e, d07-9em). The sliding arc plasma source is powered by a high-voltage power supply (model: Fang Ben Technology, Heifei, China, 15 kv1500 w-7). The cracked ammonia hydrogen mixture is cooled in a pipeline and then partially connected to an NK-205-series ammonia decomposition tester. The high-voltage power supply, MFC, and ammonia decomposition tester in the device are connected to a Crio-9047 controller and connected to the LabVIEW program on the upper computer for real-time acquisition and control. On the ammonia-cracking platform, the plasma-assisted ammonia combustion system provides heat for ammonia thermal cracking. In the experiment, the plasma power supply is maintained at 600 W. The high-temperature gas from ammonia combustion flows into the cracker-heating pipe at a flow rate of approximately 48 SLM. Following ammonia pyrolysis, the mixture is cooled and then passed to a storage tank. The flow rate of ammonia inlet under MFC control is 50–120 SLM, and the temperature of ammonia gas heated by the water bath is approximately 350 K. The geometric model of the cracker is shown in Figure 1b. The cracker system consists of a central pipe and a double-layer outer sleeve, which are the combustion chamber and ammonia-cracking reaction chamber, respectively. The central pipe is isolated from the double-layer outer sleeve. The plasma-assisted ammonia burner is positioned at one side of the central pipe to provide heat to the outer pyrolysis reaction chamber. The heat exchange fins are arranged inside the outer sleeve and welded to the central pipe, which is beneficial to the heat transfer response of combustion in the central pipe. The outer pyrolysis reaction chamber is filled with ammonia decomposition catalyst (nickel-based alumina support) with a certain porosity. Ammonia gas enters the end of the combustion chamber in the central tube after the central tube and catalyst are heated to high temperature. The pyrolysis ammonia gas flow is directed opposite to the heat flow to increase heat exchange efficiency. Table 1 shows the geometric parameters of the model.
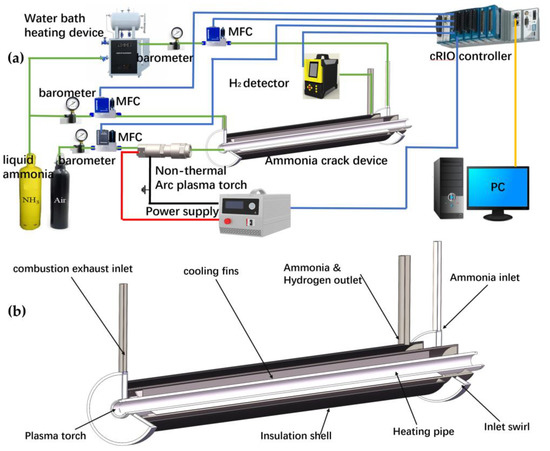
Figure 1.
(a) Ammonia cracker experimental platform, (b) Geometric model of ammonia cracker.

Table 1.
Reactor Size and Catalytic Bed Physical Properties.
3. Mathematical model
3.1. Chemical Reaction Model
When ammonia gas is introduced, a decomposition reaction occurs on a porous catalyst bed:
The decomposition of ammonia on metals is an endothermic reaction. The ammonia numerator adsorbed on the surface of the active metal is gradually dehydrogenated after being heated; then two N (ad) and two H (ad) atoms combine to form N2 and H2, respectively [12,21,22,23]. The decomposition reaction rate of ammonia gas can be described using a power-law model as follows:
In the formula, a and b are the reaction orders of NH3 and H2, respectively. When using Ni-based and Ru-based catalysts, the value of b is negative for both. This indicates that the H2 concentration seriously affected the decomposition rate of NH3. The power-law model here could be used to investigate the effects of the different operation variables on the reactions. However, it is inconvenient to detail the Ru or Ni size effects because both always vary simultaneously [1]. The Temkin–Pyzhev kinetic model, which assumes that the desorption of N(AD) is the rate determining step for NH3 decomposition, is widely accepted by researchers. Its rate equation is described as follows:
where K0 and Ea refer to the prefactor and activation energy, respectively. Keq represents the equilibrium constant of the reaction (according to experimental data from Jian Zhang [22], the value of Keq approximately equals 0.03). Its inverse reaction rate can be ignored in practical experiments. The first term in parentheses is the decomposition rate of NH3, and the second represents the synthesis rate of NH3. The Temkin–Pyzhev kinetic model can be simplified as:
The porous catalytic bed of the ammonia cracker uses Al2O3 as the reaction bed substrate, which is prepared via coprecipitation, and its surface is coated with Ni particles with an average grain size of 4.0 nm and a number of Ni atoms per gram of catalyst surface of 4.4 × 10²⁰. The atomic ratio of Ni and Al is 1.2, and the prefactor K0 is 0.788 × 10⁶ with a reaction activation energy Ea of 95.6 kJ/mol. The decomposition reaction index β is 0.209.
3.2. Heat and Mass Transfer Equation
3.2.1. Heat and Mass Transfer in Porous Media
The fluid flow of gas reactive species across a porous catalyst bed is described by Darcy’s law:
where indicate gas density, gas viscosity, the permeability of the porous-medium catalyst, and the pressure in the catalyst bed, respectively. A local thermal equilibrium (LTE) is used inside the porous-medium Al2O3 catalytic bed for the conditional assumption within the porous medium. Its physical field control equation is shown below:
where Tsr, Q and U (SI unit: m/s) in the equation are the local temperature in the reaction bed, the heat source, and the fluid velocity, respectively. Kf and Kpc represent the thermal conductivity of the fluid and that of the porous catalyst, respectively. ε is the volume fraction of the fluid, and the effective thermal conductivity of the reaction bed keff can be expressed as:
The effective heat capacity of the porous catalyst bed can be expressed as:
The heat source Q generated by the reaction is:
Hj and rj are the reaction enthalpy and the reaction rate, respectively. The decomposition of NH3 on metal is an endothermic reaction with a reaction enthalpy of 46.22 kJ/mol. The mass balance equations for the model are the Maxwell Stefan diffusion and convection equations:
In the above equation, ρ represents the density, ωi is the mass fraction of substance i, xk is the mole fraction of substance k, is the ik component of the effective multicomponent Ficoll diffusivity. represents the effective generalized thermal diffusion coefficient. T and Ri are temperature and reaction rate, respectively.
3.2.2. Heat and Mass Transfer in Heating Tubes
The heating source used for the experiments consists of a sliding arc plasma torch, ammonia and air supply equipment, and an intermediate pipe for combustion exhaust gas transmission with an average flow rate of 0.67 m/s. The high-temperature flue gas generated via ammonia combustion propagates inside the tube and heats the dissipating fins and the reaction bed. The heated gas in the tube is described by the steady-state weakly compressible Navier–Stokes equation [20]:
where ρ, u, μ and p represents the gas density, the gas velocity, the kinetic viscosity of the gas, and the intratubular pressure of the tube.
The energy transfer in the heated tube can then be described as:
Kht represents the thermal conductivity of the heated gas.
3.3. Physical Parameters and Boundary Conditions
The sizing parameters for the ammonia cracker have been given in Table 1. The solubility parameters [24] including permeability for the cracker are given by Table 2.
Table 2.
Physical parameters of ammonia cracker.
For a simple yet feasible way to examine the ammonia decomposition process and improve operational performance, this paper uses high-temperature hot gas flow instead of the plasma-assisted ammonia combustion process to provide heat for the cracker. The mathematical model is partially simplified as follows:
- The heated inner tube forms a fully developed flow of high-temperature flue gas, which flows in the opposite direction of the cracked ammonia gas, at a flow rate of approximately 0.67 m/s.
- The pressure at the outlet of the heat pipe and catalytic pipe is atmospheric pressure, and the heat of the shell mainly dissipates via natural convection.
- The gas flow in the reaction zone is single-phase and incompressible.
- The flow of ammonia and pyrolysis gas at the outlet and inlet does not affect the structure and configuration of the porous-medium catalyst bed.
The boundary conditions considered in the present numerical model, including the mass transfer, heat transfer, fluid flow, and chemical reaction rate control equations, are summarized in Table 3:
Table 3.
Boundary conditions of heat and mass transfer equation.
Because the accuracy of the numerical solution largely depends on the size of the mesh, it is necessary to refine the mesh in the region with obvious dependent variable gradient. A finer grid is used to capture the subtle changes in velocity, temperature, and species concentration near the wall. Before reporting the results, a detailed verification of grid independence is carried out. Numerical results show that when the number of elements exceeds 30,000, the solution is mesh-independent. Therefore, the results given in this study are 50,000 elements. Based on the hydrogen concentration gathered from the H2 concentration analyzer in the experiment, the ammonia-cracking rate can be calculated via the following formula.
, , represent the amount of cracked ammonia gas, introduced ammonia gas, and the mass fraction of ammonia at the end of the reactor, respectively. The mass fractions of reactant components at the end of the reactor are calculated via numerical simulation results. The evaluation indexes of the cracker cracking rate in numerical calculation are as follows:
4. Results and Discussion
4.1. Model Validation and Analysis
In order to verify the reliability of the numerical model, the efficiency curve of ammonia-cracking rate as a function of ammonia flow rate on the reaction bed was compared with the results from the experimental platform. The experimental test data are marked with red triangles in Figure 2a, and the black curve is the results from numerical simulation. The maximum error between the simulation and the experiment results is approximately 10.4% at a low ammonia gas flow rate of approximately 0.45 m/s, and the rest are within 5%. The largest error may be due to insufficient mixing of cracking tail gas and errors generated by the ammonia decomposer. Considering the existence of certain errors and deviations in the experimental device itself, it could be the case that the numerical model established in this paper for ammonia-cracking has a certain unreliability in simulating the ammonia-cracking process.
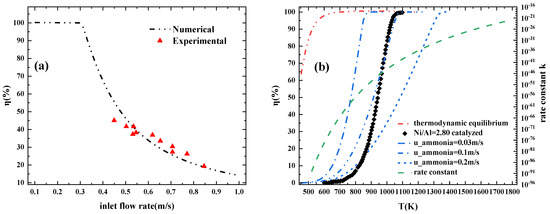
Figure 2.
Comparison of the pyrolysis rate curve of the model with (a) our experimental data and (b) experimental and numerical data from published paper; change of rate constant with temperature (u_ammonia refers to the inlet flow rate of ammonia gas; on the right is the axis of the rate constant).
Figure 2b compares the simulation results of the model presented in this paper with previous studies, including experimental data and numerical simulations. Using a catalyst with a nickel–aluminum atomic ratio of 2.8 [19,25], the theoretical limit of the NH3 decomposition rate based on thermodynamic equilibrium is the red dotted line. The theoretical limit of thermodynamic equilibrium shows that a cracking rate greater than 50% can be achieved at a reaction temperature lower than 500 K. Sorensen et al. reported that using Ru as a catalyst and cesium (Cs) as a promoter, high NH3 decomposition efficiency can be achieved at a reaction temperature of approximately 500 K [26]. The green curve describes the change trend of the rate constant with the reaction temperature; as shown in the Formula (6), the ammonia decomposition rate under the same pressure is directly proportional to the rate constant. The blue dot line describes the simulation results from the model presented in this paper. When the ammonia flow rate is 0.03 m/s, the cracker shows a temperature sensitivity similar to that of the catalytic experiment. In the range of 700–800 K, the cracking rate varies with temperature and the change trend of is almost a vertical curve. The difference in cracking rate corresponding to temperature may be attributed to the use of different catalysts. Ammonia cracking sensitivity to temperature weakens with the increase of the ammonia flow rate, which is because the residence time of ammonia in the cracking tube becomes shorter, resulting in an inefficient heat exchange with the heating tube. When we compare the simulation results with the experimental results, our error is small. In addition, the results of the comparison with the research show a similar trend, which proves that this simulation model has certain reliability.
Figure 3a compares the cracking rates of the cracker with and without reciprocating heating. The trend of cracking rate curves for both non-reciprocating heated crackers and reciprocating heated crackers is similar. With the increase to ammonia flow rate, the cracking rate decreases rapidly and then slows down gradually. Figure 3b,c describe the temperature distribution inside a catalytic bed without reciprocating heating and with reciprocating heating. Without reciprocating heating, the temperature of ammonia rises slowly and the time spent in the high temperature area is shorter. With the addition of a reciprocating heating pyrolyzer, the reaction temperature is reached in the area 0.1 m away from the inlet. The high temperature zone has a longer journey and better pyrolysis efficiency.
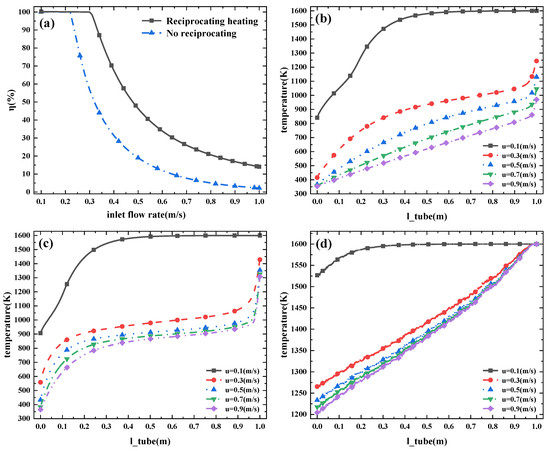
Figure 3.
(a) η at reciprocating and non-reciprocating heating. (b) Temperature of the cracker ports with no reciprocating heating and (c) temperature of the cracker ports with reciprocating heating. (d) Temperature of the heating pipe (reciprocating heating) (u refers to different inlet ammonia flow rates).
Figure 3d is the variation trend of the internal temperature of the heating pipe with the distance from the cracker port. When the ammonia flow rate is greater than 0.3 m/s, the temperature of the heat pipe decreases from 1600 K at the inlet to 1200 K. When the ammonia flow rate is 0.1 m/s, the ammonia is completely decomposed and the temperature at the end of the heating tube is 1520 K. With the increase in ammonia flow rate, the temperature of the heating tube changes more slowly. It can be inferred that the heat flow of the heating tube to the catalytic bed is similar for the input of ammonia with large flow rate. Given the simulation results shown in Figure 4, an inappropriate length of ammonia cracker is not conducive to efficient ammonia-cracking.
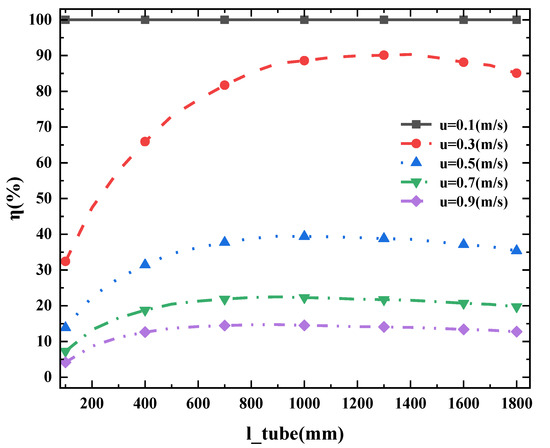
Figure 4.
η with different pipe lengths (length refers to different catalytic bed lengths, u refers to different inlet ammonia flow rates).
As for the temperature field of the reactor bed changing with the axial distance, when the flow rate of ammonia is small enough, ammonia can be completely decomposed. Therefore, there is no reaction heat absorption after the complete reaction of ammonia in a short axial distance. The temperature of the catalytic bed increases with the axial distance and tends to stabilize gradually (1550 K). When the ammonia flow rate is larger than 0.3 m/s, ammonia undergoes two stages of temperature rise, which are at the inlet and the tail end. The temperature rise at the inlet is due to the heat exchange between the low-temperature ammonia and the tail gas in the hot pipe. The temperature difference is large, which results in high heat exchange efficiency. The rise slope of the catalytic bed temperature is steep. The temperature rises at the tail end since the reaction gas needs to be returned to the catalytic bed for reciprocating heating. There is a longer residence time and more efficient heat exchange in the high-temperature area at the inlet of the heating tube. For the catalytic bed area with an axial distance of 0.3 m–0.8 m, the temperature rises slowly and smoothly because of the heat input from both reciprocating heating tube and inner tube. The heat absorption from the ammonia-cracking reaction coexists simultaneously, which results in the temperature decline. It is worth noting that the pyrolysis tube temperature is an important indicator of the performance of the cracker because ammonia is supposed to have a longer residence time at the appropriate temperature scale, which can greatly improve the pyrolysis efficiency of the cracker.
Figure 4 shows the effect of inlet gas flow rate on cracking efficiency with the different lengths of catalytic bed ranging from 0.3 m to 1.8 m under the conditions of porosity 0.7, ammonia inlet temperature 350 K, and flue gas temperature 1600 K in the heating tube. With the tube length ranging from 0.7 m to 1.8 m, the cracking efficiency of the cracker varies slightly with the maximum deviation remaining within 5%. However, an obvious decrease in the cracking efficiency of the cracker occurs when the tube length decreases to 0.3 m. It is worth mentioning that cracking efficiency increases when the tube length increases from 0.3 m to 1.2 m but slightly decreases when the tube length increases from 1.2 m to 1.8 m. It may because the tube length, as an important indicator of cracker structure, has a composite effect on the performance of the ammonia cracker. A longer pipe length increases the reaction time of ammonia in the catalytic bed. However, it also increases the heating volume of the catalytic bed and reduces the temperature of the catalytic bed, which may result in the decrease of efficient heating section, especially in the design of the counter-flow heating tube. It is noteworthy that when the flow rate of ammonia is greater than 0.67 m/s, the 0.6 m length of pipe and the 1 m length of pipe correspond to almost similar ammonia-cracking efficiency. In industrial production, the length of pipe could be suggested to be approximately 0.7 m.
As shown in Figure 4, when the catalytic bed length of the cracker is 1 m–1.5 m, the system maintains the highest cracking rate. Therefore, as shown in Table 1, the catalytic bed length of the cracker is designed to be 1 m.
In this section, the reliability of the model has been verified, and the reasons for reciprocating heat exchange and dimensional design have also been explained. In the next section, we will further explore the effects of ammonia inlet temperature, flue gas temperature in the heating pipe, and ammonia flow rate on the cracking rate.
4.2. Effect of Thermal Field and Flow Field Boundary on Cracking Rate
The effects of different reaction conditions and physical parameters on the hydrogen production process from ammonia gas cracking were further investigated. The heating pipe is the main heat source for the device, and the flue gas temperature at the inlet ranges from 600 to 1800 K. The gas component at the inlet of the porous catalytic bed is high-purity ammonia gas, with an inlet velocity u ranging from 0.1 to 1 m/s and a reaction gas inlet temperature ranging from 300 to 700 K. The porosity of Ni/Al2O3 catalyst ε ranges from 0.1 to 0.9.
Figure 5 shows the variation trend of ammonia decomposition rate with ammonia flow rates in a counter-flow reactor at different heat pipe temperatures of 1400 K, 1600 K and 1800 K. The inset figure at the top right of Figure 3a is the one-dimensional derivative of the variation curve. The trend of the pyrolysis rate at different temperatures is very close to that of the ammonia flow rate. The magnitude of the decrease rate shown in the inset of Figure 5 dramatically increases first and then decreases to near zero because the increase in ammonia flow rate increases convection heat exchange efficiency between the ammonia and the catalytic bed but decreases the reaction time.
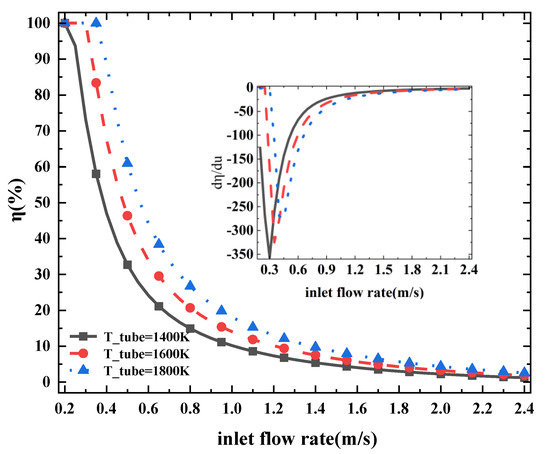
Figure 5.
Ammonia-cracking efficiency η at different ammonia inlet flow rates (u refers to different inlet ammonia flow rates). Three curves with different colors represent different temperatures while the graph inside is the slope of the curve.
Under the three heat pipe temperature conditions, the cracking rate difference at the same flow rate decreases with the increase of ammonia flow rate. When the ammonia flow rate is approximately 1 m/s, the temperature difference of 200 K has approximately 5% difference in ammonia-cracking rate. At a flow rate of 0.5 m/s, the cracking rate gap exceeds 10%. The influence of the ammonia-cracking rate decreases with the increasing flow rate. When ammonia flow rate exceeds 1.2 m/s, the temperature difference of 200 K makes less than 3% difference in cracking rate of the cracker. It is noteworthy that the curve of the ammonia-cracking rate is the steepest and reaches the inflection point fastest when the temperature of the middle heating pipe is 1400 K. In industrial production, if a mixture with a certain concentration of hydrogen needs to be proportioned, the economic benefit of increasing temperature is lower. It is more economical to consider reducing the flow rate of ammonia gas and producing high-purity hydrogen rather than mixing it with a certain amount of ammonia gas.
Figure 6 shows different ammonia-cracking rates corresponding to different heating tube flow rates under different ammonia flow rates ranging from 0.1 m/s to 0.9 m/s. The ammonia-cracking rate increases with the combustion gas flow rate in the heat pipe because higher flow rate in the heating pipe corresponds to higher heat exchange efficiency. The ammonia in the cracking pipe can be heated to a higher temperature, which corresponds to a more adequate reaction degree. It is worth noting that when the flow rate of the heating pipe is low, the rising rate is higher. For example, when the combustion gas flow rate increases from 0.25 m/s to 0.5 m/s, the ammonia-cracking rate varies from 20% to 30%, while when the flow rate rises to 0.75 m/s, the cracking rate only rises by 5%.
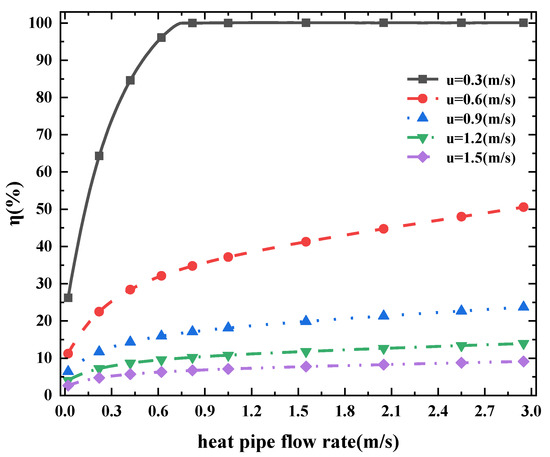
Figure 6.
Ammonia-cracking efficiency η at different heating tube flow rates (u refers to different inlet ammonia flow rates).
Another notable phenomenon is that the increase in the heating pipe flow rate is more sensitive at the low ammonia flow rate. Under the conditions of ammonia gas flow rate 0.1 m/s and 0.3 m/s shown in Figure 6, the increase of cracking rate is more obvious. This is because ammonia has a longer reaction time and is used in smaller amounts at lower flow rate, which are more predominant factors involved in ammonia-cracking.
Figure 7 shows the change trend in cracking rate corresponding to the inlet temperature of high-temperature flue gas under different ammonia flow rates. With an increase of flue gas temperature, the cracking efficiency will increase. However, with the increase in flow rate, the increase rate of pyrolysis efficiency gradually decreased. This is because the residence time of ammonia in the cracking chamber becomes shorter, it cannot be fully heated, and the sensitivity of the device to the flue gas temperature also decreases.
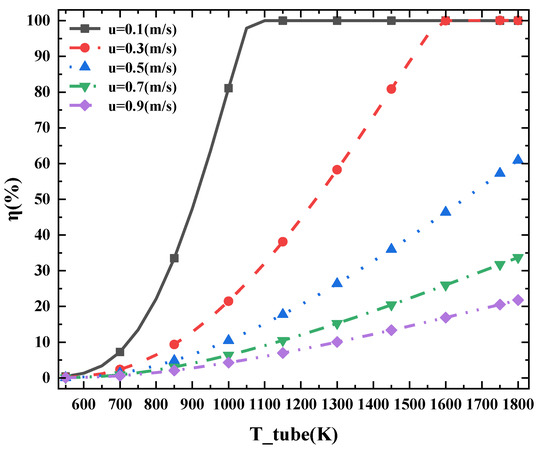
Figure 7.
η at different temperature of the heat pipe under different flow rate (T_tube refers to the different heat pipe inlet temperature, u refers to the flow rate of ammonia).
4.3. Response Surface Analysis
The ammonia-cracking reaction depends on several process variables. The effects of flue gas temperature in the heating tube, inlet flow rate of catalytic bed, and flue gas flow rate in the heating tube on ammonia-cracking reaction were investigated. The temperature range of flue gas in the middle pipe is 1200–1600 K, the gas flow rate in the middle pipe is 0.1–0.5 m/s, and the ammonia flow rate in the catalytic bed is 0.2–1.6 m/s. Taking the cracking rate of ammonia gas as the performance index of ammonia cracker, the response factor range is 10.70–100%. Table 4 shows the matrix of 17 experiments.
Table 4.
The Box-Behnken design matrix and input data.
4.3.1. Model Fitting and Diagnostics
To find out which equation can obtain the best correlation between the independent variable and the reaction, the most used equation was analyzed by ANOVA: linear two-factor interaction (2FI) and quadratic and cubic fitting tests [27]. Via the fitting test, the quadratic polynomial regression equation can best describe the experimental data. ANOVA analysis results are shown in Table 5 below.
Table 5.
ANOVA results for reduced model of the response variable R.
The significance of each independent variable can be summarized from the p value of the ANOVA results in Table 5: the three single factors of heat pipe temperature (A), heat pipe gas flow rate (B), and catalytic bed flow rate (C) have highly significant effects on the cracking rate. In the interactive term, the significance of heat pipe temperature (A) and heat pipe gas flow rate (B) on the cracking rate is slightly weaker than the other two terms. In the square term, only the catalytic bed flow rate (C2) has significant effects on the ammonia-cracking rate. The cracking rate of the cracker is obtained after removing the non-significant items η (response value R) and the quadratic regression equation model of each influencing factor:
Figure 8 shows the model diagnosis of response variable R. The normal graph of residual should be approximately a straight line, and the relationship between residual and predicted response value and operation value should be random scattered points. The points in the actual response value graph with reference to the predicted response value are accurately arranged at an angle of 45° along the axis.
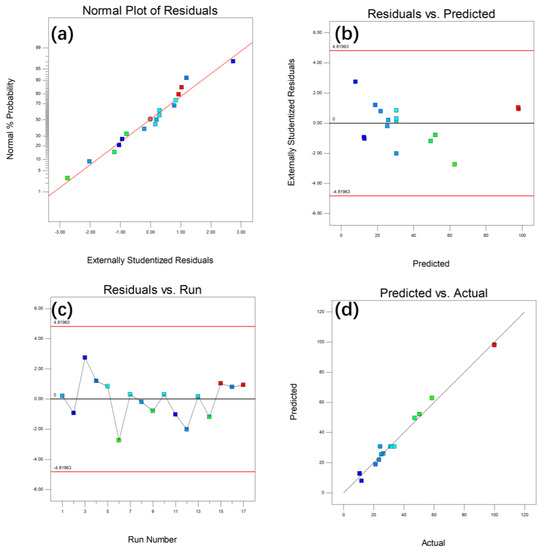
Figure 8.
Model diagnosis of response variable R (a) normal probability diagram of residuals; (b) the relationship between residual error and RZ prediction value; (c) residuals and running numbers; (d) comparison of predicted value and actual value of response variable R.
The analysis chart of these results shows that the input value and predicted value fit well in the RSM surface fitting results.
4.3.2. Response Surface Result and conclusion
As shown in Table 5, the interaction term AC of the inlet temperature (A) of the heating intermediate pipe and the inlet flow rate (C) of the catalytic bed, and the interaction term BC of the inlet flow rate (B) of the heating intermediate pipe and the inlet flow rate (C) of the catalytic bed are related to the response factor (η). This interaction has high significance. The response surface of pipe flow rate of AC and η at different temperatures is shown in the figure.
As shown in Figure 9, with the increase of heat pipe temperature and the decrease of catalytic bed flow rate, the cracking efficiency of the cracker has maintained an upward trend. The cracking rate is more sensitive to the flow rate of the catalytic bed. When the flow rate of the catalytic bed is higher, increasing the flow rate of the heating tube or increasing the temperature of the heating tube cannot improve the cracking efficiency of the catalytic bed. Therefore, the flow rate of the catalytic bed should be reduced as much as possible in order to improve the hydrogen concentration in the product. In addition, with the increase of gas flow rate in the heating middle pipe, the adjustable range of cracking rate also gradually expands. In the case of on-site hydrogen production, the flow rate in the middle pipe can be appropriately increased to achieve better control efficiency.
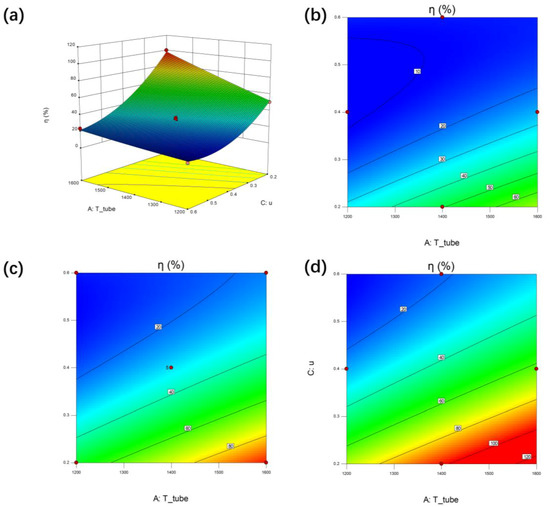
Figure 9.
Interaction effect between the catalytic flow rate (C) and the temperature of heat tube (A) at fixed value of heat tube flow rate (B) on η of the ammonia cracker (R) by response surface and contour plot. (a) Response surface while B = 0.3, (b) contour plot while B = 0.1, (c) contour plot while B = 0.3, (d) contour plot while B = 0.5.
It can be seen from Figure 10b–d that the slopes of contour lines are less than 1, which indicates that the effect of flow rate in catalytic bed on cracking rate is more significant than that in heating tube. In Figure 10b, when the temperature of the heating pipe is 1200 K, more than half of the fitting data of the contour surface are less than 20%, which is unacceptable in on-site hydrogen production, so it is recommended that the temperature of the heat pipe should be kept above 1400 K. It can be seen from Figure 10b,c that when the flow rate in the heating pipe is greater than 0.4 m/s, the fitting point falls within the range of the maximum cracking rate, and the increase of the heating flue gas temperature has no significant effect on the distribution of cracking rate.
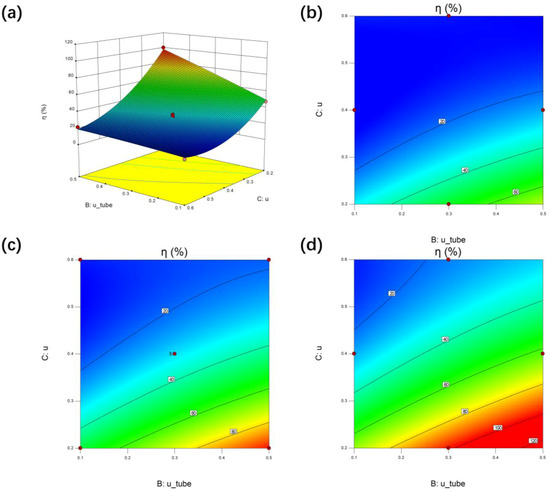
Figure 10.
Interaction effect between the catalytic flow rate (C) and the heat tube flow rate (B) at fixed value of temperature of heat tube (A) on η of the ammonia cracker (R) by response surface and contour plot. (a) Response surface while A = 1400 K, (b) contour plot while A = 1200 K, (c) contour plot while A = 1400 K, (d) contour plot while A = 1600 K.
Therefore, from the perspective of practical application scenarios, if we want to flexibly control the cracking rate of the device, on the one hand, we should increase the flue gas flow rate and inlet temperature of the heating pipe; on the other hand, we should control the ammonia gas flow rate in the catalytic bed to a suitable scope.
5. Conclusions
A numerical simulation of an ammonia cracker with a multi-physics field was carried out. Detailed temperature field and reaction flow information were obtained. The characteristic trend of our simulation expresses consistence with experimental results with the maximum discrepancy within 13%, which reflects the feasibility and reasonability of the numerical model presented in this paper. Based on the model, we obtain the following conclusions.
- (1)
- Factors affecting the cracking efficiency of the cracker, including the flue gas temperature in the heating pipe and the size parameters of the cracker, are simulated and analyzed to better understand the inner physical and chemical processes of ammonia-cracking. The temperature of the heating tube has the most prominent influence on the cracking rate of the cracker and can be used as the control quantity for cracking efficiency.
- (2)
- According to the simulation results, it can be concluded that a longer tube does not mean higher cracking efficiency for the design and optimization of ammonia crackers in industrial applications and operation control. With the ammonia flow rate and pipe length at approximately 0.5 m/s and 0.6 m respectively, an appropriate cracking efficiency approximately of 37% can be achieved.
- (3)
- According to the comparison between the device without a reciprocating heating layer and the device, we found that the high-temperature gas after cracking heated the low-temperature ammonia gas flowing into the cracking pipe via reciprocating reflux, which made the ammonia gas temperature rise faster and the temperature curve smoother and significantly improved the cracking rate.
- (4)
- According to the results of RSM analysis, under common working conditions, the ammonia flow rate in the catalytic bed is the most important factor affecting the cracking efficiency of the unit. Correspondingly, a too-low flue gas inlet temperature and the flow rate of the heating pipe will affect the upper limit of the cracking efficiency, but have little effect on the lower limit.
In addition, some deficiencies in the existing research and challenges for future research are summarized.
- (1)
- The heat of combustion gas in the heating pipe could still be used for the vaporization of liquid ammonia or directly for the heating of ammonia at the inlet.
- (2)
- A customized catalyst bed with a porosity gradient would improve the flow characteristics in the cracker.
- (3)
- The simulation and analysis are only for this application scenario of the cracker, and less consideration is given to the constraints of hydrogen production cost and device size. Further research should establish an evaluation index based on size or cost to optimize the structural design and boundary parameter control of the cracker.
Author Contributions
Conceptualization, L.C.; data curation, P.Y. and Z.W.; investigation, P.Y. and C.L.; methodology, P.Y.; writing—original draft preparation, P.Y.; writing—review and editing, L.C. All authors have read and agreed to the published version of the manuscript.
Funding
This work was supported by the National Natural Science Foundation of China (T2341001, 11775270), and Institute of Energy of Hefei comprehensive National Science Center (19KZS206, 21KZS201, 22KZS301, 22KZS304).
Data Availability Statement
The data presented in this study are available on request from the corresponding author.
Conflicts of Interest
The authors declare no conflict of interest.
References
- Le, T.A.; Do, Q.C.; Kim, Y.; Kim, T.-W.; Chae, H.-J. A Review on the Recent Developments of Ruthenium and Nickel Catalysts for COx-Free H2 Generation by Ammonia Decomposition. Korean J. Chem. Eng. 2021, 38, 1087–1103. [Google Scholar] [CrossRef]
- Ao, R.; Lu, R.; Leng, G.; Zhu, Y.; Yan, F.; Yu, Q. A Review on Numerical Simulation of Hydrogen Production from Ammonia Decomposition. Energies 2023, 16, 921. [Google Scholar] [CrossRef]
- Lucentini, I.; Garcia, X.; Vendrell, X.; Llorca, J. Review of the Decomposition of Ammonia to Generate Hydrogen. Ind. Eng. Chem. Res. 2021, 60, 18560–18611. [Google Scholar] [CrossRef]
- Comotti, M.; Frigo, S. Hydrogen Generation System for Ammonia–Hydrogen Fuelled Internal Combustion Engines. Int. J. Hydrogen Energy 2015, 40, 10673–10686. [Google Scholar] [CrossRef]
- Cardoso, J.S.; Silva, V.; Rocha, R.C.; Hall, M.J.; Costa, M.; Eusébio, D. Ammonia as an Energy Vector: Current and Future Prospects for Low-Carbon Fuel Applications in Internal Combustion Engines. J. Clean. Prod. 2021, 296, 126562. [Google Scholar] [CrossRef]
- Lamb, K.E.; Dolan, M.D.; Kennedy, D.F. Ammonia for Hydrogen Storage; A Review of Catalytic Ammonia Decomposition and Hydrogen Separation and Purification. Int. J. Hydrogen Energy 2019, 44, 3580–3593. [Google Scholar] [CrossRef]
- Valera-Medina, A.; Xiao, H.; Owen-Jones, M.; David, W.I.F.; Bowen, P.J. Ammonia for Power. Prog. Energy Combust. Sci. 2018, 69, 63–102. [Google Scholar] [CrossRef]
- Juangsa, F.B.; Irhamna, A.R.; Aziz, M. Production of Ammonia as Potential Hydrogen Carrier: Review on Thermochemical and Electrochemical Processes. Int. J. Hydrogen Energy 2021, 46, 14455–14477. [Google Scholar] [CrossRef]
- Chang, F.; Gao, W.; Guo, J.; Chen, P. Emerging Materials and Methods toward Ammonia-Based Energy Storage and Conversion. Adv. Mater. 2021, 33, 2005721. [Google Scholar] [CrossRef]
- Recent Advances in Bimetallic Catalysts for Hydrogen Production from Ammonia—Khan—2022—The Chemical Record—Wiley Online Library. Available online: https://onlinelibrary.wiley.com/doi/abs/10.1002/tcr.202200030 (accessed on 19 September 2022).
- Gu, Y.; Ma, Y.; Long, Z.; Zhao, S.; Wang, Y.; Zhang, W. One-Pot Synthesis of Supported Ni@Al2O3 Catalysts with Uniform Small-Sized Ni for Hydrogen Generation via Ammonia Decomposition. Int. J. Hydrogen Energy 2021, 46, 4045–4054. [Google Scholar] [CrossRef]
- Chen, C.; Wu, K.; Ren, H.; Zhou, C.; Luo, Y.; Lin, L.; Au, C.; Jiang, L. Ru-Based Catalysts for Ammonia Decomposition: A Mini-Review. Energy Fuels 2021, 35, 11693–11706. [Google Scholar] [CrossRef]
- Guan, J.; Zhang, H.; Su, Z.; Shi, D.; Wu, Q.; Chen, K.; Zhang, Y.; Li, H. Recent progress in nickel-based catalysts for ammonia decomposition to hydrogen. Chem. Ind. Eng. Prog. 2022, 41, 6319–6337. [Google Scholar]
- Lin, Q.F.; Jiang, Y.M.; Liu, C.Z.; Chen, L.W.; Zhang, W.J.; Ding, J.; Li, J.G. Instantaneous Hydrogen Production from Ammonia by Non-Thermal Arc Plasma Combining with Catalyst. Energy Rep. 2021, 7, 4064–4070. [Google Scholar] [CrossRef]
- Wang, Z.; Zheng, S.; Yao, Y.; Chen, R.; Wang, Z. Research progress on electrocatalytic decomposition of ammonia for hydrogen production. CIESC J. 2022, 73, 1008–1021. [Google Scholar]
- Chiuta, S.; Everson, R.C.; Neomagus, H.W.J.P.; van der Gryp, P.; Bessarabov, D.G. Reactor Technology Options for Distributed Hydrogen Generation via Ammonia Decomposition: A Review. Int. J. Hydrogen Energy 2013, 38, 14968–14991. [Google Scholar] [CrossRef]
- Akiyama, M.; Aihara, K.; Sawaguchi, T.; Matsukata, M.; Iwamoto, M. Ammonia Decomposition to Clean Hydrogen Using Non-Thermal Atmospheric-Pressure Plasma. Int. J. Hydrogen Energy 2018, 43, 14493–14497. [Google Scholar] [CrossRef]
- Lin, Q.; Jiang, Y.; Liu, C.; Chen, L.; Zhang, W.; Ding, J.; Li, J. Controllable NO Emission and High Flame Performance of Ammonia Combustion Assisted by Non-Equilibrium Plasma. Fuel 2022, 319, 123818. [Google Scholar] [CrossRef]
- Chein, R.-Y.; Chen, Y.-C.; Chang, C.-S.; Chung, J.N. Numerical Modeling of Hydrogen Production from Ammonia Decomposition for Fuel Cell Applications. Int. J. Hydrogen Energy 2010, 35, 589–597. [Google Scholar] [CrossRef]
- Di Carlo, A.; Dell’Era, A.; Del Prete, Z. 3D Simulation of Hydrogen Production by Ammonia Decomposition in a Catalytic Membrane Reactor. Int. J. Hydrogen Energy 2011, 36, 11815–11824. [Google Scholar] [CrossRef]
- Appari, S.; Janardhanan, V.M.; Jayanti, S.; Maier, L.; Tischer, S.; Deutschmann, O. Micro-Kinetic Modeling of NH3 Decomposition on Ni and Its Application to Solid Oxide Fuel Cells. Chem. Eng. Sci. 2011, 66, 5184–5191. [Google Scholar] [CrossRef]
- Zhang, J.; Xu, H.; Li, W. Kinetic Study of NH3 Decomposition over Ni Nanoparticles: The Role of La Promoter, Structure Sensitivity and Compensation Effect. Appl. Catal. A Gen. 2005, 296, 257–267. [Google Scholar] [CrossRef]
- McCabe, R.W. Kinetics of Ammonia Decomposition on Nickel. J. Catal. 1983, 79, 445–450. [Google Scholar] [CrossRef]
- CRC Handbook of Chemistry and Physics, 97th ed.; Haynes, W.M., Lide, D.R., Bruno, T.J., Eds.; CRC Press: Boca Raton, FL, USA, 2016; ISBN 978-1-315-38047-6. [Google Scholar]
- Zhang, J.; Xu, H.; Jin, X.; Ge, Q.; Li, W. Characterizations and Activities of the Nano-Sized Ni/Al2O3 and Ni/La–Al2O3 Catalysts for NH3 Decomposition. Appl. Catal. A Gen. 2005, 290, 87–96. [Google Scholar] [CrossRef]
- Sørensen, R.Z.; Klerke, A.; Quaade, U.; Jensen, S.; Hansen, O.; Christensen, C.H. Promoted Ru on High-Surface Area Graphite for Efficient Miniaturized Production of Hydrogen from Ammonia. Catal. Lett. 2006, 112, 77–81. [Google Scholar] [CrossRef]
- Inger, M.; Dobrzyńska-Inger, A.; Rajewski, J.; Wilk, M. Optimization of Ammonia Oxidation Using Response Surface Methodology. Catalysts 2019, 9, 249. [Google Scholar] [CrossRef]
Disclaimer/Publisher’s Note: The statements, opinions and data contained in all publications are solely those of the individual author(s) and contributor(s) and not of MDPI and/or the editor(s). MDPI and/or the editor(s) disclaim responsibility for any injury to people or property resulting from any ideas, methods, instructions or products referred to in the content. |
© 2023 by the authors. Licensee MDPI, Basel, Switzerland. This article is an open access article distributed under the terms and conditions of the Creative Commons Attribution (CC BY) license (https://creativecommons.org/licenses/by/4.0/).