Article

The Acoustic Characteristics of Tectonically Deformed Coal in Huaibei Coalfield

1
Laboratory of Coalbed Methane Resources & Reservoir Formation Process, Ministry of Education, China University of Mining and Technology, Xuzhou 221008, China
2
School of Resource and Earth Science, China University of Mining and Technology, Xuzhou 221116, China
3
Geophysical Survey Team of Hebei Province Coal Geological Bureau, Xingtai 054099, China
*
Author to whom correspondence should be addressed.
Energies 2023, 16(13), 5179; https://doi.org/10.3390/en16135179
Submission received: 14 June 2023 / Revised: 30 June 2023 / Accepted: 4 July 2023 / Published: 5 July 2023
(This article belongs to the Section H: Geo-Energy)

Abstract

:
Tectonically deformed coal (TDC) is closely related to gas outbursts. Since TDC exploration is an essential objective for coalfield exploration, it is of great significance to study the petrophysical properties of TDCs and explore their differences. This study collected 17 TDCs and undeformed coal samples from the Huaibei coalfield and ultrasonically tested their petrophysical parameters, including densities, P- and S-wave velocities, and their derived petrophysical parameters (VP/VS ratio, P- and S-wave impedances). Undeformed coal and TDCs with different deformation types (brittle, shear, and plastic deformations) show significant differences in their petrophysical parameters, and cross-plot analysis can directly differentiate them. As with traditional geological methods, acoustically measured petrophysical parameters are good indicators to determine the type of coal deformation. However, the TDCs with the same deformation type have similar petrophysical parameters; it is not easy to distinguish them directly. Instead, the proposed method incorporating principal component analysis and clustering can accurately distinguish up to five classes of TDCs. Different types of tectonic deformation environments and their intensities are highly correlated with the clustering results. This paper also provides essential petrophysical parameters for undeformed coal and TDCs in the Huaibei coalfield, and these parameters can help interpret undeformed coal and TDCs using wireline logs and seismic data.

1. Introduction

Tectonically deformed coal (TDC) is a type of coal in which the primary structure of the coal body has undergone different degrees of embrittlement, fracture or ductile deformation, superimposed damage under the action of one or more periods of tectonic stresses, and even internal chemical composition and structure changes [1,2,3,4,5,6]. The main coalfields in China experienced several geological periods and caused complex geological structures, and TDCs are widely developed in coal beds [1,6,7,8]. It has been proven that TDCs are closely related to gas outbursts because of their low strength and weak resistance to stresses and deformations [6,9,10,11,12]. Low-rank TDCs have rich fractures and high permeability compared with undeformed coal [6,13]. These characteristics are preferred for exploiting coalbed methane (CBM) on the surface and in the underground tunnel [14,15,16,17,18]. However, the fracture development and permeability of high-rank TDCs are more complicated, and it is more likely unsuitable for direct CBM exploitation [19,20,21,22,23]. Therefore, it is significant for CBM exploitation and coal mine safety to study the petrophysical properties of TDCs and undeformed coal.
The petrophysical parameters (such as bulk modulus, shear modulus, P-wave velocity, and S-wave velocity) are related to the elastic parameters of rocks and play an essential role in geophysical exploration, including wireline logging and seismic surveys [24,25]. Like seismic inversion in oil and gas reservoirs, seismic inversion in coal fields needs the quantitative association of density, velocity, and their mutual conversion to reduce the embedded uncertainty and ambiguity [26,27]. With the large-scale exploration and production of coals and CBMs in China, the study of the petrophysical properties of coals has attracted extensive attention and resulted in many applications [6,28,29,30]. Although researchers have measured undeformed coals and TDCs, the petrophysical parameters and related distributing characteristics in the Huaibei coalfield are poorly studied.
Dynamic measurements of petrophysical parameters in the lab can simulate actual formation conditions and provide helpful information for geophysical exploration [31,32,33]. As for coal, researchers have studied the petrophysical parameters in the lab using ultrasonic testing for some metamorphic and deformed coals under room temperature and pressure conditions [7,34,35,36,37]. Researchers have also measured the velocity anisotropy of P and S waves in the lab for some types of coals with transmission and reflection methods [38]. Besides testing in the lab, some researchers have measured the petrophysical parameters of coal in underground roadways of coal mines to avoid the difficulty of coal sampling and preparation [39]. Although researchers have attempted to address the petrophysical parameters of coalbeds, some high-level deformed TDCs are not obtained because their fragile characteristics made the core sampling and preparation hard.
During rock physical analysis and parameter calculation, there is extensive information redundancy among rock physical parameters [24]. For example, the velocity, impedance, and density are more or less correlated [25]. Principal component analysis (PCA) is an effective method for dimensionality reduction, and it has been widely used in geoscientific research [40]. Using PCA to convert rock physical parameters into principal components can overcome the classification deviation caused by information redundancy [41,42].
This paper investigates the petrophysical parameters and their distribution characteristics and proposes a classification method for TDCs through systematic sampling and laboratory testing of the No.10 coal in the Huaibei coalfield.

2. Geological Background

2.1. Geological Setting

The Huaibei coalfield is located on the southeast margin of the North China Plate. The main body belongs to the Xu-Su sag in the south-central part of the Luxi-Xuhuai Uplift [9]. The active belts on the south and east sides of the plate margin control the structural framework. The formation of the Mesozoic Xu-Su arc double-impact imbricated fan reverse fault system established the main structural framework of this area [9], characterized by linearly compact closed folds and thrust imbricated fan faults (Figure 1).
The Zhuxianzhuang and Luling coal mines are located in the southern part of the Huaibei Coalfield and are bounded to the south by the Xisipo faults (Figure 1). The coal seams in the Huaibei Coalfield have been strongly deformed due to previous multistage tectonic events [9,43,44]. Thus, a full suite of TDCs is widely developed in the Zhuxianzhuang and Luling coal mines, making these two mines ideal places for TDC research [45,46].
The strata presented in the Huaibei Coalfield are the upper Proterozoic, Sinian, Cambrian, Ordovician, Carboniferous, Permian, Triassic, Jurassic, Cretaceous, Paleogene, Neogene, and Quaternary strata [1,47]. The coal-bearing strata in the coalfield belong to the lower Permian Shanxi Formation and the middle Permian Lower Shihezi Formation [38,48]. The main mineable coal seams in this area are the No. 8 coal of the Lower Shihezi Formation and the No.10 coal of the Shanxi Formation.

2.2. Core Sampling and Preparation

TDC samples were collected from typical TDC-rich coalbeds in the Zhuxianzhuang and Luling coal mines according to the China National Standards [49]. The sampling sites were on the fresh working faces and tunneling roadways in the coal mines. To prevent coal samples from being damaged during the sampling process, geological hammers were used carefully to preserve the original coal structures, and then samples were wrapped up with soft paper followed by adhesive tape with marks on the ends. The samples were placed in plastic storage bags to prevent contamination and minimize oxidation after collection. Then, the samples were immediately transported to the laboratory for observation, preparation, and experimentation.
According to the structure–genetic classification system of TDCs [1,6,10], the coal samples were classified into undeformed, cataclastic, porphyroclastic, granulitic, schistose, scaly, wrinkle, and mylonitic coals, as shown in Table 1. Among them, two samples of undeformed coal were used for comparison purposes. For a clearer explanation, the deformation environment and structure evolution of TDCs are summarized, as shown in Figure 2.
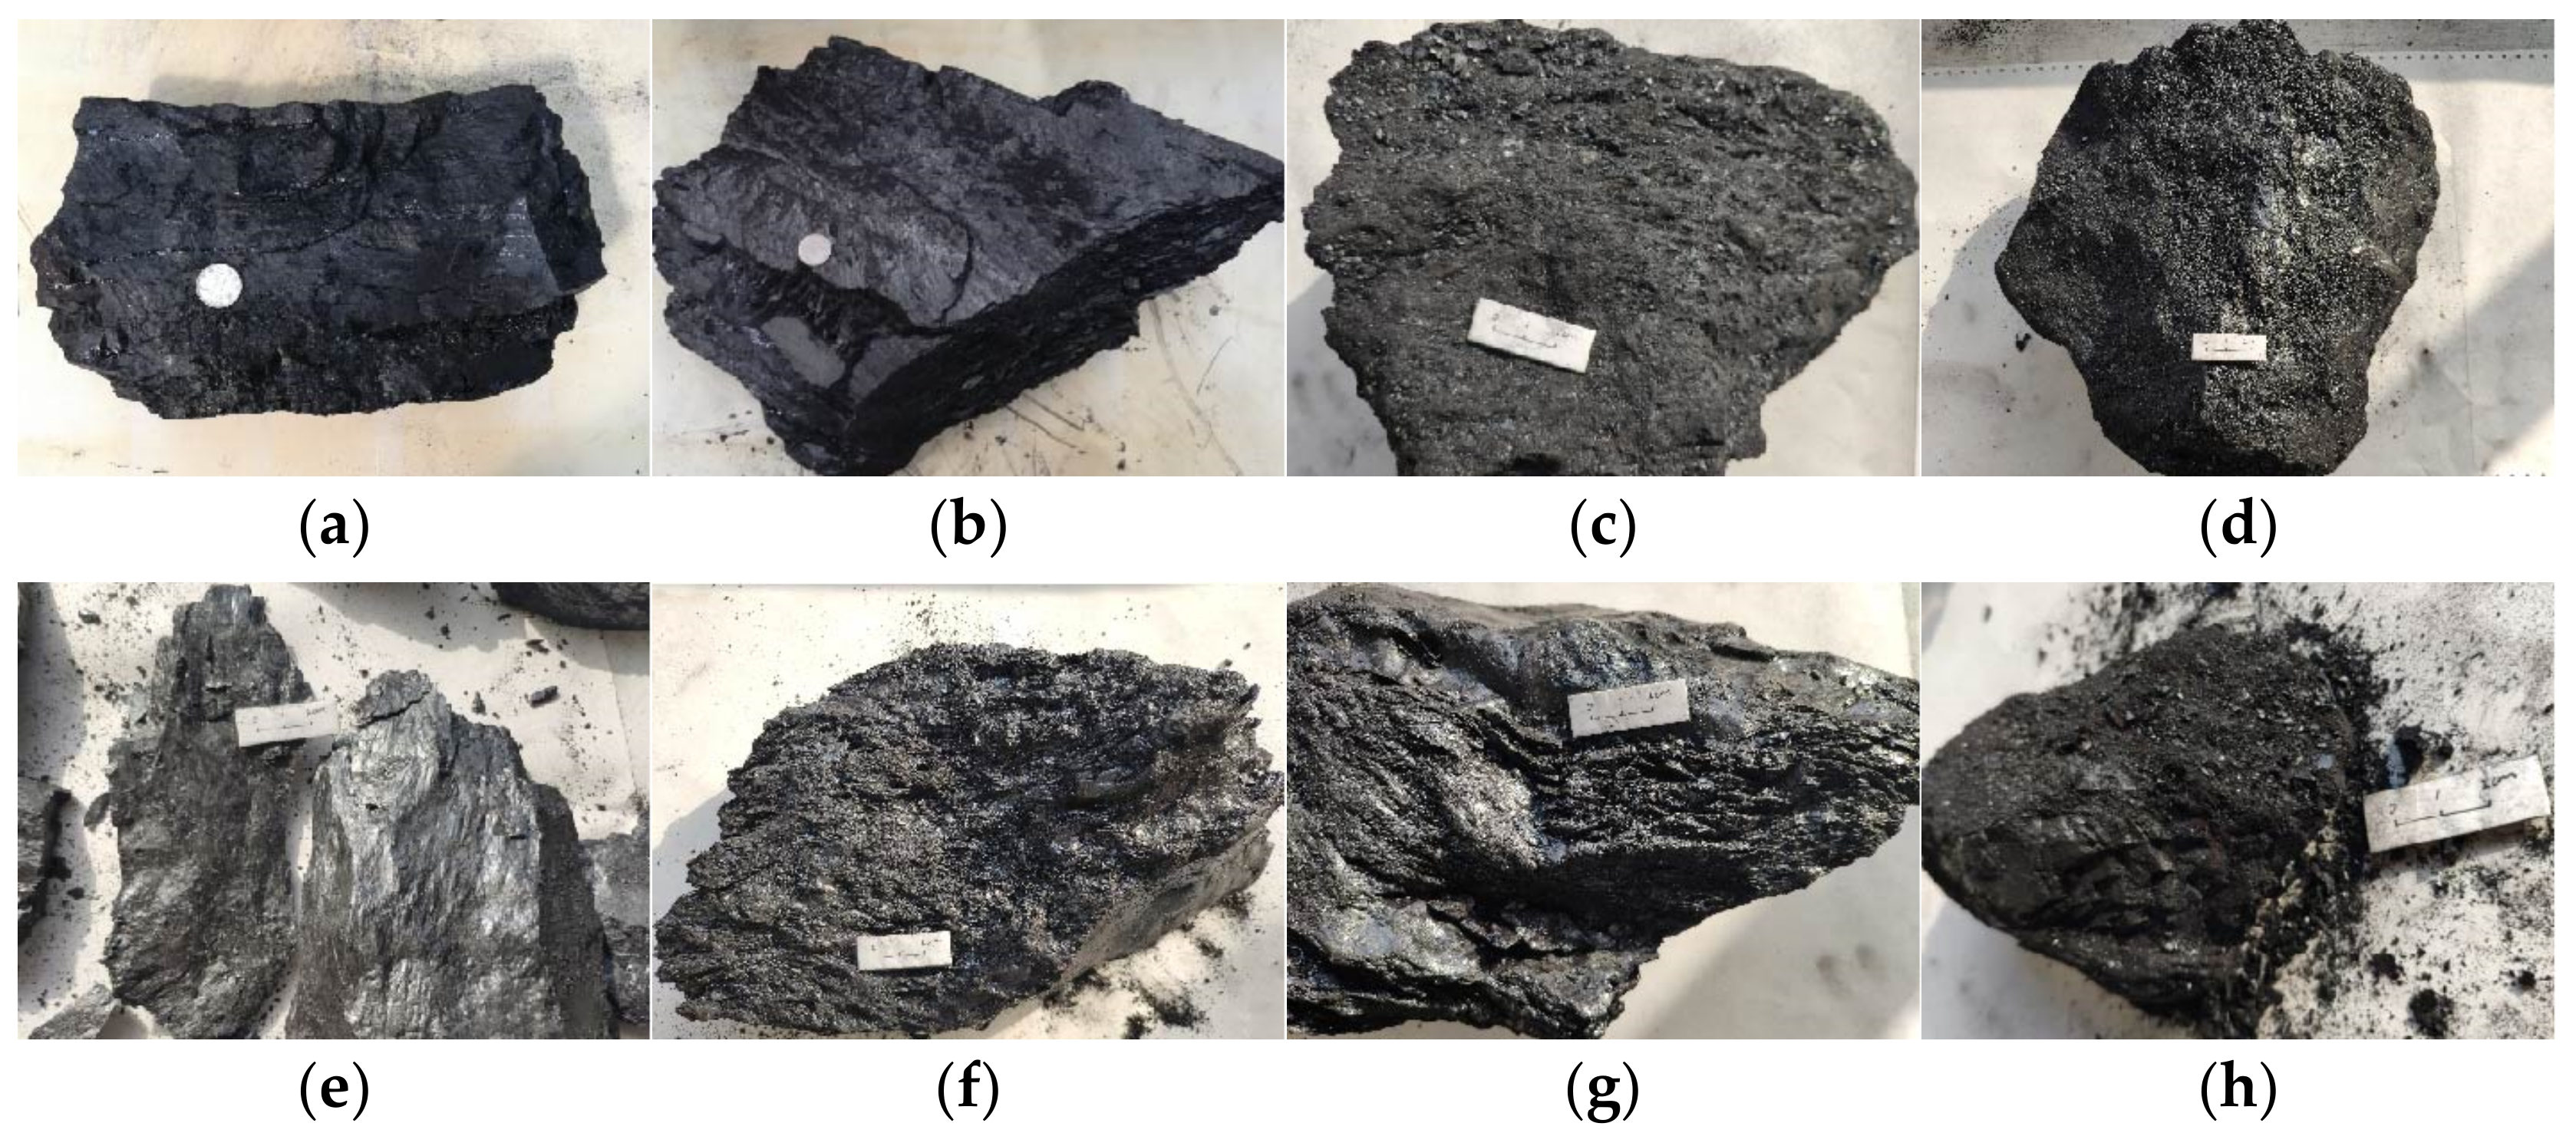
According to the deformation environment, the tectonic deformation process of TDCs includes three classes, i.e., brittleness, shear, and plastic deformation environment. In Figure 2, different colors are used to distinguish different deformation environments, and color shades are used to indicate the strength of the deformation degree. The TDCs resulting from plastic deformations are wrinkle and mylonitic coals characterized by ductile bending, rheology, and mylonitization structures. Photos of the original coal samples collected in this study are shown in Figure 3. Before preparation, these samples were classified into corresponding types based on their stiffness, macrostructure, and other visual characteristics. After classification, original coal samples were cut into small sizes by wire saw and then ground by hand into cubic cores with sandpaper under dry conditions. Since the coal samples are easily damaged, the edge lengths of the prepared cores range from 26.2 mm to 35.1 mm, with an average value of about 30.1 mm. The numbers of prepared undeformed and TDC cores are shown in Table 1.

3. Core Testing

3.1. Testing Method

The ultrasonic and density measurements were conducted at room temperature (25 °C) and atmospheric pressure (1 bar). The ultrasonic testing adopts the method of traveling waves [50], as shown in Figure 4a. The instruments consist of a pulse signal generator, an ultrasonic transducer, an amplifier, and an oscilloscope [50,51]. Two piezoelectric ceramic transducers generate and record P and S waves simultaneously among the components. The transducer, shown in Figure 4b, uses HKN-type coaxial cascade-type transducers to generate and receive primary and secondary waves, which can send pulse signals of different frequencies and intensities. Vaseline and shear-wave coupling agents were used during measurement to ensure good coupling between cores and transducers. The used frequency of the signal is 100 kHz square impulse for both P and S waves. The traveling times of waves across the cores were obtained by reading the onset of P and S waves, and a caliper measured the core lengths. The helium pycnometer tested the true densities of cores, and they were calibrated to the apparent densities by the porosities as measured by mercury porosimetry, as shown in Table 2.

3.2. Testing Result

After measuring all cores, the P- and S-wave velocities of undeformed coals and TDCs were calculated using the formula of V = Lt, where L is the side length of cores, Δt is the travel time of P or S waves through the cores, and V is the P-wave velocity (VP) or S-wave velocity (VS). As derivative parameters, P-wave impedance (IP), S-wave impedance (IS), and the ratios between P-wave velocity and S-wave velocity (VP/VS) were computed accordingly, as shown in Table 2. The authors only presented the average of all corresponding cores to reduce the influence of coal heterogeneity and improve the reliability of recorded signals. In addition, to reduce the effect of coal anisotropy, the tested velocities in this paper are in the direction perpendicular to the coalbed plane. This paper used a boxplot of petrophysical parameters to investigate their distribution characteristics, as shown in Figure 5. In the box plots, the red lines in the middle of each box indicate the medians. The bottom and top of each box represent the 25th and 75th percentile. The top and bottom short lines represent the maximum and minimum values. Red markers that exceed the whisker line lengths are outliers. As shown, the petrophysical parameters of undeformed coal and TDC cores have very different distribution ranges. Among them, density and VP/VS ratio have narrow variation ranges, S-wave impedance and velocity have middle variation ranges, but P-wave impedance and velocity vary widely. This research used all the petrophysical parameters mentioned above to analyze the possible coal deformation-related variations and distinguish undeformed coals and TDCs.

4. Discussion

4.1. Regularity in Cross Plots

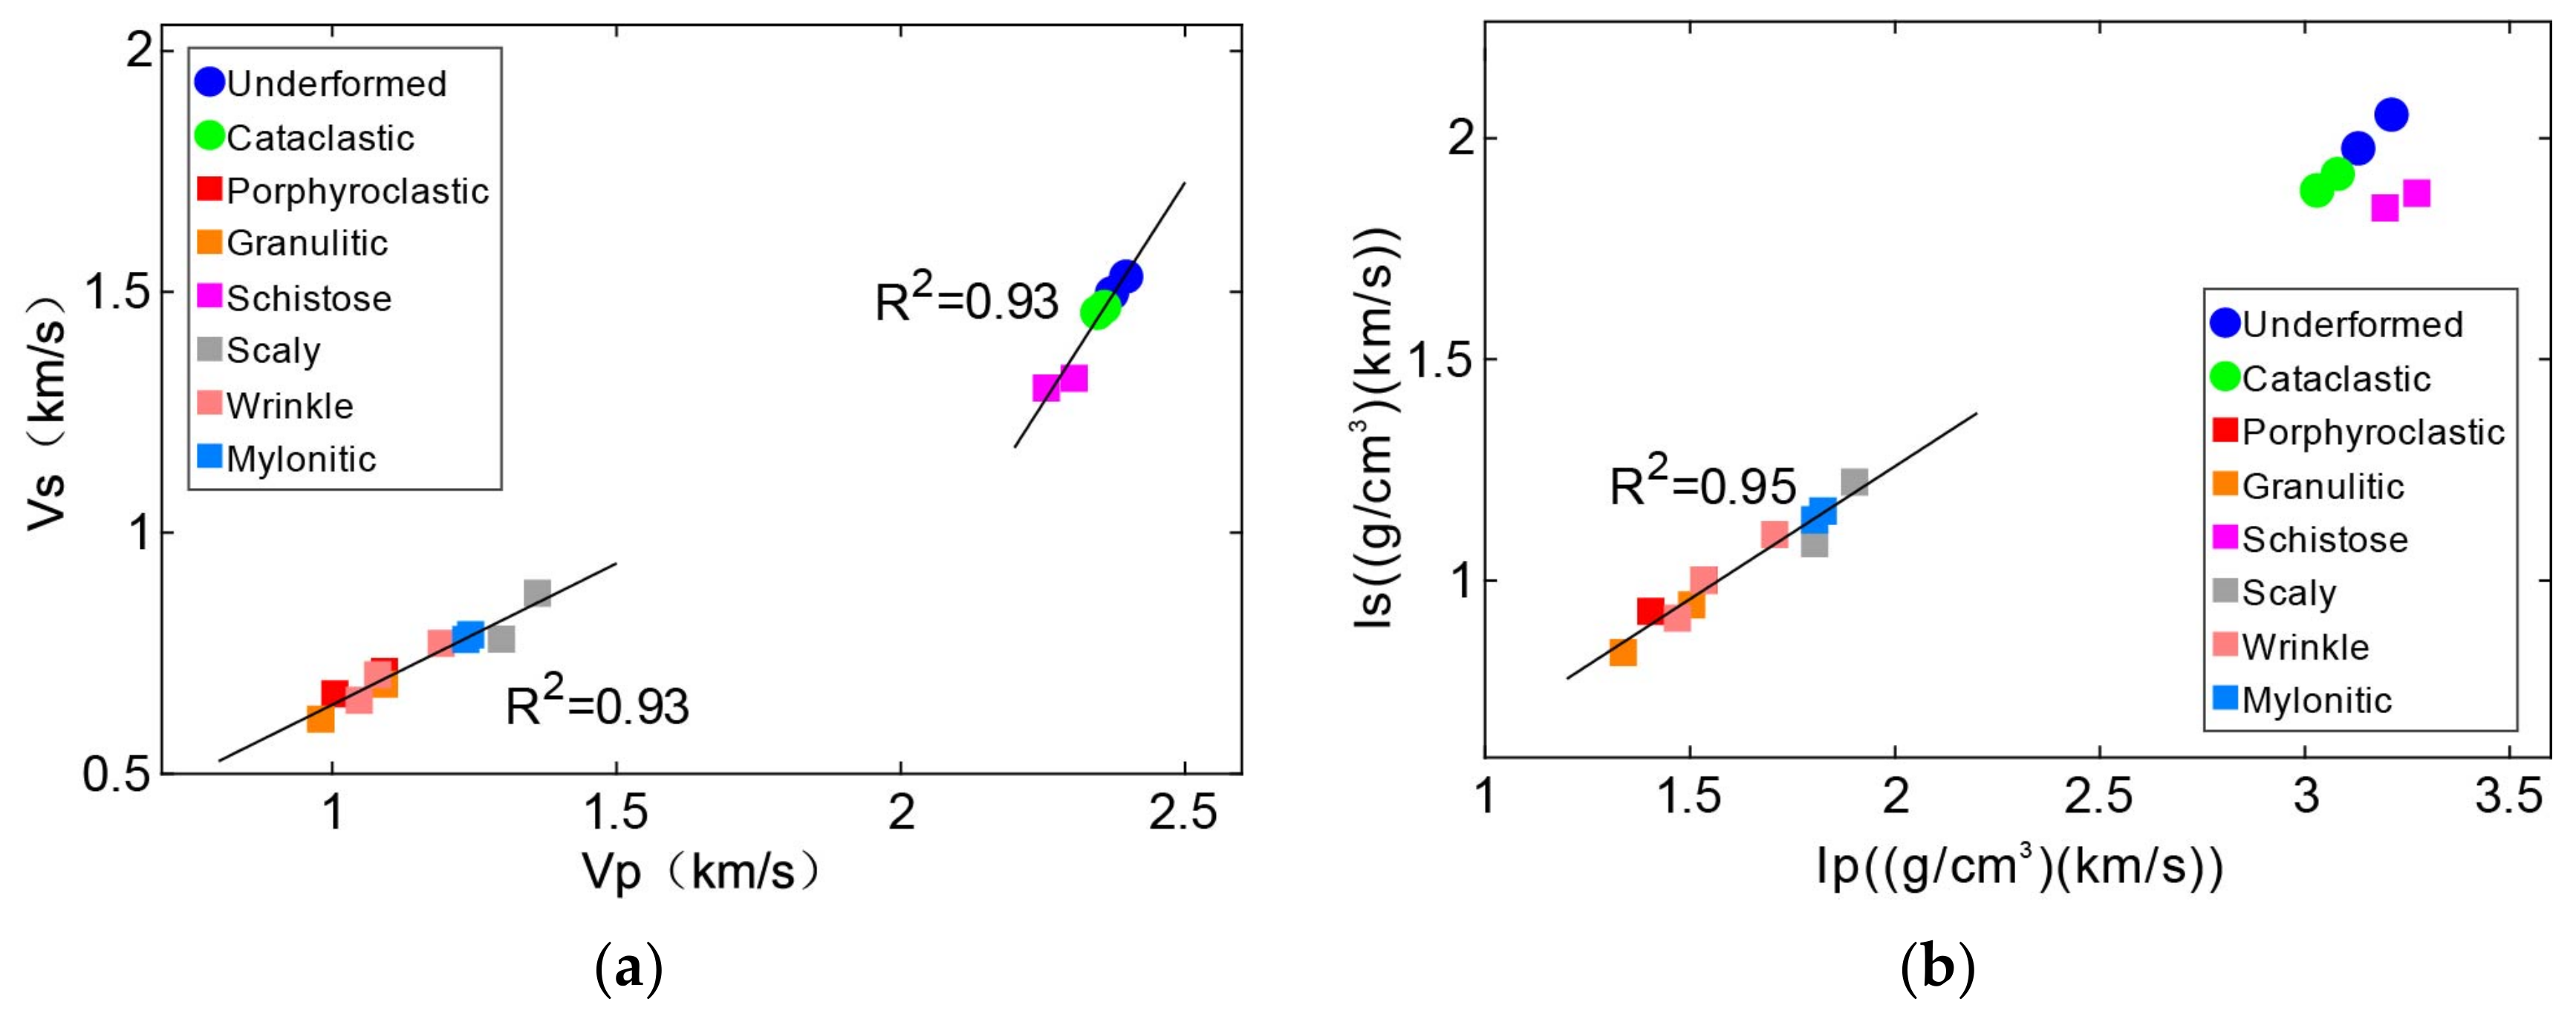
Since velocities and impedances are the most used and most readily obtained petrophysical parameters in seismic exploration, this paper uses velocities and impedances to address the variation characteristics of undeformed coal and TDCs, as shown in Figure 6. In general, the scatter points in the cross plots have the characteristics of regular partition distributions. Because undeformed coal and weak-deformed TDCs mostly keep their original structures unchanged, their velocities and impedances are relatively higher than those of strong-deformed TDCs. Consequently, undeformed coal and weak-deformed TDCs are located in the top-right area, while strong-deformed TDCs are located in the bottom-left region. Velocities and impedances in both regions show good linear correlations, as shown in Equations (1) and (2). With these equations, users can derive S-wave velocity and impedance from P-wave velocity and impedance for undeformed coal and TDCs since S-wave velocity and impedance are conventionally harder to achieve than P-wave velocity and impedance. Since the fitted conversion equation for velocities is more reliable than the impedances, the equation for velocities is preferred when doing a potential conversion. These conversion equations can help interpret undeformed coal and TDCs using wireline logs and seismic data.
V S = 0.59 V P + 0.06 ,   for   strong - deformed   TDCs V S = 1.83 V P 2.86 ,   for   other   coals
I S = 0.13 I P + 1.5 ,   for   strong - deformed   TDCs Not   reliable ,   for   other   coals
Besides the linear correlations, velocities and impedances of different TDC cores decrease with increasing coal deformation. Among them, the velocities and impedances of undeformed coal are the highest, and cataclastic and undeformed coals have similar elastic characteristics. The velocities and impedances of schistose coal, formed under shear deformation conditions, are slightly lower than that of cataclastic coal. The elastic characteristics of scaly and mylonitic coals are similar and significantly different from that of schistose coal. The velocities and impedances of porphyroclastic, granulitic, and wrinkle coals are the lowest. In Figure 6b, the fitted trend for strong-deformed TDCs is more reliable than in Figure 6a since the fitted determination coefficient is larger. However, it is unreliable to fit a trend for undeformed coal and weak-deformed TDCs in Figure 6b. The reason is because of the influences of core densities. Because the scatter points in Figure 6b have larger variation ranges and point-to-point distances, the cross-plot of IP vs. IS thus appears to be more useful than the cross-plot of VP vs. VS in distinguishing TDCs. Therefore, it is more conducive to identify and distinguish TDCs with the cross-plot of IP vs. IS.
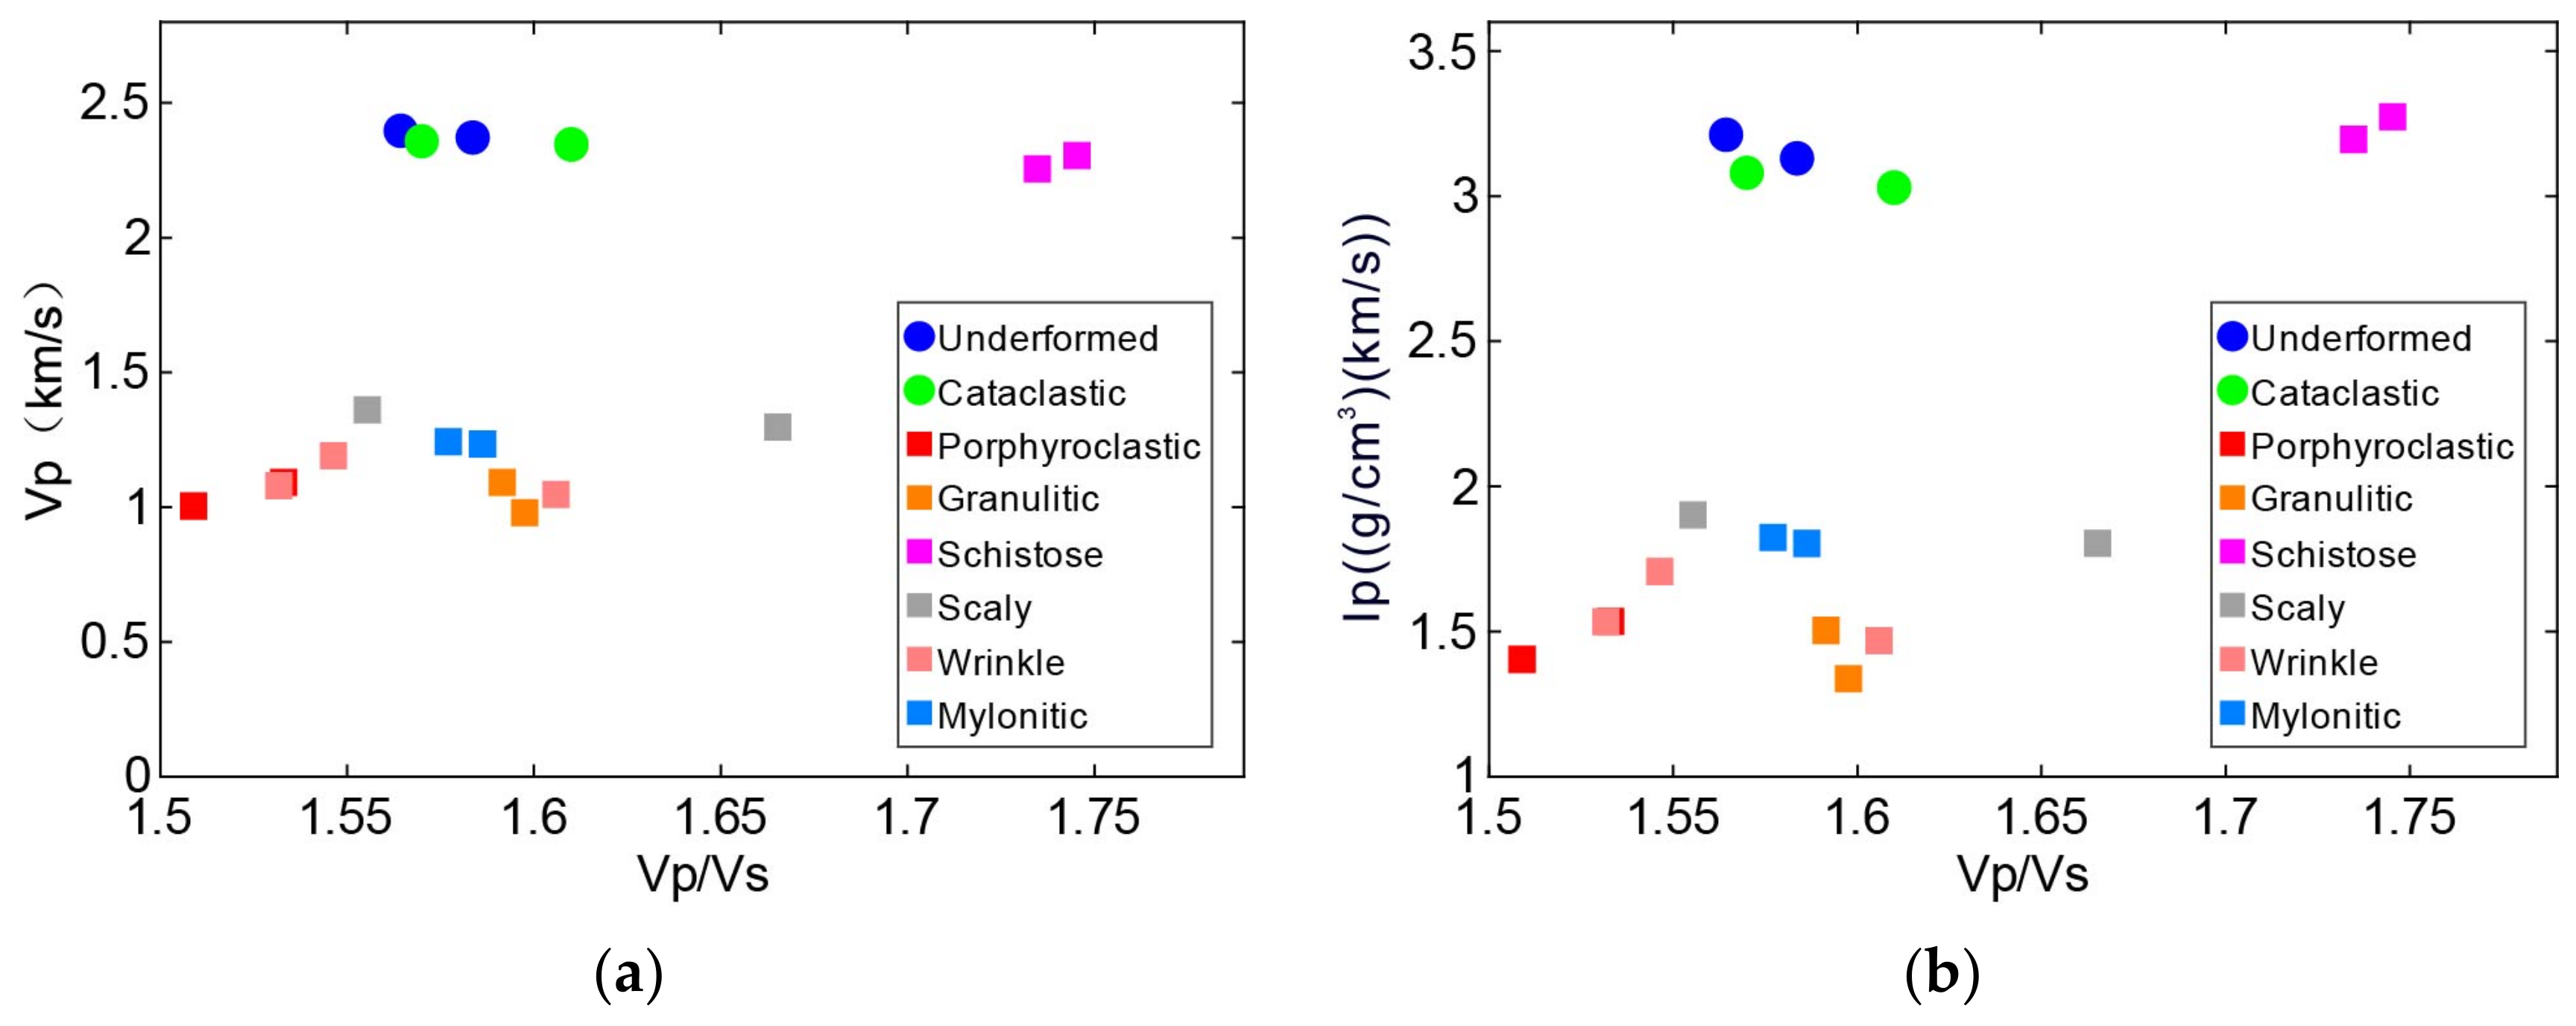
The VP/VS ratio or Poisson’s ratio is essential for lithology identification and differs from wave velocities and impedances [52,53,54,55]. Since the cross plots of VP/VS vs. VP and VP/VS vs. IP have been widely used in reservoir characterization, this paper uses them to investigate the distribution characteristics of TDCs, as shown in Figure 7. Similar to Figure 6, the scatter points of coal cores are distributed regionally in the cross plots. Undeformed coal and weak-deformed TDCs are located in the top-right area, while strong-deformed TDCs are located in the bottom-left region. Compared with the cross-plot of VP/VS vs. VP, the scatter points in the cross-plot of VP/VS vs. IP have wider variation. When users identify and distinguish undeformed coal and TDCs, the cross-plot of VP/VS vs. IP is preferred.

4.2. Information Redundancy among Petrophysical Parameters

As commonly used petrophysical parameters, VP, VS, VP/VS ratio, density, IP, and IS are valuable inputs for reservoir characteristics and are helpful for coal-type differentiation. However, as mentioned above, some of the petrophysical parameters are correlated. The correlation coefficients among the petrophysical parameters listed in Table 3 were calculated to understand the correlation extent. As shown, velocities, impedances, and densities are correlated with over 0.55 correlation coefficients. The VP/VS ratio has a 0.4 coefficient with other parameters except for density. These phenomena exhibit the existence of extensive information redundancy among petrophysical parameters [56]. Information redundancy can increase computation intensity and conceal effective information. Using these parameters directly to classify TDCs, the classification bias caused by the information redundancy is inevitable. This paper used principal component analysis (PCA) to transfer the petrophysical parameters into principal components (PCs) and use the PCs to classify TDCs. The approach may overcome the classification bias of TDCs caused by information redundancy [40,41,42,56,57]. The results are listed in Table 4 and Table 5.
As shown in Table 4, the PCs’ characteristic values and variance contribution rates differ significantly. The variance contribution rates of the first three PCs are 76.48%, 17.49%, and 6.00%. The cumulative variance contribution of the first three PCs is 99.98%, which is large enough to represent the information variations of the input parameters. As shown in Table 5, PC1 is mainly composed of VP, VS, IP, and IS, and PC2 and PC3 are mainly composed of VP/VS ratio and density. Therefore, these three PCs are proper inputs for cross-plot and TDC classification.
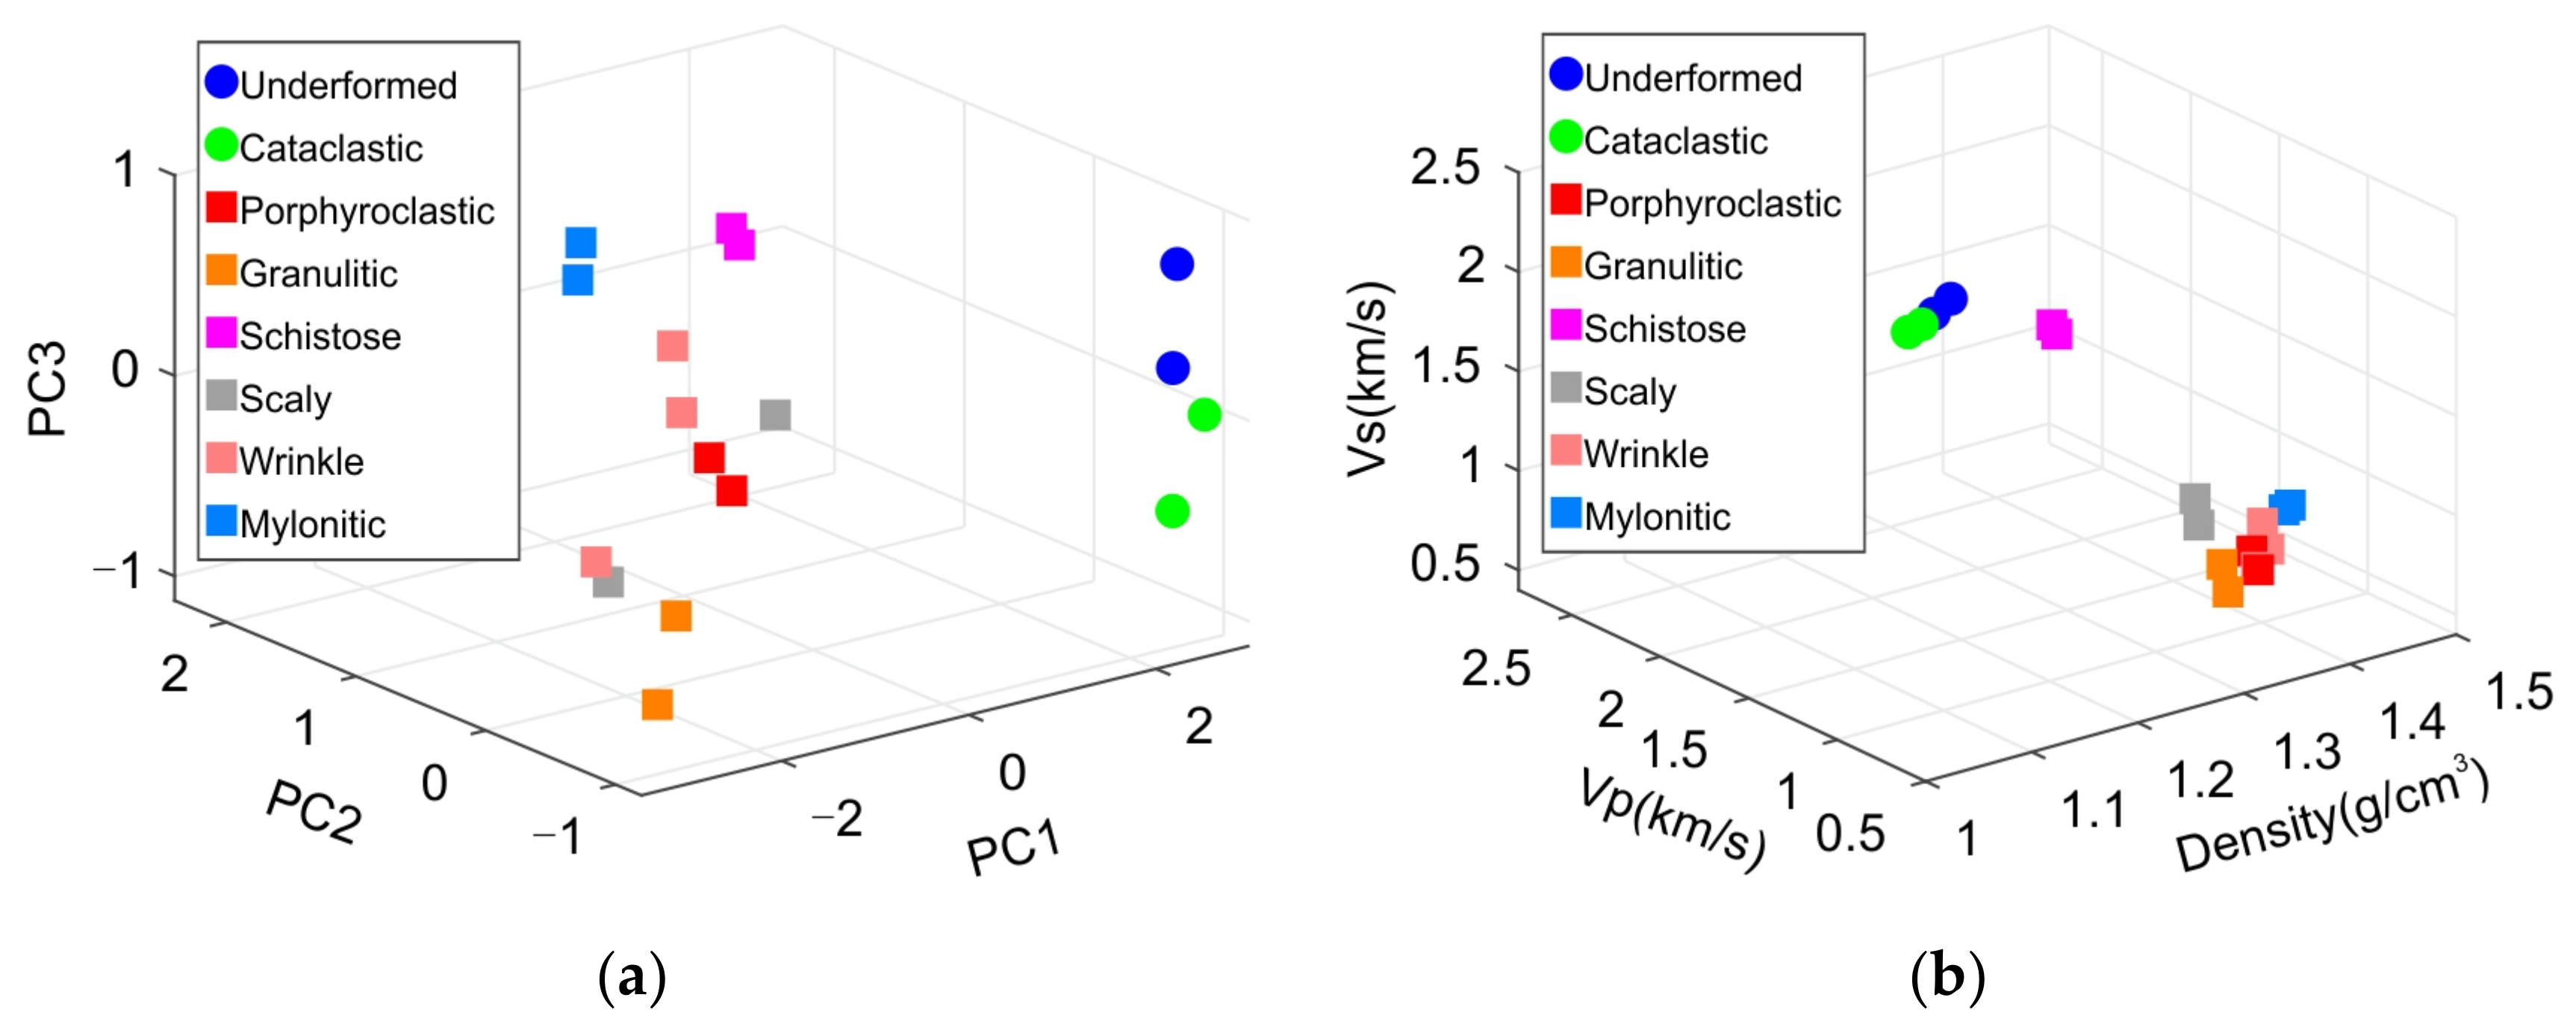
Compared with Figure 8b, most scattering points of the cross-plot of PCs are separated well, as shown in Figure 8a, and the PCs are visually independent. After PCA analysis, the information redundancy among petrophysical parameters is adequately removed.

4.3. Identification and Classification for TDCs

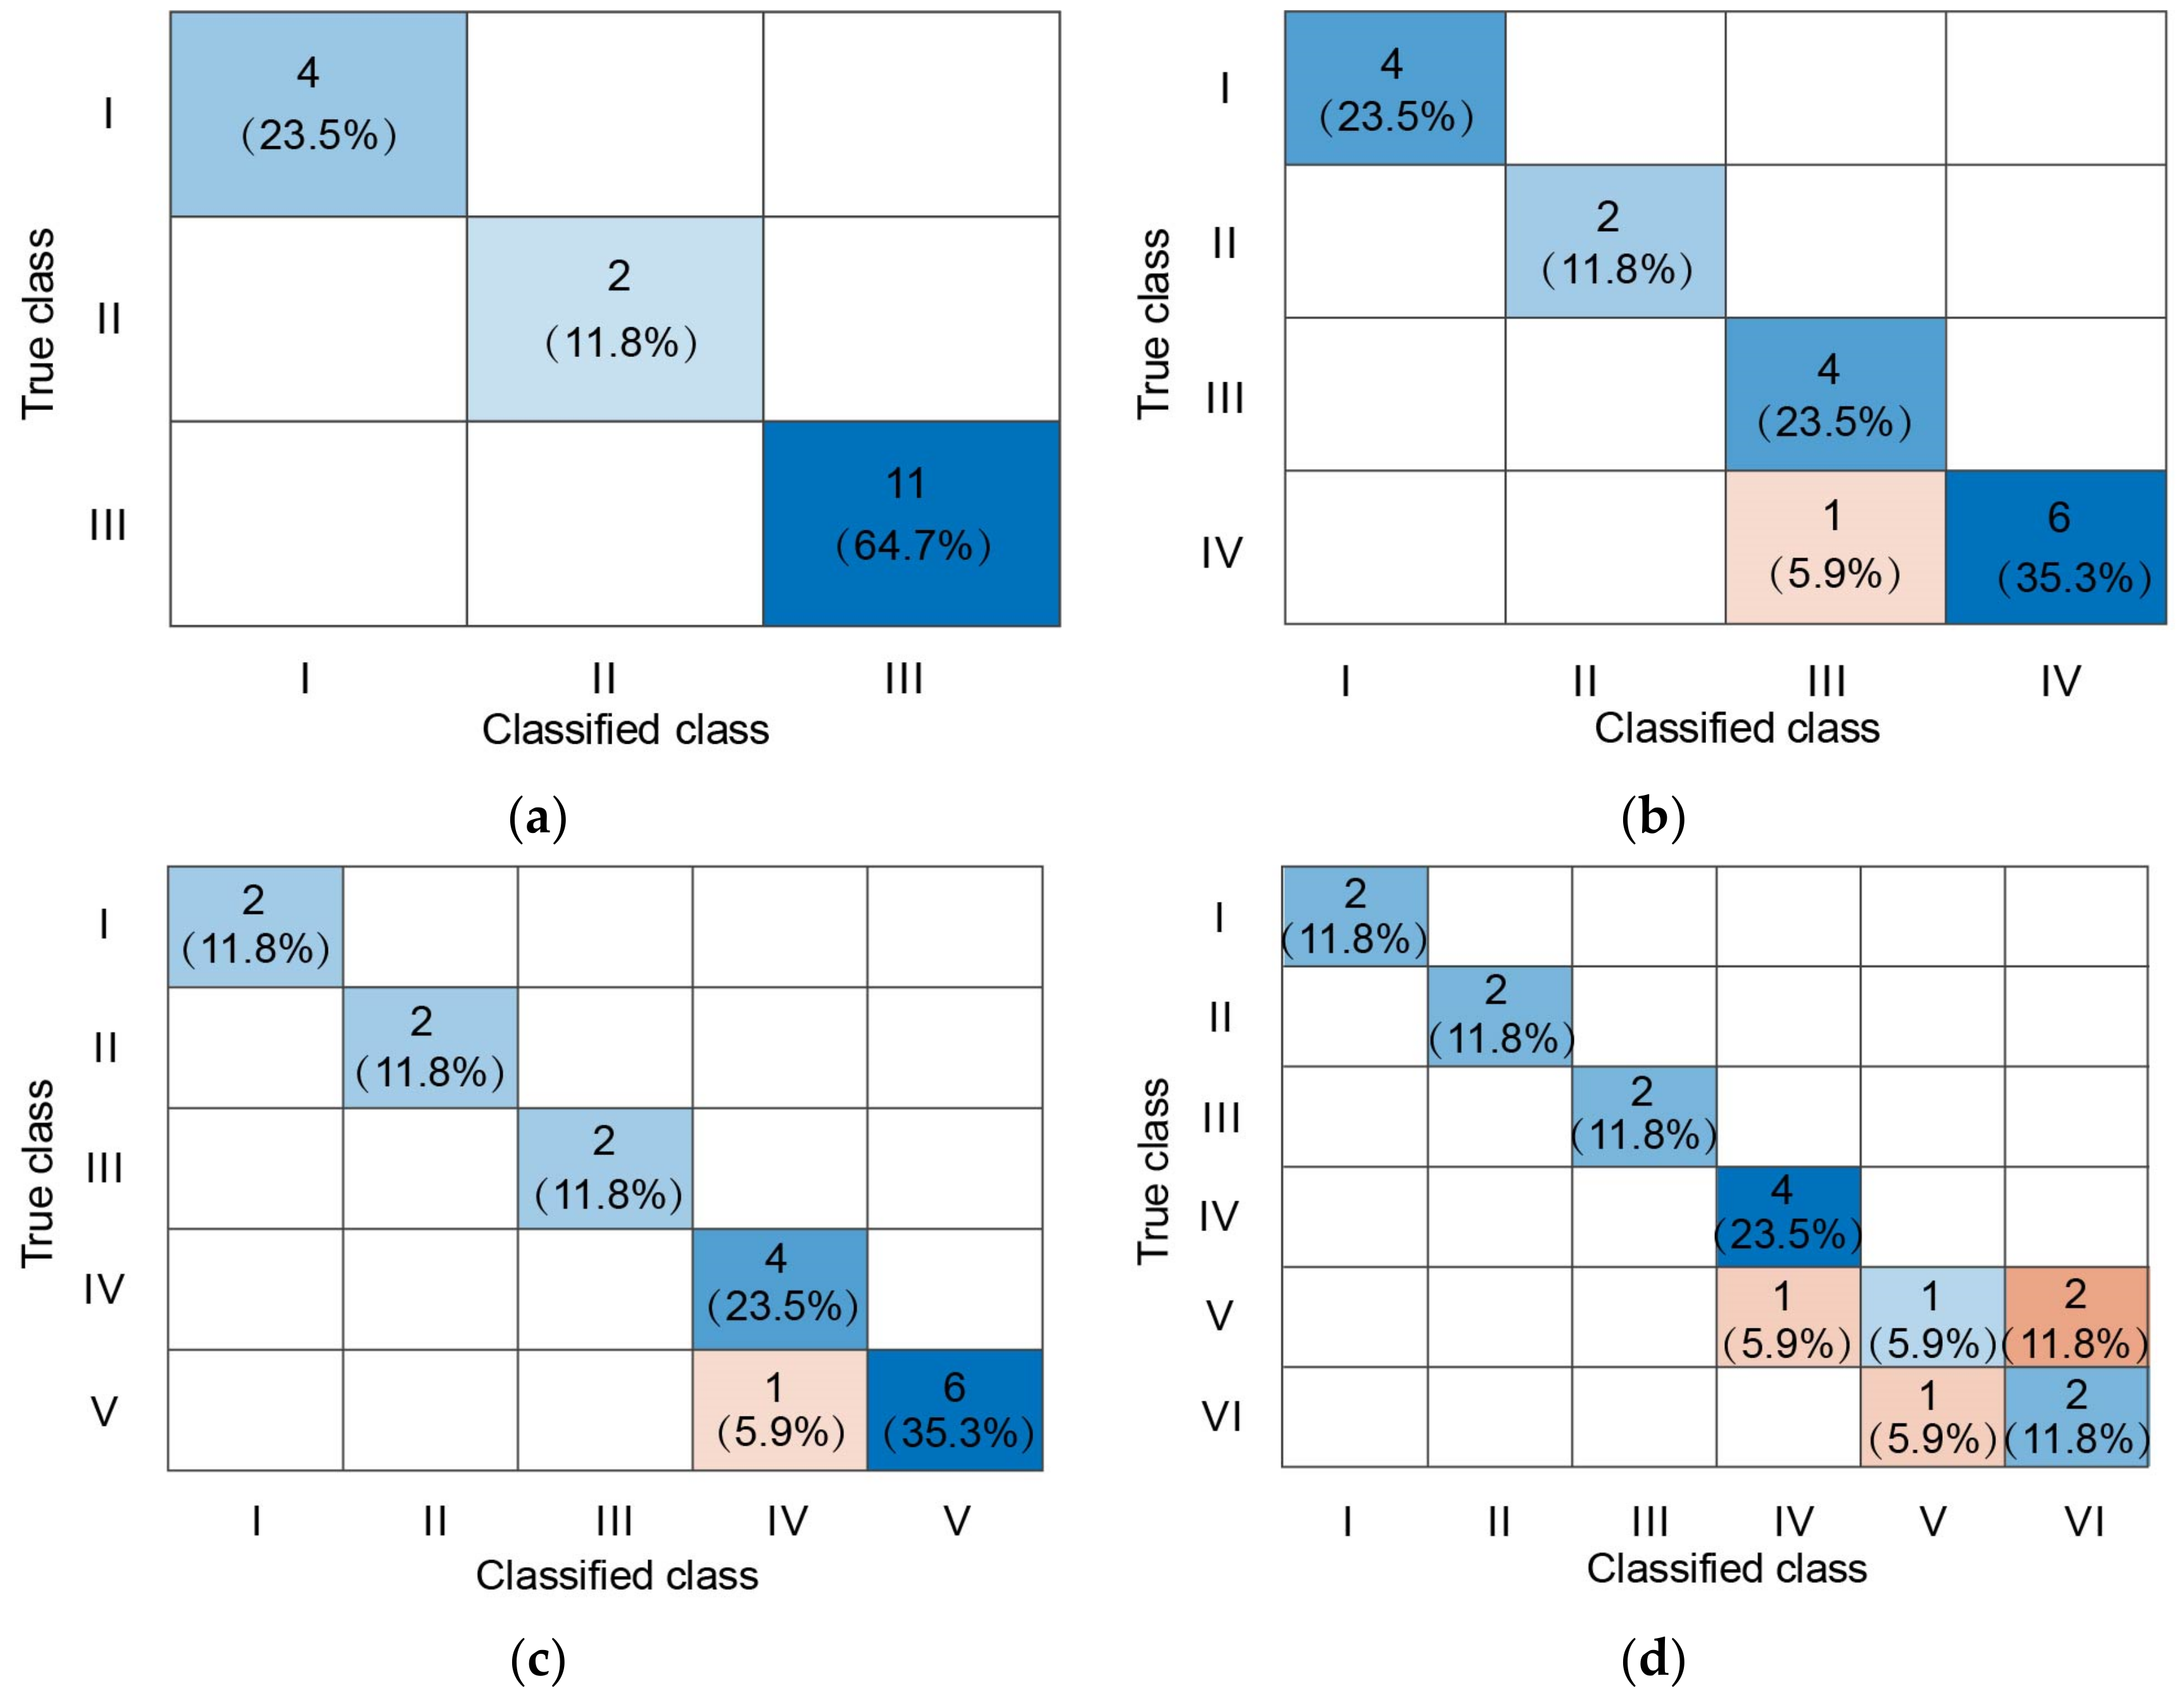
This paper proposes a classification method incorporating principal component analysis and clustering analysis to classify coal samples from different coal types. After PCA analysis, the derived first-three PCs are used to identify and classify undeformed coals and TDCs, and the K-means algorithm measuring the square of Euclidean distance is used for clustering analysis. Referring to the deformation environment and types of coal samples, we gradually define classification classes from three to six and perform classification operations accordingly. After each iteration of classification, we compute the related classification accuracy and confusion matrix to evaluate the classification results. The class definition and classification accuracy are shown in Table 6, and the classification confusion chart [58,59] is shown in Figure 9.
When defined as three classes, the classification accuracy of coal samples is 100%, as the class’s petrophysical parameters differ accountably. When defined as four classes, the classification accuracy of coal samples is preferably 94.1%. Classes I and II have no misclassification because their petrophysical parameters have accountable variation, but one sample of class IV was misclassified into class III. The misclassified sample belongs to Wrinkle coal, whose petrophysical parameters are close to class III. When defined as five classes, the classification accuracy of coal samples is favorably 94.1%. Classes I, II, and III have no misclassification, but one sample of class V was misclassified into class IV. The reason is the same as the four classes case. When defined as six classes, the classification accuracy of coal samples is unfavorably 76.5%. Classes I, II, and III have no misclassification, but classes IV, V, and VI have misclassifications. Three samples of class V have been misclassified into class IV (one sample) and VI (two samples), and one sample of class VI was misclassified into class V. The reason is that granulitic, porphyroclastic, mylonite, and wrinkle coal samples have similar petrophysical parameters, making it hard for the classification algorithm to distinguish between them.
As the previous paragraphs have shown, the proposed classification method incorporating principal component analysis and clustering analysis shows its potential ability to accurately classify undeformed coal and TDCs. For undeformed coal and weak-deformed TDCs, the proposed method can distinguish coal types accurately because of their accountable variations of petrophysical parameters. For the strong-deformed TDCs, the proposed method can only roughly classify the coal samples into two classes due to their similar petrophysical parameters. Namely, scaly and mylonite coals belong to one class, and granulitic, porphyroclastic, and wrinkle coals belong to another class.

4.4. Correlations between TDC Classifications and Deformation Environments

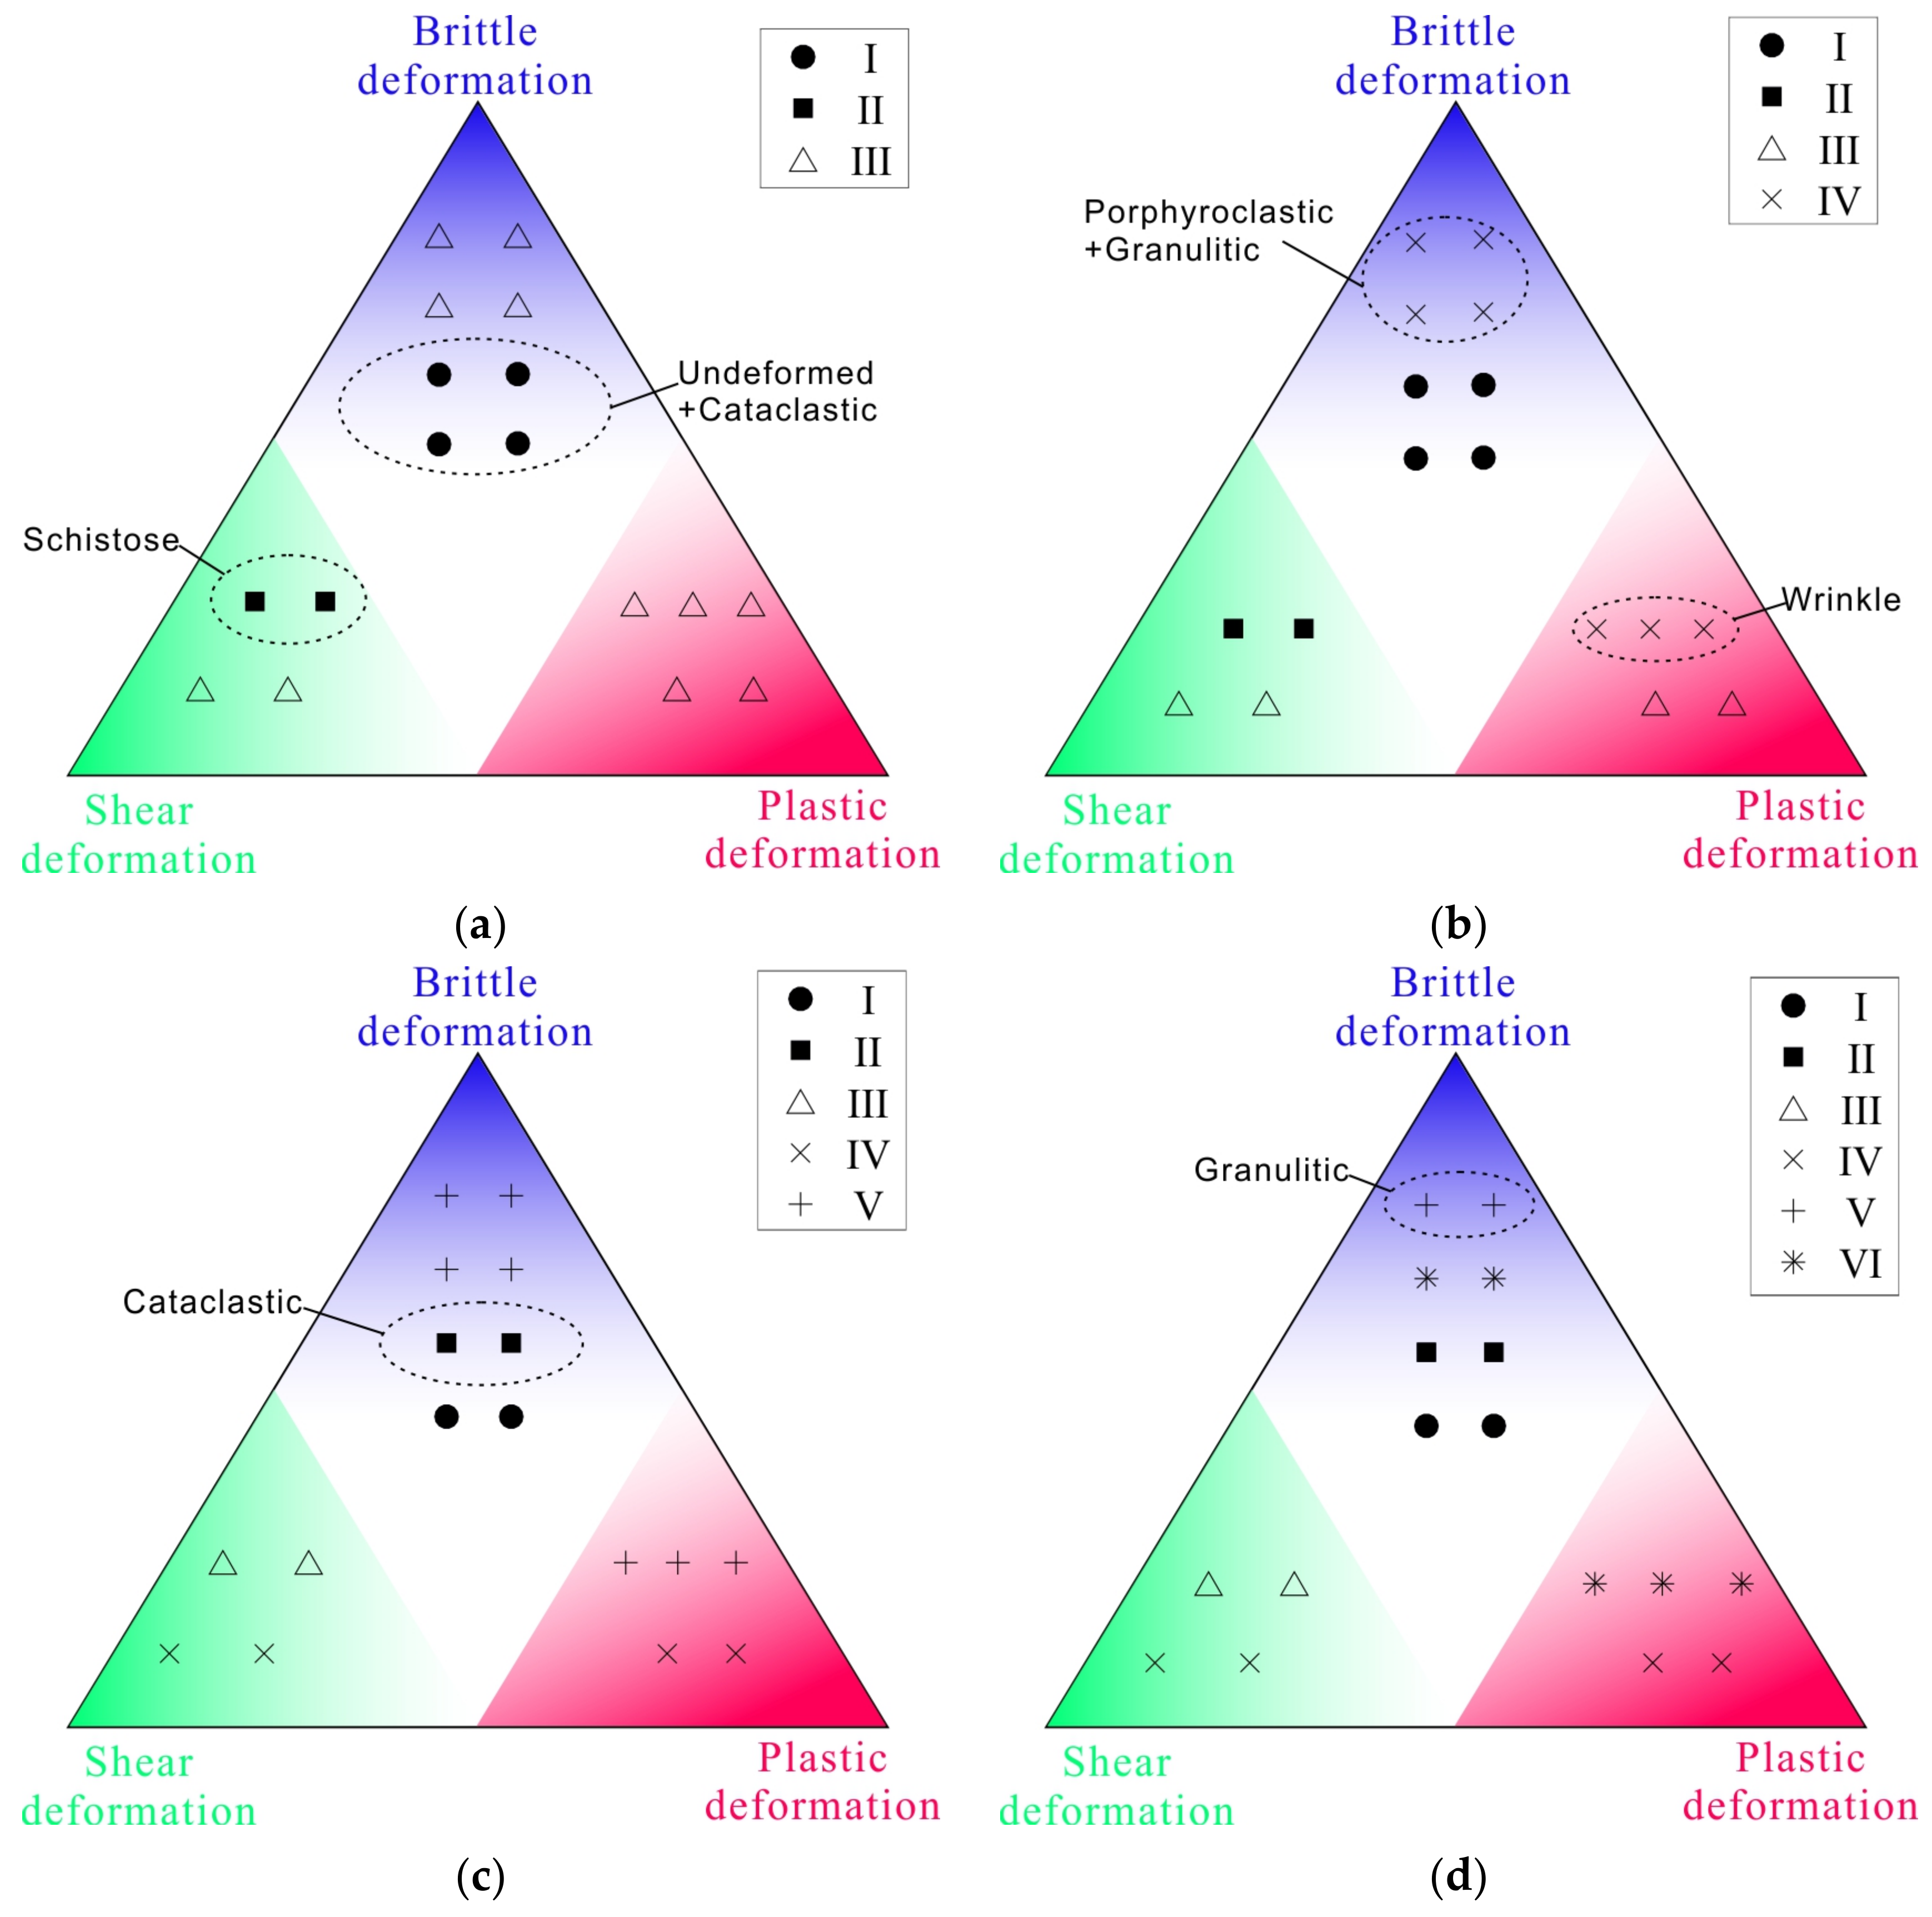
In Figure 2 of Section 2.2, based on the differences in deformation environments and strengths, the undeformed coal and seven TDCs are distributed in the corresponding positions. Therefore, all 17 coal samples in this research are also scattered in the corresponding positions. The classification confusion chart, as shown in Figure 9, only reflects the accuracy of the clustering results. To investigate the correspondence between the classification results and deformation environment types, the authors use different symbols to represent the clustering results of all classes. Moreover, the clustering results of 3–6 categories of principal components were superimposed onto the deformation environment and structure evolution diagram, as shown in Figure 10.
When defined as three classes, undeformed and cataclastic coals formed by slight extrusion and tensile stress and in a brittle deformation environment are identified first. The schistose coal was formed in a shear deformation environment where the coal body was cut into plates due to the shear stress, and dense tectonic fractures were produced in the dominant direction. These characteristics easily classify schistose coal, as shown in Figure 10a. When defined as four classes, porphyroclastic, granulitic, and wrinkle coals, which experienced strong brittle or ductile deformations, are separated. They can be distinguished from other coals in the same deformation environment, as shown in Figure 10b. When defined as five classes, the cataclastic coal formed in a weak and brittle deformation environment has sparsely developed fractures and can be distinguished from the undeformed coal, as shown in Figure 10c. The granulitic coal in the strong brittle deformation environment is also distinguished when defined as six classes. Moreover, its coal structure is strongly deformed with significant fissures and strong fragmentation, as shown in Figure 10d.
Through principal component cluster analysis, it is easier to distinguish different coal types formed under different deformation environments and the intensity of deformation. This method can accurately distinguish coal samples into at least five types and provide a theoretical basis for classifying coal deformation types using wireline logs and seismic data as input.
Based on the analyses above, several potential research directions may be inspired by this work. Firstly, TDCs are widely distributed in the producing coalbeds in countries such as China, Poland, Turkey, and Australia [6]. This classification schema can be a reference for distinguishing and classifying undeformed coal and TDCs in the future for these countries. Moreover, this work will be important for coal mining safety and coalbed methane production. Secondly, the factors that may affect the petrophysical parameters of coalbeds deserve further analysis and discussion. The influence factors include the original sedimentary depositional environment [60,61,62], the components of coal such as organic matter and mineral contents within the deposits [63,64,65], pore structure [12,18,66,67], and environmental factors [68] such as temperature and pressure. Discussing the relationship between these influencing factors and petrophysical parameters can help distinguish different TDCs and infer the depositional and tectonic information.

5. Conclusions

This paper measured and characterized the petrophysical parameters of coal samples collected from No.10 coal in the Huaibei coalfield. The main conclusions are as follows:
(1)
A total of 17 samples of full types of coal (undeformed coal and seven of TDCs) were collected from the Huaibei coalfield, and their petrophysical parameters, including velocities, VP/VS ratio, density, and impedances, were measured accordingly in the laboratory. The VP and VS of dry samples show a small frequency effect, and the experimental results of ultrasonic testing can be comparable to the results of the seismic frequency range. The research results can provide physical parameter guidance for the geophysical exploration of TDCs;
(2)
The scatter points of coal samples in the cross plots of VP vs. VS and IP vs. IS have the characteristics of regular partition distributions. Undeformed coal and weak-deformed TDCs have higher velocities/impedances, but strong-deformed TDCs have lower velocities/impedances. P-wave velocity and S-wave velocity show good correlation associations in both regions;
(3)
Undeformed coal and TDCs with different deformation types (brittle, shear, and plastic deformations) show significant differences in their petrophysical parameters, and one can differentiate them with cross-plot analysis. Instead of direct classification, this paper proposed a method incorporating principal component and cluster analysis to classify coal samples. The method can accurately distinguish coal samples into at least five types. From the clustering results, different deformation environments and the intensity of deformation can help distinguish different coal deformation types. It provides a theoretical basis for the classification of coal deformation types;
(4)
For the strong-deformed TDCs, the proposed method can only roughly classify the coal samples into two classes due to their similar petrophysical parameters. Namely, scaly and mylonite coals belong to one class, and granulitic, porphyroclastic, and wrinkle coals belong to another;
(5)
As coal mining in many parts of the world is gradually moving to structurally complex areas, the risks of TDC-related coal-and-gas outbursts occur increasingly. Therefore, this classification schema can be a reference for distinguishing and classifying undeformed coal and TDCs in the future. Moreover, this work will be important for coal mining safety and coalbed methane production.

Author Contributions

Conceptualization, X.S. and T.C.; methodology, T.C. and X.S.; software, X.S.; validation, D.Z.; formal analysis, T.C.; investigation, X.S. and T.C.; resources, T.C. and D.Z.; data curation, D.Z.; writing—original draft preparation, X.S. and T.C.; writing—review and editing, T.C.; visualization, X.S. All authors have read and agreed to the published version of the manuscript.

Funding

This research was funded by the National Key Research and Development Project of China, grant number 2021YFC2902003, and a project funded by the Key Cooperation Unit and Academician Workstation Project of the Hebei Provincial Department of Science and Technology.

Data Availability Statement

Not applicable.

Acknowledgments

The authors acknowledge the anonymous reviewers for their constructive suggestions.

Conflicts of Interest

The authors declare no conflict of interest.

References

  1. Jiang, B.; Ju, Y.W. Tectonic coal structure and its petrophysical features. Nat. Gas Ind. 2004, 24, 27–29. [Google Scholar]
  2. Frodsham, K.; Gayer, R.A. The impact of tectonic deformation upon coal seams in the South Wales coalfield, UK. Int. J. Coal Geol. 1999, 38, 297–332. [Google Scholar] [CrossRef]
  3. Schweinfurth, S.P. Coal: A complex natural resource: An overview of factors affecting coal quality and use in the United States. US Geol. Surv. Circ. 2002, 1–39. [Google Scholar] [CrossRef]
  4. Ju, Y.W.; Jiang, B.; Hou, Q.L.; Wang, G.L. New structure-genetic classification system in tectonically deformed coals and its geological significance. Meitan Xuebao/J. China Coal Soc. 2004, 29, 513. [Google Scholar]
  5. Draper, J.J.; Boreham, C.J. Geological controls on exploitable coal seam gas distribution in Queensland. Appea J. 2006, 46, 343–366. [Google Scholar] [CrossRef]
  6. Cheng, Y.; Pan, Z. Reservoir properties of Chinese tectonic coal: A review. Fuel 2020, 260, 116350. [Google Scholar] [CrossRef]
  7. Lu, J.; Wang, Y.; Chen, J.Y. Detection of Tectonically Deformed Coal Using Model-Based Joint Inversion of Multi-Component Seismic Data. Energies 2018, 11, 17. [Google Scholar] [CrossRef]
  8. Chen, L. Effects of tectonic stress environment on tectonophysical features of deformed coal. Int. J. Green Energy 2019, 16, 185–199. [Google Scholar] [CrossRef]
  9. Jiang, B.; Qu, Z.; Wang, G.G.X.; Li, M. Effects of structural deformation on formation of coalbed methane reservoirs in Huaibei coalfield, China. Int. J. Coal Geol. 2010, 82, 175–183. [Google Scholar] [CrossRef]
  10. Qu, Z.; Wang, G.G.X.; Jiang, B.; Rudolph, V.; Dou, X.; Li, M. Experimental Study on the Porous Structure and Compressibility of Tectonized Coals. Energy Fuels 2010, 24, 2964–2973. [Google Scholar] [CrossRef]
  11. Pan, Z.; Connell, L.D. Modelling of anisotropic coal swelling and its impact on permeability behaviour for primary and enhanced coalbed methane recovery. Int. J. Coal Geol. 2011, 85, 257–267. [Google Scholar] [CrossRef]
  12. Song, Y.; Jiang, B.; Li, M.; Hou, C.; Xu, S. A review on pore-fractures in tectonically deformed coals. Fuel 2020, 278, 118248. [Google Scholar] [CrossRef]
  13. Song, Y.; Jiang, B.; Han, Y. Macromolecular response to tectonic deformation in low-rank tectonically deformed coals (TDCs). Fuel 2018, 219, 279–287. [Google Scholar] [CrossRef]
  14. Jiang, B.; Qin, Y.; Ju, Y.W.; Wang, J.Y. Research on tectonic stress field of generate and reservoir of coalbed methane. Zhongguo Kuangye Daxue Xuebao/J. China Univ. Min. Technol. 2005, 34, 564–569. [Google Scholar]
  15. Meng, Z.; Zhang, J.; Wang, R. In-situ stress, pore pressure and stress-dependent permeability in the Southern Qinshui Basin. Int. J. Rock Mech. Min. Sci. 2011, 48, 122–131. [Google Scholar] [CrossRef]
  16. Mosher, K.; He, J.; Liu, Y.; Rupp, E.; Wilcox, J. Molecular simulation of methane adsorption in micro- and mesoporous carbons with applications to coal and gas shale systems. Int. J. Coal Geol. 2013, 109–110, 36–44. [Google Scholar] [CrossRef]
  17. Li, W.; Jiang, B.; Zhu, Y.-M. Impact of tectonic deformation on coal methane adsorption capacity. Adsorpt. Sci. Technol. 2019, 37, 698–708. [Google Scholar] [CrossRef] [Green Version]
  18. Lu, G.; Wei, C.; Wang, J.; Meng, R.; Soh Tamehe, L. Influence of pore structure and surface free energy on the contents of adsorbed and free methane in tectonically deformed coal. Fuel 2021, 285, 119087. [Google Scholar] [CrossRef]
  19. Pan, J.; Zhu, H.; Hou, Q.; Wang, H.; Wang, S. Macromolecular and pore structures of Chinese tectonically deformed coal studied by atomic force microscopy. Fuel 2015, 139, 94–101. [Google Scholar] [CrossRef]
  20. Fengli, L.; Bo, J.; Guoxi, C.; Yu, S.; Zheng, T. Structural and evolutionary characteristics of pores-microfractures and their influence on coalbed methane exploitation in high-rank brittle tectonically deformed coals of the Yangquan mining area, northeastern Qinshui basin, China. J. Pet. Sci. Eng. 2019, 174, 1290–1302. [Google Scholar] [CrossRef]
  21. Cheng, G.; Jiang, B.; Li, M.; Li, F.; Song, Y. Effects of pore-fracture structure of ductile tectonically deformed coals on their permeability: An experimental study based on raw coal cores. J. Pet. Sci. Eng. 2020, 193, 107371. [Google Scholar] [CrossRef]
  22. Ren, J.; Song, Z.; Li, B.; Liu, J.; Lv, R.; Liu, G. Structure feature and evolution mechanism of pores in different metamorphism and deformation coals. Fuel 2021, 283, 119292. [Google Scholar] [CrossRef]
  23. Hou, X.; Zhou, X.; Pan, J. Similar Material Proportioning and Preparation of Ductile Surrounding Rocks for Simulating In Situ Coalbed methane Production from Tectonically Deformed Coals. Rock Mech. Rock Eng. 2022, 55, 5377–5392. [Google Scholar] [CrossRef]
  24. Avseth, P.; Mukerji, T.; Mavko, G. Quantitative Seismic Interpretation: Applying Rock Physics Tools to Reduce Interpretation Risk; Cambridge University Press: Cambridge, UK; New York, NY, USA, 2005. [Google Scholar]
  25. Mavko, G.; Mukerji, T.; Dvorkin, J. The Rock Physics Handbook: Tools for Seismic Analysis of Porous Media; Cambridge University Press: Cambridge, UK, 2009. [Google Scholar]
  26. Bosch, M.; Mukerji, T.; Gonzalez, E.F. Seismic inversion for reservoir properties combining statistical rock physics and geostatistics: A review. Geophysics 2010, 75, A165–A176. [Google Scholar] [CrossRef] [Green Version]
  27. Li, H.; Lin, B.; Yang, W.; Zheng, C.; Hong, Y.; Gao, Y.; Liu, T.; Wu, S. Experimental study on the petrophysical variation of different rank coals with microwave treatment. Int. J. Coal Geol. 2016, 154–155, 82–91. [Google Scholar] [CrossRef]
  28. Li, J.J.; Pan, D.M.; Cui, R.F.; Ding, E.J.; Zhang, W.; Hu, M.S. Prediction of tectonically deformed coal based on lithologic seismic information. J. Geophys. Eng. 2016, 13, 116–122. [Google Scholar] [CrossRef]
  29. Wang, Y.; Liu, D.; Cai, Y.; Li, X. Variation of petrophysical properties and adsorption capacity in different rank coals: An experimental study of coals from the Junggar, Ordos and Qinshui Basins in China. Energies 2019, 12, 986. [Google Scholar] [CrossRef] [Green Version]
  30. Jia, Q.; Liu, D.; Cai, Y.; Fang, X.; Li, L. Petrophysics characteristics of coalbed methane reservoir: A comprehensive review. Front. Earth Sci. 2021, 15, 202–223. [Google Scholar] [CrossRef]
  31. Li, Q.; Zhao, D.; Yin, J.; Zhou, X.; Li, Y.; Chi, P.; Han, Y.; Ansari, U.; Cheng, Y. Sediment Instability Caused by Gas Production from Hydrate-bearing Sediment in Northern South China Sea by Horizontal Wellbore: Evolution and Mechanism. Nat. Resour. Res. 2023, 32, 1595–1620. [Google Scholar] [CrossRef]
  32. Wang, F.; Liu, X.; Jiang, B.; Zhuo, H.; Chen, W.; Chen, Y.; Li, X. Low-loading Pt nanoparticles combined with the atomically dispersed FeN4 sites supported by FeSA-N-C for improved activity and stability towards oxygen reduction reaction/hydrogen evolution reaction in acid and alkaline media. J. Colloid Interface Sci. 2023, 635, 514–523. [Google Scholar] [CrossRef]
  33. Li, Q.; Zhang, C.; Yang, Y.; Ansari, U.; Han, Y.; Li, X.; Cheng, Y. Preliminary experimental investigation on long-term fracture conductivity for evaluating the feasibility and efficiency of fracturing operation in offshore hydrate-bearing sediments. Ocean. Eng. 2023, 281, 114949. [Google Scholar] [CrossRef]
  34. Morcote, A.; Mavko, G.; Prasad, M. Dynamic elastic properties of coal. Geophysics 2010, 75, E227–E234. [Google Scholar] [CrossRef]
  35. Lwin, M.J. The effect of different gases on the ultrasonic response of coal. Geophysics 2011, 76, E155–E163. [Google Scholar] [CrossRef]
  36. Wang, Y.; Xu, X.; Yang, D. Ultrasonic elastic characteristics of five kinds of metamorphic deformed coals under room temperature and pressure conditions. Sci. China Earth Sci. 2014, 57, 2208–2216. [Google Scholar] [CrossRef]
  37. Wu, H.; Dong, S.; Li, D.; Huang, Y.; Qi, X. Experimental study on dynamic elastic parameters of coal samples. Int. J. Min. Sci. Technol. 2015, 25, 447–452. [Google Scholar] [CrossRef]
  38. Chen, H.; Jiang, B.; Chen, T.; Xu, S.; Zhu, G. Experimental study on ultrasonic velocity and anisotropy of tectonically deformed coal. Int. J. Coal Geol. 2017, 179, 242–252. [Google Scholar] [CrossRef]
  39. Cai, W.; Dou, L.M.; Cao, A.Y.; Gong, S.Y.; Li, Z.L. Application of seismic velocity tomography in underground coal mines: A case study of Yima mining area, Henan, China. J. Appl. Geophys. 2014, 109, 140–149. [Google Scholar] [CrossRef]
  40. Barrash, W.; Morin, R.H. Recognition of units in coarse, unconsolidated braided-stream deposits from geophysical log data with principal components analysis. Geology 1997, 25, 687–690. [Google Scholar] [CrossRef]
  41. Ren, P.; Xu, H.; Tang, D.; Li, Y.; Sun, C.; Tao, S.; Li, S.; Xin, F.; Cao, L. The identification of coal texture in different rank coal reservoirs by using geophysical logging data in northwest Guizhou, China: Investigation by principal component analysis. Fuel 2018, 230, 258–265. [Google Scholar] [CrossRef]
  42. Li, W.; Chen, T.; Song, X.; Gong, T.; Liu, M. Reconstruction of critical coalbed methane logs with principal component regression model: A case study. Energy Explor. Exploit. 2020, 38, 1178–1193. [Google Scholar] [CrossRef] [Green Version]
  43. Liu, H.; Liu, J.; Xue, S.; Zhang, K.; Xu, H.; Fang, H.; Jia, J. Insight into difference in high-pressure adsorption-desorption of CO2 and CH4 from low permeability coal seam of Huainan-Huaibei coalfield, China. J. Environ. Chem. Eng. 2022, 10, 108846. [Google Scholar] [CrossRef]
  44. Li, Y.; Jiang, B.; Qu, Z. Controls on migration and aggregation for tectonically sensitive elements in tectonically deformed coal: An example from the Haizi mine, Huaibei coalfield, China. Sci. China Earth Sci. 2014, 57, 1180–1191. [Google Scholar] [CrossRef]
  45. Lu, G.; Wei, C.; Wang, J.; Zhang, J.; Quan, F.; Tamehe, L.S. Variation of surface free energy in the process of methane adsorption in the nanopores of tectonically deformed coals: A case study of middle-rank tectonically deformed coals in the huaibei coalfield. Energy Fuels 2019, 33, 7155–7165. [Google Scholar] [CrossRef]
  46. Dong, J.; Cheng, Y.-P.; Chang, T.-Y.; Zhang, J.-J.; Guo, S.-F. Coal mine methane control cost and full cost: The case of the Luling Coal Mine, Huaibei coalfield, China. J. Nat. Gas Sci. Eng. 2015, 26, 290–302. [Google Scholar] [CrossRef]
  47. Zheng, L.; Liu, G.; Wang, L.; Chou, C.-L. Composition and quality of coals in the Huaibei Coalfield, Anhui, China. J. Geochem. Explor. 2008, 97, 59–68. [Google Scholar] [CrossRef]
  48. Zheng, L.; Liu, G.; Qi, C.; Zhang, Y.; Wong, M. The use of sequential extraction to determine the distribution and modes of occurrence of mercury in Permian Huaibei coal, Anhui Province, China. Int. J. Coal Geol. 2008, 73, 139–155. [Google Scholar] [CrossRef]
  49. GB482-1995; Sampling of Coal in Seam. China State Bureau of Technical Supervision: Beijing, China, 1995.
  50. Birch, F. The velocity of compressional waves in rocks to 10 kilobars: 1. J. Geophys. Res. (1896–1977) 1960, 65, 1083–1102. [Google Scholar] [CrossRef]
  51. Greenhalgh, S.A.; Emerson, D.W. Elastic Properties of Coal Measure Rocks New South Wales. Explor. Geophys. 1986, 17, 157–163. [Google Scholar] [CrossRef]
  52. Tatham, R.H. Vp Vs and lithology. Geophysics 1982, 47, 336–344. [Google Scholar] [CrossRef]
  53. Dumitrescu, C.C.; Lines, L. Heavy oil reservoir characterization using Vp/Vs ratios from multicomponent data. In Proceedings of the 69th EAGE Conference and Exhibition Incorporating SPE EUROPEC, London, UK, 11–14 June 2007. [Google Scholar]
  54. Bhowmick, S. Role of Vp/Vs and Poisson’s Ratio in the Assessment of Foundation(s) for Important Civil Structure(s). Geotech. Geol. Eng. 2017, 35, 527–534. [Google Scholar] [CrossRef]
  55. Li, Y.; Grevemeyer, I.; Huang, H.; Qiu, X.; Murray-Bergquist, L. Crustal Compositional Variations From Continental to Oceanic Domain: A VP/VS Ratio Study Across the Zhongsha Block, South China Sea. J. Geophys. Res. Solid Earth 2022, 127, e2021JB023470. [Google Scholar] [CrossRef]
  56. Yuan, Y.; Liu, Y.; Zhang, J.; Wei, X.; Chen, T. Reservoir prediction using multi-wave seismic attributes. Earthq. Sci. 2011, 24, 373–389. [Google Scholar] [CrossRef] [Green Version]
  57. Huang, B.; Xu, R.; Fu, C.; Wang, Y.; Wang, L. Thief Zone Assessment in Sandstone Reservoirs Based on Multi-Layer Weighted Principal Component Analysis. Energies 2018, 11, 1274. [Google Scholar] [CrossRef] [Green Version]
  58. Machart, P.; Ralaivola, L. Confusion Matrix Stability Bounds for Multiclass Classification. Comput. Sci. 2012. [Google Scholar] [CrossRef]
  59. Deng, X.; Liu, Q.; Deng, Y.; Mahadevan, S. An improved method to construct basic probability assignment based on the confusion matrix for classification problem. Inf. Sci. 2016, 340–341, 250–261. [Google Scholar] [CrossRef]
  60. Kalkreuth, W.D.; Marchioni, D.L.; Calder, J.H.; Lamberson, M.N.; Naylor, R.D.; Paul, J. The relationship between coal petrography and depositional environments from selected coal basins in Canada. Int. J. Coal Geol. 1991, 19, 21–76. [Google Scholar] [CrossRef]
  61. Wang, K.; Pang, X.; Zhang, H.; Hu, T.; Xu, T.; Zheng, T.; Zhang, X. Organic geochemical and petrophysical characteristics of saline lacustrine shale in the Dongpu Depression, Bohai Bay Basin, China: Implications for Es3 hydrocarbon exploration. J. Pet. Sci. Eng. 2020, 184, 106546. [Google Scholar] [CrossRef]
  62. Burton, Z.F.M.; McHargue, T.; Kremer, C.H.; Bloch, R.B.; Gooley, J.T.; Jaikla, C.; Harrington, J.; Graham, S.A. Peak Cenozoic warmth enabled deep-sea sand deposition. Sci. Rep. 2023, 13, 1276. [Google Scholar] [CrossRef]
  63. Radke, M.; Schaefer, R.G.; Leythaeuser, D.; Teichmüller, M. Composition of soluble organic matter in coals: Relation to rank and liptinite fluorescence. Geochim. Cosmochim. Acta 1980, 44, 1787–1800. [Google Scholar] [CrossRef]
  64. Cook, A.C.; Sherwood, N.R. Classification of oil shales, coals and other organic-rich rocks. Org. Geochem. 1991, 17, 211–222. [Google Scholar] [CrossRef]
  65. Burton, Z.F.M. Sediment Organic Contents Required for Gas Hydrate Formation: A Survey of Published Basin and Hydrocarbon System Models. Fuels 2022, 3, 580–587. [Google Scholar] [CrossRef]
  66. Song, W.; Yao, J.; Li, Y.; Yang, Y.; Sun, H. New pore size distribution calculation model based on chord length and digital image. J. Nat. Gas Sci. Eng. 2017, 48, 111–118. [Google Scholar] [CrossRef]
  67. Hou, S.; Wang, X.; Wang, X.; Yuan, Y.; Pan, S.; Wang, X. Pore structure characterizeation of low volatile bituminous coals with different particle size and tectonic deformation using low pressure gas adsorption. Int. J. Coal Geol. 2017, 183, 13. [Google Scholar] [CrossRef]
  68. Wang, Z. Fundamentals of seismic rock physics. Geophysics 2001, 66, 398–412. [Google Scholar] [CrossRef]
Figure 1. Plan view map of the regional tectonic conditions and the study area [1].
Energies 16 05179 g001
Figure 2. Sketch map of deformation environment and structure evolution of TDCs.
Energies 16 05179 g002
Figure 3. Photos of different types of TDCs: (a) undeformed coal; (b) cataclastic coal; (c) porphyroclastic coal; (d) granulitic coal; (e) schistose coal; (f) scaly coal; (g) wrinkle coal; and (h) mylonitic coal.
Energies 16 05179 g003
Figure 4. Ultrasonic testing equipment: (a) sketch of ultrasonic testing equipment and (b) transmitting and receiving transducers mounted on a coal core.
Energies 16 05179 g004
Figure 5. Boxplot of measured petrophysical parameters.
Energies 16 05179 g005
Figure 6. Cross plots of VP vs. VS (a) and IP vs. IS (b) for undeformed coal and TDCs.
Energies 16 05179 g006
Figure 7. Cross plots of VP/VS vs. VP (a) and VP/VS vs. IP (b) for undeformed coal and TDCs.
Energies 16 05179 g007
Figure 8. Three-dimensional cross-plots of the PCs (a) and VP vs. VS vs. Density (b) for undeformed coal and TDCs.
Energies 16 05179 g008
Figure 9. Classification confusion chart when defining coal samples as (a) three classes, (b) four classes, (c) five classes, and (d) six classes.
Energies 16 05179 g009
Figure 10. Classification results when defining coal samples as (a) three classes, (b) four classes, (c) five classes, and (d) six classes.
Energies 16 05179 g010
Table 1. Classification of coal samples for testing in this study.
CoalmineDeformation OrderMain DeformationCoal TypeMeasurable Cores
LulingUndeformedPrimaryUndeformed coal2
Brittle deformationBrittle deformation environmentCataclastic coal2
ZhuxianzhuangPorphyroclastic coal2
Granulitic coal2
Shear deformation environmentSchistose coal2
Brittle–ductile deformationScaly coal2
Ductile deformationPlastic deformation environmentWrinkle coal3
Mylonitic coal2
Table 2. Tested elastic parameters of coal cores in the lab.
No.TDC TypeVP
(km/s)
VS
(km/s)
VP/VS
Ratio
Density
(g/cm3)
IP
(g/cm3)(km/s)
IS
(g/cm3)(km/s)
1Underformed2.371.501.581.293.131.98
2Underformed2.401.531.561.343.212.05
3Cataclastic2.361.471.571.323.081.92
4Cataclastic2.351.461.611.303.031.88
5Porphyroclasticic1.000.671.511.331.400.93
6Porphyroclastic1.090.711.531.301.531.00
7Granulitic1.090.691.591.301.500.95
8Granulitic0.980.611.601.291.340.84
9Schistose2.261.301.731.303.201.84
10Schistose2.311.321.751.303.271.88
11Scaly1.360.871.561.401.901.22
12Scaly1.300.781.671.401.801.08
13Wrinkle1.050.651.611.381.470.91
14Wrinkle1.190.771.551.411.711.10
15Wrinkle1.080.701.531.401.531.00
16Mylonitic1.240.791.581.401.821.16
17Mylonitic1.240.781.591.401.801.14
Table 3. Correlation coefficient matrix among petrophysical parameters.
CorrelationVPVSVP/VSdenIpIs
VP1.00
VS0.991.00
VP/VS0.450.351.00
den−0.63−0.670.031.00
Ip0.990.980.50−0.551.00
Is1.000.990.40−0.590.991.00
Table 4. Characteristic value and the variance contribution rate of PCs.
PCsEigenvaluesVariance Contributions (%)Cumulative Contributions (%)
PC14.58976.4876.48
PC21.05017.4993.98
PC30.3606.0099.98
PC40.0010.0299.99
PC53.41 × 10−40.01100.00
PC61.32 × 10−70.00100.00
Table 5. Component contribution matrix of PCs.
ParametersPC1PC2PC3PC4PC5PC6
VP0.470.010.120.300.65−0.51
VS0.46−0.090.17−0.600.330.53
VP/VS0.220.80−0.54−0.12−0.020.00
Density−0.310.580.74−0.050.110.00
IP0.460.100.200.65−0.290.48
IS0.46−0.010.27−0.33−0.61−0.48
Table 6. Class definition and classification results for coal samples.
ClassesClass DefinitionDeformation EnvironmentAccuracy
3I Undeformed, Cataclastic
II Schistose
III Scaly, Mylonitic, Granulitic, Porphyroclastic, Wrinkle
Primary and brittle
Shear
Brittle, shear, and plastic
100%
4I Undeformed, Cataclastic
II Schistose
III Scaly, Mylonitic
IV Granulitic, Porphyroclastic, Wrinkle
Primary and brittle
Shear
Shear and plastic
Brittle and plastic
94.1%
5I Undeformed
II Cataclastic
III Schistose
IV Scaly, Mylonitic
V Granulitic, Porphyroclastic, Wrinkle
Primary
Brittle
Shear
Shear and plastic
Brittle and plastic
94.1%
6I Undeformed
II Cataclastic
III Schistose
IV Scaly, Mylonitic
V Granulitic
VI Porphyroclastic, Wrinkle
Primary
Brittle
Shear
Shear and plastic
Brittle
Brittle and plastic
76.5%
Disclaimer/Publisher’s Note: The statements, opinions and data contained in all publications are solely those of the individual author(s) and contributor(s) and not of MDPI and/or the editor(s). MDPI and/or the editor(s) disclaim responsibility for any injury to people or property resulting from any ideas, methods, instructions or products referred to in the content.