Article

Investigation of Heat Transfer and Pressure Drop for R744 in a Horizontal Smooth Tube of R744/R404A Hybrid Cascade Refrigeration System—Part 2: Low-Temperature Region

Department of Refrigeration and Air-Conditioning Engineering, College of Engineering, Chonnam National University, 50, Daehak-ro, Yeosu, Jeonnam 59626, Republic of Korea
Energies 2023, 16(13), 5108; https://doi.org/10.3390/en16135108
Submission received: 8 June 2023 / Revised: 25 June 2023 / Accepted: 28 June 2023 / Published: 2 July 2023
(This article belongs to the Special Issue Heat Transfer Characteristics and Two-Phase Flow Performance)

Abstract

:
This paper studies the evaporative heat transfer characteristics of R744 at low temperatures in a horizontal smooth tube as a cascade refrigeration system (CRS) among hybrid cascade refrigeration systems (HCRSs). There is a lack of research on the low-temperature evaporative heat transfer characteristics of R744 under the operating conditions of evaporators used in actual CRSs used in supermarkets. Therefore, this study aims to provide basic data on the evaporative heat transfer characteristics of R744 in the evaporators of refrigerators used in supermarkets. The tube used in the evaporation experiment conducted herein was a smooth horizontal copper tube with an inner diameter and length of 11.46 mm and 8000 mm, respectively. The experimental parameters were as follows: heat fluxes of 11.8–21.3 kW/m2, mass fluxes of 76.3–175.1 kg/(m2·s), and saturation temperatures of −49.8–−30.2 °C. The main results are summarized as follows: the evaporative heat transfer coefficient of R744 can be predicted well by using the correlation formula of Chen at the evaporation temperature of −40 °C in the CRS.

1. Introduction

Global warming resulting from ozone layer depletion caused by the use of hydrofluorocarbon (HFC) refrigerants is a major concern worldwide. To solve this problem, many researchers have focused on the development of environmentally friendly refrigerants. For instance, a few researchers [1,2,3,4,5,6] have investigated natural refrigerants such as hydrocarbons (HCs), carbon dioxide (R744, CO2; R744 hereinafter), and ammonia (NH3) as promising candidates. These natural refrigerants have an ozone depletion potential (ODP) of 0, and most of them have a global warming potential (GWP) of 0 as well. Unlike other natural refrigerants, R744 offers advantages such as non-toxicity, non-flammability, and economic feasibility. In addition to these advantages, R744 offers several other advantages over conventional refrigerants owing to its high volumetric capacity for refrigerants (VCR), which can reduce the system size. The R744 refrigeration system has a wide range of applications, and R744 has recently been used as the working fluid in micro-coolers (for CPUs). Moreover, R744 is used in low-temperature freezing and refrigeration systems, and its scope of application is being expanded to the R744/R404A cascade refrigeration system (CRS) [7,8,9] or indirect refrigeration system (IRS) [10,11,12,13,14] by using it as a secondary refrigerant in supermarkets. Furthermore, the evaporative heat transfer characteristics of R744 in the evaporators used in such refrigeration systems are being researched actively. In particular, studies on low-temperature (below −30 °C) evaporative heat transfer characteristics, such as those of evaporators of CRSs using R744 as a low-temperature refrigerant, are as follows.
Hassan and Shedid [15] used seamless precision steel tubes with outer diameters of 4 mm and 10 mm and a length of 1.12 m in an experiment conducted under the mass fluxes of 90–125 kg/(m2∙s), heat fluxes of 5.0–16.5 kW/m2, saturation temperatures of −35–−10 °C, and oil concentrations of 0.2–7.0%. They reported that the greatest change in the heat transfer coefficient occurred at higher heat fluxes, higher oil concentrations, and high quality, and no improvement in heat transfer coefficient was observed at any oil concentration. Zhao and Bansal [16] conducted experiments under the saturation temperatures of −29.9–−28.6 °C, mass fluxes of 139.5–230.9 kg/(m2∙s), and heat fluxes of 12.6–19.3 kW/m2 by using stainless steel tubes with an outer diameter of 6.35 mm, inner diameter of 4.57 mm, and length of 4.5 m. Their results indicated that the evaporative heat transfer coefficient of R744 decreased in the low-temperature region owing to high surface tension, but it increased as the vapor quality increased until dry-out, which was contrary to the trend observed at the high temperature of approximately 0 °C. Bansal and Zhao [17] conducted an R744 evaporative heat transfer experiment in the low temperature range of −40–−24.3 °C by using a stainless steel tube with an inner diameter of 4.57 mm and a length of 4.5 m. According to their results, the heat transfer coefficient decreased as the evaporation temperature decreased under constant heat and mass fluxes. Moreover, the heat transfer coefficient increased as the heat flux increased, and it increased slightly as the mass flux increased. Therefore, they reported that the influence of mass flux on the heat transfer coefficient was insignificant. Park and Hrnjak [18] used R744 refrigerant in a horizontal smooth copper tube with an outer diameter of 9.6 mm, inner diameter of 6.1 mm, and a length of 150 mm. The experiment was conducted under the following conditions: evaporation temperatures of −30 °C and −15 °C, mass fluxes of 100–400 kg/(m2∙s), and heat fluxes of 5–15 kW/m2. Their results indicated that the heat transfer coefficient decreased as the mass flux increased in the low-vapor-quality region, and the heat transfer coefficient decreased as the evaporation temperature decreased. In addition, under the mass flux conditions of 200 kg/(m2∙s) and 400 kg/(m2∙s), the heat transfer coefficient increased up to the high-vapor-quality region of 0.8, and dry-out did not occur. Wu et al. [19] used a horizontal stainless steel tube with an inner diameter of 1.42 mm and a length of 0.3 m as a test section to perform stepwise scanning of vapor quality over the entire two-phase region. To determine the characteristics of heat transfer and pressure drop according to the vapor quality in the tube, they varied the mass flux between 300 and 600 kg/(m2∙s), heat flux between 7.5 and 29.8 kW/m2, and saturation temperature between −40 and 0 °C. Fang et al. [20] compared and reviewed the existing correlations for the flow boiling heat transfer coefficient of R744. In total, 34 correlations were analyzed and evaluated using 2956 experimental data points related to the flow boiling heat transfer of R744 obtained from 10 independent laboratories. Yoon et al. [21] experimentally investigated the evaporative heat transfer coefficient of R744 at the low temperatures of −30–−20 °C in a horizontal smooth tube. The inner and outer diameters of the test section were 8 mm and 9.52 mm, respectively, and the experiment was conducted at the mass fluxes of 100–300 kg/(m2∙s) and saturation temperatures of −30–−20 °C. Liang et al. [22] studied the heat transfer properties of boiling R744 streams in horizontal micro-tubes. The experiment was conducted at a saturation temperature of −40–0°C, a heat flux of 5–35 W/m2, a mass flux of 200–1500 kg/(m2∙s), and an inner diameter of 1.5 mm.
As part of the literature on hybrid cascade refrigeration systems (HCRS), which can be operated as an IRS at intermediate temperatures (around −25 °C) and as a CRS at low temperatures (below −40 °C), this study addresses the heat transfer characteristics at low temperatures in the CRS mode. A review of the literature indicated the lack of studies on evaporative heat transfer at temperatures lower than −40 °C. Therefore, the evaporative heat transfer characteristics and heat and mass fluxes of R744 at saturation temperatures below −40 °C are investigated to provide basic data for designing CRS low-temperature (below −40 °C) evaporators.

2. Experimental Apparatus and Data Reduction

The HCRS can be operated as both a CRS and an IRS. When the HCRS is operated as an IRS, evaporative heat transfer of R744 occurs at an intermediate temperature (−25–0 °C), and when it is operated as an R744/R404A CRS, evaporative heat transfer of R744 occurs at lower temperatures (−50–−30 °C). Herein, we aim to provide basic data for optimal CRS evaporator design by theoretically identifying and analyzing the evaporation pressure drop and heat transfer coefficient characteristics of R744 in the low-temperature region.

2.1. Experimental Apparatus and Procedure

As shown in Figure 1, the experiments were conducted to investigate the R744 evaporative heat transfer characteristics and pressure drop in the low-temperature refrigeration cycle of CRSs. The experimental setup was composed of an evaporator (test section), accumulator, compressor, oil separator, condenser (cascade heat exchanger), receiver, mass flowmeter, and expansion valve for low temperature (−50–−30 °C).
A detailed schematic diagram of the R744 evaporator used herein is presented in Figure 2, and its specifications are listed in Table 1. Descriptions of the experiment, measurement method, heat transfer and pressure drop processes, and data reduction procedure can be found in a previous paper [23].
The ranges of experimental conditions are summarized in Table 2, and the details of measuring equipment are shown in Table 3.
The order of experiments for low-temperature evaporation heat transfer and pressure drop is as follows.
(1)
After checking the measuring device in advance, vacuum the inside of the system using a vacuum pump.
(2)
A small amount of refrigerant is injected and a purge process is performed three times to remove impurities such as residual air while creating a vacuum using a vacuum pump.
(3)
Before operating the system, adjust the inlet temperature of the secondary fluid of the R744 evaporator and the R404A condenser using the low-temperature refrigeration system and temperature controller, and then charge each system with refrigerant as a liquid.
(4)
After turning on the power of the R744 compressor and operating the compressor, adjust the opening of the expansion valve and the injection amount of refrigerant to maintain the superheat at the outlet of the evaporator, the degree of subcooling of the condenser, and the temperature of the condenser.
(5)
In addition, the measurement equipment is operated and the data of temperature, pressure, and mass flow of the measuring part are sent to the computer using GPIB communication.
(6)
When the system reaches a steady state, measure the refrigerant temperature, pressure, mass flow rate, and compressor compression work three times at 5 min intervals under steady state.
(7)
Repeat the previous process (4)–(7) while changing the experimental conditions.
If the temperature measurement variation is within ±0.3 °C, the pressure measurement variation is ±5 kPa, and the mass flow change is within ±0.2 g/s during 30 min, the system is considered to be in a normal state and the data are measured.

2.2. Uncertainties

Because the experimental results used for engineering analysis or design cannot be considered accurate, the uncertainties of the experimental parameters are predicted in this study by using the equations proposed by Kline and McClintock [24] and Moffat [25] in the same way as in a previous paper [23]. The estimated uncertainties are summarized in Table 4.

3. Experimental Results

The evaporative heat transfer characteristics of the R744 evaporator were studied experimentally by operating the HCRS as a CRS, wherein R744 was circulated using a refrigerant compressor.

3.1. Flow Pattern Map of R744

Figure 3, Figure 4 and Figure 5 show the variations in the flow pattern map of R744 when mass flux, saturation temperature, and heat flux are changed, respectively. These variations are illustrated with reference to the results of Cheng et al. (2006) [26], Cheng et al. (2008a) [27], and Cheng et al. (2008b) [28], which have adequately described the evaporative flow pattern maps of R744. In the Figure 3, Figure 4 and Figure 5, A is annular flow, D is dry-out region, I is intermittent flow, M is mist flow, S is stratified flow and SW is stratified-wavy flow. Also, several lines represent the boundary lines between different flow pattern. G is mass flux in the Figure 3, Tsat is saturation temperature and xIA is vapor quality transition from intermittent flow to annular flow in the Figure 4 and q is heat flux in the Figure 5.

3.1.1. Influence of Mass Flux

Figure 3 shows the flow pattern map of R744 as the mass flux increases from 75 to 175 kg/(m2·s). At the mass fluxes of 75–175 kg/(m2·s), stratified wave flow is observed because the transition to annular flow does not occur owing to an insufficient refrigerant flow rate. In addition, the dry-out point is formed at low vapor quality as the mass flux increases because the shear force between the liquid film and the gas phase increases, as does the degree of droplet separation. However, droplet separation occurs actively, and the refrigerant on the wall surface evaporates rapidly.

3.1.2. Influence of Saturation Temperature

Figure 4 shows the flow pattern map obtained by changing the saturation temperature. The figure indicates that the flow pattern changes considerably because the physical properties of the refrigerant change considerably with the saturation temperature. As the saturation temperature increases, the length of the annular flow section increases, and, consequently, the dry-out point is formed in the high-vapor-quality region. In the transition to annular flow, the vapor quality varies from 0.0677 to 0.0973 depending on the saturation temperature, and forced convective boiling occurs more actively than nucleate boiling.

3.1.3. Influence of Heat Flux

Figure 5 shows the flow pattern map obtained by changing the heat flux. As the heat flux increases, bubble generation occurs actively and the length of the annular flow section decreases, resulting in the formation of a dry-out point in the low-vapor-quality region.

3.2. Evaporative Heat Transfer of R744

Forced boiling in a horizontal tube is affected by a number of factors, such as mass flux, heat flux, and velocity ratio of the gas and liquid phases. In this study, the purpose is to investigate how these factors affect the evaporative heat transfer characteristics.

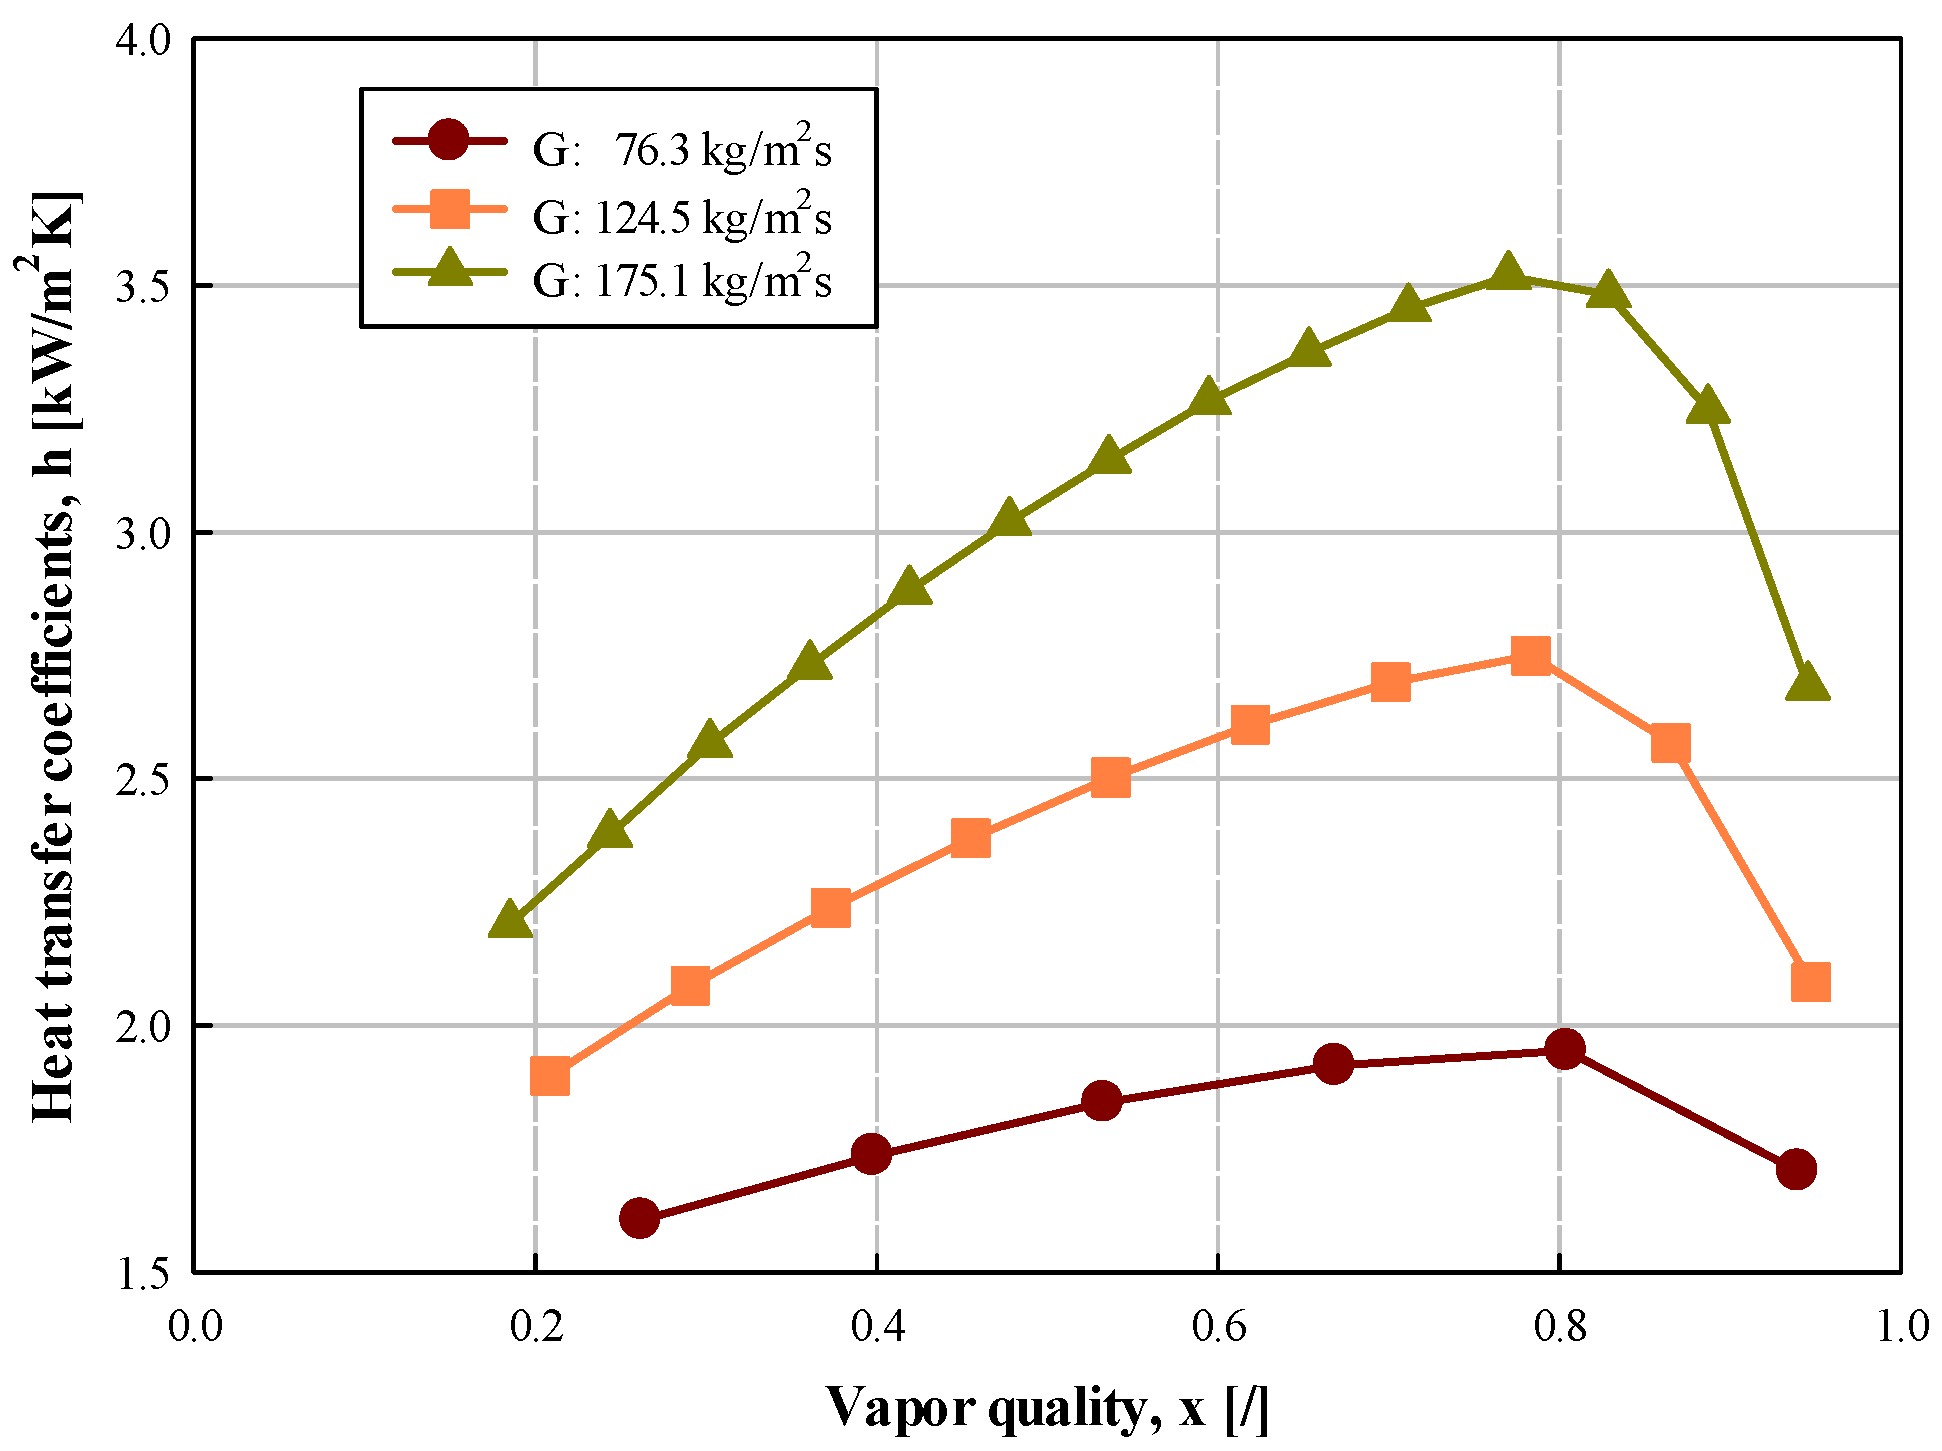
3.2.1. Influence of Mass Flux

Figure 6 shows the local evaporative heat transfer coefficient when the mass flux is increased in steps of approximately 50 kg/(m2·s) from 76.3 to 175.1 kg/(m2·s) under constant conditions (heat fluxes of 17 kW/m2 and saturation temperature of −40 °C). According to this figure, the local evaporative heat transfer coefficient increases when the mass flux increases in steps of 50 kg/(m2·s) from 76.3 to 175.1 kg/(m2·s). Before the high-vapor-quality region (x > 0.7702–0.8042), the heat transfer coefficient increases by 1.6–9.6% as the mass flux increases, possibly because the shear force between the liquid film and the two-phase flow increases as the mass flux increases, and the droplets escape actively. As summarized in Table 5, as the mass flux increases, the effect of forced convective boiling increases owing to the increase in Reynolds number [29]. In addition, the heat transfer coefficient decreases in the high-vapor-quality region (x > 0.8042) when the mass flux is 76.3 kg/(m2·s). This is because dry-out occurs in this high-vapor-quality region, as reported by Yun et al. [30].
According to the flow pattern depicted in Figure 3, as the mass flux is increased in steps of approximately 50 kg/(m2·s) from 76.3 to 175.1 kg/(m2·s), dry-out occurs in the lower-vapor-quality region.
Similarly, the results of our experiment indicated that the higher the mass flux, the greater the extent to which dry-out occurred in the low-vapor-quality region.

3.2.2. Influence of Saturation Temperature

Figure 7 shows the local evaporative heat transfer coefficient when the saturation temperature of the refrigerant is increased in steps of 5 °C from −49.8 to −30.2 °C under constant conditions (mass flux of 125 kg/(m2·s) and heat flux of 17 kW/m2). As the saturation temperature of the refrigerant increases, the local evaporative heat transfer coefficient decreases with an increase in the vapor quality. This is because the thermal conductivity of the liquid-phase refrigerant decreases as the saturation temperature increases, as summarized in Table 6. Accordingly, the thermal resistance of the liquid refrigerant film increases and, consequently, the evaporative heat transfer coefficient of the refrigerant decreases. Another reason is that as the saturation temperature increases, the density ratio ( ρ l / ρ v ) decreases. Therefore, the velocity ratio ( v v / v l ) between the gas and liquid phases of Table 7 decreases with an increase in the saturation temperature, resulting in a decrease in the heat transfer coefficient [31,32]. Another possible cause is the effect of the Pr number. As the saturation temperature increases, the thermal conductivity decreases, leading to a decrease in the Pr number, which affects the heat transfer of forced convection. Therefore, the heat transfer coefficient decreases.
Moreover, it can be seen from Figure 7 that the higher the saturation temperature, the greater the heat transfer coefficient is in the low-vapor-quality region (x < 0.28). However, this trend reverses when the vapor quality increases. In addition, the overall peak value of the heat transfer coefficient increases as the saturation temperature decreases. As the temperature decreases, surface tension increases, and the heat transfer coefficient increases until dry-out begins. The reason why the heat transfer coefficient increases as the saturation temperature gradually increases, as shown in Table 6, is possibly because the surface tension decreases and nucleate boiling increases as the saturation temperature increases. This was confirmed by Yun et al. [33] and Choi et al. [34]. The surface tension decreases by 7.5–9.3% as the evaporation temperature increases in steps of 5 °C from −49.8 to −30.2 °C. As the surface tension decreases, the critical radius of nucleate boiling decreases. The greater the extent of nucleate boiling in the tube wall, the more intensely nucleate boiling is activated. Nucleate boiling is generally dominant in the low-vapor-quality region.
However, in the moderate-vapor-quality region (0.28 < x < 0.7757–0.8409), inversion of the heat transfer coefficient occurs because nucleate boiling is suppressed and forced convection heat transfer is dominant owing to the high gas flow rate at low saturation temperatures.
According to the values calculated by Cheng et al. (2006) [26], Cheng et al. (2008a) [27], Cheng et al. (2008b) [28], and Thome et al. [35], the onset of dry-out (vapor quality of 0.7757–0.8409 according to saturation temperature) occurs at a slightly lower vapor quality because the surface tension decreases as the saturation temperature increases in steps of approximately 5 °C from −49.8 to −30.2 °C. The heat transfer coefficient decreases in the high-vapor-quality region (x > 0.7757–0.8409), possibly because of the occurrence of dry-out in this high-vapor-quality region, as reported by Yun et al. [30]. These results were found to be consistent with those reported by Wu et al. [19].

3.2.3. Influence of Heat Flux

Figure 8 shows the changes in the local evaporative heat transfer coefficient as the refrigerant heat flux increases in steps of 5 kW/m2 from 11.8 kW/m2 to 21.3 kW/m2 under constant conditions. The local evaporative heat transfer coefficient increases when the refrigerant heat flux increases. As the heat flux increases in steps of 5 kW/m2 from 11.8 kW/m2 to 21.3 kW/m2, the heat transfer coefficient increases by 4.1–9.6% in the low-vapor-quality (x < 0.5) region and by 0.3–4.4% in the medium-vapor-quality (0.5 < x < 0.7446–0.8336) region.
This is because the density ratio ( ρ l / ρ v ) or specific volume ratio ( v v / v l ) of the gas phase to the liquid phase of R744 refrigerant at −40.3 °C is high, as summarized in Table 6 and Table 7. This simplifies the transition to annular flow with a thin liquid film owing to the high velocity difference between the liquid and gas phases. Moreover, the relatively high surface tension makes it difficult to nucleate [36].
As the heat flux increases, the heat transfer coefficient is affected more in the low-vapor-quality region than in the moderate-vapor-quality region. This is because at low vapor quality, nucleate boiling under the influence of heat flux has a dominant effect on the heat transfer coefficient, but in the moderate-vapor-quality region, nucleate boiling is suppressed, and forced convective boiling dominates the heat transfer coefficient [37,38]. As reported in the literature, the difference in heat transfer coefficient is small in the moderate-vapor-quality region, even when the heat flux increases [37,38]. Moreover, the heat transfer coefficient decreases in the high-vapor-quality region (x > 0.7446–0.8336) because dry-out occurs in this region, as reported by Yun et al. [30]. Furthermore, as the heat flux increases, as shown in Figure 8, dry-out occurs at a slightly lower vapor quality [34,39]. These results are consistent with those of Wu et al. [19].

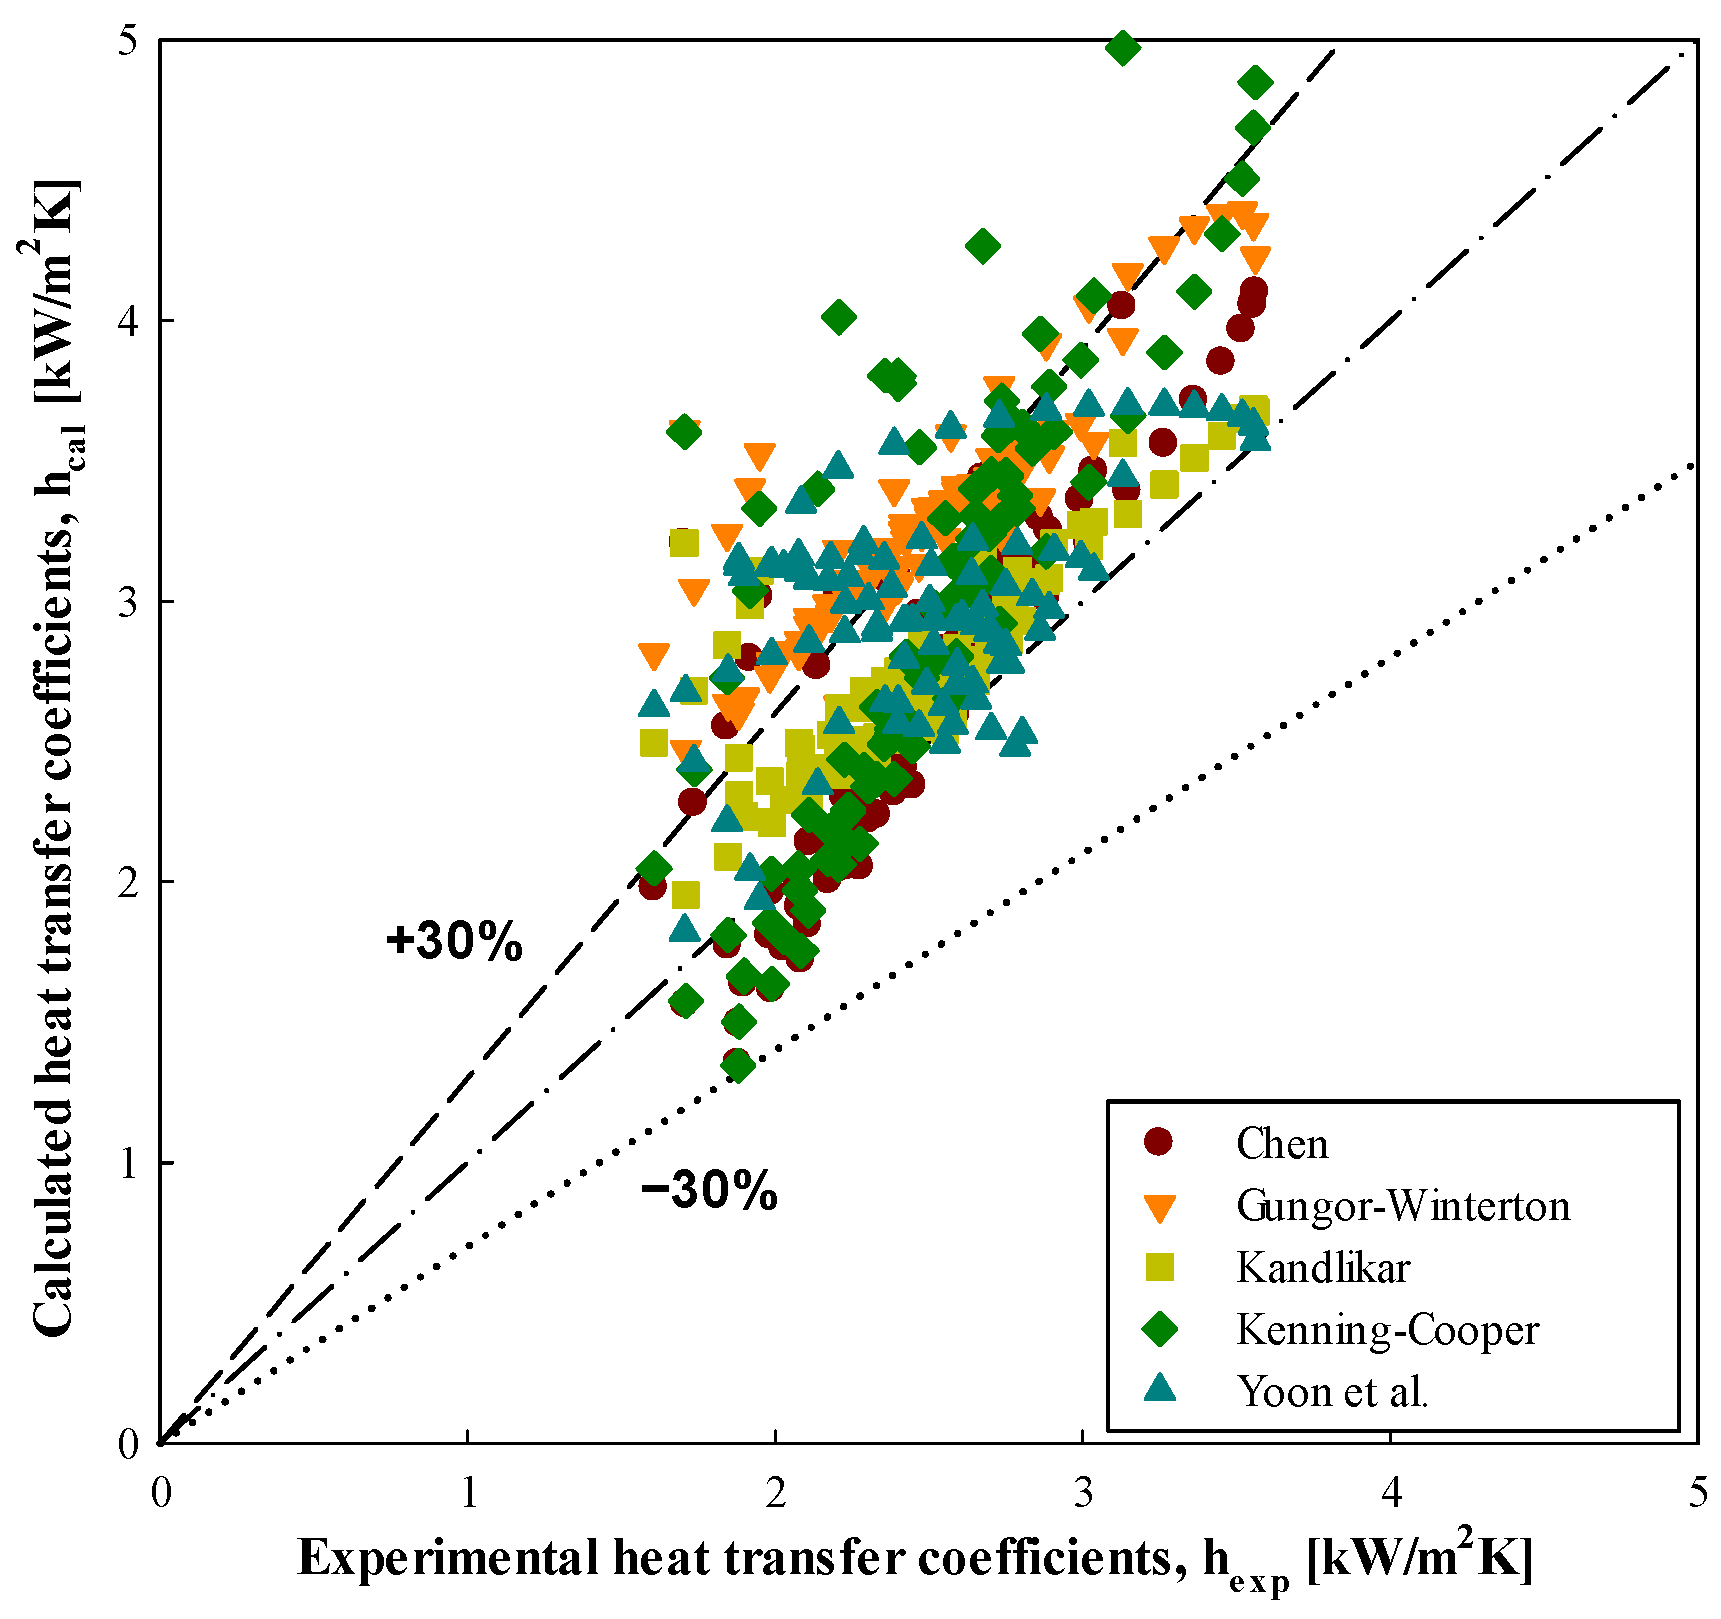
3.2.4. Comparison between Experimental Data and Existing Correlation Formulas

In this section, as in Jeon [23], comparative correlation formulas (Chen [40], Gungor and Winterton [41], Kandlikar [42], Kenning-Cooper [43], and Yoon et al. [44]) are used to calculate the average deviation, and absolute mean deviation is applied to compare these correlations. The related correlation formulas are presented in Table 8.
In the correlation formula of Kandlikar [42], Ffl is replaced by 1, as in Jeon [23]. This is because Ffl = 1 for all refrigerants, except those studied by Kandlikar [45] and Kandlikar and Balasubramanian [46].
Table 9 presents the average deviation and absolute mean deviation calculated using these correlation formulas for all data before the critical heat flux (CHF).
Figure 9 compares the heat transfer coefficients of R744 refrigerant in a tube with an inner diameter of 11.46 mm under each given condition according to the vapor quality with the values calculated using other correlation formulas.
As can be inferred from Table 9 and Figure 9, the correlation formulas of Chen [40] and Kandlikar [42] well predict the absolute mean deviation rates of 10.37% and 10.51%, respectively. The correlation formulas of Gungor-Winterton [41] and Yoon et al. [44] showed large absolute mean deviation rates of 26.35% and 25.02%, respectively.
Kandlikar [42] proposed the suppression variable S in their correlation formula. Because the correlation proposed by Kandlikar [42] reflects the fact that when the forced convection effect increases, nucleate boiling is strongly suppressed owing to the decrease in the thickness of the thermal boundary layer; forced convective boiling is predicted well from the experimental values. In addition, the experimental data were almost similar to the value obtained using the correlation formula proposed by Chen [40].
By contrast, the correlation formulas of Gungor-Winterton [41], Kenning-Cooper [43], and Yoon et al. [44] have large deviation rates, which is consistent with the results presented in Jeon [23]. The correlation formula of Gungor-Winterton [41] uses experimental constants based on experimental data, and it has a high deviation rate because the experimental range is out of the application range of the correlation formula. Because the correlation formula of Kenning-Cooper [43] considers only the liquid single phase, its deviation rate is rather large. Moreover, the correlation formula of Yoon et al. [44] is unsuitable because the evaporative heat transfer conditions considered herein are different.
As shown in Figure 10, the correlation formulas of Gungor-Winterton [41] and Yoon et al. [44] slightly overestimate the experimental values, and their absolute mean deviations are rather high, which is not desirable.

3.3. Evaporation Pressure Drop of R744

Accurate prediction of the pressure drop in an evaporator is essential for not only predicting the heat transfer state but also evaluating the actual operating state of each device and preparing an optimal design for selecting a compressor. In addition, pressure drop data are essential for designing an evaporator that uses R744 as a working fluid in refrigeration and air-conditioning systems, and identifying the characteristics of the two-phase flow frictional pressure drop in the tube is important data to predict the pressure drop in the case of designing an evaporator for R744. Therefore, many researchers have studied the pressure drops of two-phase flows in tubes, and several empirical formulas have been proposed.

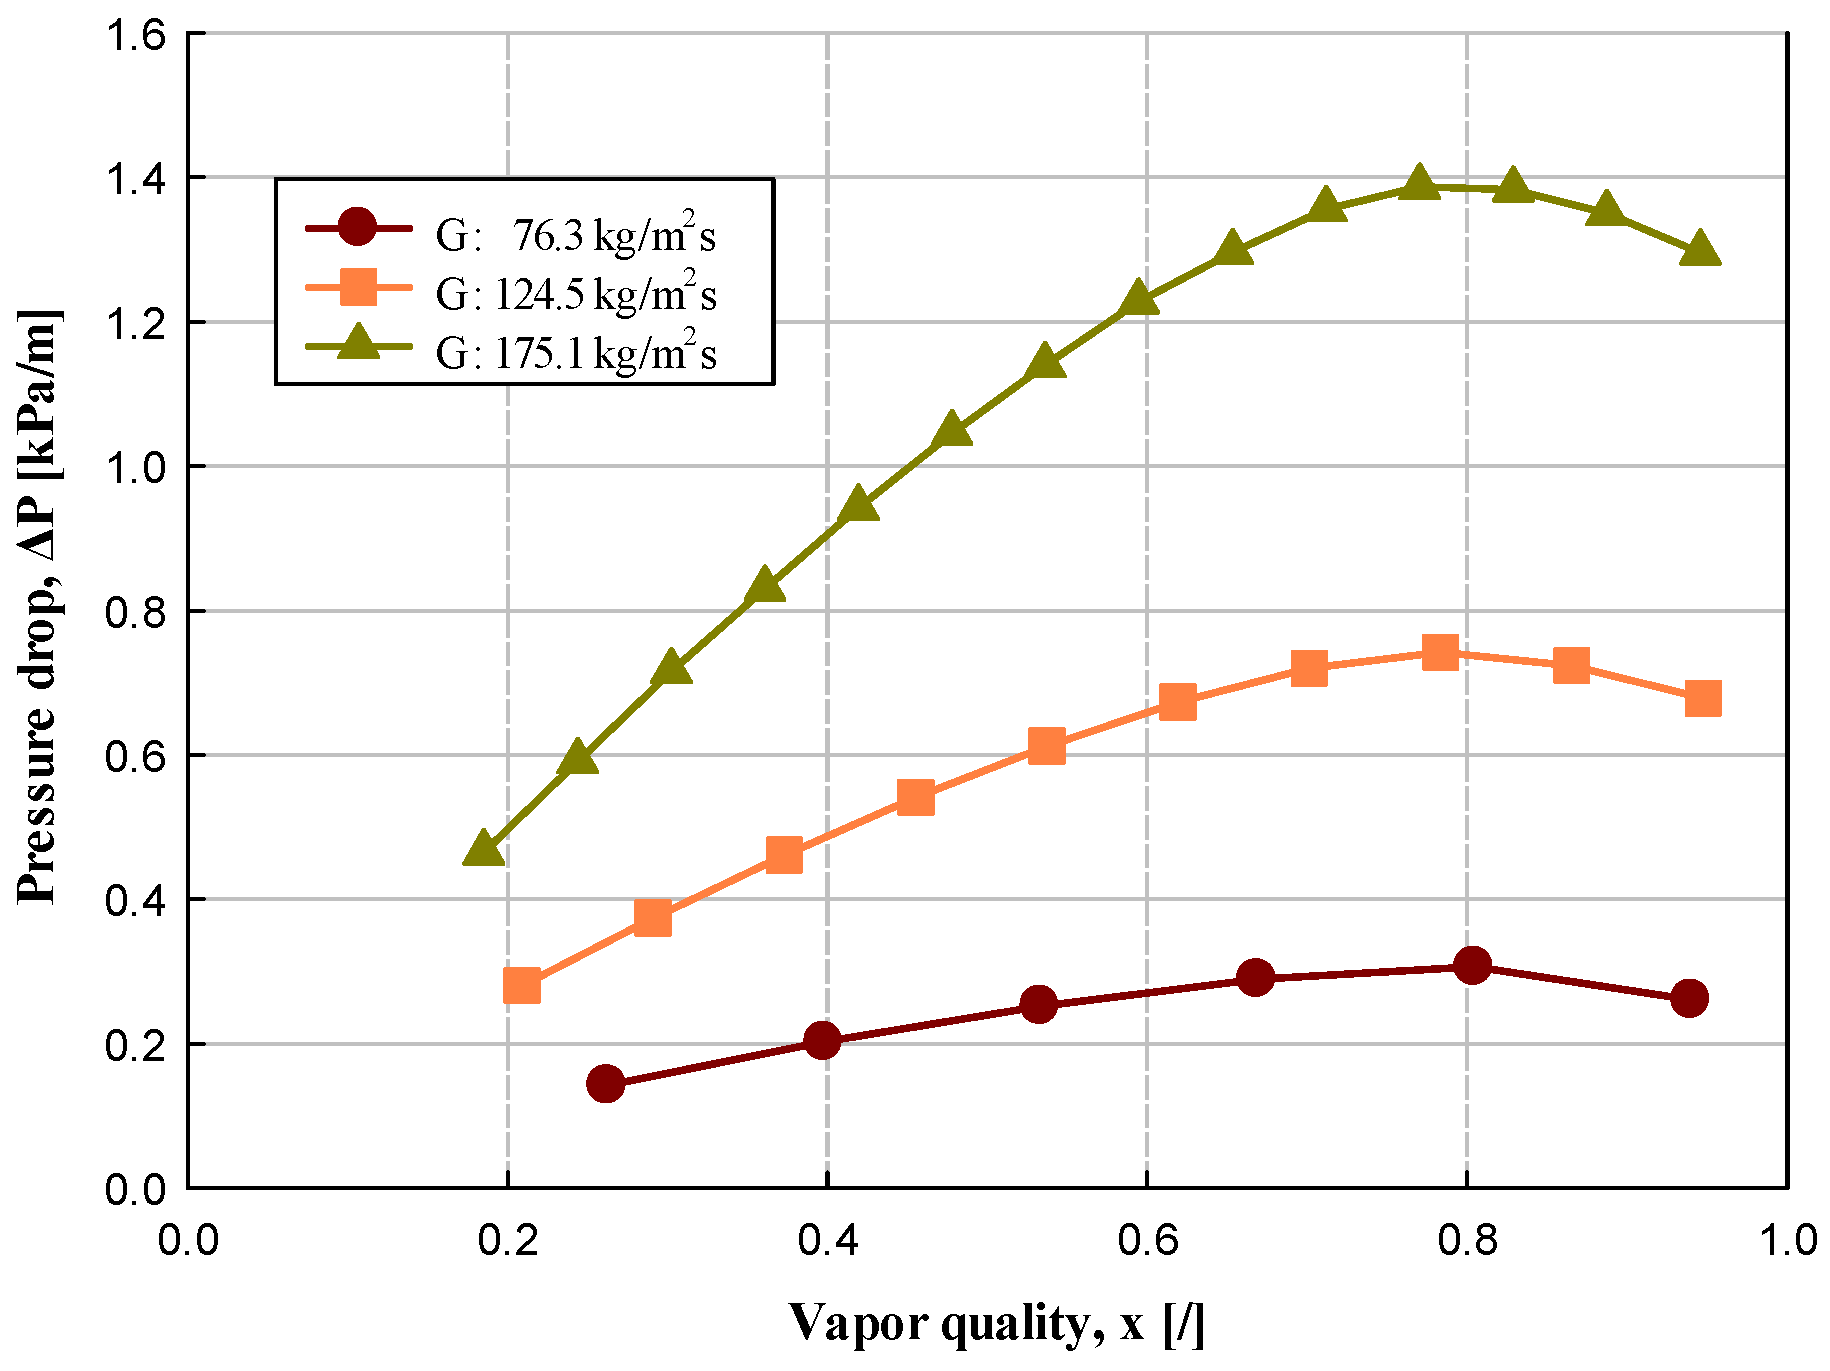
3.3.1. Influence of Mass Flux

Figure 11 depicts the frictional pressure drop in accordance with the variation in mass fluxes. The frictional pressure drop increases as the mass flux increases. When the mass flux increases in steps of approximately 50 kg/(m2·s) from 76.3 kg/(m2·s) to 175.1 kg/(m2·s), the average friction pressure drop values are 0.228 kPa/m, 0.551 kPa/m, and 1.048 kPa/m, respectively, and the corresponding increases in pressure drop are 1.42 kPa/m and 0.9 kPa/m. By contrast, Bredesen et al. [47] reported that the frictional shear force at the wall surface increases as the mass flux increases.

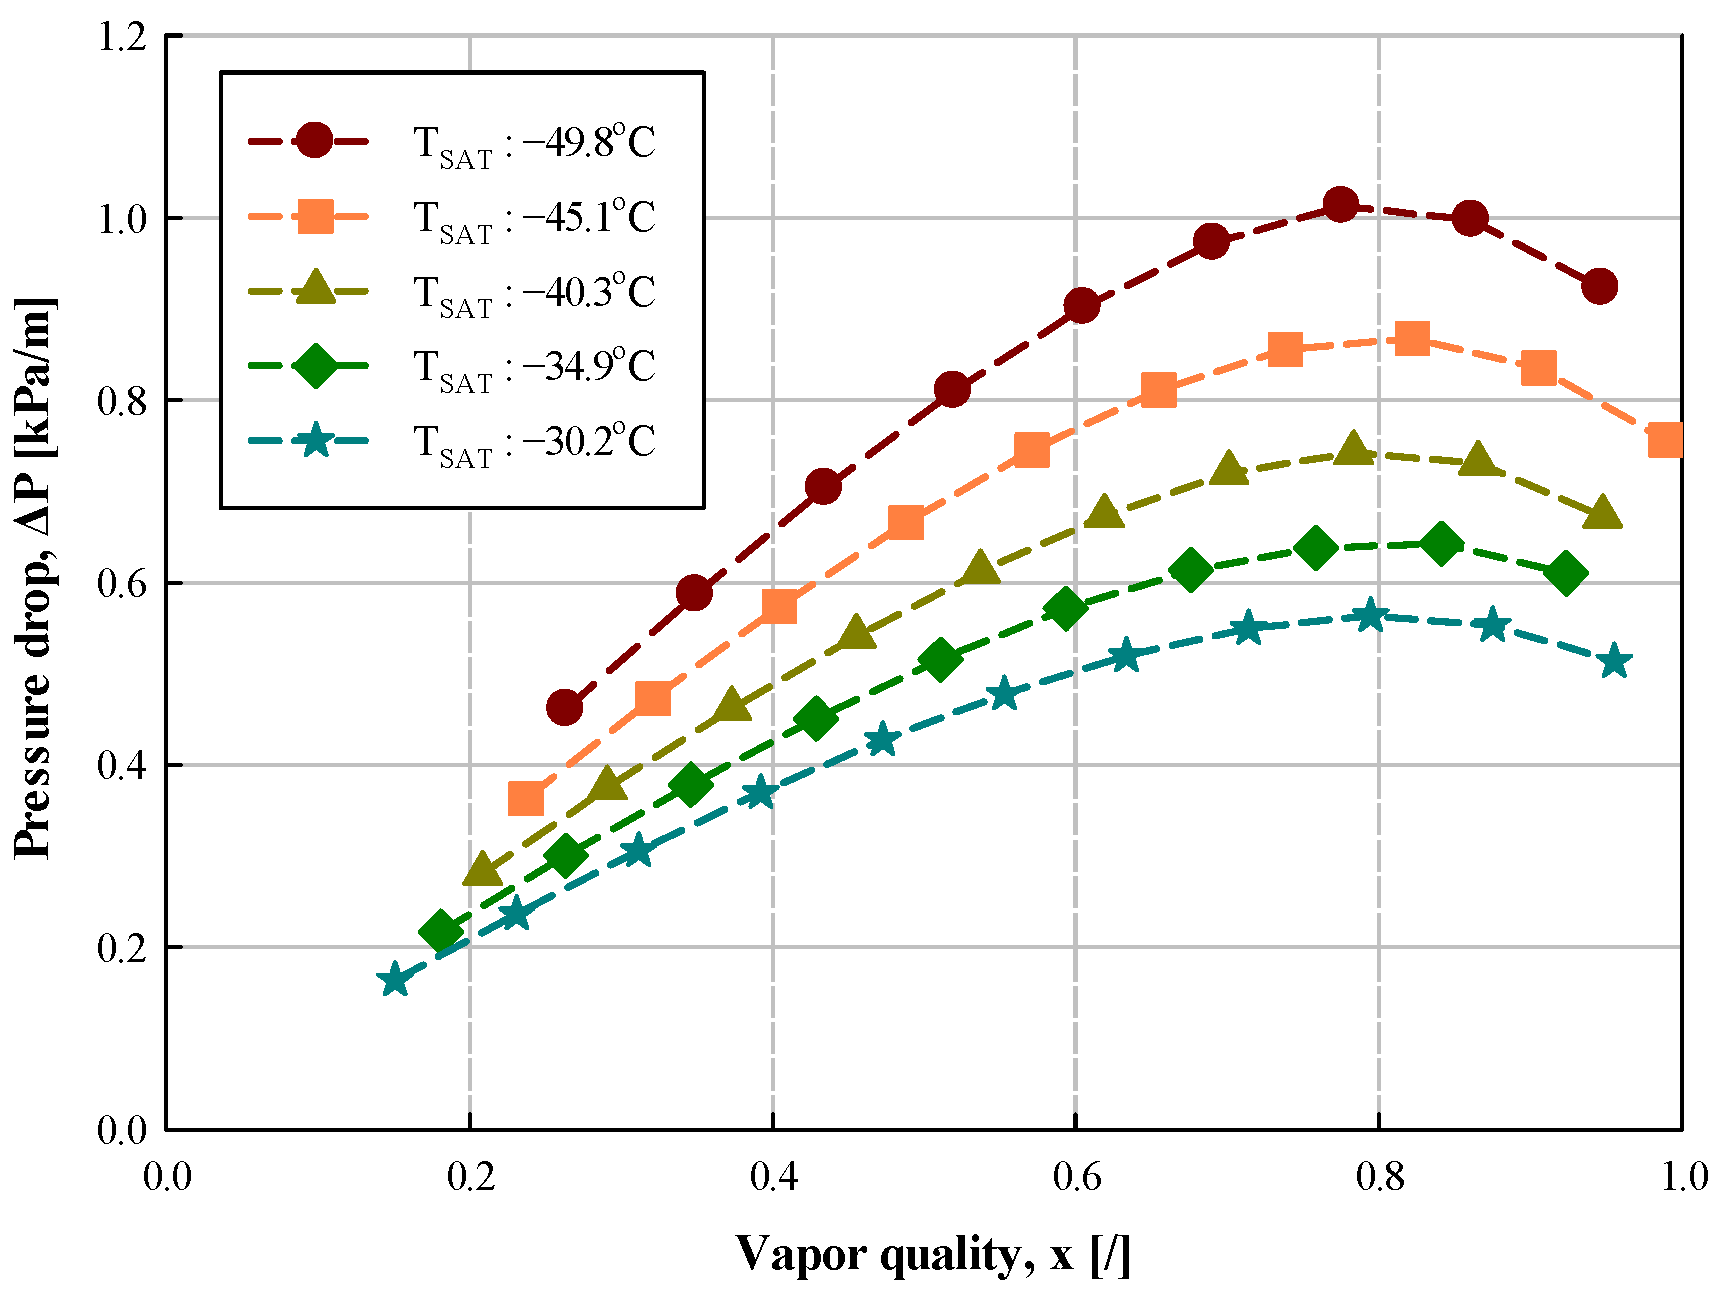
3.3.2. Influence of Saturation Temperature

Figure 12 shows the estimated frictional pressure drop when the saturation temperature of the refrigerant is increased in steps of approximately 5 °C from −49.8 to −30.2 °C. The frictional pressure drop increases as the saturation temperature decreases under constant mass and heat flux conditions. When the saturation temperature is increased in steps of 5 °C from −49.8 to −30.2 °C, the corresponding average friction pressure drops are 0.773 kPa/m, 0.655 kPa/m, 0.551 kPa/m, 0.469 kPa/m, and 0.405 kPa/m, respectively, and the pressure drops decreases by 13.6–15.9%. This is because the viscosity coefficient ratio ( μ l / μ v ) and density ratio ( ρ l / ρ v ) of R744 decrease as the saturation temperature increases, as summarized in Table 10 and Table 11.
In addition, the viscosity coefficient and density of the liquid decrease as the saturation temperature increases, but the viscosity coefficient and density of the gas increase. This means that while the flow velocity of the liquid phase decreases as the refrigerant evaporates, the flow velocity of the gas phase increases, which promotes turbulence and reduces the pressure drop. This pressure drop further decreases as the saturation temperature increases. Therefore, the frictional pressure and acceleration pressure of the refrigerant in the tube decrease, leading to a further reduction in the pressure drop [37].
Moreover, the pressure drop decreases rapidly in the high-vapor-quality region (x > 0.7757–0.8409), where dry-out occurs. This is because of the reduced pressure drop owing to the occurrence of dry-out. The same tendency can be observed in Figure 12, which depicts the effect of mass flux, and the pressure drop is considered to decrease rapidly for the same reason.

3.3.3. Influence of Heat Flux

Figure 13 shows the frictional pressure drop increases slightly when the heat flux of the refrigerant increases in steps of 5 kW/m2 from 11.8 kW/m2 to 21.3 kW/m2 under constant conditions in the low-vapor-quality region (0 < x < 0.7757–0.8409). Thus, it can be concluded that heat flux does not have a significant effect on the frictional pressure drop of the two-phase fluid. The pressure drop measured under the experimental conditions is the sum of the pressure drop due to friction ( Δ P f r i c t ) and that due to momentum ( Δ P m o m ), as shown in Jeon [23]. Because the pressure drop due to momentum in a short section is negligible, the experimental pressure drop in this paper refers only to the frictional pressure drop.
In addition, for all curves corresponding to the heat fluxes of 11.8 kW/m2, 17.1 kW/m2, and 21.3 kW/m2, the point of maximum pressure drop occurs at the starting point of dry-out (x = 0.7446–0.8336), and the pressure drop increases as the vapor quality increases in the low-vapor-quality region.
This means that in the dry-out region (x > 0.7446–0.8336), liquid flows into the vapor core in the form of droplets, and this conversion from an annular flow to a spray flow due to dry-out is related to a reduction in the frictional pressure drop [48]. These results are consistent with those of Yun et al. [30] and Moreno Quibén and Thome [49].
In Figure 13, the frictional pressure drop increases as the heat flux increases, possibly because the frictional pressure drop increases as the internal flow changes to turbulent flow when the frequency of bubble generation increases with an increase in the heat flux. However, this effect is small compared to those of other variables, and it is considered that there is almost no effect on the pressure drop.

3.3.4. Comparison between Experimental Data and Existing Correlation Formulas

As summarized in Table 12, the existing correlations for calculating the frictional pressure drop are used, as in Jeon [23], and the average deviation and absolute mean deviation are compared.
Figure 14 compares the pressure drop of R744 measured experimentally in a tube with an inner diameter of 11.46 mm with the pressure drop predicted using the correlation formulas proposed by Chisholm [50], Grönnerud [51], Friedel [52], Lockhart-Martinelli [53], Muller-Steinhagen-Heck [54], and Jung et al. [55]. As shown in Figure 14 and summarized in Table 13, the predictions generated using the correlation formulas of Chisholm [50], Friedel [52], and Jung et al. [55] deviated on the higher side relative to the experimental data, and the predictions generated using the correlations proposed by Grönnerud [51], Lockhart-Martinelli [53], and Muller-Steinhagen-Heck [54] deviated on the lower side relative to the experimental data. The prediction generated using the correlation formula of Lockhart-Martinelli [53] was the closest to the experimental data, with an absolute mean deviation rate of 8.31% under all conditions and a marginal difference relative to the prediction generated using the correlation formula proposed by Friedel [52]. By contrast, the prediction generated using the correlation formula proposed by Chisholm [50] showed the highest absolute mean deviation of 32.76%.
Figure 15 compares the experimental values and the values calculated using the existing correlation formulas under all conditions. According to the figure, the values calculated using the correlation formulas of Friedel [52] and Lockhart-Martinelli [53] agree well with the experimental data.

4. Conclusions

In this study, an experiment was conducted to determine the evaporative heat transfer characteristics of R744 in the low-temperature region by considering the operating conditions in the evaporator. The results are as follows.
  • When designing the R744 evaporator, as the mass flux increased, the evaporation heat transfer coefficient increased, as did the evaporation pressure drop.
  • The lower the saturation temperature, the higher the heat transfer coefficient and pressure drop. However, as the saturation temperature decreased, the rate increase of the pressure drop was insignificant compared to the rate of increase of the heat transfer coefficient. In the design of an evaporative heat exchanger, it is an efficient and appropriate design to lower the saturation temperature in terms of heat transfer and pressure drop.
  • As the heat flux increased, the evaporative heat transfer coefficient and evaporation pressure drop of R744 increased. However, the rate of increase of the evaporation pressure drop was negligible compared to that of the evaporative heat transfer coefficient. Therefore, the higher the heat flux, the better.
  • The evaporative heat transfer characteristics of R744 can be predicted well by using the correlation formula of Chen [40] at the saturation temperature of −40 °C in the CRS.
  • The evaporative pressure drop characteristics of R744 can be predicted well by using the correlation formula of Lockhart-Martinelli [53] at the saturation temperature of −40 °C in the CRS.
  • Through this study, an equation for predicting R744 evaporation heat transfer and pressure drop was introduced, but it is thought that more research on a prediction equation exclusively for the R744 refrigerant is needed for a more accurate prediction.

Funding

This research received no external funding.

Data Availability Statement

Not applicable.

Conflicts of Interest

The authors declare no conflict of interest.

Nomenclature

SYMBOLS
dDiametermm
EEnhancement factor
FConstant in Shah’s correlation
FflFluid-dependent parameter in Equations (3) and (4)
GMass velocitykg/(m2·s)
gGravity accelerationm/s2
hHeat transfer coefficientkW/(m2 · K)
kThermal conductivitykW/(m · K)
PPressurekPa
q Heat fluxkW/m2
SSuppression factor
TTemperature°C
v Specific volumem3/kg
x Quality
zLocal tube lengthm
( dP dz ) f Pressure drop due to friction
GREEK SYMBOLS
Δ Difference
ρ Densitykg/m3
μ Viscositykg/(m · s)
σ Surface tension, Standard deviation N/m%
Φ Two-phase multiplier
DIMENSIONLESS NUMBERS
B o Boiling number
C o Convection number
Fr Froude number
Pr Prandtl number
Re Reynolds number
SUBSCRIPTS
calCalculated
cbConvective boiling
CBDConvective boiling dominant
expExperimental
IATransition from intermittent flow to annular flow
lLiquid state, Flow of the liquid phase alone in the tube
loTotal flow with liquid properties
nbNucleate boiling
NBDNucleate boiling dominant
poolPool boiling
SATSaturation
vVapor state
X tt Martinelli parameter

References

  1. Lorentzen, G.; Pettersen, J. A new, efficient and environmentally benign system for car air-conditioning. Int. J. Refrig. 1993, 16, 4–12. [Google Scholar] [CrossRef]
  2. Pettersen, J.; Hafner, A.; Skaugen, G.; Rekstad, H. Development of compact heat exchangers for CO2 air-conditioning systems. Int. J. Refrig. 1998, 21, 180–193. [Google Scholar] [CrossRef]
  3. Kruse, H.; Heidelck, R.; Suss, J. The application of CO2 as a refrigerant. Bull. Int. Inst. Refrig. 1999, 99, 2–21. [Google Scholar]
  4. Strommen, I.; Bredesen, A.M.; Eikevik, T.; Neksa, P.; Pettersen, J.; Aarlien, R. Refrigeration, air-conditioning, and heat pump systems for the 21st century. Bull. Int. Inst. Refrig. 2000, 2000–2002, 3–18. [Google Scholar]
  5. Lorentzen, G. Revival of carbon dioxide as a refrigerant. Int. J. Refrig. 1994, 17, 292–301. [Google Scholar] [CrossRef]
  6. Pettersen, J. Efficient new automobile air-conditioning system based on CO2 vapor compression. In Proceedings of the ASHRAE Annual Meeting, Orlando, FL, USA, 25–29 June 1994; Volume 100, pp. 657–665. [Google Scholar]
  7. Knudsen, H.J.H.; Pachai, A.C. Energy comparison between CO2 cascade systems and state of the art R404A systems. In Proceedings of the 6th IIR-Gustav Lorentzen Natural Working Fluid Conference, Glasgow, UK, 29 August–1 September 2004. cd-ROM, Paper No. 2/A. [Google Scholar]
  8. Winkler, J.M.; Aute, V.; Radermacher, R.; Shapiro, D. Simulation and validation of a R404A/CO2 cascade refrigeration system. In Proceedings of the International Refrigeration and Air-Conditioning Conference, Purdue, IN, USA, 14–17 July 2008. [Google Scholar]
  9. Rees, B.; Rohrer, C.; Shapiro, D.; Trachta, J. Performance testing and comparison of liquid overfeed and cascade CO2 systems with R404A primary. In Proceedings of the International Congress of Refrigeration, ICR07-B2-123, Beijing, China, 21–26 August 2007. [Google Scholar]
  10. Pearson, A. Carbon dioxide-new uses for an old refrigerant. Int. J. Refrig. 2005, 28, 1140–1148. [Google Scholar] [CrossRef]
  11. Hinde, D.; Zha, S.; Lan, L. CO2 experiences in North American supermarkets. In Proceedings of the Eighth IIR Gustav Lorentzen Conference on Natural Working Fluids, Copenhagen, Denmark, 7 September 2008; pp. 1098–1104. [Google Scholar]
  12. Kaga, S.; Nomura, T.; Seki, K.; Hirano, A. Development of compact inverter refrigerating system using R600a/CO2 by Thermo Siphon. In Proceedings of the Eighth IIR-Gustav Lorentzen Conference on Natural Working Fluids, Copenhagen, Denmark, 7 September 2008; pp. 1011–1018. [Google Scholar]
  13. Sawalha, S.; PALM, B. Energy comsumption evaluation of indirect systems with CO2 as secondary refrigerant in supermarket refrigeration. In Proceedings of the International Congress of Refrigeration, ICR0434, Washington, DC, USA, 17–22 August 2003. [Google Scholar]
  14. Yi, W.B.; Choi, K.H.; Yoon, J.I.; Son, C.H.; Ha, S.J.; Jeon, M.J. Exergy characteristics of R404A indirect refrigeration system using CO2 as a secondary refrigerant. Heat Mass Transf. 2019, 55, 1133–1142. [Google Scholar] [CrossRef]
  15. Hassan, M.A.M.; Shedid, M.H. Experimental investigation of two phases evaporative heat transfer coefficient of carbon dioxide as a pure refrigerant and oil contaminated under forced flow conditions in small and large tube. Int. J. Refrig. 2015, 56, 28–36. [Google Scholar] [CrossRef]
  16. Zhao, X.; Bansal, P.K. Flow boiling heat transfer characteristics of CO2 low temperatures. Int. J. Refrig. 2007, 30, 937–945. [Google Scholar] [CrossRef]
  17. Bansal, P.; Zhao, X. Flow boiling heat transfer of CO2 at low temperature: Challenges and Oppertunites. In Proceedings of the ASME 2007 5th International Conference on Nanochannels, Microchannels, and Minichannels, ICNMM2007-30155, Puebla, Mexico, 18–20 June 2007; pp. 979–988. [Google Scholar] [CrossRef]
  18. Park, C.Y.; Hrnjak, P.S. Flow boiling heat transfer of CO2 at low temperatures in horizontal smooth tube. J. Heat Transf. 2005, 127, 1305–1312. [Google Scholar] [CrossRef]
  19. Wu, J.; Koetting, T.; Franke, C.; Helmer, D.; Eisel, T.; Haug, F.; Bremer, J. Investigation of heat transfer and pressure drop of CO2 two-phase flow in a horizontal minichannel. Int. J. Heat Mass Transf. 2011, 54, 2154–2162. [Google Scholar] [CrossRef]
  20. Fang, X.; Zhou, Z.; Li, D. Review of correlations of flow boiling heat transfer coefficients for carbon dioxide. Int. J. Refrig. 2013, 36, 2017–2039. [Google Scholar] [CrossRef]
  21. Yoon, J.I.; Son, C.H.; Jung, S.H.; Jeon, M.J.; Yang, D.I. Evaporation heat transfer of carbon dioxide at low temperature inside a horizontal smooth tube. Heat Mass Transf. 2017, 53, 1631–1642. [Google Scholar] [CrossRef]
  22. Liang, Z.; Linlin, J.; Jianhua, L.; Yue, Z. Investigation of flow boiling heat transfer characteristics of CO2 in horizontal mini-tube. Int. J. Therm. Sci. 2019, 138, 109–115. [Google Scholar] [CrossRef]
  23. Jeon, M.J. Investigation of heat transfer and pressure drop for R744 in a horizontal smooth tube of R744/R404A hybrid cascade refrigeration system-part 1: Intermediate temperature region. Energies 2022, 15, 2285. [Google Scholar] [CrossRef]
  24. Kline, S.J.; McClintock, F.A. Describing Uncertainties in Single Sample Experiments. Mech. Eng. 1953, 75, 3–8. [Google Scholar]
  25. Moffat, R. Describing the uncertainties in experimental results. Exp. Therm. Fluid Sci. 1988, 1, 3–17. [Google Scholar] [CrossRef] [Green Version]
  26. Cheng, L.; Ribatski, G.; Wojtan, L.; Thome, J.R. New flow boiling heat transfer model and flow pattern map for carbon dioxide evaporating inside horizontal tubes. Int. J. Heat Mass Transf. 2006, 49, 4082–4094. [Google Scholar] [CrossRef]
  27. Cheng, L.; Ribatski, G.; Quiben, J.M.; Thome, J.R. New prediction methods for CO2 evaporation inside tubes: Part I—A two-phase flow pattern map and a flow pattern based phenomenological model for two-phase flow frictional pressure drops. Int. J. Heat Mass Transf. 2008, 51, 111–124. [Google Scholar] [CrossRef]
  28. Cheng, L.; Ribatski, G.; Thome, J.R. New prediction methods for CO2 evaporation inside tubes: Part II—An updated general flow boiling heat transfer model based on flow patterns. Int. J. Heat Mass Transf. 2008, 51, 125–135. [Google Scholar] [CrossRef]
  29. Han, J.U.; Kim, S.J.; Jung, D.S.; Kim, Y.I. Flow Boiling Heat Transfer Characteristics of R22 Alternative Refrigerants in a Horizontal Smooth Tube. Korean J. Air-Conditioning Refrig. Eng. 2001, 13, 242–251. [Google Scholar]
  30. Yun, R.; Kim, Y.C.; Kim, M.S. Two-phase flow patterns of CO2 in a narrow rectangular channel. In Proceedings of the 21st IIR International Congress of Refrigeration, Washington, DC, USA, 17–22 August 2003; pp. 1–7. [Google Scholar]
  31. Zhao, X.; Bansal, P. Experimental investigation on flow boiling heat transfer of CO2 at low temperatures. Heat Transf. Eng. 2009, 30, 2–11. [Google Scholar] [CrossRef]
  32. Park, C.Y.; Hrnjak, P.S. CO2 and R410A Flow boiling heat transfer and pressure drop at low temperatures in a horizontal smooth tube. Int. J. Refrig. 2007, 30, 166–178. [Google Scholar] [CrossRef]
  33. Yun, R.; Kim, Y.C.; Kim, M.S. Convective boiling heat transfer characteristics of CO2 in microchannels. Int. J. Heat Mass Transf. 2005, 48, 235–242. [Google Scholar] [CrossRef]
  34. Choi, K.I.; Pamitran, A.S.; Oh, J.T. Two-phase flow heat transfer of CO2 vaporization in smooth horizontal minichannels. Int. J. Refrig. 2007, 30, 767–777. [Google Scholar] [CrossRef]
  35. Thome, J.; Wojtan, L.; Ursenbacher, T. Investigation of flow boiling in horizontal tubes: Part 1—A new adiabatic two-phase flow pattern map. Int. J. Heat Mass Transf. 2005, 48, 2955–2969. [Google Scholar] [CrossRef]
  36. Oh, H.K.; Jo, H.; Son, C.H.; Jeon, M.J.; Yi, W.B. Evaporation heat transfer characteristics of carbon dioxide at low temperature of −30 °C~−50 °C. In Proceedings of the SAREK Summer Annual Conference, Toronto, ON, Canada, 7–10 July 2013; pp. 17–20. [Google Scholar]
  37. Choi, K.I.; Oh, J.T. Boiling Heat Transfer Ammonia inside Horizontal Smooth Small Tube. Korean J. Air-Cond. Refrig. Eng. 2013, 25, 101–108. [Google Scholar] [CrossRef]
  38. Lim, T.W.; Han, K.I. A Study on Heat Transfer Characteristics in Flow Boiling of Pour Refrigerants and Their Mixtures in Horizontal Tube. Korean J. Air-Cond. Refrig. Eng. 2003, 15, 144–151. [Google Scholar]
  39. Pettersen, J. Flow vaporization of CO2 in micro-channels tubes. Exp. Therm. Fluid Sci. 2004, 28, 111–121. [Google Scholar] [CrossRef] [Green Version]
  40. Chen, J.C. Correlation for boiling heat transfer to saturated fluids in convective flow. Ind. Eng. Chem. Process. Des. Dev. 1966, 5, 322–329. [Google Scholar] [CrossRef] [Green Version]
  41. Gungor, K.E.; Winterton, R.H.S. A general correlation for flow boiling in tubes and annuli. Int. J. Heat Mass Transf. 1986, 29, 351–358. [Google Scholar] [CrossRef]
  42. Kandlikar, S.G. A general correlation for saturated two-phase flow boiling horizontal and vertical tubes. J. Heat Transf. 1990, 112, 219–228. [Google Scholar] [CrossRef] [Green Version]
  43. Kenning, D.B.R.; Cooper, M.G. Saturated flow boiling of water in vertical tubes. Int. J. Heat Mass Transf. 1989, 32, 445–458. [Google Scholar] [CrossRef]
  44. Yoon, S.H.; Cho, E.S.; Hwang, Y.W.; Kim, M.S.; Min, K.; Kim, Y.C. Characteristics of evaporative heat transfer and pressure drop of carbon dioxide and correlation development. Int. J. Refrig. 2004, 27, 111–119. [Google Scholar] [CrossRef]
  45. Kandlikar, S.G. A model for correlating flow boiling heat transfer in augmented tubes and compact. J. Heat Transf. 1991, 113, 966–972. [Google Scholar] [CrossRef] [Green Version]
  46. Kandlikar, S.G.; Balasubramanian, P. An Extension of the flow boiling correlation to transition, laminar, and deep laminar flows in minichannels and microchannels. Heat Transf. Eng. 2004, 25, 86–93. [Google Scholar] [CrossRef]
  47. Bredesen, A.M.; Hafner, A.; Pettersen, J.; Nekså, P.; Aflekt, K. Heat transfer and pressure drop for in-tube evaporation of CO2. In Proceedings of the International Conference on Heat Transfer Issues in Natural Refrigerants, IIF-IIR, College Park, MD, USA, 6–7 November 1997; pp. 1–15. [Google Scholar]
  48. Yun, R.; Kim, Y. Two-phase pressure drop of CO2 in mini-tubes and micro-channels. Microscale Thermophys. Eng. 2004, 8, 259–270. [Google Scholar] [CrossRef]
  49. Moreno Quiben, J.; Thome, J.R. Flow pattern based two-phase frictional pressure drop model for horizontal tubes, Part II: New phenomenological model. Int. J. Heat Fluid Flow 2007, 28, 1060–1072. [Google Scholar] [CrossRef]
  50. Chisholm, D. The influence of mass velocity on friction pressure gradients during steam-water flow. Proc. Inst. Mech. Eng. Conf. Proc. 1967, 182, 35. [Google Scholar] [CrossRef]
  51. Grönnerud, R. Investigation of Liquid Hold-Up, Flow Resistance and Heat Transfer in Circulation Type Evaporators. Part 4: Two-Phase Flow Resistance in Boiling Refrigerants; Annexe 1972-1, Bull. de 1’Inst. de Froid; International Institute of Refrigeration (IIR): Paris, France, 1979. [Google Scholar]
  52. Friedel, L. Improved friction pressure drop correlation for horizontal and vertical two-phase pipe flow. Presented at the European Two-Phase Flow Group Meeting, Ispra, Italy, 5–8 June 1979; p. E2. [Google Scholar]
  53. Lockhart, R.W.; Martinelli, R.C. Proposed correlation of data for isothermal, two phase, two component flow in pipes. Chem. Eng. Prog. 1949, 45, 39–48. [Google Scholar]
  54. Muller-Steinhagen, H.; Heck, K. A simple friction pressure drop correlation for two-phase flow in pipes. Chem. Eng. Process. 1986, 20, 297–308. [Google Scholar] [CrossRef]
  55. Jung, D.S.; McLinden, M.; Radermacher, R.; Didion, D. A study of flow boiling heat transfer with refrigerant mixtures. Int. J. Heat Mass Transf. 1989, 32, 1751–1764. [Google Scholar] [CrossRef]
Figure 1. Schematic diagram of experimental apparatus for a CRS using R744 in low-temperature refrigeration cycle.
Energies 16 05108 g001
Figure 2. Schematic diagram of the evaporator used in the R744 evaporation heat transfer test [23].
Energies 16 05108 g002
Figure 3. Flow pattern map of carbon dioxide at different mass fluxes and a constant heat flux (17 kW/m2) and saturation temperature (−40 °C).
Energies 16 05108 g003
Figure 4. Flow pattern map of carbon dioxide at different saturation temperatures under a constant mass flux (125 kg/(m2·s)) and heat flux (17 kW/m2).
Energies 16 05108 g004
Figure 5. Flow pattern map of carbon dioxide at different heat fluxes under a constant mass flux (125 kg/(m2·s)) and saturation temperature (−40 °C).
Energies 16 05108 g005
Figure 6. Variation of heat transfer coefficient at different mass fluxes under a constant heat flux (17 kW/m2) and saturation temperature (−40 °C).
Energies 16 05108 g006
Figure 7. Variation in heat transfer coefficient at different saturation temperatures under constant heat and mass fluxes (G: 125 kg/(m2·s), q: 17 kW/m2).
Energies 16 05108 g007
Figure 8. Variation in heat transfer coefficient at different heat fluxes under constant mass flux (125 kg/(m2·s)) and saturation temperature (−40 °C).
Energies 16 05108 g008
Figure 9. Comparison of experimental data with the heat transfer coefficients calculated using the existing correlations under each given condition (ac) [40,41,42,43,44].
Energies 16 05108 g009
Figure 10. Comparison of experimental data with the heat transfer coefficients calculated using the existing correlations [40,41,42,43,44].
Energies 16 05108 g010
Figure 11. Variation in experimental pressure drop at different mass fluxes under a constant heat flux (17 kW/m2) and saturation temperature (−40 °C).
Energies 16 05108 g011
Figure 12. Variation in experimental pressure drop at different saturation temperatures under constant mass and heat fluxes (125 kg/(m2·s) and 17 kW/m2).
Energies 16 05108 g012
Figure 13. Variation in experimental pressure drop at different heat fluxes under a constant mass flux and saturation temperature (125 kg/(m2·s), −40°C).
Energies 16 05108 g013
Figure 14. Comparison of experimental data with pressure drop calculated using the existing correlations under each given condition (ac) [50,51,52,53,54,55].
Energies 16 05108 g014
Figure 15. Comparison between measured and calculated frictional pressure drops [50,51,52,53,54,55].
Energies 16 05108 g015
Table 1. Specifications of R744 evaporator [23].
ItemsEvaporator
Inner tubeMaterialCopper
Inside diameter [mm]11.46
Outside diameter [mm]12.7
Outer tubeMaterialCopper
Inside diameter [mm]33.27
Outside diameter [mm]34.92
Evaporator length [mm]8000
Table 2. Experimental conditions for evaporative heat transfer of R744.
VariableValue
RefrigerantR744
Test sectionHorizontal smooth tube
Inner diameter of tube [mm]11.46
Tube length [mm]8000
Mass flux [kg/(m2·s)]76.3, 124.5, 175.1
Saturation temperature [°C]−49.8, −45.1, −40.3, −34.9, −30.2
Heat flux [kW/m2]11.8, 17.1, 21.3
Quality0~1
Table 3. Details of measuring equipment.
Measuring EquipmentDetail
R404A Mass flow rateOval Ultra mass MKII Flow meter, model: CT9401-CN10, Range: 0–24 kgmin−1
R744 Mass flow rateOval Ultra mass MKII Flow meter, model: CT9401-CN06, Range: 0–12 kgmin−1
Ethylene glycol flow rateCorea Flow, model: TBN-II-AD (Turbine flowmeter), Range: 0.6~6 m3h−1
TemperatureONDI, model: TT-TE (T-type), Range: −270–400 °C
Pressure transmitterWIKA, model: S-10, Range: 0–160 bar abs, 0–5 V
Power meterYOKOGAWA Digital power meter, model: WT230, Range: 15–600 V, 0.5–20 A, 0.5–100 kHz
Table 4. Parameters and estimated uncertainties [23].
ParameterUnitUncertainty
Inner diameter[mm]±0.05
Length, width, and thickness[m]±0.005
Mass flow rate of coolant[kg/h]±7.53
Mass flux of refrigerant[kg/(m2·s)]±1.5
Temperature[°C]±0.2
Pressure[kPa]±5.27
Δ P (Pressure drop)[kPa]±0.01
Heat flux[kW/m2]±0.15045
Heat transfer coefficient[kW/(m2·°C)]±0.597
Table 5. Variation of Reynolds number at different mass fluxes under a constant saturation temperature (−40 °C) and heat flux (17 kW/m2).
G [kg/(m2·s)] V [m/s] μ [N·s/m2] ρ [kg/m3] D [m] Re [/]
76.30.068340.000193811170.011464512
124.50.11150.000193811170.011467362
175.10.15680.000193811170.0114610,354
Table 6. Variation of properties (thermal conductivity, density ratio, and Prandtl number) at different saturation temperatures.
T S A T   [ ° C ] k [kW/(m·K)] ρ l / ρ v   [ / ] Pr [/]
−49.80.171864.412.631
−45.10.165352.32.536
−40.30.158942.742.453
−34.90.152635.122.384
−30.20.1463292.327
Table 7. Variation of properties (specific volume ratio, surface tension) with respect to different saturation temperatures.
T S A T   [ ° C ] v v / v l   [ / ] σ [N/m]
−49.864.410.01432
−45.152.30.01324
−40.342.740.01217
−34.935.120.01111
−30.2290.01008
Table 8. Evaporative heat transfer correlations reported by several researchers [23].
ResearcherCorrelation
Chen [40] h t p = S · h n b + F · h c b (1)
Gungor-Winterton [41] h t p = E · h l + S · h p o o l (2)
Kandlikar [42] h N B D = { ( 0.6683 C o 0.2 ) ( 25 F r l o ) 0.3 + ( 1058.0 B o 0.7 F f l ) } h l (3)
h C B D = { ( 1.1360 C o 0.9 ) ( 25 F r l o ) 0.3 + ( 667.2 B o 0.7 F f l ) } h l (4)
Kenning-Cooper [43] h t p = ( 1 + 1.8 X t t 0.87 ) h s p (5)
Yoon et al. [44] h t p = [ ( S · h n b ) 2 + ( E · h l ) 2 ] 1 / 2 (6)
Table 9. Comparison of deviation between the calculated and experimental heat transfer coefficients for all data prior to CHF.
CorrelationChen [40]Gungor-Winterton [41]Kandlikar [42]Kenning-
Cooper [43]
Yoon et al. [44]
Deviation
Average deviation (%)−0.53−25.10−10.51−13.40−24.86
Absolute mean deviation (%)10.3726.3510.5121.8725.02
Table 10. Variation in properties (liquid viscosity, vapor viscosity, and viscosity ratio) at different saturation temperatures.
T S A T   [ ° C ] μ l   [ kg / ( m · s ) ] μ v   [ kg / ( m · s ) ] μ l / μ v   [ / ]
−49.80.00022940.0000113120.28
−45.10.00021070.0000115818.19
−40.30.00019380.0000118716.33
−34.90.00017840.0000121614.67
−30.20.00016420.0000124613.18
Table 11. Variation in properties (liquid density, vapor density, and density ratio) at different saturation temperatures.
T S A T   [ ° C ] ρ l   [ kg / m 3 ] ρ v   [ kg / m 3 ] ρ l / ρ v   [ / ]
−49.8115517.9364.41
−45.1113621.7252.3
−40.3111726.1242.74
−34.9109731.2235.12
−30.2107637.129
Table 12. Correlations for calculating pressure drops, as proposed by several researchers [23].
ResearcherCorrelation
Chisholm [50] ( d P d z ) f Φ l o 2 · ( d P d z ) l o (7)
Grönnerud [51] ( d P d z ) f = Φ g d 2 · ( d P d z ) l (8)
Friedel [52] ( d P d z ) f = ( d P d z ) l o · Φ l o 2 = f l o G re 2 2 ρ l d i Φ l o 2 (9)
Lockhart-Martinelli [53] ( d P d z ) f = Φ l t t 2 · ( d P d z ) l (10)
( d P d z ) f = Φ v t t 2 · ( d P d z ) v (11)
Muller-Steinhagen-Heck [54] ( d P d z ) f = G · ( 1 x ) 1 3 + B x 3 (12)
Jung et al. [55] ( d P d z ) f = Φ l o 2 · ( d P d z ) l o (13)
Table 13. Comparison of deviation between the calculated and experimental pressure drops for all data.
AuthorsChisholm [50]Grönnerud [51]Friedel [52]Lockhart and Martinelli [53]Muller-Steinhagen and Heck [54]Jung et al. [55]
Deviation
Average deviation (%)−29.4525.57−8.658.1021.58−10.36
Absolute mean deviation (%)32.7626.238.508.3121.8827.83
Disclaimer/Publisher’s Note: The statements, opinions and data contained in all publications are solely those of the individual author(s) and contributor(s) and not of MDPI and/or the editor(s). MDPI and/or the editor(s) disclaim responsibility for any injury to people or property resulting from any ideas, methods, instructions or products referred to in the content.

