1. Introduction
With the phaseout of thermal power plants and integration of variable renewables such as wind and PV, the demand for operational flexibility in power systems changes and increases. Therefore, the capability of existing hydropower plants to offer such flexibilities, and to even extend it, is becoming even more important. The worldwide installed hydropower capacity hit 1369 GW in 2021. An additional 26 GW of capacity was added in 2021, including pumped storage. The total installed pumped-storage capacity exceeded 165 GW. In that year, around 4250 TWh of electricity was generated from hydropower, according to [
1]. In [
2], the hydropower project pipeline from 2022 to 2037 is described. According to [
2], new installations of 651 GW (of which 136 GW are pumped storage) are foreseen. Hence, the existing hydropower fleet plays not only an important role in carbon-free power generation but also in the integration of wind and PV by providing flexibility.
In [
3], the contribution of hydropower to grid resilience is described. In particular, it is noted that hydropower plants can enhance a system’s response and recovery attributes by including a wide band of frequency ride-through ability. Further, it is mentioned that hydropower plants are an important resource for inertial and governor response during extreme events. To increase the operational flexibility of hydropower plants (HPP) even further, existing limitations, which are defined by the HPP type (e.g., run-of-river, pumped-storage hydro, reservoir type etc.), must be overcome by means of technological improvements. At the same time, other regulations (e.g., the water framework directive) must be respected at all times.
In the Horizon 2020-funded XFLEX HYDRO project [
4], a consortium of 19 partners demonstrates different types of HPPs, including how more flexibility can be provided to enable the integration of even more intermittent renewables. In total, innovations are demonstrated at seven HPP locations in Portugal, France and Switzerland. Demonstrated technologies include a conversion to variable speed, operation with hydraulic short circuit and a hydro–battery hybrid system. At the hydro–battery hybrid system, the benefits of providing FCR with a run-of-river power plant and a BESS are studied.
In [
5], the load-frequency control process of the ENTSO-E synchronous area is described (
Figure 1). Whenever an imbalance between supply and demand occurs, the frequency starts to deviate from its controlled value (e.g., 50 Hz). A drift of the frequency is stabilized by means of the frequency containment process within permissible limits. After that, the frequency restoration process is activated in the load-frequency control (LFC) areas where the disturbance occurred. This process ensures that the frequency is restored to the frequency setpoint. European TSOs cover the FCR demand via a cooperation [
5]. The total demand of FCR within this cooperation is 1531 MW (approximately 514 MW in France and 593 MW in Germany) [
6].
To deliver FCR, the contracted active power has to be provided for full activation (200 mHz) within 30 s [
8,
9]. The optimization and sizing for stand-alone BESS were, for example, discussed in [
10,
11,
12]. A practical approach to sizing BESS for FCR provision was proposed in [
13], in particular, for power systems with a large wind power penetration level. In [
10], a general formulation was derived to obtain the minimum size of a stand-alone BESS. To provide 1 MW of FCR with a stand-alone BESS, a minimum BESS size of 1.6 MW/1.6 MWh was obtained. Hence, reserves in terms of sizing must be considered to comply with FCR requirements and ensure a sufficient service life to reach economic viability. An alternative to providing FCR with a stand-alone BESS, or any type of generation technology, is to use a hybrid system. With a hybrid system, two different systems can be combined in such a way that FCR requirements are fulfilled. Thereby, both systems are used to the full extent and according to their capabilities.
In [
14], it was found that hybridizing the hydropower plant can generate additional revenue while simultaneously enabling more environmentally friendly operations and reducing the overall ramping mileage (sum of up and down ramping) of the turbines to approximately 1/5th of the mileage from hydropeaking operations.
The advantages of operating a BESS with a pumped-storage plant to increase its flexibility based on live test results were described in [
15]. The authors summarize that the combination of three pumped-storage units and a BESS substantially increases the flexibility of the operator’s FCR reserve pool. This is obtained with two features: fast ramping with the BESS and large autonomy of pumped hydro.
In [
16,
17], the advantages of combining run-of-river (RoR) hydropower plants with BESS is presented. The analysis shows that the movement of guide vanes and runner blades can be reduced significantly with a properly sized BESS.
At the XFLEX HYDRO Vogelgrun demonstrator, a run-of-river power plant, frequency containment reserve (FCR) is provided with a hydro–battery hybrid. In doing so, the target is not only to increase the frequency response dynamics, but also to reduce the wear and tear of the turbine.
In general, run-of-river power plants with double-regulated Kaplan turbines encounter a high impact when providing FCR. The challenges of permanent blade movements in stand-alone Kaplan units due to FCR provision was analyzed in [
18,
19,
20]. The drawback is a significant increase in load stress, which reduces the lifetime of the turbines and increases the probability of outages. The author describes that the main driver of providing FCR with run-of-river units is to free up more flexible storage power plants to deliver products with a higher revenue (e.g., frequency restoration reserve—FRR). The outcomes of this analysis were then used to derive specifications for a new turbine design for a turbine replacement.
In [
21], an optimal control strategy to provide FCR with hydropower units was discussed. The purpose of the control strategy is to use fast storage power plants for small frequency deviations, while for larger frequency disturbances, RoR on the Danube River are activated.
In [
2], benefits of operating a hybrid power plant are listed:
Ensuring that the BESS is charged with clean energy.
Allowing the producer to extract value out of the minimum flows.
Increasing the provision of ancillary services through the large increase in capacity.
On the other hand, a review of the BESS aging caused by FCR provision, based on operational data, carried out in [
22] shows that after 5 years of operation, lithium-ion batteries suffered only a loss of 5% in state-of-health (SoH).
In [
23], results of different types of aging tests performed by the Italian transmission system operator (Terna) applied to several electrochemical technologies are presented. While some lithium-based technologies were not influenced by the cycle type and by its features in terms of both energy and power, other technologies suffered a 20% capacity decrease after the performed tests. The authors conclude that further research is necessary in order to deeply understand what determines the premature aging of some storage technologies during FCR provision.
For all demonstrators in the XFLEX HYDRO project, an aggregated ancillary services matrix was developed. Within this ancillary services matrix, the performance of each demonstrated technology for different grid services was evaluated [
24].
The paper is organized as follows. In
Section 2, the demonstrator is explained in detail. In
Section 3, the control strategy, monitoring concept and methodology of benchmarking the benefits of the hybridization are described. In
Section 4, field results of the demonstrator are presented. A conclusion and outlook are given in
Section 5.
2. Description of the XFLEX HYDRO Vogelgrun Demonstrator
In this section, the XFLEX HYDRO Vogelgrun demonstrator is described.
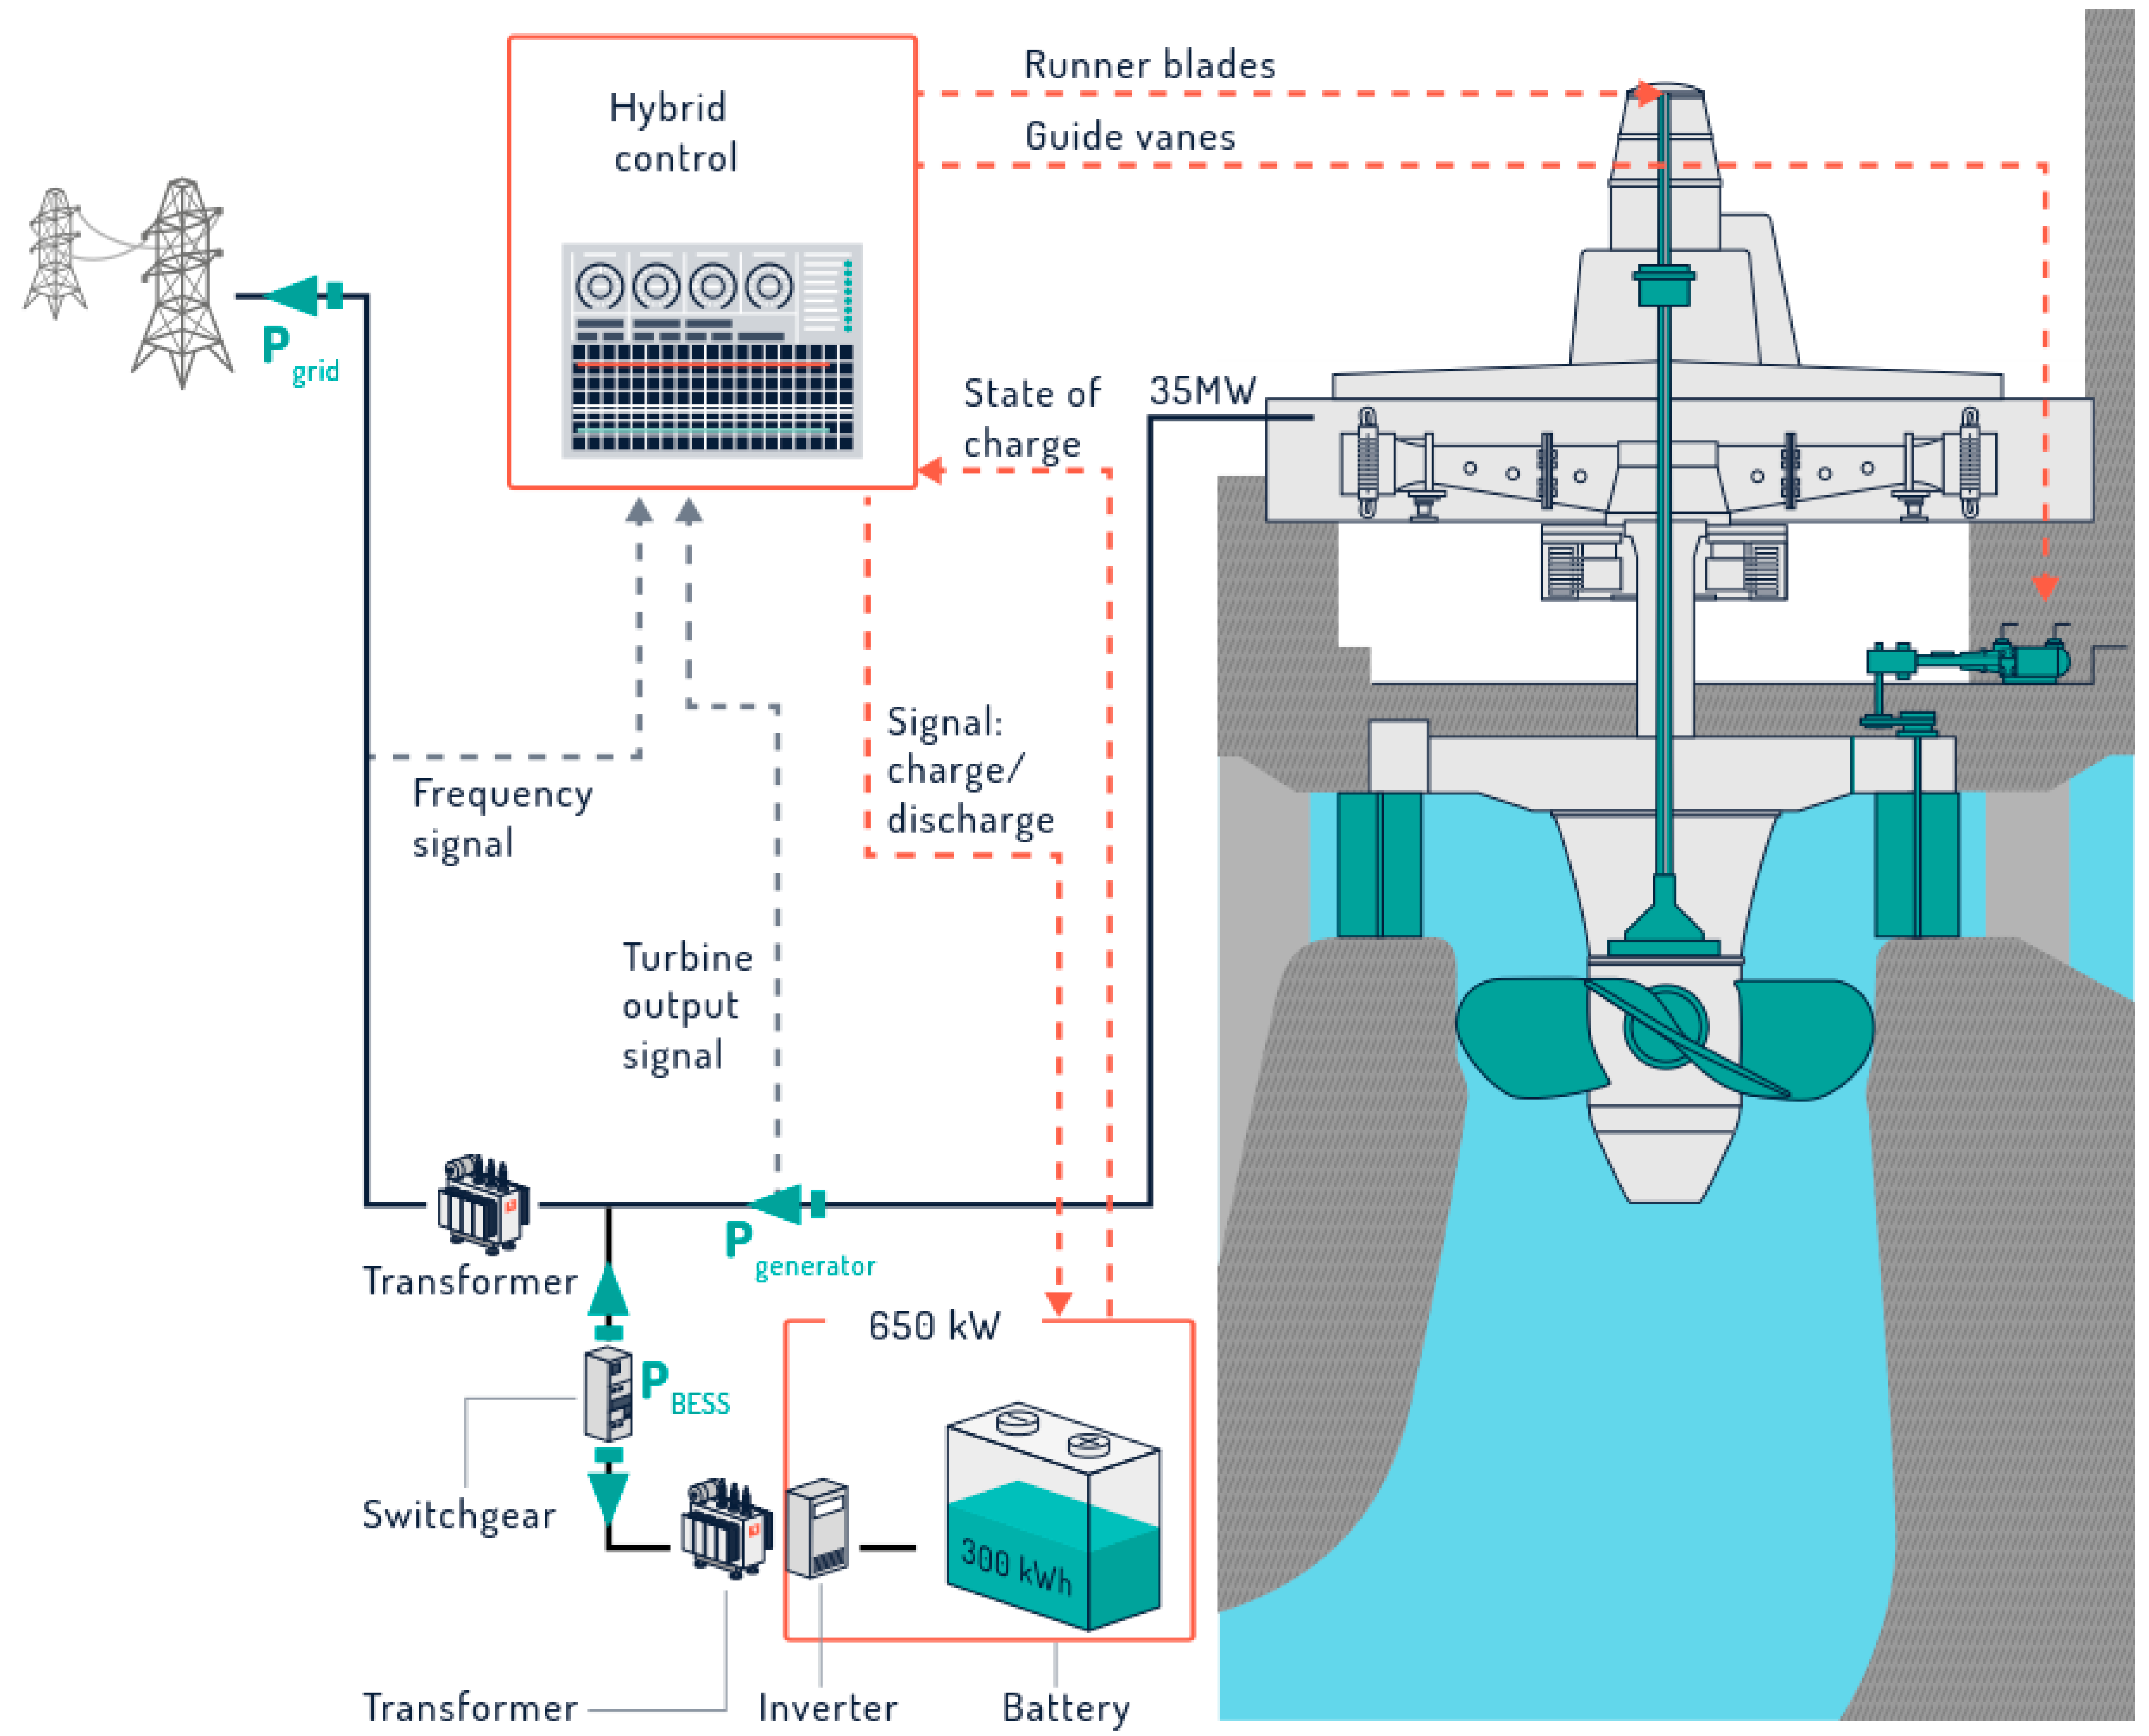
In the run-of-river (RoR) HPP Vogelgrun, four Kaplan units with a nominal power of 35 MW are installed. At this demonstrator, the hybridization of one turbine-generator-unit (TG-unit) with a battery energy storage system (BESS) of 650 kW/370 kWh is assessed. The technical and economical constraints in the optimization of the BESS size were described in [
25]. The target of the demonstrator is to improve FCR provision and dynamics with a hybrid system, increase the flexibility capability and, at the same time, reduce wear and tear compared to a non-hybrid TG-unit by 90%. Furthermore, a minimally sized BESS shall be used. The four TG-units provide 4 MW of FCR each. Additionally, the existing speed governor of the hybridized TG-unit shall not be replaced.
In the case of the Vogelgrun demonstrator, the response time of 30 s for FCR provision is met thanks to a hybrid controller and a dedicated algorithm splitting the active power setpoint to the BESS and the TG-unit, which has a slower response.
In
Figure 2, the scheme of the control of the hybrid system is shown. A hybrid controller measures the grid frequency and distributes the FCR setpoint to the existing speed governor and the BESS, while considering the state of charge (SoC).
3. Methodology
In this section, the control strategy of the hybrid system is described. Further, the monitoring concept, wear and tear assessment as well as developed real-time simulation models are explained.
3.1. Control Strategy of the Hybridized Unit
The Vogelgrun hybrid demonstrator is driven by FCR dynamic response and by wear and tear reduction. These two goals led to the hybridization algorithm, which consists of controlling HPP and BESS power simultaneously. Indeed, at every moment, the sum of these two powers on the grid has to be equal to the power expected by the TSO regarding the frequency deviation.
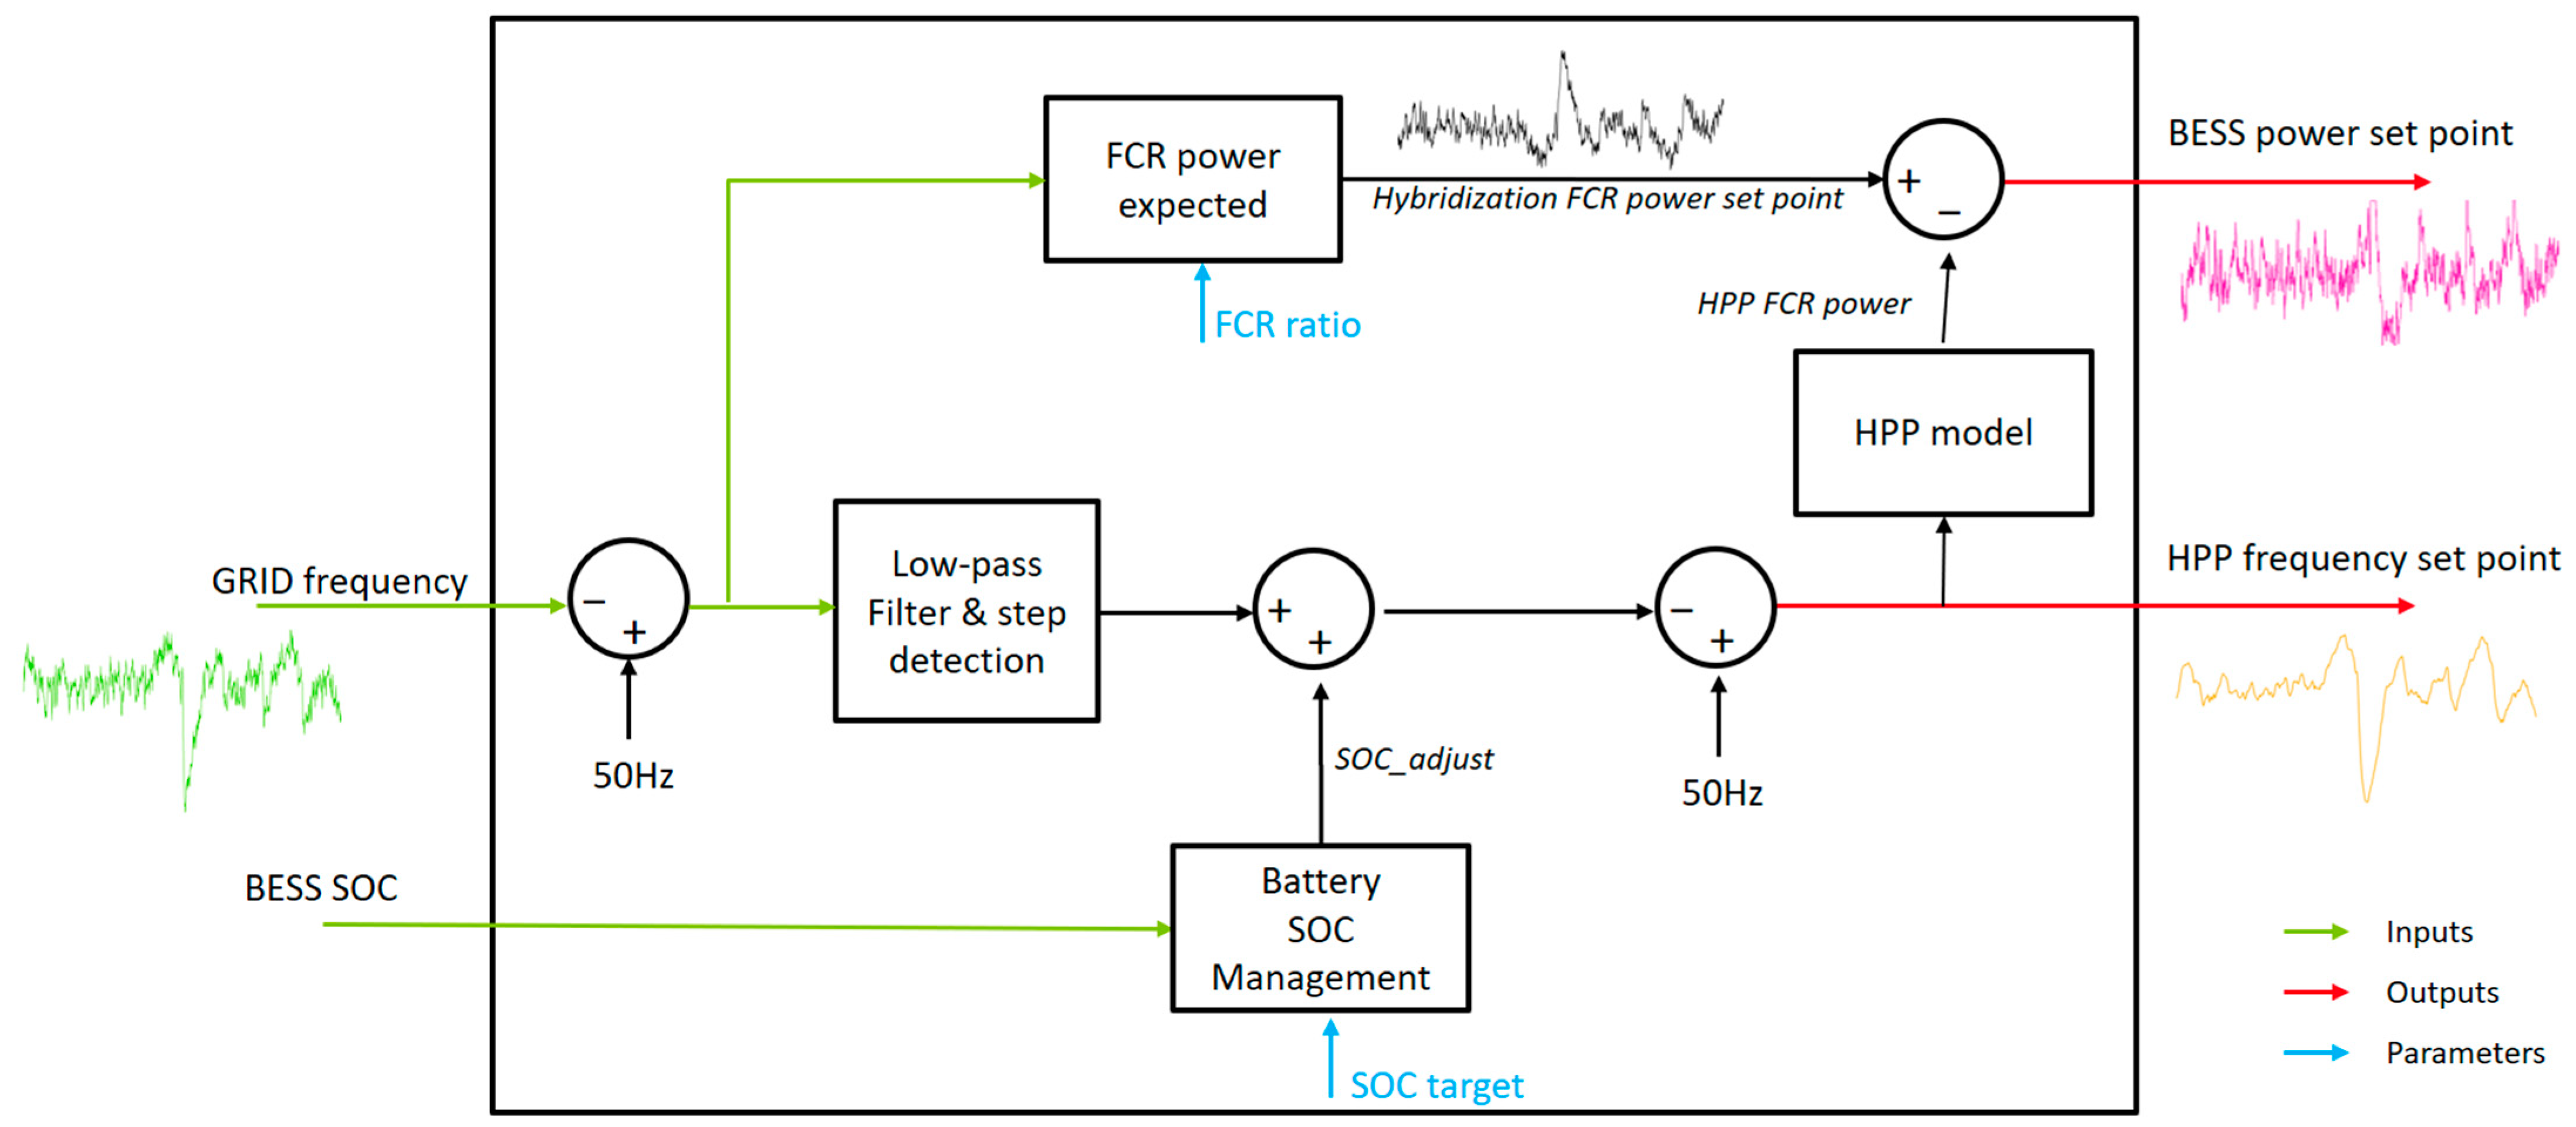
The diagram in
Figure 3, presents the control overview where grid frequency and BESS SoC signals are the inputs of the algorithm and where BESS power and HPP frequency set points are the outputs of the controller. In general, the HPP’s controller uses the frequency signal to modulate its power generation regarding frequency deviation. The aim of the hybridization algorithm is to control the HPP’s power through its actual governor, thus utilizing existing hardware. For this purpose, the hybrid controller recreates an analogic frequency signal to control the existing turbine governor. Computation steps of this algorithm are explained in the following paragraphs.
HPP control is based on filtered grid frequency modulated with SoC management. The first block named “Low-pass Filter & step detection” is a first-order low pass filter and creates the “smooth version” of the grid frequency signal. The time constant of this filter is set to 30 s (modified to 100 s) and was chosen to optimize wear and tear and FCR coverage. Moreover, a step detection process is also computed in this block and compares the temporal variation in the frequency to a threshold. Abrupt variations in the frequency are detected, and the magnitude of filtered signal is boosted by a gain of 1.2 to speed up the power time response of the HPP. Finally, the filtered signal is updated using the signal provided by the block named “battery SOC management”. Indeed, when the DC power profile applied to the battery is not symmetrical in terms of energy, efficiency is not 100% and the BESS quickly reaches lower values of SoC. The battery SoC management block addresses this behavior and operates the BESS around a SoC target. The strategy is to modulate energy provided by the HPP to charge or discharge batteries to maintain the BESS’ SoC target level.
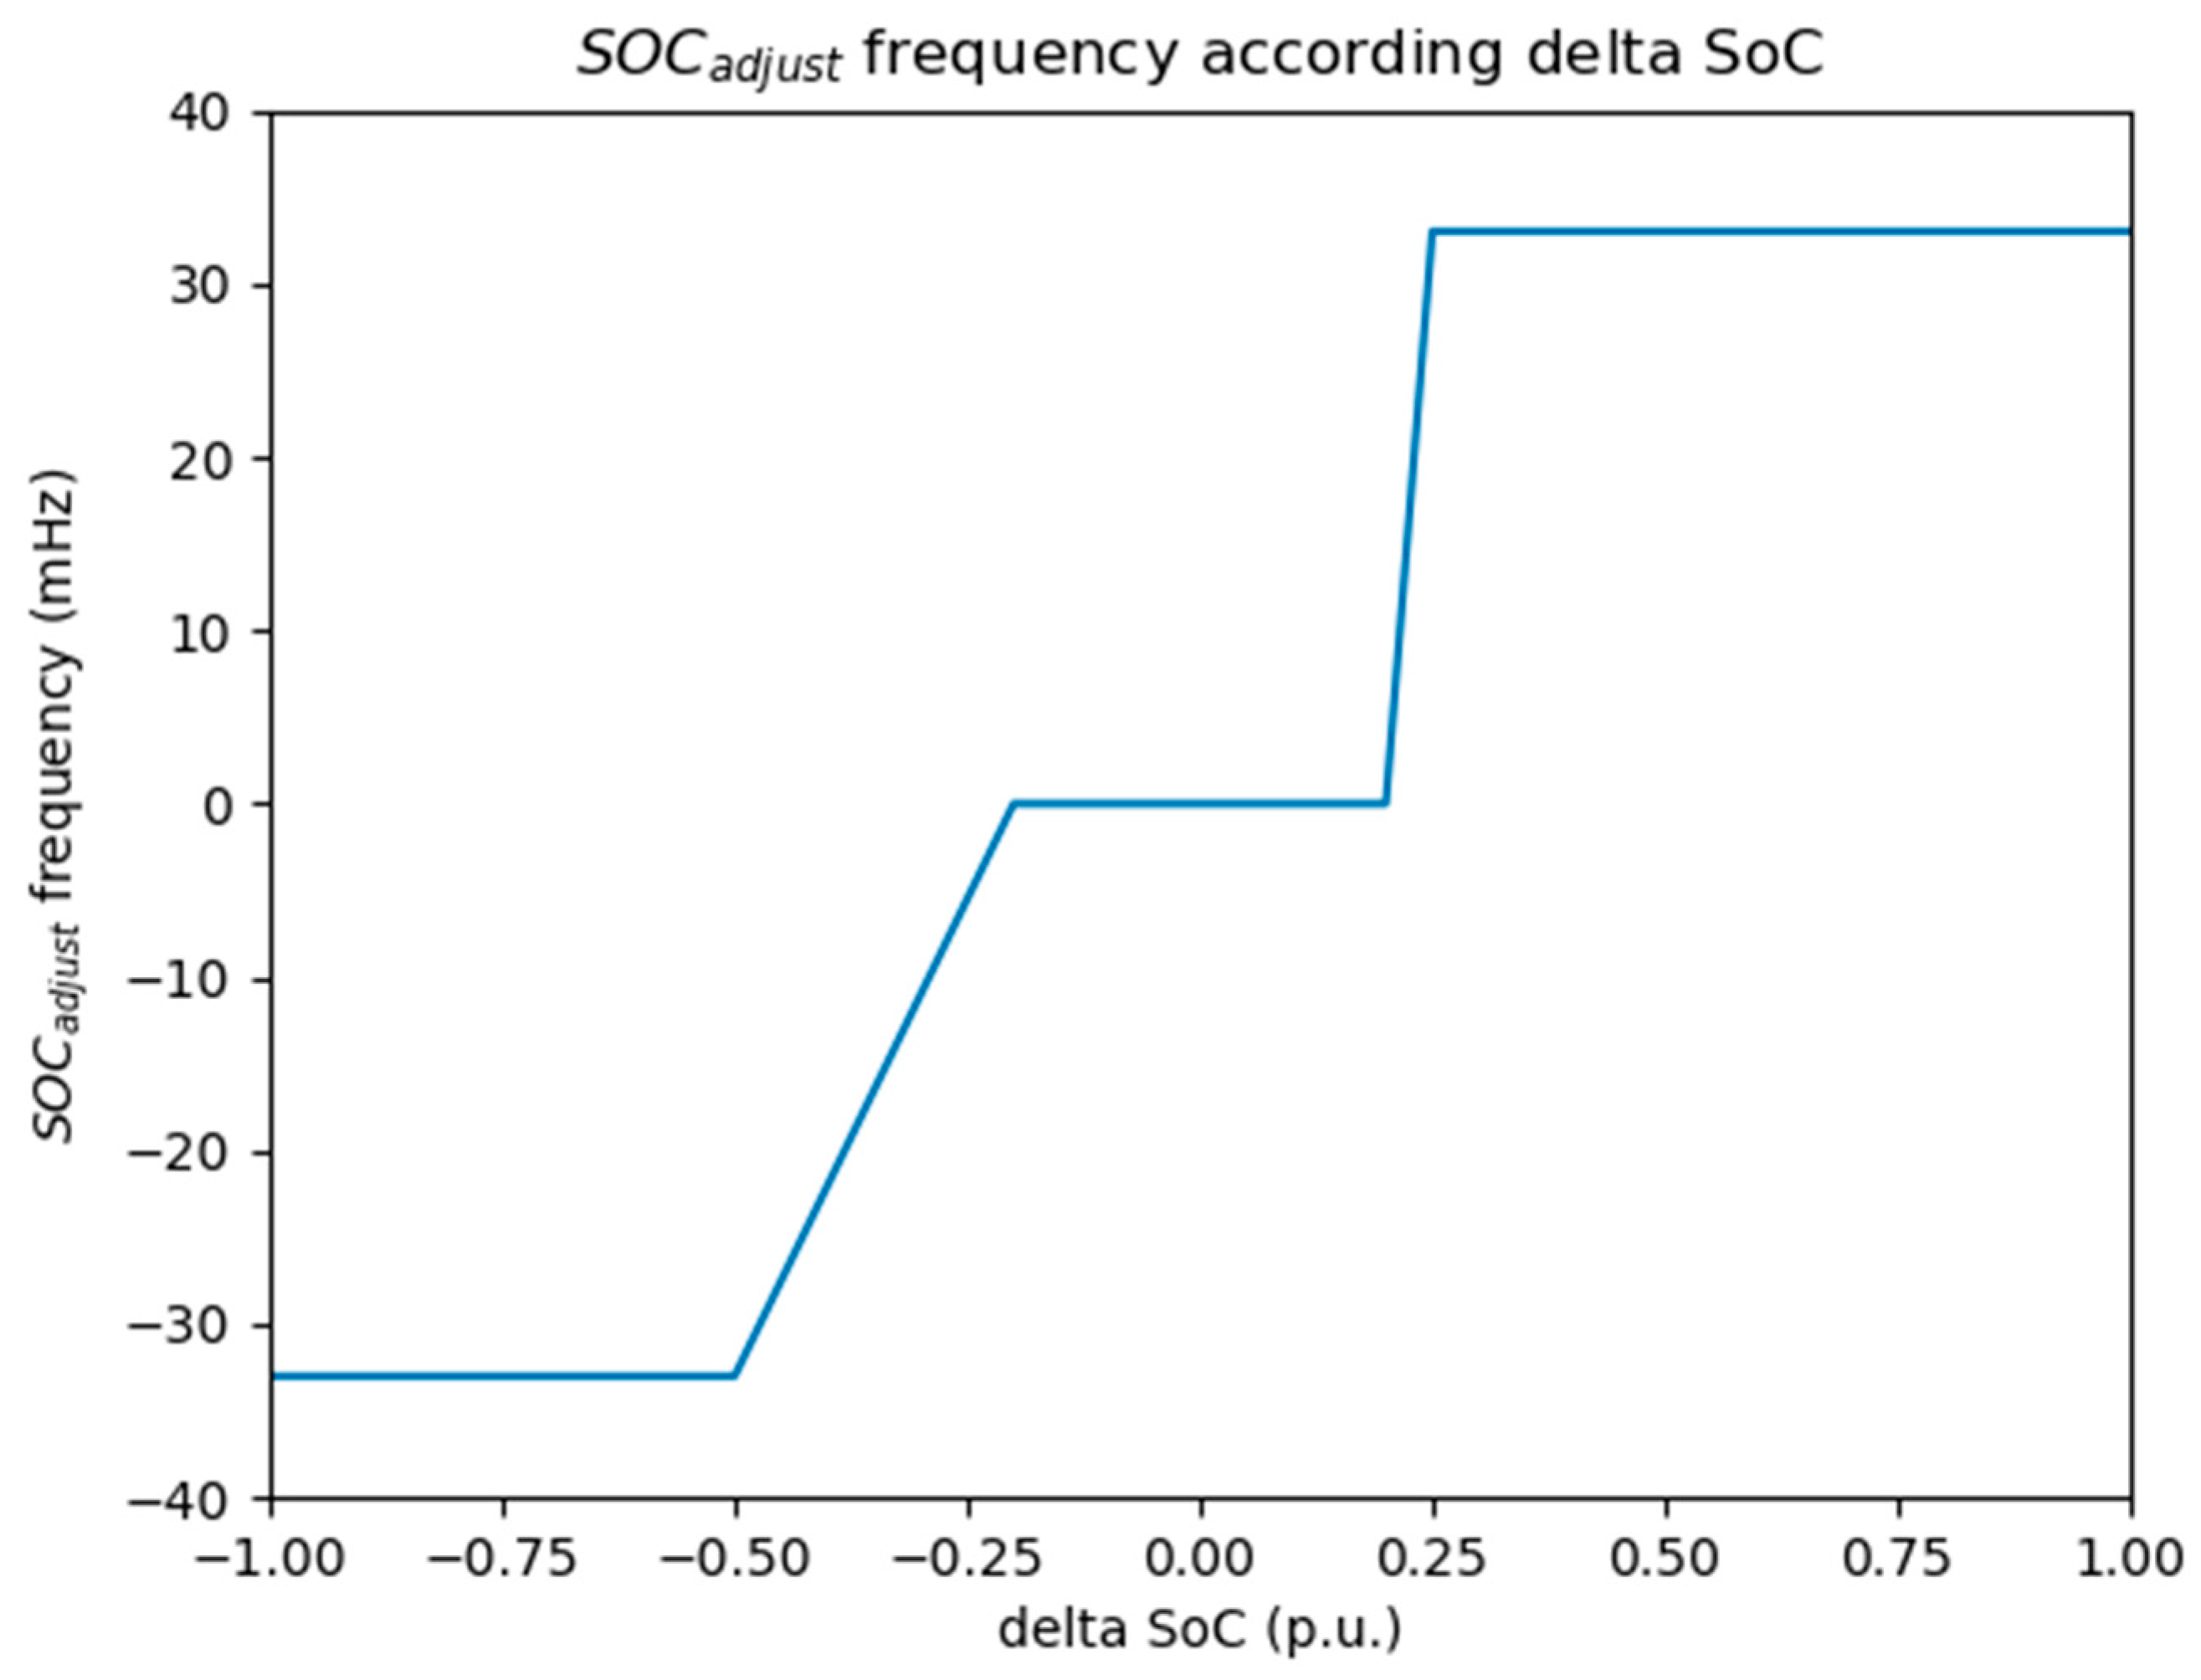
When the operating SoC does not reach the SoC target parameter, the signal “SOC_adjust” deviates from the frequency set point of the HPP according to the lookup table presented in
Figure 4. The input is the delta SoC, computed as the difference between the battery’s SoC and a constant parameter SOCtarget (fixed to 0.6, in order to limit battery aging). Therefore, when the SoC is in the range from 40% to 80% (and delta SoC in the range [±0.2]), the “SOC adjust signal” remains close to 0 and no extra or deficient power from the HPP is used to manage the BESS energy stock. However, when the SoC is in the range from 10% to 40% (and delta SoC in the range [−0.5–0.2]), linear correction is used, and the frequency signal sent to the HPP is decreased. Accordingly, the HPP’s power increases and the overproduction is used to charge batteries. The frequency adjustment signal is saturated to +/−32.5 mHz and corresponds to the maximum BESS power (650 kVA). In the same manner as presented previously, when the SoC is in the range from 80% to 85% (and delta SoC in the range [0.2–0.25]), linear correction is used, and the frequency signal sent to the HPP is increased. As a result, the HPP’s power decreases and the BESS is discharged to provide more energy to the grid.
The BESS power setpoint is the difference between the power required by FCR response (“Hybridization FCR power setpoint”) and the power provided by the HPP controlled with frequency signals from a hybrid controller. The regulating power, “Hybridization FCR power setpoint”, is computed as the frequency deviation from 50 Hz multiplied by a ratio, “FCR ratio”, fixed to 20 MW/Hz. Unfortunately, the power provided by the HPP controlled with frequency signals from a hybrid controller is physically unmeasurable. This signal is estimated by the “HPP model” block from the HPP frequency setpoint, and it corresponds to a first-order model with a time constant measured on the TG-unit.
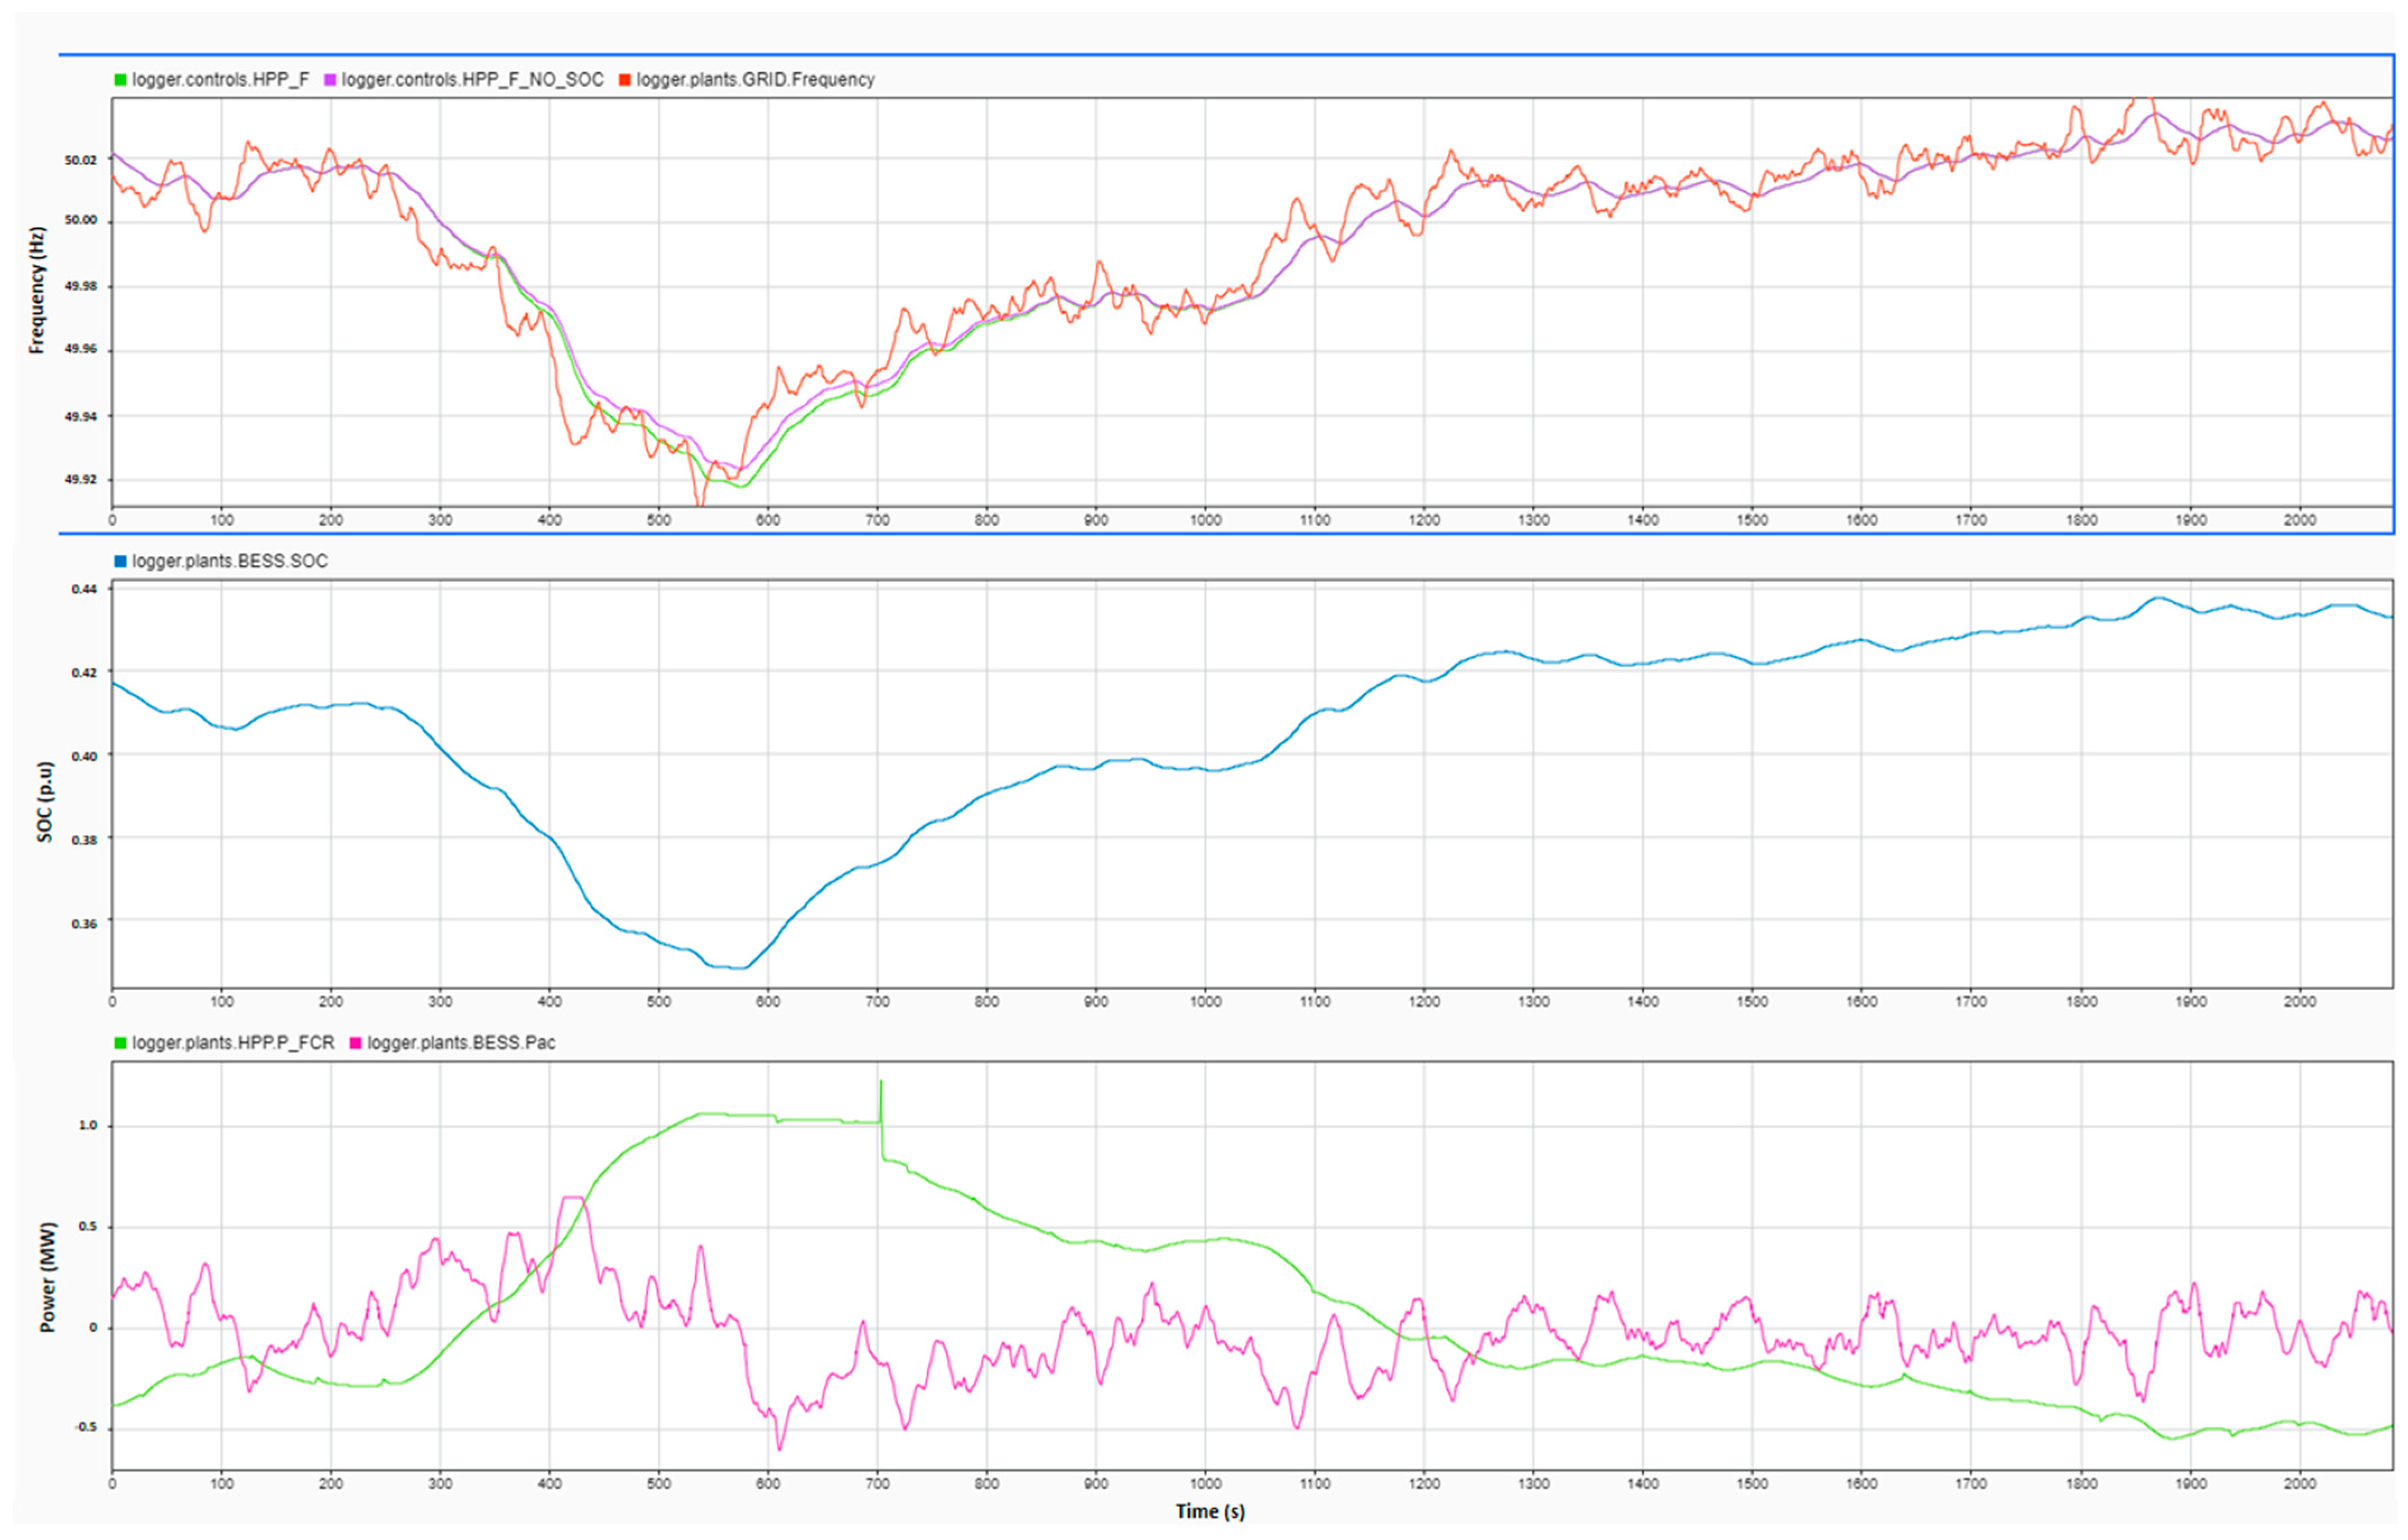
Considering the rules of the SoC management block described previously,
Figure 5 presents the behavior of the controller regarding the SoC (blue curve in the middle plot) during a frequency deviation (red curve in the top plot). In the case of under-frequency (<50 Hz), the battery is discharged, and the SoC signal decreases (from time 250 s to 580 s). After time 300 s, the SoC is lower than 40% and the SoC management strategy influence is visible with the difference between the HPP frequency signal setpoint with adjustment (green curve in the top plot) and without adjustment (output filter signal, purple curve in the top plot). After time 580 s, the BESS’s output power (pink curve in the bottom plot) becomes negative, and the BESS is charged with increased HPP output power (green curve in bottom plot).
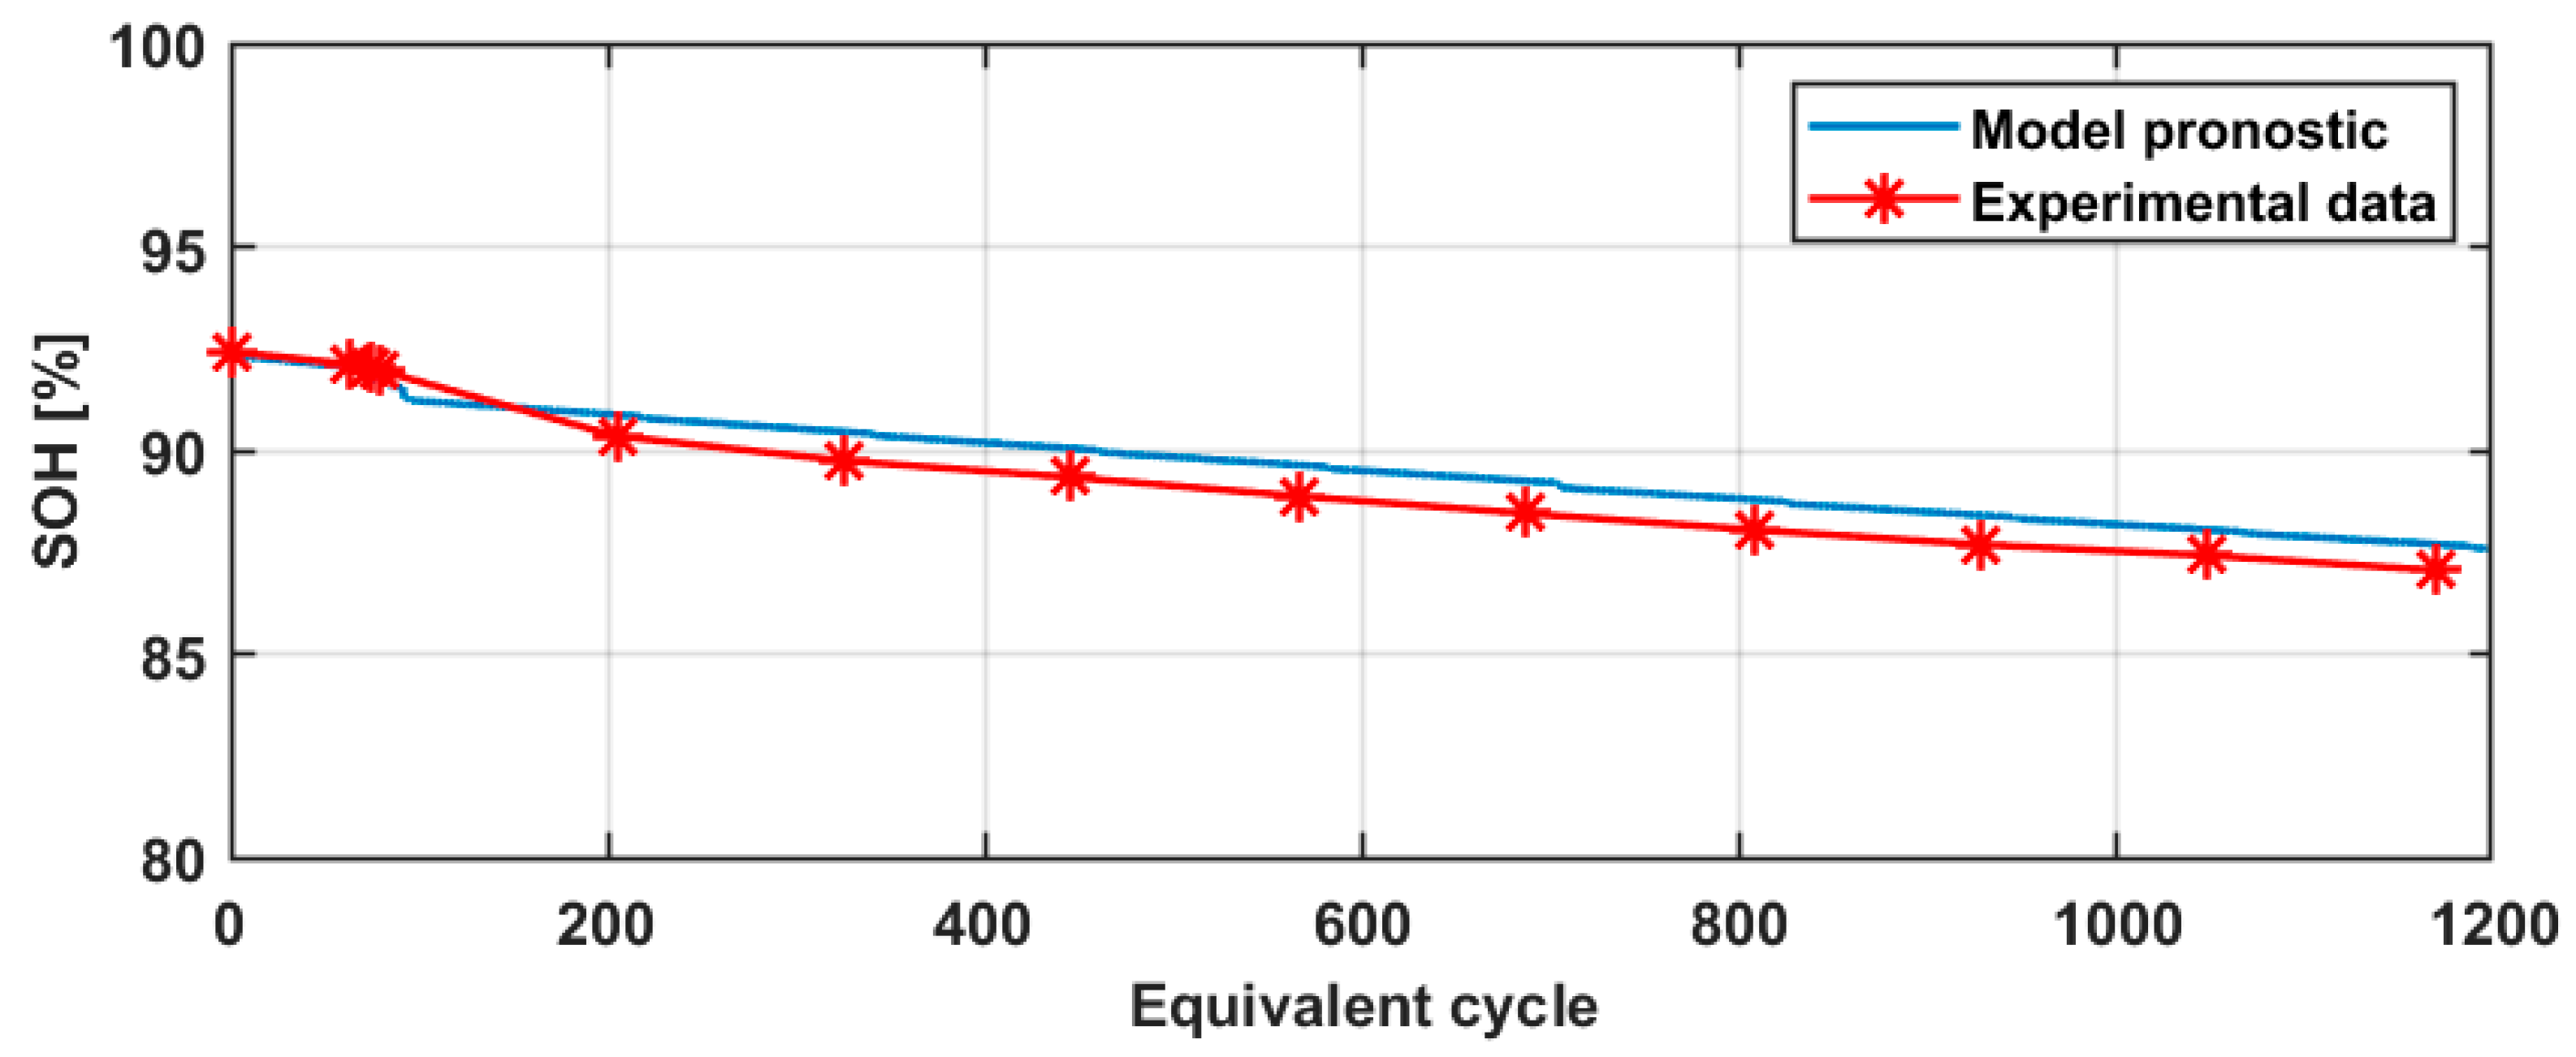
Additionally, an aging campaign on a testing bench with climatic chamber regulation at 25 °C on lithium-ion C/NMC cells representative of the ones used in the Vogelgrun demonstrator was conducted. The power profile is made of 2 phases, and it was tested in February 2020. The aging phase consists of applying 3 weeks of the current profile based on a February 2018 FCR power profile followed by a check-up test phase to the control cell’s capacity. The initial state of health (SoH) is not at 100% as experimental cells faced calendar aging prior to the aging campaign.
Figure 6 shows the comparison between experimental (in red) and model prognostic results (in blue). This comparison highlights that the model prognostic is very close to the experimental results and the SoH error, defined as total energy throughput divided by 2-times the nominal energy, remains below 1% after 1200 equivalent cycles.
In [
26], a model-based control strategy for optimal asset management of hydroelectric units in run-of-river hydropower plants is presented. The proposed control strategy aims to operate the unit at the best efficiency while improving water flow management and minimizing components’ wear during frequency containment reserve provision.
Figure 5.
Simulation of BESS operation with SoC management implementation.
Figure 5.
Simulation of BESS operation with SoC management implementation.
Figure 6.
Experimental results vs. model prognostic comparison.
Figure 6.
Experimental results vs. model prognostic comparison.
3.2. Monitoring Concept
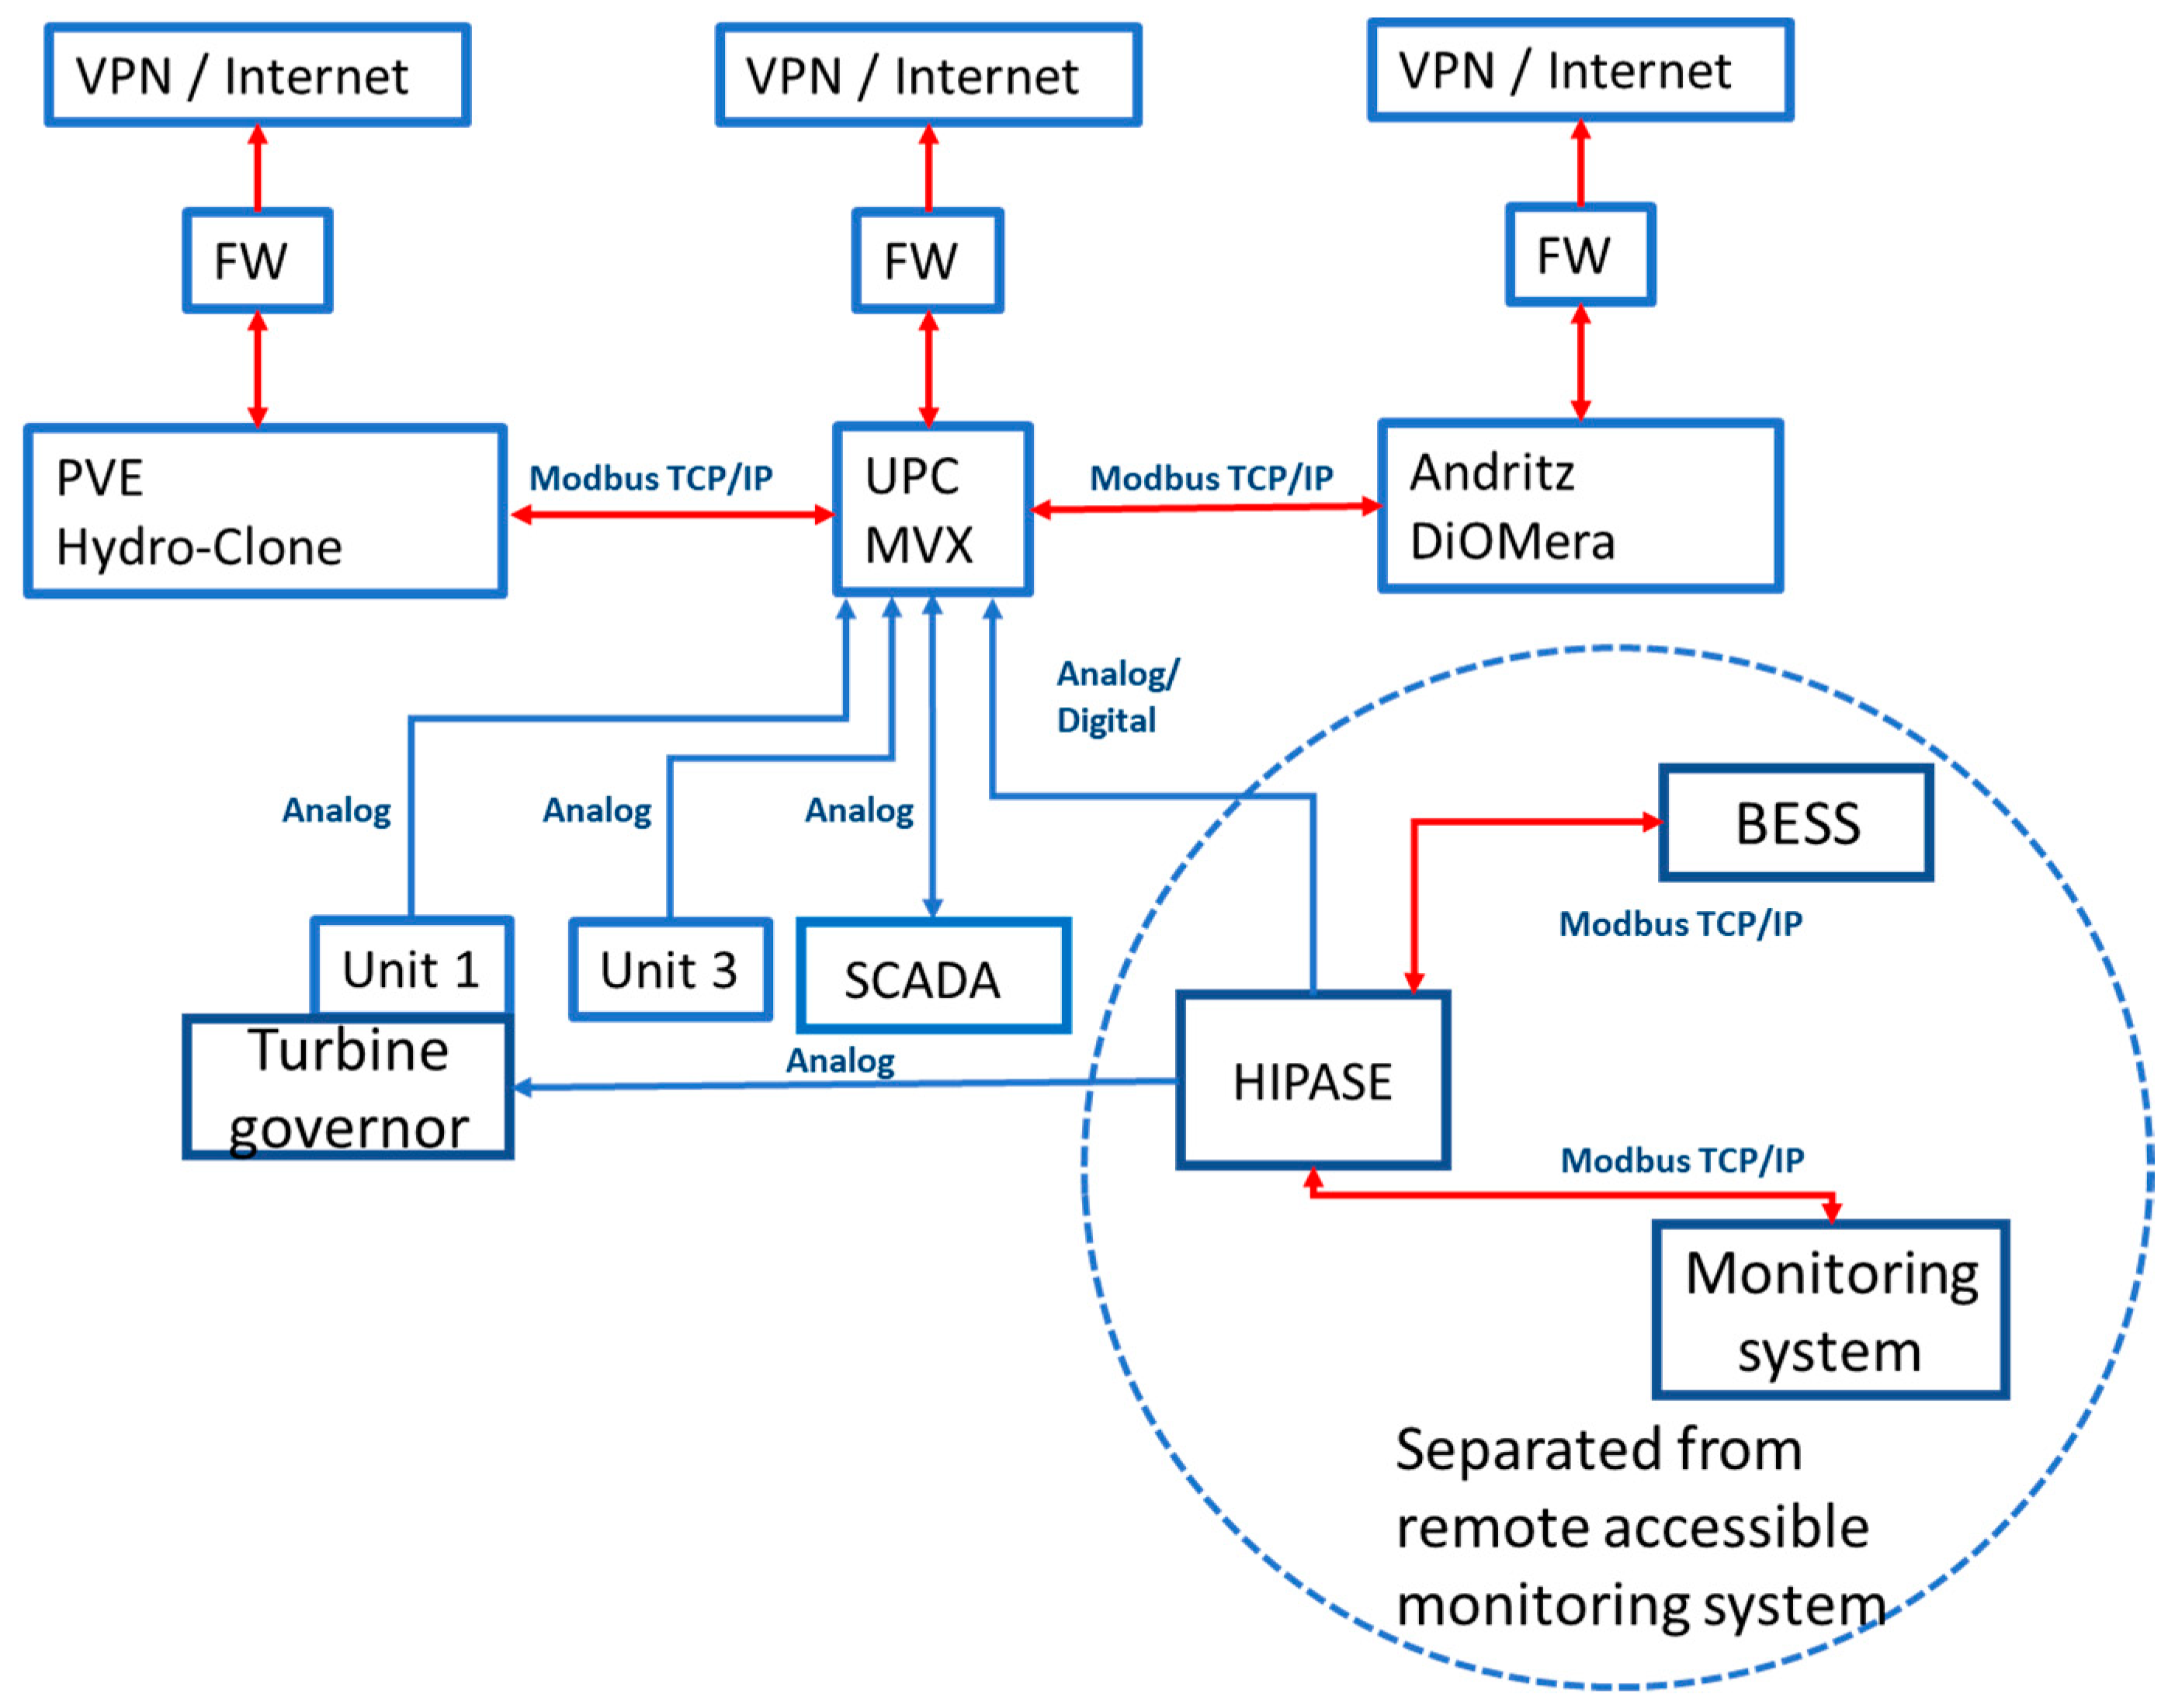
In
Figure 7, the overall monitoring concept is depicted. There are four systems deployed either via Modbus TCP/IP or analogue signals (voltage signals) connected to each other. The blue circle marks the HIPASE hybrid controller system, including the BESS and the SCADA monitoring system running on an industry PC. Due to security reasons, there is no access to the hybrid controller via a VPN. To exchange signals with the MVX monitoring systems, analogue signals are used. From the MVX, the collected measurement signals from unit 1 and unit 3 as well as selected signals from the hybrid system are distributed to the Hydro-Clone and Metris DiOMera. Each of these three systems is remotely accessible.
3.3. Wear and Tear Assessment
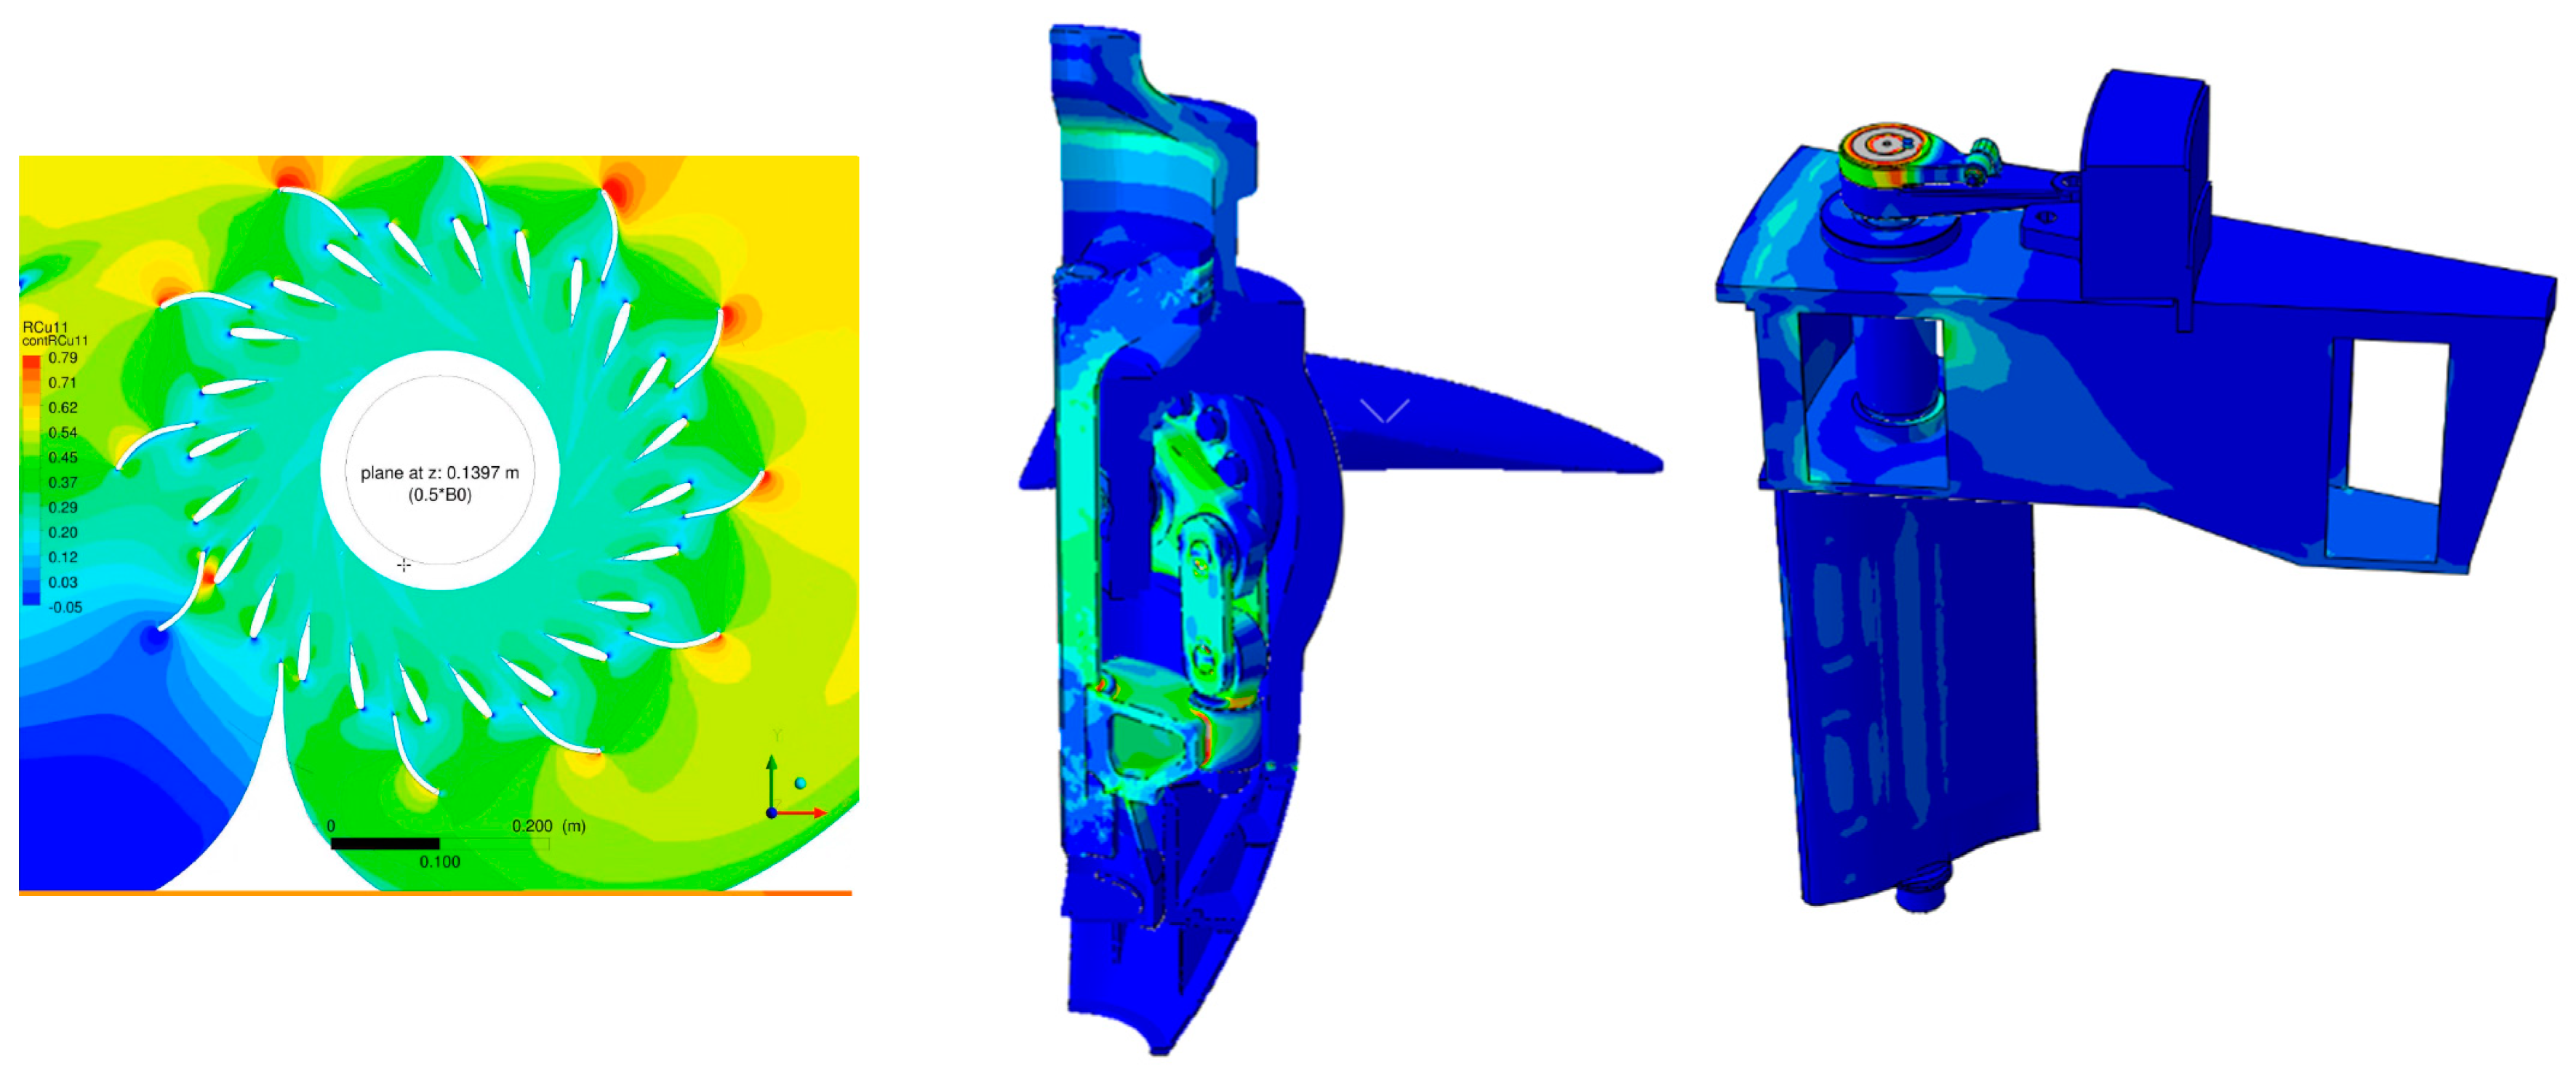
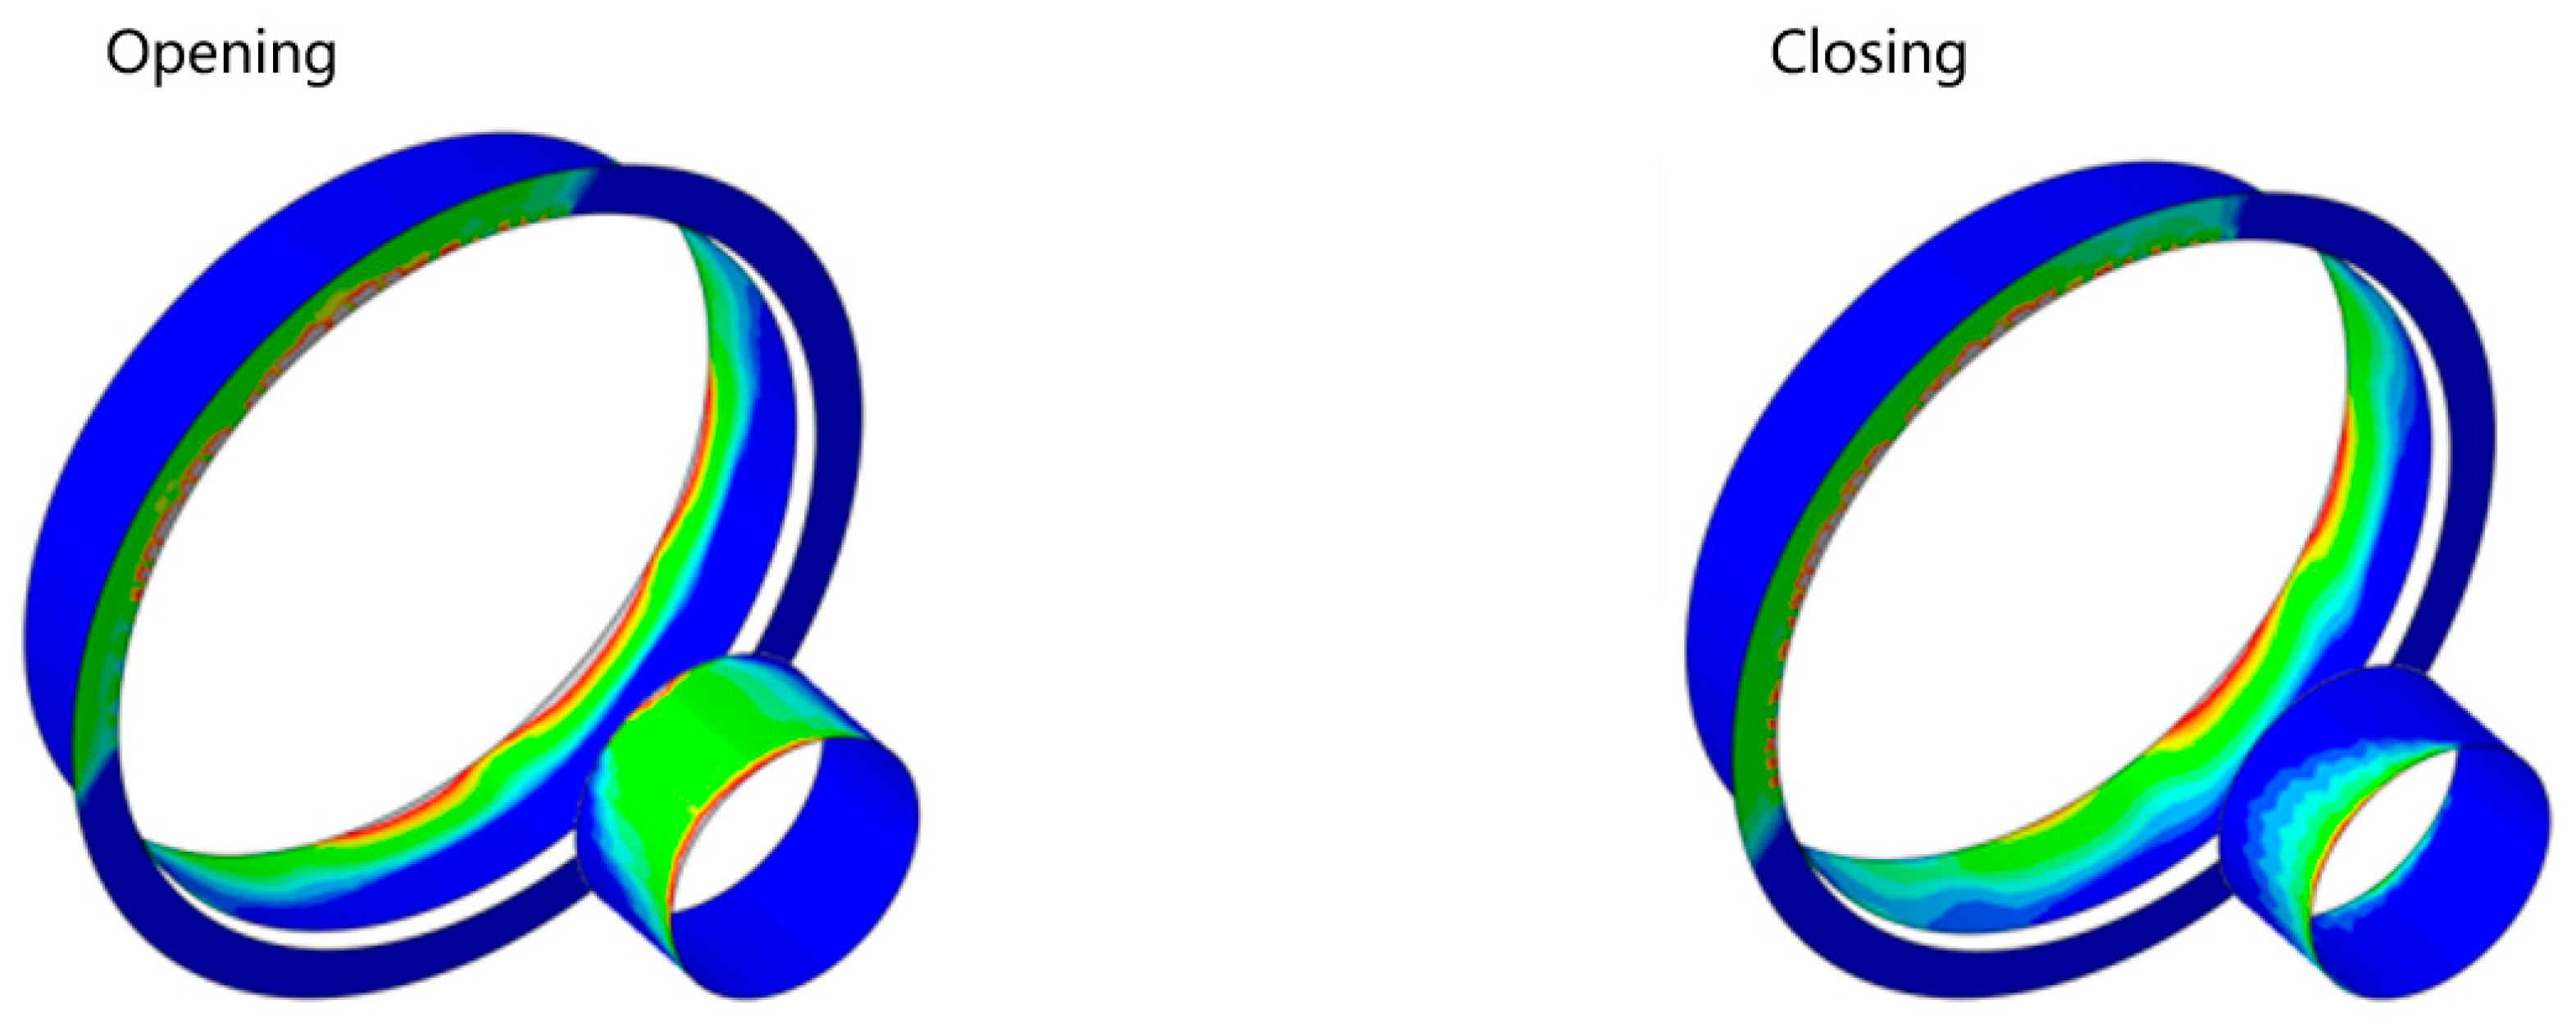
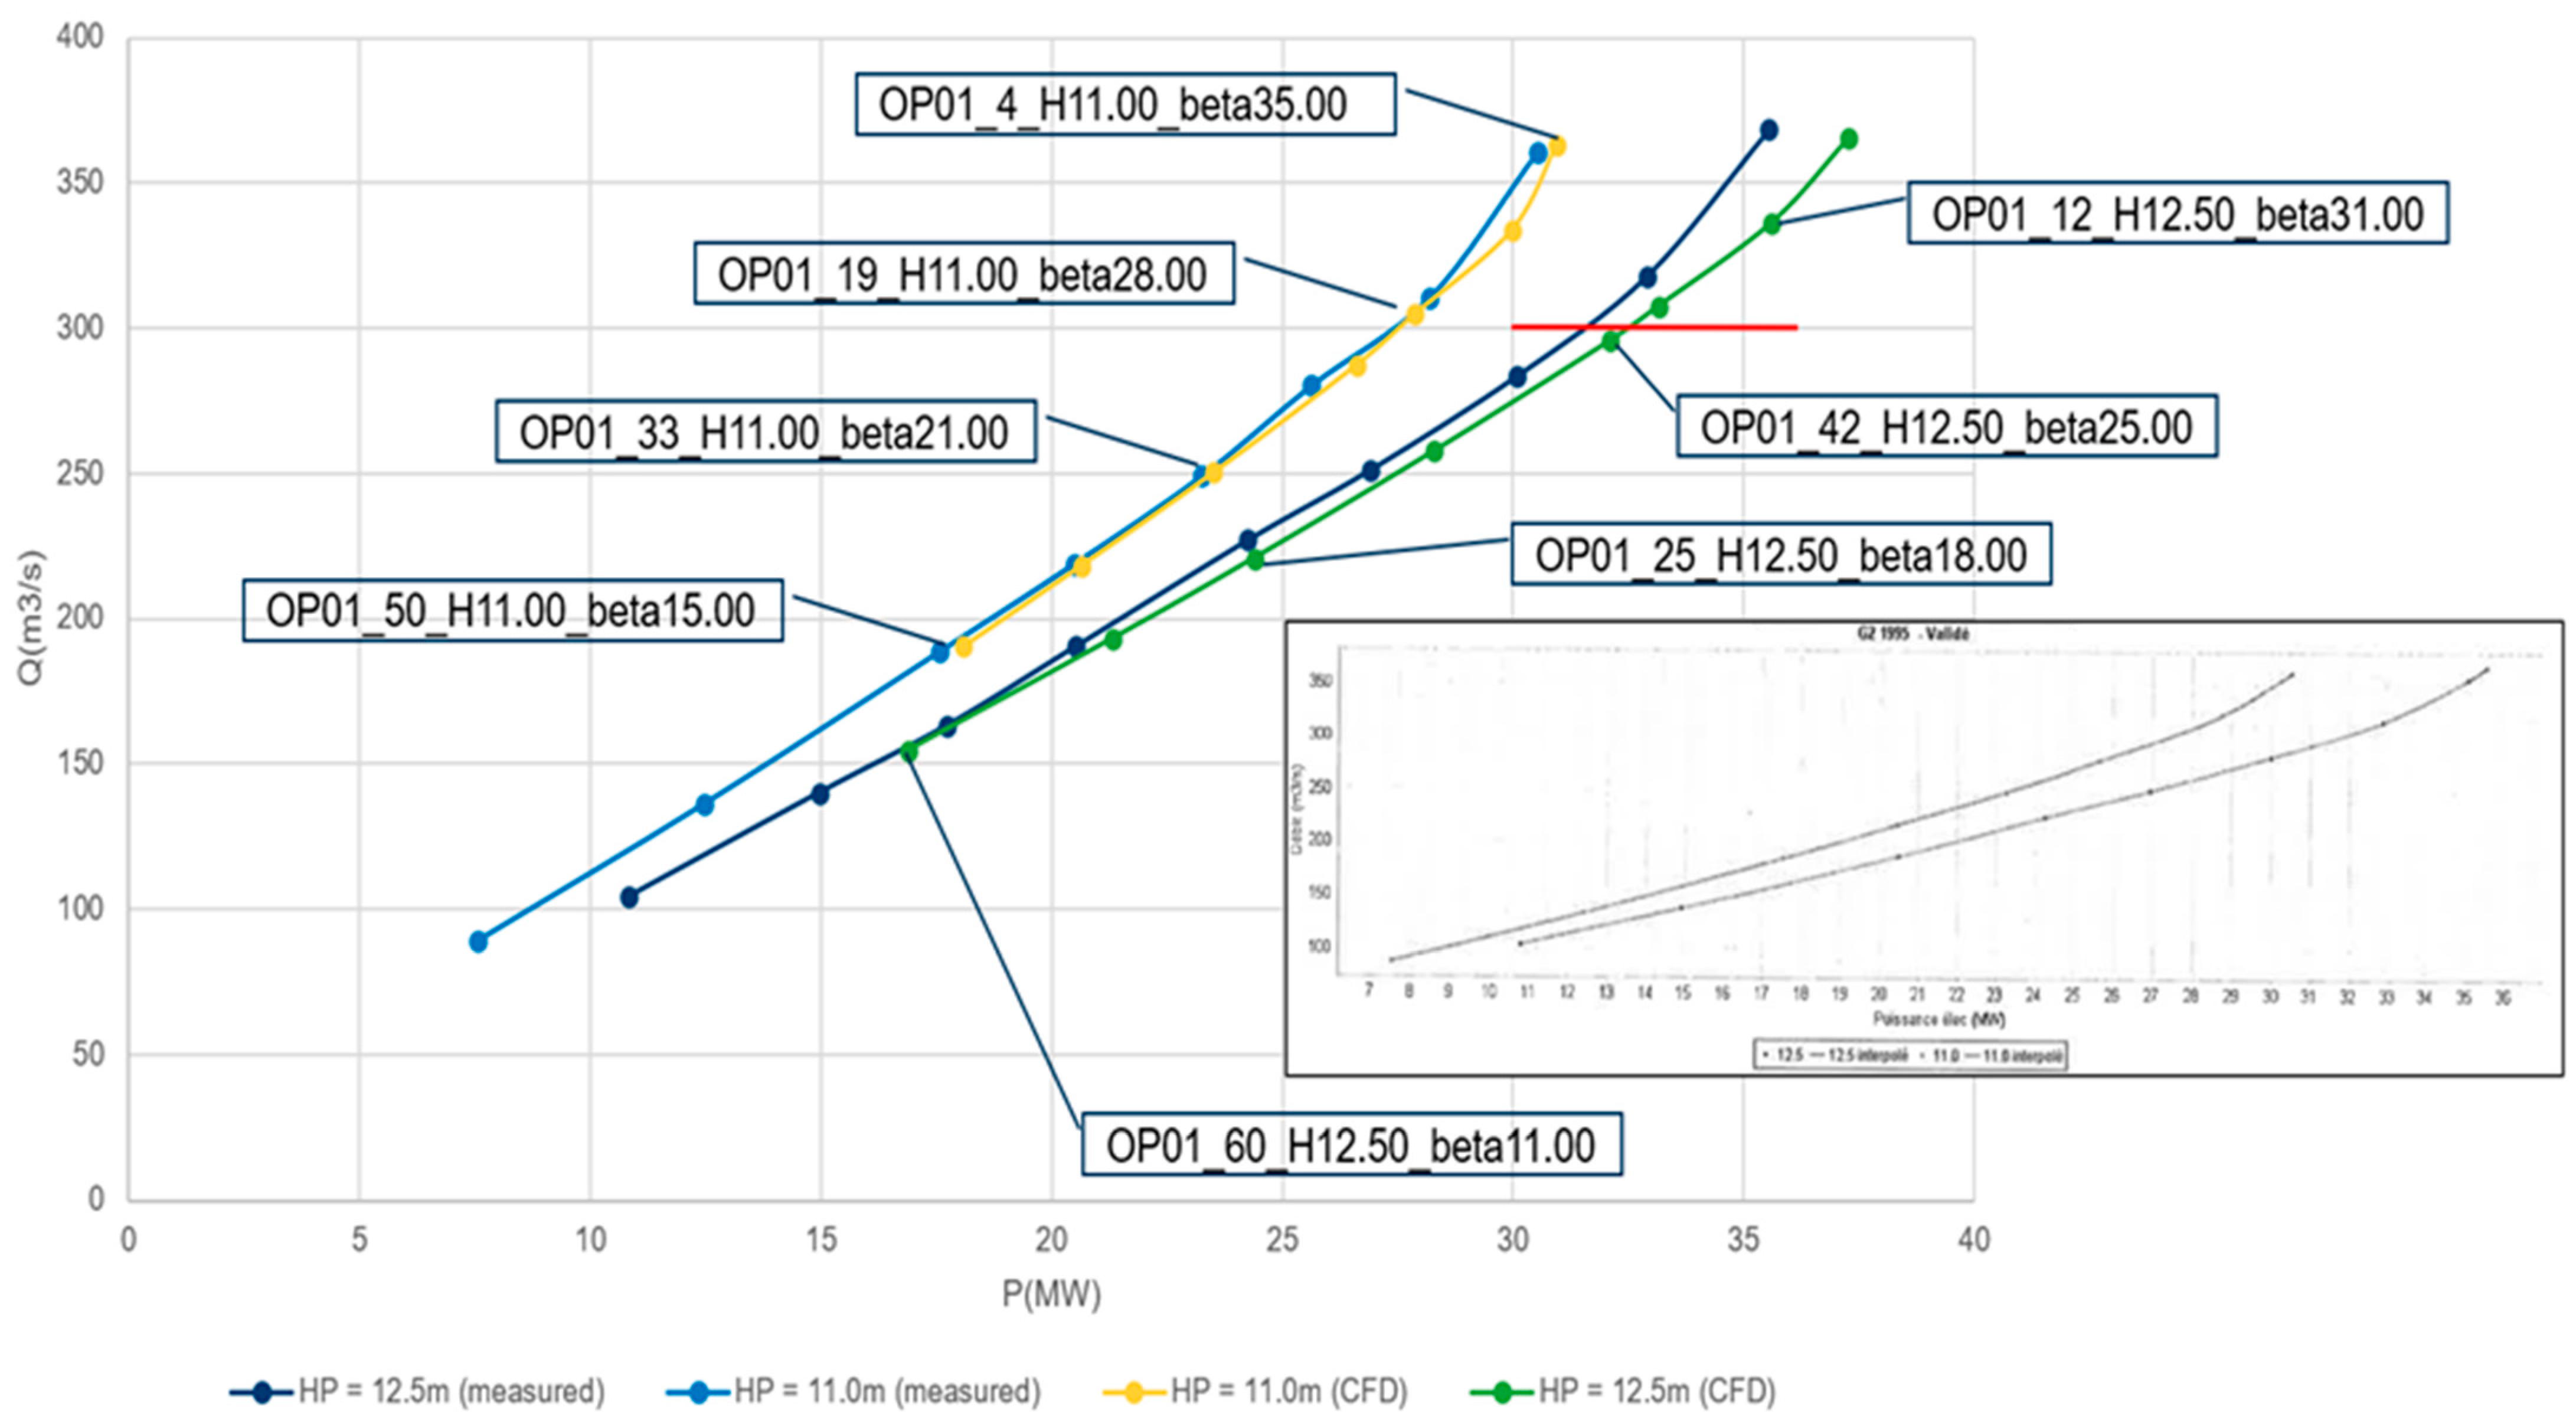
The mainly affected mechanical components of a Kaplan turbine during primary regulation in the sense of wear and tear are the turbine runner and the guide vane mechanisms. These parts were modelled in 3D and analyzed with finite element methods (FEMs). The needed hydraulic loads acting on runner blades and guide vanes were obtained from separate computational fluid dynamics (CFD) simulations (
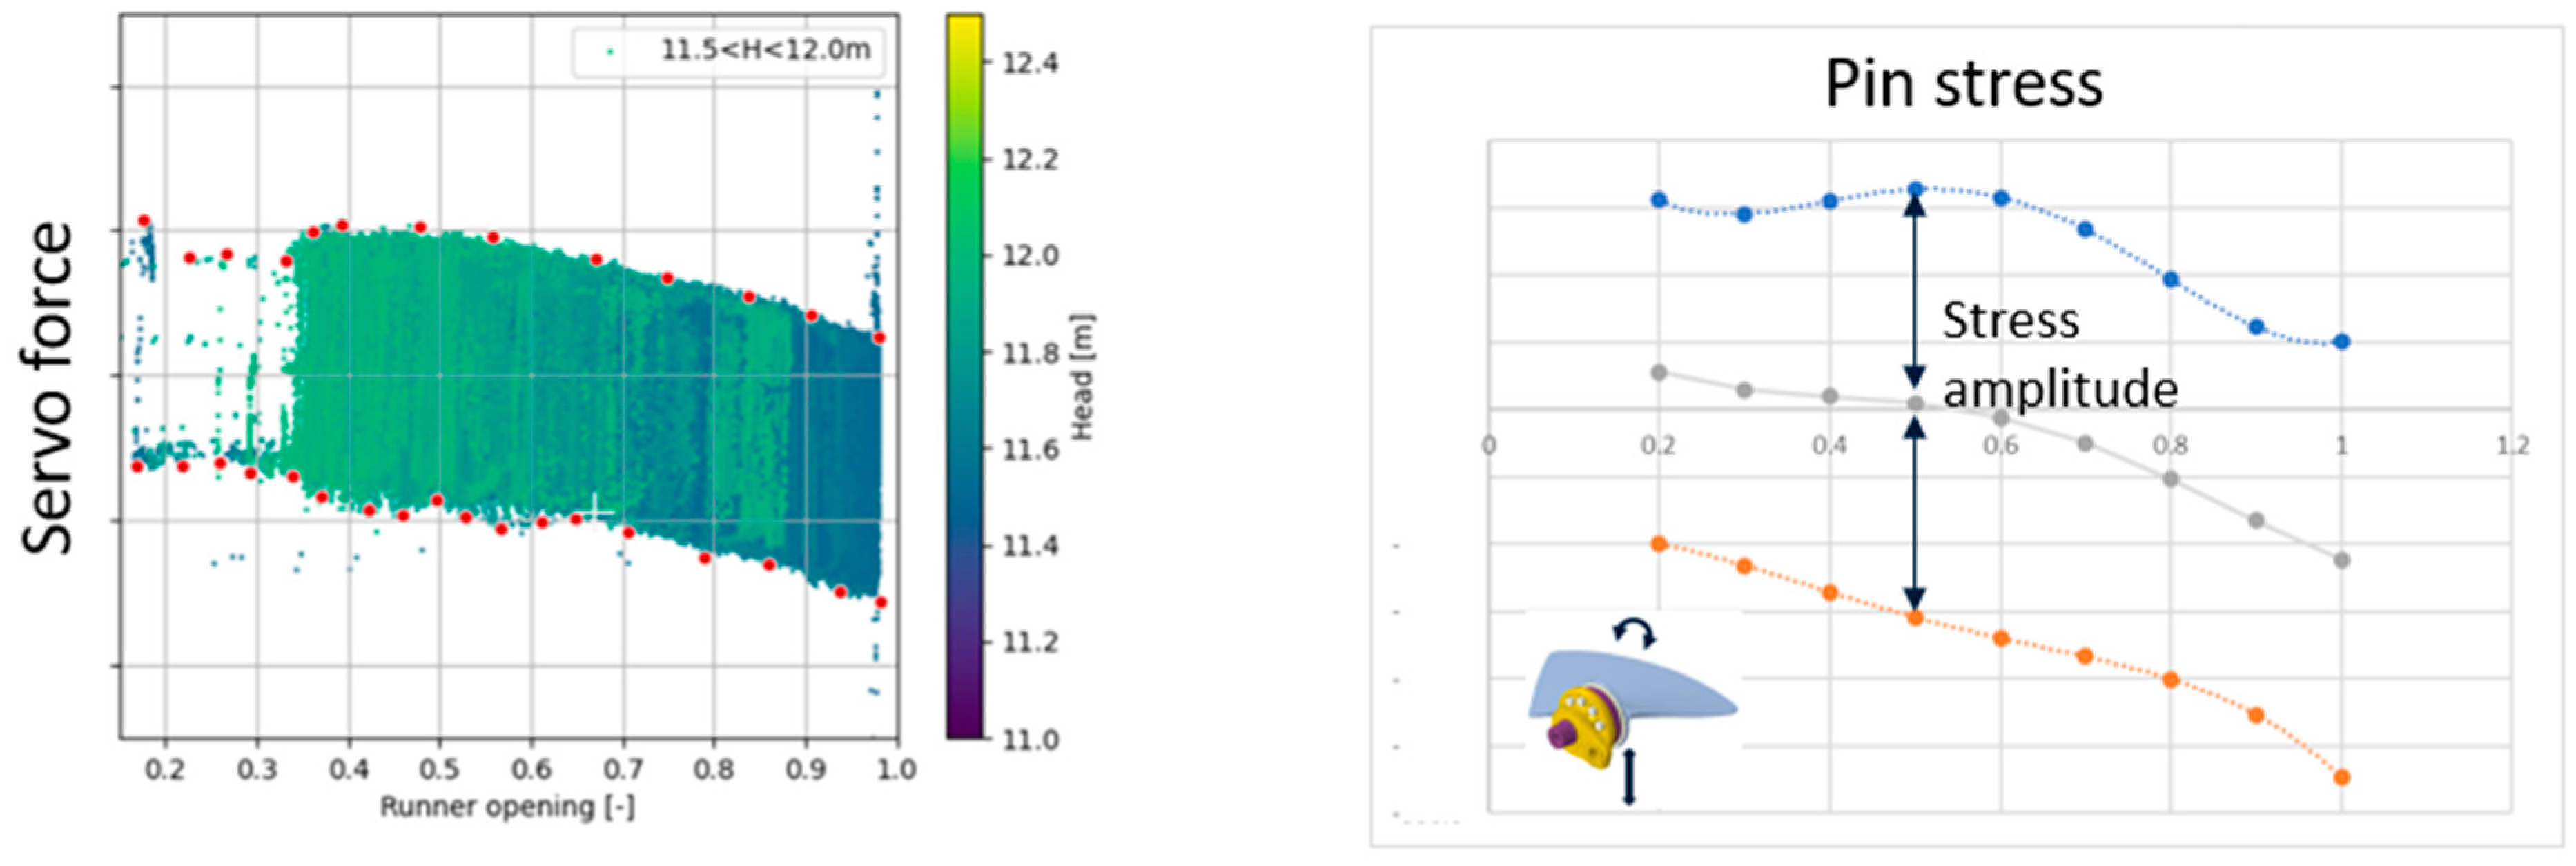
Figure 8). Frequent adjustments of the runner blade and guide vane angular positions primarily induce fatigue-related damaging impacts during FCR provision. At each adjustment cycle, friction encountered when moving blades and vanes back and forth must be overcome, leading to certain stress amplitudes at the parts. Wear depending on the turning distance of the trunnions in the bearings and the bearing load is calculated with the pressure distributions gained from the finite element analyses (
Figure 9). The FE models are simplified using cyclic symmetry but contain the full mechanism.
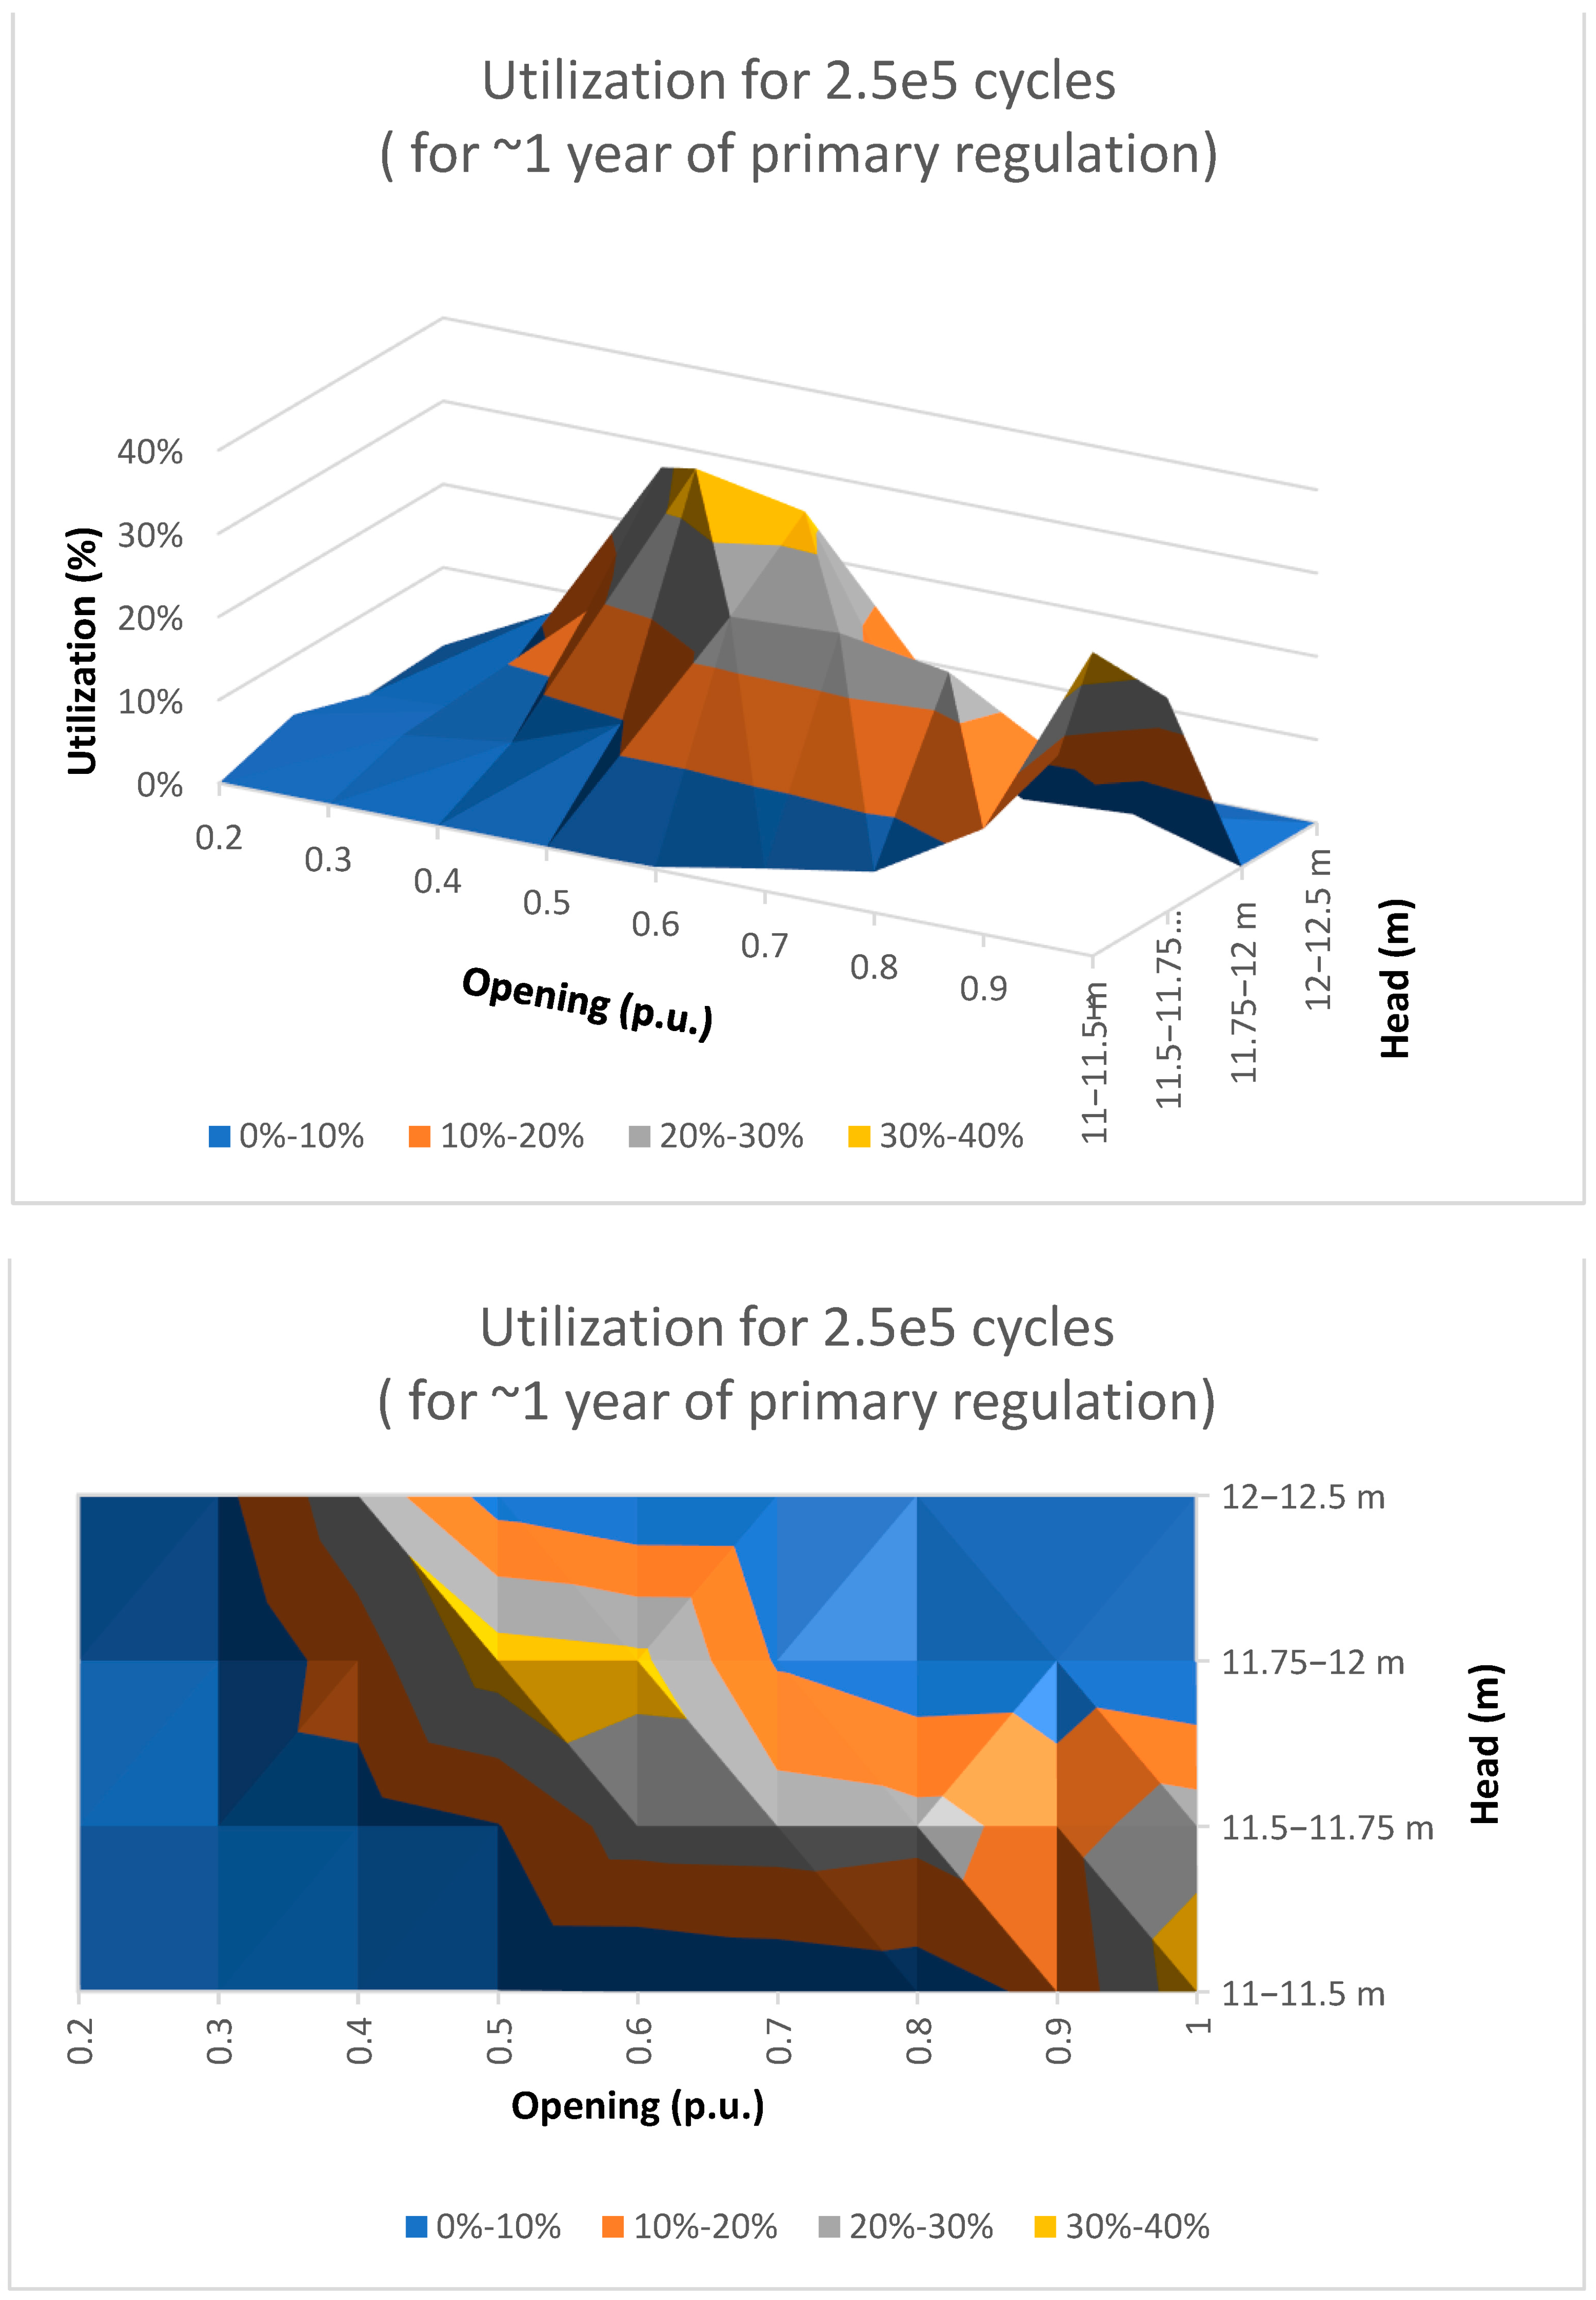
Hill charts for wear (bearing deterioration) and fatigue (utilization of the turbine parts) should describe the damage in each point of operation for the runner and the guide vane mechanisms. In
Figure 10, the utilization of approximately one year of primary regulation is presented. The link pin at the runner is the most endangered part regarding fatigue failure. With the fatigue hill chart points, the operation with high and low utilization can be detected.
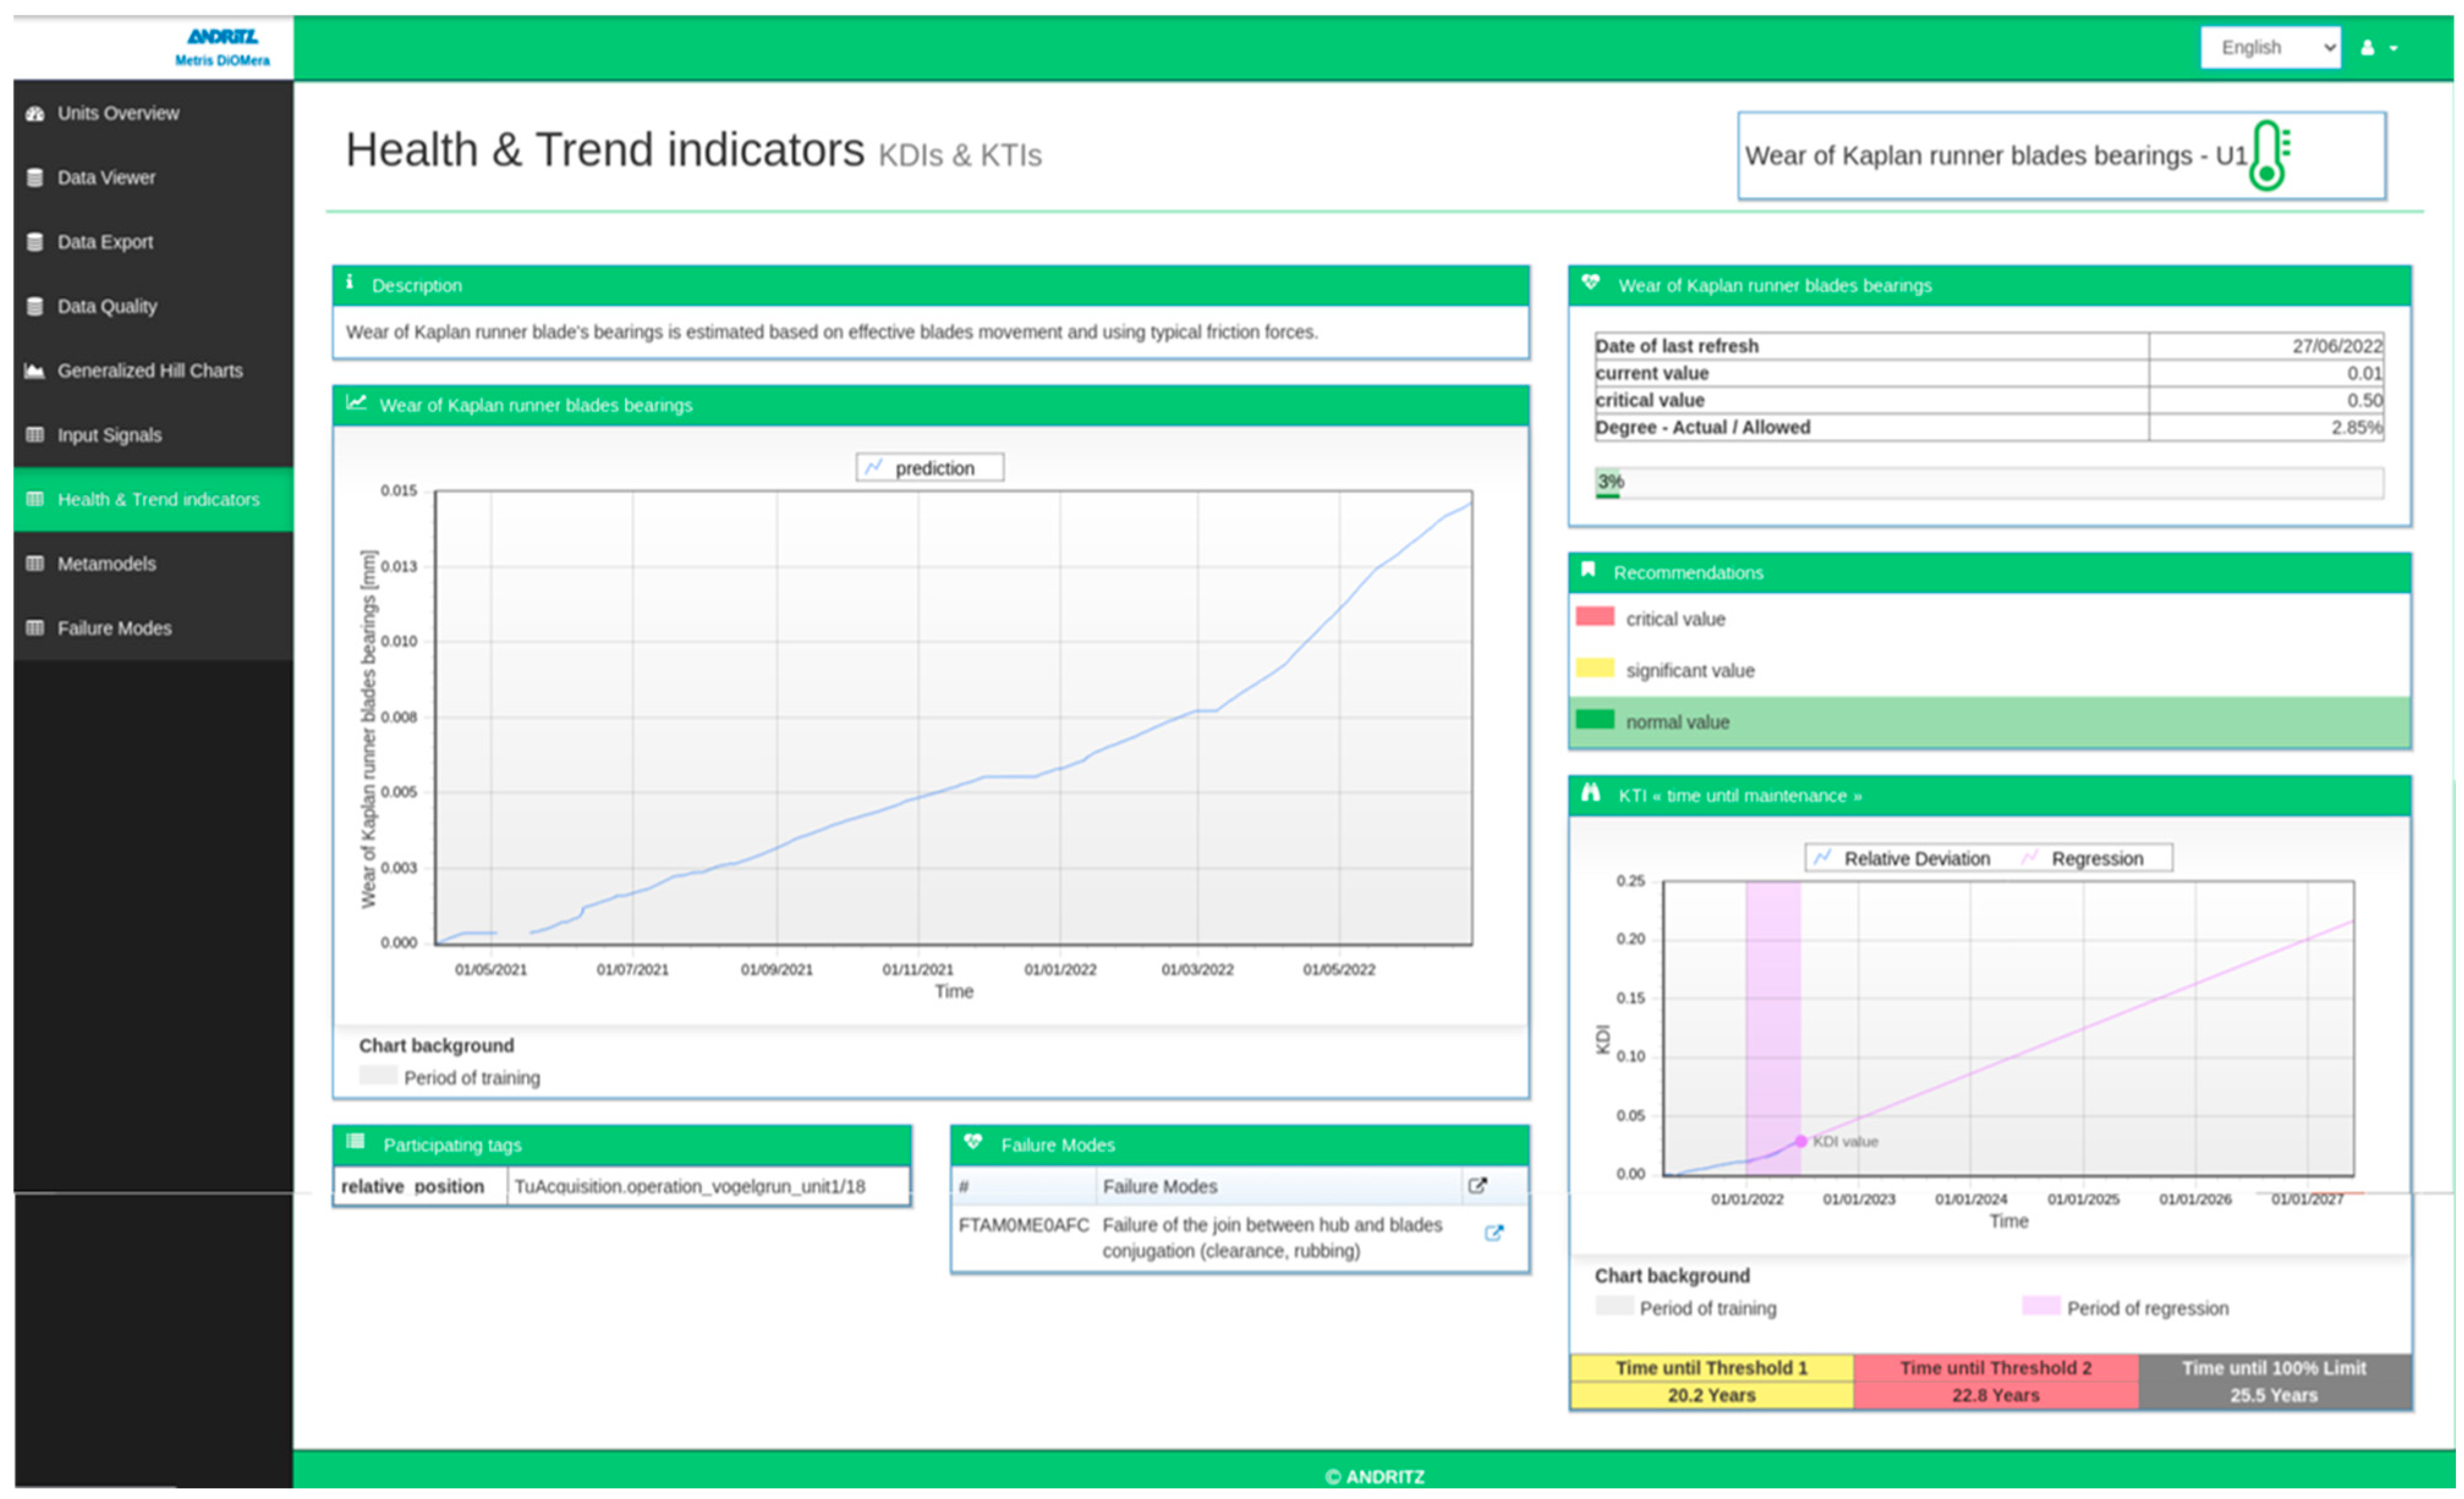
Metris DiOMera, the digital solution by Andritz Hydro for predictive maintenance, was installed in Vogelgrun on a computer in the powerhouse. In Metris DiOMera, health and trend indicators are defined that describe the current state of a component, or group of components in the units, and that predict its future behavior. It is distinguished from the so-called key diagnostic indicators (KDIs) that evaluate the past and present condition of a component and key trend indicators (KTIs) that predict future evolution of the KDIs. KDIs are normalized, where 0% means good condition and 100% means critical condition. For Vogelgrun, the main emphasis is put on KDIs that analyze wear and tear of the turbine with the aim of quantifying the improvement in the hybrid mode on the turbine aging. Wear of runner blade bearings and fatigue of the runner regulating mechanism were identified as the most relevant indicators.
The status of wear of runner blade bearings: Wear of the runner blade bearings depends on the distance that is covered by the movement of the runner blades (the so-called mileage), the contact pressure and a wear coefficient. The mileage is computed from the acquired runner servomotor position, the contact pressure comes from FEMs, and the wear coefficient is chosen according to the literature. Wear in [mm] is converted into a non-dimensional KDI by defining a critical limit value for wear.
The status of fatigue of the runner regulating mechanism: From the recorded servomotor’s opening and closing pressures, a servomotor force is computed that is then converted into stress by applying FEM results. The number of load cycles is determined using rain flow counting. Using Miner’s rule and an appropriate S–N curve yields cumulated damage for the considered period. The same method can be applied to different parts of the runner regulating mechanism.
In order to compute these indicators based on real operation, operation data are acquired from the MVX monitoring system for unit 1 and unit 3. Therefore, the data of unit 3 serves as comparison to the hybrid unit 1.
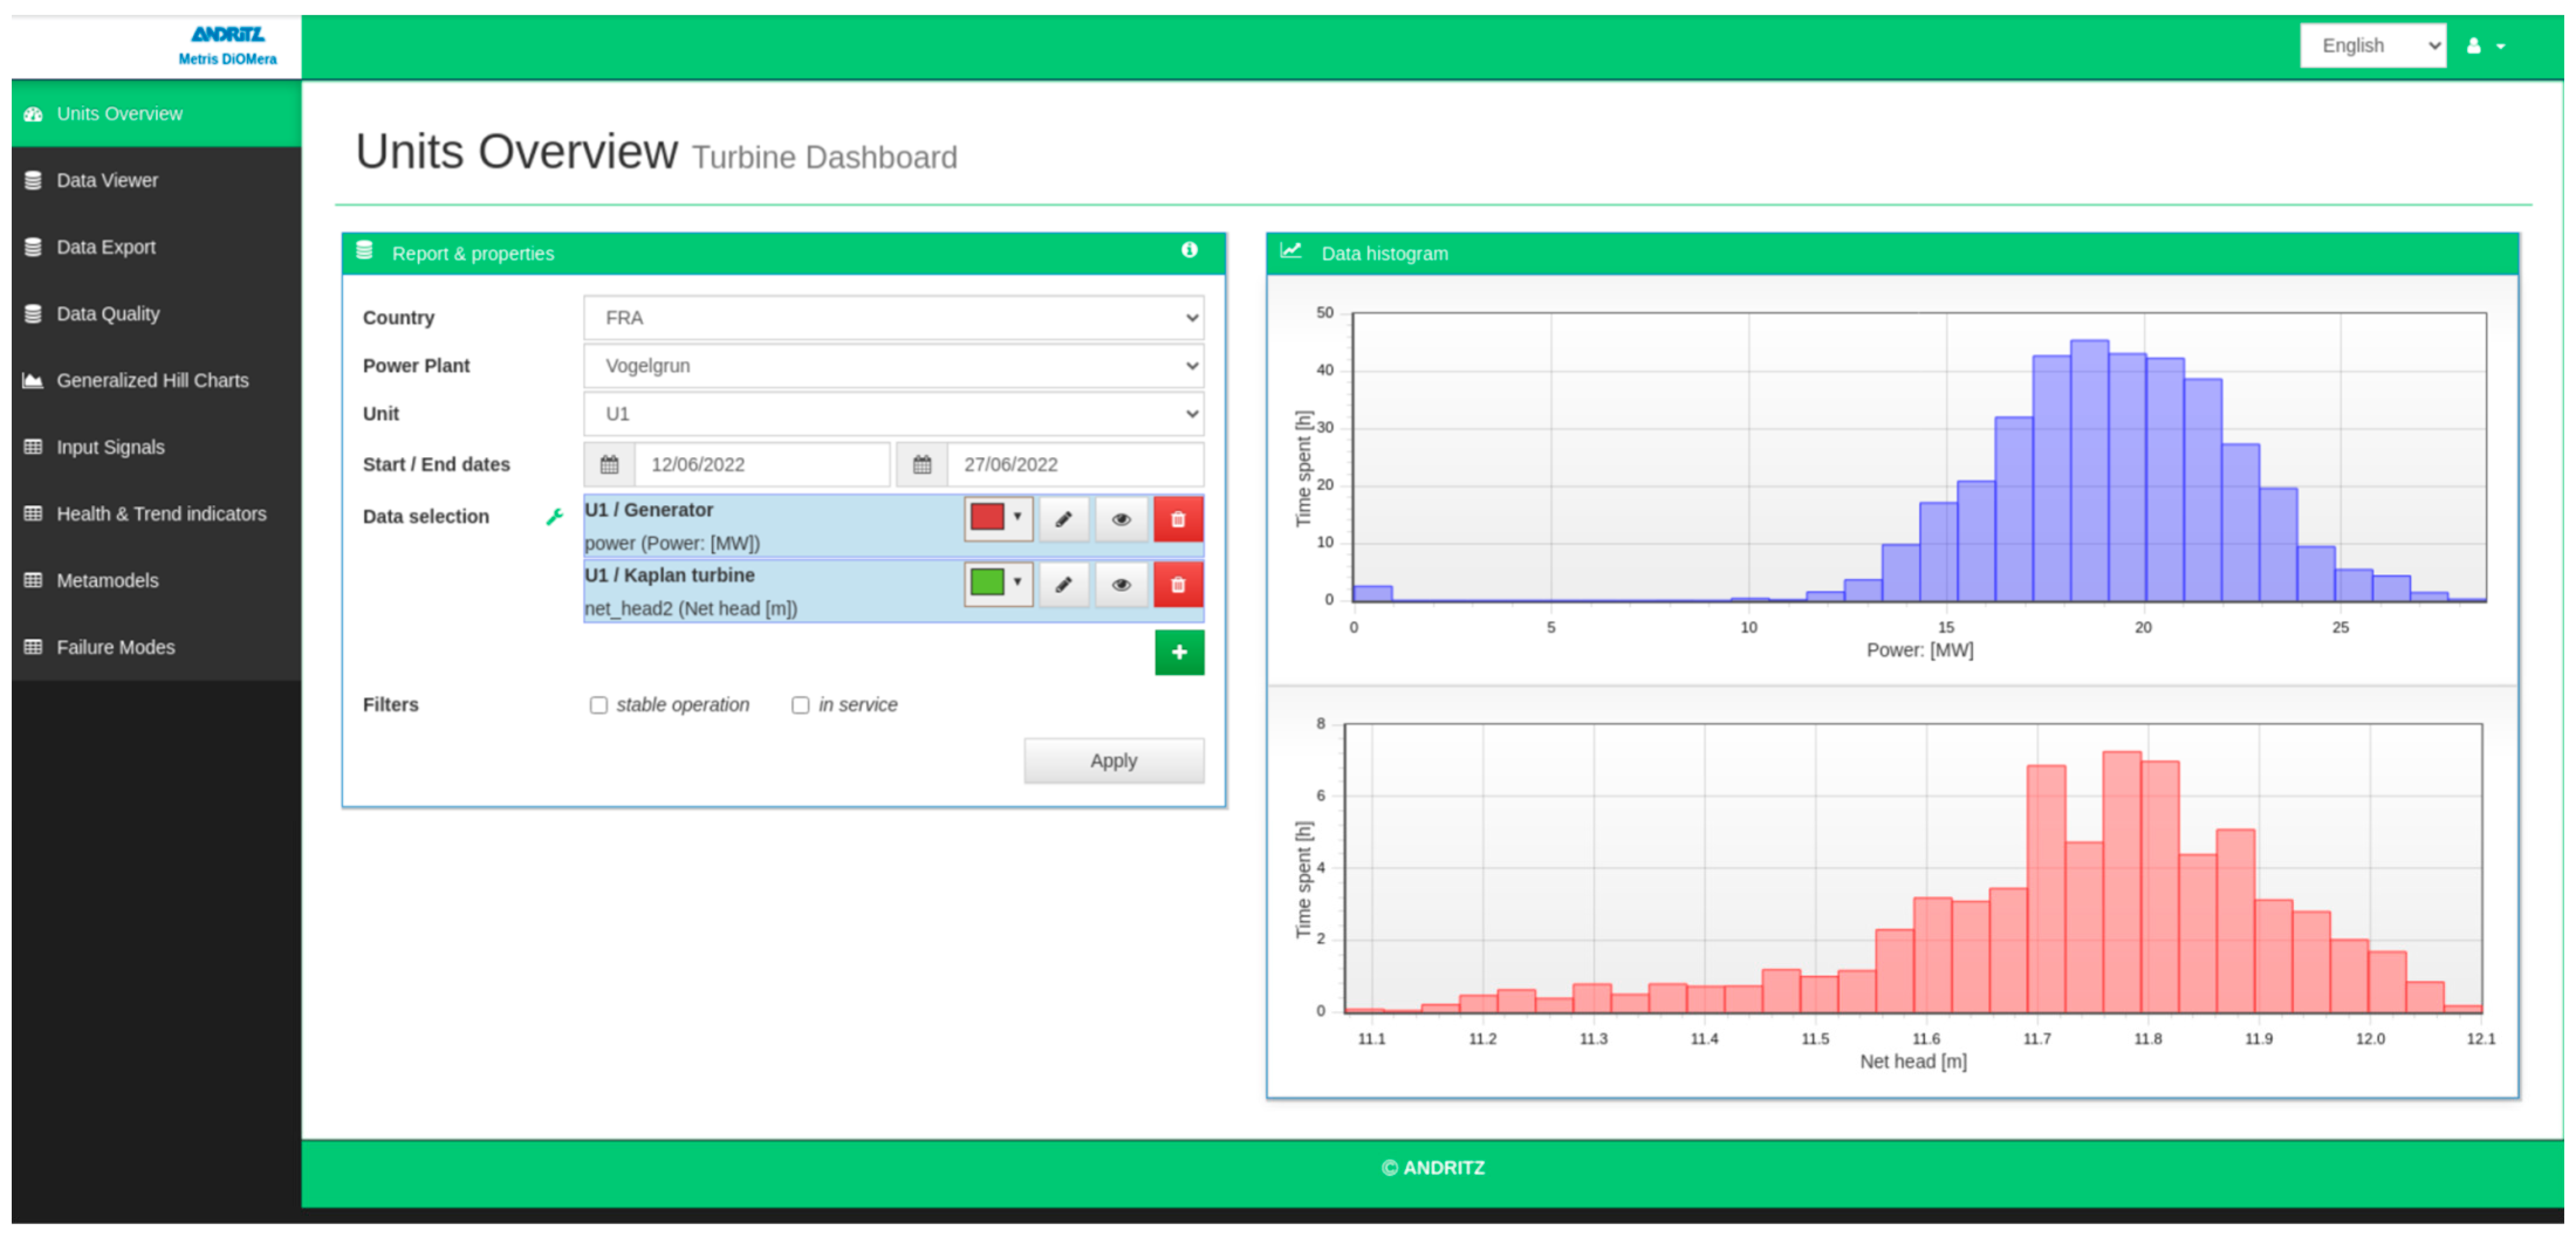
Metris DiOMera comes with a web-based graphical user interface (GUI) showing data visualization of all acquired and computed signals as well as the health and trend indicators. In
Figure 11, one tab of the GUI showing histograms of acquired active power of the turbine and head is depicted, as one example. The plot shows the distribution of the operating points and durations. One can observe that the unit was operated mainly between 15 MW and 25 MW during the selected period. In the dispatch of the unit, the water levels are considered to maintain those on the Rhine River for shipping traffic. A discharge setpoint for each 15 min interval is received for the power plant.
Figure 10.
Utilization for approximately 1 year of primary regulation.
Figure 10.
Utilization for approximately 1 year of primary regulation.
3.4. Real-Time Simulation Models
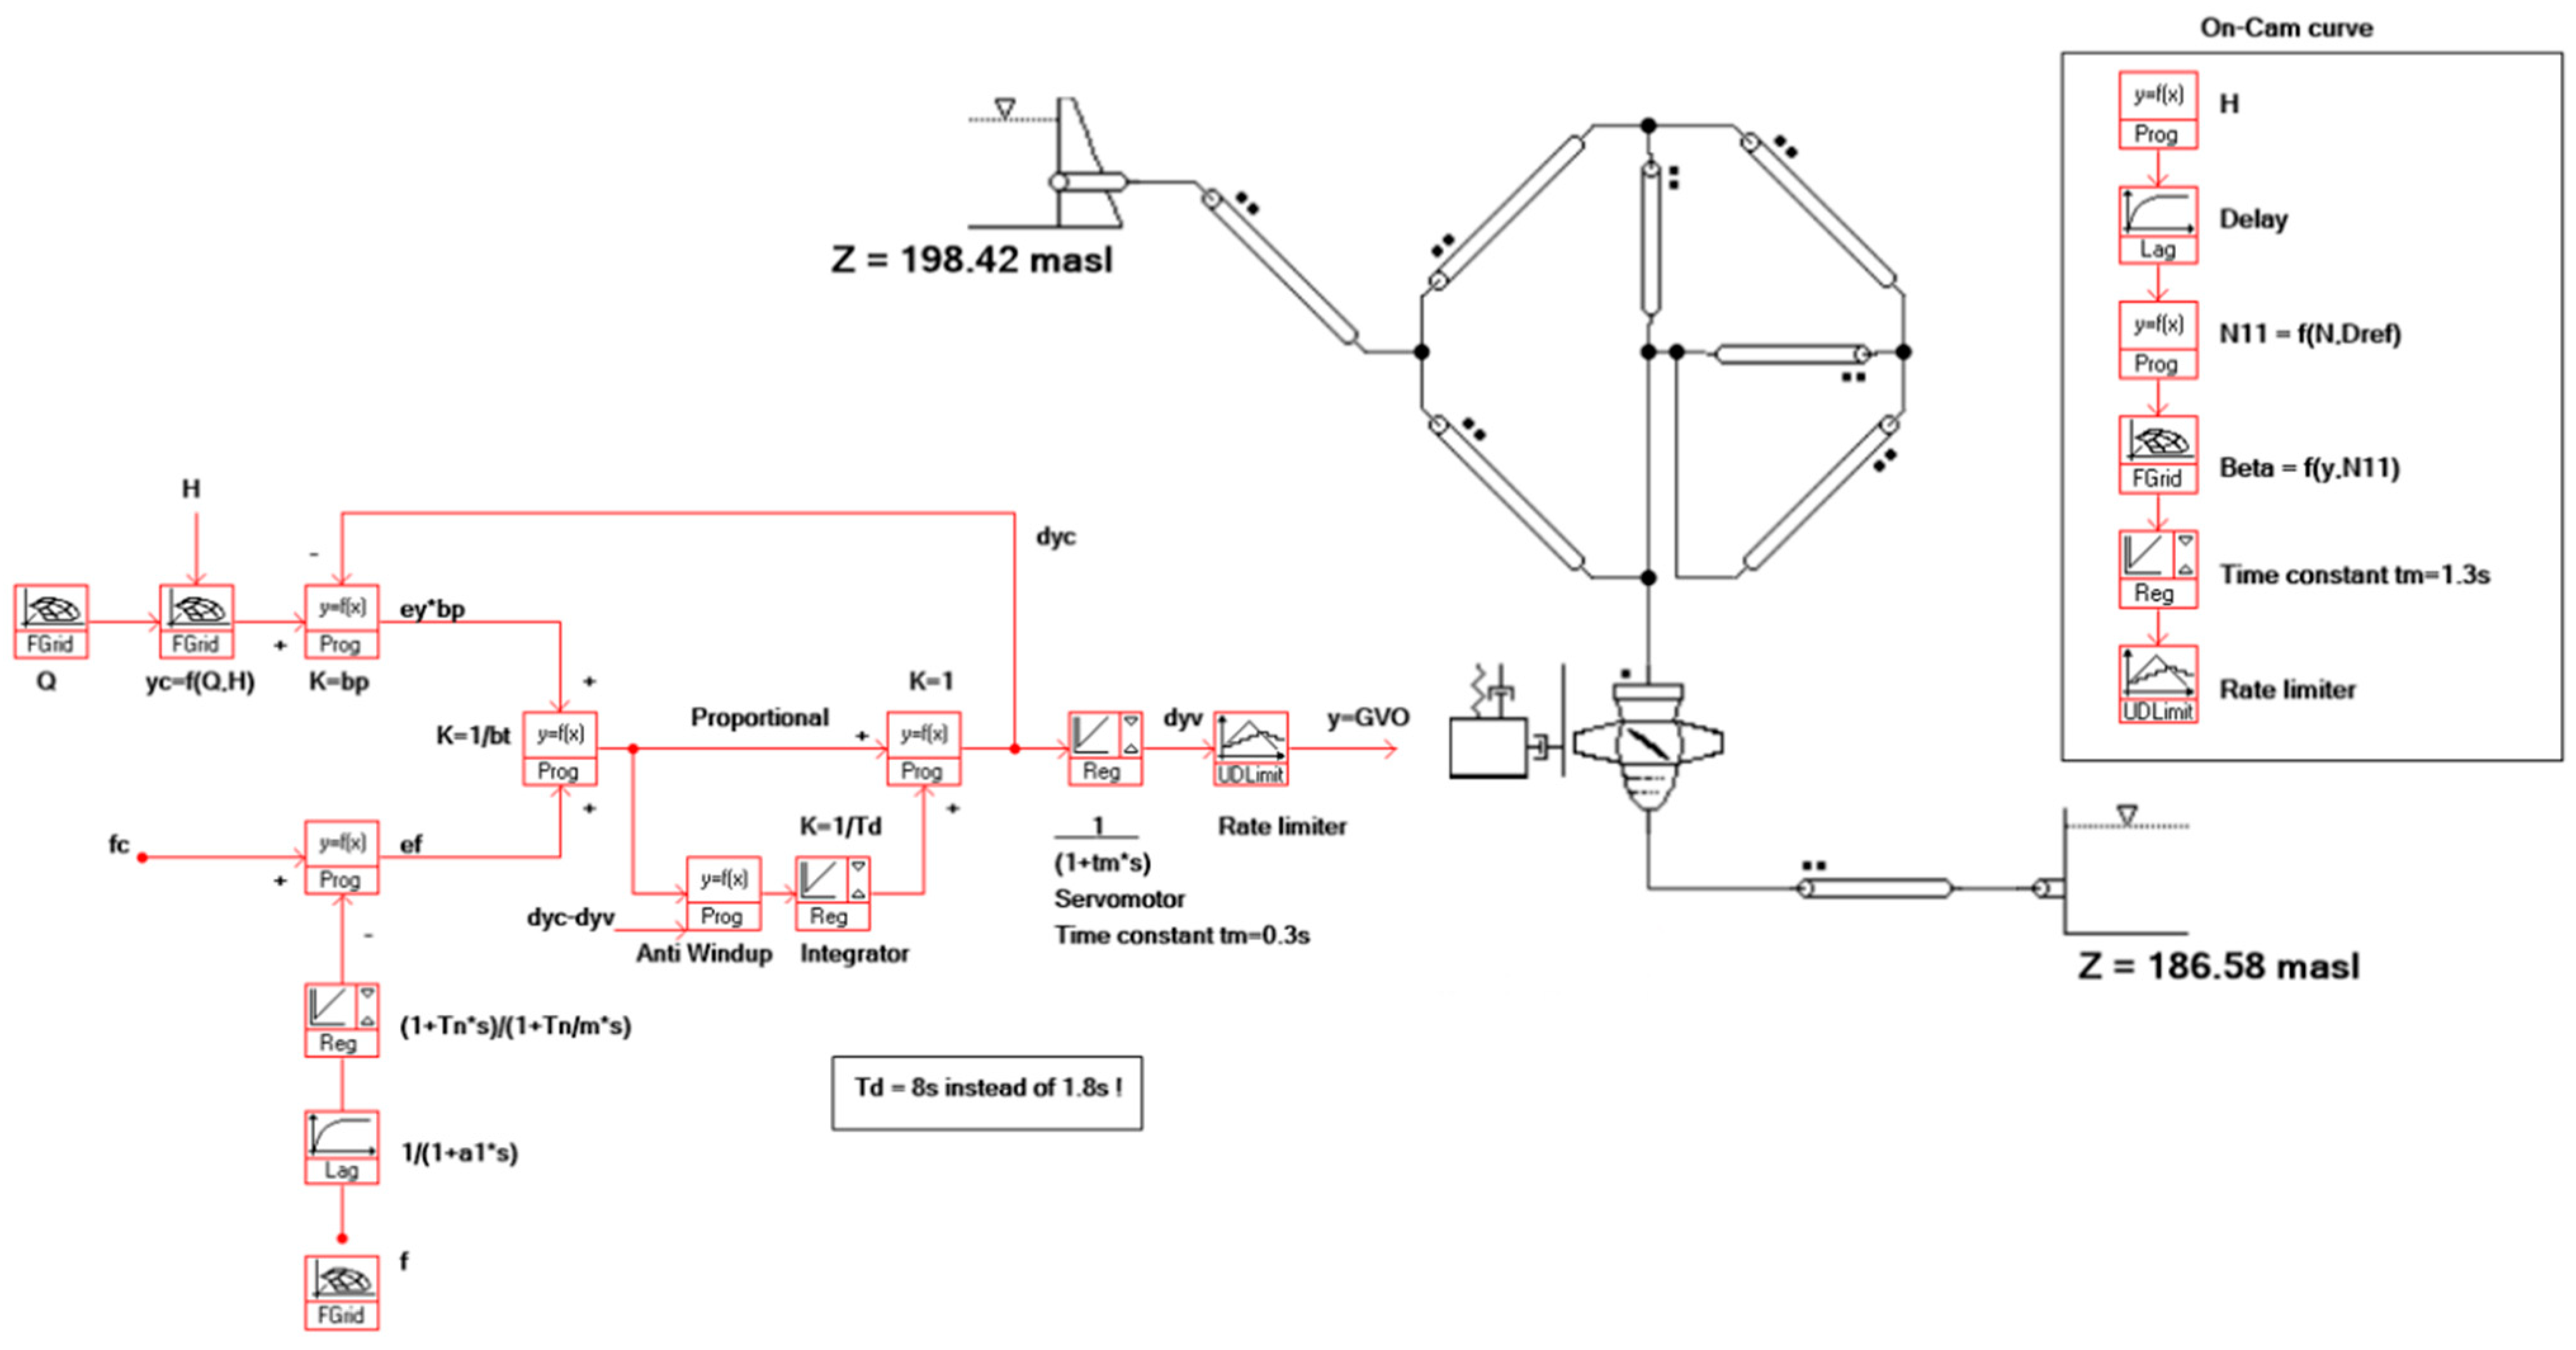
A SIMSEN model of the Vogelgrun HPP was developed including the water intake, the Kaplan turbine and the draft tube of the unit (
Figure 12). Particular attention has been paid to the modeling of the spiral case in order to consider the evolution of the cross-sectional area and the distribution of the discharge. The hydraulic part of the numerical model was validated by comparing the simulation results with a time series of static pressure in the spiral case and the rotational speed of the Kaplan turbine measured during an emergency shutdown performed in 2015 [
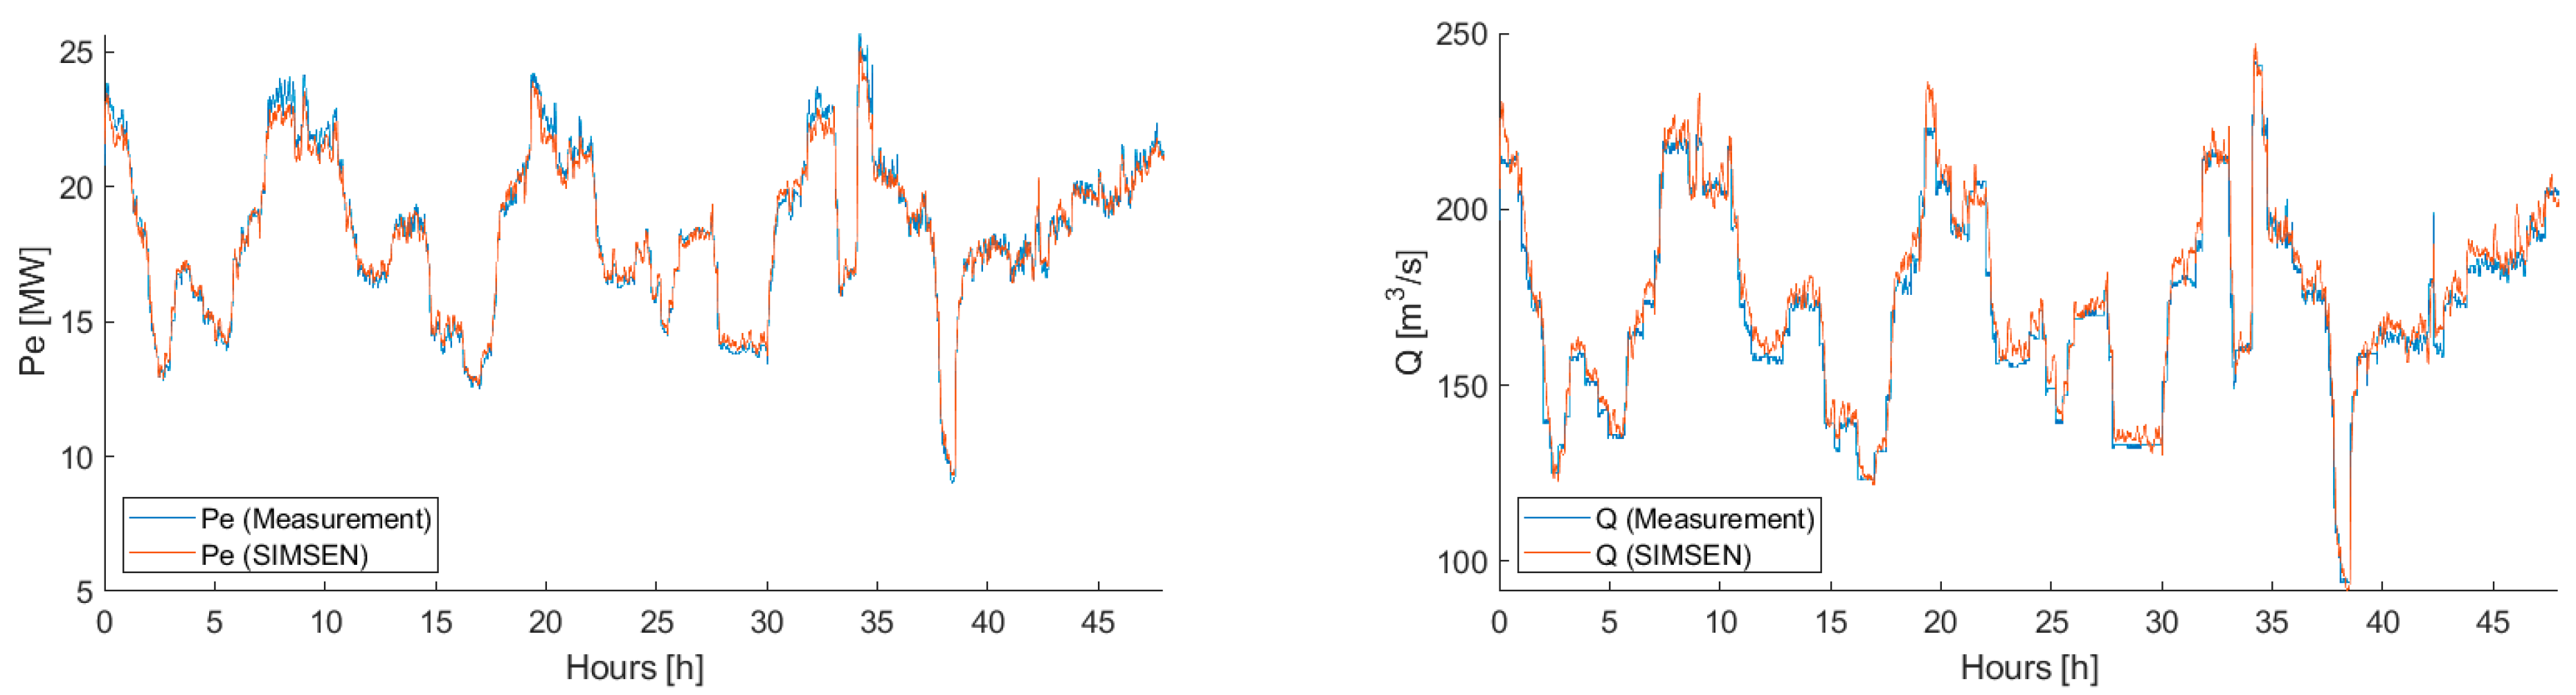
27]. The SIMSEN model also includes a turbine governor combining the control of the flow of the Rhine River and the FCR control. The turbine governor is operated in the guide vane position control mode and uses an on-cam lookup table to define the blade angle setpoint as a function of the head and the guide vane position. The validation of the control part in the SIMSEN model was performed by comparing the numerical simulation results with the site measurements performed over 2 days in April 2021, as seen in
Figure 13.
Figure 11.
Screenshot of the graphical user interface of Metris DiOMera in Vogelgrun.
Figure 11.
Screenshot of the graphical user interface of Metris DiOMera in Vogelgrun.
Figure 12.
SIMSEN model of the Vogelgrun HPP.
Figure 12.
SIMSEN model of the Vogelgrun HPP.
Figure 13.
Comparison of power and discharge measurements (blue line) made over 2 days in April 2021 and numerical results (red line).
Figure 13.
Comparison of power and discharge measurements (blue line) made over 2 days in April 2021 and numerical results (red line).
By using turbine flow setpoint and grid frequency time histories, it was possible to reproduce the time evolution of the active power, guide vane opening and blade angle with good agreement. Thus, the good reproduction of the active power Pe validated the characteristic curve of the Kaplan turbine. Moreover, the good agreement for the guide vane opening confirmed the turbine governor’s behavior. Finally, the on-cam curve also attested to the comparison of the blade angle beta. This model was then used for real-time monitoring of the Vogelgrun HPP with Hydro-Clone.
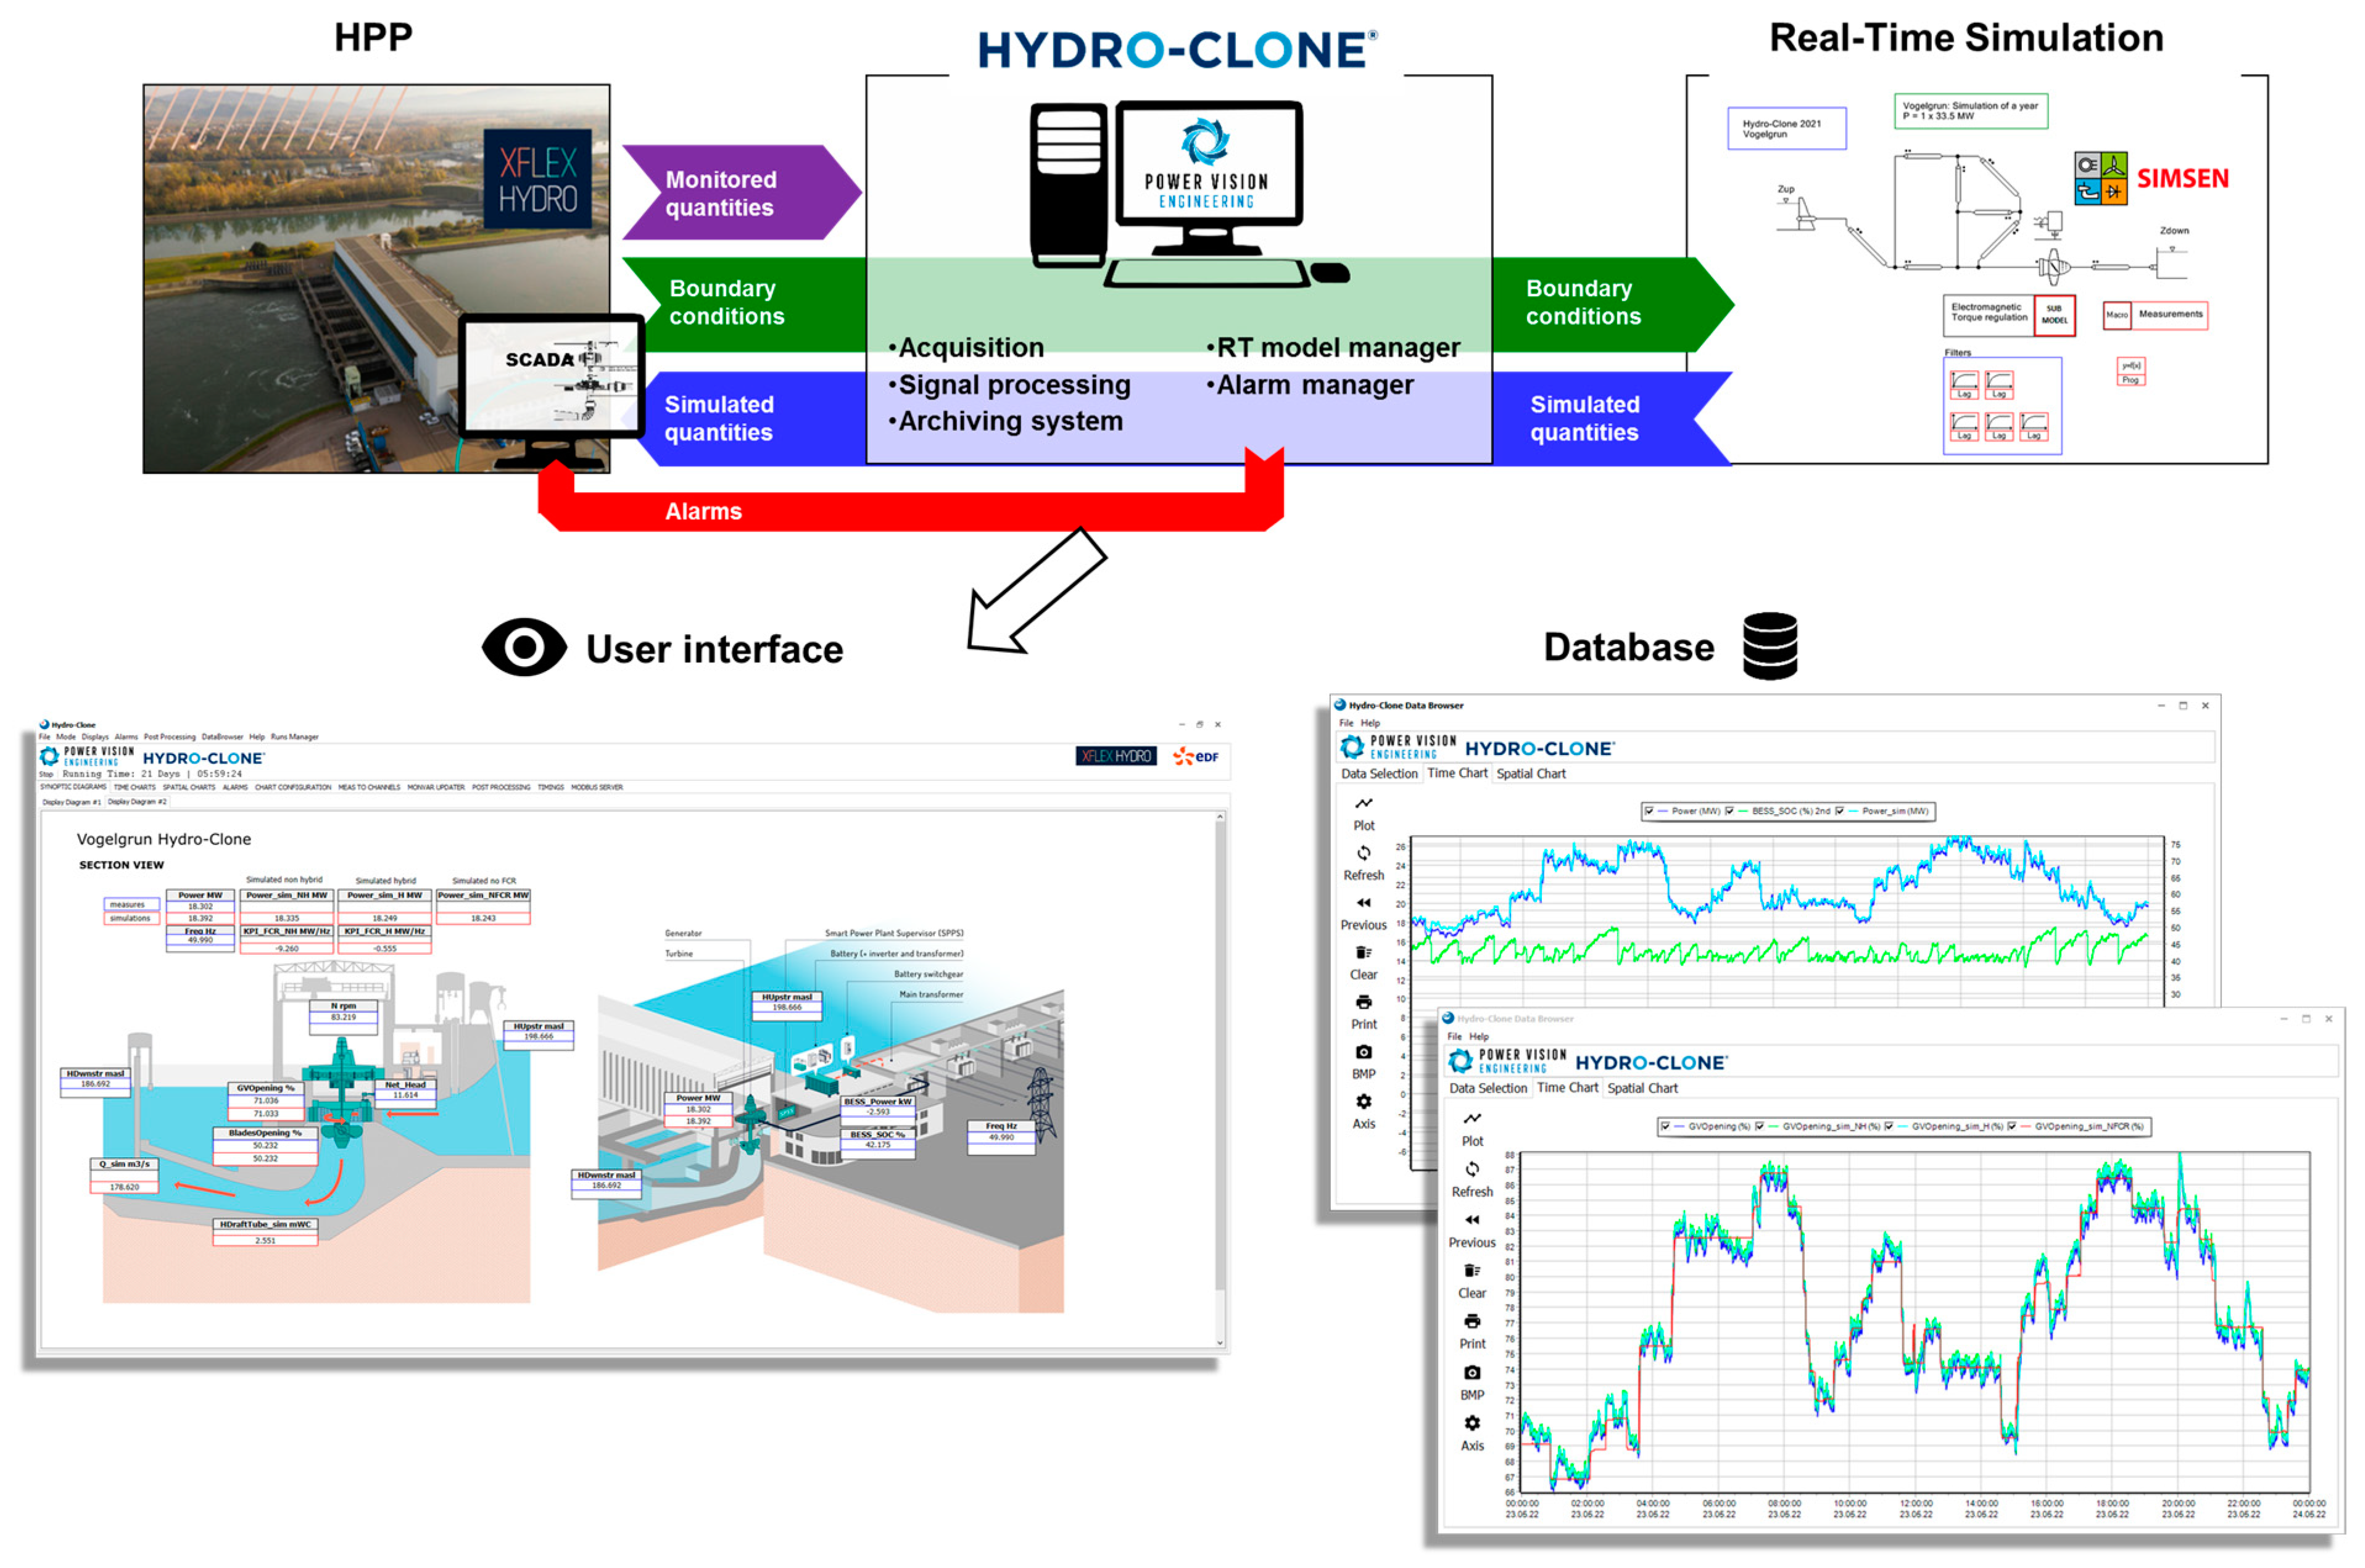
Hydro-Clone is an innovative real-time simulation monitoring system (RTSM) based on a well-calibrated and validated SIMSEN model of the hydropower plant capable of reproducing in real time any dynamic behavior of the plant based on the boundary conditions measured in situ, i.e., it is a digital twin [
28,
29,
30]. This system allows continuous diagnosis of the health of a hydropower plant with digital cloning of the main hydraulic and electrical components of the plant. The Hydro-Clone’s general concept is illustrated in
Figure 14. The system manages the tasks of real-time acquisition and transfer of boundary conditions and measured quantities to the SIMSEN model, as well as data processing and diagnosis of the HPP health status. A custom-built archival storage system and an associated database allow for the display and analysis of previous results. The analysis and comparison of simulated and measured quantities enable us to understand, at any time, the fitness and behavior of all essential components of the system and to estimate non-measured/non-measurable quantities throughout the entire system.
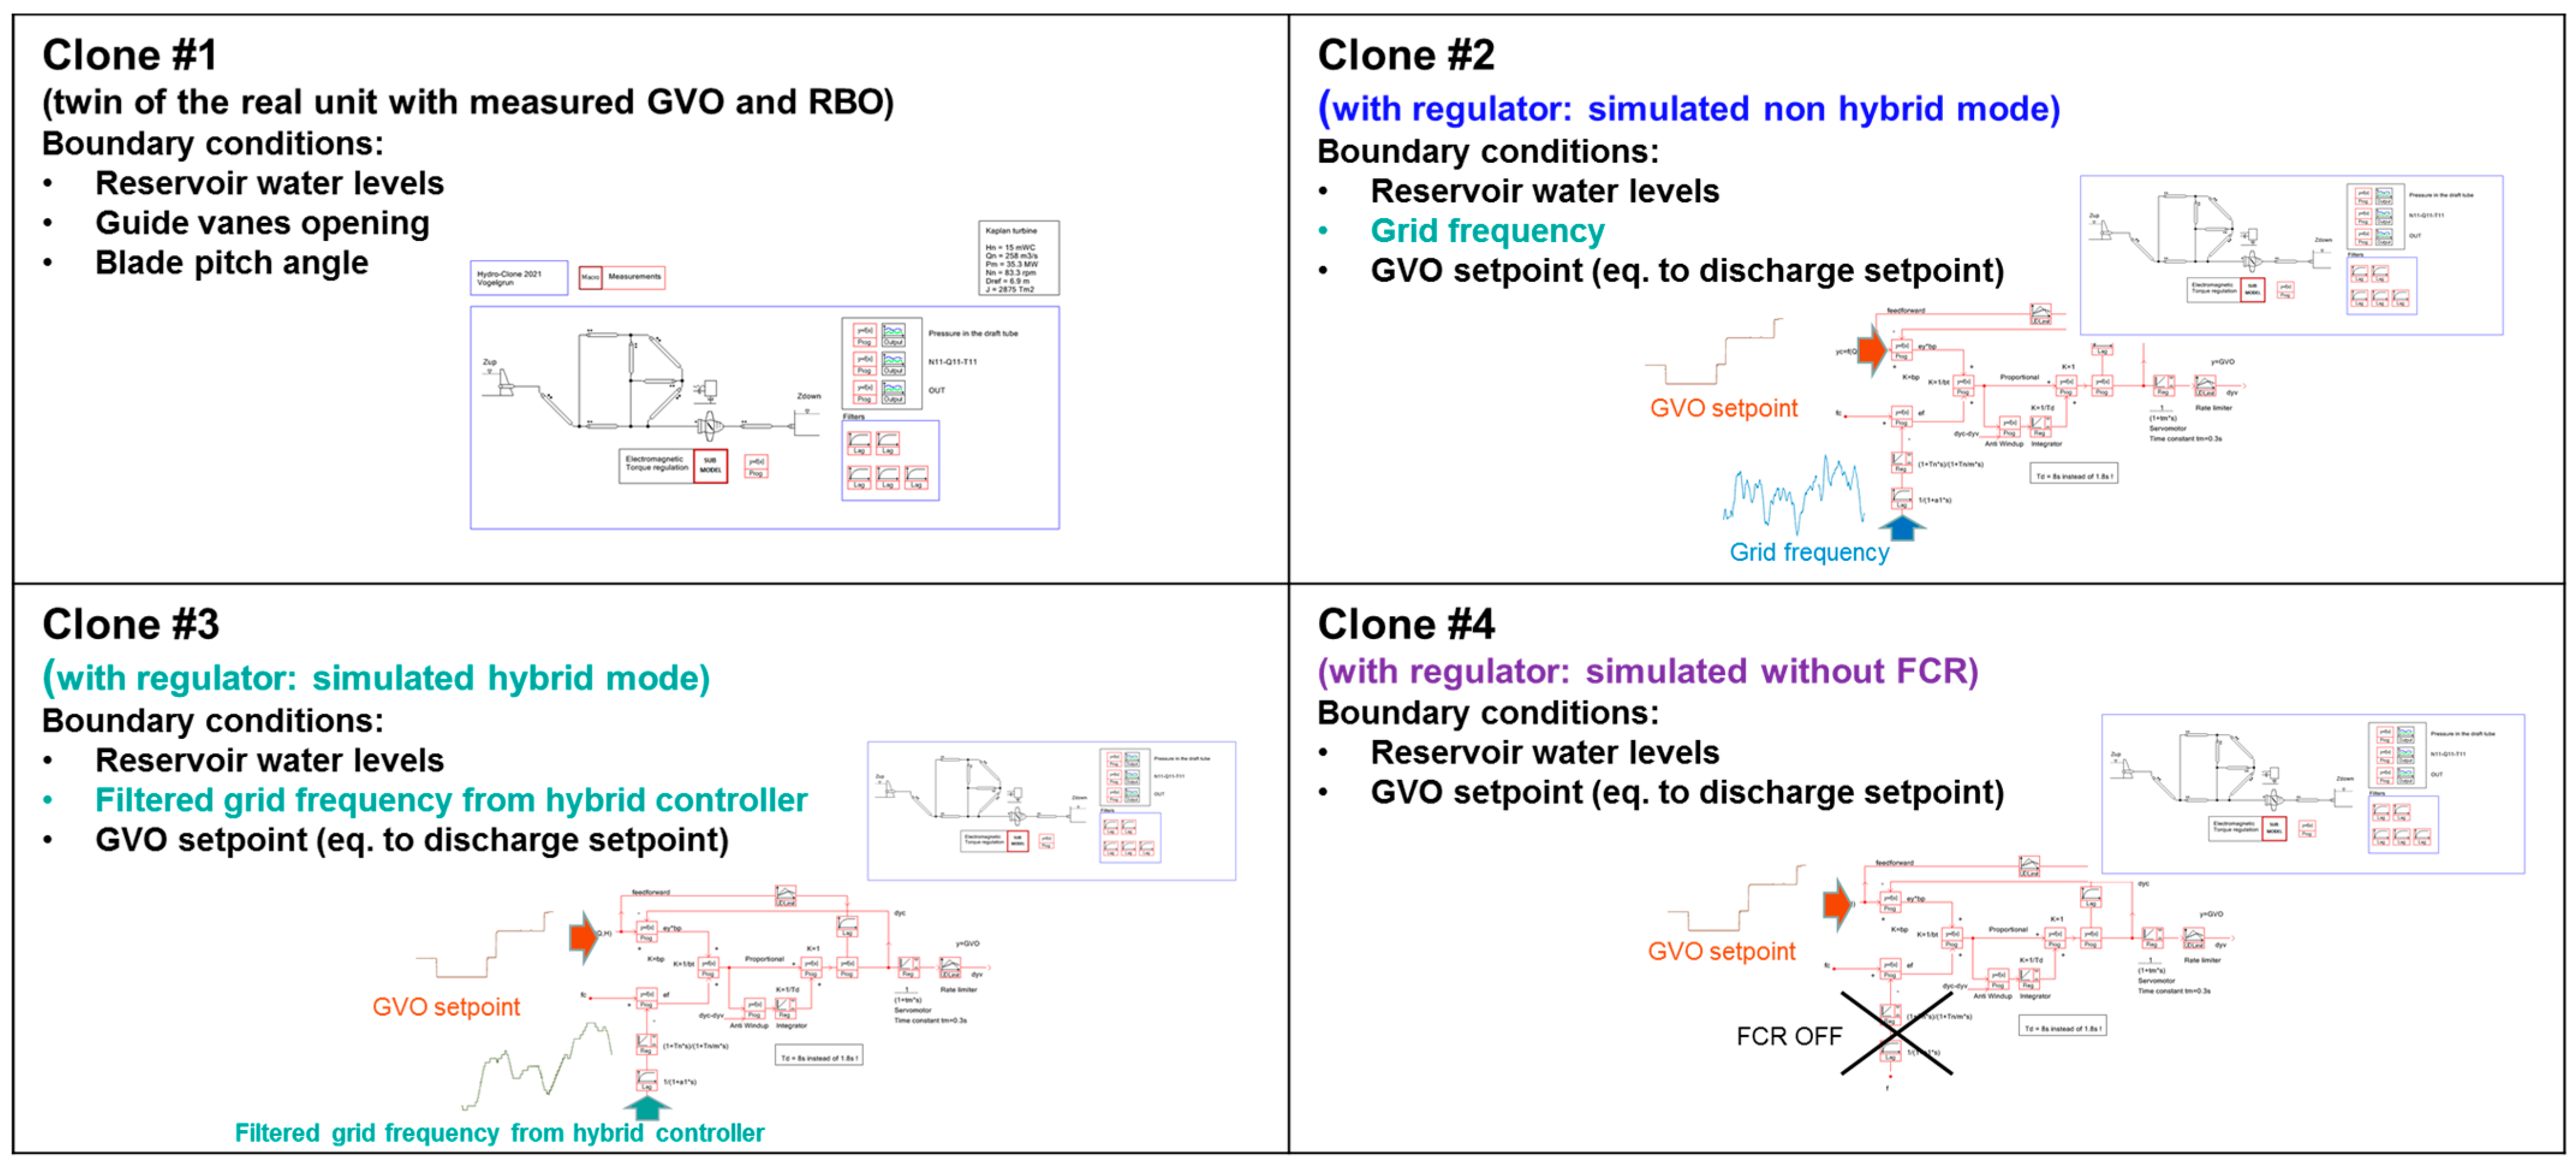
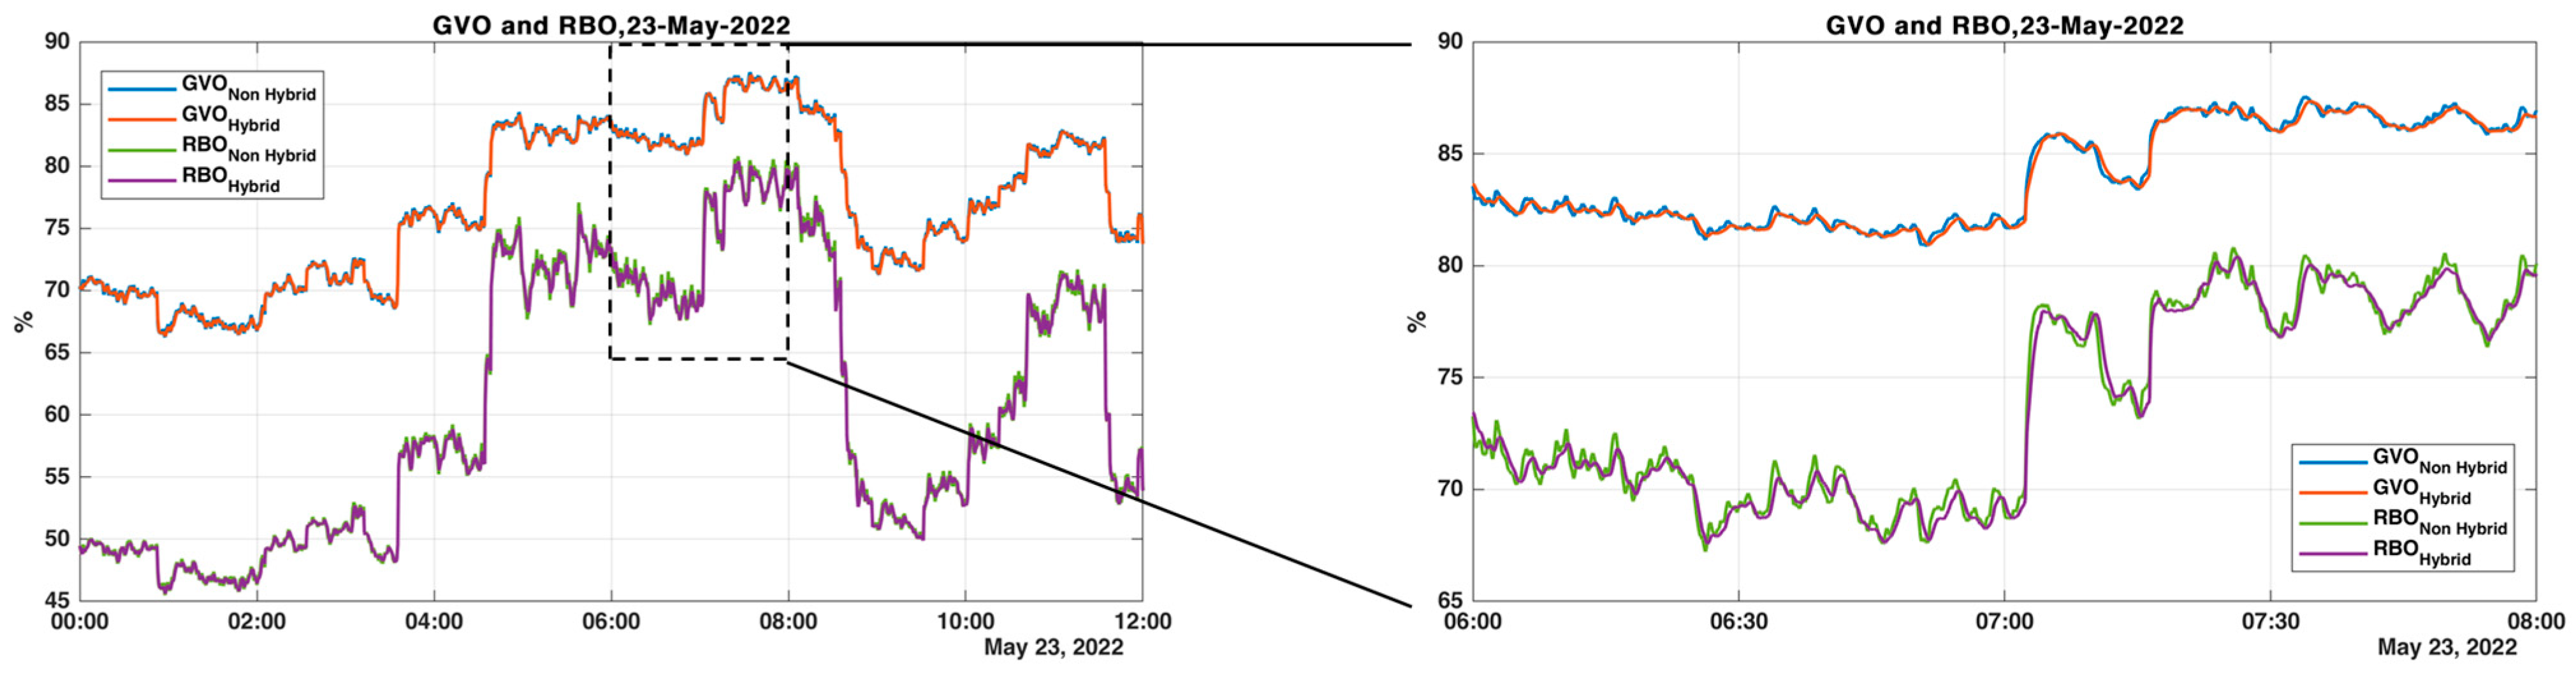
The immediate benefit of this digitalization is that it allows the non-measured/non-measurable quantities to be monitored at any time without the physical installation of additional sensors. In the case of the Vogelgrun HPP, it was decided to take advantage of this type of digitization to evaluate the impact of the BESS on the movements of the guide vanes opening (GVO) and the runner blade opening (RBO) by adding three additional real-time models operating in parallel in the Hydro-Clone. The characteristics and goal of each model are summarized in
Figure 15. The clone model #1 is the classic monitoring, which replicates the behavior of the real unit by imposing the measured guide vane openings and blade pitch angle in the simulation. The clone model #2 includes the turbine governor model, with the guide vane opening setpoint and grid frequency as inputs. In this mode, the movement of the guides and blades is therefore a result, as they are driven by the turbine governor. This model enables us to emulate the behavior of unit 1 without the BESS regardless of the mode of operation of the real unit. The clone model #3 follows the same philosophy as the model #2 except that the input is the low pass filtered grid frequency, as computed by the hybrid controller (
Figure 3). This allows us to replicate the behavior of the hybridized unit 1 with the same control structure as when the BESS is activated. It was verified that the behaviors of models #2 and #3 correspond to the real unit when the battery is deactivated or activated, respectively. Finally, clone #4 simulates the behavior of the unit when the FCR response is disabled. This enables us to identify the contribution of level regulation to the movement of GVO and RBO. These various versions of the digital twins with the unit controller provide a basis for comparison that allows direct confrontation of the hybrid and non-hybrid modes under the same operating conditions.
Figure 14.
General concept of Hydro-Clone system based on real-time simulation.
Figure 14.
General concept of Hydro-Clone system based on real-time simulation.
Figure 15.
Summary and characteristics of the four real-time models deployed in Hydro-Clone.
Figure 15.
Summary and characteristics of the four real-time models deployed in Hydro-Clone.
5. Conclusions and Outlook
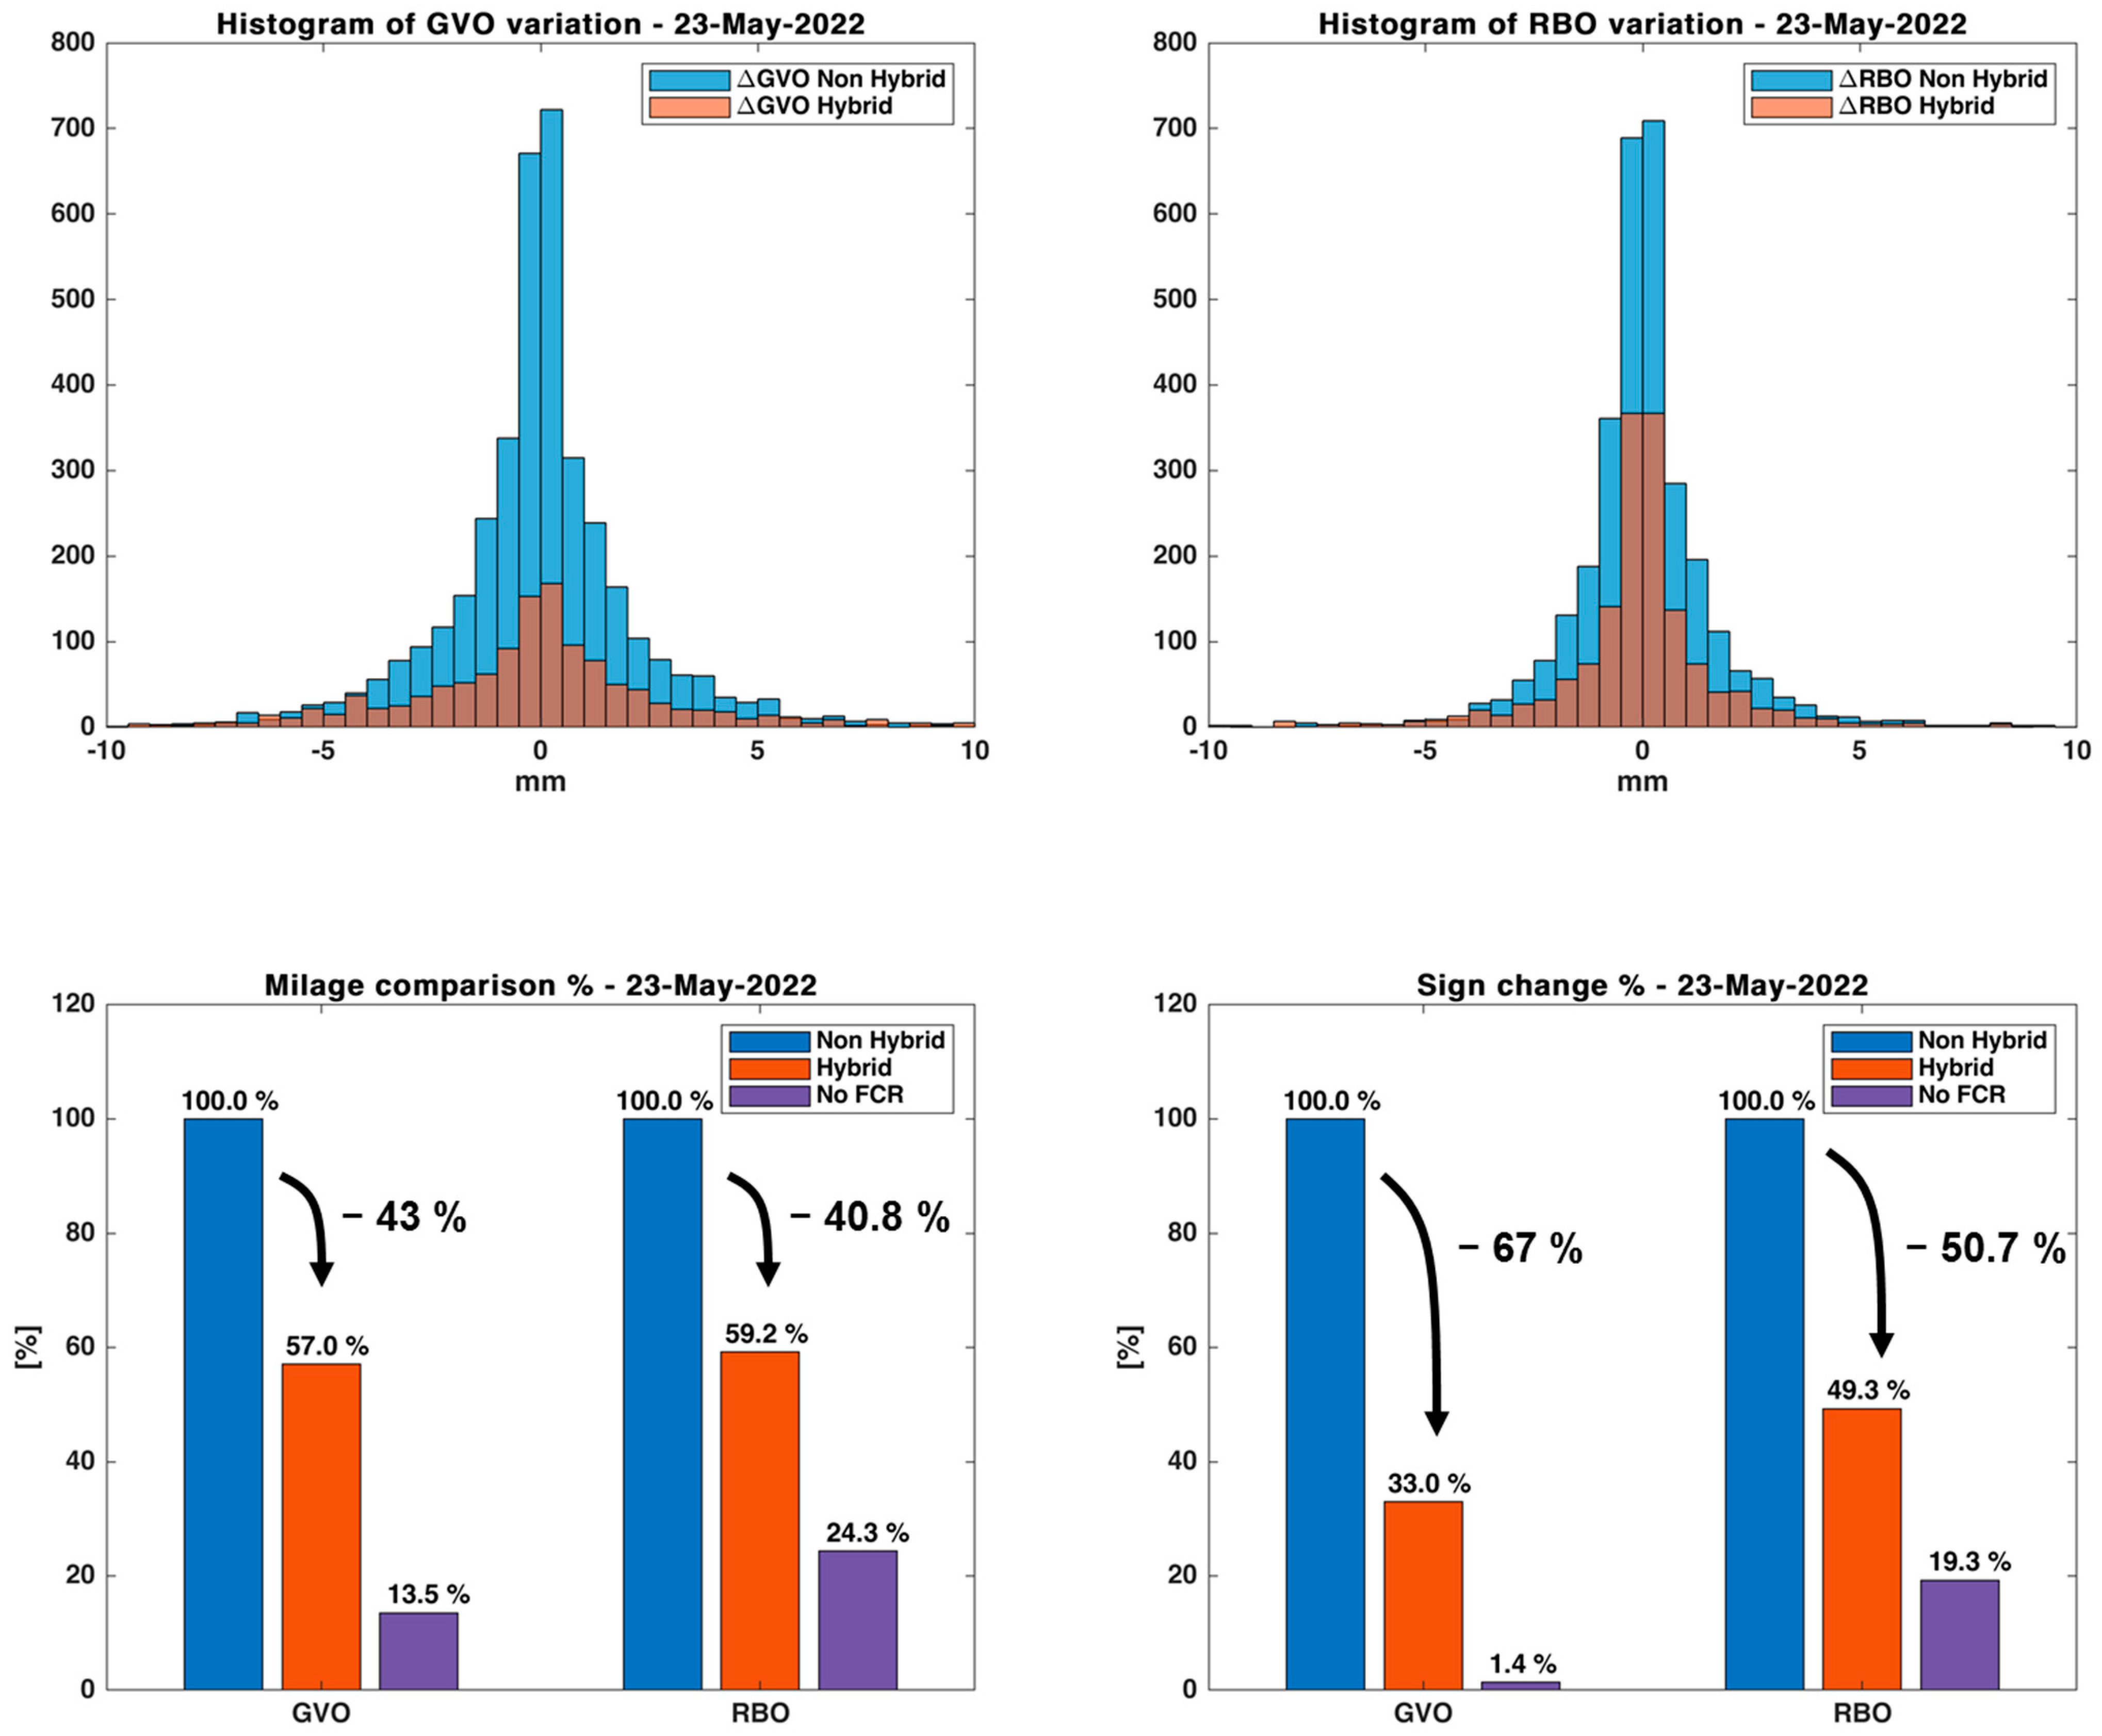
It was demonstrated that due to the hybridization, the mileage of the guide vanes and runner blades could be reduced. In that regard, the estimated reduction in wear and tear at the beginning of the demonstration matches the achieved reduction very well. With the collected measurements, the simulation models were tuned. This allows us to run simulations for various scenarios with validated models and the same conditions (e.g., discharge, head and frequency of the power system). With the hybridization, the total mileage of the guide vanes could be reduced by 43%, while the runner blade’s opening movement was reduced by 40.8%. It was quantified that the proportion of mileage that comes from level regulation represents 13.5% for GVO and 24.5% for RBO, respectively. Additionally, a significant reduction in the number of sign changes in the movement of GVO and RBO was observed (number of panel changes by 67% for guide vane openings and 50.7% for runner blade openings).
One boundary condition of the BESS sizing was that the BESS shall reach its end of life at the end of the demonstration phase. However, during the first half of the demonstration phase, the calculated SoH with the BESS was 98%.
Due to the sizing of the BESS (1.8% of the nameplate rating of one unit), the participation in other ancillary services markets is not feasible. However, with a larger BESS rating and capacity, a stand-alone RoR power plant could also participate on intraday and other reserve markets (aFRR, mFRR, etc.).
Until the end of the project, different control strategies will be tested and evaluated in terms of achievable reduction in wear and tear as well as impact on the SoH of the BESS.
Finally, based on the experiences of all demonstrators of the XFLEX HYDRO project, a technical whitepaper and roadmap for the European Hydropower fleet will be published.


 and
and 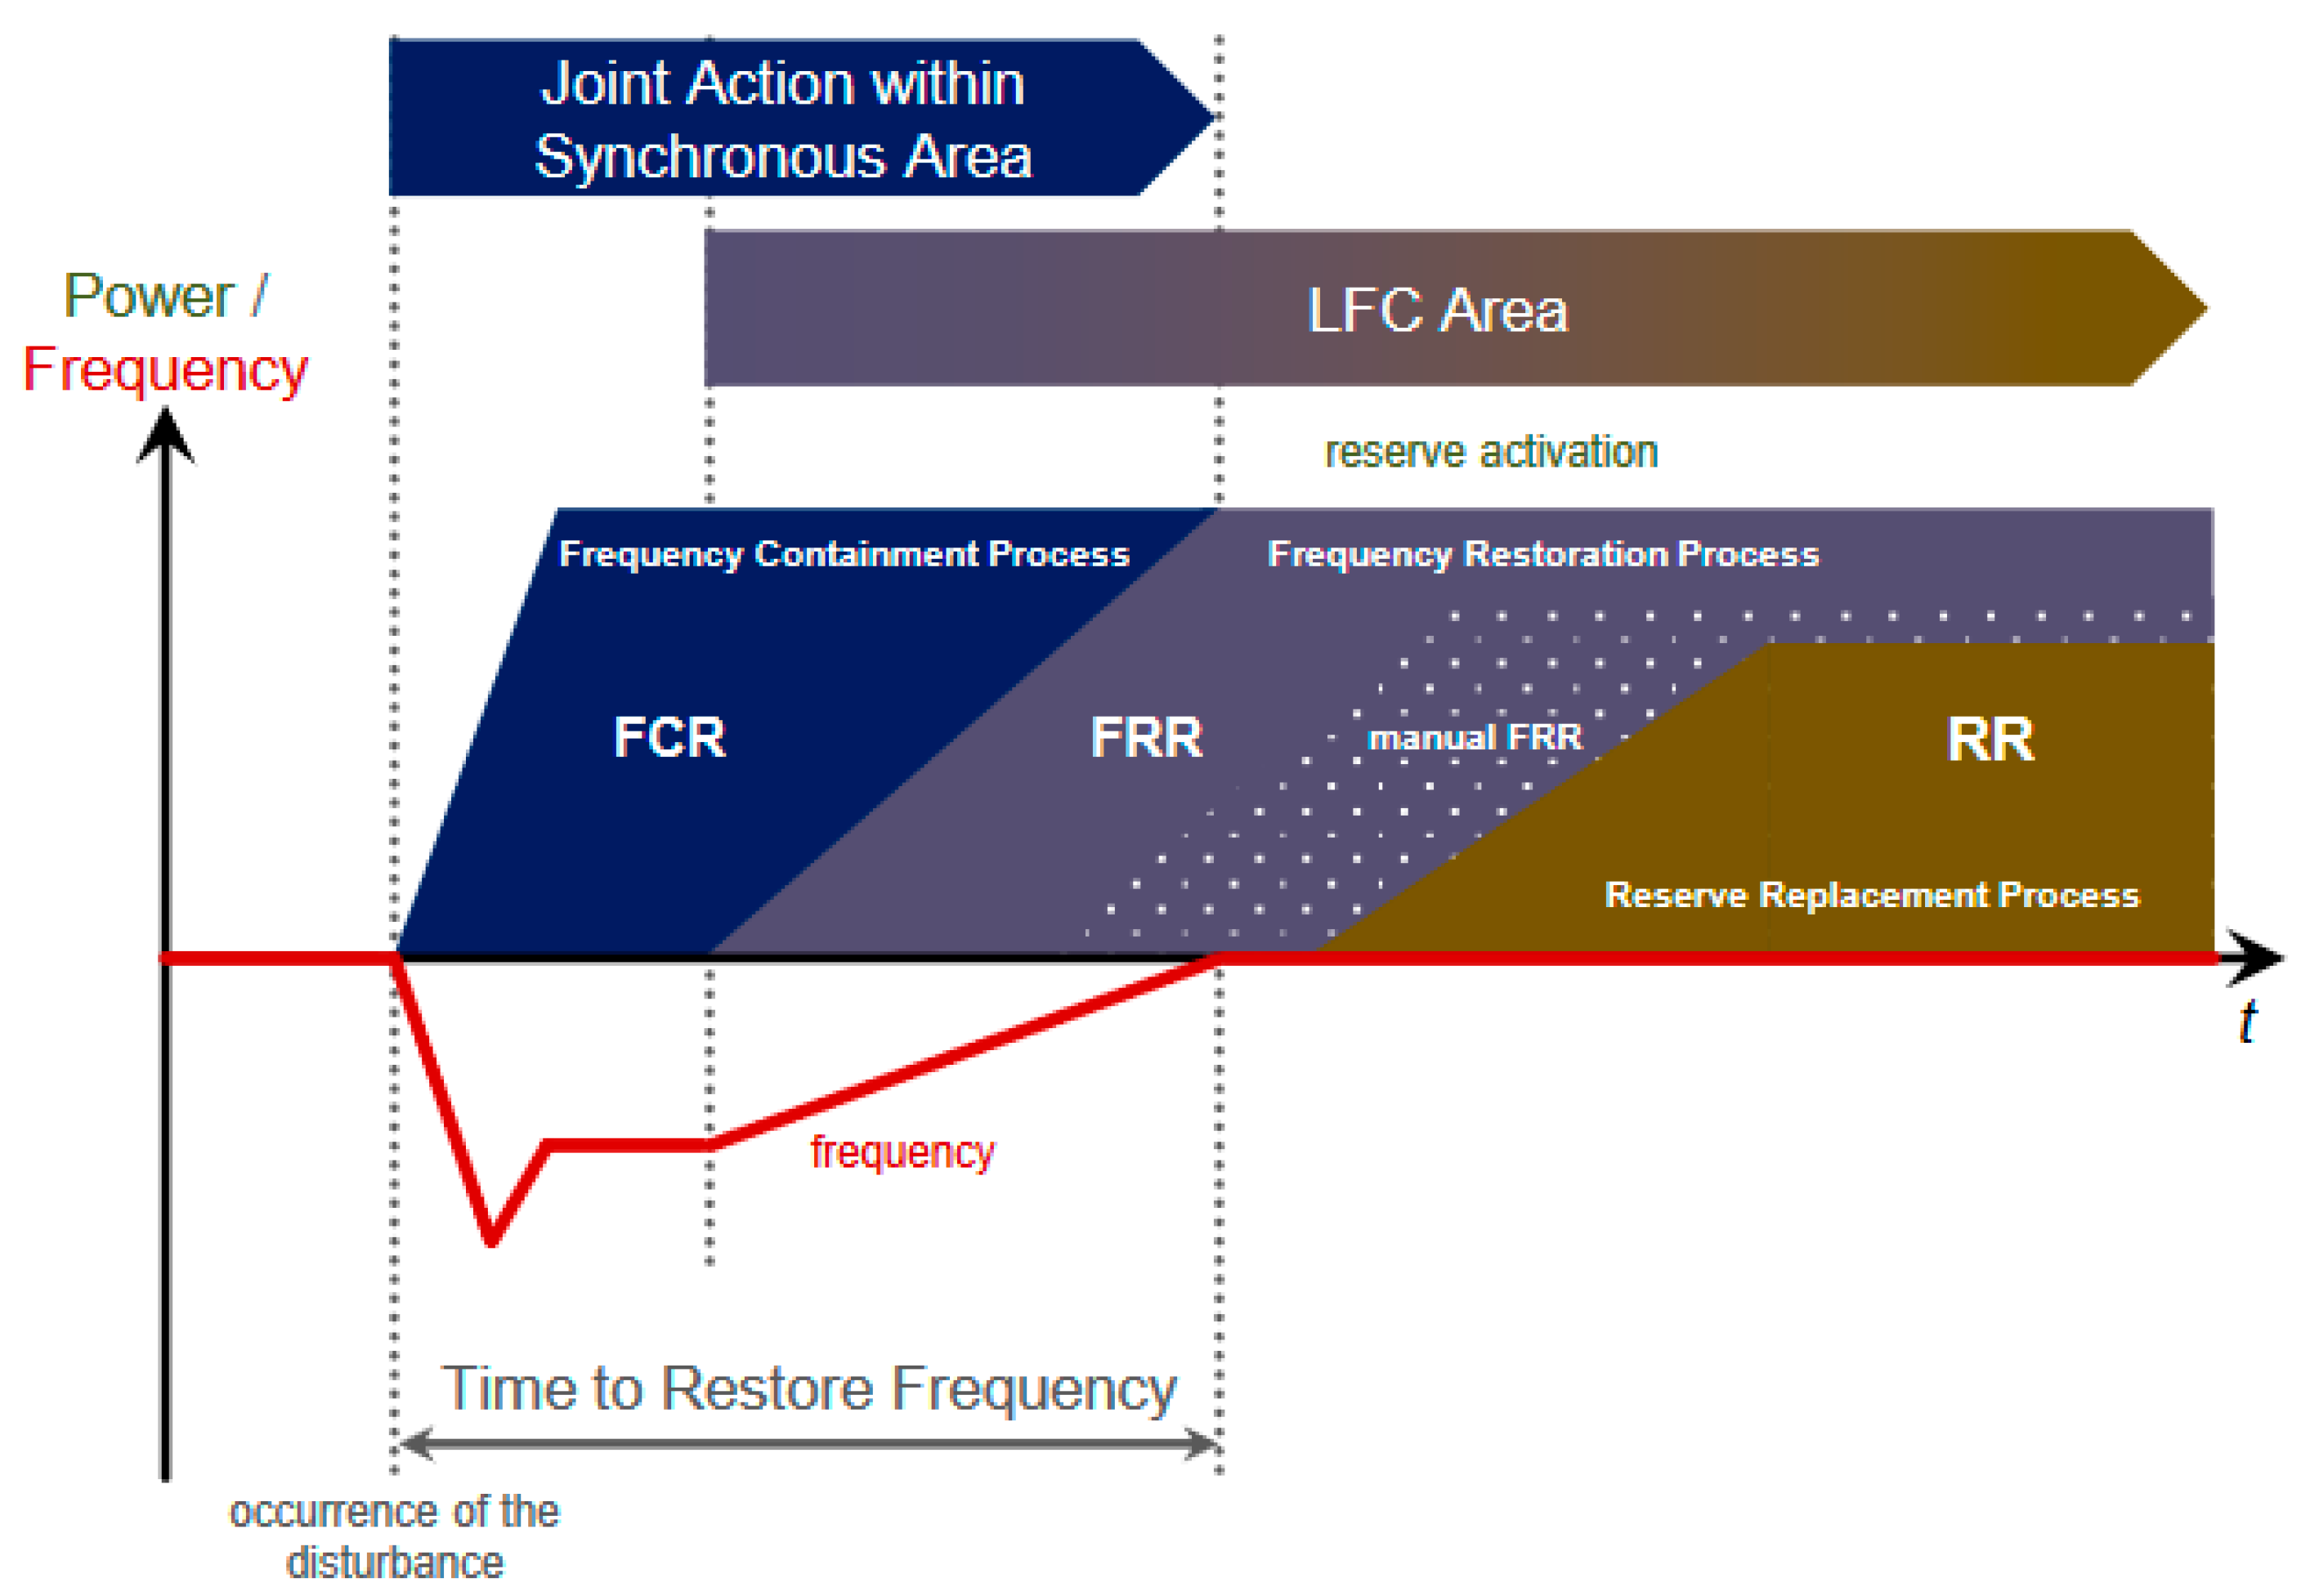


