Article

Modeling and Analyzing the Impact of Different Operating Conditions for Electric and Conventional Vehicles in Malaysia on Energy, Economic, and the Environment

by
Nur Ayeesha Qisteena Muzir
1,2,
Md. Hasanuzzaman
1,* and
Jeyraj Selvaraj
1
1
Higher Institution Centre of Excellence (HICoE), UM Power Dedicated Advanced Centre (UMPEDAC), Level 4, Wisma R&D UM, Jalan Pantai Baharu, Kuala Lumpur 59990, Malaysia
2
Institute of Advanced Studies, University of Malaya, Kuala Lumpur 50603, Malaysia
*
Author to whom correspondence should be addressed.
Energies 2023, 16(13), 5048; https://doi.org/10.3390/en16135048
Submission received: 28 April 2023 / Revised: 12 June 2023 / Accepted: 21 June 2023 / Published: 29 June 2023
(This article belongs to the Special Issue Energy Saving in Traffic Infrastructure)

Abstract

:
Given the significance of the transportation sector to the economy of a country, major companies and government-linked entities have invested in infrastructure and transportation services. Nonetheless, the sector faces issues relating to traffic congestion, energy consumption, and environmental impacts such as air pollution and carbon emissions. To address and analyze these issues, the current study employed microscopic modeling using the AIMSUN software, which allowed for detailed modeling and simulation. The current study examined the impacts of different operating conditions, namely: internal combustion engine vehicles (ICEVs) and electric vehicles (EVs), on energy consumption, energy savings, cost savings, and emissions traveling on a total of six (6) routes: (i) long-distance highway travel, (ii) short-distance highway travel, (iii) long-distance urban travel, (iv) short-distance urban travel, (v) long-distance suburban travel, and (vi) short-distance suburban travel. The impacts of the traffic management systems, such as traffic lights, roundabouts, and road altitude, were also analyzed in this research. The current study discovered that, on average, EVs consumed 30 percent less energy than ICEVs and a 26 percent energy cost saving for long-distance highway travel. On long-distance urban travel, EVs experienced higher energy and cost savings than ICEVs, with 86 percent and 64 percent, respectively. In addition, EVs had lower carbon dioxide emissions than ICEVs. This study concludes that EVs offer positive impacts on energy cost savings and carbon dioxide emissions reduction for all six (6) simulated routes in Malaysia compared to ICEVs, thereby contributing to the existing literature on EVs in Malaysia.

1. Introduction

The rise in population, as well as urbanization, has resulted in an increased number of mobile purchases, especially private freight. In Malaysia, according to Malaysian Automotive Association (MAA), in October 2022, there was a 53 percent increase in car sales from September 2021 to September 2022, albeit the impact of COVID-19. This demonstrates the high purchasing power of Malaysians in regard to private freight and their high dependency on private over public transportation.
Car ownership does not restrict the travel demand of individuals or households. As a result, the possession of a private car allows economic opportunities such as an increase in employability and job rate, access to better schools and colleges for education, and a boost in self-satisfaction and wellness [1,2]. In addition, owning a car affects the household’s long-term decisions, including the location to reside and the route to work, school, college, or shopping. Buying and owning a car in Malaysia is appealing with government-subsidized fuel. With subsidized fuel, car owners in Malaysia are not significantly impacted by the increase in world fuel prices. As of 2 January 2022, the petrol price per liter for RON 95 was USD 0.48, RON 97 was USD 0.75, and the diesel price was USD 0.48. In addition, in June 2022, petrol, diesel, and liquefied petroleum (LP) gas received a total of USD 8.50 billion (48% of the total subsidies). Despite that subsidized fuel helps raise the standard of living through low input cost [3], the subsidization benefits the higher-income groups more than the lower-income groups because the higher-income groups consume more fuel and fuel-related services. According to reports, 20 percent of the benefits accrued to the T20 income class, while only 15 percent of the benefits accrued to the B40 income class. This defeats the purpose of subsidization.
Furthermore, car owners underestimated approximately 52 percent of the total cost of car ownership, and car owners would own a cheaper car if the cost were calculated and tabulated before buying a car [4]. A study by Moody, Farr [2] also confirmed that the cost of ownership of a car is higher than the total cost of use. This can be supported by the cost of insurance, road tax, and maintenance that is required every six months for most cars and depending on the mileage traveled [2].
A drawback of owning a conventional vehicle or an internal combustion engine vehicle (ICEVs) is the low efficiency of converting power to wheels. According to Energy [3], ICEVs convert between 12 and 30 percent of the energy stored in petrol into power at wheels. In addition, over 60 percent of the energy is lost as heat, used for the engine and driveline and to power accessories. Moreover, in a combined city and highway drive, the idling losses accounted for up to six percent of total power consumption. Moreover, older engines lose more power and less horsepower and efficiency. The stop-and-go for ICEVs also consumes more energy since the car uses power for acceleration and sudden braking. Thus, driving ICEVs in a city center, especially during peak hours when traffic congestion occurs, consumes more fuel than any other time of driving. For instance, Martin Treiber, Arne Kesting [4] reveal that fuel consumption increases by 80 percent during congestion compared to normal traffic. MIT CSHub [5] adds that fuel consumption during congestion increases by 3.5 times compared to normal free-flow traffic.
The traffic conditions and the growing number of cars on the road influence fuel consumption. This results in the emissions of harmful gases to the environment. Carbon dioxide (CO2) and water vapors are the two main gases that are transported to the atmosphere from the full combustion of fuel (H2O). All fuels consist of certain contaminants in addition to the combination of hydrocarbons. For example, sulfur is transformed during combustion mostly to sulfur dioxide (SO2) and sporadically to sulfate, both of which aid in the deposition of particulates in the emissions.
In parallel to lesser amounts of nitrogen-containing combustible contaminants, atmosphere nitrogen is oxidized to nitric oxide and tiny quantities of nitrogen oxides (NOx) at the high combustion temperatures of the majority of transportation sources of air pollutants. The burning of fossil fuels produces air pollution across all forms of transportation. Consequently, a majority of transport sources currently generate comparable contaminants, while their relative abundance varies depending on the precise combustion products and specifics of the burning circumstances.
Bad air pollution circulates to bad health for humans. Pollution-induced illness has caused approximately 600,000 deaths a year in Europe alone, with Germany and Italy contributing to the highest mortality [6]. Without proper governance, this can create a risk to human health, including respiratory, heart diseases, and lung cancer. Thus, it is important to find an alternative to combustion engines that reduces their dependency on fossil fuels, reduces the cost of fuel, and lessens the environmental impacts in the transportation industry. Consequently, electric vehicles (EVs) can serve as a solution.
In Malaysia’s 2022 Budget, EVs incentives include exemption from import and excise duty for imported Complete Built-Up (CBU) EVs until 31 December 2023 and excise duty and sales tax for Completely Knocked Down (CKD) EVs until 31 December 2025. Apart from that, there is also personal tax relief of up to USD 562 for the cost of purchase, installation, rental, and subscription fees of EVs’ charging facilities for income tax assessment years 2022 and 2023. The owner of battery and fuel cells EVs is also entitled to a road tax exemption until 31 December 2025.
Despite the promising offers by the government, the number of EV sales are still low. This is due to the lack of public awareness to encourage the public to switch to EVs which includes the range and reliability of EVs, including information on energy cost, cost savings, and the environment compared to ICEVs, in addition to the lack of readiness of the infrastructure for EVs.
Another factor associated with the lack of EV ownership is the risk of electric shock. This mainly can happen during charging, where the EV can become live during charging due to lack of appropriate protection onboard, and the owner may suffer from electric shock. Apart from that, while charging an EV, a cyberattack may also happen—this is where the hackers are able to hack and bypass the system and eventually copy the owner ID for other transactions. Cyberattacks can also disable the networks, range sensors, and cameras, taking over the steering control and disabling the brake, which may lead to collisions and fatalities.
According to the Energy Handbook by Suruhanjaya Tenaga [7], the transportation sector contributes 96 percent of carbon dioxide emissions, with road transportation being the biggest contributor to the emission of carbon dioxide in this country. Many researchers agree that the deployment and adoption of EV or hybrid vehicles can reduce the amount of carbon dioxide emission by the transport sector [8]. This phenomenon can be seen in Norway, where an increase in the usage of EVs decreases the amount of carbon dioxide emission in the air [9]. However, the amount of carbon dioxide reduced depends on the electrical mix of the country. The goal in owning and driving a car is to have good and better fuel energy for internal combustion engines and energy for EVs which, in return, reduces the economic cost and environmental impacts. In order to achieve this goal, the factors affecting the energy consumption for both vehicles need to be analyzed.

1.1. Factors Affecting Energy Consumption

There are various factors that affect the fuel and energy consumption of a vehicle. The first factor is the aerodynamics of vehicles. Aerodynamics for a vehicle is referred to the shape and design of a car. In order to have better fuel economy, the drag coefficient needs to be as low as possible, as there is a strong relationship between speed and velocity with the power to overcome the aerodynamic drag. For instance, an additional roof rack or roof box increases fuel consumption by 5 percent, while opening windows at 130 km/h will increase fuel consumption by 5.1 percent [10].
The second factor is the driving factor which includes the driving behavior and aggressiveness of the driver. Zhou, Jin [11] state that a 40 percent increase in fuel consumption contributes to aggressive driving behavior. Proper planning of a drive can reduce fuel consumption by 10 percent by choosing a less congested road or a road with lesser bumps and slopes. A new road with roadblocks may take a longer time, but it reduces fuel and energy costs.
The next factor is the condition of the vehicles. A good and well-maintained vehicle saves 60 percent on fuel consumption [11]. Good maintenance includes well-maintained spark plugs, air, and oil. Clogged filters and wheels that are not aligned can cause an increase of up to 4 percent in fuel consumption, whereas based on National Highway Traffic Safety Administration in the USA, every 1 percent decrease in tire pressure correlated to a 0.3 percent reduction in fuel economy. However, 10 percent underinflation increases fuel consumption by 2 percent, and twenty percent underinflation increases fuel consumption by 4 percent.
The fourth factor is the natural environmental factor which includes road gradient, topology, climate zone, weather, and altitude. The decrease in sea level improves engine efficiency with the increase in atmospheric pressure. The increase in atmospheric pressure improves the fuel combustion process but decreases fuel consumption compared to an altitude with low atmospheric pressure, where fuel consumption increases [11]. This is also due to the greater force to overcome vertical forces. In addition, weather affects fuel and energy consumption through the use of air conditioning and water pumps. In contrast, cold weather increases engine and transmission friction. These factors, however, only affect one percent of the consumption of fuel for a vehicle [12].
Another factor is traffic management, such as traffic lights, yield signs, intersections, and roundabouts. The effect of stopping this traffic management system is crucial to fuel and energy consumption. The idling, decelerating, and reaccelerating of a vehicle consume approximately 2 percent more fuel [13]. For instance, increased traffic flow increases fuel consumption because there is more idling, stopping, and reaccelerating. Another important factor is the speed and velocity of a car. The acceleration and ramping of a car require more fuel, so the faster a vehicle travels, the higher its fuel consumption. The high speed creates more separated flow regions and increases the aerodynamic drag, thereby increasing fuel consumption. For instance, a four percent increase in speed results in a 40 percent increase in fuel consumption. In general, there are many more factors that impact fuel and energy consumption. However, this paper focused on distance travel, traffic management, and the speed of vehicles to determine the effect of fuel and energy consumption on conventional and electric vehicles.
The main aims of the paper were to analyze the impact of both an electric car and a conventional car on energy consumption, energy cost, energy and cost saving, and environmental impact on different routes affect and strengthen the factors that may influence buyers to buy an electric vehicle.

1.2. Electric Vehicle Energy Consumption Modeling

This paper focused on building a model from traffic simulation software called Advanced Interactive Micro-Simulation for Urban and Non-Urban Networks (AIMSUN). The advantage of AIMSUN, among other traffic simulation software, is that it integrates traffic management with mesoscopic, microscopic, and macroscopic simulation in one software [14]. Compared to other microscopic simulators, such as simulation of urban mobility (SUMO), AIMSUN provides closer and more accurate data for all simulated exit speed detectors than SUMO, which yields more reliable results [15]. Another traffic simulation software is VISSIM, in terms of a car-following model.
AIMSUN treats safety distance as a variable, whereas VISSIM is based on the psycho-physic model. Even though both provide different advantages, for AIMSUN, there is a desired distance between vehicles at a certain speed, and the follower is required to decelerate or accelerate to obtain the distance. Meanwhile, in VISSIM, there is also a desired distance between two cars, but when the follower reaches the difference in speed and distance, the acceleration mode is activated to mimic the real behavior of the driver [15]. Apart from that, user preferences in choosing software are based on the intention, as both AIMSUN and VISSIM are able to incorporate all the features required in the traffic simulation. However, the advantage that AIMSUN gave is, it has a user-friendly interface and features are more advanced compared to the other software. A study by [16] using AIMSUN on a freeway shows that the simulated data match the real-world data that was conducted to evaluate the traffic sensor data.
Microscopic simulation is extensively used to provide detailed output with the second-by-second estimation of energy consumption [17]. AIMSUN uses the car-following method, lane-changing, and gap acceptance models to model the vehicle’s behavior. This initiative is the Helly’s model that was further improvised and used in the software using the ad-hoc version of Gipps [18]. The Gipps model emphasizes acceleration—whereby it is the act of a vehicle reaching a certain desired speed—and deceleration, which is the limitations of the vehicle when trying to achieve the desired speed.
On the other hand, [19] used VSP methodology and AIMSUN simulation software to evaluate the environmental performance of roundabouts in urban areas. The fuel consumption, carbon dioxide emission, and noise levels were analyzed during the simulation. The results showed that roundabouts generally had lower environmental impacts compared to traditional signal-controlled intersections. Specifically, the VSP methodology showed a reduction of up to 30 percent in carbon dioxide emission and fuel consumption and a reduction of up to 75 percent in noise levels. AIMSUN simulations also demonstrate that roundabouts can significantly reduce traffic congestion and travel time. Thus, the current study employed AIMSUN simulation to analyze the influence of traffic management and the natural environment on EVs and ICEVs.
As the aim of the current study is to evaluate the impact of energy consumption, cost, and saving by both ICEVs and EVs, a thorough literature review of previous studies, especially in Malaysia, regarding energy consumption was conducted.
In Malaysia, there is a limited number of studies on the comparison between EVs and ICEVs, particularly on energy consumption, as EVs in Malaysia are relatively new. However, previous studies have focused on the challenges and prospects of EVs [20], providing an in-depth examination of the challenges and prospects of EVs in Malaysia. It also identifies the key barriers that hinder widespread usage and discusses the potential solutions and prospects for the future growth of EVs in the country [21]. On the other hand, it also employs the DEMATEL (Decision Making Trial and Evaluation Laboratory) approach to analyze the interrelationships among the factors that influence the adoption and usage of EVs and provide insights into the current state of EV usage in the country. Several key drivers of EV adoption in Malaysia include environmental concerns, government support and policies, energy security, and technological advancements. The barriers identified were lack of charging infrastructure, limited consumer awareness and knowledge about EVs, high upfront costs and concerns about the driving range and charging time.
There are various studies on the perception of the development of EVs, for instance in [22], the study analyses the public perception and attitude towards EVs in Malaysia by identifying the key factors that shape public opinion, such as infrastructure availability, cost considerations, and the need for awareness campaigns and educational initiatives to address the gap. A study in [23] indicates that the majority of respondents have positive attitudes toward EVs; however, there are certain barriers that hinder their acceptance. The study suggests the need for the development of a robust charging infrastructure network as this is the main concern.
A comprehensive review and bibliometric analysis of the life cycle cost assessment (LCCA) of EVs was conducted by [24]. The intention of the study was to summarize the existing literature on the LCCA of EVs and identify the key research trends and gaps. It considered various factors such as vehicle cost, battery cost, fuel and energy costs, maintenance costs, and environmental impact. The study also suggests the inclusion of additional cost components, such as infrastructure costs, grid integration costs, and external costs, in future studies.
Another study by [25] on the cost was conducted on plug-in hybrid electric vehicles (PHEVs), conventional vehicles, and hybrid electric vehicles (HEVs). The findings of the study indicate that the PHEV offers potential cost savings compared to conventional vehicles and HEVs. This is due to the PHEV’s ability to operate in electric-only mode for shorter trips, reducing the dependence on conventional fuel and lowering fuel costs. Additionally, the regenerative braking feature of PHEVs contributes to increased energy efficiency and further cost savings.
A study by [26] investigated the impact of traffic management systems on EVs and ICEVs through LMS AMESIM software with more than 100 driving cycles. The speed profiles for both vehicles were retrieved from [27]. The study found that traffic conditions significantly affect the energy consumption of vehicles. In stop-and-go traffic, electric vehicles consume less energy than ICEVs; however, at higher speeds, EVs consume more energy than ICEVs due to the vehicle weight and powertrains. Congested traffic has a greater impact for ICEVs than EVs as it consumes more energy due to the frequent starts and stops while EV uses regenerative braking to recover the loss and it also does not burn fuel while idling. Thus, in this current study, the said condition is tested under Malaysia’s road condition by AIMSUN software. This study will contribute to the comprehensive comparison of both EVs and ICEVs under six different travel conditions as the traffic in urban cities is mostly congested especially during peak hours.
The impact of driving electric vehicles at highway speed was studied by [28]. This study focuses on the impact of auxiliary loads, such as heating or air conditioning, on the range and energy consumption of EVs. Nissan Leaf and Imiev were used in the experiments. The models were compared from the real-road driving with three different scenarios, and the parameter was calibrated accordingly. The finding reveals that energy consumption increases with the increase in vehicle speed, mass, cross-frontal area, auxiliary loads, and headwind. The current study investigates the comparison of energy consumption for both EVs and ICEVs on a highway. In this study, long and short-distance highways are included as both highways have different road conditions with different road altitudes.
A novel approach to optimizing energy consumption in EVs by taking into account traffic lights was also adopted [29]. This study discovers a 24 percent reduction in the energy consumption of EVs when considering the optimal speed profile for EVs while ensuring the vehicle arrives at the traffic light during the green phase. The current study investigates the energy consumption in the presence of traffic lights for both EVs and ICEVs in Malaysia.
A study conducted by [30] used a life cycle approach to estimate the greenhouse gas 9GHG) emissions of three vehicle types: petrol, biodiesel, and battery electric vehicles (BEVs). The findings revealed that BEVs exhibit the lowest GHG emissions throughout their life cycle. Petrol vehicles have the highest emissions due to the combustion of gasoline, and bio-diesel vehicles show intermediate emissions, as the production and processing of bio-diesel contribute to the overall environmental footprint. The current study investigates the impacts of driving on six road conditions on the environment, with the most used vehicles on the road in Malaysia—EVs and ICEVs.
Another study [31] reveals significant decreases in the cost of EVs from 2010 to 2020 in Germany, driven by technological advancements, economies of scale, and supportive policies. The cost trends indicate the increasing competitiveness of EVs compared to ICEVs which is further supported by [24]. As the current study focuses on the operational cost of EVs and ICEVs in Malaysia, it will contribute to the adoption of EVs in the country as more EVs are coming to Malaysia and the price is slightly competitive with current ICEVs and this study highlights the difference in operational cost for both vehicles.
A case study in Canada by [32] revealed that for long-distance travel, EVs had lower fuel costs, averaging USD 0.05 per mile compared to USD 0.09 per mile for ICEVs. In terms of emissions, EVs emitted 40% less GHG per mile than ICEVs. Thus, this current study aims to investigate both vehicles in Malaysia on various road conditions.
Given this prior study on EVs and ICEs in Malaysia, it is important to compare the energy consumption and carbon emissions of EVs and ICEVs in order to give an overview of EV ownership in Malaysia. As EVs are relatively new and emerging in Malaysia, there is a limited study on the comparison of both EVs and ICEVs in the country. Listed above are some of the examples of studies conducted in Malaysia that focus on the perception, acceptance, and benefits of EVs to the individual and the country as a whole.
Hence it is important for the current study to look into the comparison of both vehicles in Malaysia as it contributes to the potential benefits of transitioning to electric vehicles and helps to achieve the Net Zero 2050 goals for Malaysia, which EVs are one of the important components to realizing the goal.

2. Methodology

The performance of EVs is affected by the battery capacity and the travel distance, while ICEVs are affected by the consumption of fuel, travel distance, and engine capacity. This paper modeled three building blocks to demonstrate transportation behavior through the microscopic traffic network simulation model. The model was employed to comprehend the microscopic interactions between vehicles and infrastructures. Furthermore, the microscopic simulation model simulates real-world driving conditions through the features offered, such as the car-following model, lane-changing, and route choice. The model also produces variables such as traffic flow, density, speed, travel time, pollution, fuel, and battery consumption. The modeling that was performed on AIMSUN intended to provide realistic driving cycles of how EVs consume energy to meet power demand and how ICEVs consume fuel to meet fuel demand during different cycles, with ICEs and EVs simulated with the same parameters such as route, road conditions, season, weather, and speed. This is to ensure that the result can be both compared and analyzed accurately.

2.1. Modeling the Route for Different Scenarios

Prior studies have selected various routes for various reasons. For example, [33] chose based on the most transited route in the country, [34] chose the route/intersection to study the impact of intersections as a substitute route on BEV, [35] conducted experiments based on the U.S Highway Functional Classification System of the Division of Statewide Planning, to explain the road’s purpose and characteristics of the interstate, freeways, principal arterial, minor arterial, major collector and minor collector. Other than that, a study of the electric vehicles’ energy consumption and estimation is based on the daily route commuted by one of the member of faculty [36].
In the current study, six (6) road scenarios with different intersections were studied and constructed in AIMSUN to see the variation in energy consumption in each scenario. The scenarios aimed to evaluate the energy or fuel consumption of different road altitudes or gradients, road conditions, and traffic management controls because the differences affect the fuel or energy. Other than that, the impact of traffic congestion was also studied, especially in urban areas where peak-hour traffic congestion is likely to occur. The sic scenarios were: (i) long-distance highway route, (ii) short-distance highway route, (iii) long-distance urban route, (iv) short-distance urban route, (v) long-distance suburban route, and (vi) short-distance suburban route.

2.1.1. Scenario 1: Long-Distance Highway Route

The first route (Scenario 1) shown in Figure 1, was from Gombak Toll Plaza, Kuala Lumpur, to Jabor, Terengganu, via the East Coast Highway. The distance from the origin to the destination was approximately 232 km. This route has multiple road altitudes, no traffic lights, and a speed limit of 110 km/h. According to the road transportation statistics by the Ministry of Transportation Malaysia [37], this road was among the highest traffic usage in Pahang compared to other roads. However, it was typically busy on weekends and during festive seasons as it is the main road connecting the west and east coast of Peninsular Malaysia. The toll price from the origin to the destination was USD 6 for a Class 1 vehicle. This included USD 1.3 for the Gombak Toll and USD 4.67 from Karak Toll to the Jabor Toll.

2.1.2. Scenario 2: Short-Distance Highway Route

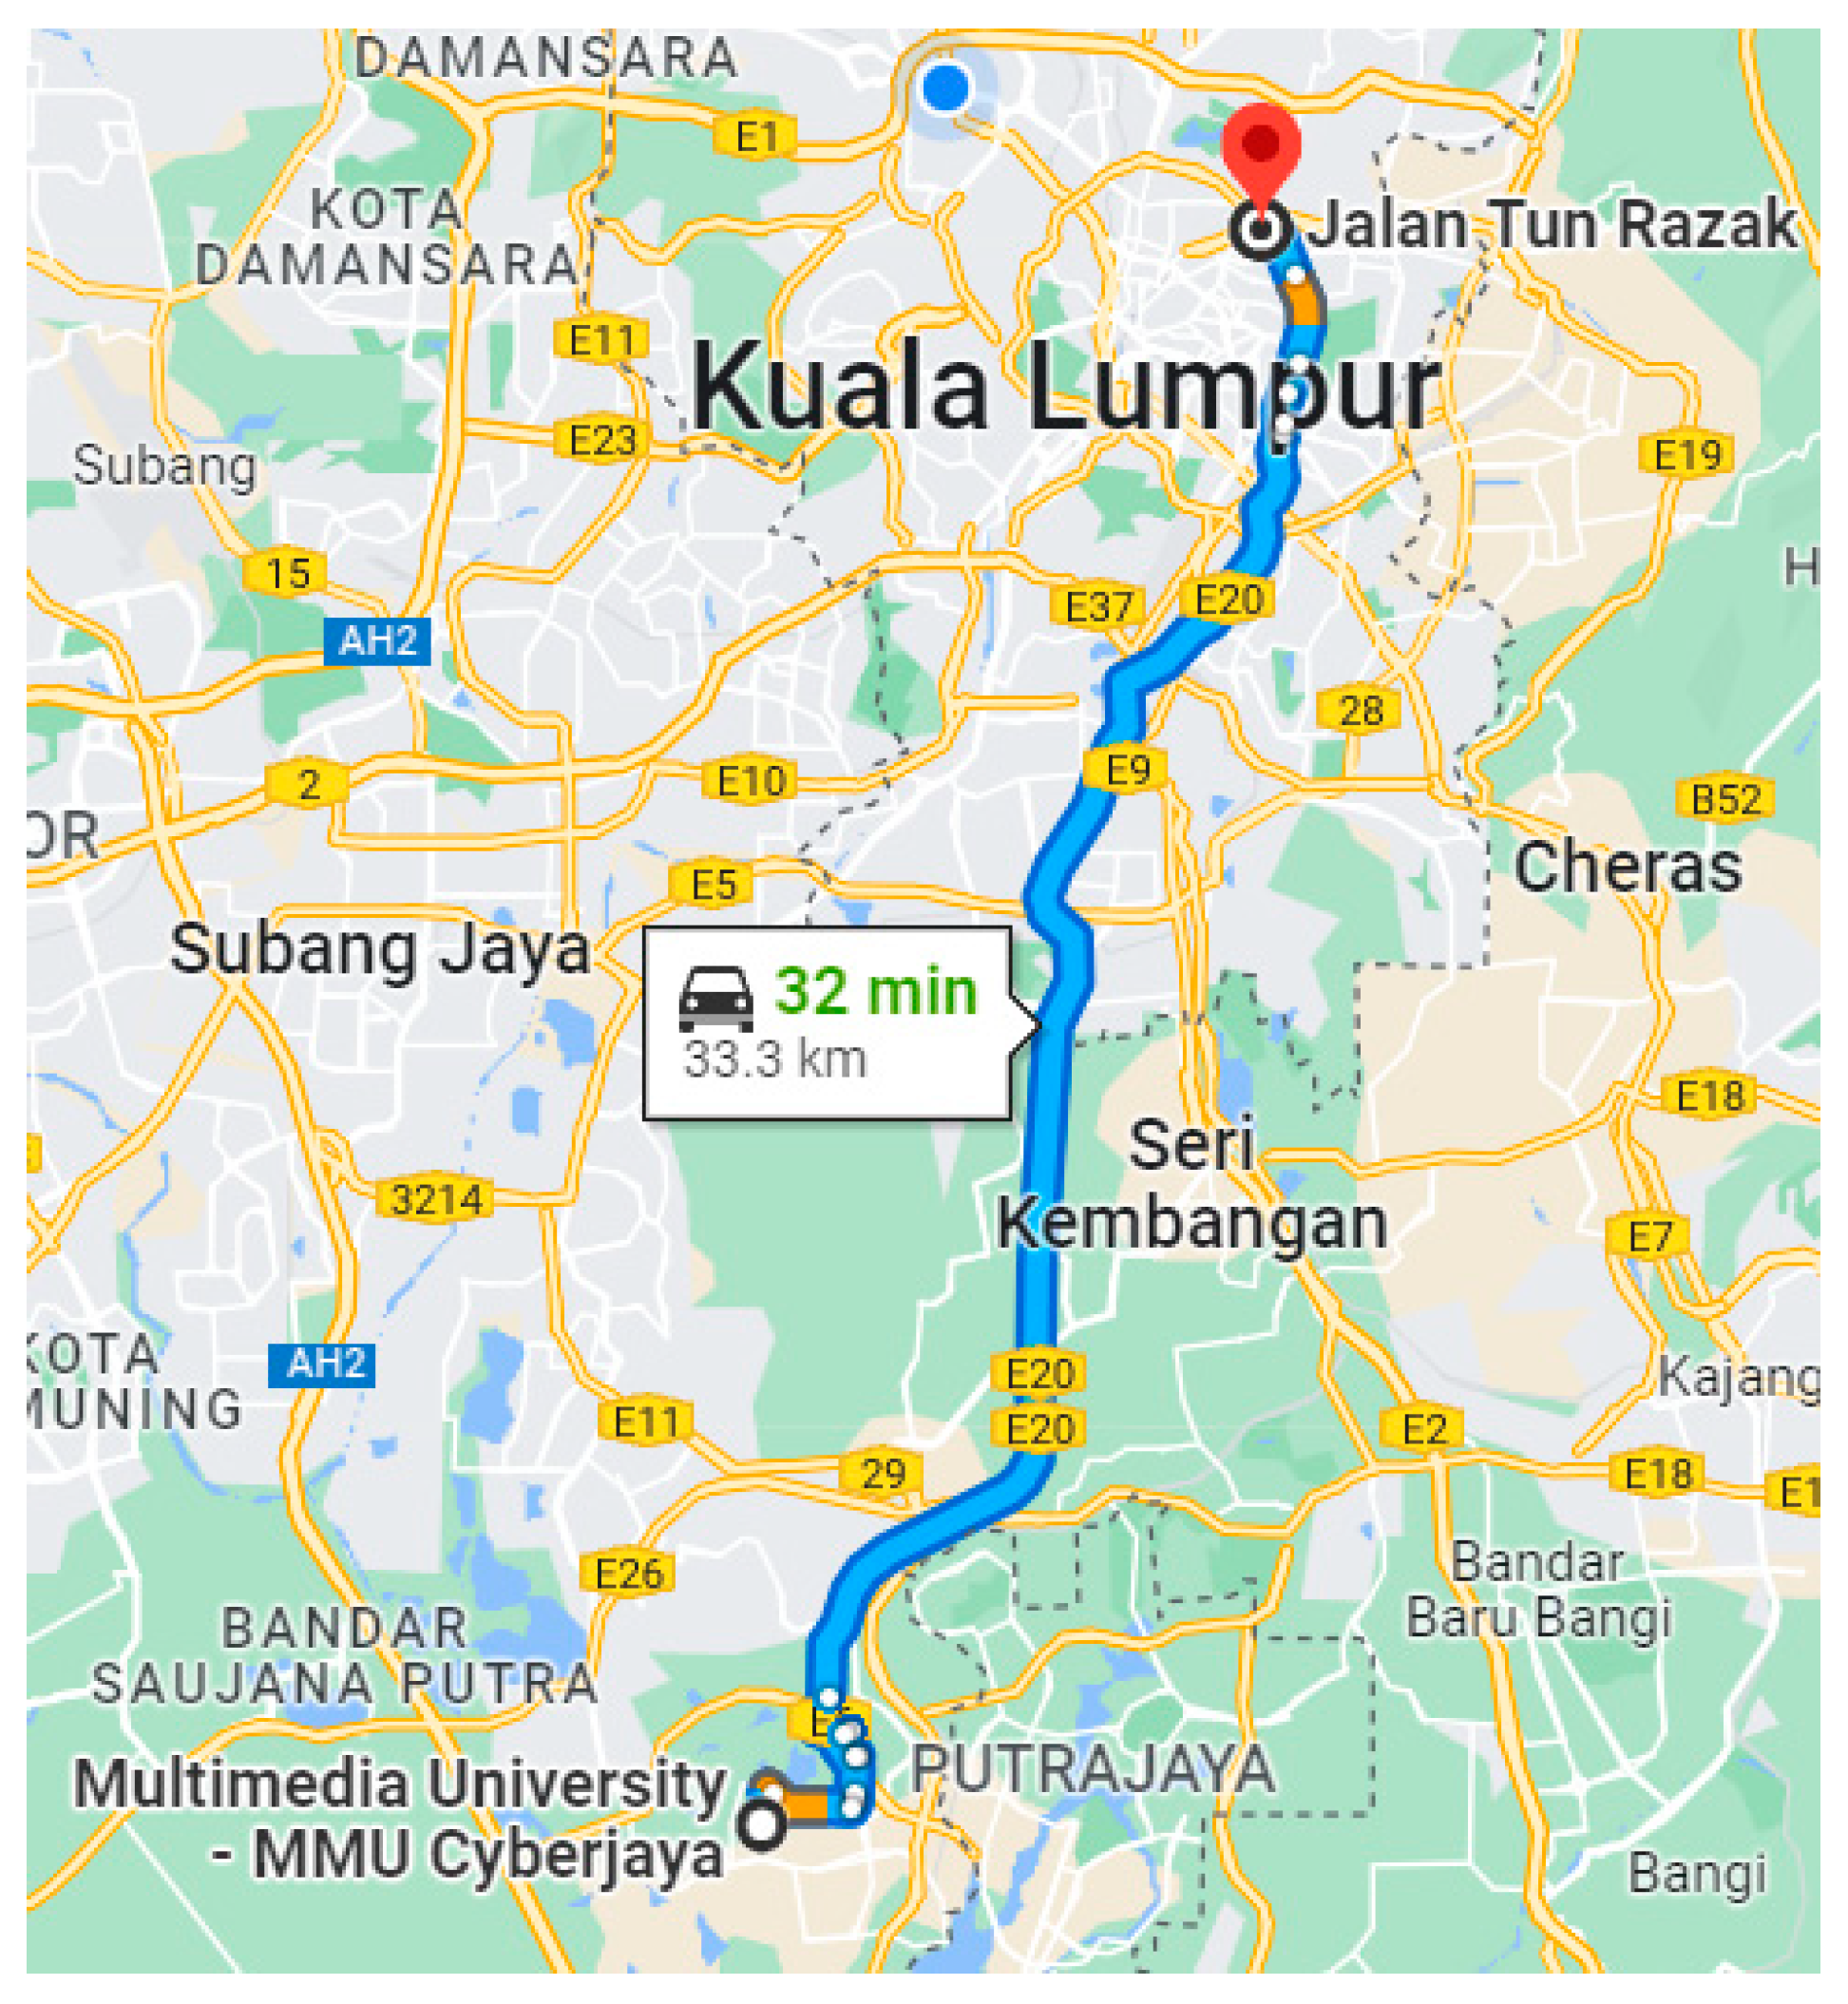
The second route (Scenario 2, Figure 2) was from Jalan Tun Razak, Kuala Lumpur, to Multimedia University (MMU), Cyberjaya, via Maju Expressway. The main intention for this scenario was to see the impact of taking short-distance highway routes on vehicle users. The distance from the origin to the destination was approximately 34 km. This route had no traffic lights and a speed limit of 90 km/h. This route was the fastest and shortest route from the city center to Putrajaya, Cyberjaya, and also Kuala Lumpur International Airport.
The toll price from the origin to the destination was USD 1.22. This included the price for the Salak Selatan Toll and Putrajaya Utama Toll.

2.1.3. Scenario 3: Long-Distance Urban Route

The third route (Scenario 3, Figure 3) was from Mutiara Damansara, Petaling Jaya, to UM Power Energy Dedicated Advanced Centre (UMPEDAC). The main intention for this scenario was to examine the impact of taking urban long-distance routes with variable traffic conditions on vehicle users. The distance from the origin to the destination was approximately 14 km. This route has regular road altitudes, four traffic lights, and a speed limit of 60–90 km/h.

2.1.4. Scenario 4: Short-Distance Urban Route

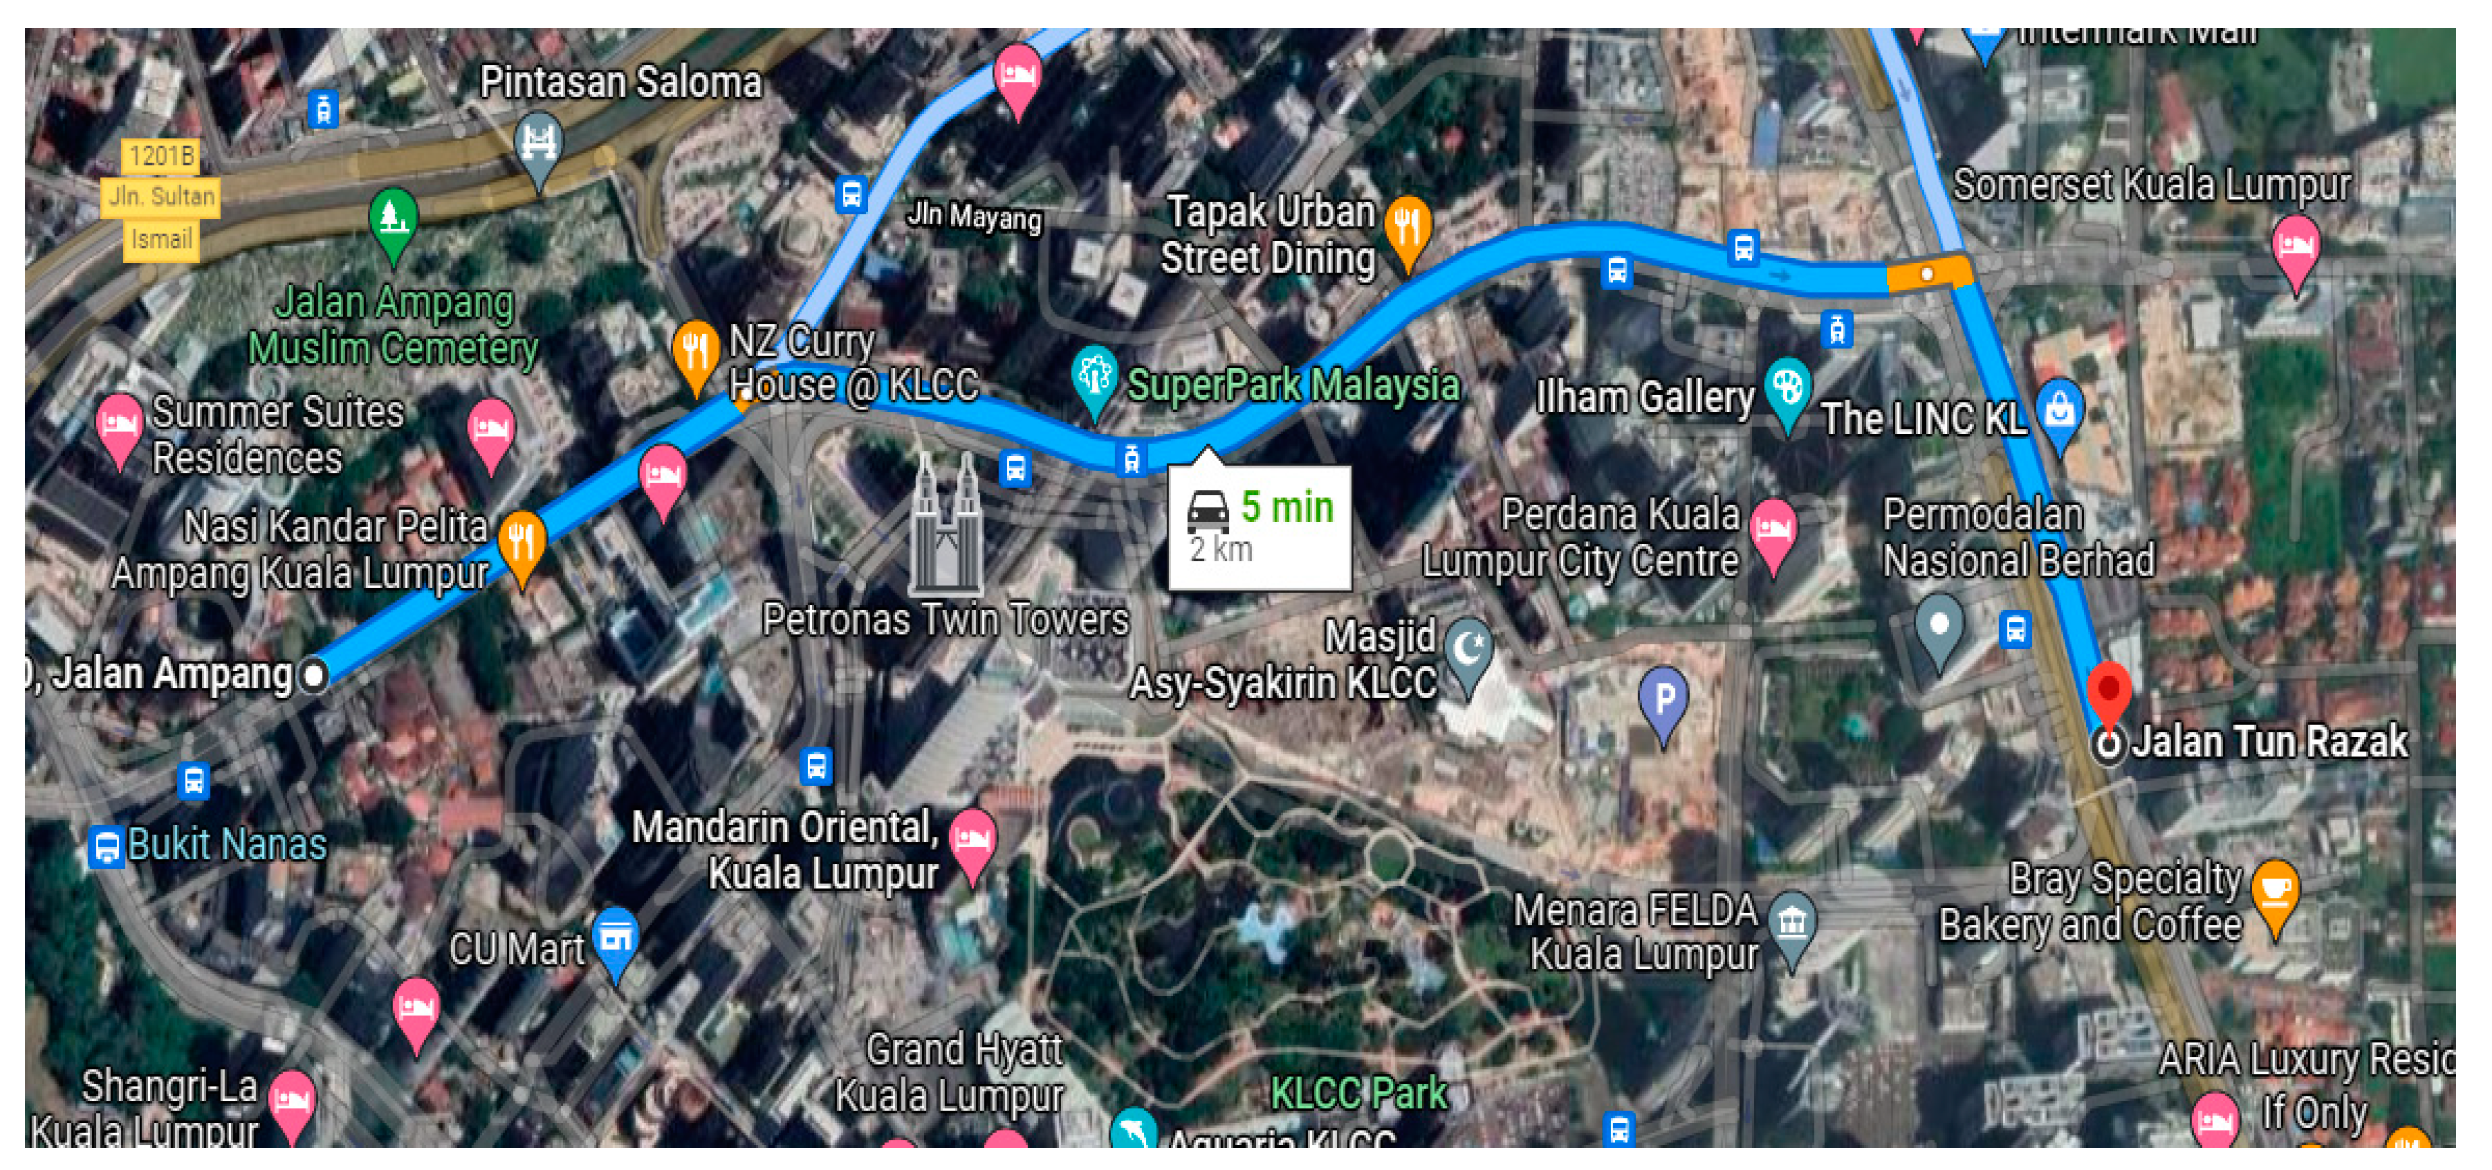
The fourth route (Scenario 4, Figure 4) was from Jalan Ampang to Jalan Tun Razak. The main intention for this scenario was to examine the impact of traffic lights and road congestion on vehicle users. The distance from the origin to the destination was approximately 2 km. This route had regular road altitudes, two traffic lights, and a speed limit of 60 km/h. This route was typically congested during peak hours, weekends, and on public holidays as it was located near tourist spots, shopping malls, and hotels, including the Kuala Lumpur Twin Towers.

2.1.5. Scenario 5: Long-Distance Suburban Route

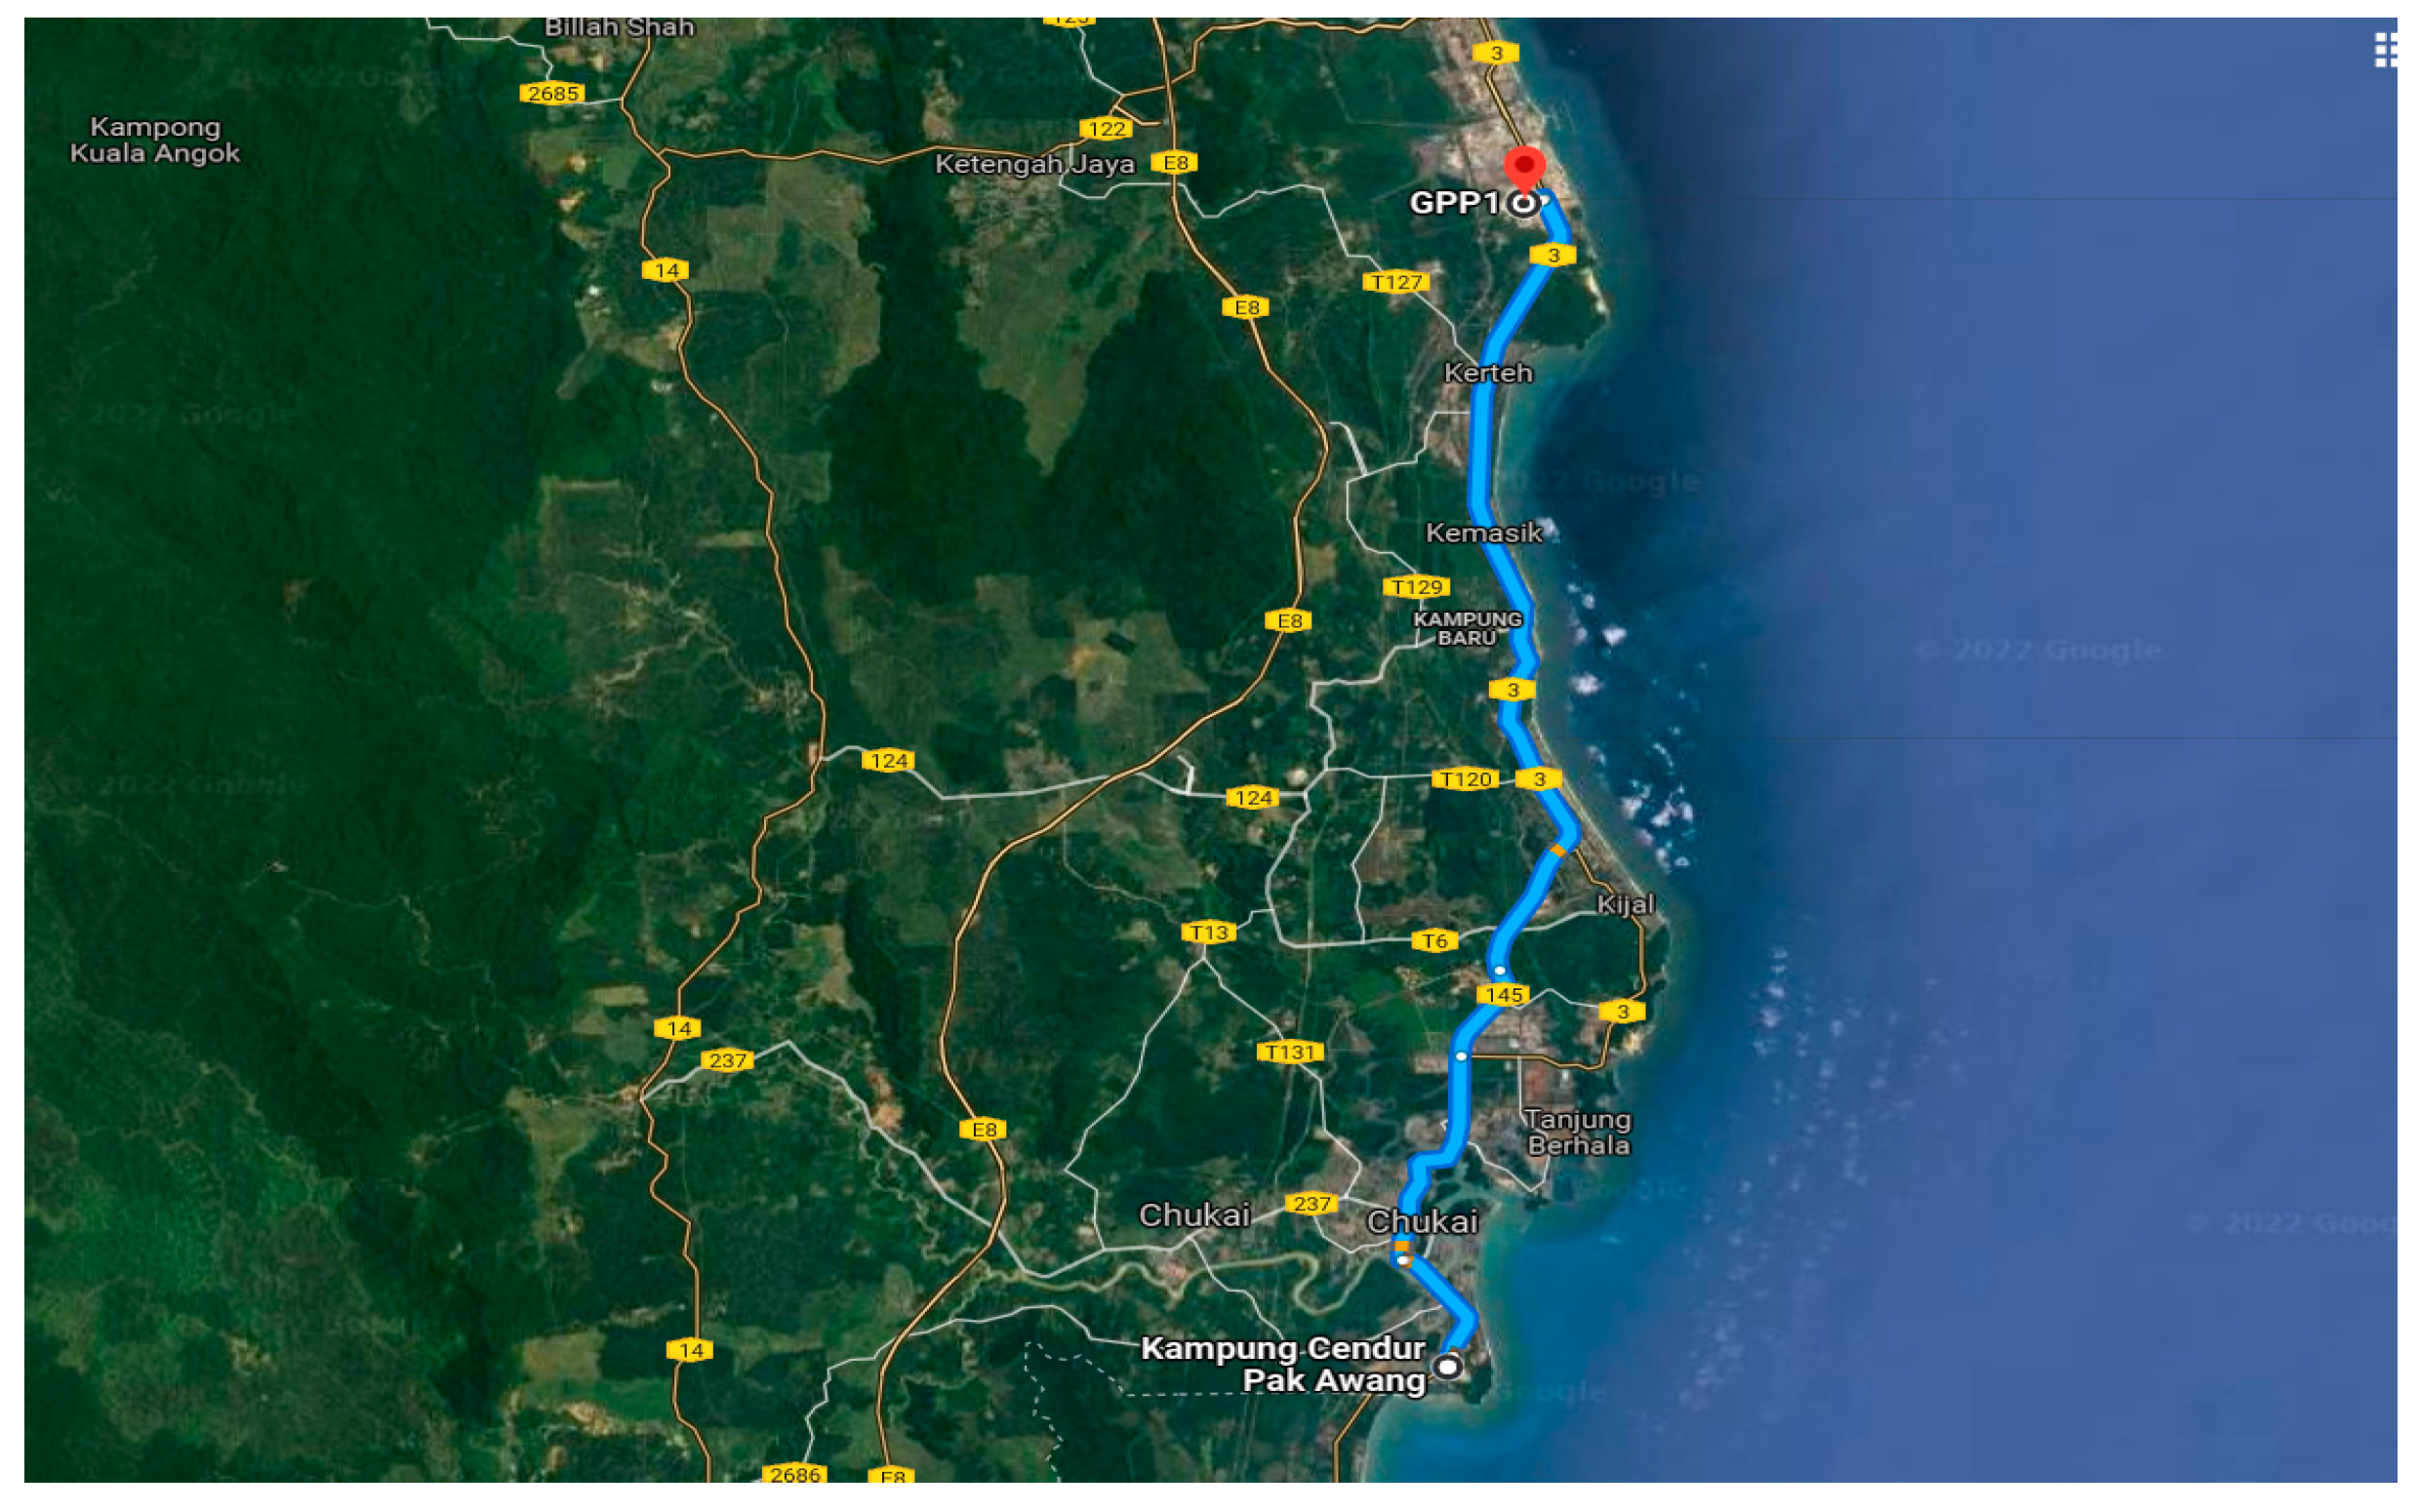
The fifth route (Scenario 5, Figure 5) was from Kampung Chendur, Kemaman, to Petronas Gas Berhad, Kerteh. The main intention for this scenario was to examine the impact of traffic lights on vehicle users. The distance from the origin to the destination was approximately 50 km. This route had regular altitudes, two traffic lights, and a speed limit of 90 km/h. This route could be congested during peak hours due to the route leading to a well-known Malaysian petroleum company and the close proximity of Chukai, the main town of Kemaman, and factories, hypermarkets, and schools. This road is one of the busiest roads based on the report by the Ministry of Transport [37] in Terengganu.

2.1.6. Scenario 6: Short-Distance Suburban Route

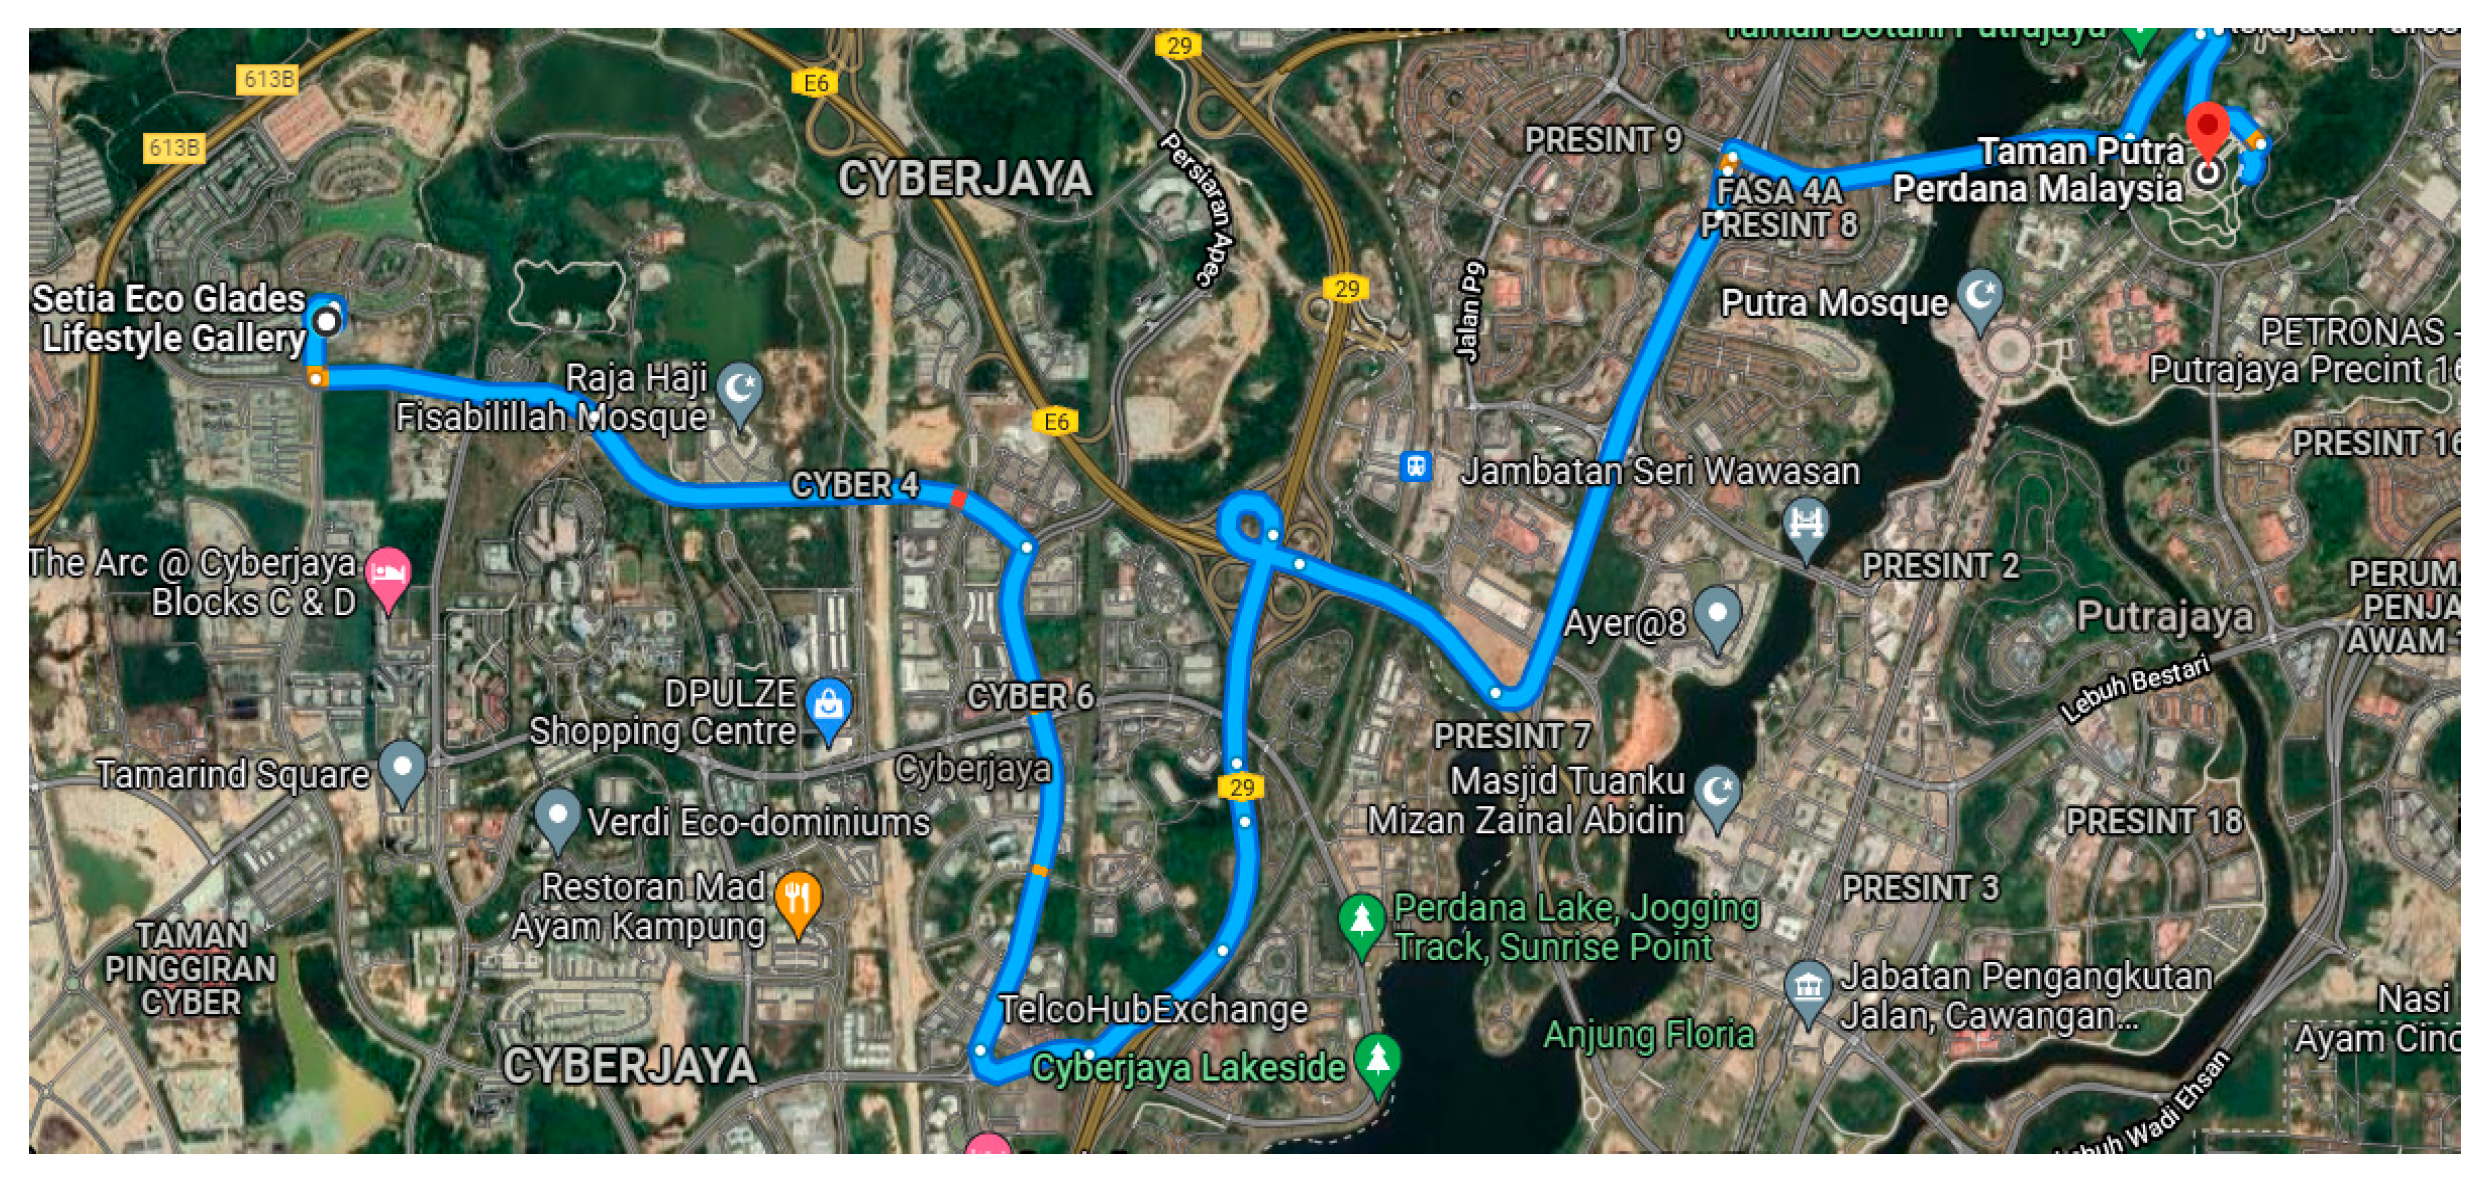
The sixth route (Scenario 6, Figure 6) was from Setia Eco Glades, Sepang, to Taman Putra Perdana, Putrajaya. The main intention for this scenario was to examine the impact of traffic lights and roundabouts on vehicle users. The distance from the origin to the destination was approximately 14 km. This route had regular road altitudes, two traffic lights, a speed limit of 90 km/h, and a few roundabouts. This route could be congested due to the destination being a popular park. Based on the list above, the road type varies depending on the scenario. For instance, in Scenarios 1 and 2, the road type is a mixture of highway and primary road, while the remaining scenarios consist of a primary road. The road type might affect the speed of the vehicle simulated. There was a specific reason for the route chosen for this study; however, these routes were the usual routes to work, school, university, park, and home.

2.2. Speed

The modeling followed the speed limit set by the government. For the expressway, the maximum speed was set at 110 km/h, and the minimum speed limit was 60 km/h. The speed is reduced to 80 or 90 km/h at dangerous mountain stretches, crosswind areas, and urban areas with high traffic capacity. For federal and state roads, the speed limit is 90 km/h by default and 60 km/h in the town area.

2.3. Time and Weather

Malaysia has a tropical climate with a mean annual temperature is 24.5 °C, and most days of the year are sunny. This experiment was set to be conducted on a sunny day to mimic the Malaysian weather. Apart from that, this simulation was conducted at 8:00 a.m., since the traffic around the city center, urban area, and suburban area was heavy during this time due to the rush hour to get to the office, university, and school. The simulation time varied depending on the traveled distance from origin to destination.

2.4. Cost

Cost is one of the crucial decision-making factors when making a long-term commitment, such as the purchase of a vehicle. Thus, in this study, the cost of energy consumption and petrol consumption was calculated. Thus, savings in energy and petrol costs were the added value to the purchasing process. The current study focused on the operational cost, which was the petrol and energy costs of ICEVs and EVs.
For the purpose of calculating the fuel consumption of ICEVs, the price of RON 95 was used as the base cost because it was cheaper than RON 97 and was widely utilized in Malaysia. The price of RON 95 in November 2022 was USD 0.46 per L, based on the exchange rate of USD 1 to MYR 4.43. To calculate the cost of fuel for ICEVs, Equation (1) was employed.
FC = FC I C E ×   PC  
where FC was petrol cost, FCICE was petrol consumption by ICE, and PC was the petrol price per liter.
As for the cost of energy consumption of EVs, Tenaga Nasional Berhad (TNB), electricity tariff for residential as per Table 1 was used. It was assumed that the household electricity usage had exceeded 900 kWh per month. Thus, the cost of energy for the battery charging of EVs started at MYR 0.571 or USD 0.13, as shown in the table below.
The energy cost for EVs was calculated using Equation (2):
EC = EC E V ×   ER
where EC was the energy cost (USD), ECEV (kWh) was the energy consumption by EVs, and ER was the electricity rate.

2.5. Carbon Dioxide Emission

The GHG emissions of ICEVs during manufacturing are approximately 6.5 t CO2, as stated by Hawkins, Singh [38]. Fuel emissions are proportional to the rate of fuel consumption. To calculate the GHG emissions of the petrol car during the usage stage, Equation (3) was employed.
GHG E = FC   × E F
where FC was the petrol consumption and EF was the emission factor.
The number of carbon dioxide emitted into the air from the car based on the United States Environment Protection Agency (EPA) was used. EPA 2018 stated that the amount of carbon dioxide produced by road transportation was 2.37 kg/CO2 per liter of petrol [39].
During the usage stage, the GHG emissions produced by EVs depend on the electricity consumption rate and the power grid characteristic. Based on Matthew Brander, Aman Sood [40], the GHG emissions from grid-provided electricity are estimated to be 0.744 kgCO2/kWh. Thus, the Equation (4) was employed to calculate the emission of GHG for an electric car is:
GHG E V = EC   ×   EF G R I D
The AIMSUN software considered electric vehicles to have zero emissions. Since all electric vehicles in Malaysia are imported from other countries, the manufacturing emission of an electric vehicle will not be discussed in this paper. However, there are arguments on the carbon dioxide emission associated with electricity generation. Thus, based on the Sustainability Report 2021 by Tenaga Nasional Berhad (TNB), the emission factor for Peninsular Malaysia was 0.55 kgCO2/kWh.

2.6. Internal Combustion Engine Vehicle Petrol Consumption Model

The simulation of the current study was based on a 100% petrol engine type. The study focused only on petrol engine type due to the high number of petrol cars in Malaysia compared to diesel vehicles, as diesel is often used by larger vehicles such as trucks. Although there are no latest data available on the diesel engine vehicles statistics available, based on Fazil, Fawzi [41], there are only 21,597 new diesel vehicles registered in 2015 compared to the 666,677 total registered in the same year, which accumulated to only 3.2%. Thus, this study only focuses on petrol cars.
Each vehicle was assumed to be capable of cruising, accelerating, decelerating, and idling. The fuel consumption model parameter listed in Table 2 was only applied to ICEVs. The following are the parameters for the input based on [42] and shown in Table 2:
F1:
The petrol consumption rate, in liters per 100 km, for vehicles traveling at a constant speed of 90 km/h
F2:
The fuel consumption rate, in liters per 100 km, for vehicles traveling at a constant speed of 120 km/h
Fi:
The petrol consumption rate for idling vehicles in m/s
Fd:
The petrol consumption rate for decelerating vehicles in mL/s
C1 and C2:
The two constants in the equation for the fuel-consumption rate for accelerating vehicles, in mL/s and in ml s2/m2
Vm:
The speed at which the fuel-consumption rate, in mL/s, is at a minimum for a vehicle cruising at a constant speed

2.7. Electric Vehicle Energy Consumption Model

Electric vehicles are highly dependent on travel distance and battery capacity. In the simulation of the current study, a 40 kWh battery capacity is chosen for all scenarios. The 40 kWh battery replicated the 39.2 kWh battery capacity of the Hyundai Kona Electric, and the minimum battery capacity for usage was set at 10%. The Hyundai Kona Electric was chosen as there is a limited number of EVs that are available for rent in Kuala Lumpur at the moment conducting the experiment. Currently, EVs that are available for rent are the Nissan Leaf by GoCar, a car rental application, and the Hyundai Kona Electric by Hertz—at the time of the experiment, only Hyundai Kona Electric was available.
The initial state of charge (SOC) of EVs is set at 100 percent at the origin. The charging of EVs during the simulation. Haaren [43] stated that the factors that affect the driving range are the driving route, battery state of charge, battery age, and the ambient temperature, whereby low ambient temperature will reduce its full charge capacity.
The use of other electric accessories power is set to be a minimum of 0.18 kW and a maximum of 0.40 kW for the entire simulation.
AIMSUN used the backward-looking approach for battery consumption that was first proposed by [44,45] and later by [46]. In this approach, the power required at the wheels is determined by the velocity specified by the driving cycle as a product of resistance and inertia forces. During traction, the electrical energy was drawn from the battery and transformed into kinetic energy that was later transformed into electrical energy during braking through the wheel. This is called bidirectional power flow.

2.8. Pollutant Emission

AIMSUN evaluated the emission rates of each vehicle at every time step and in every vehicle state, including idling, accelerating, and decelerating. It also modeled the instantaneous pollution emissions caused by acceleration. It also considered different factor values depending on the vehicle type, petrol type, acceleration, and deceleration. Based on Int Panis, Broekx [47], the pollution emission factors for cars are shown in Table 3 as follows:

2.9. Vehicle Weight

The minimum weight of the vehicle used in this simulation was 800 kg, while the maximum was 2550 kg. The weight included a few car segments and shapes. The selected vehicles for the simulation were the common vehicles on Malaysian roads that could accommodate four passengers, namely a microcar, a city car, a family sedan, a compact SUV, and a sports car.

2.10. Simulation Results Validation

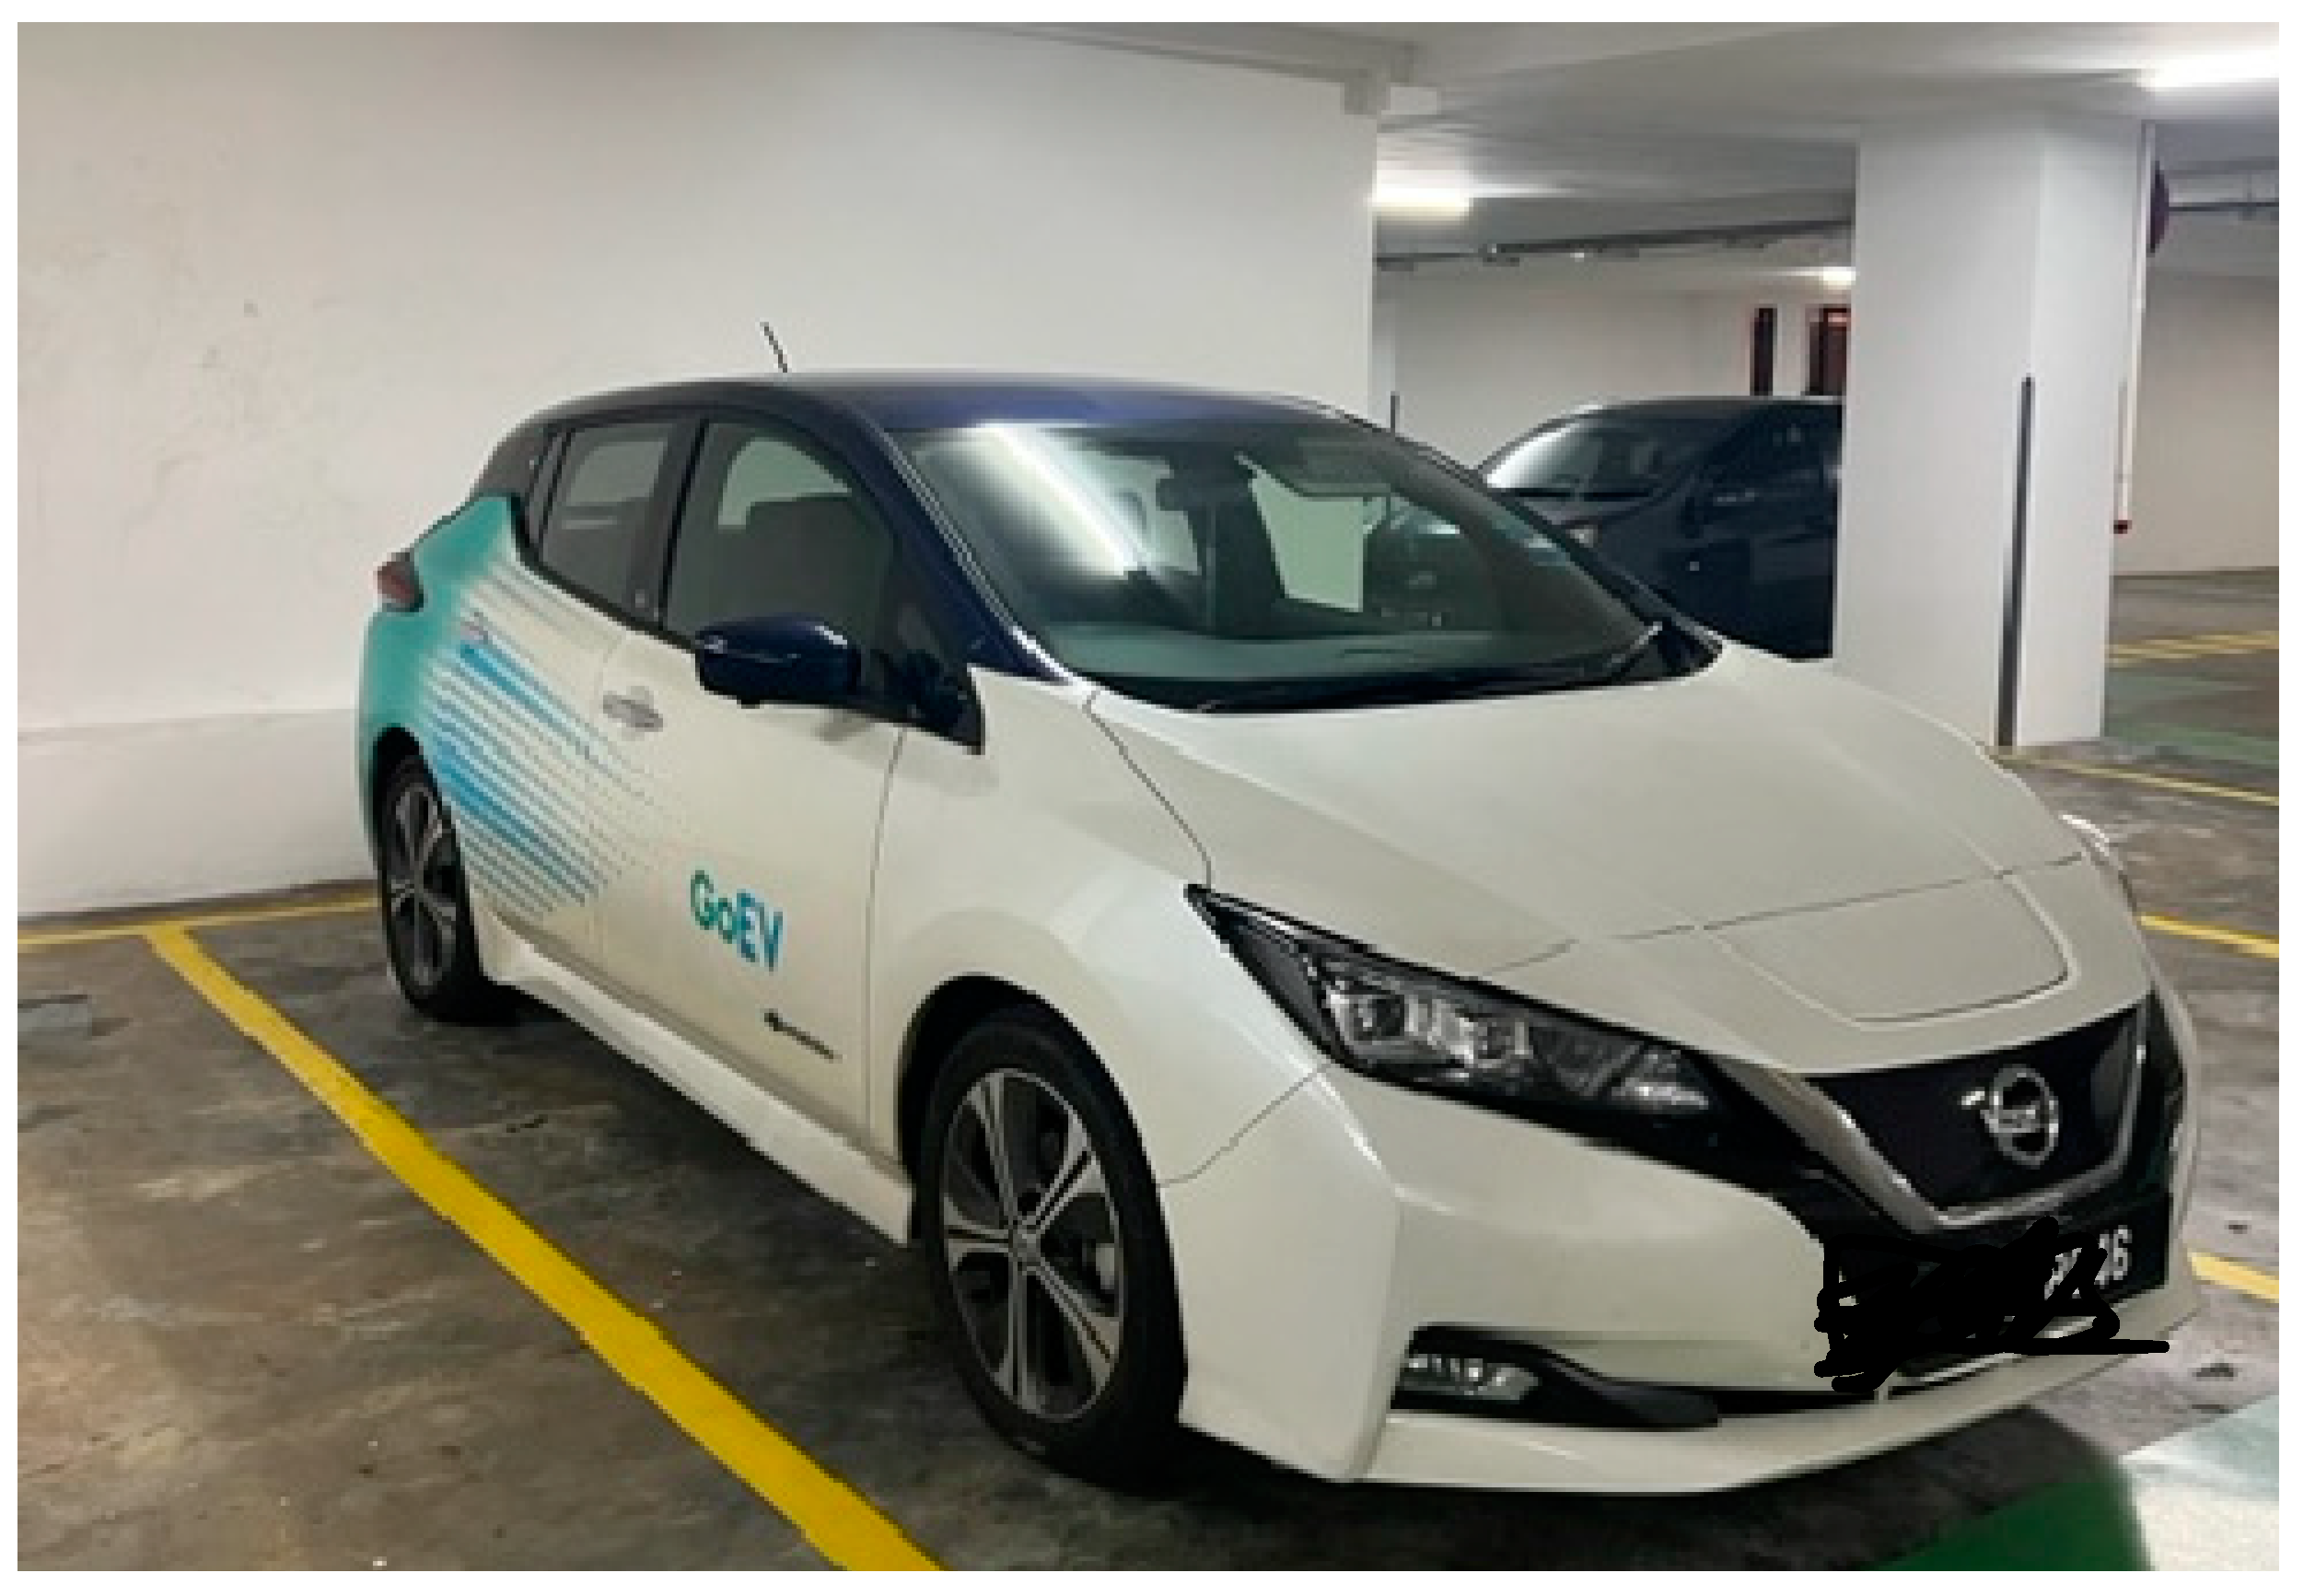
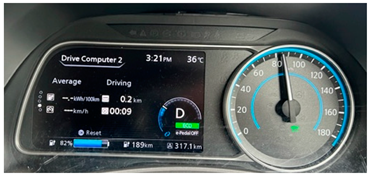
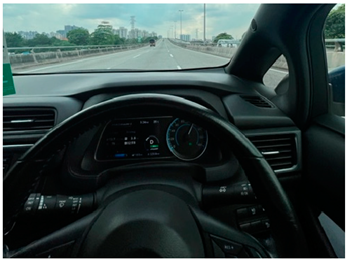
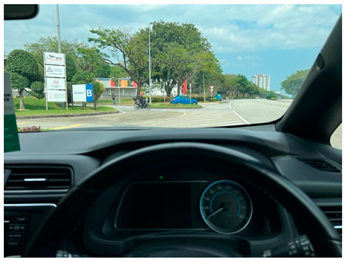
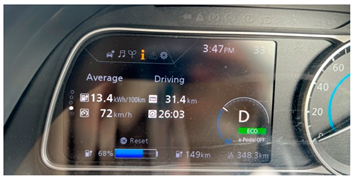
To validate the result of the AIMSUN simulation, a real-world experiment was conducted. The experiment is conducted by using an electric vehicle, Nissan Leaf, with a battery capacity of 40 kWh. This Nissan Leaf (Figure 7) is rented through a mobile application called Gocar. Nissan Leaf is used as AIMSUN uses the model as the base model for the simulation.
To validate the simulation results, three scenarios were selected: Scenario 2, Scenario 3, and Scenario 4. These three routes were selected due to their proximity to Kuala Lumpur, and the traffic management system has a greater impact on these routes. The readings for mileage, battery capacity, and battery consumption were reset for each scenario to provide an accurate result.
At the start and end of every experiment, the reading of the odometer was also reset to ensure the reading of the average energy consumption, speed, distance traveled, and time taken was correct and was not mixed with the previous experiment.
The methodology of this experiment which shown in Table 4 began with the resetting of the odometer, followed by driving from the origin to the destination based on the chosen route, arriving at the destination, collecting data, and then resetting the odometer for the next scenario.
The experiments were conducted with no repetition as other researchers, such as [36,48]. The average consumption of each trip was calculated as the final result.

3. Results and Discussion

This section explains and analyzes the results from the simulation and the real-world experiment conducted.

3.1. Energy Consumption Impact of Different Route Conditions

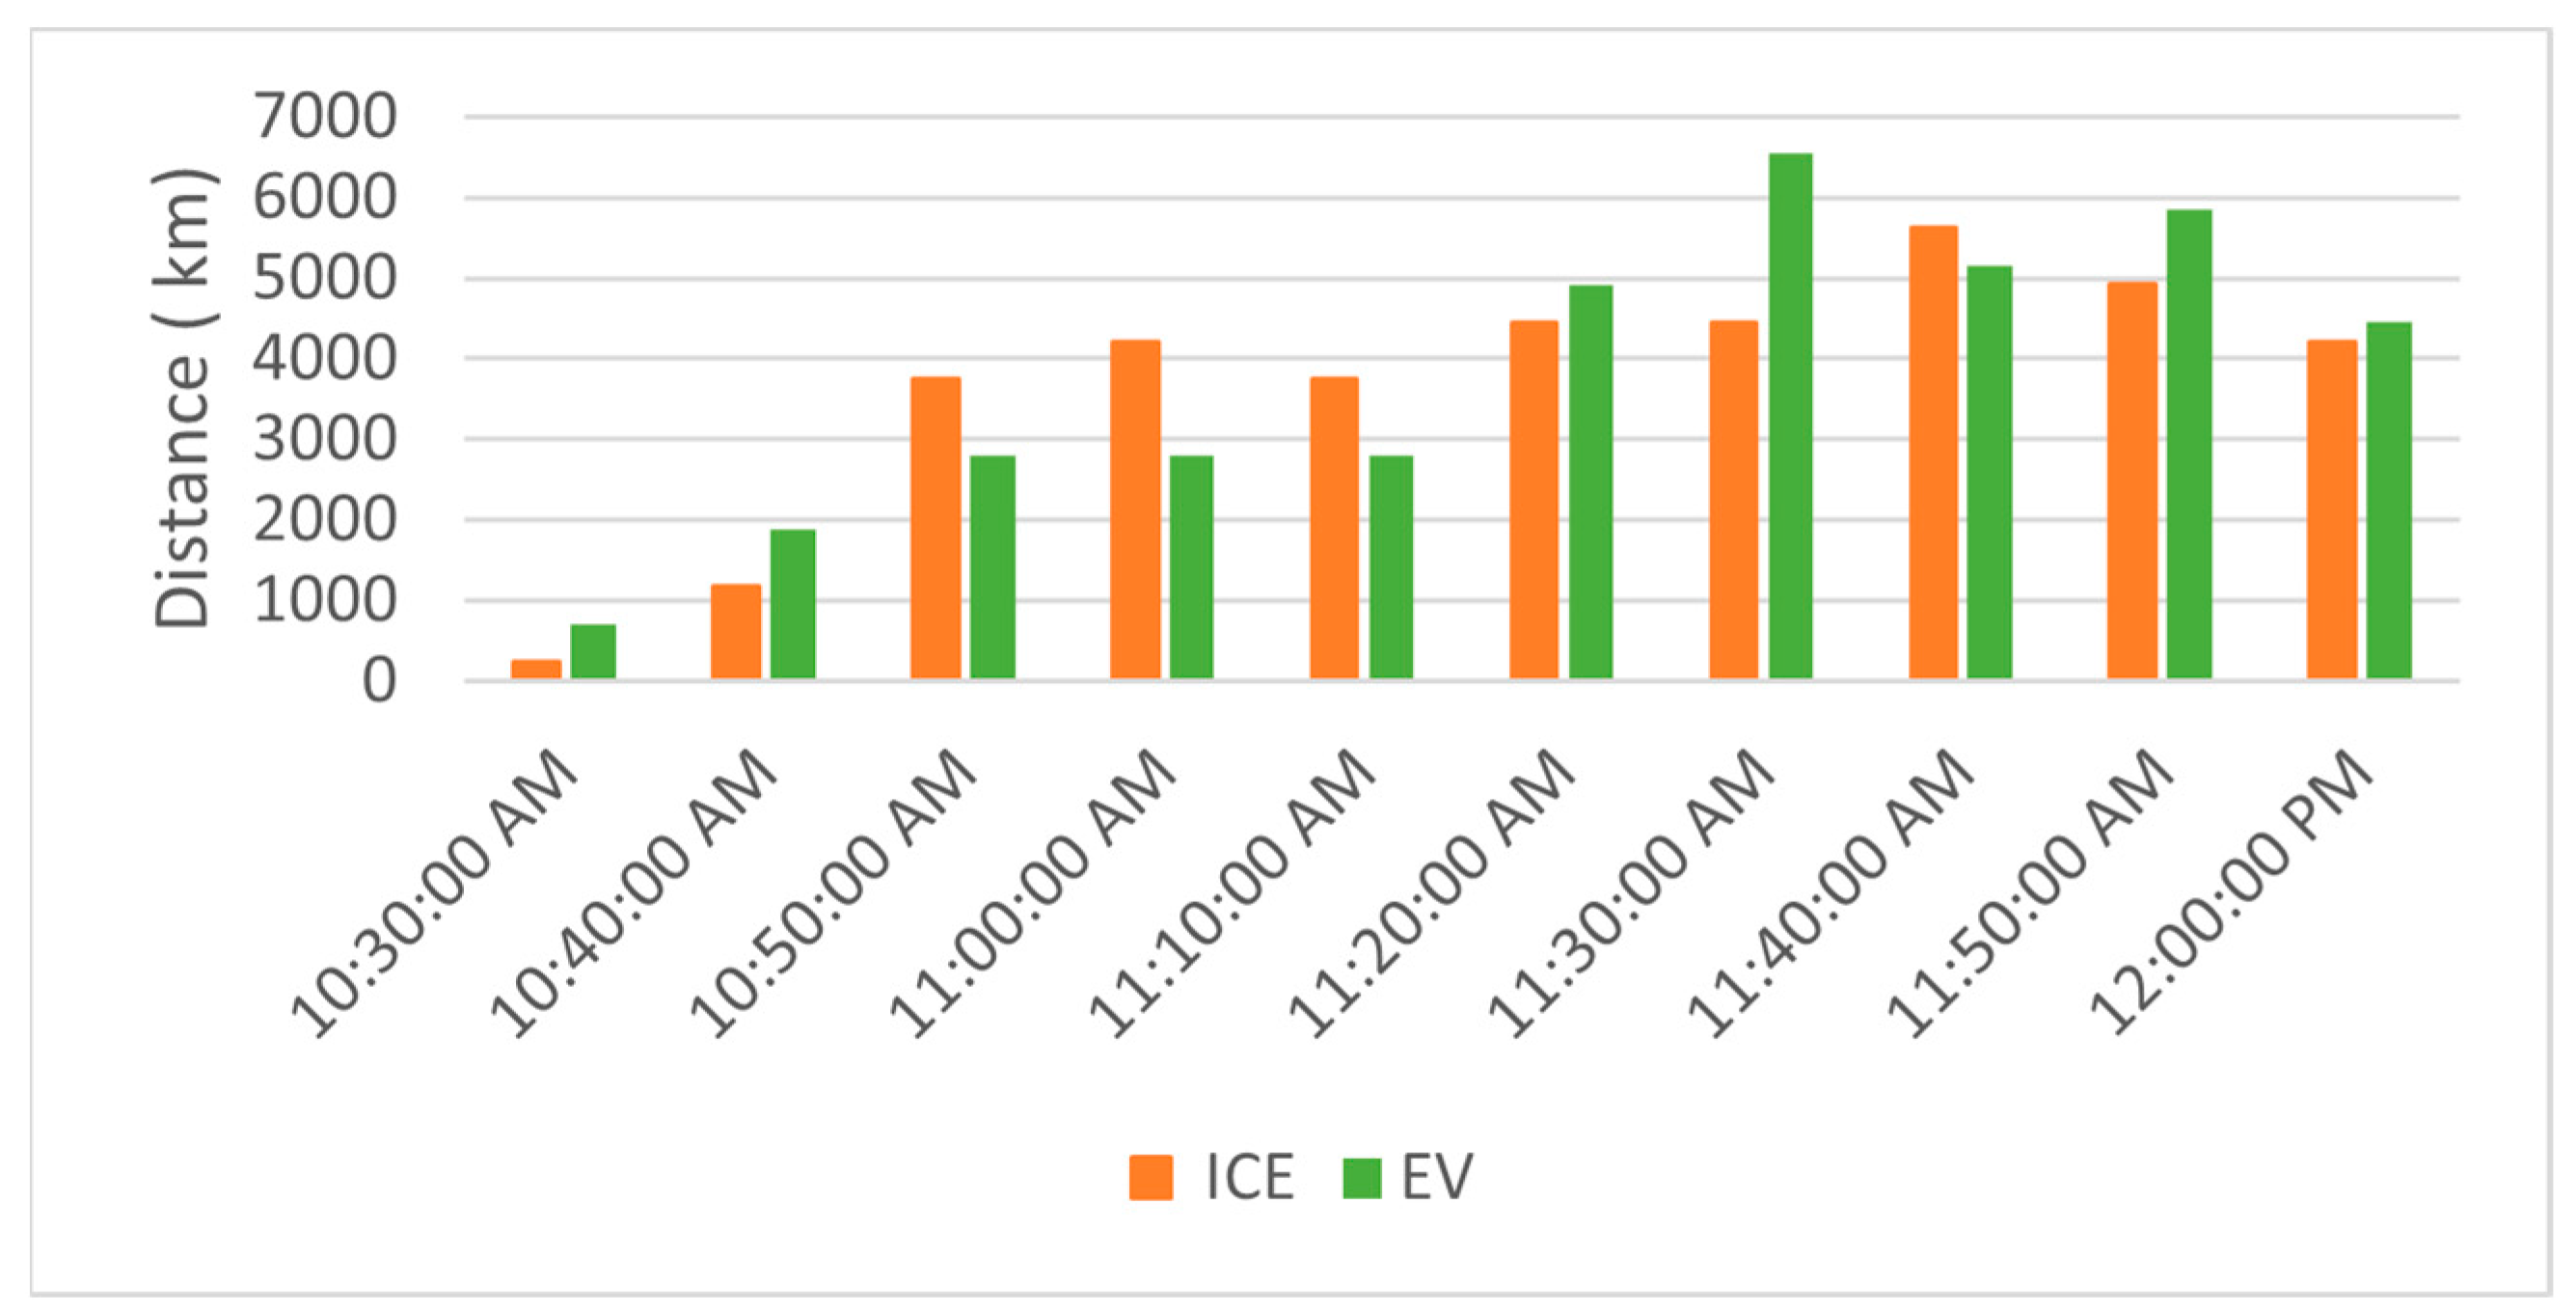
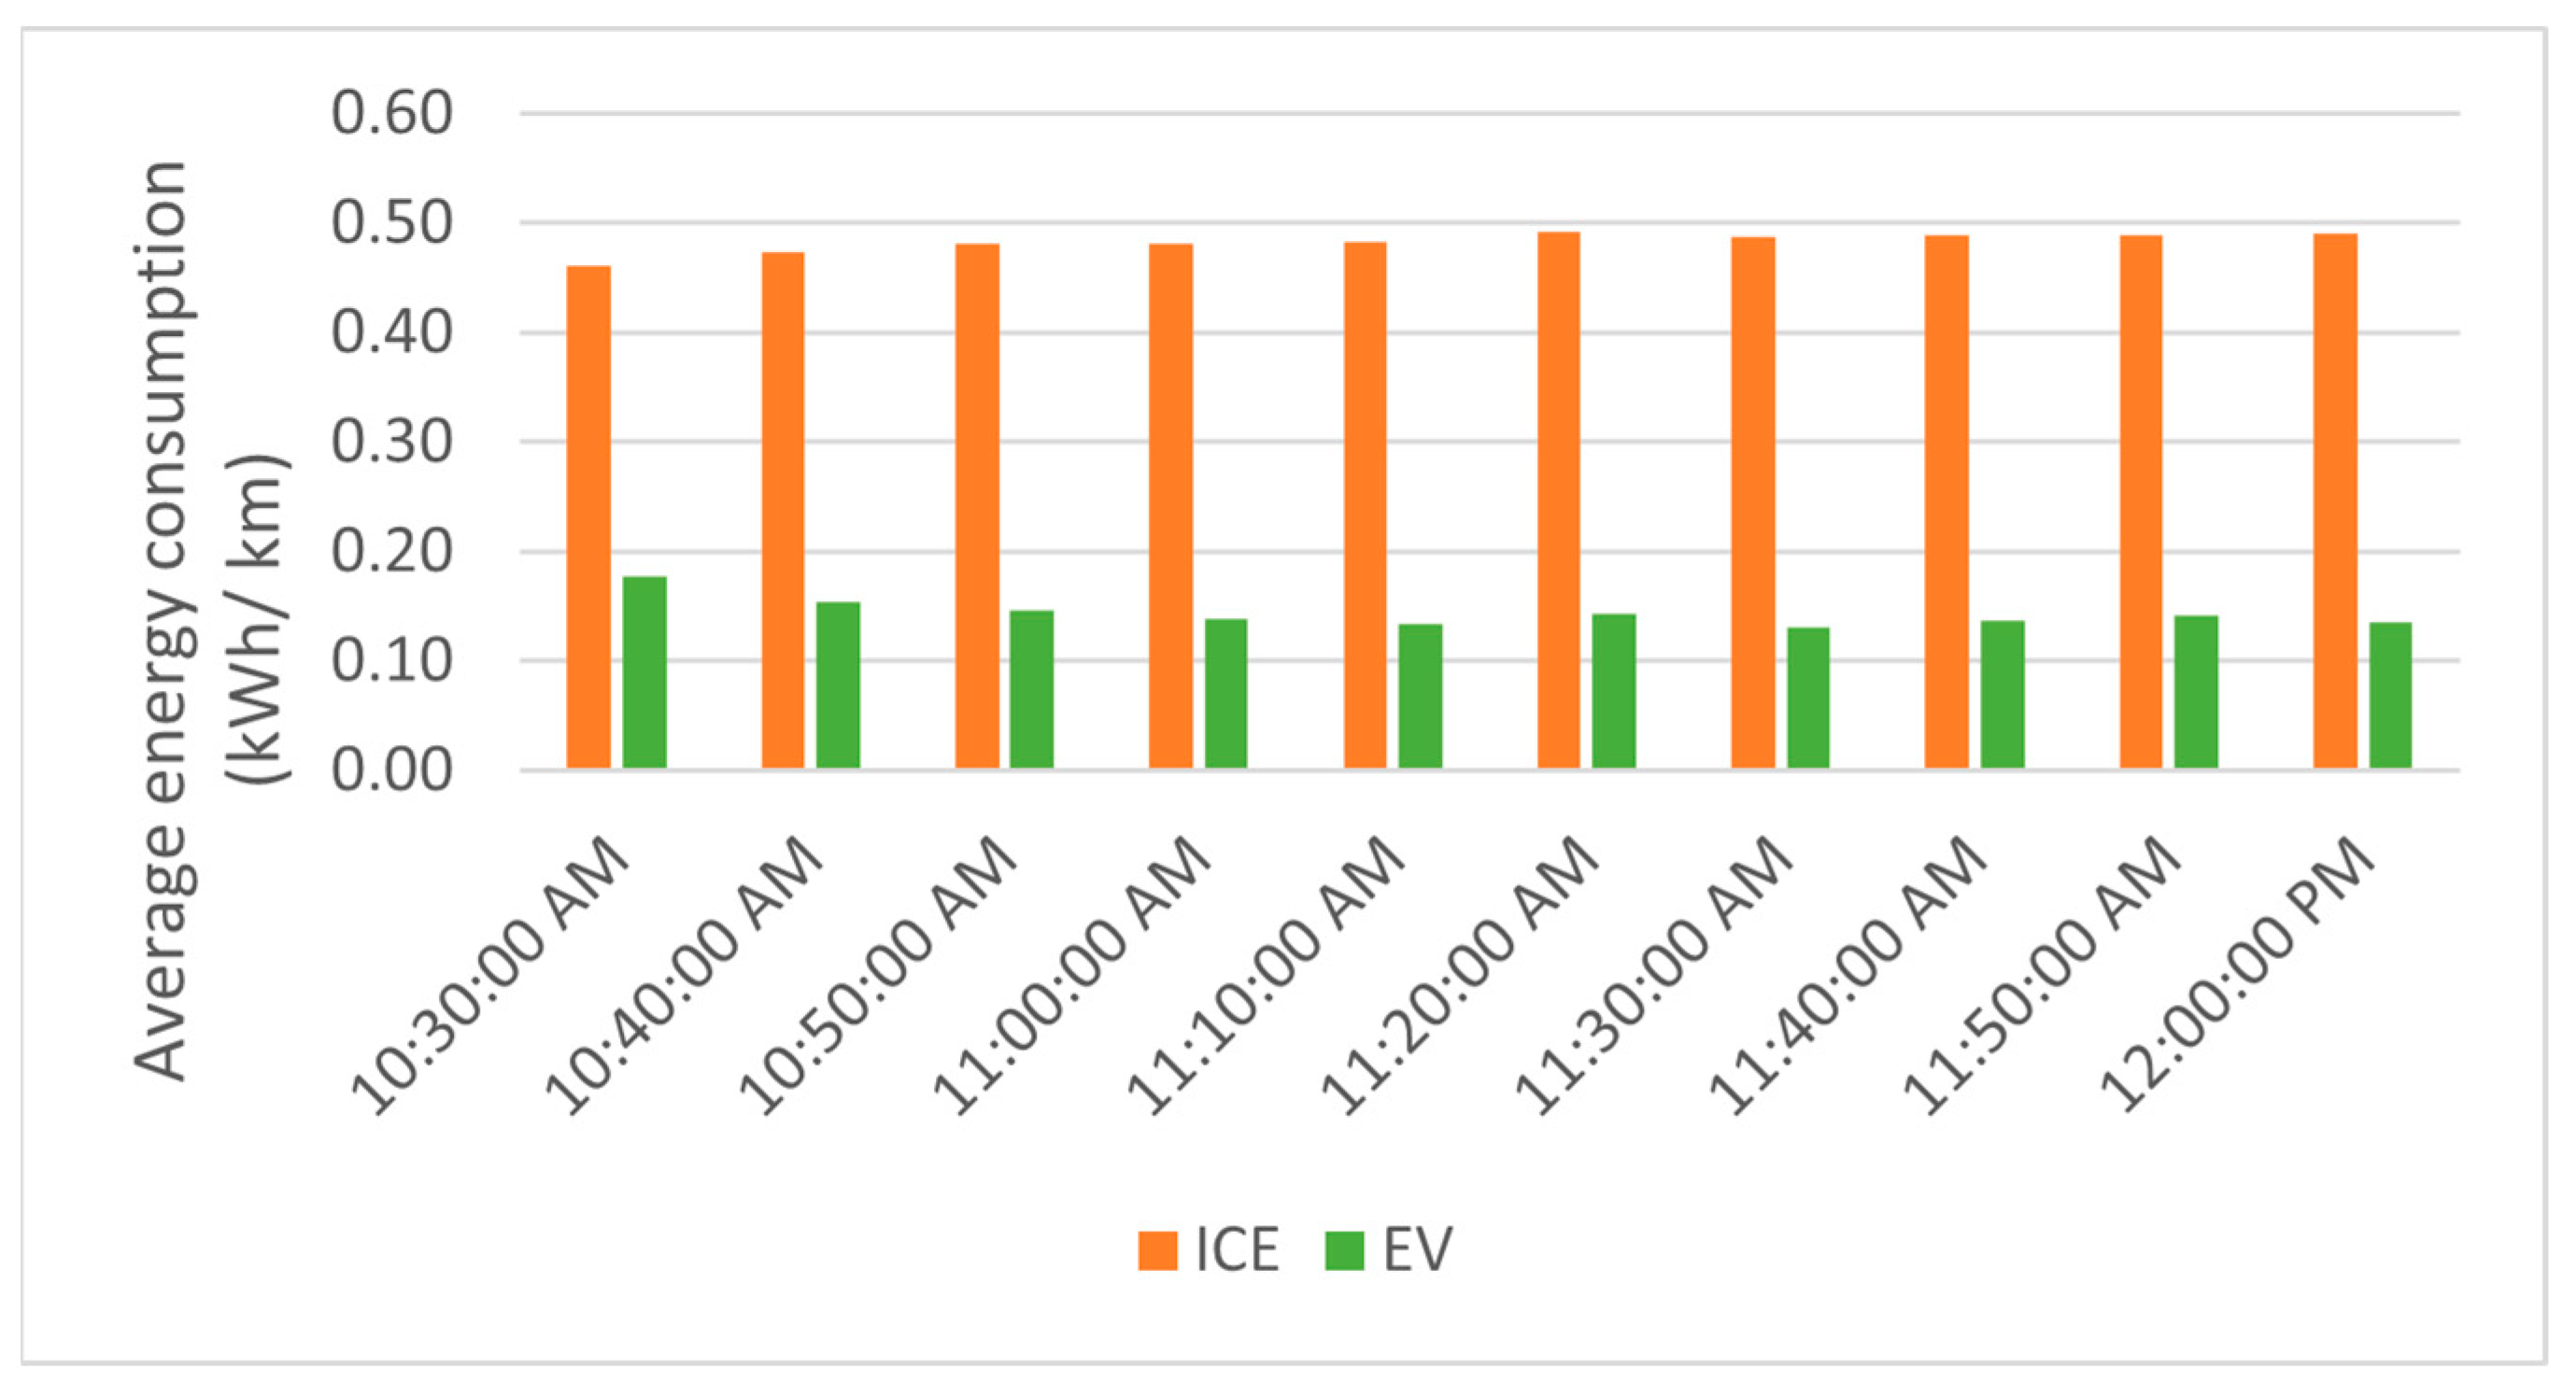
The distance traveled by EVs and ICEVs based on time intervals is shown in Figure 8. According to Figure 8, EVs traveled a total of 37,933.37 km, while ICEVs traveled 36,762.57 km. The total distance differed due to the number of vehicles that could complete the journey in the four hours simulation time and the number of vehicles that could complete the journey based on the car count determined by the software. For example, at 10:30 a.m., only one ICEV, compared to three EVs, completed the journey. Although the number of EVs that completed the journey was higher than ICEVs, and the total distance traveled differed by 1170.80 km, the average energy consumption for EVs was 70 percent lower than ICEVs (refer to Figure 9). The average energy consumption for EVs was 0.14 kWh/km, and ICEVs was 0.48 kWh/km. Thereby, the energy consumption of EVs was lower than ICEVs during the simulation modeling.
Scenario 1 route consisted of different road altitudes, which are flat roads, driving uphill and downhill. Figure 10 shows the average energy consumption based on three different road altitudes. On a flat road, in a normal road, EVs (0.19 kWh/km) consumed less energy than ICEVs (0.49 kWh/km). The amount of energy consumed increased when traveling uphill: EVs (0.32 kWh/km) and ICE (0.55 kWh/km). A study conducted by Boriboonsomsin and Barth [49] shows that an increase in road gradient will increase petrol consumption. The study also stated that going downhill consumed the lowest amount of energy, which is also shown in this modeling; whereby going downhill, the energy consumption is the lowest among the other two road gradients and conditions. These results can also be compared to a study conducted by the U.S. Department of Energy [50].
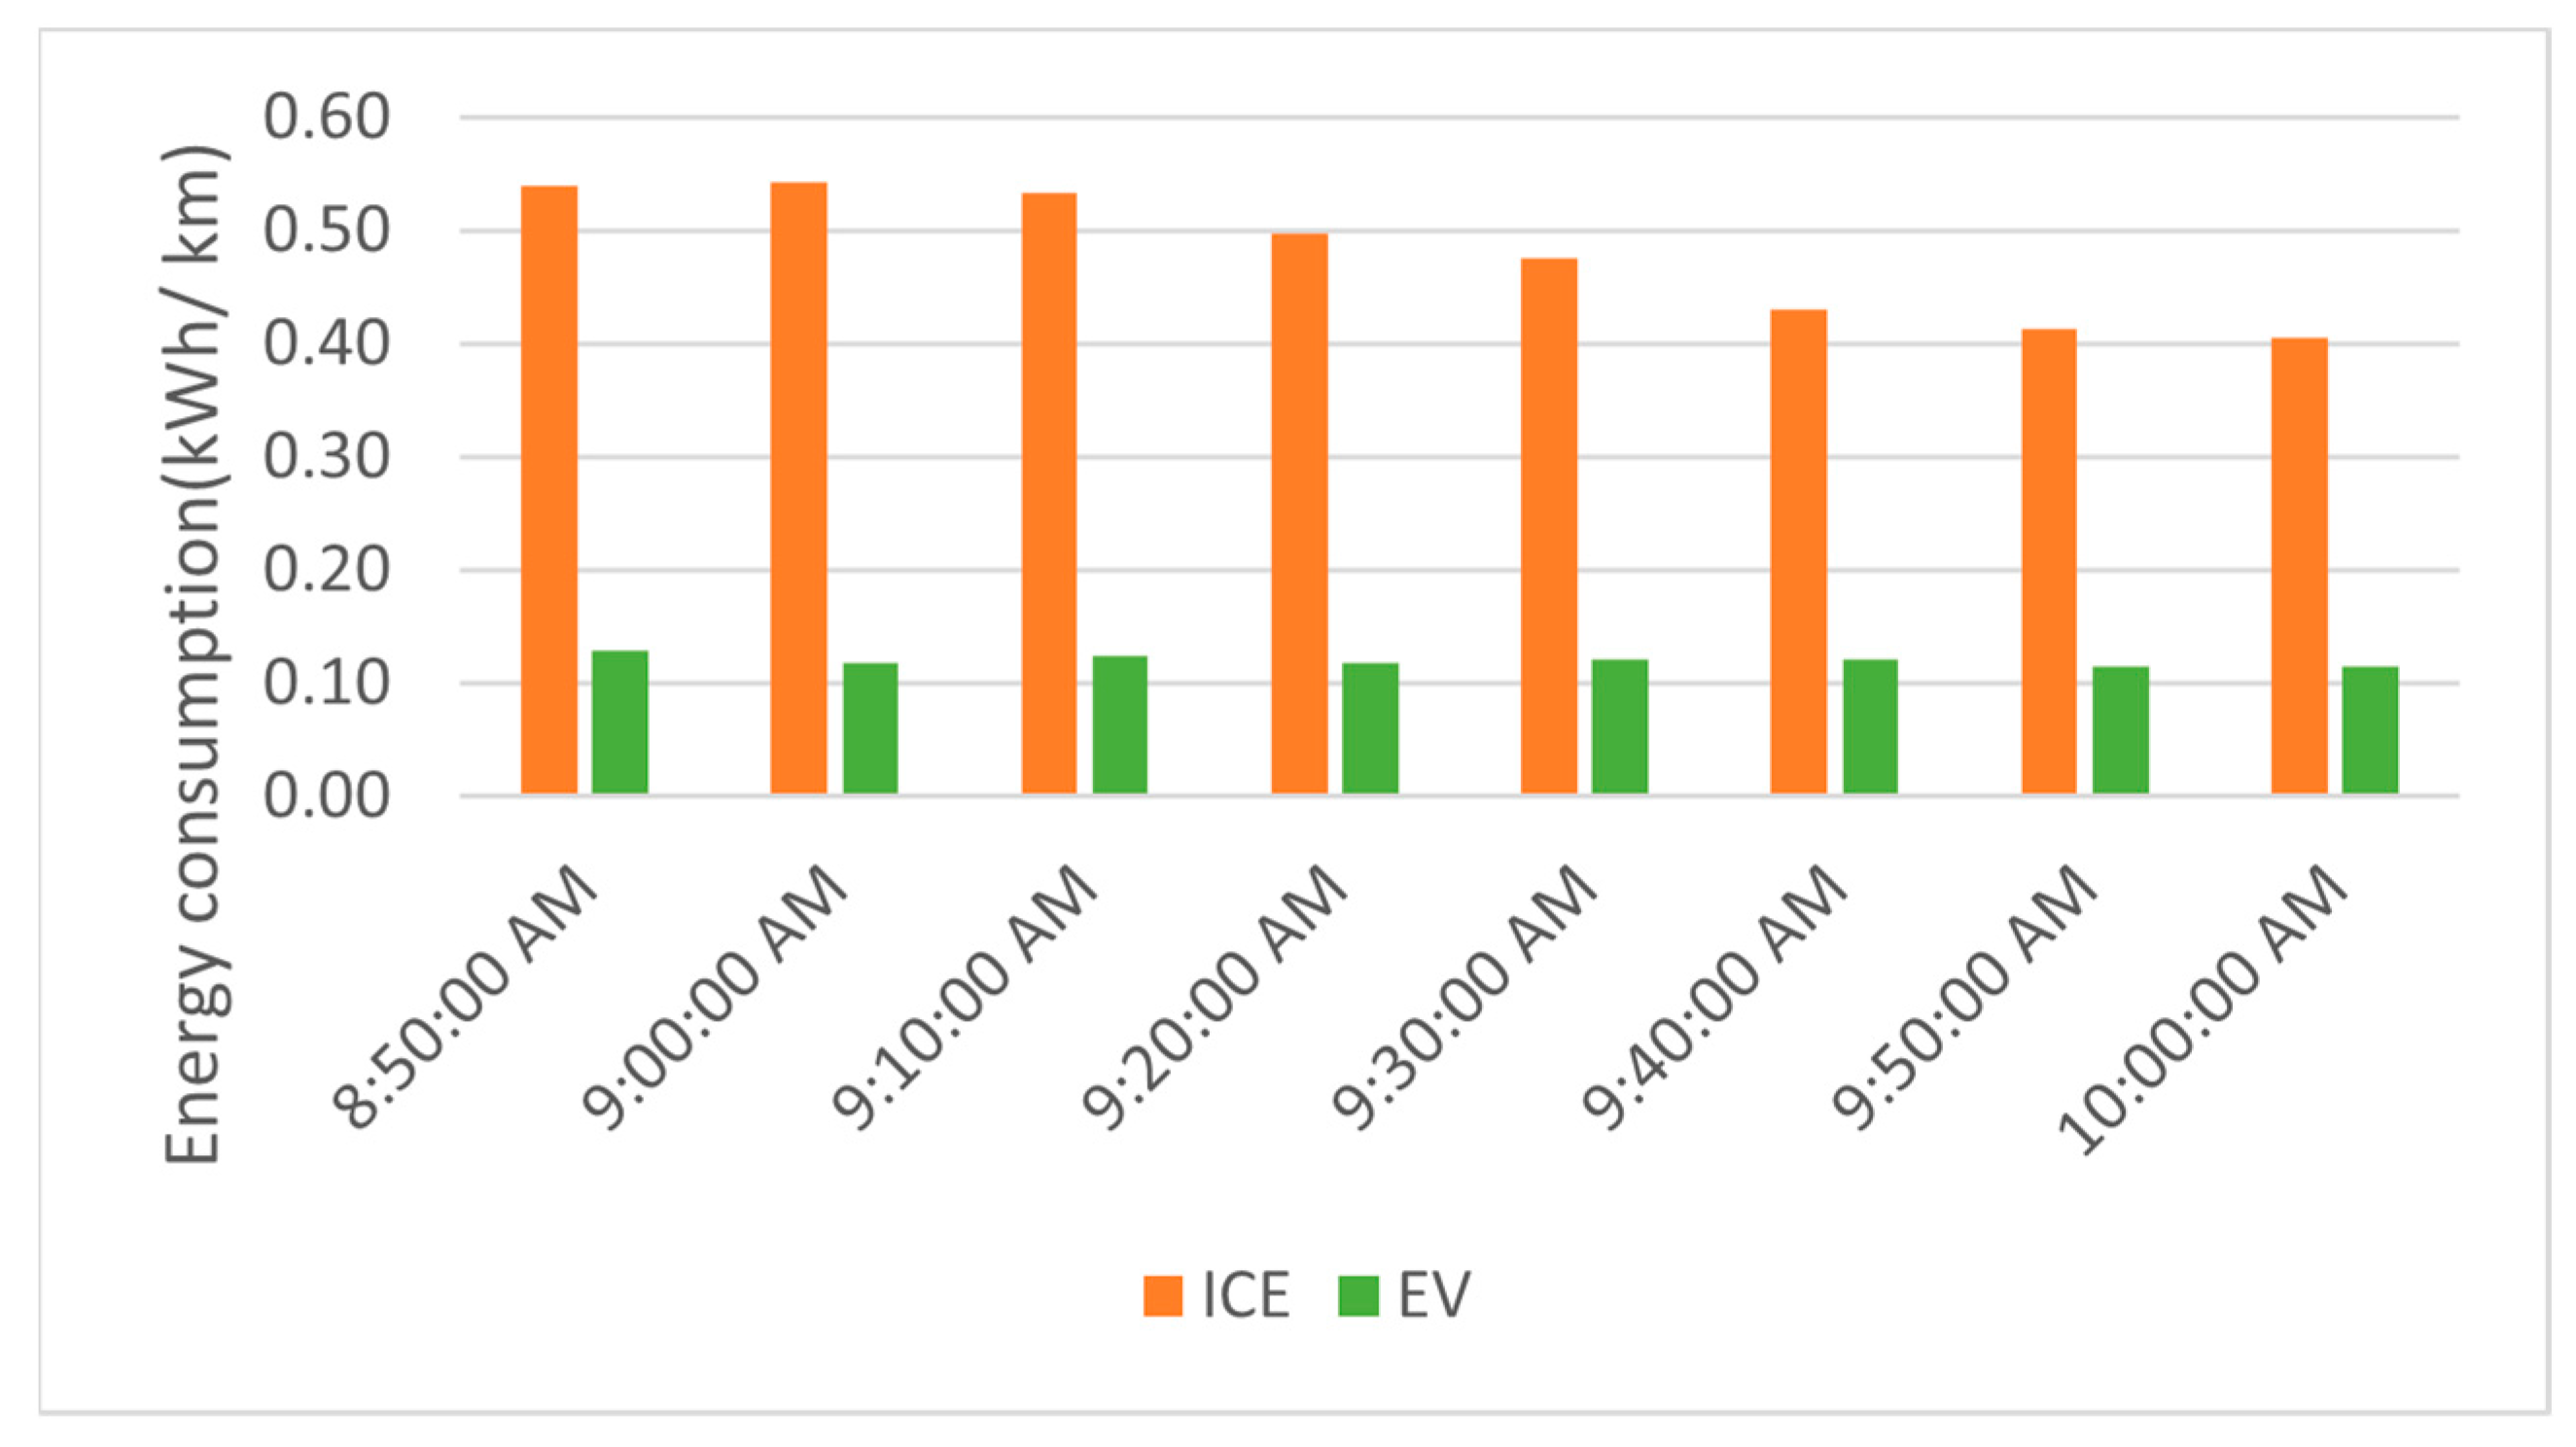
In Scenario 2, the total distance traveled by 307 EVs was 96,111.32 km, whereas the total distance traveled by 268 ICEVs was 8390.14 km (Figure 11). This is the total distance traveled from the origin to the destination by the number of vehicles that completed the journey based on the AIMSUN. The number of ICEVs and EVs that completed journeys varied depending on the speed and other factors. For example, the number of vehicles (220 vehicles) that completed four journeys at 8:25 a.m. was the lowest compared to other time intervals. At 9:00 a.m., there were 224 vehicles, with 34 completed journeys for EVs. Figure 12 shows the average energy consumption for EVs and ICEVs, which were 0.12 kWh/km and 0.61 kWh/km, respectively. Similar to Scenario 1, the average fuel consumption for ICEVs is higher than EVs despite the total distance traveled being much shorter. One of the reasons was due to the high efficiency of EVs (80%) compared to ICEVs.
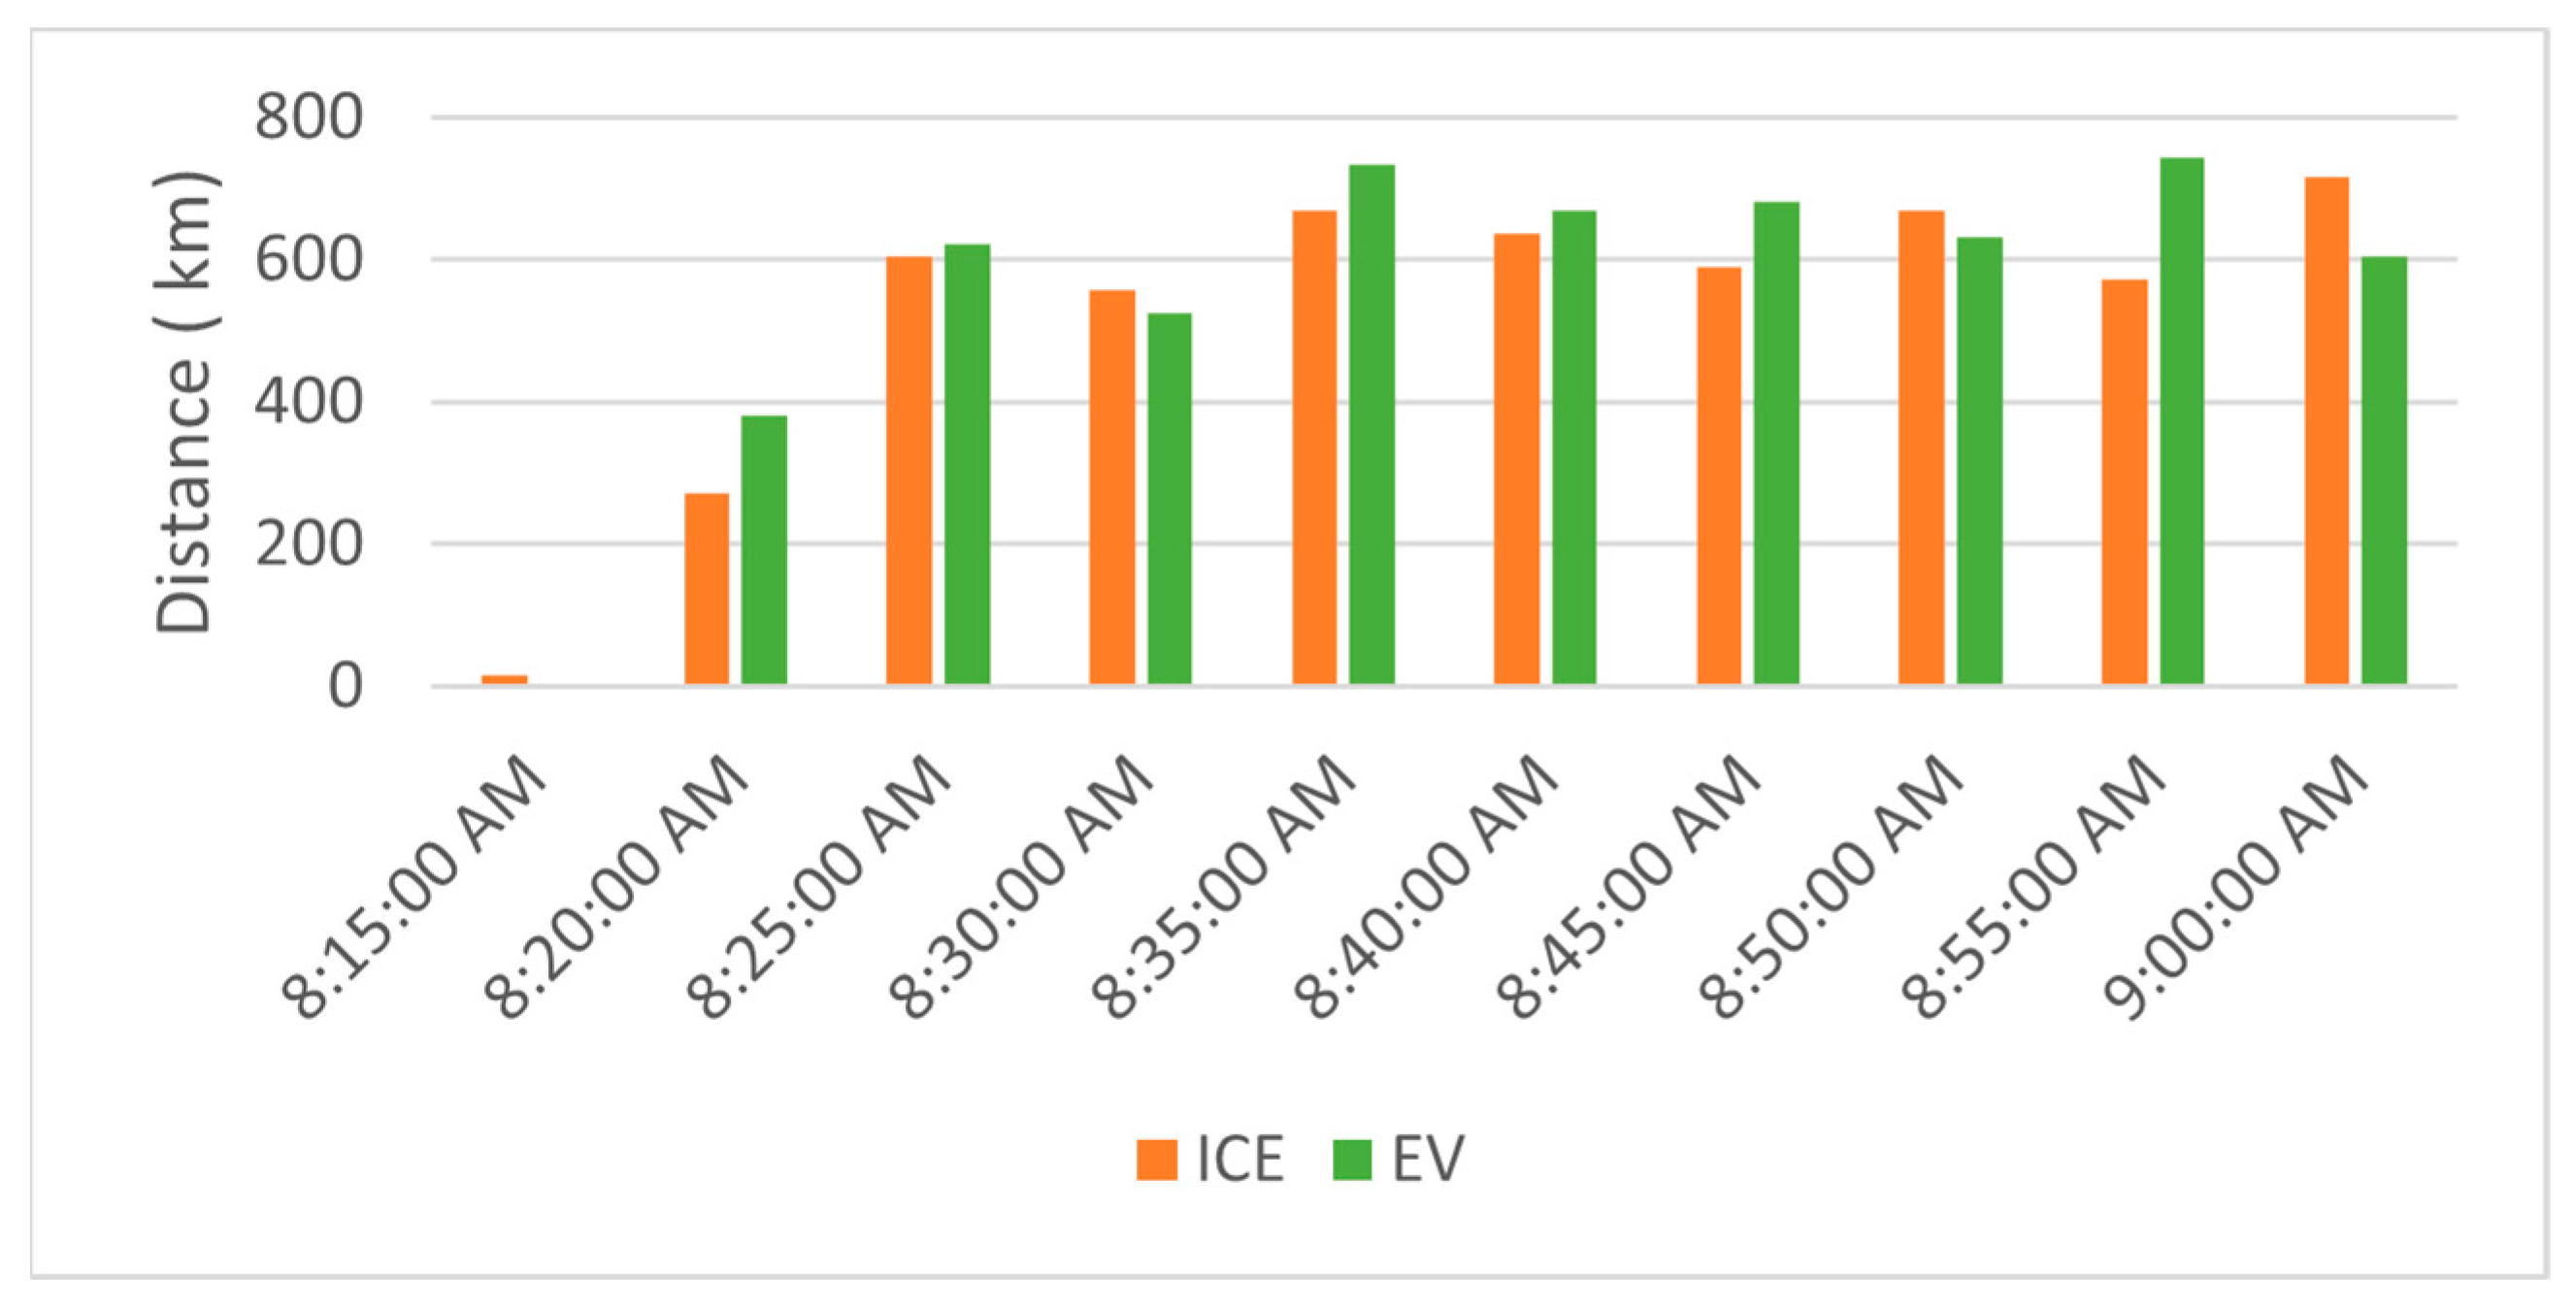
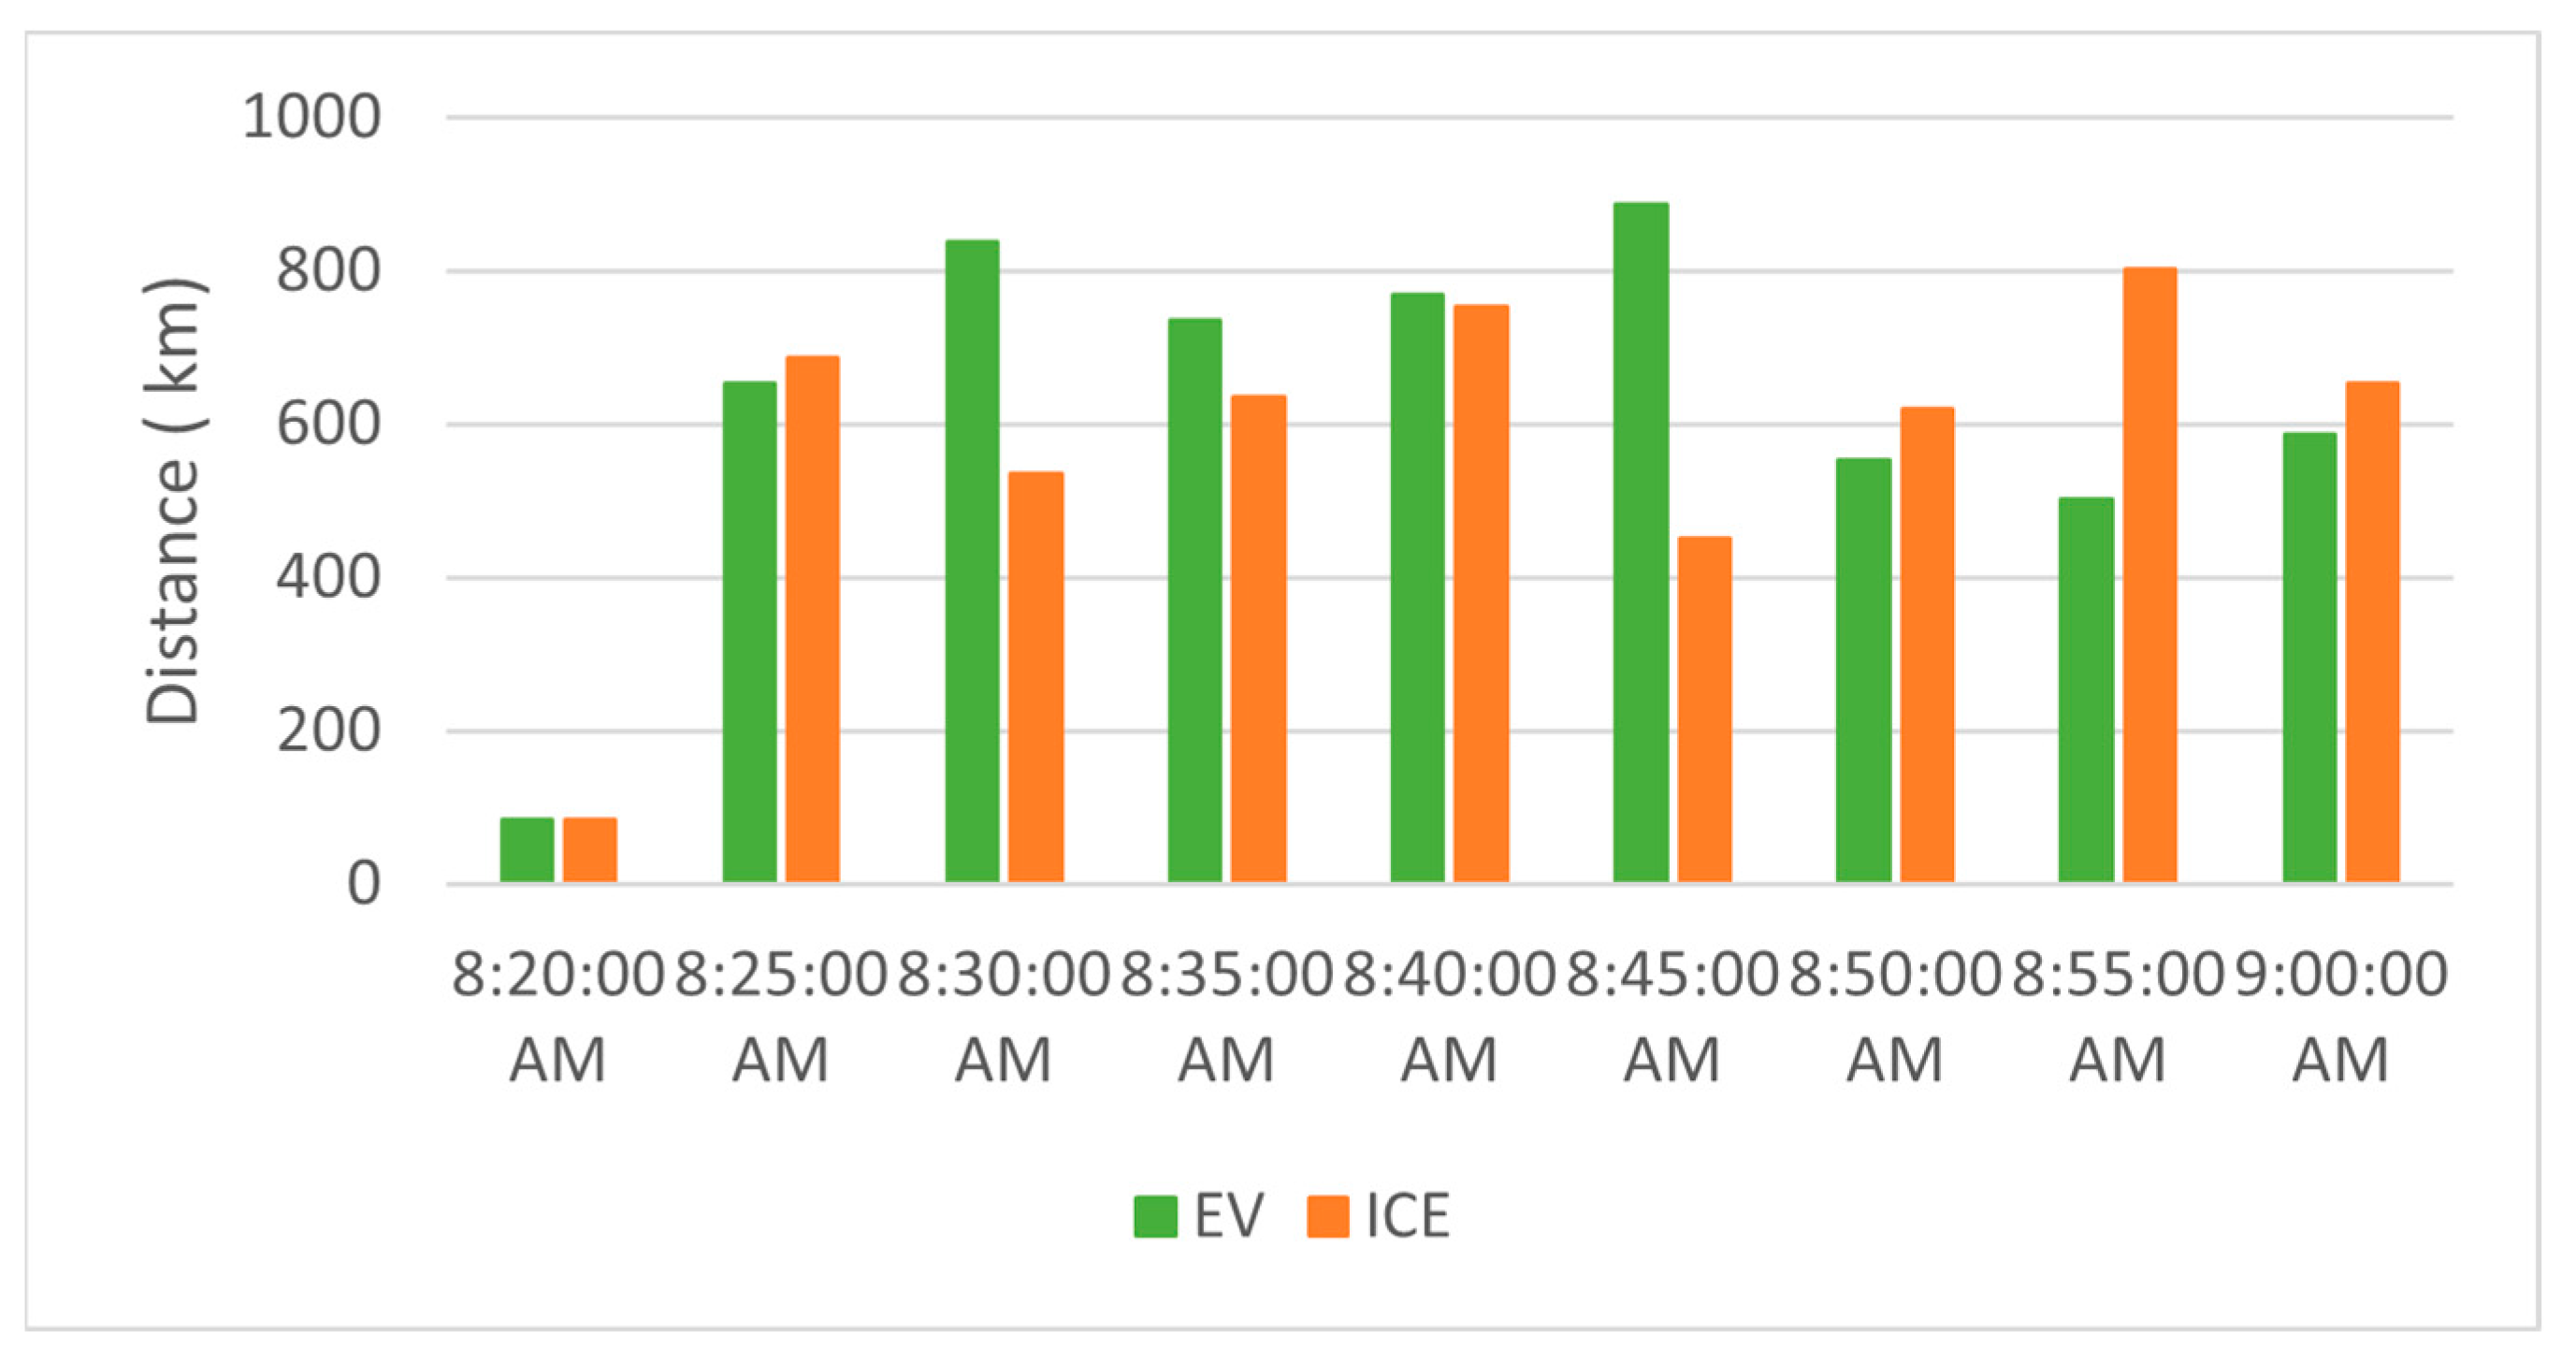
The total distance traveled by EVs was 5594.82 km, completed by 383 vehicles, whereas ICEVs traveled a total distance of 5303.70 km by 303 vehicles in a one-hour simulation, as shown in Figure 13. In most time intervals, EVs completed more journeys than ICEVs. This is due to the input vehicles to the network. For instance, at 8:20 a.m., the total number of vehicles inside the network is 153 for EVs and 133 for ICEVs. The new vehicles entering the network for EVs was 44 and 31 for ICEVs, and the number of completed journeys for EVs was 28 and 17 for ICEVs. Thus, the more vehicles in the network, the number of completed journeys increases. However, at 8:15 a.m., there was one completed journey by ICEVs, but none by EVs, due to the faster speed of ICEVs.
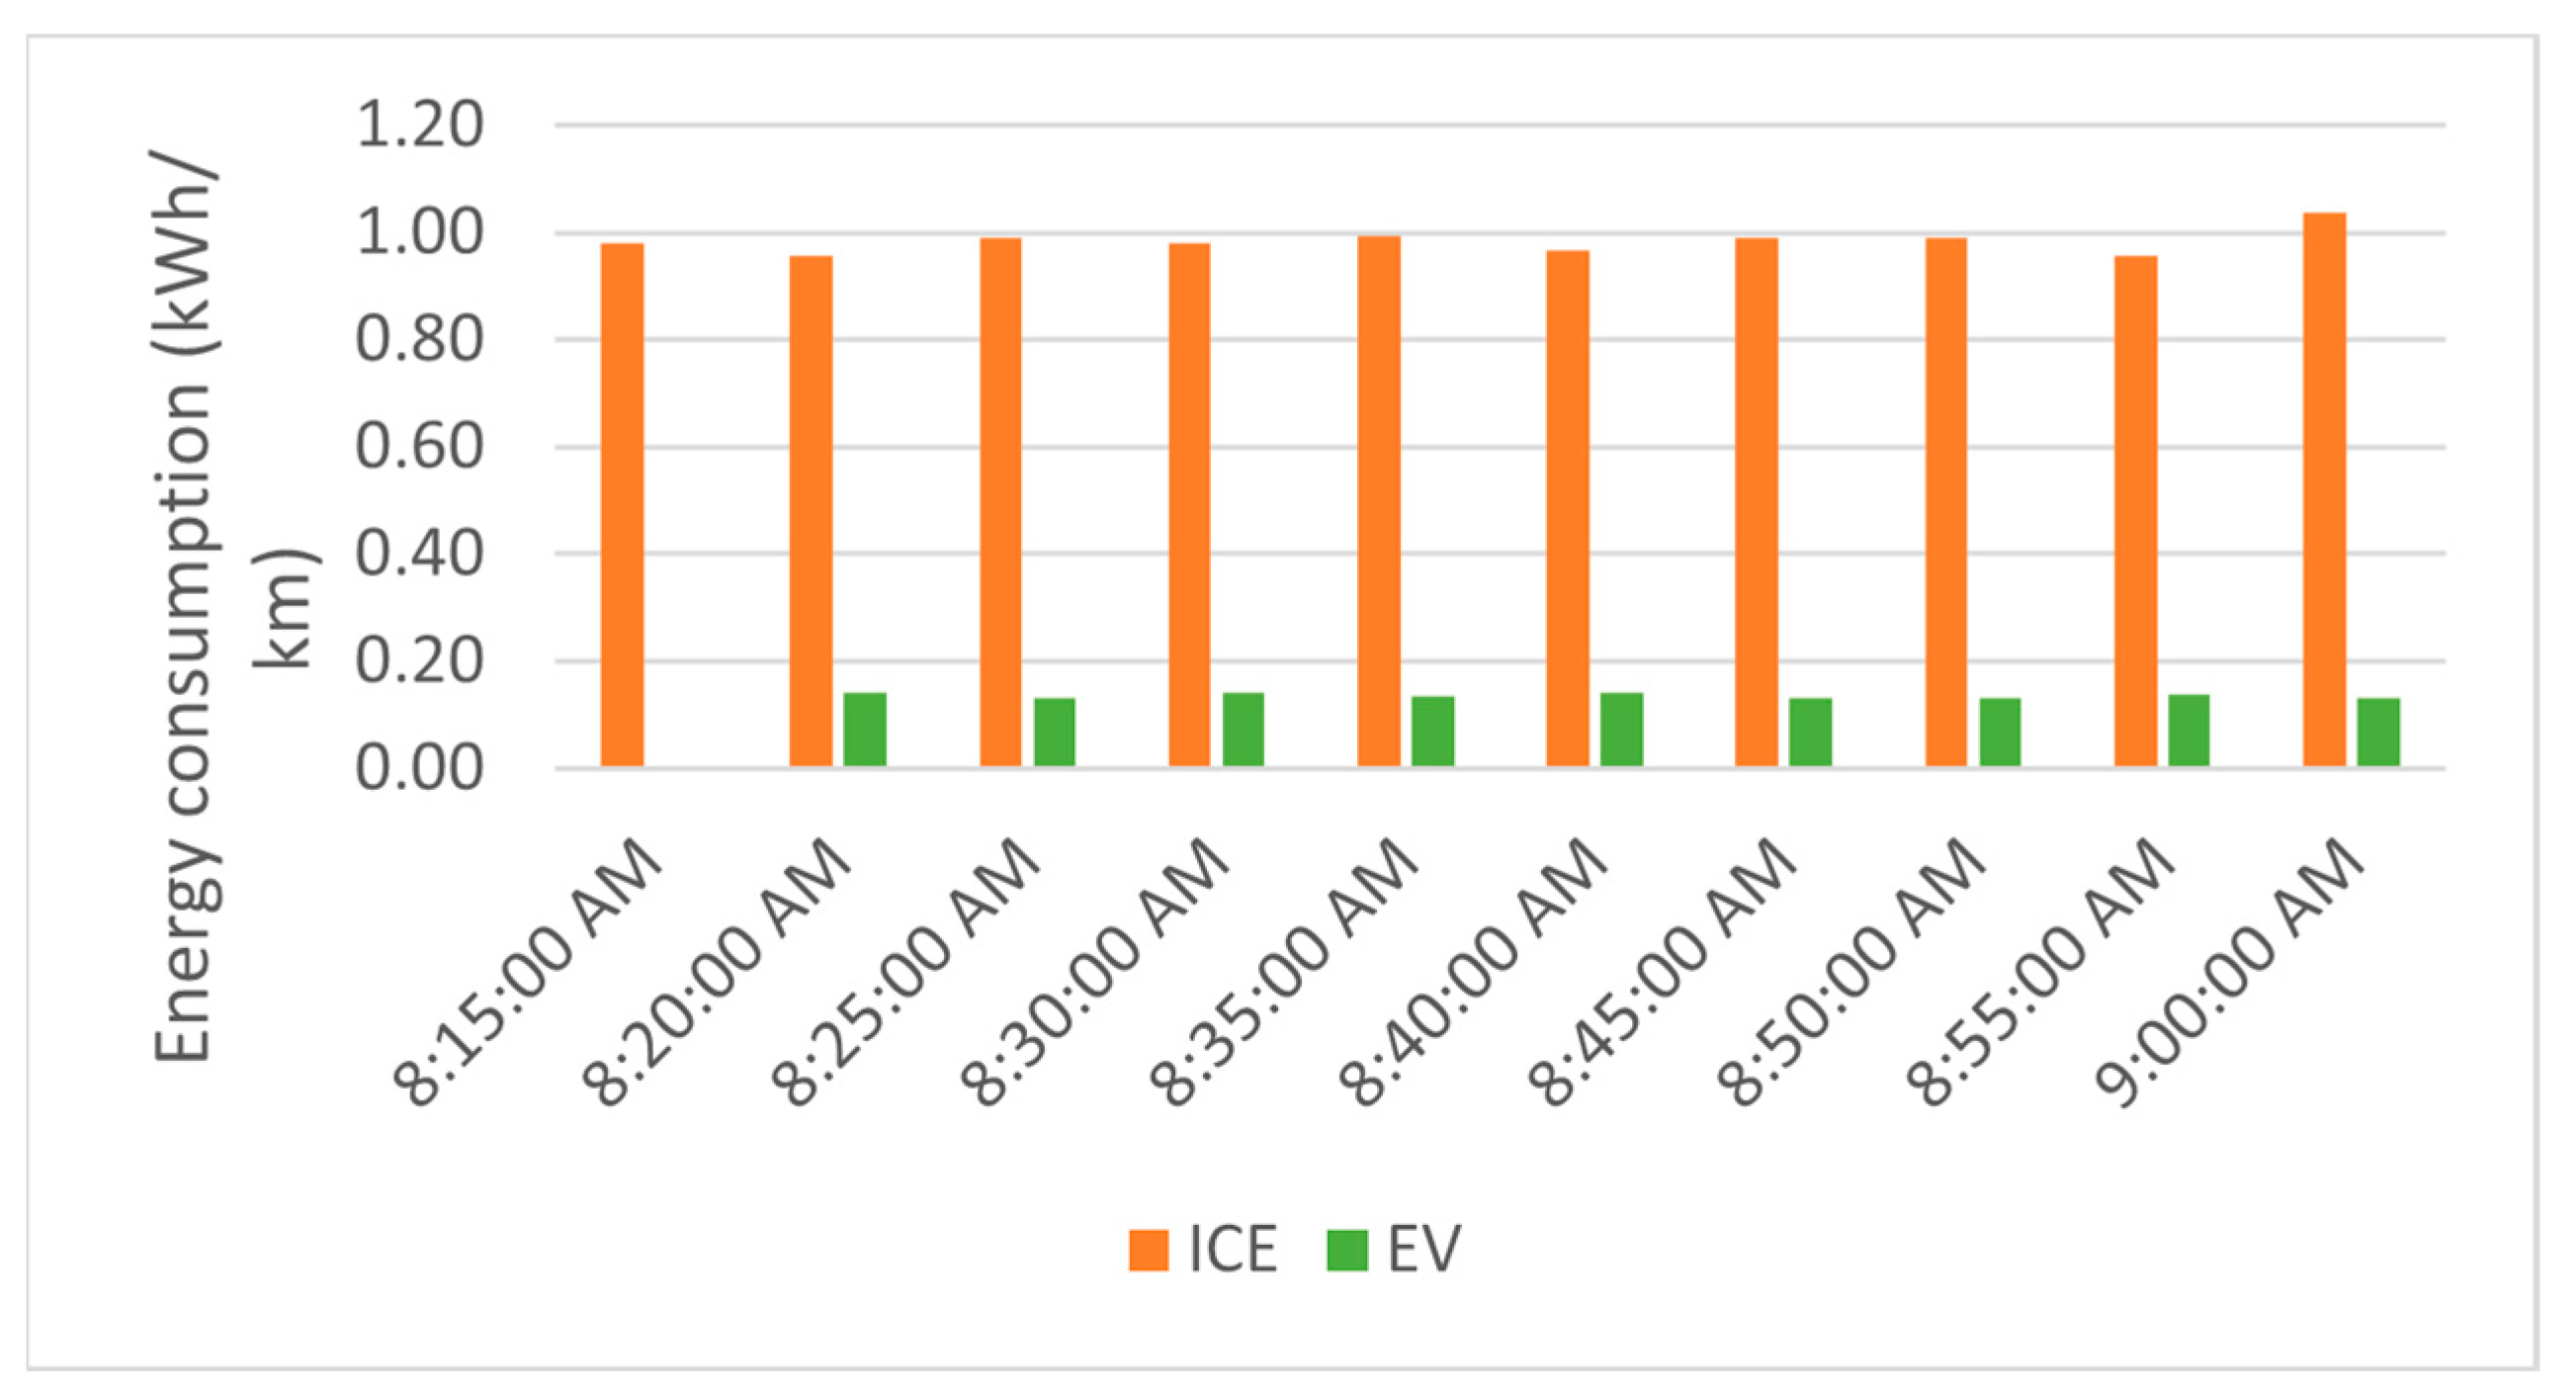
Figure 14 shows the average energy consumption by EVs and ICEVs for Scenario 3. The energy saved by driving an EV in this scenario is approximately 86%. The average energy consumption for EVs is 0.14 kWh/km, while the average energy consumption of ICEVs is 0.98 kWh/km. This difference in energy consumption was due to the speed, road density, and traffic lights. The effect of the traffic light is shown in Figure 15. As Scenario 3 was conducted in an urban area, the difference between the energy consumption of EVs and ICEVs existed due to the stop-and-go situation as a result of traffic congestion besides traffic lights. A study conducted by [27] shows that in stop-and-go conditions, EVs consume less energy compared to ICEVs. Congested traffic also had a greater impact on ICEVs than EVs as it consumes more energy due to the frequent starts and stops, while EVs use regenerative braking to recover the losses and also do not burn fuel while idling.
The average energy consumption of EVs at Traffic Light 1 was 0.01 kWh/km and 0.14 kWh/km at Traffic Light 2. On the other hand, the average energy consumption of ICEVs was 1.35 kWh/km and 1.40 kWh/km, respectively. This shows the effectiveness of regenerative braking in electric vehicles in which the power is transferred from the wheels to the battery pack, mostly during the deceleration and braking. Another reason was that there was only one lane for the vehicle to turn. Therefore, it creates congestion and queuing. Congestion makes EVs use less energy, and ICEVs consume more energy than normal driving. ICEVs required more fuel while idling and accelerated more after the lights turned green, thereby being less fuel-efficient during stop time.
AIMSUN uses the backward-looking approach for the battery consumption model that was first proposed by James Larminie and Lowry [44] and Genikomsakis and Mitrentsis [45], and later by Iora and Tribioli [46].
In this approach, the power required at the wheels is determined by the velocity specified by the driving cycle as a product of resistance and inertia forces. During traction, the electrical energy is drawn from the battery and transformed into kinetic energy, and the kinetic energy is transformed into electrical energy during braking through the wheels, thus saving more energy compared to ICEV. There is a 24% reduction in energy consumption of EVs by taking into account the optimal speed profile for EVs at traffic lights, which cannot be conducted in ICEVs [29].
As for Scenario 4, the total distance traveled was 1289.47 km by 477 vehicles out of 534 vehicles simulated for EVs (Figure 16) and consumed 147.24 kWh of battery capacity. The higher the number of vehicles that reached the destination, the higher the accumulated distance traveled by the time intervals. The total distance traveled by ICEVs for Scenario 4 is 1229.36 km, with fuel consumption of 106.62 L by 453 vehicles out of 496 vehicles simulated. The average fuel consumption for ICEVs was 11.53 km/L for an urban area with short-distance driving.
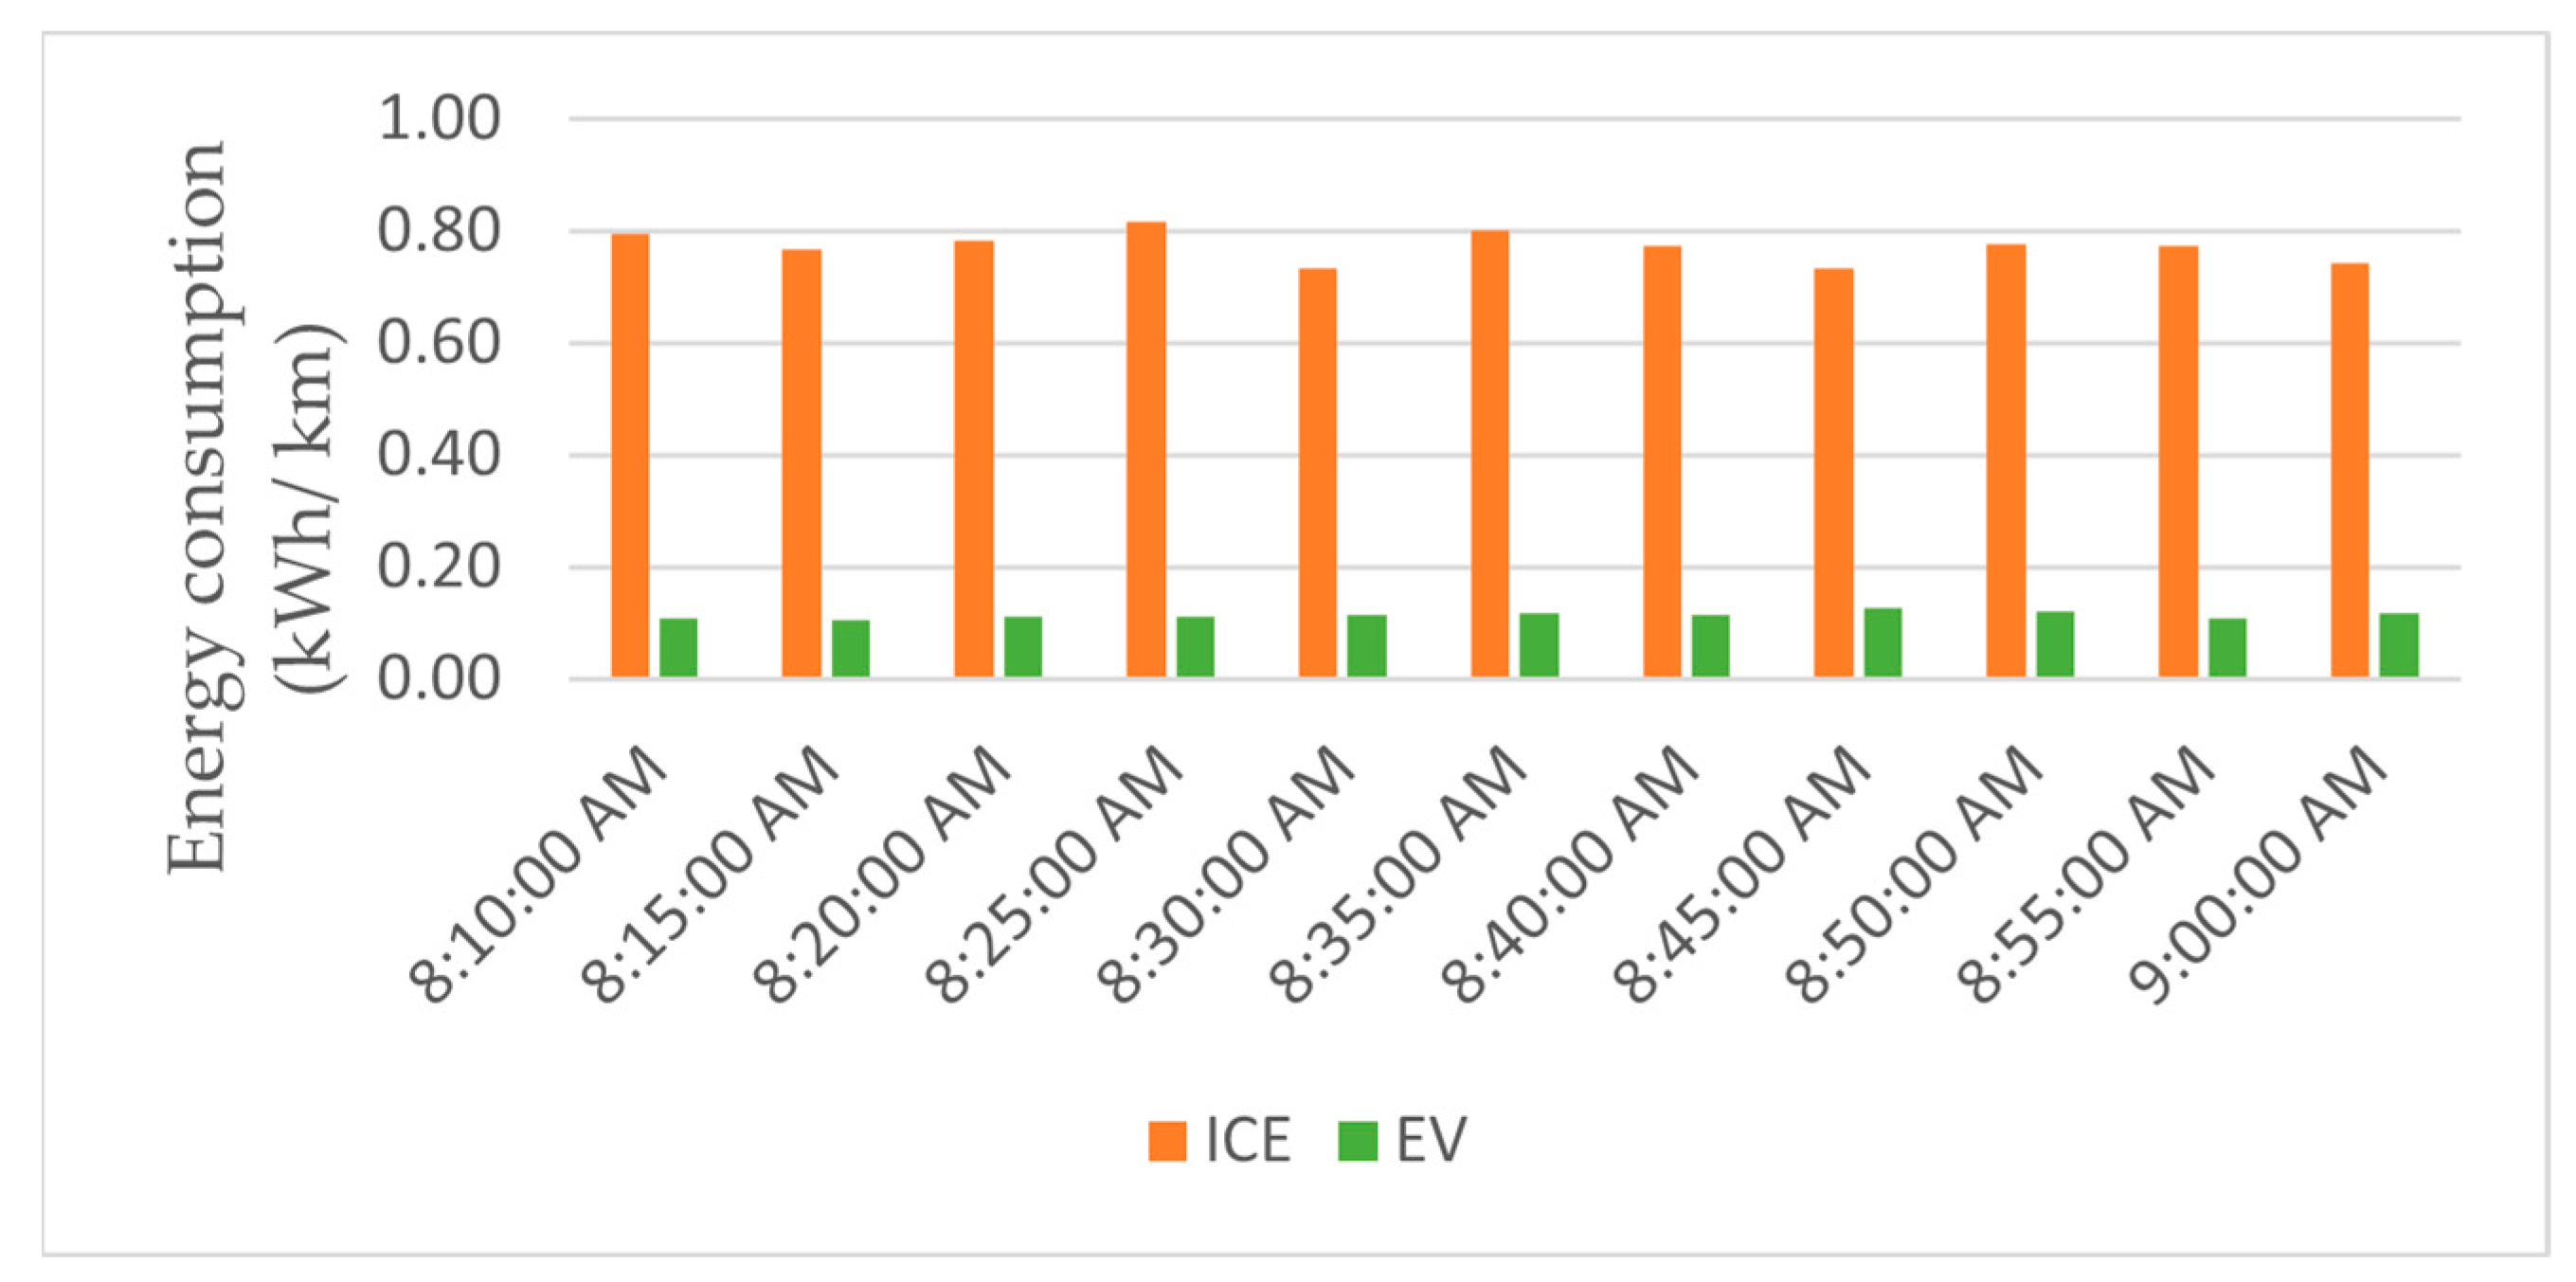
Figure 17 shows the average energy consumption by EVs and ICEVs for Scenario 4. The average energy consumption for EVs was 0.11 kWh/km, while for ICEVs was 0.77 kWh/km. The energy saved by driving EVs was approximately 85 percent.
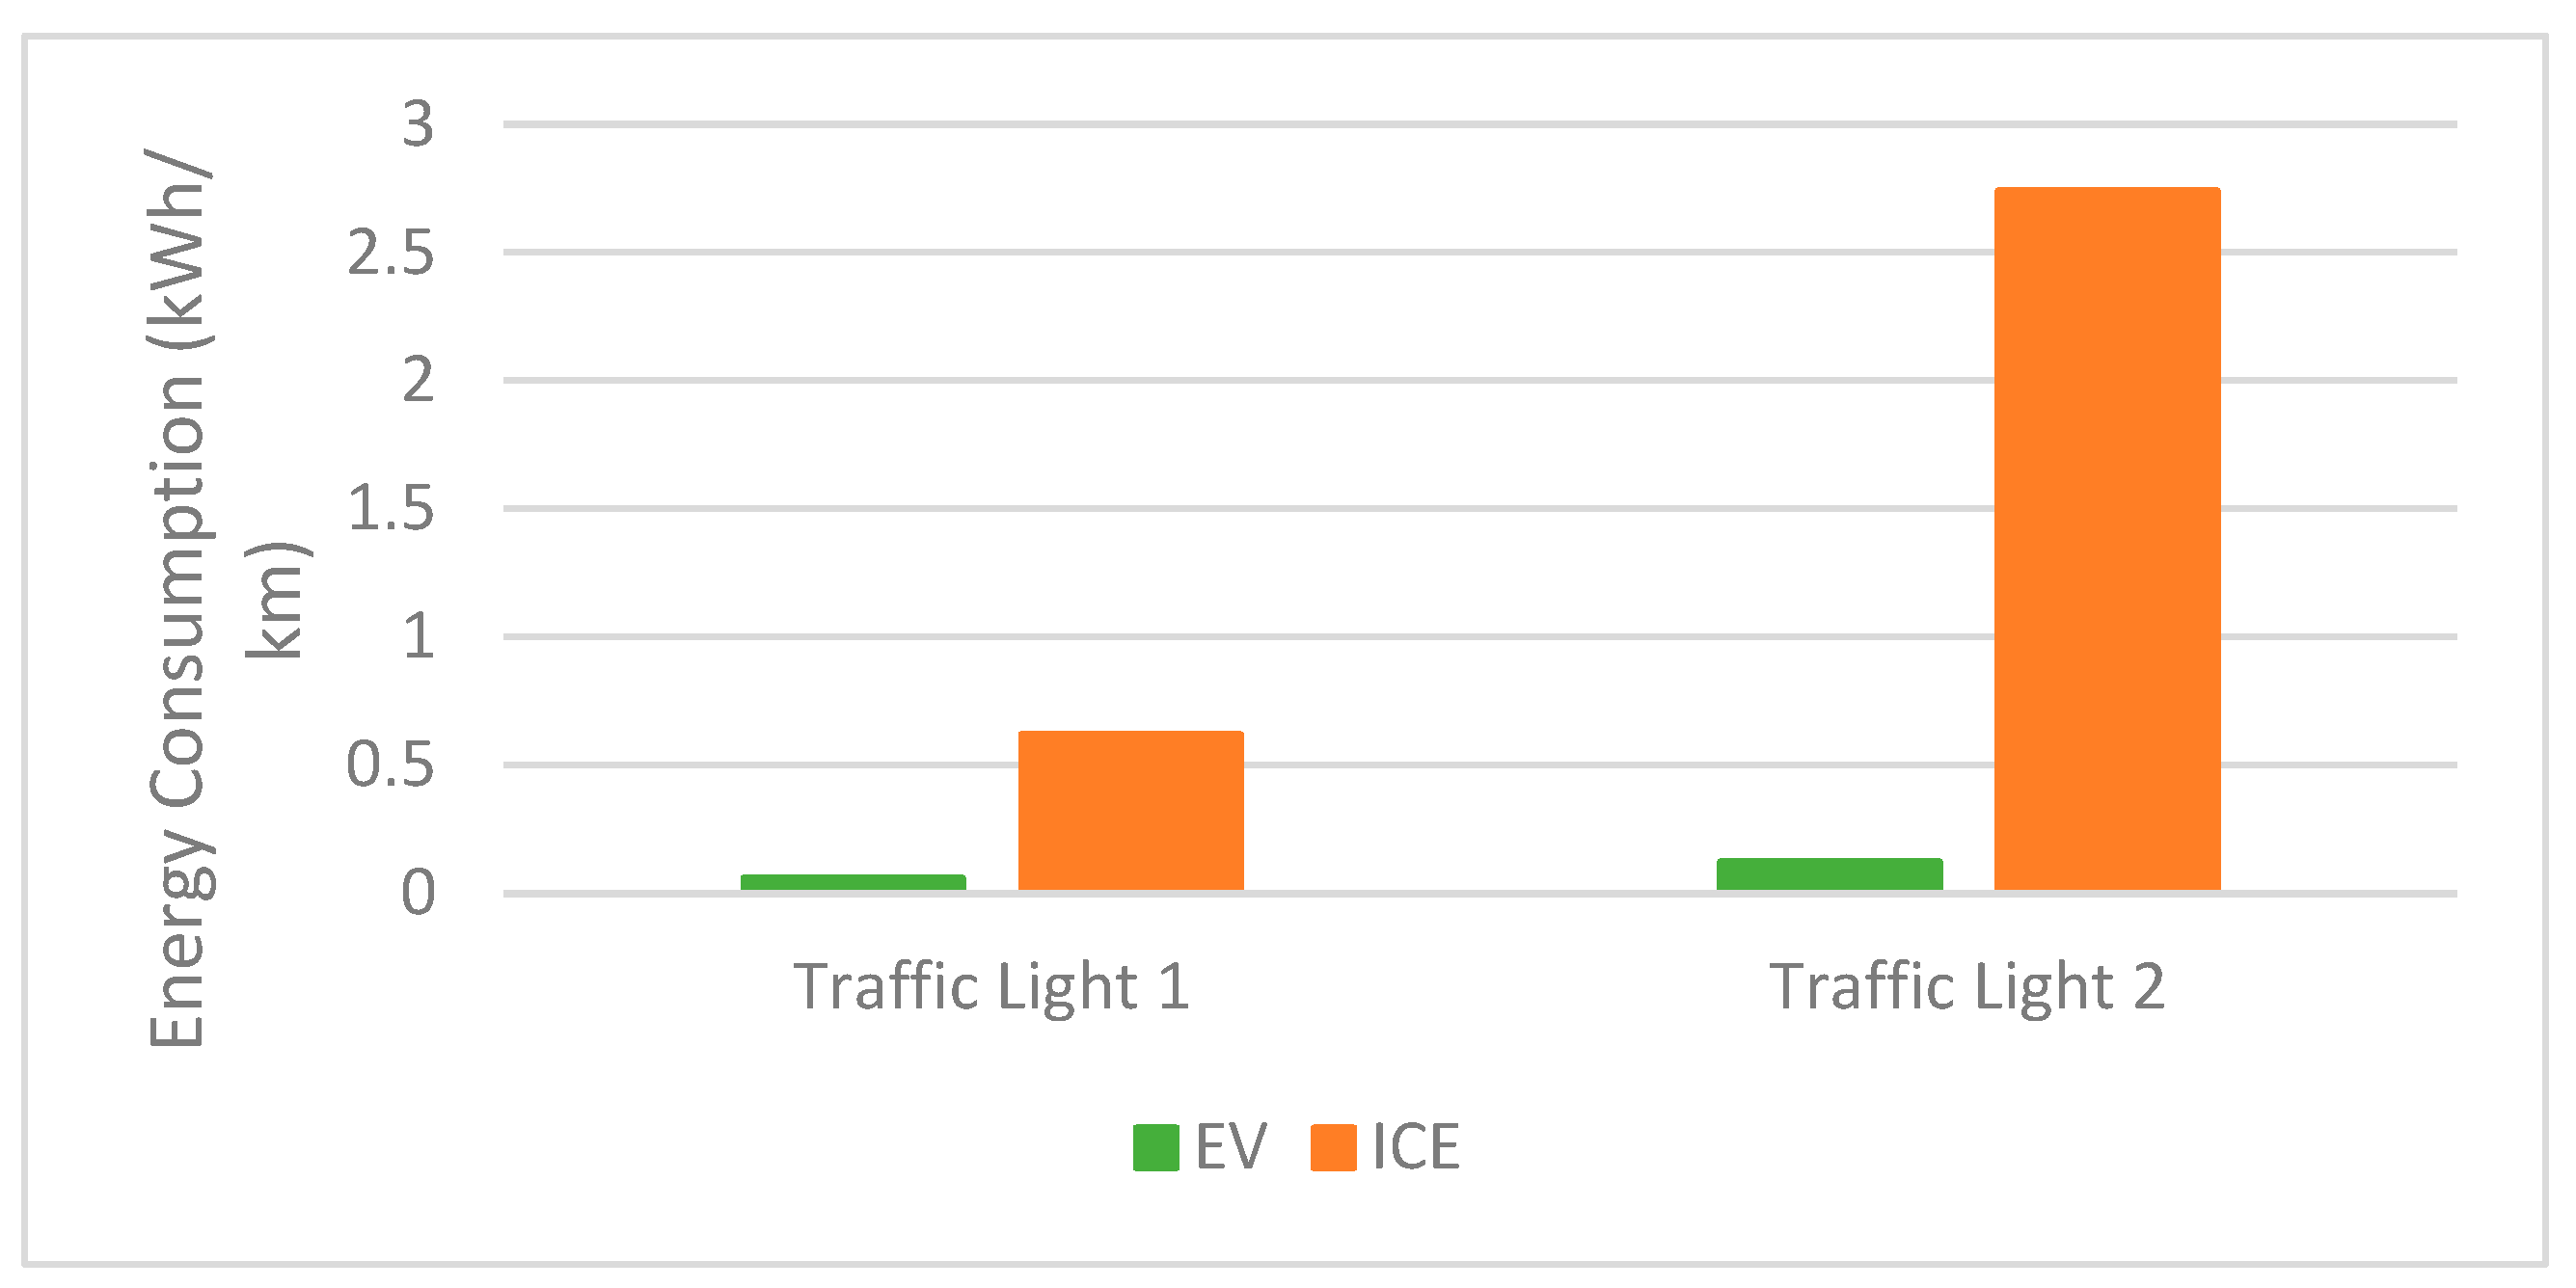
The average energy consumption at traffic light 1 for EVs was 0.06 kWh/km, and for ICEVs, it was 0.6 kWh/km on a 491-m road. Figure 18 shows the comparison of energy consumption per kilometer by ICEVs and EVs. One of the factors for the difference was that EVs do not consume energy when at a stop or idling except for the internal electronics or climate used. Meanwhile, for ICEVs, fuel was still used up as the engine was still on.
The average stop time of EVs was 30 s, while for ICEVs, it was 24 s. Although EVs stop time was longer, the energy consumption was low. The energy consumed by ICE fluctuates from time to time due to the number of vehicles that stop and pass through the traffic light differing from time to time. A higher number of stops results in higher fuel consumption.
As for Traffic Light 2, the average energy consumption for EVs was 0.13 kWh/km, while for ICEVs, it was 2.7 kWh/km on a 150 m simulated road before the traffic light. The average stop time for EVs was 103 s, while for ICEVs, it was 76.9 s. This shows that EVs did not consume more energy, although the stop time is higher than ICEVs.
In addition, the fuel consumption of ICE decreased in low lane density and the shorter stop time. For instance, the density and the stop time were higher at 8:25 a.m. compared to 8:30 a.m., and it was observed that the fuel consumed was lower at the latter time.
The findings from both traffic lights demonstrated that the stop-and-go situation benefited EVs. This is because ICEVs needed fuel to maintain the engine while at a stop or idling and used more fuel to accelerate to go, while EVs used less or zero energy at a stop or idling and regenerative braking that helped in reducing the energy consumption.
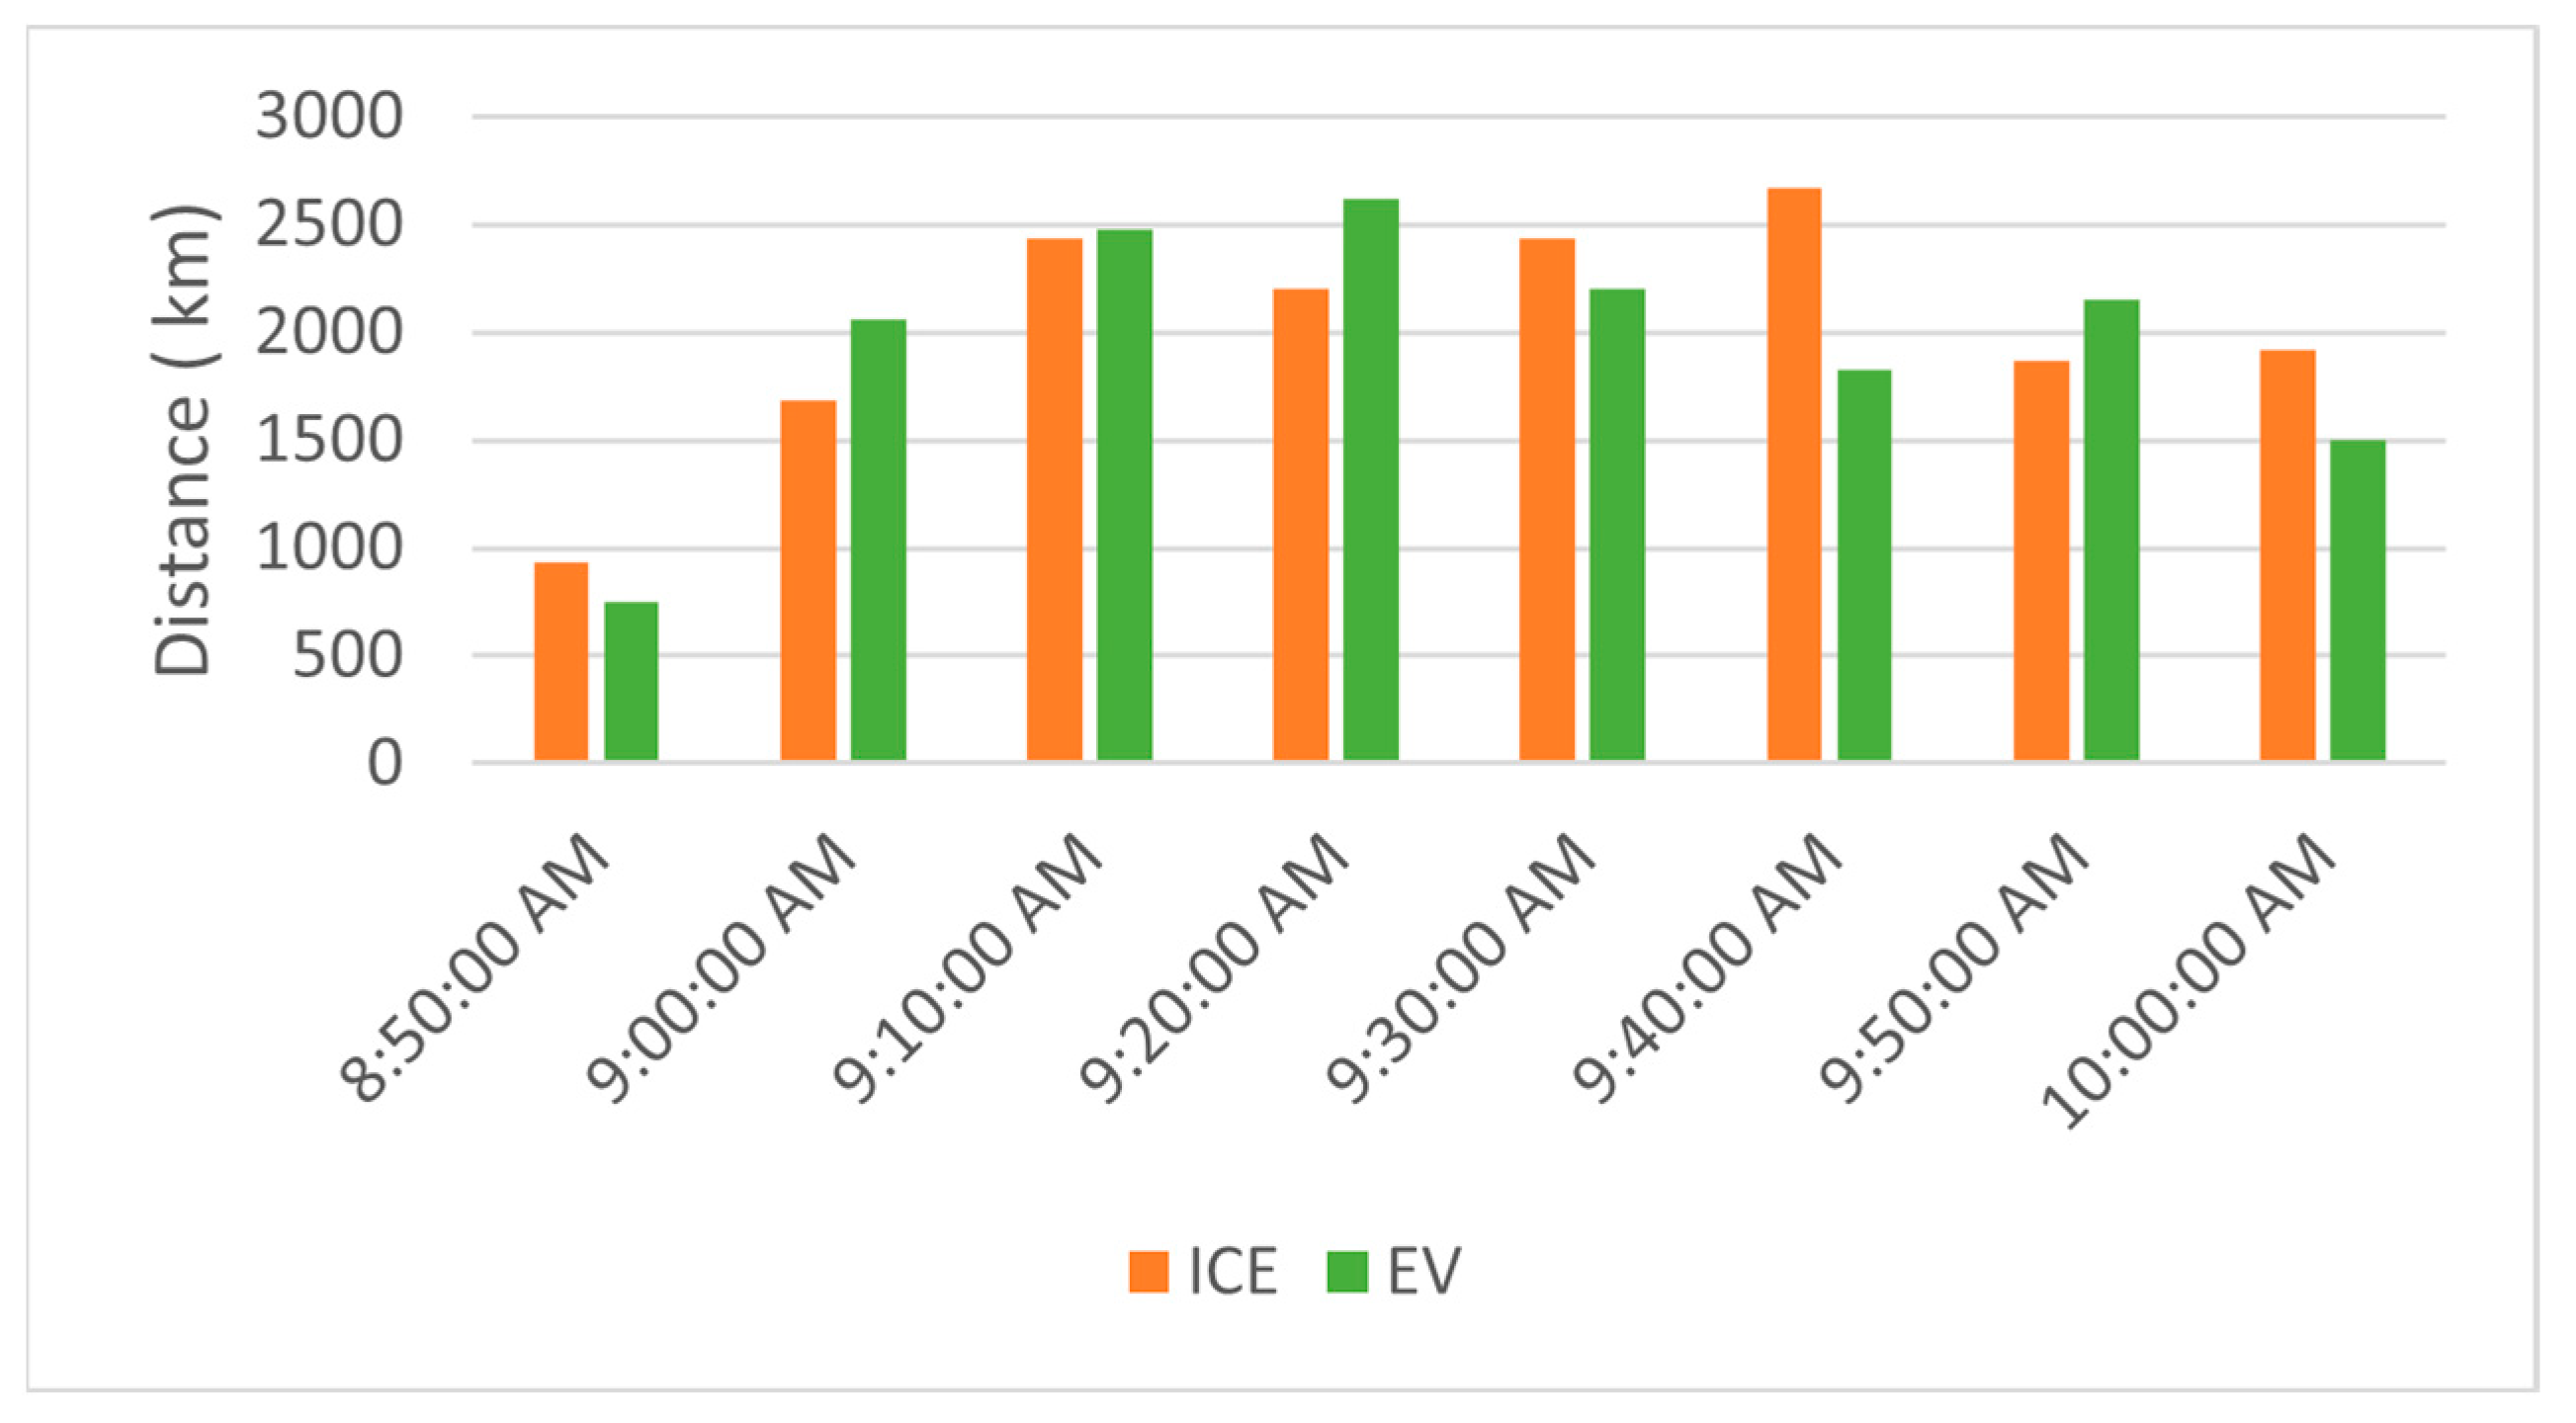
The total distance traveled by EVs in Scenario 4 was 15,583.7 km which consumed 1863.71 kWh of energy. The average energy consumption was 0.12 kWh/km. The distance traveled was 333 vehicles out of 498 vehicles simulated (Figure 19). The distance traveled and battery consumption was closely correlated to the number of completed journey. Out of 507 vehicles simulated, 345 vehicles reached the destination within a two-hour simulation, which the first few cars reached after 50 min of traveling. This made the total distance traveled 16,145.43 km with 859.81 L of petrol consumed.
Long-distance driving in EVs in suburban areas saved 75 percent of energy. Driving at higher speeds in less traffic and with low lane density, however, resulted in higher energy consumption. Higher speed increased the energy consumption for both EVs and ICEVs. Based on Figure 20, the average energy consumption for EVs and ICE was 0.12 kWh/km and 0.48 kWh/km, respectively.
The total distance traveled by EVs in Scenario 6 was 5604.18 km which consumed 572.37 kWh of energy. This made the average energy consumption for a suburban with a short-distance drive 10 kWh/km. The distance was completed by 335 EVs out of 536 simulated EVs. As for ICE, the total distance traveled was 5219.53 km which consumed 384.38 L of fuel by 312 vehicles out of 470 simulated vehicles. Both was shown in Figure 21. The average energy consumption for this scenario was 13.57 km/L.
Each time interval received a different number of vehicles. Only five ICEVs and EVs reached their destination at 8:20 a.m., which is the reason for the low fuel consumption and distance travel. This differs from 8:55 a.m., where the total completed journey is 48 ICEVs and 30 EVs, the highest among other time intervals for ICEVs, which contributed to the highest fuel consumption for this scenario. This shows fluctuations in the trend.
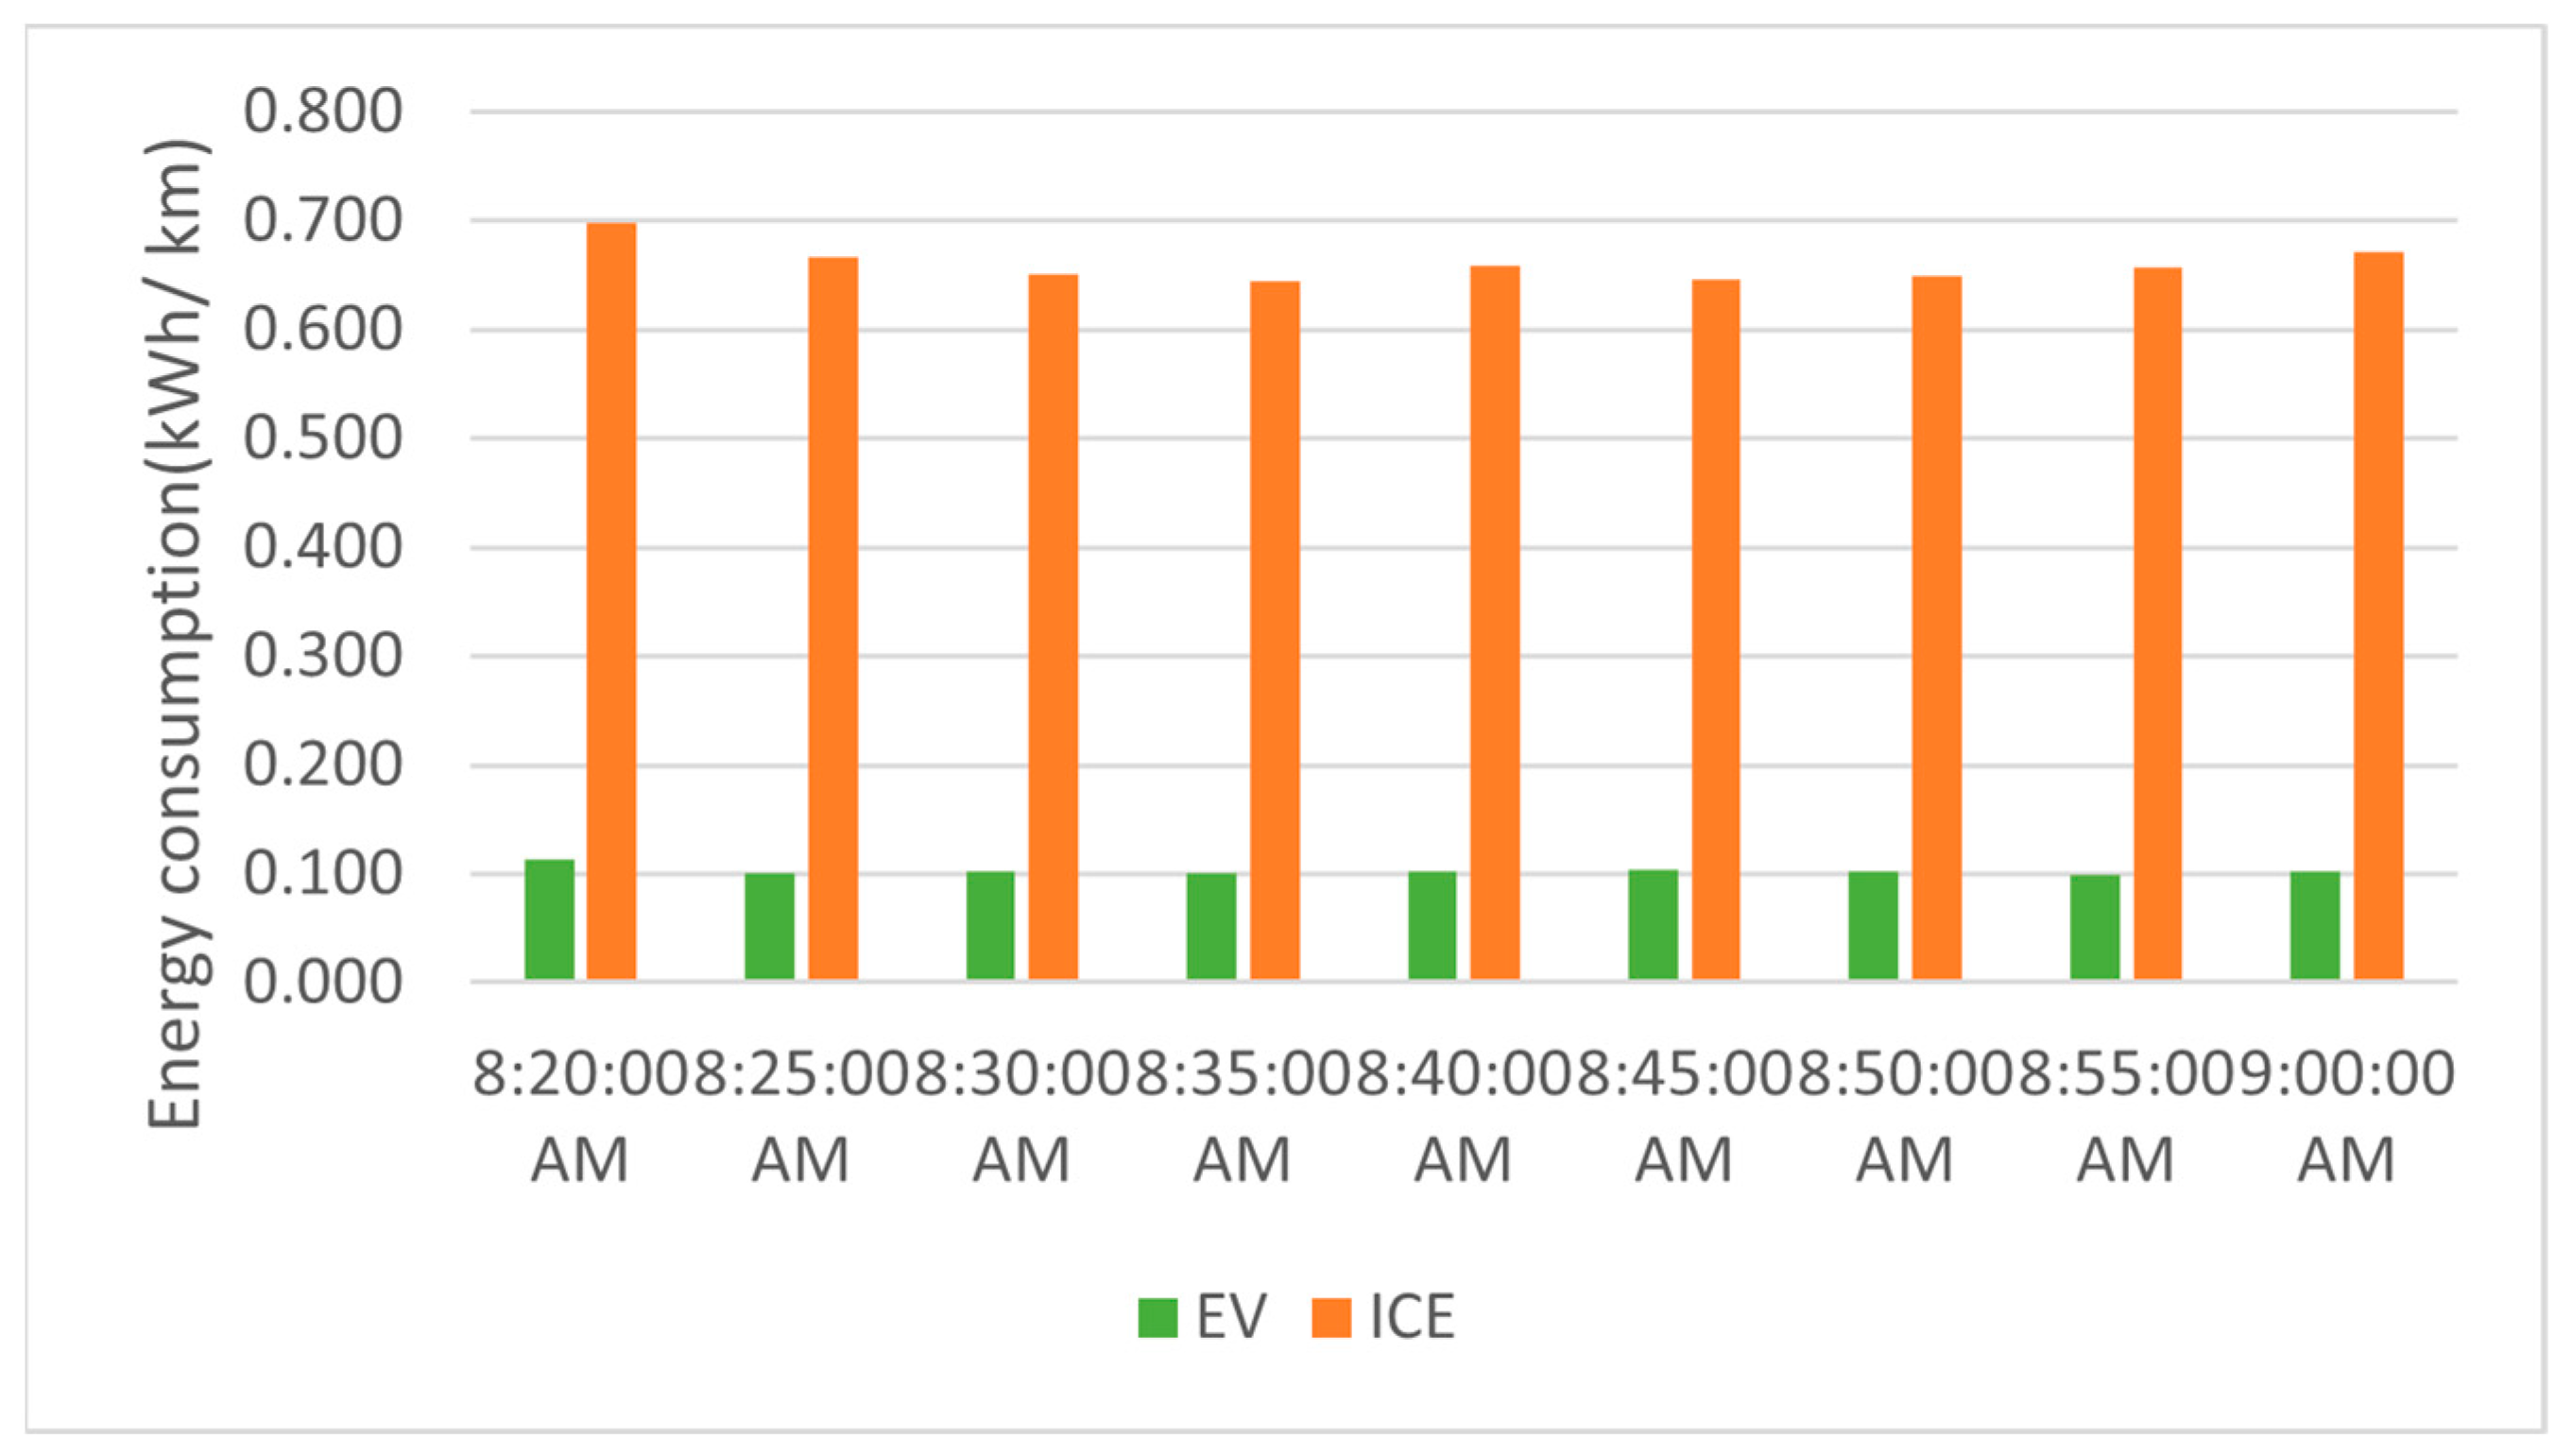
Driving EVs in Scenario 6 saved 84 percent of energy as shown in Figure 22. The energy saving from EVs was lowest at all times throughout the one-hour simulation. The average energy consumption for EVs was 0.1 kWh/km, while for ICEVs, it was 0.66 kWh/km. This indicated that EVs were more energy efficient than ICEVs.
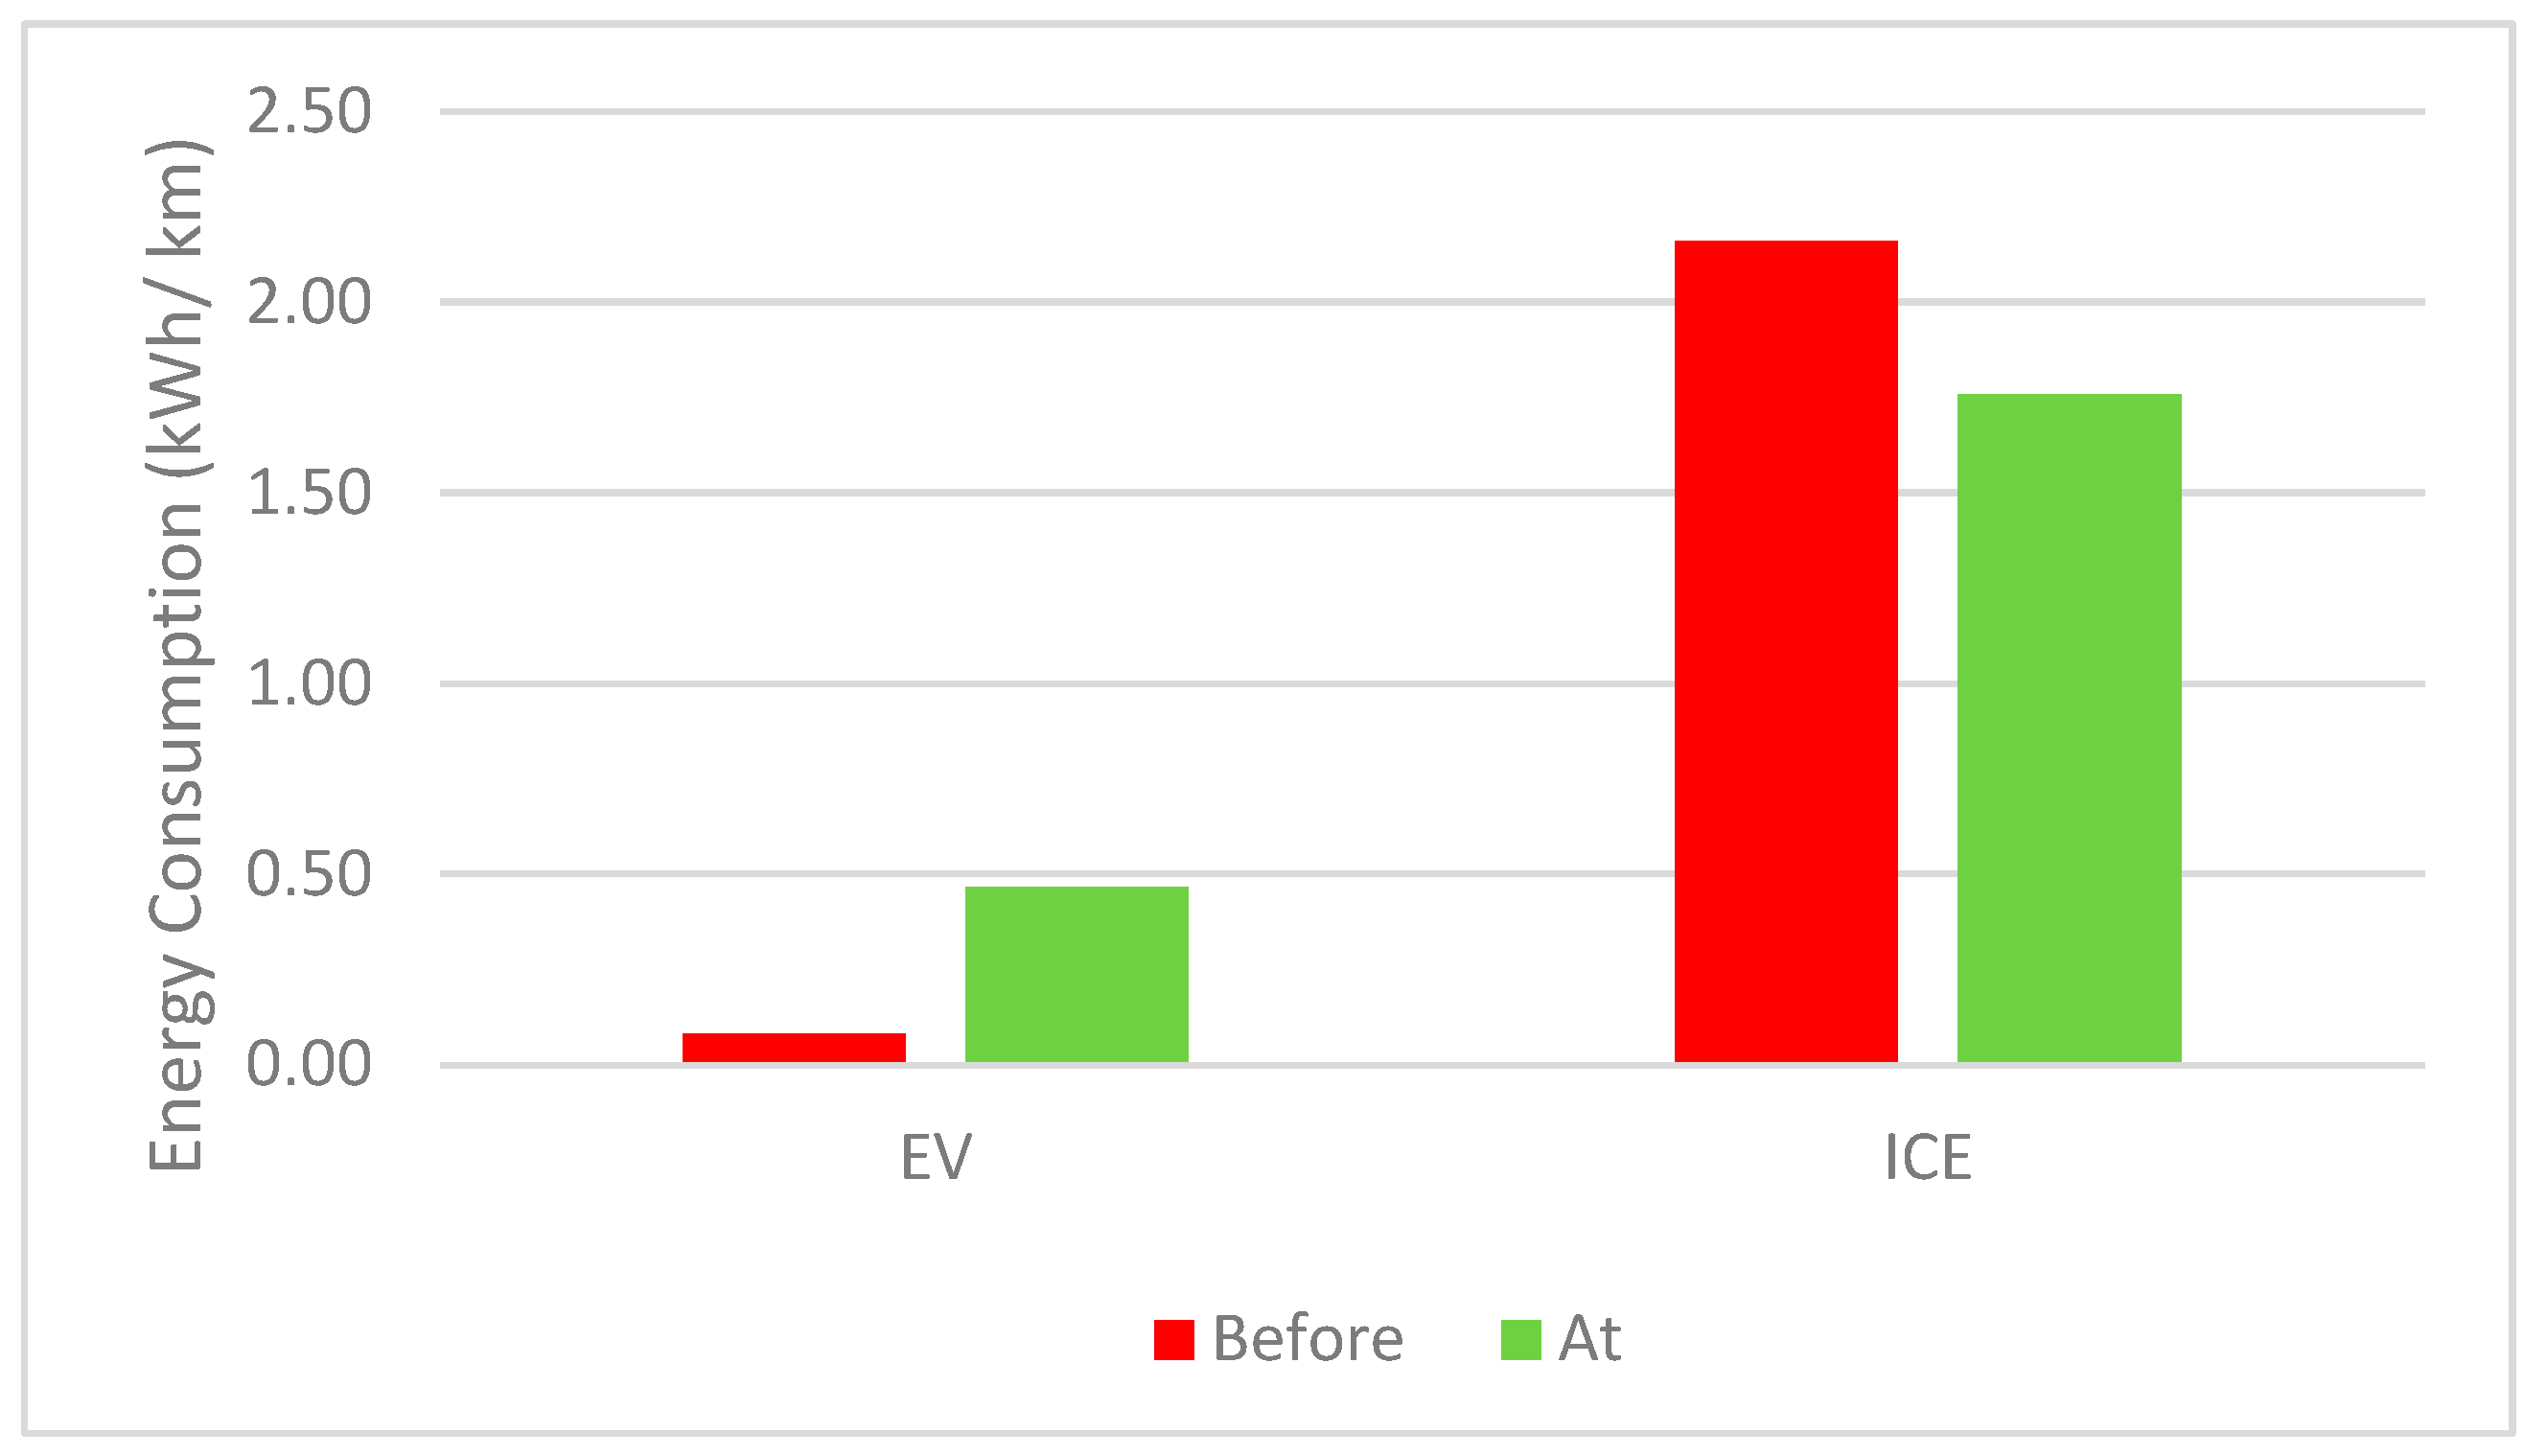
Two energy consumption comparisons were made, which are before the roundabout and at the roundabout. Based on the Figure 23, the energy consumed before entering the roundabout was less than the energy consumed at the roundabout. This was due to the acceleration made when the vehicles were about to enter the roundabout after the stop or yielding.
The energy consumption of EVs before the roundabout was 0.08 kWh. This was because the vehicle slowed down the speed approaching the roundabout. Regenerative braking also lowered energy consumption. However, different from EVs, ICEVs consumed 2.16 kWh/km before the roundabout due to the braking and slowing down from acceleration.
Both vehicles experienced a drastic increase in energy consumption at roundabouts due to the stop-and-go condition causing the vehicle to consume more energy to accelerate.

3.2. Economic Impact of Different Route Conditions

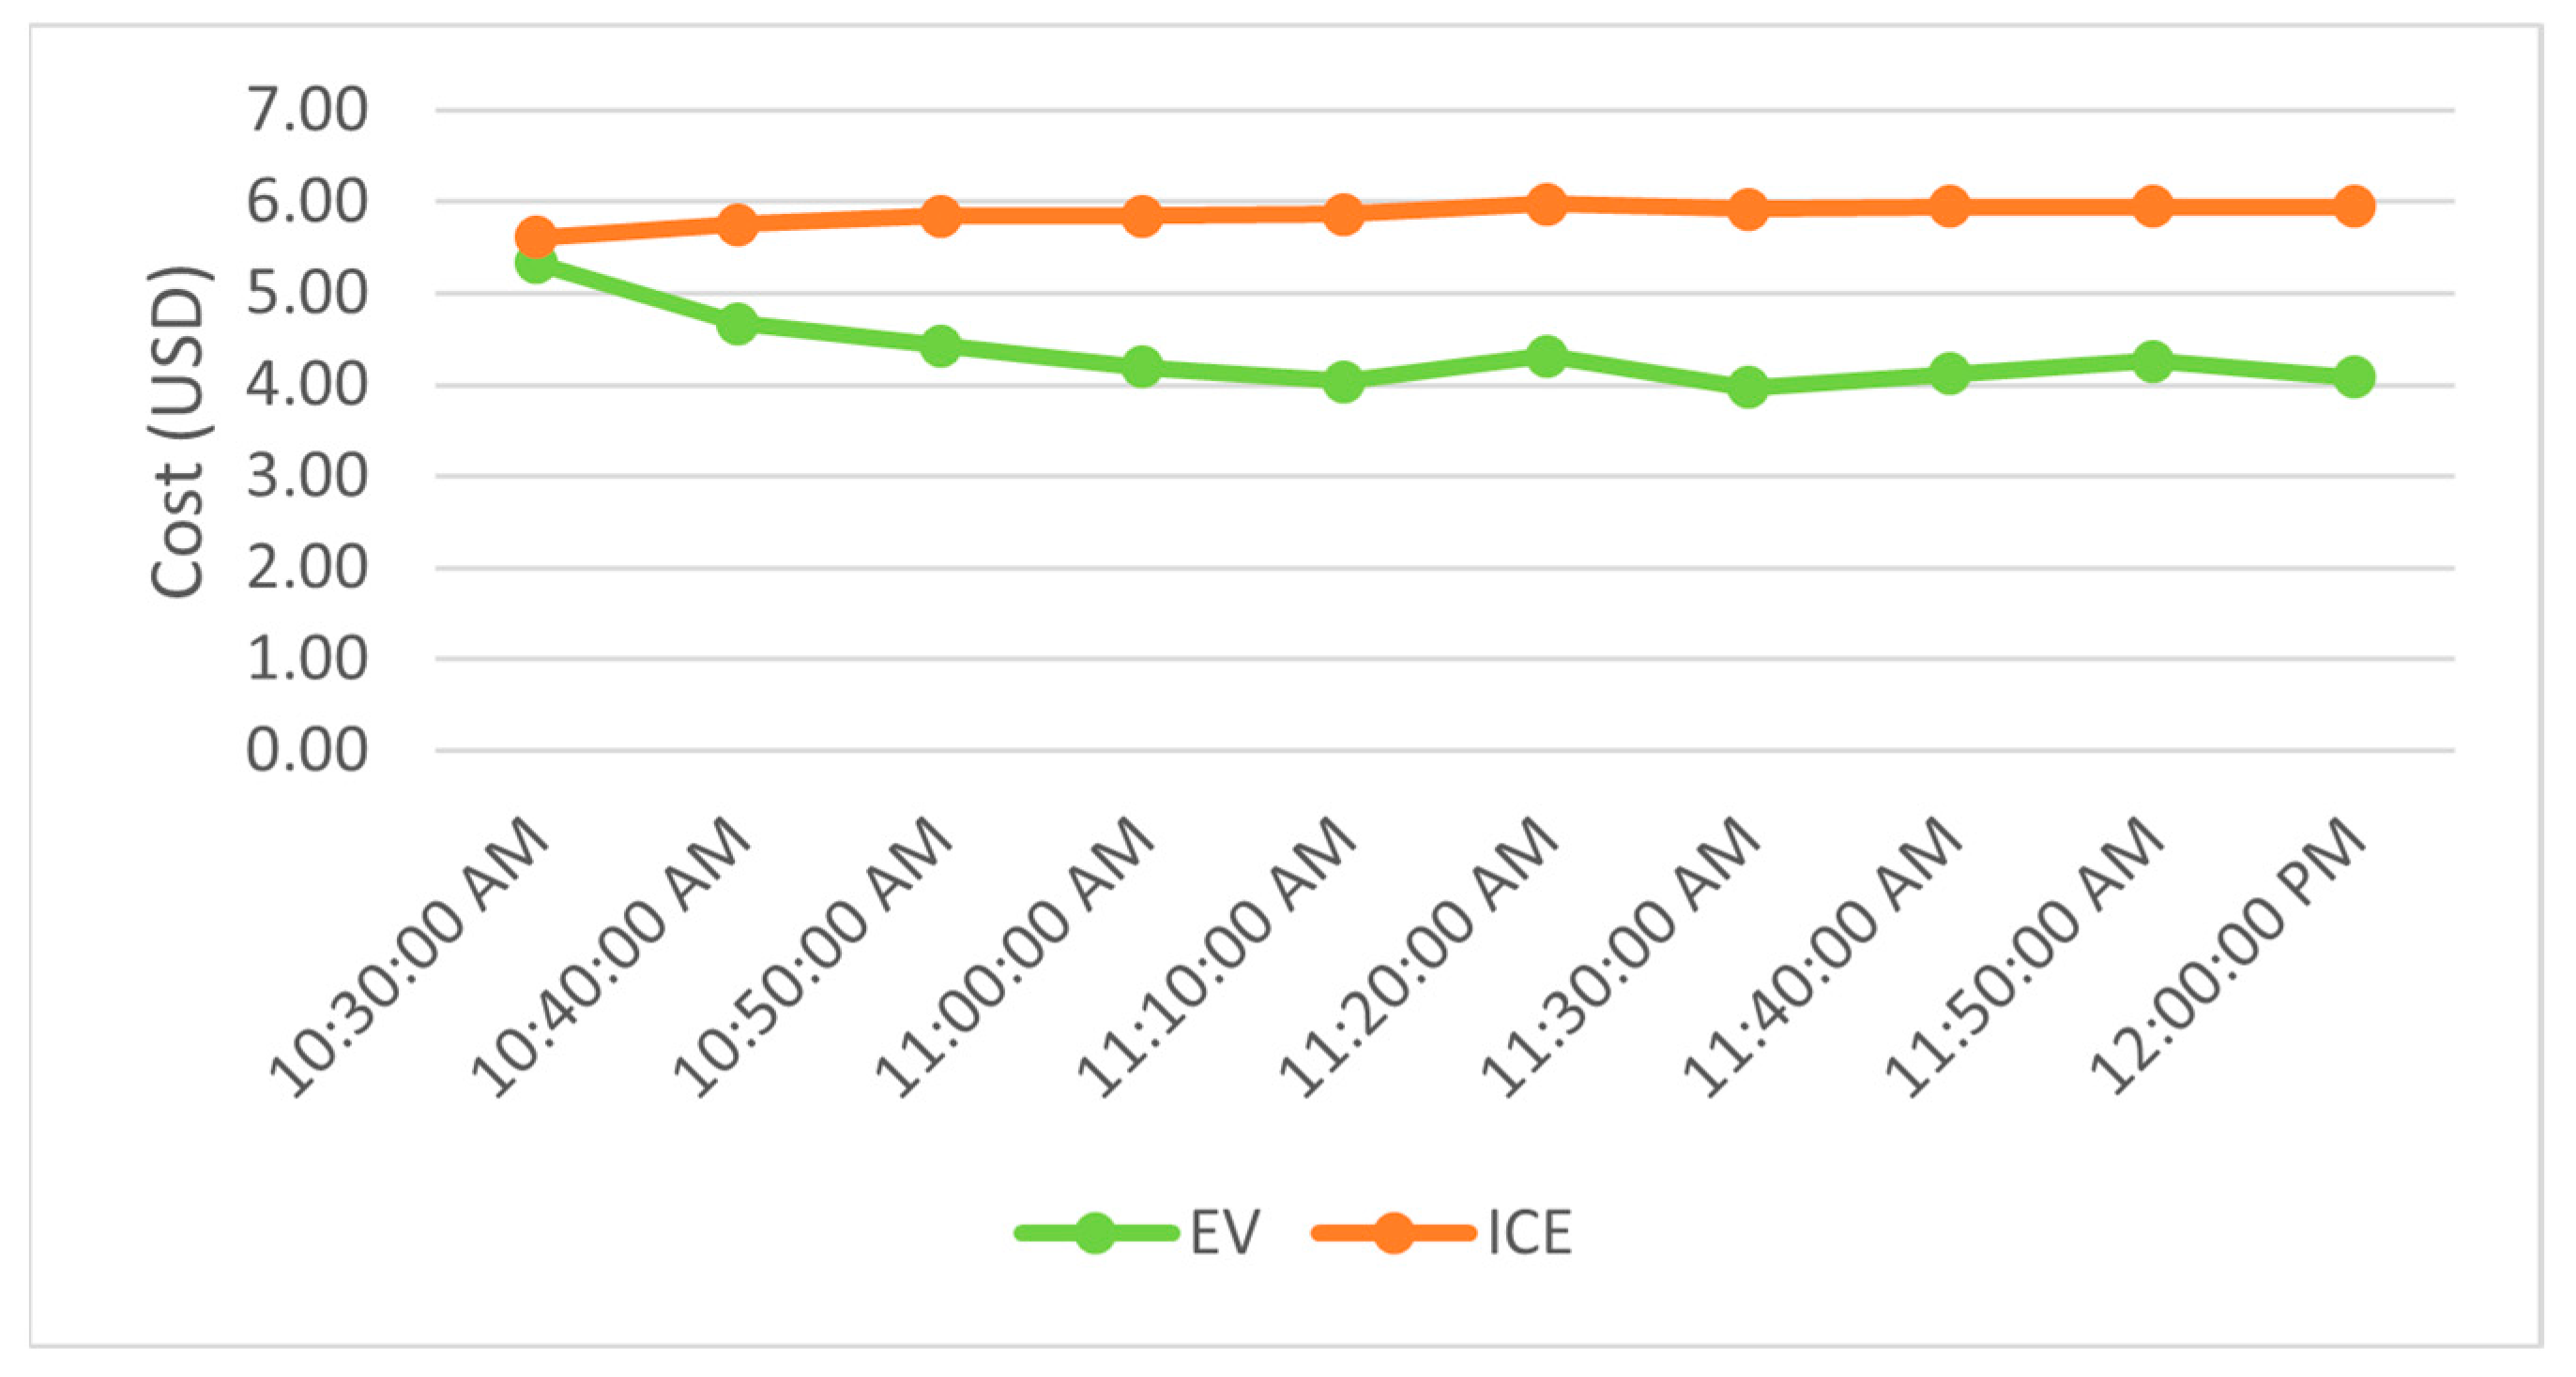
The total cost of petrol for ICEVs was USD 927.83, while for EVs, it was USD 681.56 for a total distance of 37,933.37 km and 36,762.57 km, respectively Figure 24 shows the average fuel and energy cost for both vehicles at each time interval. The cost of energy for EVs at 10:30 a.m. was USD 0.27. The cost was less than ICEVs due to the higher speed of the EVs and the higher density of the network, thereby contributing to the high energy consumption. However, an average of 26% of fuel cost was saved when driving an EVs on a 234.15 km long-distance highway travel.
The recharging cost was zero if the EVs were recharged by using ChargeEV, which had a yearly subscription of USD 54.18 for unlimited charging. Otherwise, the rate of charging depended on the charging rate. However, the average battery consumption to travel from the origin to the destination for this Scenario 1 was 33.67 kWh. Taking Nissan Leaf with a 40 kWh battery capacity as a subject, it required one stop for a recharge. However, with good driving behavior, Nissan Leaf can travel up to 311 km, which is enough energy to reach the destination in the current scenario.
Driving EVs saved approximately 41% of the petrol cost that ICE bear. Figure 25 shows the cost comparison by each vehicle traveling at each time interval. The cost fluctuates based on the road condition, which includes road density and speed. The average battery consumption to travel from origin to destination for this scenario was 3.83 kWh, which not required recharging for most EVs in the market. For instance, a 40 kWh Nissan Leaf used 9.6% battery for a one-way travel journey, and a return journey consumed less than half of the battery capacity. The charging cost was not considered in this scenario, as the charging can be conducted at home.
Figure 26 shows the cost comparison between both EVs and ICEVs. Driving EVs in Scenario 3 saved an average of 64 percent of the petrol cost. The total cost of petrol for ICEVs was USD 271.66, while for EVs, it was USD 97.69. This Scenario will not require any recharging as the average battery consumption for EVs was only 2 kWh. The charging could be performed at home or at a public charging station that is scattered around near the destination.
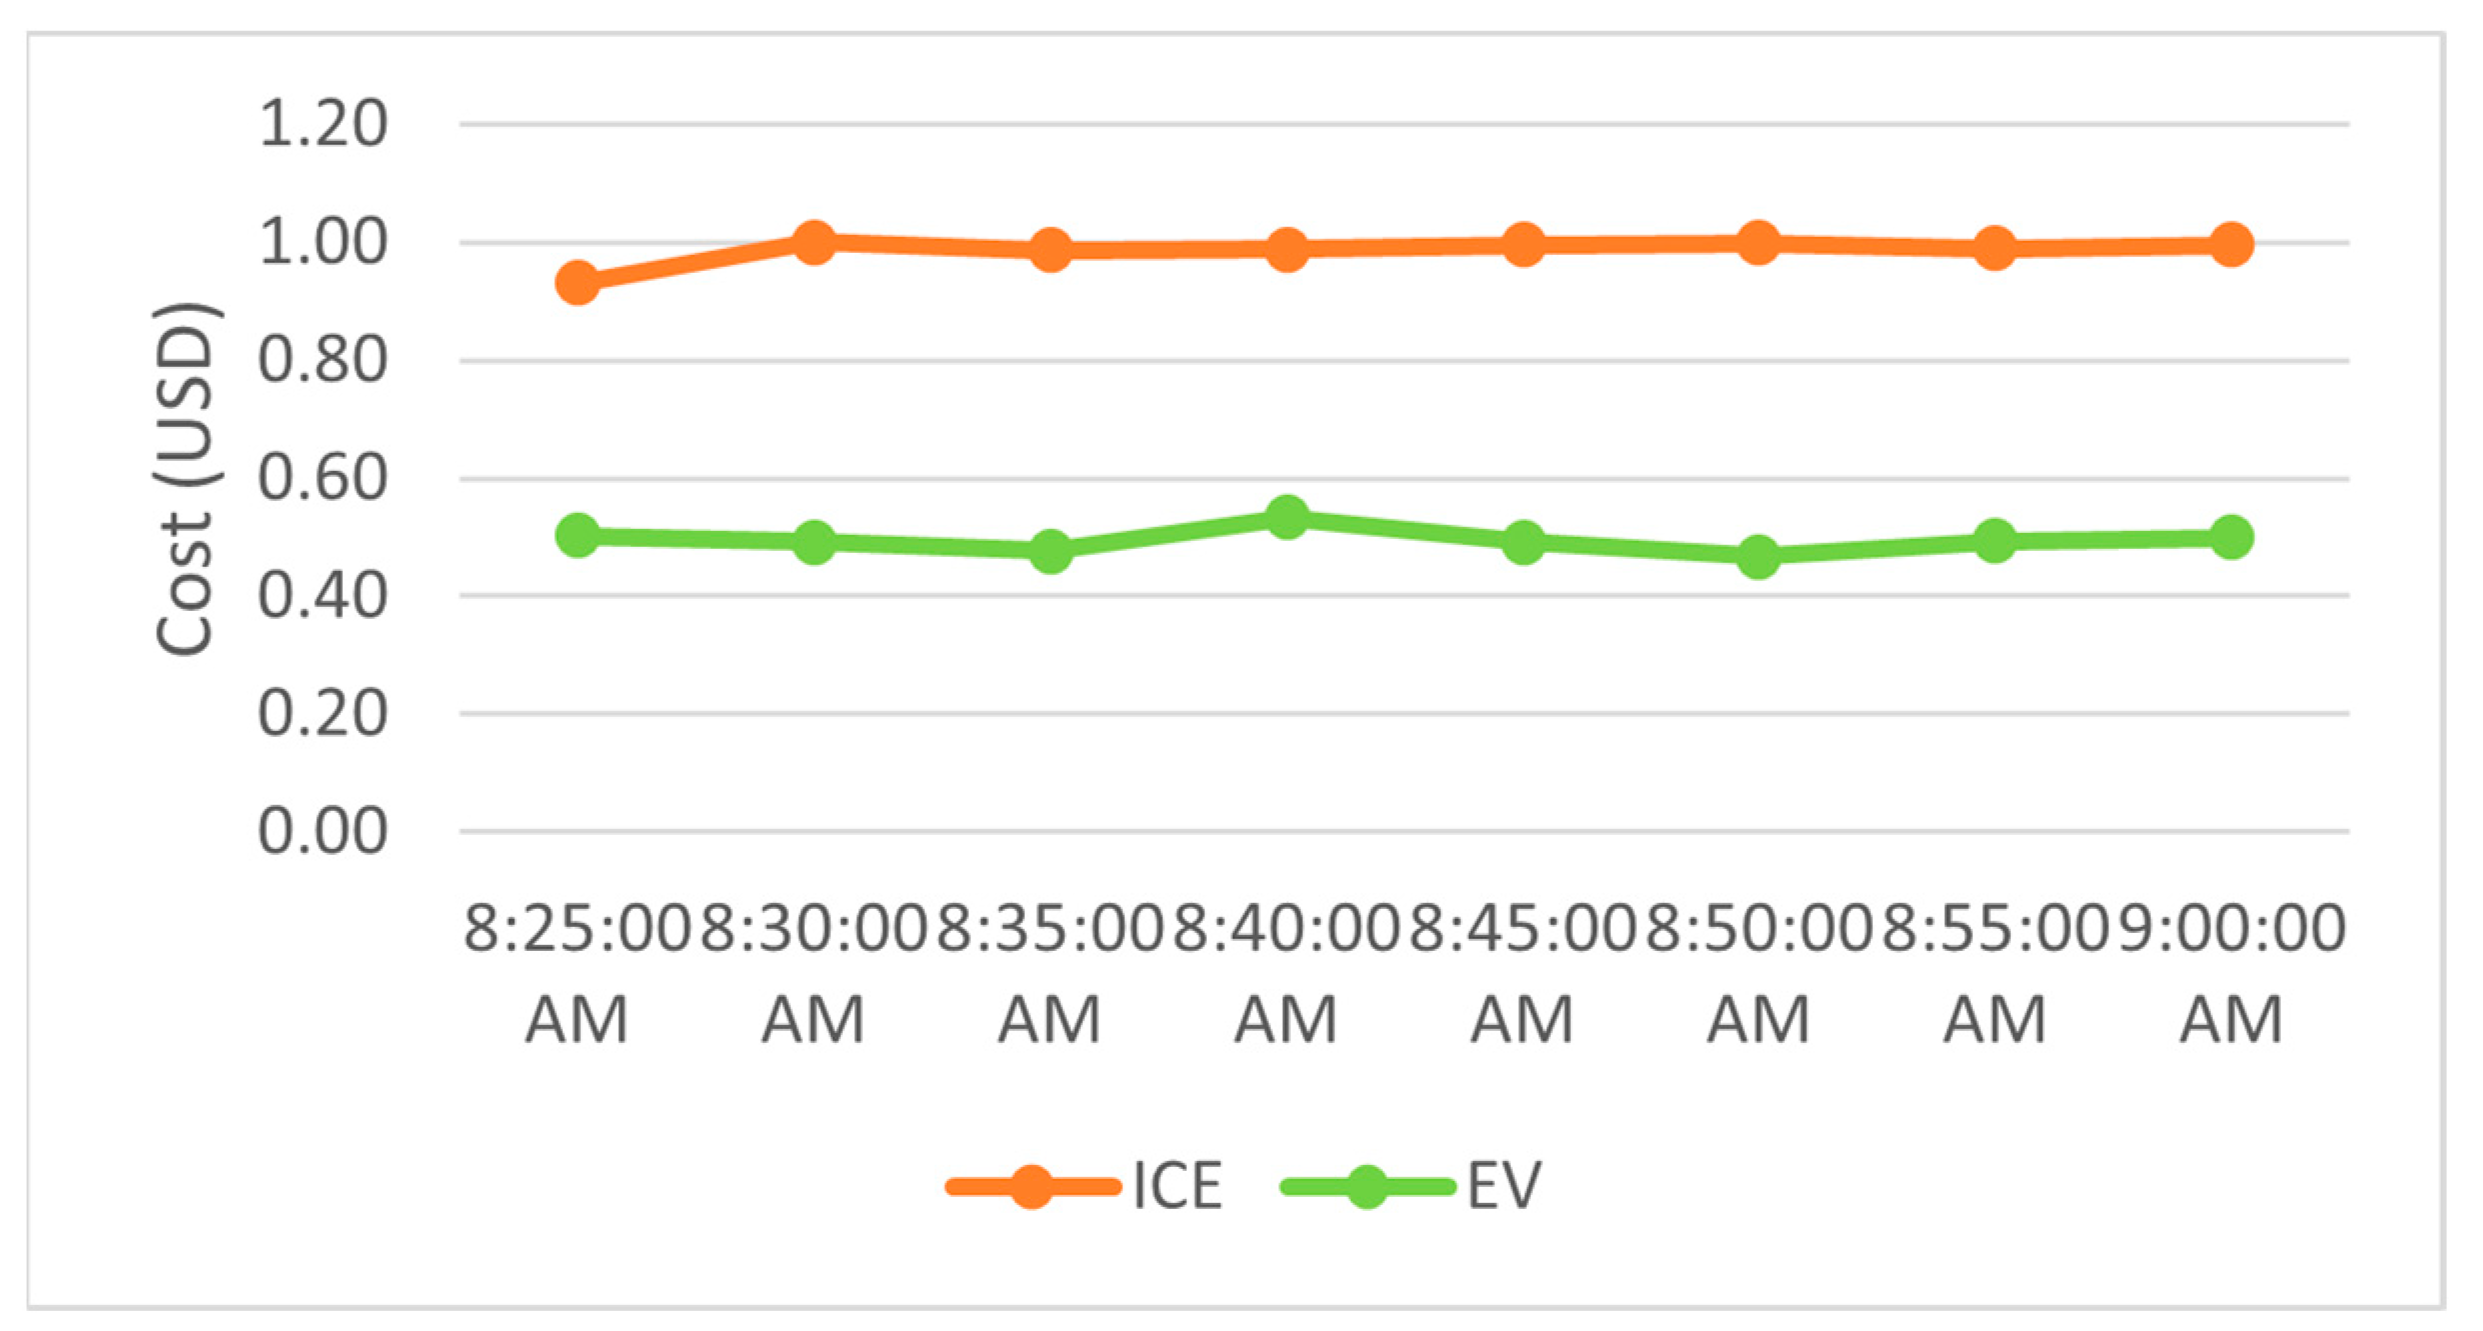
Driving EVs instead of ICEVs saved 85 percent of energy in Scenario 4, which can be seen in the Figure 27. Driving EVs consumed lower energy compared to ICEVs at all time intervals. Apart from that, 61% can be saved from the fuel cost of driving ICEVs. Although the cost of energy of EVs fluctuates over time, it is still lower than ICEVs. The fuel cost at 8:30 a.m. increased from USD 5.19 to USD 7.73 due to the lower fuel consumption and low travel distance.
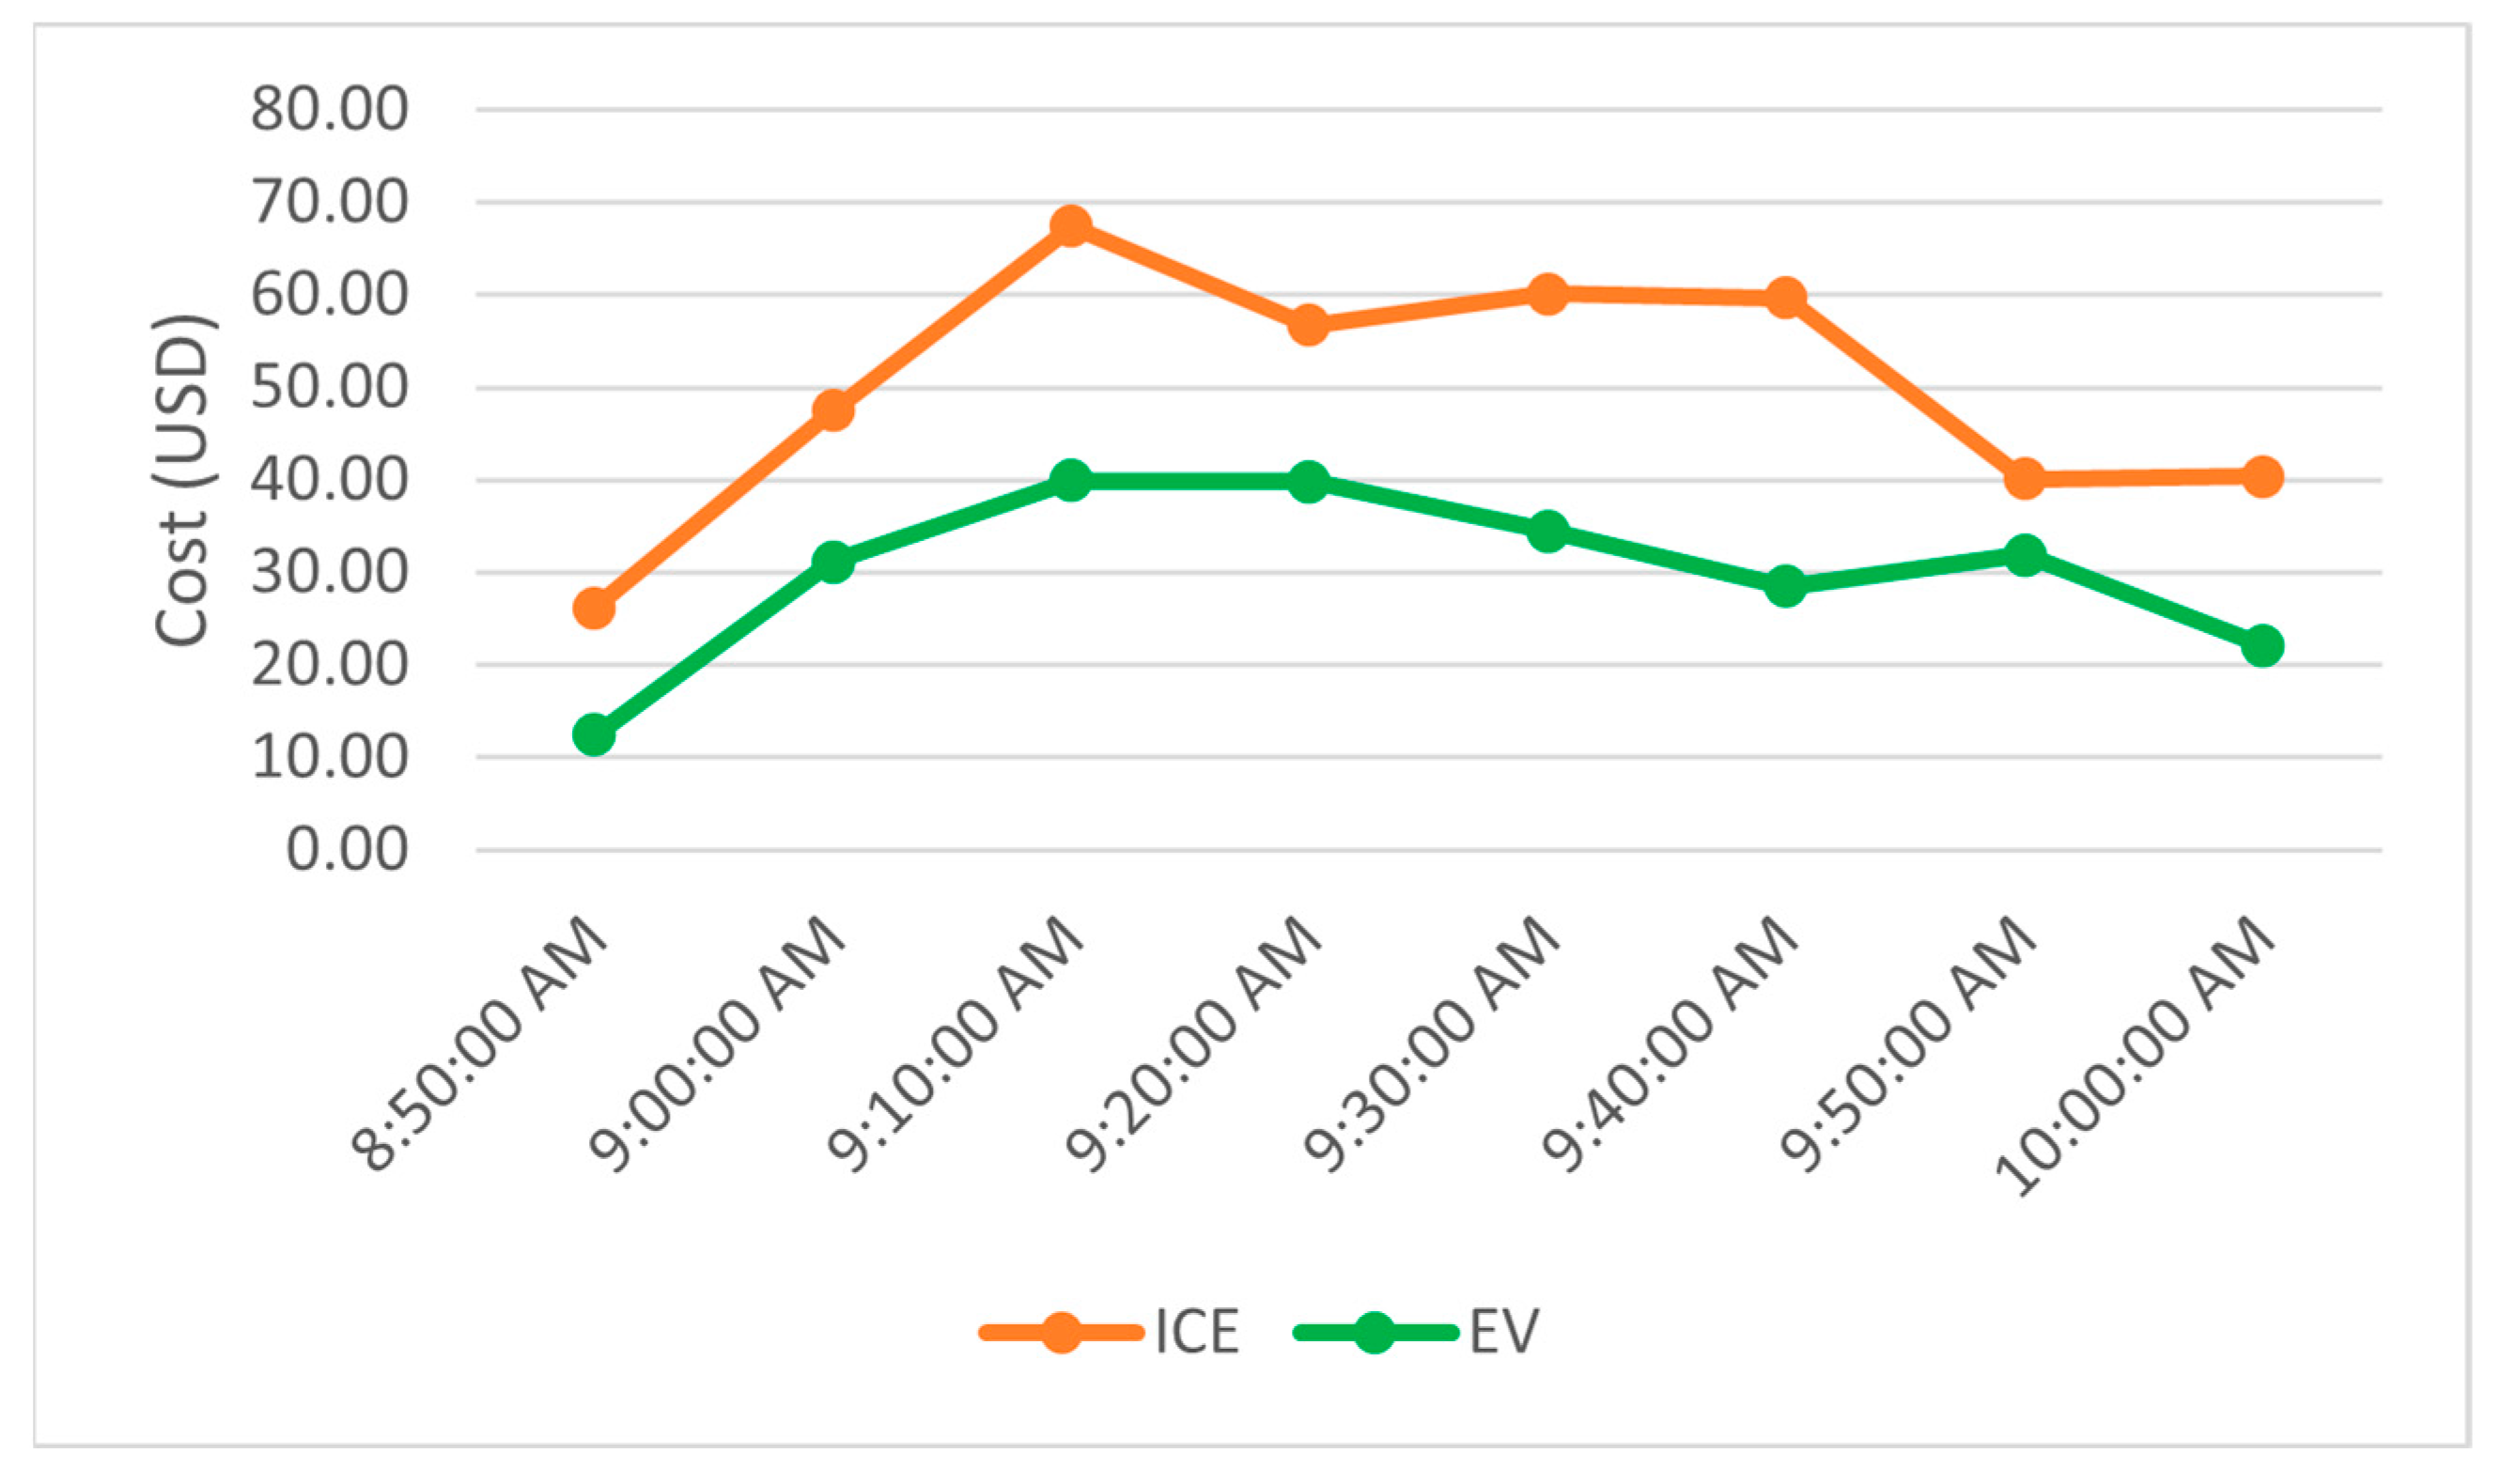
Driving EVs saved approximately 39% of petrol costs in Scenario 5 (Figure 28). This cost was affected by the number of stops, lane changes, and density. The total cost of petrol was USD 397.87, while the cost of energy for EVs was USD 240.18. To travel in this Scenario, the average battery consumption was 5.6 kWh for EVs. EVs did not require any recharging as most battery capacity of EVs in the Malaysian market could cater to this consumption.
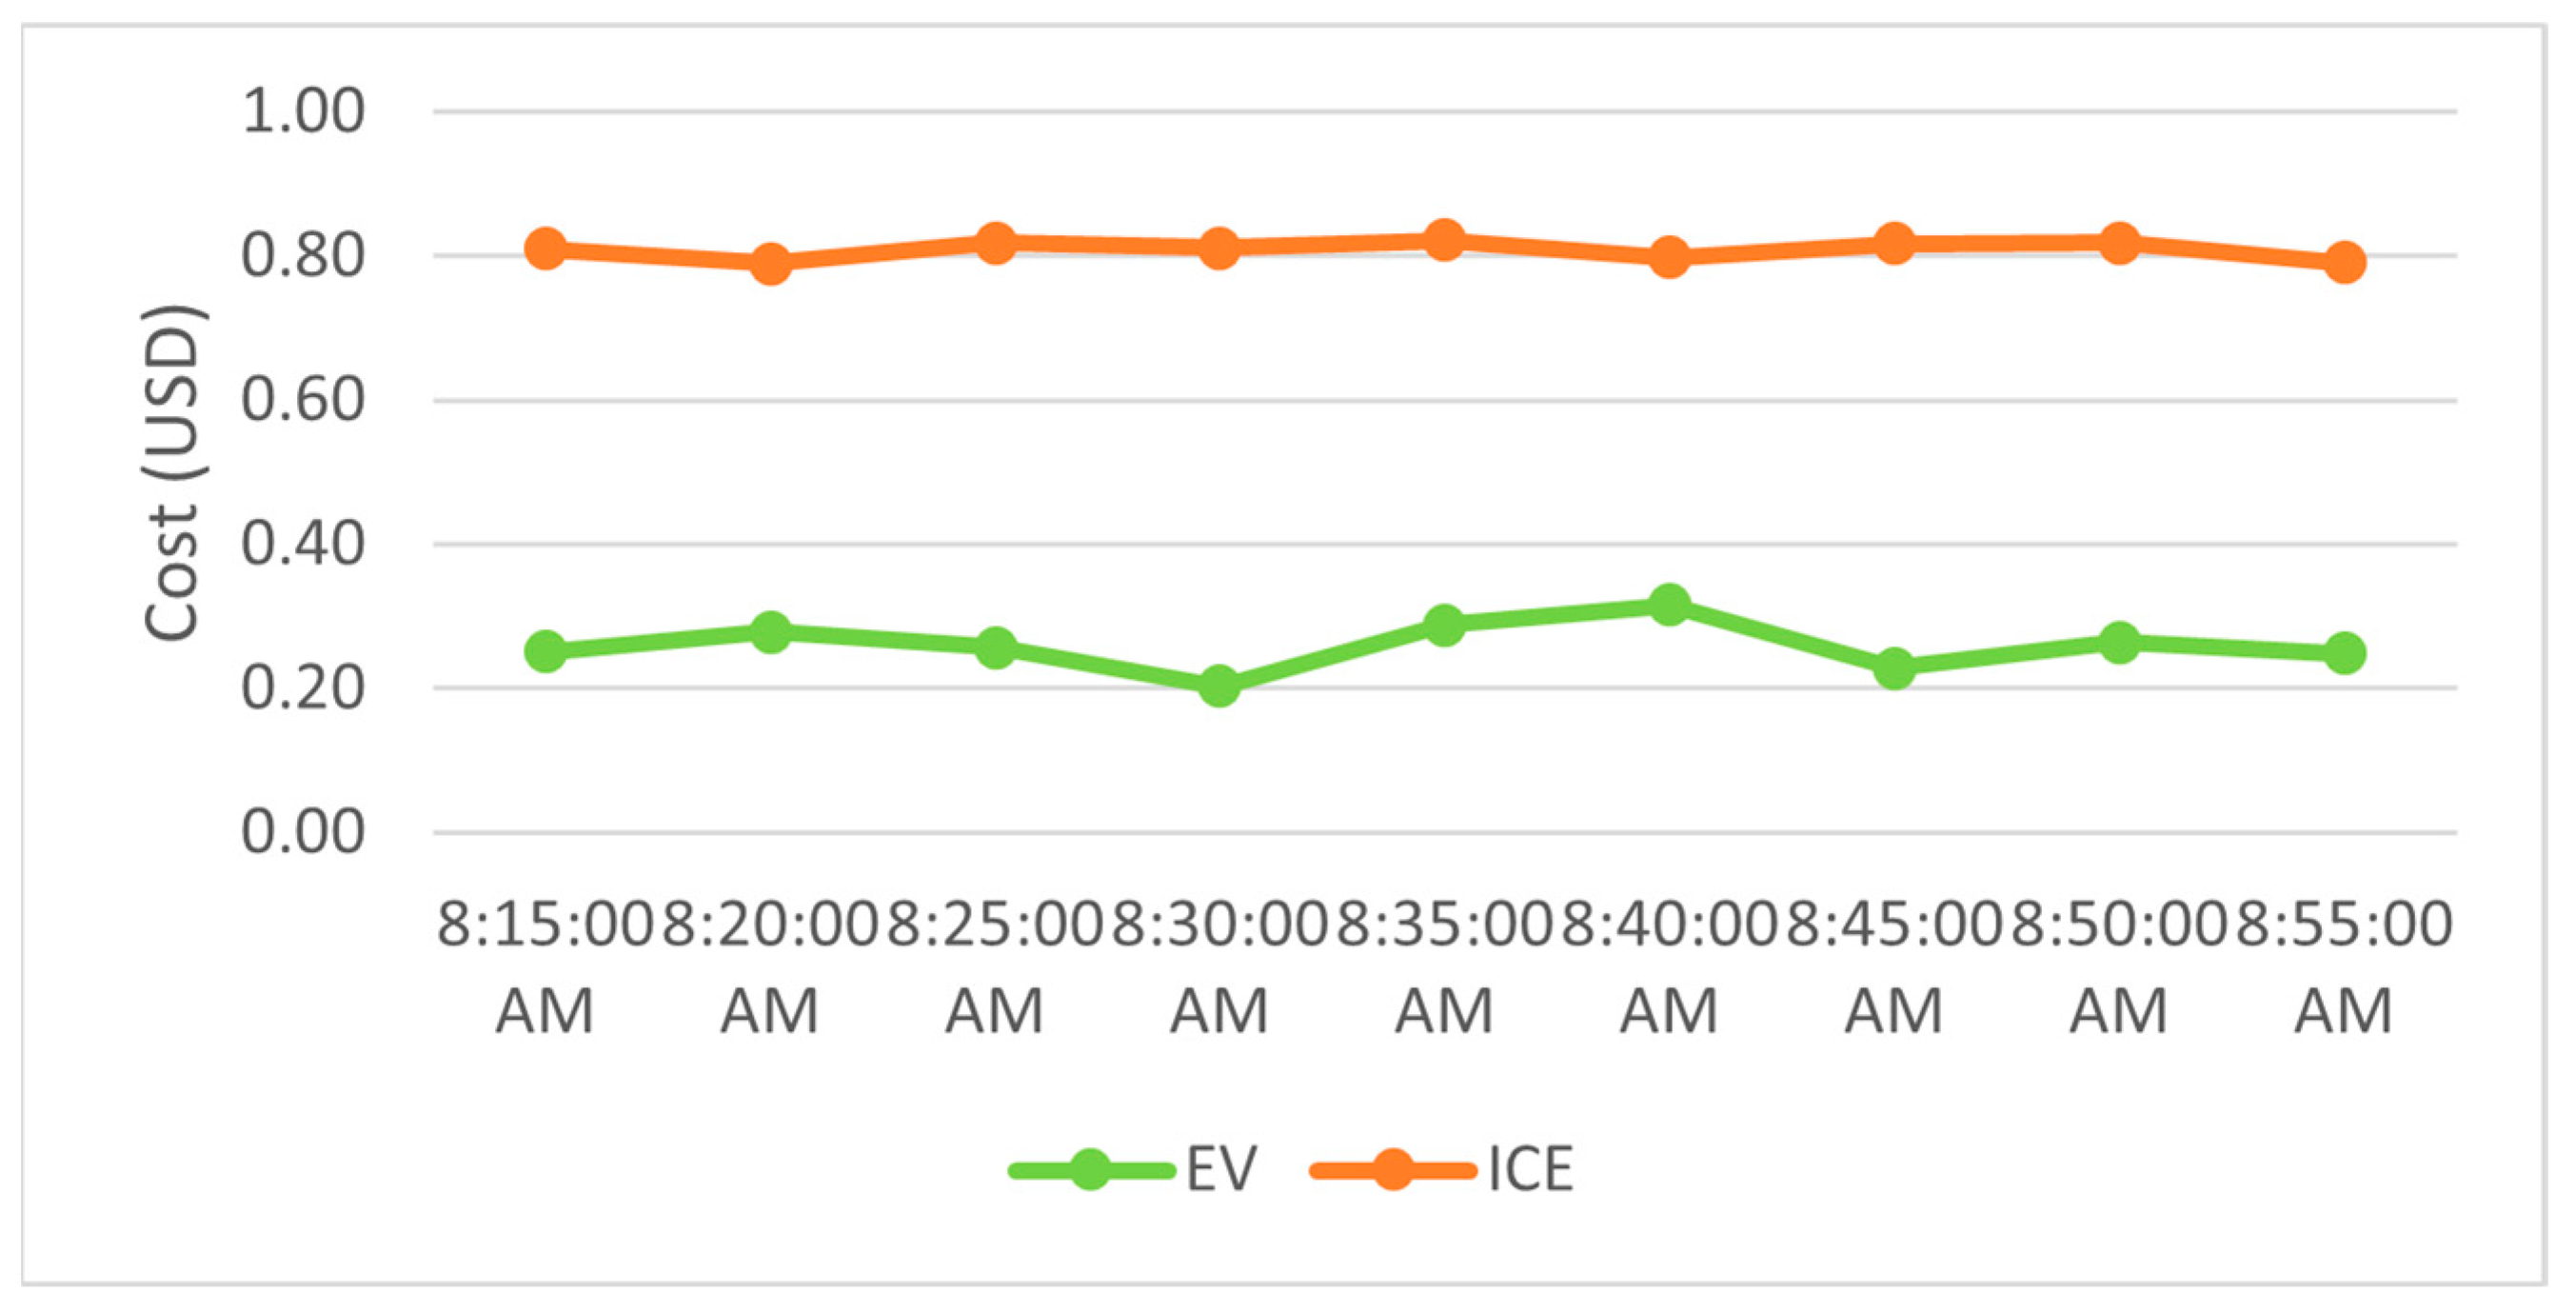
Driving EVs in this Scenario 6saved an average of 59 percent of the petrol cost (Figure 29). The cost fluctuated depending on the petrol consumption, energy consumption, and distance traveled. For instance, at 8:45 a.m., the cost of petrol was USD 15.54, while the cost of energy for EVs was USD 11.84. This was because the distance traveled by ICEVs was only 451.64 km, thus consuming less petrol compared to other time intervals. The same applies to EV; the distance traveled at 8:45 a.m. was the furthest compared to other time intervals, which was 886.63 km, thus consuming more energy. The total petrol cost for ICEVs was USD 177.88, and for EVs, it was USD 73.78. EVs did not require any recharging to travel from the origin to the destination.

3.3. Environmental Impact on Different Route Conditions

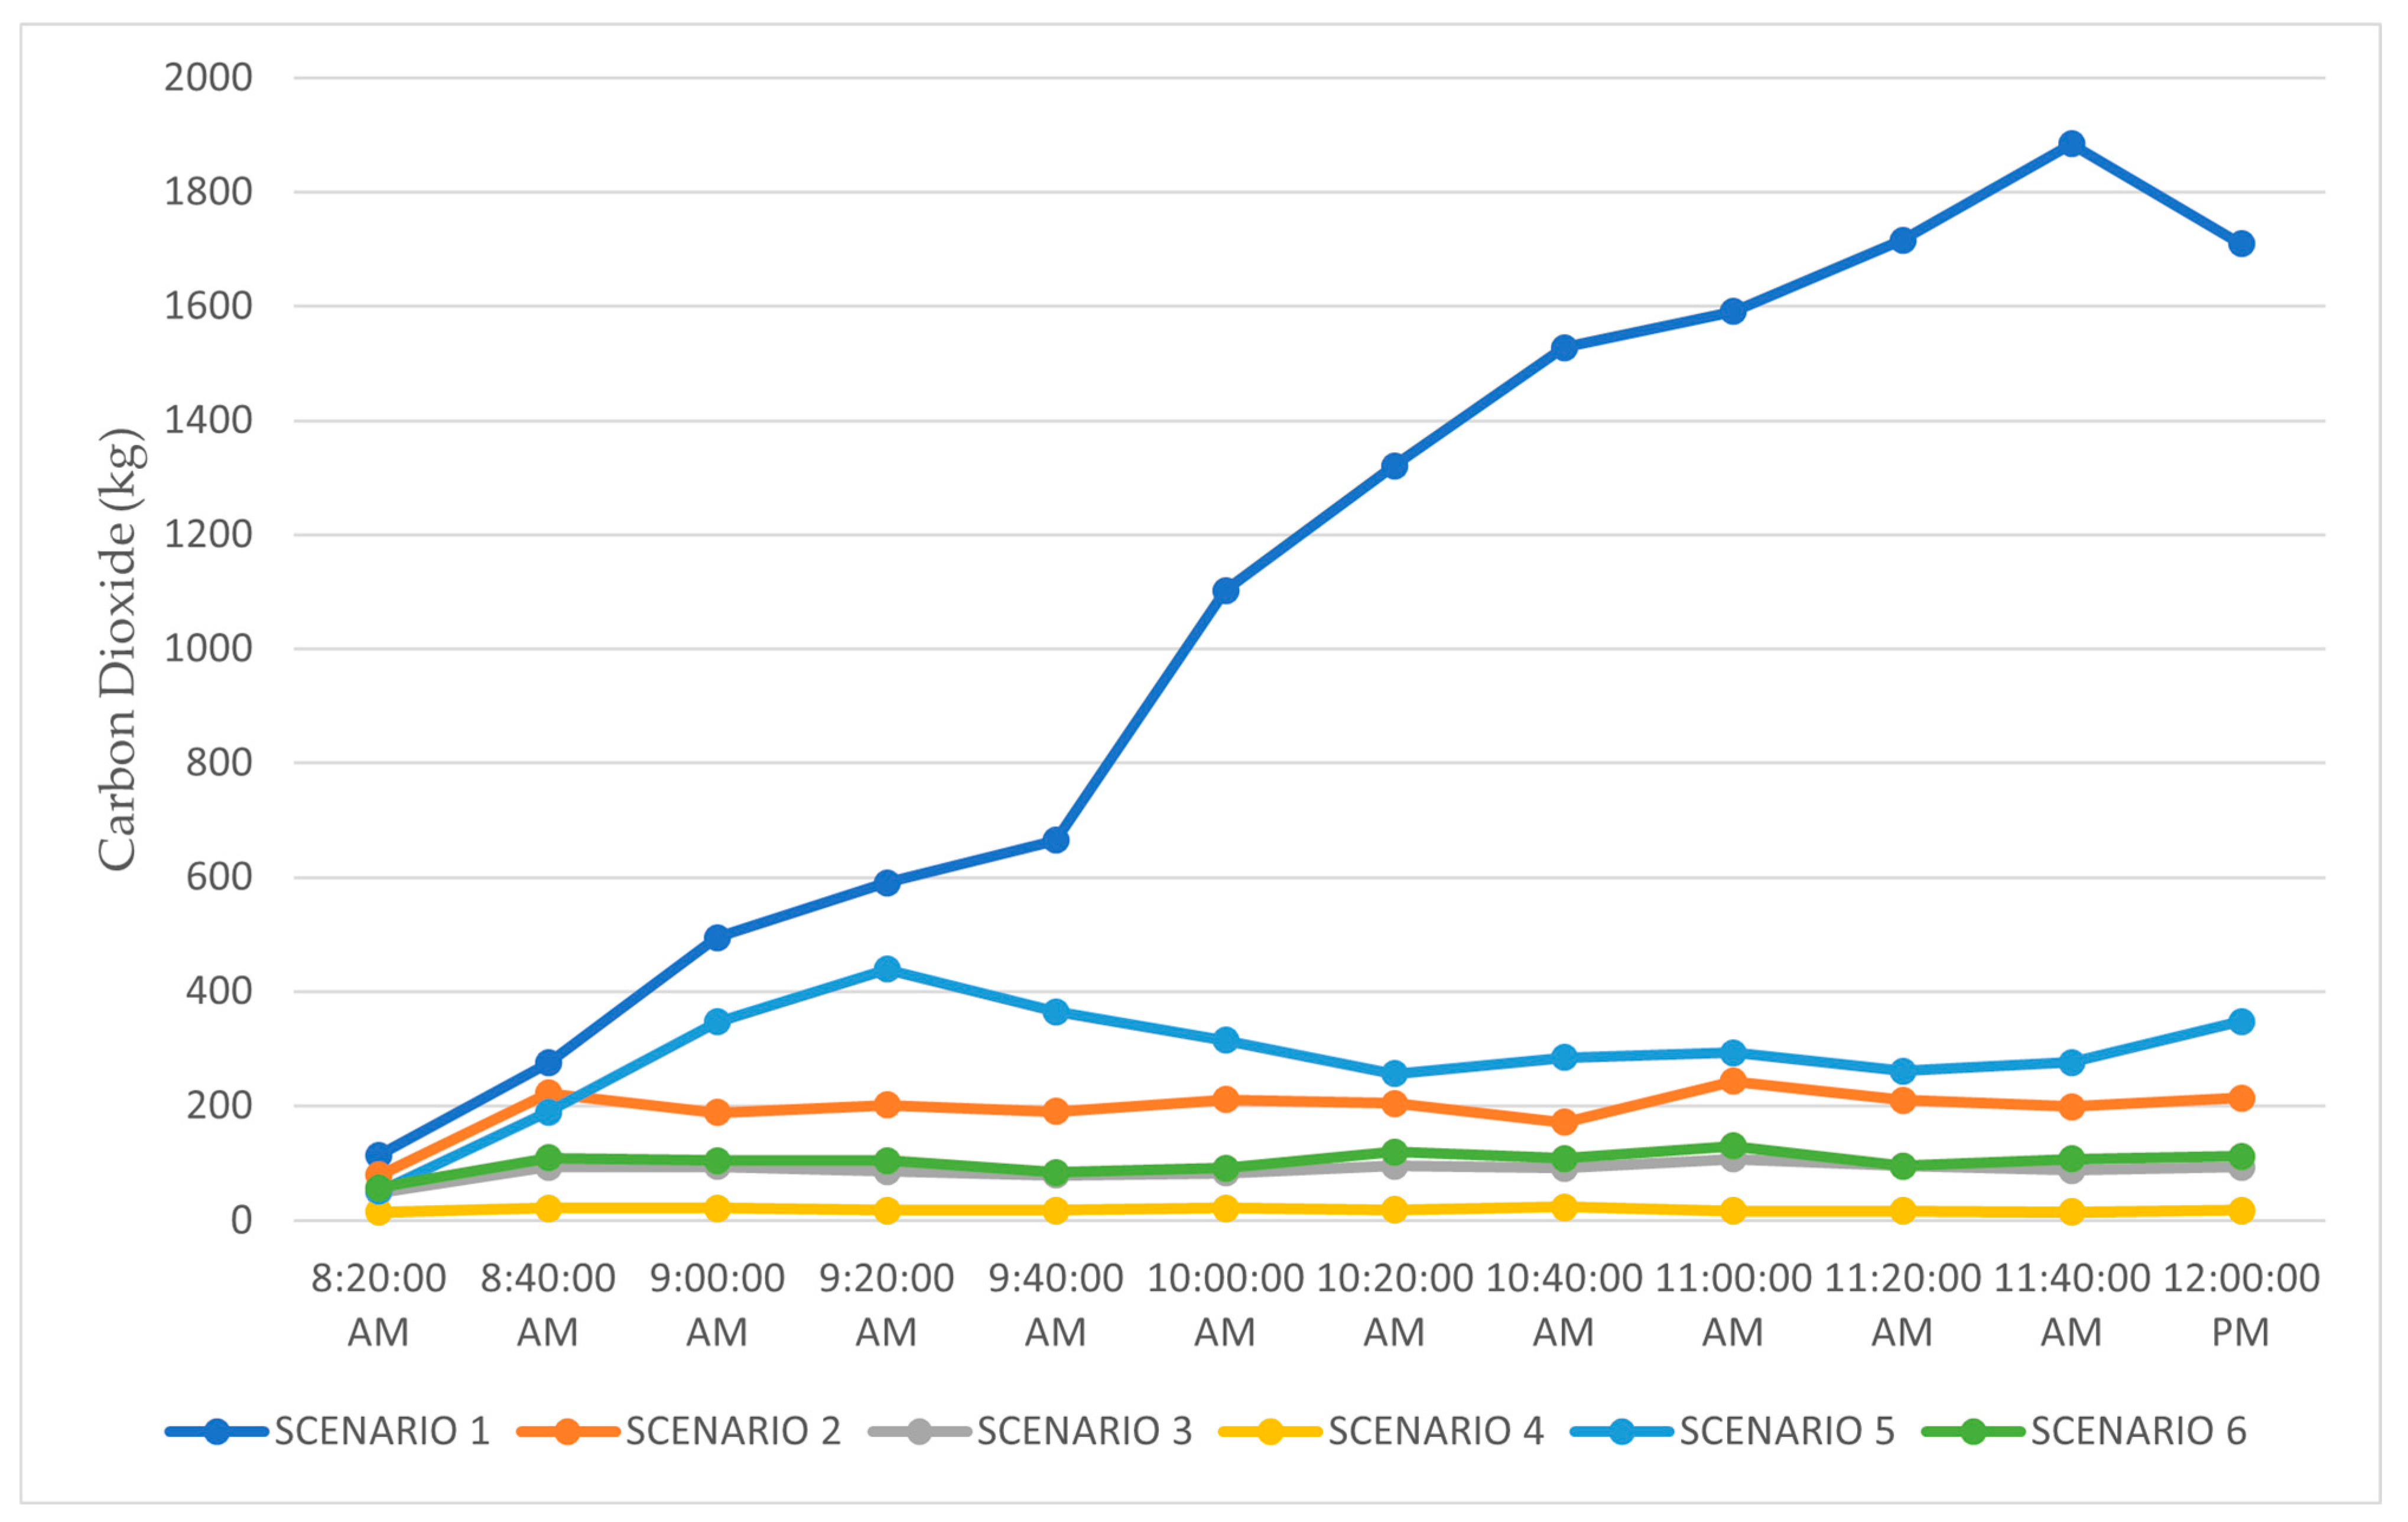
The carbon dioxide emission generated by ICE in all scenarios is shown in Figure 30. The highest emitter of carbon dioxide was from Scenario 1, which was 12,989.43 kg for the entire 36,762.56 km journey. This accounted for 0.35 kgCO2 for each km traveled in this scenario. The carbon dioxide emission for Scenario 1 increased after 9:40 a.m. due to the increased number of vehicles that had completed the journey and the high number of vehicles that were still in the network, driving to the destination. Apart from that, compared to other scenarios, Scenario 1 had the highest travel distance. The high number of different variables contributed to the increase in emissions.
The second highest accumulated carbon dioxide is Scenario 5, followed by Scenario 2. It is worth noting that these three highest carbon dioxide emitters in those travel distances were more than 30 km from origin to destination. These results are comparable to a study conducted in [50,51], which concluded that longer car trips resulted in a 44 percent increase in carbon dioxide emissions, while short trips were only responsible for 10 percent of carbon dioxide emissions. Therefore, Scenarios 3, 4, and 6, which were considered short trips, contributed to the least emission in this study.
As for EVs, the carbon dioxide emissions by EVs were relatively low for all scenarios simulated. The carbon dioxide emission associated with each scenario is compared in Table 5.
The United States Environmental Protection Agency (EPA) stated a few ways to reduce greenhouse emissions in the transportation sector, which include reducing the number of miles traveled by a vehicle, using more advanced technology and hydrogen vehicles, using lower carbon transportation fuel, and using public transportation [52]. A study on multimodality and unimodality of transportation against carbon emissions revealed that carbon dioxide emissions are highly related to distance travel [53], which explains that higher distance travel contributes to higher carbon dioxide emissions.
Scenarios 3 and 6 had similar carbon dioxide emissions due to the distance traveled from origin to destination being approximately the same at 14 km. However, Scenario 6 accumulated higher due to the three roundabouts, which increased the fuel consumption of the vehicle and directly affected carbon dioxide emission. The total carbon dioxide emission from two traffic lights in Scenario 3 is 191.79 kg, while the amount of carbon dioxide emissions for Scenario 6 was 250.08 kg. These two scenarios had two different traffic management, and the roundabout emitted higher CO2 than traffic lights due to the braking and accelerating before and after entering the roundabout.
Scenario 4 emitted the lowest carbon dioxide compared to other scenarios due to the shorter simulated distance, although having two traffic lights along the road. This shows that the carbon dioxide emission from vehicles was affected by the distance traveled, traffic management system, and vehicle speed.

3.4. Overall Comparison of the Different Scenarios

Table 6 concludes that, electric vehicle provides better energy consumption compared to ICE while remaining at a lower cost of energy compared to ICE. In all scenarios, Scenario 3 had the highest energy saving while the least energy saving was in Scenario 1. Apart from that, switching from ICEVs to EVs in all scenarios saved costs, with the least cost saving being from Scenario 1, while the highest cost saving was from Scenario 3. Driving in a sub-urban area with long-distance travel offered the highest cost saving, while the least cost saving was driving on a long-distance highway, followed by driving in a suburban area with a long-distance journey.
Apart from that, traffic management, such as roundabouts and traffic lights, impacted both vehicles. This can be seen from the result for Scenario 3 and Scenario 4, as traffic light favors EVs in terms of energy consumption. At Traffic Light 1 in Scenario 3, it consumes 1.32 kWh of battery for 502 vehicles that stopped on average for 22.36 s, compared to ICEVs, which consumed 15.5 L (138.26 kWh) for 464 vehicles. The number of EVs that used the traffic light was also less than ICEVs, but ICEVs consumed more energy than EVs.

3.5. Validation Result

The distance traveled, the average speed, and the time to the destination by both simulation and experimental have a slight difference, especially in Scenario 3 as shown in Table 7. This is due to the traffic condition from the origin to the destination, and the traffic congestion resulted in the slower movement of vehicles, thus affecting the time taken to the destination. However, due to slow movement and the stop-and-go driving condition, Nissan Leaf could save energy and have similar energy consumption with the simulated EVs.
Table 8 shows the results of energy consumption from the software and experiment. For all three scenarios, the results have a slight difference (0.05 kWh/km). For Scenario 2, energy consumption in the experiment is higher due to the slower speed used, resulting in a longer time to destination and slightly higher energy consumption. Scenario 3, on the other hand, experienced lower energy consumption due to the traffic congestion in some areas and stop-and-go conditions that required regenerative braking, thereby saving energy. Scenario 4 had the highest difference in energy consumption compared to the simulation. This is because the time taken to the destination was faster than the simulation, resulting from the no-stopping at traffic lights. As a result, the findings from the simulation and the experiment from real-world driving were similar, as the AIMSUN simulation software provided an accurate estimation of energy consumption based on real-world conditions.
In short, when both EVs and ICEVs are compared with the same travel distance as well as the same route, the difference in financial and time taken to the destination can be determined.

4. Conclusions

The use of EVs in terms of operational energy costs is feasible in Malaysia because the roads in Malaysia are mostly flat, thereby consuming less energy. This is evidenced by an average savings of USD 702.78, or about 38 percent, from the six scenarios studied in the current study. The current study reveals that 73 percent of energy was saved, and 19,827.73 kg of carbon dioxide emissions can be avoided if EVs were used in all scenarios. In addition, 26,571.50 kWh of electricity could be generated if the carbon dioxide emitted was to be converted to electricity. In general, EVs have the potential to yield significant cost savings for their owners, particularly in urban settings. This is due to the reduced energy consumption during travel, particularly during peak hours.
Despite progress made by the EVs, Malaysia still faces challenges in promoting the adoption of EVs. For example, the matter of electric vehicle ownership poses fewer challenges for individuals who reside in detached dwellings compared to those who live in multi-story buildings, where charging infrastructure is restricted for high-rise residential units. This necessitates the implementation of various measures such as incentives, the development of an EVs cloud system, and the establishment of adequate EVs infrastructure, particularly charging stations, to encourage more individuals to transition to EVs.
It is recommended that for future research endeavors, the inclusion of charging cost in the total cost calculation would render a more comprehensive total cost. In addition, a comprehensive assessment of the life cycle expenses can be conducted by taking into account the actual environmental effects of EVs in conjunction with the incorporation of mixed generation into the grid, as well as the influence of peak and off-peak charging for EVs.

Author Contributions

Conceptualization, M.H. and J.S.; methodology, M.H.; software, N.A.Q.M.; formal analysis, N.A.Q.M.; data curation, N.A.Q.M.; writing—original draft preparation, N.A.Q.M.; writing—review and editing, M.H. and J.S.; supervision, M.H. and J.S. All authors have read and agreed to the published version of the manuscript.

Funding

This research received no external funding.

Data Availability Statement

Not applicable.

Conflicts of Interest

The authors declare no conflict of interest in the manuscript.

References

  1. Abdul Razak, N.A.; Ismail, R.; Abdul Hakim, R. Is There a Case for Fuel Subsidy Removal in Malaysia? J. Econ. Financ. Stud. 2014, 2, 1–13. [Google Scholar] [CrossRef] [Green Version]
  2. Moody, J.; Farr, E.; Papagelis, M.; Keith, D.R. The value of car ownership and use in the United States. Nat. Sustain. 2021, 4, 769–774. [Google Scholar] [CrossRef]
  3. U.S. Department of Energy. All-Electric Vehicles. Available online: https://www.fueleconomy.gov/feg/evtech.shtml (accessed on 20 December 2022).
  4. Treiber, M.; Kesting, A.; Thiemann, C. How Much does Traffic Congestion Increase Fuel Consumption and Emissions? Applying a Fuel Consumption Model to the NGSIM Trajectory Data. In Proceedings of the 87th Annual Meeting of the Transportation Research Board, Washington, DC, USA, 13–17 January 2007. [Google Scholar]
  5. Massachusetts Institute of Technology (MIT CSHub). The Impact of Traffic Jams on PVI Estimates. 2015. Available online: https://cshub.mit.edu/sites/default/files/documents/3%20CSHub%20Research%20Brief%20-%20Iss.%203%202015%20-%20PVI%20Velocity%20Distributions.pdf (accessed on 2 February 2023).
  6. Burlando, C.; Ivaldi, E.; Parra Saiani, P.; Penco, L. To own or not to own? Car ownership and consumer awareness: Evidence from an Italian survey. Res. Transp. Bus. Manag. 2019, 33, 100435. [Google Scholar] [CrossRef]
  7. Tenaga, S. Malaysia Energy Statistics Handbook 2020; Energy Commission: Putrajaya, Malaysia, 2020.
  8. Teixeira, A.C.R.; Sodré, J.R. Impacts of replacement of engine powered vehicles by electric vehicles on energy consumption and CO2 emissions. Transp. Res. Part D Transp. Environ. 2018, 59, 375–384. [Google Scholar] [CrossRef]
  9. Aasness, M.A.; Odeck, J. The increase of electric vehicle usage in Norway—Incentives and adverse effects. Eur. Transp. Res. Rev. 2015, 7, 1–8. [Google Scholar] [CrossRef] [Green Version]
  10. Zacharof, N.G.; Fontaras, G.; Ciuffo, B.; Tsiakmakis, S.; Anagnostopoulos, K.; Marotta, A.; Pavlovic, J. Review of in Use Factors Affecting the Fuel Consumption and CO2 Emissions of Passenger Cars; Publications Office of the European Union: Luxembourg, 2016. [Google Scholar]
  11. Zhou, M.; Jin, H.; Wang, W. A review of vehicle fuel consumption models to evaluate eco-driving and eco-routing. Transp. Res. Part D Transp. Environ. 2016, 49, 203–218. [Google Scholar] [CrossRef]
  12. Alberto Barbado, Ó.C. Understanding Factors Affecting Fuel Consumption of Vehicles Through Explainable AI: A Use CaseWith Explainable Boosting Machines. 2021. Available online: https://www.researchgate.net/publication/353235325_Understanding_Factors_Affecting_Fuel_Consumption_of_Vehicles_Through_Explainable_AI_A_Use_Case_With_Explainable_Boosting_Machines (accessed on 3 February 2023).
  13. Miller, V. The Impact of Stopping on Fuel Consumption. 2011. Available online: http://large.stanford.edu/courses/2011/ph240/miller1/#:~:text=Therefore%2C%20each%20time%20a%20car,of%20one%20gallon%20of%20gasoline (accessed on 5 February 2023).
  14. Ronaldo, A. Comparison of the Two Microsimulation Software Aimsun & Sumo for Highway Traffic Modelling. 2012. Available online: https://www.diva-portal.org/smash/record.jsf?pid=diva2%3A555913&dswid=5354 (accessed on 21 February 2023).
  15. Mitroi, I.S.; Ciobîcă, A.M.; Popa, M. Car-Following Models Comparison between Models Used by VISSIM and AIMSUN. UPB Sci. Bull. Ser. D 2016, 78, 71–82. [Google Scholar]
  16. Lu, X.Y.; Lee, J.; Chen, D.; Bared, J.; Dailey, D.; Shladover, S.E. Freeway Micro-simulation Calibration: Case Study Using Aimsun and VISSIM with Detailed Field Data. In Proceedings of the 93rd Annual Meeting of the Transportation Research Board, Washington, DC, USA, 12–16 January 2014. [Google Scholar]
  17. Modi, S.; Bhattacharya, J. A system for electric vehicle’s energy-aware routing in a transportation network through real-time prediction of energy consumption. Complex Intell. Syst. 2022, 8, 4727–4751. [Google Scholar] [CrossRef]
  18. Barceló, J. Microscopic traffic simulation: A tool for the analysis and assessment of its systems. J. Intell. Robot. Syst. 2005, 41, 173–203. [Google Scholar] [CrossRef]
  19. Acuto, F.; Coelho, M.C.; Fernandes, P.; Giuffrè, T.; Macioszek, E.; Granà, A. Assessing the Environmental Performances of Urban Roundabouts Using the VSP Methodology and AIMSUN. Energies 2022, 15, 1371. [Google Scholar] [CrossRef]
  20. Muzir, N.A.Q.; Mojumder, M.R.H.; Hasanuzzaman, M.; Selvaraj, J. Challenges of Electric Vehicles and Their Prospects in Malaysia: A Comprehensive Review. Sustainability 2022, 14, 8320. [Google Scholar] [CrossRef]
  21. Asadi, S.; Nilashi, M.; Iranmanesh, M.; Ghobakhloo, M.; Samad, S.; Alghamdi, A.; Almulihi, A.; Mohd, S. Drivers and barriers of electric vehicle usage in Malaysia: A DEMATEL approach. Resour. Conserv. Recycl. 2022, 177, 105965. [Google Scholar] [CrossRef]
  22. Rahman, A.; Afroz, R.; Alam, A.Z. Development of electric vehicle: Public perception and attitude, the Malaysian approach. World Rev. Intermodal Transp. Res. 2014, 5, 149. [Google Scholar] [CrossRef]
  23. Sang, Y.-N.; Bekhet, H.A. Modelling electric vehicle usage intentions: An empirical study in Malaysia. J. Clean. Prod. 2015, 92, 75–83. [Google Scholar] [CrossRef]
  24. Ayodele, B.V.; Mustapa, S.I. Life Cycle Cost Assessment of Electric Vehicles: A Review and Bibliometric Analysis. Sustainability 2020, 12, 2387. [Google Scholar] [CrossRef] [Green Version]
  25. Salisa, A.R.; Walker, P.D.; Zhang, N.; Zhu, J.G. Comparative Cost-Based Analysis of a Novel Plug-in Hybrid Electric Vehicle with Conventional and Hybrid Electric Vehicles. Int. J. Automot. Mech. Eng. 2015, 11, 2262–2271. [Google Scholar] [CrossRef]
  26. Mamarikas, S.; Doulgeris, S.; Samaras, Z.; Ntziachristos, L. Traffic impacts on energy consumption of electric and conventional vehicles. Transp. Res. Part D Transp. Environ. 2022, 105, 103231. [Google Scholar] [CrossRef]
  27. André, M. The ARTEMIS European driving cycles for measuring car pollutant emissions. Sci. Total Environ. 2004, 334–335, 73–84. [Google Scholar] [CrossRef]
  28. Kara, S.; Li, W.; Sadjiva, N. Life Cycle Cost Analysis of Electrical Vehicles in Australia. Procedia CIRP 2017, 61, 767–772. [Google Scholar] [CrossRef]
  29. Xing, J.; Chu, L.; Guo, C. Optimization of Energy Consumption Based on Traffic Light Constraints and Dynamic Programming. Electronics 2021, 10, 2295. [Google Scholar] [CrossRef]
  30. Kosai, S.; Zakaria, S.; Che, H.S.; Hasanuzzaman, M.; Rahim, N.A.; Tan, C.; Ahmad, R.D.R.; Abbas, A.R.; Nakano, K.; Yamasue, E.; et al. Estimation of Greenhouse Gas Emissions of Petrol, Biodiesel and Battery Electric Vehicles in Malaysia Based on Life Cycle Approach. Sustainability 2022, 14, 5783. [Google Scholar] [CrossRef]
  31. Goetzel, N.; Hasanuzzaman, M. An empirical analysis of electric vehicle cost trends: A case study in Germany. Res. Transp. Bus. Manag. 2022, 43, 100825. [Google Scholar] [CrossRef]
  32. Zammit, E.; Convello, A.; Leone, C.; Longo, M.; Yaici, W.; Foiadelli, F. Cost and Emission Comparison of Long-Distance Travel and Life-Cycle for EV and ICE Vehicle: A Case Study. In Proceedings of the 2022 IEEE International Conference on Environment and Electrical Engineering and 2022 IEEE Industrial and Commercial Power Systems Europe (EEEIC/I&CPS Europe), Prague, Czech Republic, 28 June–1 July 2022; pp. 1–6. [Google Scholar]
  33. Travesset-Baro, O.; Rosas-Casals, M.; Jover, E. Transport energy consumption in mountainous roads. A comparative case study for internal combustion engines and electric vehicles in Andorra. Transp. Res. Part D Transp. Environ. 2015, 34, 16–26. [Google Scholar] [CrossRef] [Green Version]
  34. Ahn, K.; Park, S.; Rakha, H.A. Impact of Intersection Control on Battery Electric Vehicle Energy Consumption. Energies 2020, 13, 3190. [Google Scholar] [CrossRef]
  35. Jonas, T.; Wilde, T.; Hunter, C.D.; Macht, G.A.; Aifadopoulou, G. The Impact of Road Types on the Energy Consumption of Electric Vehicles. J. Adv. Transp. 2022, 2022, 1–14. [Google Scholar] [CrossRef]
  36. Wu, X.; Freese, D.; Cabrera, A.; Kitch, W.A. Electric vehicles’ energy consumption measurement and estimation. Transp. Res. Part D Transp. Environ. 2015, 34, 52–67. [Google Scholar] [CrossRef]
  37. Malaysia, Ministry of Transport. Transport Statistics Malaysia 2021; Ministry of Transport: Putrajaya, Malaysia, 2022.
  38. Hawkins, T.R.; Singh, B.; Majeau-Bettez, G.; Strømman, A.H. Comparative Environmental Life Cycle Assessment of Conventional and Electric Vehicles. J. Ind. Ecol. 2012, 17, 53–64. [Google Scholar] [CrossRef]
  39. Agency, U.S.E.P. (Office of Transportation and Air Quality, United States Environmental Protection Agency). Greenhouse Gas Emissions from a Typical Passenger Vehicle; Agency, U.S.E.P.: Washington, DC, USA, 2018.
  40. Brander, M.; Sood, A.; Wylie, C.; Haughton, A.; Lovell, J. Electricity-specific emission factors for grid electricity. Ecometrica 2011. Available online: https://ecometrica.com/assets/Electricity-specific-emission-factors-for-grid-electricity.pdf (accessed on 3 February 2023).
  41. Fazil, A.D.M.; Fawzi, M.; Osman, S.A.; Ismail, M.M.; Said, M.F.M. Potential Consumer Assessment on the Usage of Diesel-CNG Dual Fuel Vehicle in Malaysia. J. Adv. Res. Fluid Mech. Therm. Sci. 2019, 53, 175–184. [Google Scholar]
  42. Aimsun. Fuel Consumption Model. Available online: https://docs.aimsun.com/next/22.0.1/UsersManual/EnvironmentalModels.html (accessed on 21 February 2023).
  43. Haaren, R.v. Assessment of Electric Cars’ Range Requirements and Usage Patterns based on Driving Behavior recorded in the National Household Travel Survey of 2009; Earth and Environmental Engineering Department, Columbia University, Fu Foundation School of Engineering and Applied Science: New York, NY, USA, 2011. [Google Scholar]
  44. Larminie, J.; Lowry, J. Electric Vehicle Technology Explained; John Wiley & Sons: Hoboken, NJ, USA, 2003. [Google Scholar]
  45. Genikomsakis, K.N.; Mitrentsis, G. A computationally efficient simulation model for estimating energy consumption of electric vehicles in the context of route planning applications. Transp. Res. Part D Transp. Environ. 2017, 50, 98–118. [Google Scholar] [CrossRef]
  46. Iora, P.; Tribioli, L. Effect of Ambient Temperature on Electric Vehicles’ Energy Consumption and Range: Model Definition and Sensitivity Analysis Based on Nissan Leaf Data. World Electr. Veh. J. 2019, 10, 2. [Google Scholar] [CrossRef] [Green Version]
  47. Int Panis, L.; Broekx, S.; Liu, R. Modelling instantaneous traffic emission and the influence of traffic speed limits. Sci Total Env. 2006, 371, 270–285. [Google Scholar] [CrossRef] [PubMed]
  48. Chalermwongphan, K.; Upala, P. Comparing the Traffic Operation, Fuel Consumption, and Pollutant Emission of Bike Lane Pattern Design with AIMSUN Microscopic Simulation Model: A Case Study of Nakhon Sawan Municipality in Thailand. Open Transp. J. 2019, 13, 182–193. [Google Scholar] [CrossRef] [Green Version]
  49. Boriboonsomsin, K.; Barth, M. Impacts of Road Grade on Fuel Consumption and Carbon Dioxide Emissions Evidenced by Use of Advanced Navigation Systems. Transp. Res. Rec. J. Transp. Res. Board 2009, 2139, 21–30. [Google Scholar] [CrossRef]
  50. U.S. Department of Energy. Average Fuel Consumption at Increasing Road Grades. 2014. Available online: https://afdc.energy.gov/data/ (accessed on 30 December 2022).
  51. Neves, A.; Brand, C. Assessing the potential for carbon emissions savings from replacing short car trips with walking and cycling using a mixed GPS-travel diary approach. Transp. Res. Part A Policy Pract. 2019, 123, 130–146. [Google Scholar] [CrossRef]
  52. Agency U.S.E.P. Routes to Lower Greenhouse Gas Emissions Transportation Future. 2022; [cited 2023]. Available online: https://www.epa.gov/greenvehicles/routes-lower-greenhouse-gas-emissions-transportation-future (accessed on 27 February 2023).
  53. Heinen, E.; Mattioli, G. Multimodality and CO2 emissions: A relationship moderated by distance. Transp. Res. Part D Transp. Environ. 2019, 75, 179–196. [Google Scholar] [CrossRef]
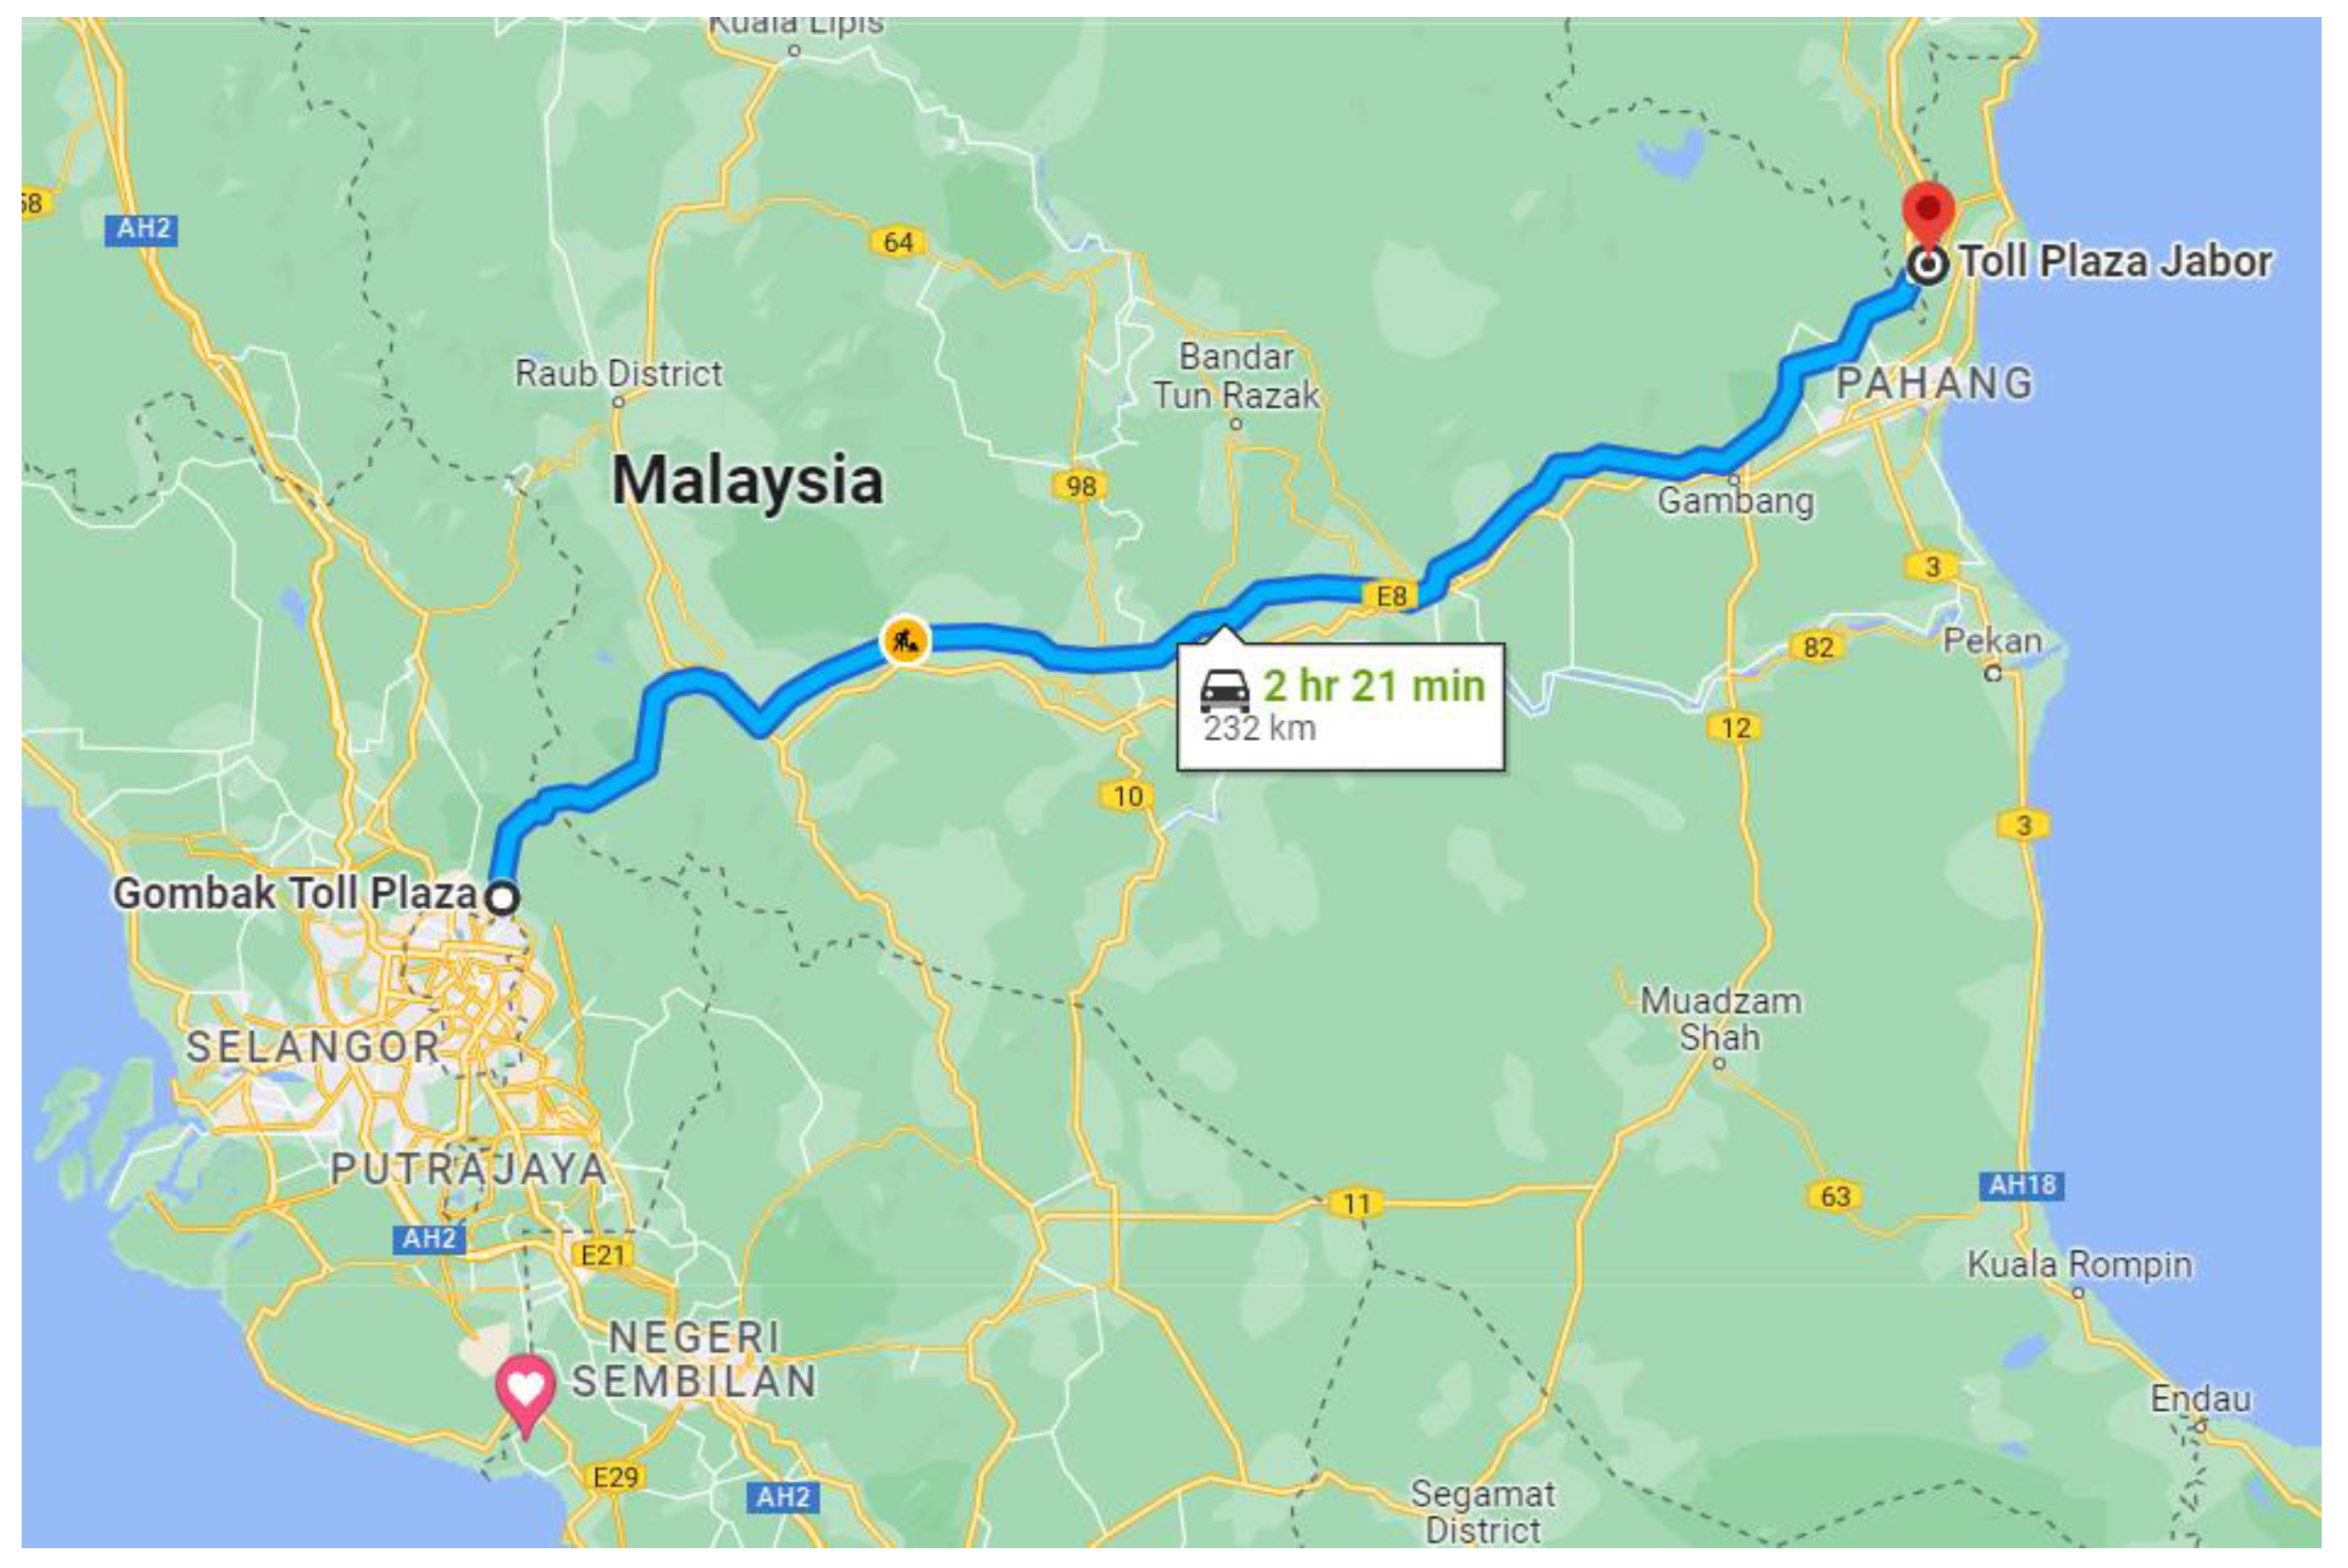
Figure 1. Scenario 1 Route.
Energies 16 05048 g001
Figure 2. Scenario 2 Route.
Energies 16 05048 g002
Figure 3. Scenario 3 Route.
Energies 16 05048 g003
Figure 4. Scenario 4 Route.
Energies 16 05048 g004
Figure 5. Scenario 5 Route.
Energies 16 05048 g005
Figure 6. Scenario 6 Route.
Energies 16 05048 g006
Figure 7. Nissan Leaf used for real-world experiment.
Energies 16 05048 g007
Figure 8. Scenario 1—Distance Traveled by EVs and ICE.
Energies 16 05048 g008
Figure 9. Scenario 1—Average Energy Consumption for EVs and ICE.
Energies 16 05048 g009
Figure 10. Scenario 1—Average Energy Consumption at Different Road Altitudes.
Energies 16 05048 g010
Figure 11. Scenario 2—Distance Traveled by EVs and ICE.
Energies 16 05048 g011
Figure 12. Scenario 2—Average Energy Consumption.
Energies 16 05048 g012
Figure 13. Scenario 3—Distance Traveled by ICEVs and EVs.
Energies 16 05048 g013
Figure 14. Scenario 3—Average Energy Consumption by EVs and ICEVs.
Energies 16 05048 g014
Figure 15. Scenario 3—Energy Consumption Comparison for Both EVs and ICEVs at Traffic Light.
Energies 16 05048 g015
Figure 16. Scenario 4—Distance Travel by EVs and ICE.
Energies 16 05048 g016
Figure 17. Scenario 4—Average Energy Consumption.
Energies 16 05048 g017
Figure 18. Scenario 4—Average Energy Consumption Comparison for EVs and ICEVs at Traffic Light.
Energies 16 05048 g018
Figure 19. Scenario 5—Distance Traveled.
Energies 16 05048 g019
Figure 20. Scenario 5—Average Energy Consumption.
Energies 16 05048 g020
Figure 21. Scenario 6—Distance Traveled by EVs and ICEVs.
Energies 16 05048 g021
Figure 22. Scenario 6—Average Energy Consumption Comparison for EVs and ICE.
Energies 16 05048 g022
Figure 23. Scenario 6—Average Energy Consumption Comparison at Roundabout.
Energies 16 05048 g023
Figure 24. Scenario 1—Energy Cost Comparison between EVs and ICEVs.
Energies 16 05048 g024
Figure 25. Scenario 2—Energy Cost Comparison.
Energies 16 05048 g025
Figure 26. Scenario 3—Energy Cost Comparison.
Energies 16 05048 g026
Figure 27. Scenario 4—Energy Cost Comparison.
Energies 16 05048 g027
Figure 28. Scenario 5—Energy Cost Comparison.
Energies 16 05048 g028
Figure 29. Scenario 6—Energy Cost Comparison.
Energies 16 05048 g029
Figure 30. Carbon dioxide emission by scenario.
Energies 16 05048 g030
Table 1. Electricity Tariff.
Tariff Category (Residential)Current Rate (Cent/kWh)
For the first 200 kWh (1–200 kWh) per month0.049
For the next 100 kWh (201–300 kWh) per month0.075
For the next 300 kWh (301–600 kWh) per month0.12
For the next 300 kWh (601–900 kWh) per month0.12
For the next kWh (901 kWh onwards) per month0.13
Table 2. Petrol consumption model parameter.
Fi (Idling)0.330 mL/s
F1 (at 90 km/h)4.700 L/100 km
F2 (at 120 km/h)5.400 L/100 km
C1 (Accelerating)0.26 mL/s
C2 (Accelerating)0.42 mls2/m2
Fd (Decelerating)0.53 mL/s
Minimum Consumption Speed: Vm50 km/h
Table 3. Pollution emission factor.
PollutantCO2
Fuel TypePetrol
Lower Limit-
Factor 1 5.53 × 10 1
Factor 2 1.61 × 10 1
Factor 3 2.89 × 10 3
Factor 4 2.66 × 10 1
Factor 5 5.11 × 10 1
Factor 6 1.83 × 10 1
Table 4. Photos from real-world experiment.
DescriptionPhoto
Scenario 2 initial odometer readingEnergies 16 05048 i001
Driving from origin of Scenario 2 to the destinationEnergies 16 05048 i002
Arrived at Scenario 2 destinationEnergies 16 05048 i003
Odometer reading at the destinationEnergies 16 05048 i004
Table 5. Total carbon dioxide emission by scenario.
Scenario123456
CO2 emission by ICEVs (kg) 12,989.432333.821055.02224.863421.111224.90
CO2 emission by EVs (kg)2908.261065.03564.5680.971279.71487.19
Table 6. Summary.
Table 6. Summary.
ScenarioTotal Distance
(km)
Energy Consumption (kWh/km)Energy SavingCost SAVING
EVsICEEVsICE
137,933.3736,762.570.140.4830%26%
29611.318390.150.120.6180%41%
3605.27716.660.140.9886%64%
41289.481229.370.110.7785%61%
51497.541918.770.120.4875%39%
6585.50652.440.100.6684%59%
Table 7. Parameter Comparison.
ScenarioDistance Traveled (km)Average Speed (km/h)Time to Destination (min)
AIMSUNExperimentAIMSUNExperimentAIMSUNExperiment
231.331.475.7722526
313.615.151232038
42.702.5025.3621107.25
Table 8. Validation Result.
ScenarioEnergy Consumption (kWh/km) (AIMSUN)Energy Consumption (kWh/km)
(EXPERIMENT)
20.120.14
30.140.13
40.110.14
Disclaimer/Publisher’s Note: The statements, opinions and data contained in all publications are solely those of the individual author(s) and contributor(s) and not of MDPI and/or the editor(s). MDPI and/or the editor(s) disclaim responsibility for any injury to people or property resulting from any ideas, methods, instructions or products referred to in the content.