Abstract
A cell model is developed and validated to analyze the performance of polymer electrolyte membrane water electrolysis (PEMWE) stacks and systems. It is used to characterize the oxygen evolution reaction (OER) activity on a TiO2-supported IrO2 catalyst and an unsupported IrO2 powder catalyst. Electrochemical, stack, and system thermoneutral potentials are defined and determined for isothermal and non-isothermal stack operation. Conditions are determined under which the system thermoneutral potential or flammability of H2 in the O2 anode stream limits the stack turndown and operating temperature. Performance is analyzed of a complete PEMWE system with an electrolyzer stack containing an IrO2/TiO2 anode catalyst (2 mg/cm2 Ir loading) and N117-like membrane mitigated for H2 crossover, anode balance-of-plant (BOP) components, cathode BOP system with temperature swing adsorption for H2 purification, and electrical BOP system with transformer and rectifier. At the rated power condition, defined as 2 A/cm2 at 1.9 V, 80 °C, and 30 bar H2 pressure, the stack/system efficiency is 65.3%/60.3% at beginning of life (BOL), decreasing to 59.3%/53.9% at end of life (EOL). The peak stack/system efficiency is 76.3%/70.2% at BOL, decreasing to 71.2%/65.6% at EOL. Improvements in catalyst activity and membrane are identified for a 50% increase in current to 3 A/cm2 at 1.8 V.
1. Introduction
Hydrogen is a commodity chemical, energy carrier, and fuel that can contribute to deep decarbonization for transportation, chemicals, industry, power generation, and integrated energy systems [1]. Carbon dioxide emissions from burning fossil fuels and deforestation are regarded as the largest human contributors to global warming and climate change. National plans offer detailed pathways for the research and development of hydrogen-related technologies for energy security and resiliency [2,3,4]. Recent and anticipated decreases in the deployed cost of renewable energy generation can reduce electricity prices and make hydrogen increasingly economic [5,6]. Hydrogen may be especially economic for e-fuel production and long-duration energy storage [6,7]. Mobility applications can benefit from hydrogen as a fuel, among which rail, heavy-duty vehicles, maritime, and aviation applications are all strong candidates [8]. Hydrogen can also be used for decarbonization in industrial-scale ammonia production, metal ore reduction, chemical synthesis, and other reduction/hydrogenation reactions across the chemical and industrial sectors [9]. However, to achieve cost targets, further research is needed across the technology development pipeline including areas of hydrogen conversion, delivery, storage, and production [2,10].
Water electrolysis produces carbon-free hydrogen if the electricity comes from renewable wind or solar, nuclear plants, or fossil fuels with CO2 sequestration. Mature technologies for generating hydrogen include alkaline electrolysis, solid-oxide electrolysis, and polymer-electrolyte membrane water electrolysis (PEMWE), each with benefits and drawbacks. Alkaline electrolysis has been mature and commercially deployed for decades as a low capital cost option, but with modest efficiency and limited ability to operate at high current densities [11]. In contrast, solid oxide electrolyzers operate at very high cell efficiencies with a cell potential approaching the thermoneutral potential [12]. However, they operate at high temperatures, often higher than 600 °C, which complicates startup/shutdown and accelerates degradation [12]. PEMWE is more efficient than alkaline electrolyzers and more dispatchable, and it operates at low temperatures, often below 80 °C, with fast startup and shutdown [13]. PEMWE can fill the highly dispatchable niche, utilizing intermittent grids to reduce the levelized cost of hydrogen (LCOH) [14]. PEMWE can also operate at substantially higher current densities than alkaline electrolyzers. Indeed, PEMWE has recently been identified as a forerunner for hydrogen production due to these operational characteristics when paired with a renewable energy-sourced grid and favorable manufacturing scalability of the components [15]. Islanded renewable solar and wind plants, however, may require energy storage to deal with intermittency and achieve high electrolyzer utilization efficiency while minimizing startups and shutdowns.
System analysis guides and benchmarks progress toward achieving coupled technical targets for PEMWE hydrogen production. A techno-economic analysis by Colella et al. showed that electricity price dominates the LCOH [16]. As electricity price can vary by a factor of two to three, so can LCOH, which demonstrates the importance of optimally designed PEMWE systems [16]. From an industrial perspective, Ayers explained how the interaction between components, interfaces, and manufacturing methods currently in development will lead to yet-unknown performance–cost–durability relationships and will require extensive testing and modeling [13]. To identify cost reduction opportunities, Mayyas et al. developed bottom-up cost models of 1 MW systems to show that system cost could reach $265/kW (2015 USD) if materials and device integration advances are made and system manufacturing production is scaled-up [17]. They also showed that at higher production volume, total cost is most sensitive to precious metal loading and membrane characteristics, which contribute to large fractions of the stack cost and determine the power density of the stack [17]. Tjarks et al. quantified the energy tradeoffs in a reduced system model that accounted for electrolysis, gas drying, and gas compression, showing that holistic modeling offers globally optimized operating strategies [18]. Scheepers et al. modeled a similar PEMWE system to show that efficiency could be further optimized for specific membranes by optimizing the cathode compartment pressure [19]. In a case study of a 60 kW system, Molho modeled the dynamic PEMWE system to show that efficiency could be increased by 13% from a baseline operating strategy [20]. Globally, the installed capacity of PEMWE increased from 19 MW in 2015 to 89 MW in 2020 [21] with almost 5 GW of new capacity planned as of 2021 [10]. Nevertheless, considerable R&D advances are needed as today’s 1 MW PEMWE systems cost ~$1100/kW compared to a target cost of $265/kW [10].
This work analyzes a PEMWE system including the electrolysis stack parameterized by state-of-the-art data and the complete balance of the plant components that comprise a PEMWE system. This is the first presentation of a detailed, physical model combining an electrochemical model of the PEMWE cell and complete system balance of plant (BOP) dynamics in order to demonstrate results for the total system, including interactions between the cell and system. Results are presented that quantify critical performance metrics including stack and system power consumption, efficiency, and parasitic losses. Finally, technology progression and remaining barriers that require attention are identified and discussed.
2. PEMWE Cell Model
The cell model in Figure 1a incorporates the oxygen evolution reaction (OER) in the anode and hydrogen evolution reaction (HER) and oxygen reduction reaction (ORR) in the cathode. Iridium oxide (IrOx) catalyst is widely used for OER under acidic conditions; RuO2 is another candidate that is even more active for OER than IrOx but less stable. IrOx catalyst has negligible activity for the hydrogen oxidation reaction (HOR) in the anode [22]. Hydrogen transports across the membrane from cathode to anode by molecular diffusion (designated as H2 crossover current) and proton migration, O2 transports across the membrane from anode to cathode by molecular diffusion (designated as O2 crossover current), and there is an electronic shorting current, , due to the finite electrical resistance of the membrane. The cell voltage, E, is the sum of the discrete contributions over-and-above the thermodynamic voltage from the membrane, contact, anode catalyst layer (ACL), and cathode catalyst layer (CCL):
where is the thermodynamic, reversible (Nernst) voltage; i is the cell current density; is the Ohmic resistance of the membrane; is the electric resistance from the PTL, GDL, and layer-to-layer contacts of the total compressed cell; is the OER surface overpotential in the anode catalyst layer; is the effective Ohmic (protonic) resistance of the anode catalyst layer; is the mass-transfer overpotential arising from incomplete liquid-water coverage of the catalyst at high current densities; is the HER surface overpotential of the cathode catalyst layer; and is the effective Ohmic resistance of the cathode catalyst layer.
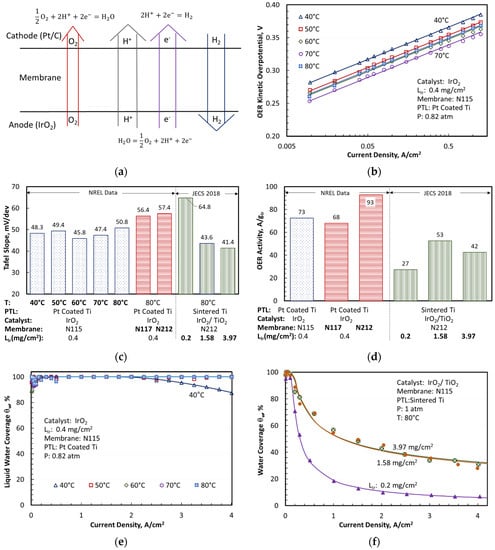
Figure 1.
Cell model and derived kinetic constants for OER on IrO2 and IrO2/TiO2 catalysts. (a) Modeled cell reactions and transport mechanisms; (b) OER overpotentials in kinetic region; (c) Derived Tafel slopes for OER; (d) Derived OER activity of IrO2 catalyst; Derived liquid water coverage of OER catalyst (e) unsupported and (f) TiO2 supported.
The ACL overpotential is the sum of the electrochemical activation overpotential and the effective Ohmic overpotential:
For convenience, the activation overpotential is represented by Butler–Volmer kinetics modified for dependence on liquid water coverage of the catalyst surface, , and corrected for the electronic shorting current density, :
where is the OER exchange current density, and is the OER Tafel constant defined by .
The anode mass-transfer overpotential is the difference of the anode activation overpotential with incomplete and complete liquid water coverage, :
The liquid water coverage, , is represented as a function of the anode mass transport overpotential derived from the polarization data:
Assuming uniform electronic potential across the electrode, the charge balance can be solved analytically to obtain the anode kinetic overpotential [23,24]:
where is the ionic sheet resistance of ACL defined by . The anode catalyst layer effective Ohmic resistance, , is a function of the ACL thickness, , the OER Tafel constant, , and the effective proton conductivity of the ACL, .
The CCL overpotential is the sum of the hydrogen evolution reaction (HER) activation overpotential and the effective Ohmic overpotential in the layer:
HER obeys Butler–Volmer kinetics.
where is the oxygen crossover current density, and is the HER Tafel constant. The HER exchange current density is a function of the HER activation energy, , of 25 kJ/mol.
The effective ionic resistance in the CCL can be expressed in terms of parameter β, the square of which represents the ratio of the CCL sheet resistance () to the HER activation resistance, [25]:
3. Model Calibration and Validation
Two sets of literature data, referred to as H2NEW and JECS 2018, obtained with differential cells were analyzed to derive the kinetic constants and calibrate the model. The H2NEW data were obtained with unsupported IrO2 OER catalyst, Pt-coated Ti porous transport layer (PTL), PFSA membranes of different thicknesses, and flowing liquid water to both anode and cathode channels. The JECS 2018 data were obtained with supported IrO2/TiO2, sintered Ti PTL, N212 membrane, liquid water flowing in the anode channel, and cathode purged with H2.
The contact resistance ( was estimated as 11.5 mΩ.cm2 from the high frequency resistance (HFR) measured in H2NEW and the membrane conductivity () correlation reported in the literature for N117. Using this value of and accounting for membrane swelling, we derived a correlation for N115 conductivity that estimated 17% larger at 80 °C (0.1762 S/cm) and 4 kJ/mol smaller activation energy (6.5 kJ/mol) with temperature dependence compared to the literature correlation for N117.
Figure 1b shows the OER kinetic overpotential, , calculated by applying Equation (1) and Equations (9)–(13) to the measured H2NEW polarization curves, with , , , and estimated using the data and sources listed in Table 1. The experimentally derived values were only applicable in the kinetic region where was negligible and, as expected, they decreased as the cell temperature rose from 40 to 70 °C. The solid lines were the modeled values determined from Equations (4)–(9) with the Tafel slopes for OER () optimized to match the experimental data presented as symbols. The modeled and experimental vs. lines were nearly parallel on a log plot, suggesting that was independent of temperature between 40 and 70 °C. varied between 45.8 and 50.8 mV/dec over this temperature range, with a mean value of 48.3 mV/dec. The exchange current density could be correlated with an activation energy, , of 35.6 kJ/mol.

Table 1.
Attributes of status, next-generation, and future PEM electrolysis systems. Anode PTL and separator plate materials are listed only to indicate the desire to eliminate the use of PGM coatings. Key membrane and OER catalyst properties have been determined to increase the current density to 3 A/cm2 at 1.8 V in the next-generation system and 1.7 V in the future system.
Using a shorting-corrected current density at IR-corrected 1.45 V, 80 °C, 1 atm, and 100% RH, the unsupported IrO2 catalyst with 0.4 loading exhibited a modeled OER activity of 78 ± 10 and a Tafel slope of 54.1 ± 3.3 mV/dec. The supported IrO2/TiO2 Elyst Ir75 0480 catalyst from Umicore had a modeled OER activity of 40 , and a Tafel slope of 54.1 ± 3.3 mV/dec. The activity of the supported catalyst was highest for 1.58 loading. The TiO2 support did not appear to enhance the OER activity of IrO2.
Figure 2 shows a quantitative agreement between the modeled (top solid lines) and measured (symbols) cell voltages for the two sets of experimental data analyzed in this work. It also presents the breakdown of the modeled cell voltages as a function of current density, temperature, membrane thickness, catalyst support, and catalyst loading. The OER kinetic and Ohmic () overpotentials were the largest contributors to the increase in cell voltage above , as shown in Figure 2a, for an MEA with an N115 membrane, unsupported IrO2 catalyst, and 0.4 mg/cm2 Ir loading. The Ohmic overpotential exceeded the OER kinetic overpotential at the highest end of the current density range, especially at lower temperatures. The oxygen transport overpotentials were small but not negligible at low temperatures. The Ohmic overpotentials in the electrodes ( and ) were also small but discernible at high current densities and low temperatures. The CCL overpotentials for HER kinetics () and proton transport () were negligible under the test conditions. The voltage breakdowns clearly indicated that membrane thickness and conductivity were critical variables controlling the cell voltage and, therefore, efficiency at high current density. The mass transfer overpotentials were small for the MEA with Pt-coated PTL, so that the modeled was nearly 100% for temperatures above 50 °C and current densities up to 4 A/cm2. decreased slightly at lower temperatures but remained above 80%, even at 40 °C and 4 A/cm2. The MEAs with uncoated PTLs had larger mass transfer overpotentials, with the modeled decreasing at higher current density and at higher Ir loading but appearing to saturate above 1.58 . The mass-transfer overpotentials arose from incomplete liquid water coverage of the catalyst due to nucleated oxygen physically blocking the catalyst sites. This blocking has been observed by sight in RDE setups [26] and inside porous transport layers by X-ray tomography [27] while theory supports sub-micron bubbles in MEA cells operating at high current density [28]. The data in Figure 1e,f suggested that coating PTL with Pt improved the removal of O2 bubbles from, and accessibility of liquid water to, the OER catalyst surface. Comparing Figure 2a,b to Figure 2c illustrated the role of the PTL coating in facilitating oxygen transport by reducing the interfacial resistance, as evidenced by significant mass transport overpotentials in MEAs with (uncoated) sintered Ti diffusion medium.
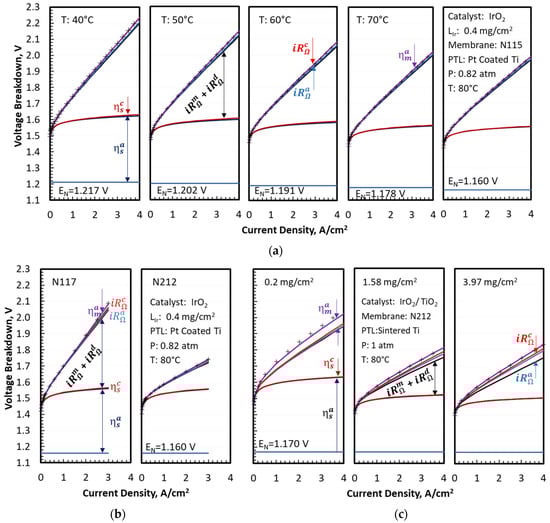
Figure 2.
Breakdown of cell voltages for different operating conditions, membrane thicknesses, and catalyst loadings. (a) Variable temperature; (b) Variable membrane thickness; (c) Variable IrO2/TiO2 loading.
4. Results and Discussion
Figure 3 shows the reference PEMWE system and the constituent subsystems for the electrolyzer stack, anode balance of plant (BOP), cathode BOP, and electrical BOP. We investigated the performance of this system using the cell model described in the last section. Some of the important performance metrics considered were thermoneutral potential, flammability limit, parasitic loss, electrolyzer efficiency, and system efficiency.
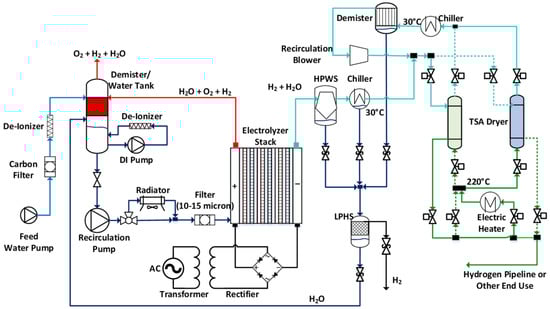
Figure 3.
Reference PEM water electrolysis system configuration.
4.1. Electrolyzer Stack
The electrolyzer stack included membrane electrode assemblies (MEA) plus supporting components in a sandwich configuration. The stack had a nameplate power of 1 MW at 500–600 V nominal rated stack voltage obtained with 200–300 cells each with nearly 1000 cm2 active areas. The cathode compartment pressure was regulated, for example, up to 3 MPa (450 psi) to obviate downstream energy expenditure for hydrogen compression.
The anode catalyst layer (ACL) in the near-term MEAs consisted of a titania-supported iridium oxide (IrO2/TiO2) catalyst and perfluorosulfonic acid (PFSA) ionomer with a nominal catalyst loading of 0.2–2.5 mg/cm2 and ionomer content of ca. 10 wt.% relative to the total weight of the electrode. The cathode catalyst layer (CCL) was platinum supported on Vulcan XC72 carbon (~50 wt.% Pt/C) with a nominal loading of 0.2–1 mg/cm2 and ionomer-to-carbon weight ratios of 0.6–1. Hydrogen permeation and crossover are more important in electrolyzers than in fuel cells because of much higher H2 partial pressures. To prevent hydrogen crossover to the anode compartment from reaching the flammability limit, a thick membrane such as N117 is used in electrolyzers designed for differential pressure operation. To further reduce hydrogen crossover, a sandwiched membrane with a thin Pt interlayer [29,30] or solution casting crossover-mitigated membranes (platinum deposited within membrane) [31] have been used [29,32]. The recombination layer can electrochemically oxidize crossover hydrogen with crossover oxygen to generate water [33]. A dimensionally stable membrane exhibiting an ionic resistance comparable to a 2–3 mil Nafion membrane but with only one fifth the hydrogen permeability has been developed [34]. The porous transport layer (PTL) on the anode side of the cell was a sintered titanium layer coated with a thin, precious metal (gold or platinum) to prevent the oxidation that would increase the electronic contact resistance of the interface [35]. The PTL must provide high fluid permeability, mechanical strength, high electronic conductivity, and long-term stability in the acidic, oxidizing environment of the anode compartment [36]. Typical PTL transport properties include a porosity of 20–50%, thickness of 250–3000 μm, and pore size of 5–50 μm. Carbon cloth or paper is incorporated as a gas diffusion layer (GDL) for gas transport and electronic conductivity between the CCL and flow channel of the bipolar plate. Thicknesses of 200–370 μm, pore sizes of 20–50 μm, and additional 5–20 weight % polytetrafluoroethylene (PTFE) coating for hydrophobicity are common.
Separator plates provide structure to the cell, separate the individual cells, and provide a conductive path for heat and electrons with minimal hydrogen absorption. Currently, PEM electrolyzers utilize coated titanium or coated stainless steel 316L sheets to maintain high electrical and thermal conductivity without corroding rapidly [37].
4.2. Anode BOP
The anode-side balance of plant (BOP) sub-system circulated purified reactant water and controlled the stack temperature. It included water supply and treatment (filtration plus de-ionization), an oxygen separation, and a radiator to reject heat generated in the stack. The deionizer was a mixed cation and anion resin bed of gel polystyrene cross-linked with divinylbenzene. Three columns were cycled into service: one in primary service, one for polishing, and one for recharging. An additional de-ionizer and pump were installed to remove system-generated impurities that accumulated in the demister tank and maintain water resistivity higher than 1 MΩ. The recirculation water pump supplied water at flow rate up to 10 kg/s to an air-cooled, finned tube heat exchanger for 5–10 °C ∆T with a provision to bypass during start-up and low stack power operation. Anode-side effluent water and cathode-side condensate were recycled to the demister that separated oxygen with trace hydrogen. The anode fluid was nominally at ambient pressure for safety and the hydrogen concentration in the oxygen stream required monitoring and emergency shut-off measures.
4.3. Cathode BOP
The cathode-side BOP system included water separation plus recovery and a temperature swing adsorption (TSA) dryer to remove water vapor for a high-quality hydrogen product. The 1 MW electrolyzer could generate hydrogen at a rate of up to 500 kg/day. The hydrogen/water cathode effluent stream flowed to a high-pressure water separator (HPWS) to recover liquid water, was cooled to lower than 30 °C in a chiller to condense water vapor, and was fed to the TSA dryer for final drying. Water recovered in the HPWS and chiller was delivered to a low pressure hydrogen separator (LPHS) to remove the dissolved hydrogen, which was periodically vented to a discharge chamber or to the atmosphere, and was returned to the anode demister/water tank utilizing the available pressure head (no pump required). The TSA of a 1 MW hydrogen production plant requires ca. 1 g/s of water adsorption. To minimize hydrogen loss, the TSA needed at least two adsorption beds, one for drying and the other for regenerating. Regeneration was accomplished by heating the bed to desorb water by feeding a hot, dry hydrogen stream followed by cooling the bed using the hydrogen product at low temperature. The regeneration loop required a circulation blower (~6 psi pressure head), an electric heater, a chiller to cool the hot and wet hydrogen back to 30 °C, and a demister to remove the condensate water after chilling. A total of 20% of the dry hydrogen from the adsorption bed was used to regenerate the bed and the hydrogen was heated to 200 °C when passed through the electric heater.
4.4. Electrical BOP
The electrical power supply included a transformer and rectifier to condition power from an alternating current grid. The rectifier accepted 3-phase, 480 V electricity. The modeled combined rectifier-transformer efficiency () in Equation (15) was a function of the fraction of rated power () decreasing from 95% at rated power to 90% at 10% of rated power:
4.5. Thermoneutral Potentials
Thermoneutral potentials in part determine the thermal management of the cell, stack, and system. The classical definition of electrochemical thermoneutral potential () or enthalpy potential refers to the equilibrium reaction enthalpy per charge transferred during isothermal operation [38]:
where , and are the temperature-dependent mass-specific enthalpies, and , and are the molecular weights of hydrogen, oxygen and liquid water, respectively.
Two additional potentials pertinent to thermal management are the stack thermoneutral potential, , and the water electrolysis system thermoneutral potential, . The stack thermoneutral potential is the cell potential at which the stack operates isothermally after accounting for the latent heat transfer to vaporize water in the anode and cathode effluent streams as well as H2 and O2 crossover. Representing the fraction of O2 produced in the anode that crosses over to the cathode as and the fraction of H2 produced in the cathode that crosses over to the anode as , the following equations can be derived for the molar flow () of different species (subscript v refers to saturated water vapor with mole fraction ) in the anode, cathode, and make-up water streams (superscripts a, c, and m, respectively) per mole of H2O consumed in OER (see the schematic in Figure 4a).
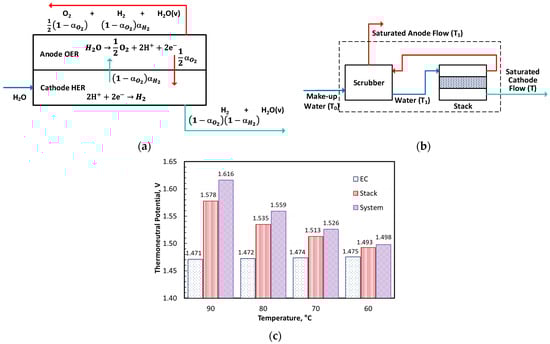
Figure 4.
Models and results for electrochemical, stack, and system thermoneutral potentials. (a) Stack material balance; (b) Control volume for system thermoneutral potential; (c) Thermoneutral potentials.
An energy balance over the isothermal stack leads to the following equation for :
The system thermoneutral potential () accounts for the changes in due to the sensible heat transfer to make-up water in the scrubber. Figure 4b shows a control volume (CV) drawn around the scrubber in which make-up water at temperature entered while the saturated anode stream at scrubber temperature and saturated cathode stream at stack temperature exited the boundaries. Thus, the stack operated non-isothermally with a temperature rise of An energy balance over this control volume led to the following equation for .
A separate heat balance around the scrubber is required to determine , which is a function of the water stoichiometry Φ.
Figure 4c presents the thermoneutral potentials as a function of the stack temperature . The electrochemical thermoneutral potential is a purely thermodynamic quantity based on the higher heating value of hydrogen. Because the overall water electrolysis reaction is endothermic, operating the stack below at steady state required an external heater to sustain the reaction. The stack and system overpotentials also depended on the anode and cathode pressures, which were 1 bar and 30 bar in this study, respectively. The system overpotential further depended on the water stoichiometry, which was >30 in this study. The latent heat of vaporization caused the stack thermoneutral potential to be 18 to 107 mV higher than over the temperature range of 60–90 °C. The sensible heat transfer to make-up water raised the system thermoneutral potential by 5 to 38 mV above . The three thermoneutral potentials were within 23 mV of each other at 60 °C, the lowest temperature considered in Figure 4c.
4.6. Hydrogen Loss
Figure 5 presents the hydrogen loss normalized by H2 production at beginning of life (BOL) and end of life (EOL). It shows that H2 crossover from cathode to anode within the electrolyzer cell was the primary source of H2 loss. A mitigation layer or dispersed Pt can oxidize a fraction of the H2 from crossing over to the anode without materially affecting the amount of H2 crossover (i.e., H2 loss) from the cathode [39]. Imperfect water–hydrogen separation in HPWS and downstream chiller and H2 dissolved in the condensate accounted for the remainder of the hydrogen loss. The H2 crossover flux () is represented as
where , and . The first term in Equation (20) describes the increase in H2 crossover at higher current density because of the dissolved H2 in enhanced water transport due to osmotic drag [39]. The second term describes the hydraulic transport of H2 across the membrane with an effective permeability that is temperature dependent. Although hydrogen permeability and crossover flux increase with current density, the normalized H2 loss in Figure 5 decreased at higher current density. For Nafion N117 and 3.10 MPa cathode pressure, the H2 loss was 1.3% at 2 A/cm2, increasing to 1.8% at 1 A/cm2, 2.9% at 0.5 A/cm2, and 4.8% at 0.25 A/cm2. Hydrogen loss via dissolution in recovery water within the cathode-side BOP was nearly independent of current density at 0.3%. Henry’s law constant for hydrogen in water, 1.56 mg-H2/kg-H2O-bar at standard conditions, is weakly dependent on temperature.
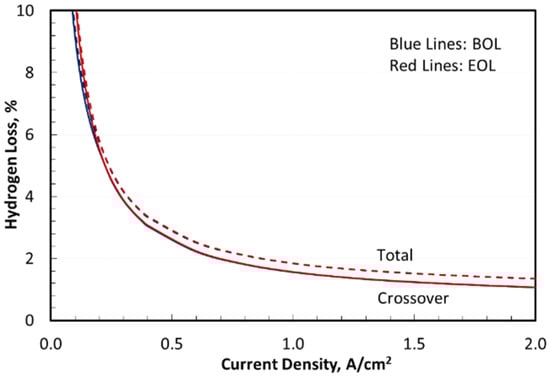
Figure 5.
Total hydrogen loss in stack and system.
Figure 6 presents the hydrogen concentration in oxygen in the anode gaseous effluent on a dry basis. Similar to the H2 loss curve in Figure 5 that affected the overall energy efficiency, the H2 concentration in O2 increased sharply at low current densities, which had serious safety implications. For context, consider the flammability limits for H2 in O2 measured by Schroeder et al. using a bomb method [40]. At 20 °C, the lower flammability limit (LFL) on a molar basis was 4.0% at 1 bar absolute pressure increasing to 4.6% at 5 bar [40]. At 80 °C, the LFL decreased slightly to 3.8% at 1 bar increasing to 4.4% at 5 bar [40]. The anode effluent in Figure 6 reached 4% H2 in O2 at 150 mA/cm2. Enforcing electrolyzer operation below one-half the LFL, ~2% H2 in O2, would require the stack current density to remain above 350 mA/cm2. Thus, flammability limited the maximum stack turndown to 14.7% of rated power at BOL and 14.2% at EOL if the design point was 2 A/cm2 current density.
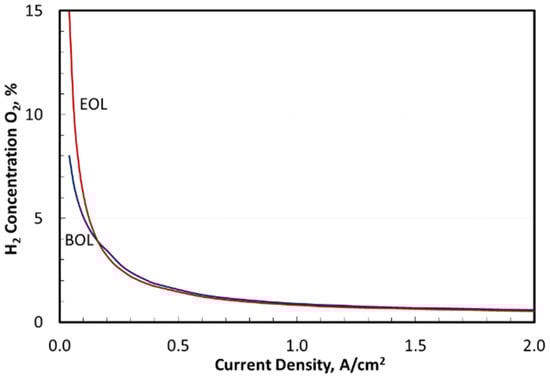
Figure 6.
Flammability consideration: H2 concentration in O2.
4.7. System Performance
Figure 7 presents the electrolyzer performance and operating temperatures at BOL and EOL. Here, EOL was defined as a 10% increase in cell voltage at 2 A/cm2 due to electrode degradation. This voltage rise was assumed to originate from the slowdown in OER kinetics and increase in electronic contact resistance between the electrode and PTL due to titanium passivation [41]. OER catalyst research may help mitigate OER catalyst degradation while balancing gas permeation over the lifetime of the cell [42,43,44,45,46,47,48,49]. The stack temperature, as shown in Figure 7, could be maintained at 80 °C at EOL but had to be lowered for current densities below 0.2 A/cm2 at BOL to stay above the system thermoneutral potential. A comparison with the results in Figure 6 showed that the actual turndown was determined by the lower flammability limit rather than by the thermoneutral potential.
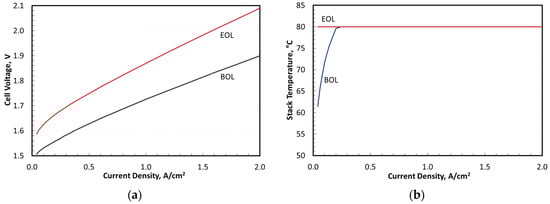
Figure 7.
Stack performance and operating conditions. (a) Stack polarization curves at BOL and EOL; (b) Stack operating temperature at BOL and EOL.
Figure 8 summarizes the system parasitic losses expressed as specific energy consumption in kWh/kg-H2 at BOL and EOL. Under all operating conditions, the electrical losses in the transformer and rectifier were the largest sources of the parasitic specific energy consumption. The losses associated with H2 crossover in the stack and H2 dissolution in the effluent water (termed H2 loss in Figure 7) generally exceeded the specific energy consumption in the mechanical system components (pumps, radiator fan, and recirculation blower) and TSA electrical heater (together termed as mechanical loss). Only at a high H2 production rate (i.e., system power or current density) did the combined mechanical losses exceed the specific energy consumption associated with H2 loss. This ranking of parasitic losses was consistent with results reported elsewhere [34].
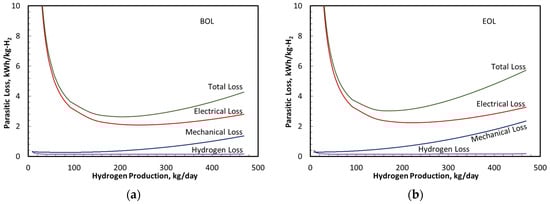
Figure 8.
Sources of performance losses in anode, cathode, and electrical subsystems. (a) Parasitic losses at BOL; (b) Parasitic losses at EOL.
Figure 9 presents the overall performance in terms of efficiency and specific energy consumption in kWh/kg-H2. The results are presented separately for the stack and the entire system at BOL and EOL. The stack efficiency is defined as the ratio of lower heating value (LHV) of net H2 produced in the stack (i.e., H2 produced by HER in cathode minus H2 crossover to anode and H2 neutralized by reaction with the crossover O2) and exiting the cathode to the net power supplied to the stack. Generally, O2 that crosses over from the anode reacts completely within a mitigated membrane before reaching the cathode. The stack specific energy consumption is defined as the net input power to the stack divided by the net H2 production rate in the stack. The system efficiency is defined as the ratio of the LHV of H2 exiting the system boundary downstream of the TSA to the total external power supplied to the system including the transformer/rectifier and other BOP components. Similarly, the system specific energy consumption is the total electrical power to system divided by the amount of H2 exiting the system.
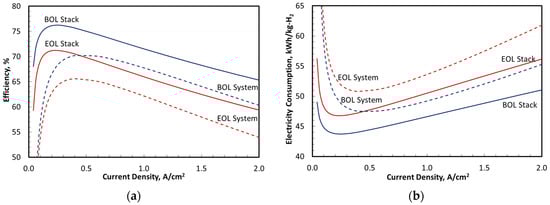
Figure 9.
PEMWE system efficiency and performance at BOL and EOL. (a) Stack and system efficiency on LHV basis; (b) Specific energy consumption.
Figure 9 shows a rated-power stack efficiency of 65.3% at BOL decreasing to 59.5% at EOL. The peak stack efficiency was 76.4% at BOL decreasing to 71.3% at EOL. The stack specific energy consumption at rated power was 51 kWh/kg-H2 at BOL increasing to 56 kWh/kg-H2 at EOL. The minimum stack specific energy consumption was 43.6 kWh/kg-H2 at BOL increasing to 46.7 kWh/kg-H2 at EOL. Similar data for the system were 60.4% rated power efficiency at BOL decreasing to 54.2% at EOL, and 70.5% peak efficiency at BOL decreasing to 66% at EOL. The system specific energy consumption at rated power was 55.2 kWh/kg-H2 at BOL increasing to 61.5 kWh/kg-H2 at EOL. The minimum system specific energy consumption was 47.3 kWh/kg-H2 at BOL increasing to 50.5 kWh/kg-H2 at EOL.
5. Conclusions
Table 1 was constructed to frame the results with a proper perspective. The first column summarizes the important material attributes of the status system analyzed in this work: mitigated 7 mil PFSA membrane (N117), TiO2-supported IrO2 OER catalyst with 2 mg/cm2 Ir loading, Pt/C HER catalyst with 1 mg/cm2 Pt loading, PGM-coated sintered-Ti anode PTL, carbon paper cathode PTL, and PGM-coated Ti separator plate. The modeled cell voltage of the status MEA was 1.9 V at 2 A/cm2, 80 °C outlet temperature, 30 bar anode pressure, and 1 bar cathode pressure. The listed stack lifetime was 60,000 h, although that depends on the duty cycle. Defining the lifetime as a 10% increase in cell voltage at rated power, the stack degradation rate was 3.2 mV/h. At this operating point, the stack had 65.3% efficiency or 51.1 kWh/kg-H2 specific energy consumption, and the system had 60.3% efficiency or 55.3 kWh/kg-H2 specific energy consumption.
The next-generation column describes the attributes of a representative system capable of reaching 3 A/cm2, a 50% increase in current density over the status MEA, at slightly lower cell voltage (1.8 V) for 6-8% improvement in stack/system efficiency and specific energy consumption. The next-generation OER catalyst (C2025) had 1.5 times the activity of the unsupported IrO2 powder with 0.4 mg/cm2 Ir loading and nearly double the activity of the status IrO2/TiO2 catalyst with 2 mg/cm2 Ir loading. Achieving the desired polarization performance required 60% lower membrane resistance than the status mitigated N117. As a reference, an N2025 membrane, if 125 mm thick, needed to have 80% higher conductivity than a PFSA membrane and 30% lower H2 permeability than N115 for the same H2 crossover (21 mA/cm2). An improved method is required to mitigate H2 crossover to the anode for acceptable turndown without exceeding the flammability limit. Additionally, attention was paid to the PTL–separator interface in order to achieve the proposed 50% reduction in contact resistance to 10 mΩ.cm2. The next-generation system must also have 80,000 h durability on dynamic duty cycles with multiple daily starts and stops typical of renewable wind and solar plants. This is challenging given the desire to reduce the PGM content in the OER and HER catalysts, anode PTL, and separator plate.
Table 1 also lists the attributes of a future system candidate capable of reaching 3 A/cm2 at 1.7 V cell voltage for 48.8 kWh/kg-H2 specific energy consumption. The future OER catalyst (C2030) doubled the activity of C2025 in the next-generation system and had half the PGM loading. The future N2030 membrane had 80% lower HFR than N117 and, if 50 mm thick, needed to have 90% higher conductivity than a PFSA membrane and 70% lower H2 permeability than N212 for 21 mA/cm2 H2 crossover. The future system also had 100,000 h durability on load-following duty cycles for 1.6 mV/h voltage degradation rate.
Author Contributions
Conceptualization, X.W. and R.K.A.; methodology, X.W., A.G.S. and R.K.A.; software, X.W. and A.G.S.; validation, R.K.A., X.W. and A.G.S.; formal analysis, X.W. and A.G.S.; investigation, R.K.A., X.W. and A.G.S.; data curation, X.W. and A.G.S.; writing—original draft preparation, A.G.S.; writing—review and editing, R.K.A.; visualization, X.W. and A.G.S.; supervision, R.K.A.; project administration, R.K.A.; funding acquisition, R.K.A. All authors have read and agreed to the published version of the manuscript.
Funding
This research was funded by the U.S. Department of Energy (DOE), Office of Energy Efficiency and Renewable Energy (EERE), Hydrogen and Fuel cell Technologies Office (HFTO), under contract DE-AC02: 06CH11357. The U.S. Government retains for itself, and others acting on its behalf, a paid-up nonexclusive, irrevocable, worldwide license in said article to reproduce, prepare derivative works, distribute copies to the public, and perform publicly and display publicly, by or on behalf of the Government.
Data Availability Statement
Not applicable.
Acknowledgments
David Peterson of DOE/EERE/HFTO was the Technology Development Manager for this study. Argonne National Laboratory, a U.S. Department of Energy Office of Science laboratory, is operated by UChicago Argonne, LLC.
Conflicts of Interest
The authors declare no conflict of interest.
References
- Davis, S.J.; Lewis, N.S.; Shaner, M.; Aggarwal, S.; Arent, D.; Azevedo, I.L.; Benson, S.M.; Bradley, T.; Brouwer, J.; Chiang, Y.-M.; et al. Net-zero emissions energy systems. Science 2018, 360, eaas9793. [Google Scholar] [CrossRef]
- United States Department of Energy. Department of Energy Hydrogen Program Plan, U.S. Dep. Energy. 2020, p. 56. Available online: https://www.hydrogen.energy.gov/pdfs/hydrogen-program-plan-2020.pdf (accessed on 5 May 2022).
- United States Department of Energy. H2@Scale: Enabling Affordable, Reliable, Clean, and Secure Energy Across Sectors. 2021. Available online: https://www.energy.gov/eere/fuelcells/articles/h2scale-handout (accessed on 5 May 2022).
- Carbon Trust and Australia’s Commonwealth Scientific and Industrial Research Organization, Mission Innovation—Clean Hydrogen. 2021. Available online: http://mission-innovation.net/missions/hydrogen/ (accessed on 5 May 2022).
- Bogdanov, D.; Ram, M.; Aghahosseini, A.; Gulagi, A.; Oyewo, A.S.; Child, M.; Caldera, U.; Sadovskaia, K.; Farfan, J.; Barbosa, L.; et al. Low-cost renewable electricity as the key driver of the global energy transition towards sustainability. Energy 2021, 227, 120467. [Google Scholar] [CrossRef]
- National Renewable Energy Laboratory. FY 2019 Progress Report for the DOE Hydrogen and Fuel Cells Program. 2020. Available online: https://www.nrel.gov/docs/fy20osti/76055.pdf (accessed on 5 May 2022).
- Ayers, K.; Danilovic, N.; Ouimet, R.; Carmo, M.; Pivovar, B.; Bornstein, M. Perspectives on low-temperature electrolysis and potential for renewable hydrogen at scale. Annu. Rev. Chem. Biomol. Eng. 2019, 10, 219–239. [Google Scholar] [CrossRef]
- Cullen, D.A.; Neyerlin, K.C.; Ahluwalia, R.K.; Mukundan, R.; More, K.L.; Borup, R.L.; Weber, A.Z.; Myers, D.J.; Kusoglu, A. New roads and challenges for fuel cells in heavy-duty transportation. Nat. Energy 2021, 6, 462–474. [Google Scholar] [CrossRef]
- Elgowainy, A.; Mintz, M.; Lee, U.; Stephens, T.; Sun, P.; Reddi, K.; Zhou, Y.; Zang, G.; Ruth, M.; Jadun, P.; et al. Assessment of Potential Future Demands for Hydrogen in the United States; Technical Report; USDOE Office of Energy Efficiency and Renewable Energy (EERE), Hydrogen and Fuel Cell Technologies Office (HFTO): Washington, DC, USA, 2020. [Google Scholar] [CrossRef]
- Satyapal, S. U.S. Department of Energy Fuel Cell Technologies Office Overview, U.S. Department of Energy, Washington, DC—January 2021. Available online: https://www.energy.gov/sites/default/files/2021-03/hfto-satyapal-overview-jan-2021.pdf (accessed on 5 May 2022).
- Ruth, M.; Mayyas, A.; Mann, M. Manufacturing Competitiveness Analysis for PEM and Alkaline Water Electrolysis Systems. In Proceedings of the Fuel Cell Seminar and Energy Exposition, Long Beach, CA, USA, 6–9 November 2017; Available online: https://www.osti.gov/servlets/purl/1550788 (accessed on 5 May 2022).
- Tang, E.; Wood, T.; Brown, C.; Pi, R.P. Solid Oxide Based Electrolysis and Stack Technology with Ultra-High Electrolysis Current Density and Efficiency; DE-EE0006962 Final Report; Fuel Cell Energy, Inc.: Danbury, CT, USA, 2015; Volume 303, pp. 1–36. Available online: https://www.osti.gov/servlets/purl/1513461%0A (accessed on 5 May 2022).
- Ayers, K. The potential of proton exchange membrane–based electrolysis technology. Curr. Opin. Electrochem. 2019, 18, 9–15. [Google Scholar] [CrossRef]
- Peschel, A. Industrial perspective on hydrogen purification, compression, storage, and distribution. Fuel Cells 2020, 20, 385–393. [Google Scholar] [CrossRef]
- Ayers, K.; Danilovic, N.; Harrison, K.; Xu, H. PEM electrolysis, a forerunner for clean hydrogen. Electrochem. Soc. Interface 2021, 30, 67–71. [Google Scholar] [CrossRef]
- Colella, W.; James, B.; Moron, J.; Saur, G.; Ramsden, T. Techno-Economic Analysis of PEM Electrolysis for Hydrogen Production. In Proceedings of the Electrolytic Hydrogen Production Workshop, Golden, CO, USA, 27 February 2014; Available online: https://www.energy.gov/sites/prod/files/2014/08/f18/fcto_2014_electrolytic_h2_wkshp_colella1.pdf (accessed on 5 May 2022).
- Mayyas, A.; Ruth, M.; Pivovar, B.; Bender, G.; Wipke, K. Manufacturing Cost Analysis for Proton Exchange Membrane Water Electrolyzers; NREL/TP-6A20-72740; National Renewable Energy Laboratory: Golden, CO, USA, 2019. [Google Scholar] [CrossRef]
- Tjarks, G.; Gibelhaus, A.; Lanzerath, F.; Müller, M.; Bardow, A.; Stolten, D. Energetically-optimal PEM electrolyzer pressure in power-to-gas plants. Appl. Energy 2018, 218, 192–198. [Google Scholar] [CrossRef]
- Scheepers, F.; Stähler, M.; Stähler, A.; Rauls, E.; Müller, M.; Carmo, M.; Lehnert, W. Improving the efficiency of PEM electrolyzers through membrane-specific pressure optimization. Energies 2020, 13, 612. [Google Scholar] [CrossRef]
- Molho, S. Dynamic Modeling of a PEM Electrolysis System: Optimal Operation for Coupling with Renewable Energy Sources. ING—School of Industrial and Information Engineering. 2021. Available online: http://hdl.handle.net/10589/179132 (accessed on 5 May 2022).
- Bermudez, J.; Hannula, I. Hydrogen—IEA Paris. 2021. Available online: https://www.iea.org/reports/hydrogen (accessed on 5 May 2022).
- Spöri, C.; Kwan, J.T.H.; Bonakdarpour, A.; Wilkinson, D.P.; Strasser, P. The stability challenges of oxygen evolving catalysts: Towards a common fundamental understanding and mitigation of catalyst degradation. Angew. Chem. 2017, 56, 5994–6021. [Google Scholar] [CrossRef]
- Neyerlin, K.C.; Gu, W.; Jorne, J.; Clark, A.; Gasteiger, H.A. Cathode catalyst utilization for the ORR in a PEMFC. J. Electrochem. Soc. 2007, 154, B279. [Google Scholar] [CrossRef]
- Ahluwalia, R.K.; Wang, X.; Osmieri, L.; Peng, J.-K.; Chung, H.T.; Neyerlin, K.C. Performance of polymer electrolyte fuel cell electrodes with atomically dispersed (AD) Fe-C-N ORR catalyst. J. Electrochem. Soc. 2019, 166, F1096–F1104. [Google Scholar] [CrossRef]
- Gu, W.; Baker, D.R.; Liu, Y.; Gasteiger, H.A. Handbook of Fuel Cells; John Wiley & Sons: Chichester, UK, 2009. [Google Scholar]
- Bernt, M.; Hartig-Weiß, A.; Tovini, M.F.; El-Sayed, H.A.; Schramm, C.; Schröter, J.; Gebauer, C.; Gasteiger, H.A. Current challenges in catalyst development for PEM water electrolyzers. Chem. Ing. Tech. 2020, 92, 31–39. [Google Scholar] [CrossRef]
- Lee, J.K.; Lee, C.; Fahy, K.F.; Zhao, B.; LaManna, J.M.; Baltic, E.; Jacobson, D.L.; Hussey, D.S.; Bazylak, A. Critical current density as a performance indicator for gas-evolving electrochemical devices. Cell Rep. Phys. Sci. 2020, 1, 100147. [Google Scholar] [CrossRef]
- Kadyk, T.; Bruce, D.; Eikerling, M. How to enhance gas removal from porous electrodes? Sci. Rep. 2016, 6, 38780. [Google Scholar] [CrossRef]
- Mirshekari, G.; Ouimet, R.; Zeng, Z.; Yu, H.; Bliznakov, S.; Bonville, L.; Niedzwiecki, A.; Capuano, C.; Ayers, K.; Maric, R. High-performance and cost-effective membrane electrode assemblies for advanced proton exchange membrane water electrolyzers: Long-term durability assessment. Int. J. Hydrogen Energy 2021, 46, 1526–1539. [Google Scholar] [CrossRef]
- Klose, C.; Trinke, P.; Böhm, T.; Bensmann, B.; Vierrath, S.; Hanke-Rauschenbach, R.; Thiele, S. Membrane interlayer with pt recombination particles for reduction of the anodic hydrogen content in PEM water electrolysis. J. Electrochem. Soc. 2018, 165, F1271–F1277. [Google Scholar] [CrossRef]
- Steinbach, A.J. Low-Cost, High Performance Catalyst Coated Membranes for PEM Water Electrolyzers. U.S. DOE 2020 Annual Merit Review, 21 May 2020. Available online: https://www.hydrogen.energy.gov/pdfs/review20/ta026_steinbach_2020_o.pdf (accessed on 5 May 2022).
- Garbe, S.; Samulesson, E.; Schmidt, T.J.; Gubler, L. Comparison of Pt-doped membranes for gas crossover suppression in polymer electrolyte water electrolysis. J. Electrochem. Soc. 2021, 168, 104502. [Google Scholar] [CrossRef]
- Ouimet, R.J.; Yu, H.; Mirshekari, G.; Zeng, Z.; Bonville, L.J.; Bliznakov, S.; Niedzwiecki, A.; Mani, P.; Capuano, C.; Ayers, K.E.; et al. Development of recombination layers to reduce gas crossover for proton exchange membrane water electrolyzers by reactive spray deposition technology. ECS Meet. Abstr. 2020, MA2020-02, 2469. [Google Scholar] [CrossRef]
- Hamdan, M. PEM Electrolyzer Incorporating an Advanced Low-Cost Membrane Final Scientific and Technical Report. U.S. Department of Energy, DOE/GO/18065-22. 2013. Available online: https://www.osti.gov/servlets/purl/1091385 (accessed on 5 May 2022).
- Mathias, M.F.; Roth, J.; Fleming, J.; Lehnert, W. Diffusion media materials and characterization. In Handbook Fuel Cells; John Wiley & Sons, Ltd.: Hoboken, NJ, USA, 2010; Volume 3. [Google Scholar] [CrossRef]
- Smolinka, T.; Ojong, E.T.; Garche, J. Hydrogen production from renewable energies-electrolyzer technologies. Electrochem. Energy Storage Renew. Sources Grid Balanc. 2015, 8, 103–128. [Google Scholar] [CrossRef]
- Lettenmeier, P.; Gago, A.S.; Friedrich, K.A. Protective coatings for low-cost bipolar plates and current collectors of proton exchange membrane electrolyzers for large scale energy storage from renewables. In New Technologies in Protective Coatings; IntechOpen: London, UK, 2017; Volume 13, Available online: https://www.intechopen.com/chapters/55381 (accessed on 5 May 2022).
- Newman, J.; Thomas-Alyea, K.E. Electrochemical Systems, 3rd ed.; John Wiley and Sons, Inc.: Hoboken, NJ, USA, 2004. [Google Scholar]
- Trinke, P.; Haug, P.; Brauns, J.; Bensmann, B.; Hanke-Rauschenbach, R.; Turek, T. Hydrogen crossover in PEM and alkaline water electrolysis: Mechanisms, direct comparison and mitigation strategies. J. Electrochem. Soc. 2018, 165, F502–F513. [Google Scholar] [CrossRef]
- Schröder, V.; Emonts, B.; Janßen, H.; Schulze, H.P. Explosion limits of hydrogen/oxygen mixtures at initial pressures up to 200 bar. Chem. Eng. Technol. 2004, 27, 847–851. [Google Scholar] [CrossRef]
- Weiß, A.; Siebel, A.; Bernt, M.; Shen, T.-H.; Tileli, V.; Gasteiger, H.A. Impact of intermittent operation on lifetime and performance of a PEM water electrolyzer. J. Electrochem. Soc. 2019, 166, F487–F497. [Google Scholar] [CrossRef]
- Minke, C.; Suermann, M.; Bensmann, B.; Hanke-Rauschenbach, R. Is iridium demand a potential bottleneck in the realization of large-scale PEM water electrolysis? Int. J. Hydrogen Energy 2021, 46, 23581–23590. [Google Scholar] [CrossRef]
- Katsounaros, I.; Cherevko, S.; Zeradjanin, A.R.; Mayrhofer, K.J.J. Oxygen electrochemistry as a cornerstone for sustainable energy conversion. Angew. Chem. Int. Ed. Engl. 2014, 53, 102–121. [Google Scholar] [CrossRef]
- Cherevko, S.; Geiger, S.; Kasian, O.; Mingers, A.; Mayrhofer, K.J.J. Oxygen evolution activity and stability of iridium in acidic media. Part 1—Metallic iridium. J. Electroanal. Chem. 2016, 773, 69–78. [Google Scholar] [CrossRef]
- Böhm, D.; Beetz, M.; Gebauer, C.; Bernt, M.; Schröter, J.; Kornherr, M.; Zoller, F.; Bein, T.; Fattakhova-Rohlfing, D. Highly conductive titania supported iridium oxide nanoparticles with low overall iridium density as OER catalyst for large-scale PEM electrolysis. Appl. Mater. Today 2021, 24, 101134. [Google Scholar] [CrossRef]
- Babic, U.; Nilsson, E.; Pătru, A.; Schmidt, T.J.; Gubler, L. Proton transport in catalyst layers of a polymer electrolyte water electrolyzer: Effect of the anode catalyst loading. J. Electrochem. Soc. 2019, 166, F214–F220. [Google Scholar] [CrossRef]
- Ito, H.; Maeda, T.; Nakano, A.; Takenaka, H. Properties of Nafion membranes under PEM water electrolysis conditions. Int. J. Hydrogen Energy 2011, 36, 10527–10540. [Google Scholar] [CrossRef]
- Giancola, S.; Zatoń, M.; Reyes-Carmona, Á.; Dupont, M.; Donnadio, A.; Cavaliere, S.; Rozière, J.; Jones, D.J. Composite short side chain PFSA membranes for PEM water electrolysis. J. Memb. Sci. 2019, 570–571, 69–76. [Google Scholar] [CrossRef]
- Harrison, K.W.; Remick, R.; Martin, G.D.; Hoskin, A. Hydrogen production: Fundamentals and case study summaries. In Proceedings of the 18th World Hydrogen Energy Conference, Essen, Germany, 16–21 May 2010; Available online: https://www.nrel.gov/docs/fy10osti/47302.pdf (accessed on 5 May 2022).


Disclaimer/Publisher’s Note: The statements, opinions and data contained in all publications are solely those of the individual author(s) and contributor(s) and not of MDPI and/or the editor(s). MDPI and/or the editor(s) disclaim responsibility for any injury to people or property resulting from any ideas, methods, instructions or products referred to in the content. |
© 2023 by the authors. Licensee MDPI, Basel, Switzerland. This article is an open access article distributed under the terms and conditions of the Creative Commons Attribution (CC BY) license (https://creativecommons.org/licenses/by/4.0/).