Article

Stator ITSC Fault Diagnosis for EMU Induction Traction Motor Based on Goertzel Algorithm and Random Forest

1
College of Locomotive and Rolling Stock Engineering, Dalian Jiaotong University, Dalian 116028, China
2
Department of Railway Rolling Stock, Liaoning Railway Vocational and Technical College, Jinzhou 121000, China
*
Author to whom correspondence should be addressed.
Energies 2023, 16(13), 4949; https://doi.org/10.3390/en16134949
Submission received: 20 May 2023 / Revised: 19 June 2023 / Accepted: 24 June 2023 / Published: 26 June 2023

Abstract

:
The stator winding insulation system is the most critical and weakest part of the EMU’s (electric multiple unit’s) traction motor. The effective diagnosis for stator ITSC (inter-turn short-circuit) faults can prevent a fault from expanding into phase-to-phase or ground short-circuits. The TCU (traction control unit) controls the traction inverter to output SPWM (sine pulse width modulation) excitation voltage when the traction motor is at a standstill. Three ITSC fault diagnostic conditions are based on different IGBTs’ control logics. The Goertzel algorithm is used to calculate the fundamental current amplitude difference Δi and phase angle difference Δθ of equivalent parallel windings under the three diagnostic conditions. The six parameters under the three diagnostic conditions are used as features to establish an ITSC fault diagnostic model based on the random forest. The proposed method was validated using a simulation experimental platform for the ITSC fault diagnosis of EMU traction motors. The experimental results indicate that the current amplitude features Δi and phase angle features Δθ change obviously with an increase in the ITSC fault extent if the ITSC fault occurs at the equivalent parallel windings. The accuracy of the ITSC fault diagnosis model based on the random forest for ITSC fault detection and location, both in train and test samples, is 100%.

1. Introduction

EMUs’ electric drive systems generally adopt AC drive modes, and AC induction motors are used for electromechanical energy conversion to generate toque, driving the EMUs. The traction motors, which produce traction and electric braking force, play a crucial role in the EMUs’ normal operation [1]. Due to reliable operation and convenient maintenance, the three-phase squirrel cage induction motor is still the main form of traction motors [2]. The insulation system is the “heart” of the traction motor. The traction motor is powered by a traction converter, and the inverter generally uses SVPWM (space vector pulse width modulation) and square wave power supply to the traction motor for different control stages [3,4]. The stator ITSC fault of the induction motor accounts for 37% in industry application, and it is more destructive than rotor bar breakage, air gap eccentricity, and bearing faults [5,6]. Due to the effect of the SVPWM voltage pulses supplied by the inverter, the traction motor bears greater voltage stress and is also affected by thermal stress and environmental factors, and thus, the ITSC fault is more prominent. If the ITSC fault can be accurately diagnosed during the incipient stage, it can be avoided to expand into ground short-circuit or phase-to-phase short-circuit faults while saving maintenance costs. An accurate ITSC fault diagnosis can provide a reference for the traction motor’s state-based repair. The diagnosis methods for stator ITSC faults in induction motors mainly include model-based fault diagnosis, signal-analysis-based fault diagnosis, and artificial-intelligence-based fault diagnosis.
The model-based diagnosis of ITSC faults mainly includes two approaches: state variable observation and parameter estimation methods. A coordinate transformation theory was used to obtain a dynamic model of an induction motor with an ITSC fault and convert the model into a state equation form that is amenable to numerical simulation [7]. The negative sequential current value of an induction motor was estimated from this model to determine the ITSC fault degree. A mathematical model of the induction motor with the stator ITSC fault was established, and an adaptive observer was designed using this model [8]. The observer can estimate the stator inter-turn insulation state under voltage imbalance and speed change conditions. This diagnosis method can be applied to the grid and converter supply conditions. A new stator ITSC fault detection method was proposed based on the model [9]. The state observer was used to generate a specific residual vector. This approach allows the rapid monitoring of ITSC faults at the initial stage. To compensate for the impact of non-equilibrium supply voltage and the existing asymmetry of the three-phase windings, a new stator ITSC fault model for the induction motor was proposed [10]. This model can accurately determine an ITSC fault’s extent and location. The motor models were established with ITSC-fault-related parameters, and the motor faults can be diagnosed by identifying the fault parameters [11,12,13]. The genetic algorithm was used to estimate the basic parameters of the motor, including the stator and rotor resistance, the self inductance and mutual inductance, and the number of turns in the short-circuit phase [14]. These parameters are closely related to the stator ITSC fault.
Signal-based diagnostic methods for ITSC faults mainly use traditional FFT transform, power spectrum analysis, and modern time-frequency analysis to detect ITSC faults. After the outage, the ITSC fault was diagnosed by detecting the third harmonic component value in the residual voltage. This method is not affected by motor parameters and power supply imbalance [15]. The stator ITSC fault in a three-phase induction motor was diagnosed by analyzing the third harmonic component in the positive and negative sequence currents [16]. A new method for parameter spectrum estimation was proposed that can take the advantage of fault-sensitive frequencies and obtain high-precision frequencies using the maximum likelihood estimation method [17]. The lower sideband of the power supply frequencies was analyzed, and the Kalman Filter was used to estimate the harmonic amplitude [18]. The total distortion of instantaneous harmonic current in each phase was used as the fault judgment criterion. If the amplitude at a certain phase exceeded a predetermined threshold, it was determined that the ITSC fault had occurred. Discrete wavelet or wavelet packet transform was used to analyze the current value, power spectral density, and other parameters [19,20,21,22,23,24]. Parameters such as the energy ratio of a particular frequency band were used for fault diagnosis in the induction motors. In addition to the wavelet method, time–frequency analysis methods such as EMD (empirical mode decomposition) can also be applied to diagnose stator ITSC faults in induction motors [25].
Artificial intelligence methods for ITSC fault diagnosis in induction motor stators mainly use intelligent pattern recognition methods such as neural networks to evaluate and locate ITSC faults [26,27,28]. The energy ratio of the three-phase current frequency bands, calculated with the discrete wavelet transform, was taken as the fault feature. The Bayesian regularization Elman network is a fault diagnosis model that can achieve high accuracy in ITSC fault detection and location at the ITSC incipient stage [29]. A HCNN (hierarchical convolution neural network) with a two-layer hybrid structure and a SVM (support vector machine) algorithm was proposed to diagnose induction motor incipient ITSC faults. The HCNN network identified stator fault modes and extracted fault features, and the SVM evaluated the fault extents [30]. The random forest and XGBoost were used to diagnose mixed faults. A two-phase current was filtered and used as the diagnostic signal. The wavelet packet decomposition was used to extract fault features, and finally, PCA (principal component analysis) was used to reduce the fault features’ dimensions. This method took a CRH2 (China railway high-speed) traction motor as the diagnostic object and proved its effectiveness through a semi-physical simulation system [31].
Although there have been more and more research achievements in industrial induction motors for stator ITSC diagnosis, there are specific requirements for the diagnosis of ITSC faults in EMUs’ induction traction motors. In the case of converter power supply, closed-loop control, and complex harmonics, ITSC fault diagnosis for traction motors is still an open problem [32]. Diagnostic methods for stator winding based on fault signals such as negative sequence current components, zero sequence voltage, and high order current harmonics are essential to detect asymmetries in three-phase winding. This article proposes a method of controlling traction inverter IGBTs to detect the asymmetry of the three-phase winding in the standstill state of a traction motor. The traction converter is used to output the SPWM excitation voltage. According to the different IGBT control logics, three ITSC fault diagnostic conditions exist. The Goertzel algorithm is used to calculate the fundamental current amplitude difference Δi and phase angle difference Δθ of equivalent parallel windings under diagnostic conditions. The fundamental amplitude differences Δi and phase angle differences Δθ of equivalent parallel windings under three diagnostic conditions are used as fault features. The random forest is used to establish the traction motor ITSC fault diagnosis model. After training, the ITSC fault detection and location model based on the random forest can detect a traction motor’s ITSC fault and locate the ITSC fault (a, b, c phase windings). The extent of the ITSC fault can also be evaluated according to the fault features. This method can be implemented by utilizing only the existing current sensors in the traction system, without additional sensors, and is a non-invasive fault diagnosis method. The ITSC faults are detected in the standstill state of the studied traction motor, and the diagnosis is not affected by other faults such as rotor bar breakage and air gap eccentricity. The ITSC fault diagnosis method proposed in this article for traction motors in a standstill state has a stable fault diagnosis environment. The diagnosis process is unaffected by load and speed, making the diagnosis more accurate and reliable.
The article consists of six sections. After the introduction of the current method used for ITSC fault diagnosis in the industry, a brief introduction of the new diagnosis method for EMUs’ traction motors is presented. The traction motor stator ITSC fault diagnostic condition control method is presented in Section 2. The TCU controlled the traction inverter to work in three diagnostic conditions. The SPWM excitation voltage control and the Goertzel algorithm are presented in Section 3. The frequency and modulation index of SPWM excitation voltage were set, and the Goertzel algorithm was used to compute the amplitude and phase angle of a three-phase current fundamental component. The fault feature extraction method and the random forest model are presented in Section 4, and the flowchart of the new method for ITSC fault diagnosis is also presented in this section. In Section 5, the EMU traction motor ITSC simulation experimental platform and the signal measurement system, are described, and the voltage and current signal of the platform are also analyzed in this section. The experimental results of the stator ITSC fault method based on the Goertzel algorithm and random forest are given, and the comparisons with other machine learning algorithms in accuracy are also presented in Section 5. The paper is concluded with a short summary.

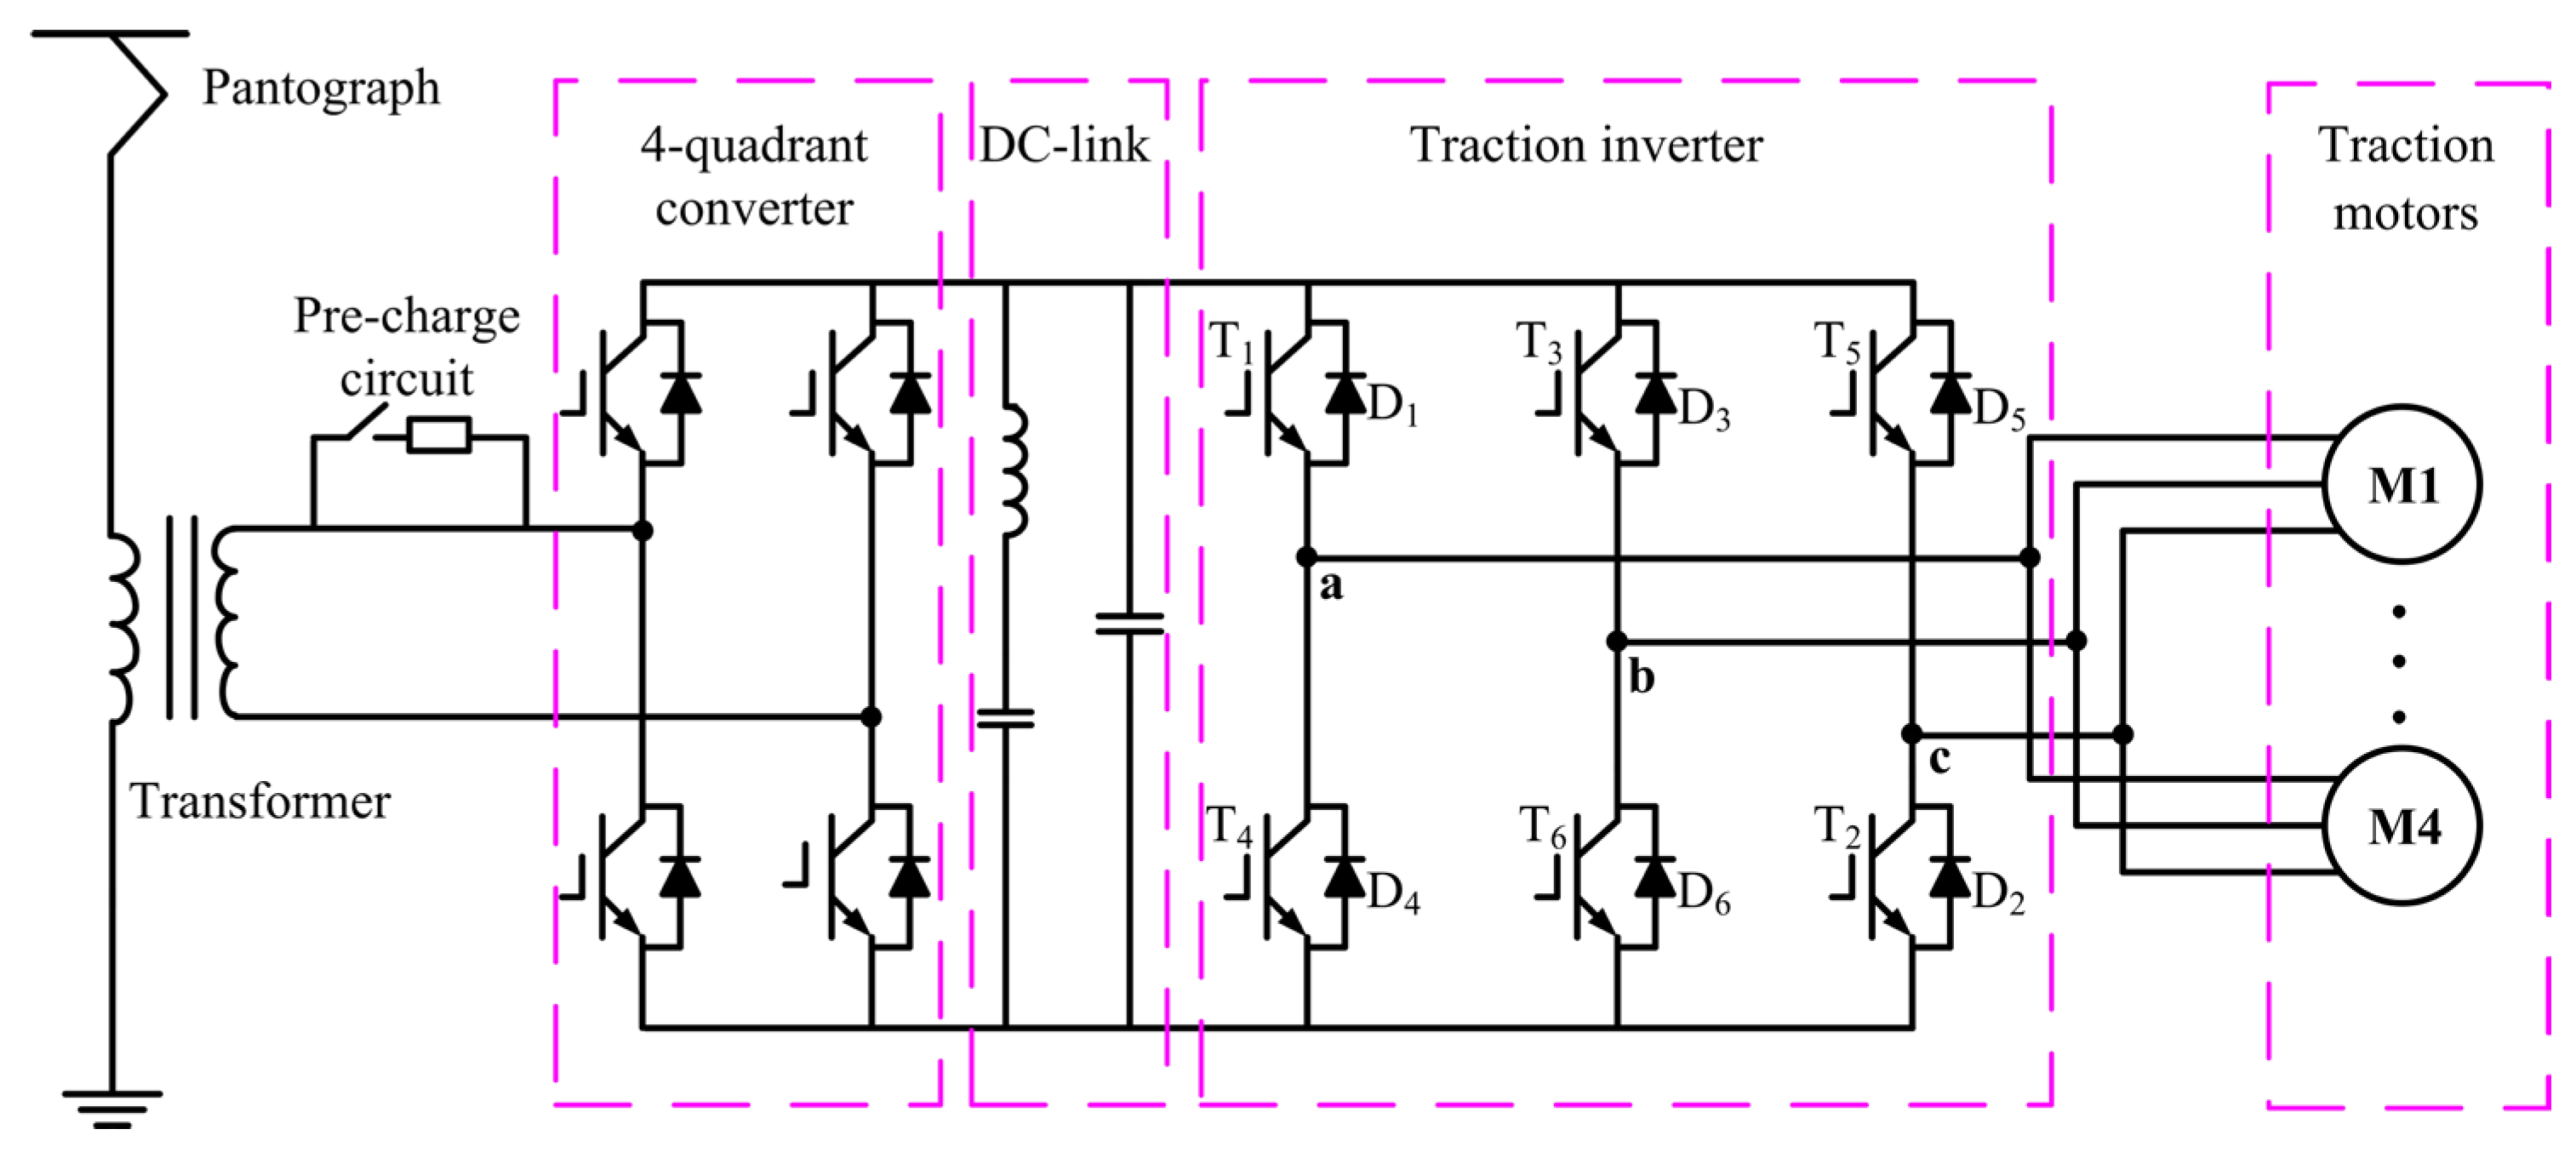
2. Traction Motor Stator ITSC Fault Diagnostic Condition Control

Figure 1 shows the structural diagram of the EMU traction system, which mainly consists of a 4-quadrant rectifier, a DC-link, a traction inverter, and traction motors. The 4-quadrant rectifier rectifies the 25 kV/50 Hz single-phase AC pulled in by the pantograph into DC, and the DC link mainly includes a second harmonic filter circuit and support capacitors. The traction inverter inverts DC voltage into a three-phase VVVF (variable frequency variable voltage) AC power supply to drive the traction motor to operate. The TCU primarily controls the EMU traction system.

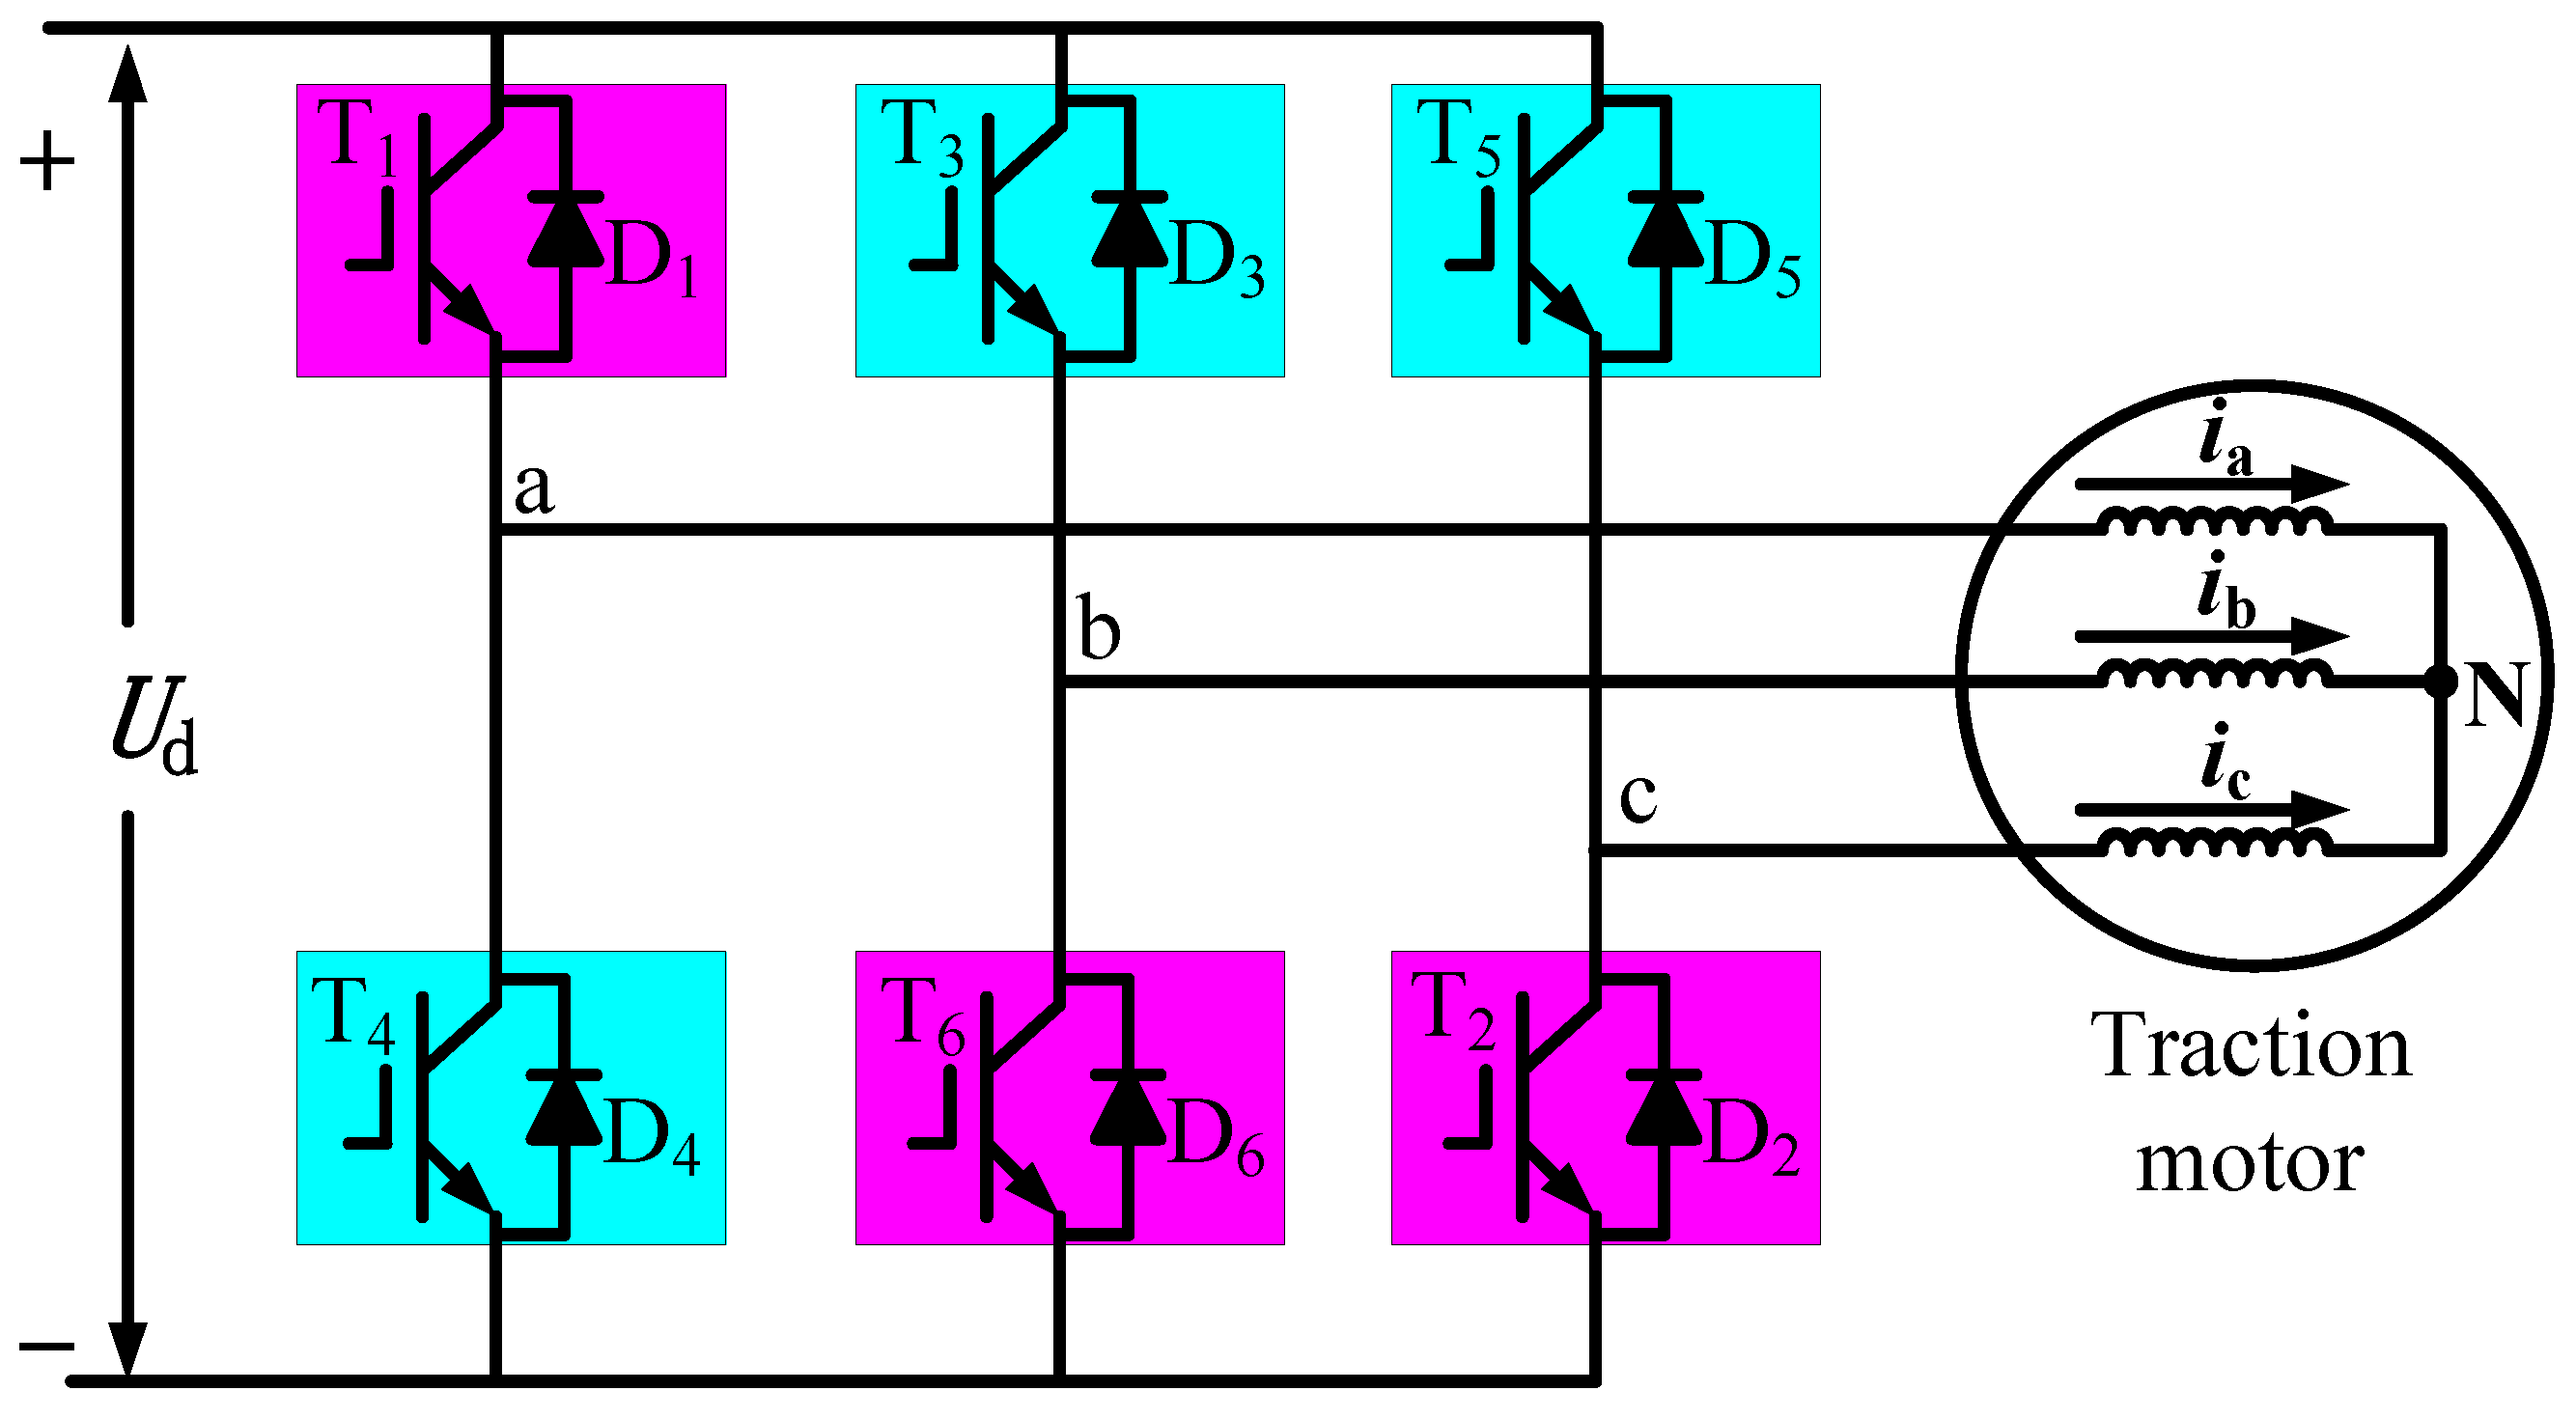
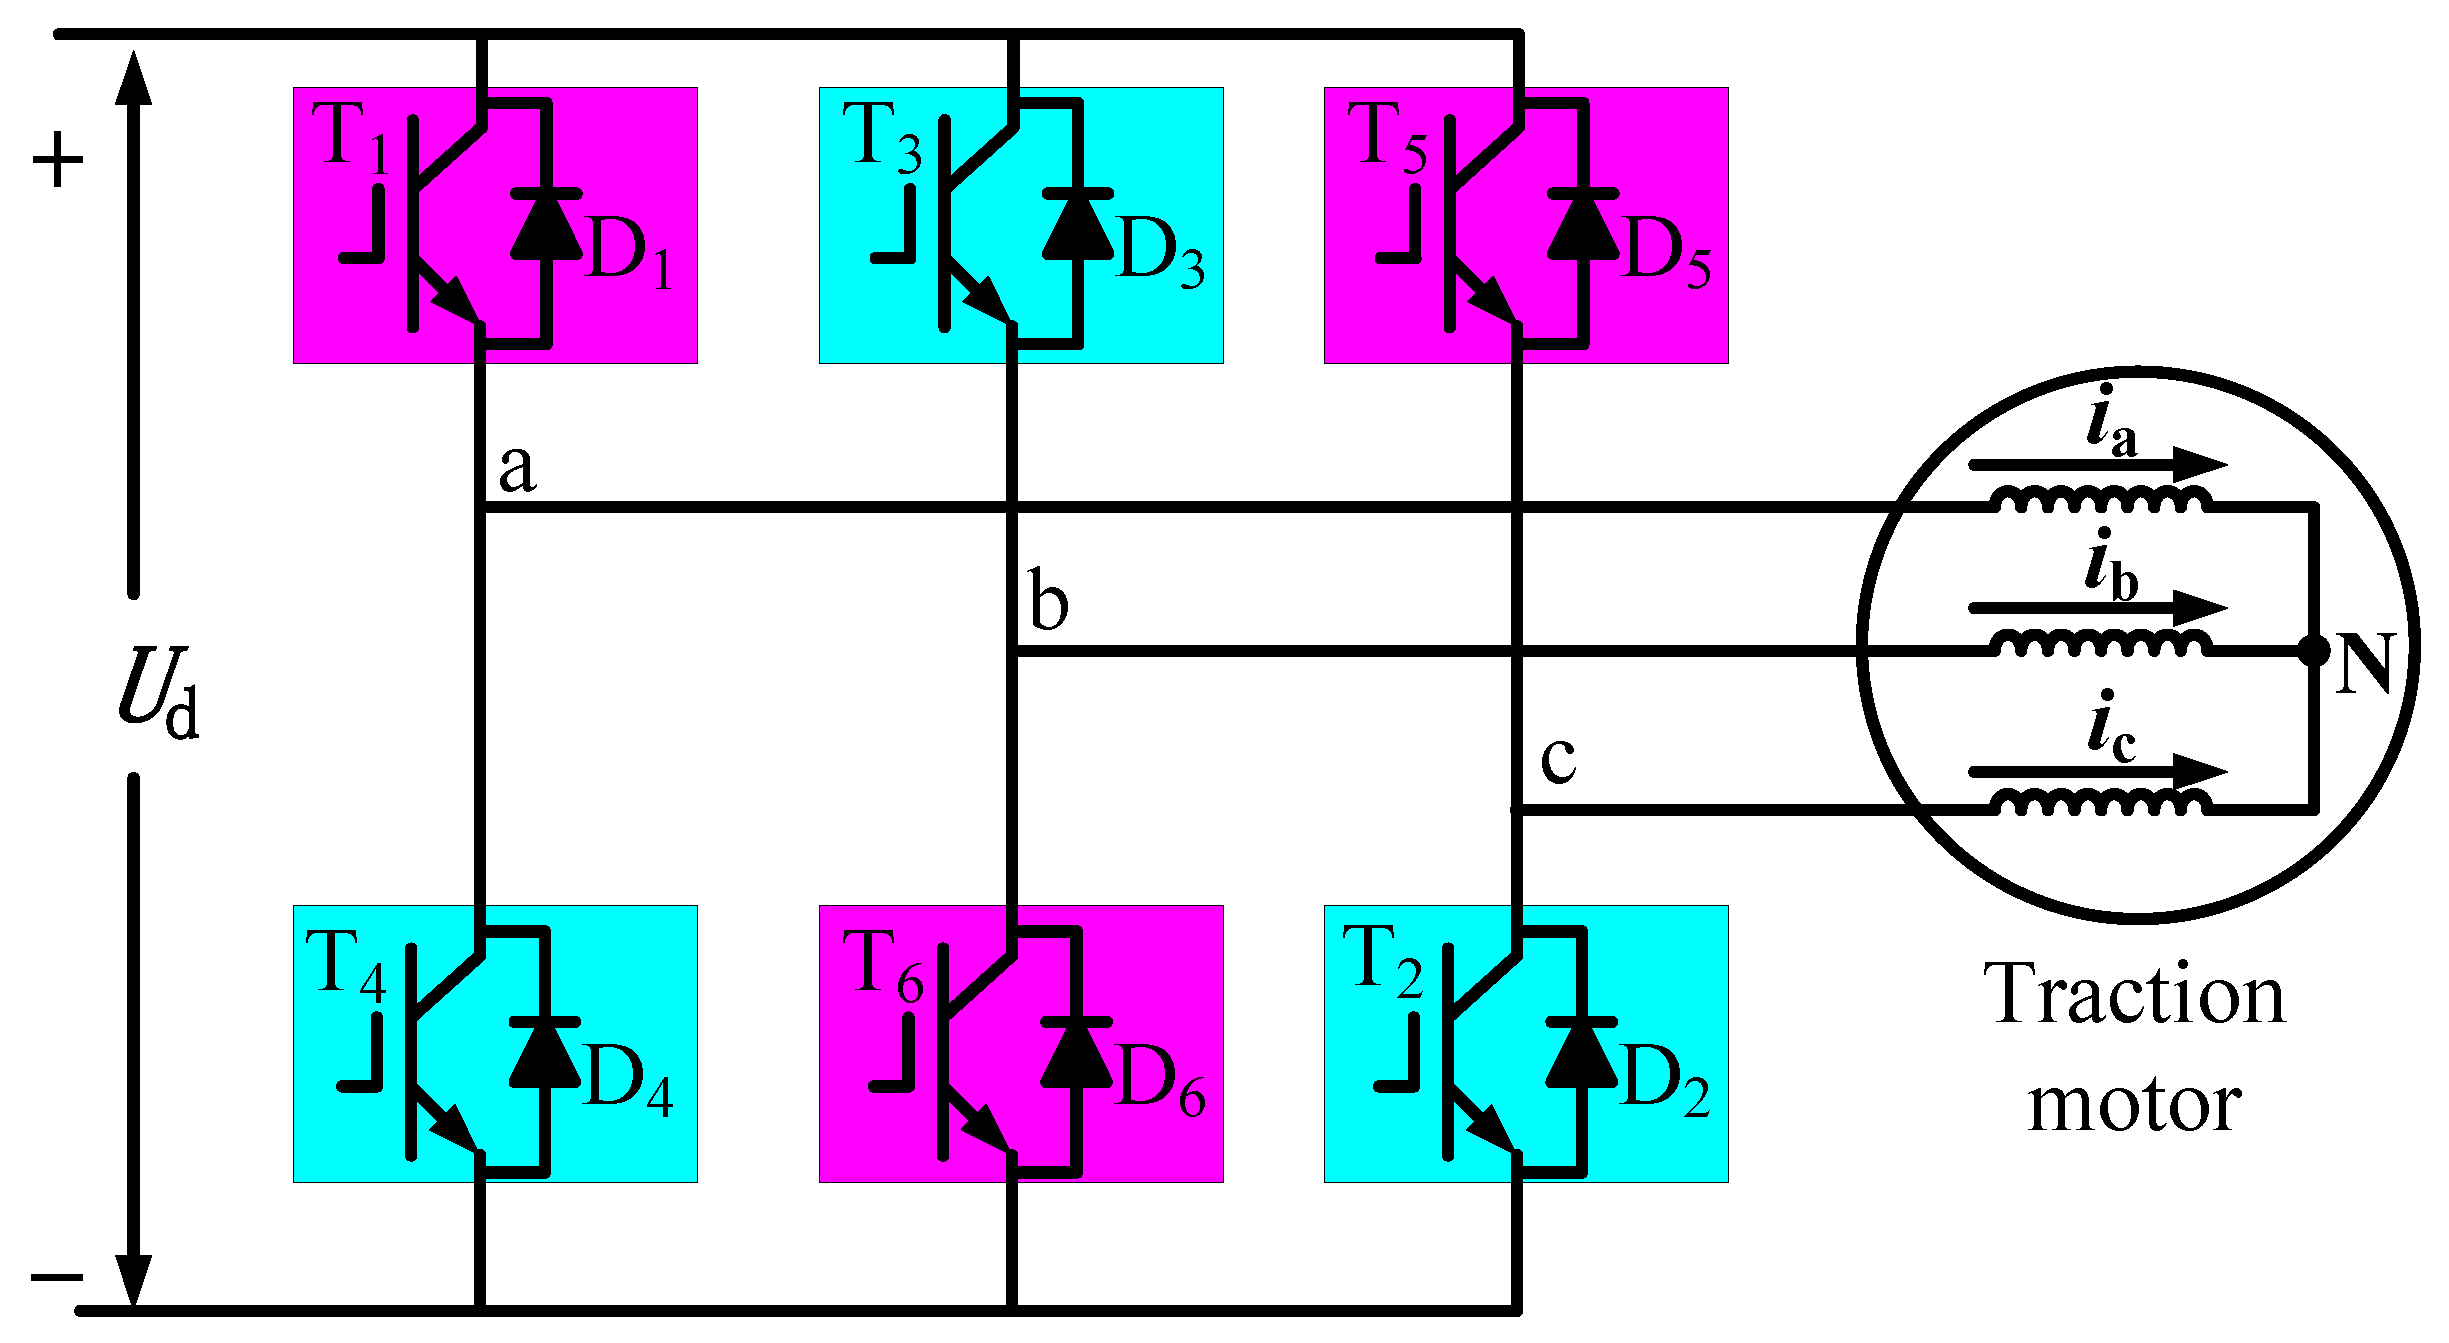
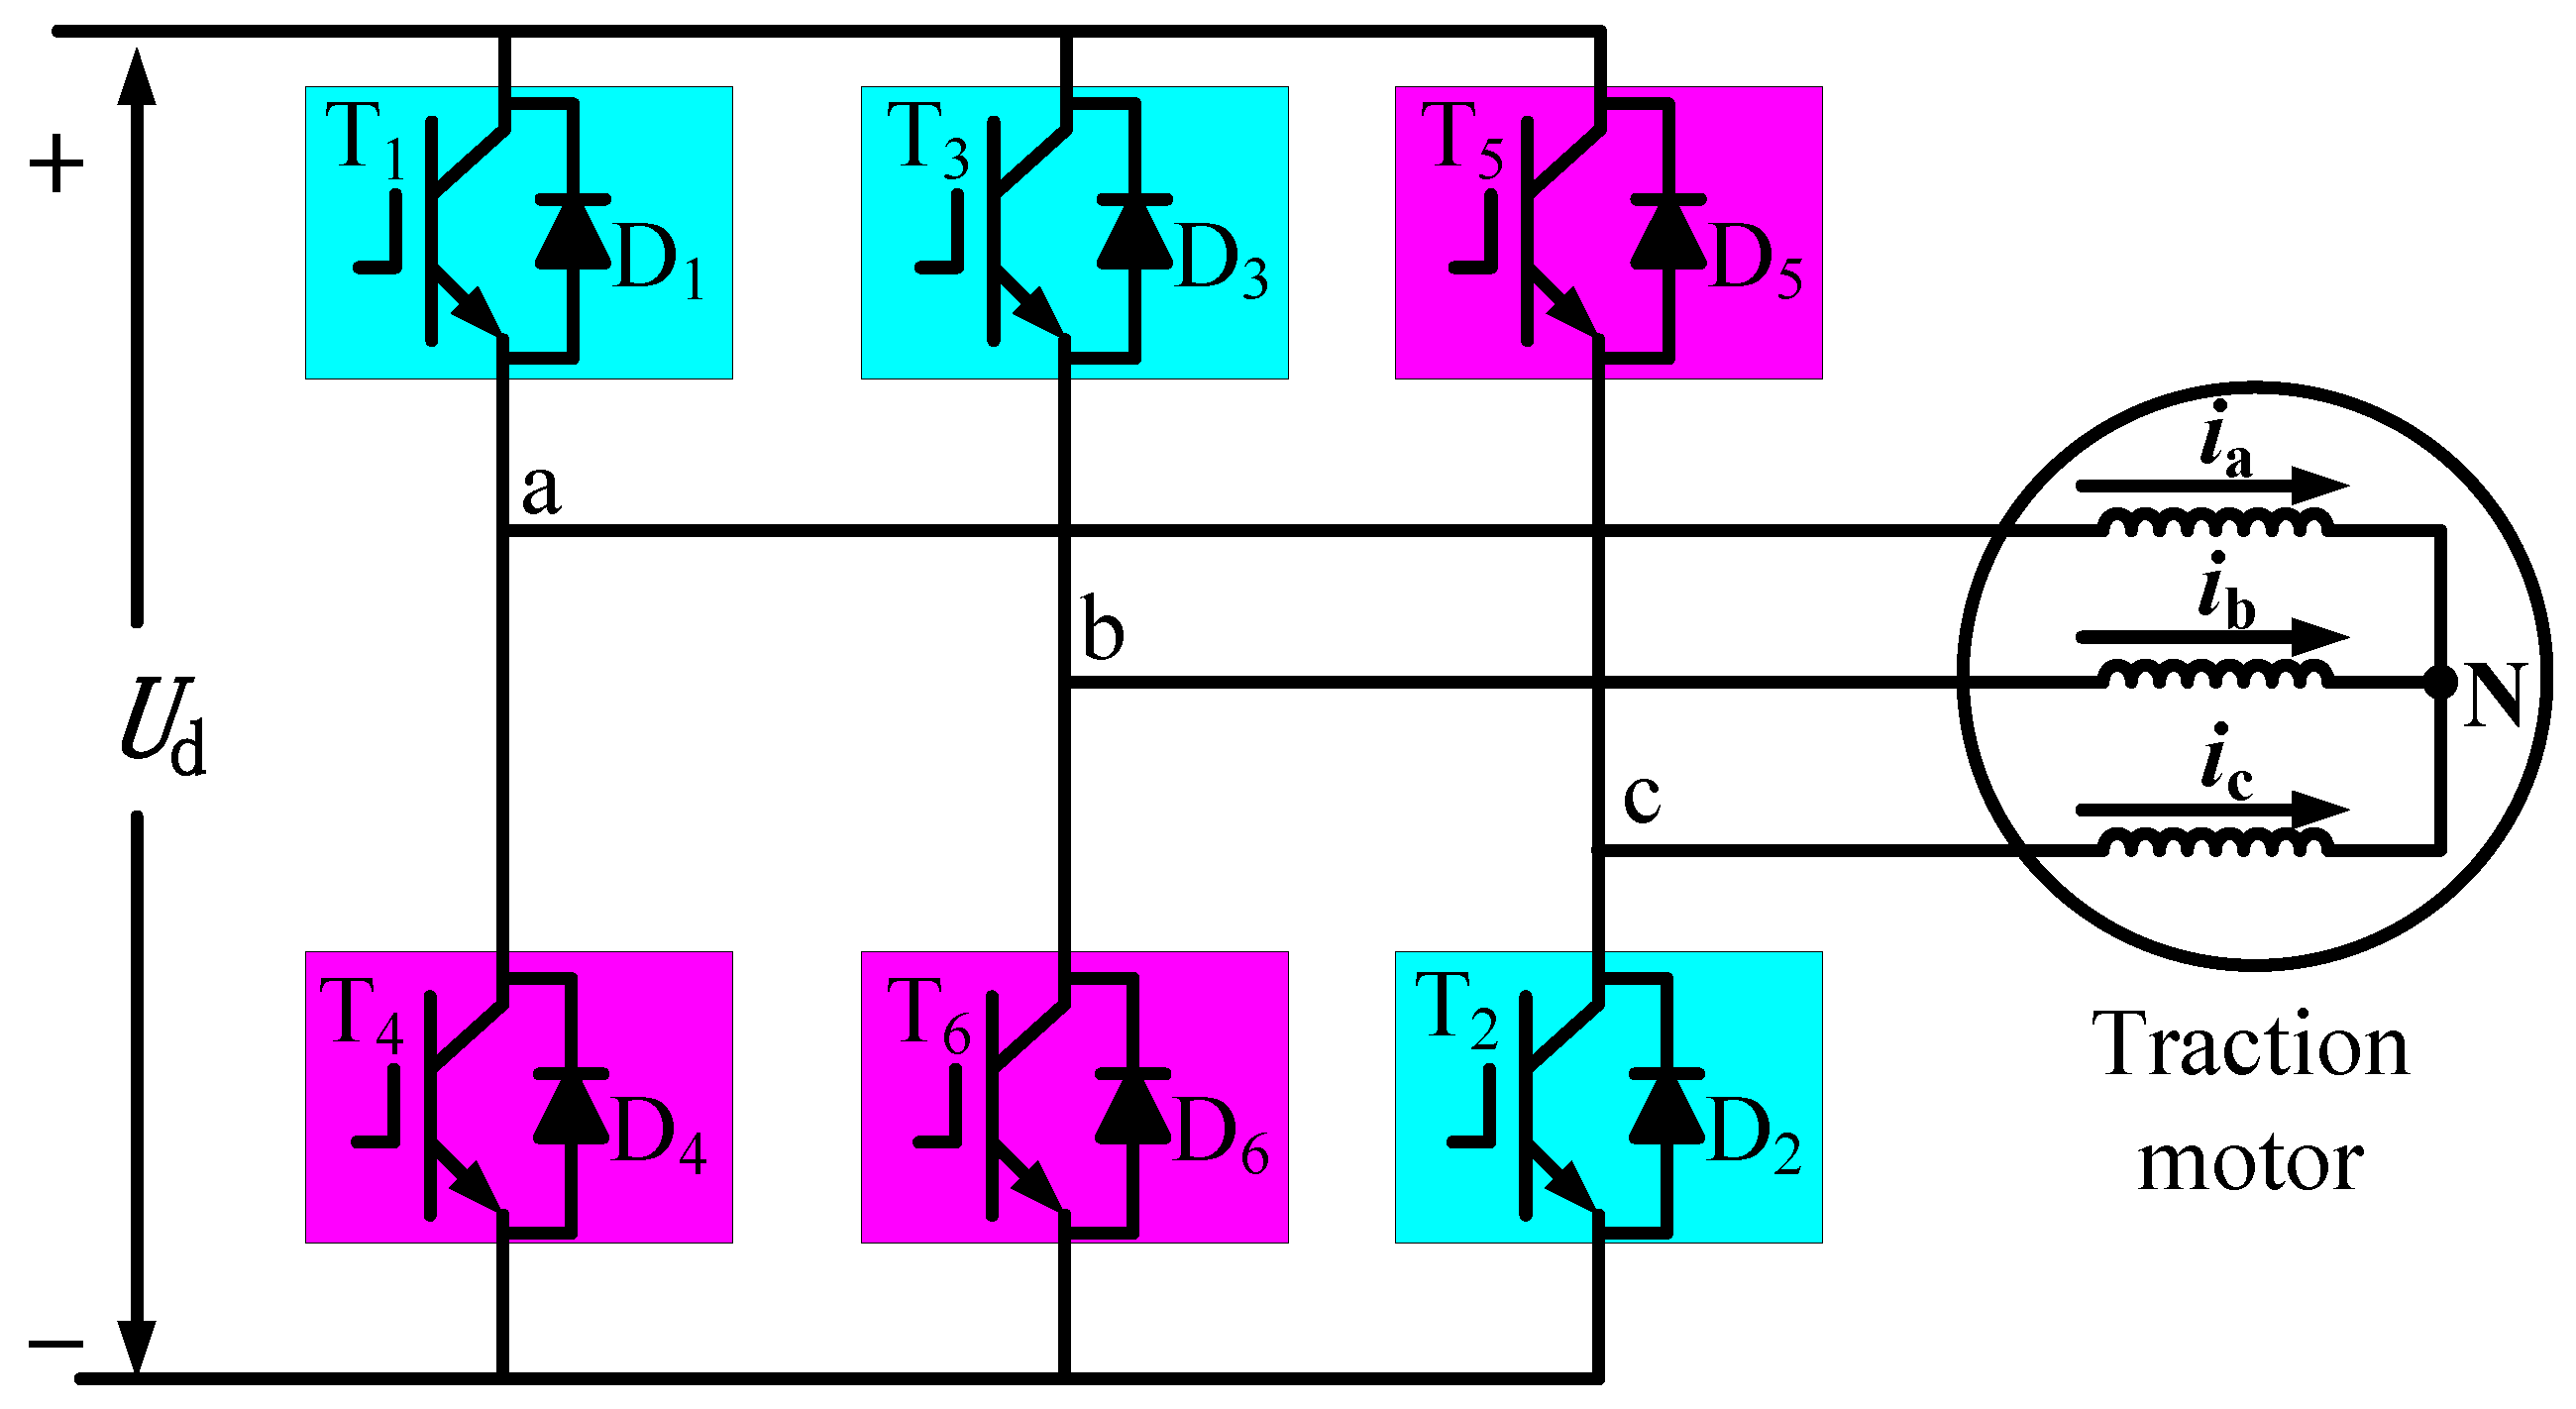
2.1. Working Status of Two-Level Traction Inverter

The main circuit topology of the two-level traction inverter, which is shown in Figure 1, mainly consists of six IGBTs, T1, T2, T3, T4, T5, and T6, forming a three-phase full bridge inverter circuit. For the convenience of analysis, three ideal switching functions are usually defined [6]: SA = {1—T1 switch on; 0—T4 switch on}, SB = {1—T3 switch on; 0—T6 switch on}, SC = {1—T5 switch on; 0—T2 switch on}. There are eight combinations of SA, SB, and SC, and their switch states in various modes are shown in Table 1.

2.2. ITSC Fault Diagnostic Condition Control

Traction motor ITSC fault diagnostic condition Ⅰ is shown in Figure 2. The driving signals of T1, T2, and T6 are the same, and are switched on and off simultaneously; the driving signals of T3, T4, and T5 are the same, and are switched on and off simultaneously. When T1, T2, and T6 are switched on, and T3, T4, and T5 are switched off simultaneously, this is equivalent to applying a voltage vector U 4 to the traction motor; when T3, T4, and T5 are switched on, and T1, T2, and T6 are switched off simultaneously, this is equivalent to applying a voltage vector U 3 to the traction motor. The directions of the three currents ia, ib, and ic in Figure 2 represent the currents’ reference directions. Suppose the IGBT driving signals Ugs1, Ugs2, Ugs6, Ugs3, Ugs4, and Ugs5 drive the IGBTs in a bipolar sine pulse width modulation mode. The intermediate DC voltage applies single-phase SPWM voltages to the stator windings of the traction motor. Under diagnostic condition Ⅰ, the b-phase winding and the c-phase winding of the traction motor are connected in parallel and then in series with the a-phase winding.
Traction motor ITSC fault diagnostic condition Ⅱ is shown in Figure 3. The driving signals of T2, T3, and T4 are the same, and are switched on and off simultaneously; the driving signals of T1, T5, and T6 are the same and switched on and off simultaneously. When T2, T3, and T4 are switched on, and T1, T5, and T6 are switched off simultaneously, this is equivalent to applying a voltage vector U 5 to the traction motor; when T1, T5 and T6 are switched on, and T2, T3, and T4 are switched off simultaneously, this is equivalent to applying a voltage vector U 2 to the traction motor. The directions of the three currents ia, ib, and ic in Figure 3 represent the currents’ reference directions. Suppose the IGBT driving signals Ugs1, Ugs5, Ugs6, Ugs2, Ugs3, and Ugs4 drive the IGBTs in a bipolar sine pulse width modulation mode. The intermediate DC voltage applies single-phase SPWM voltages to the stator windings of the traction motor. Under diagnostic condition Ⅱ, the a-phase winding and the c-phase winding of the traction motor are connected in parallel and then in series with the b-phase winding.
Traction motor ITSC fault diagnostic condition Ⅲ is shown in Figure 4. The driving signals of T1, T2, and T3 are the same, and are switched on and off simultaneously; the driving signals of T4, T5, and T6 are the same, and are switched on and off simultaneously. When T1, T2, and T3 are switched on, and T4, T5, and T6 are switched off simultaneously, this is equivalent to applying a voltage vector U 6 to the traction motor; when T4, T5, and T6 are switched on, and T1, T2, and T3 are switched off simultaneously, this is equivalent to applying a voltage vector U 1 to the traction motor. The directions of the three currents ia, ib, and ic in Figure 4 represent the currents’ reference directions. Suppose the IGBT driving signals Ugs1, Ugs2, Ugs3, Ugs4, Ugs5, and Ugs6 drive the IGBTs in a bipolar sine pulse width modulation mode. The intermediate DC voltage applies single-phase SPWM voltages to the stator windings of the traction motor. Under diagnostic condition Ⅲ, the a-phase winding and the b-phase winding of the traction motor are connected in parallel and then in series with the c-phase winding.

2.3. Traction Motor Magnetomotive Force Analysis under Diagnostic Condition

Assuming that the traction motor is a complete symmetry motor, taking condition Ⅰ as an example, the fundamental currents of the three-phase winding are:
i a 1 = 2 2 I 1 cos w t i b 1 = i c 1 = 2 I 1 cos w t
In Formula (1), I1 represents the fundamental RMS value of the b-phase and c-phase currents, and w represents the fundamental angular frequency of the SPWM excitation voltage.
The axes of the three-phase winding are separated by an electrical angle of 120° in space, and the fundamental magnetomotive forces of phases a, b, and c are:
f a 1 = 2 F p 1 cos w t cos X f b 1 = F p 1 cos w t cos ( X 120 ° ) f c 1 = F p 1 cos w t cos ( X 240 ° )
The winding axis of the a-phase is taken to be the origin, and X represents the position of any point in the motor air gap. Fp1 is the maximum amplitude of the fundamental magnetomotive forces, and its expression is:
F p 1 = 0.9 I N s p k w
Ns is the number of series turns per phase of the stator winding, p is the number of pole pairs of the traction motor, and kw is the winding coefficient of the fundamental magnetomotive force. The resultant magnetomotive force at any point in the air gap under fault diagnostic condition Ⅰ is:
f 1 = f a 1 + f b 1 + f c 1 = 2 F p 1 cos w t cos X F p 1 cos w t cos ( X 120 ° ) F p 1 cos w t cos ( X 240 ° ) = 3 F p 1 cos w t cos X
Formula (4) shows that when diagnostic condition Ⅰ is applied to the traction motor, a pulsating magnetomotive force is generated in the traction motor’s air gap. Similarly, the traction motor under diagnostic conditions Ⅱ and Ⅲ also generates pulsating magnetomotive force so that no electromagnetic torque will be generated and the traction motor does not rotate.

3. SPWM Excitation Voltage and Goertzel Algorithm

3.1. Traction Motor SPWM Excitation Voltage Control

EMU traction motors generally use separate cooling fans for cooling. Therefore, when a traction motor’s RMS current value is controlled to be less than the nominal current value in the standstill state, the motor should not cause damage to the traction motor due to heating. Under various diagnostic conditions, the bipolar SPWM voltage modulation method is used to output the ITSC fault diagnosis excitation voltage. The modulated wave is a sine wave with a triangular wave as the carrier. An appropriate modulation wave frequency fr and carrier frequency fc are selected to determine the carrier ratio N.
N = f c f r
Under various diagnostic conditions, the inverter operates in a single-phase full bridge inverter state, and the fundamental amplitude of the output voltage is:
U 1 m = U d M
where Ud is the DC link voltage, and M is the SPWM modulation index, which is defined as follows:
M = U rm U cm
In Formula (7), Urm is the amplitude of the reference signal and Ucm is the amplitude of the carrier signal. The fundamental RMS value of the maximum current in the three-phase winding should reach a certain value smaller than that of the rated current. By controlling and adjusting the inverter SPWM modulation index M through TCU, the modulation index M of the SPWM excitation voltage is determined.

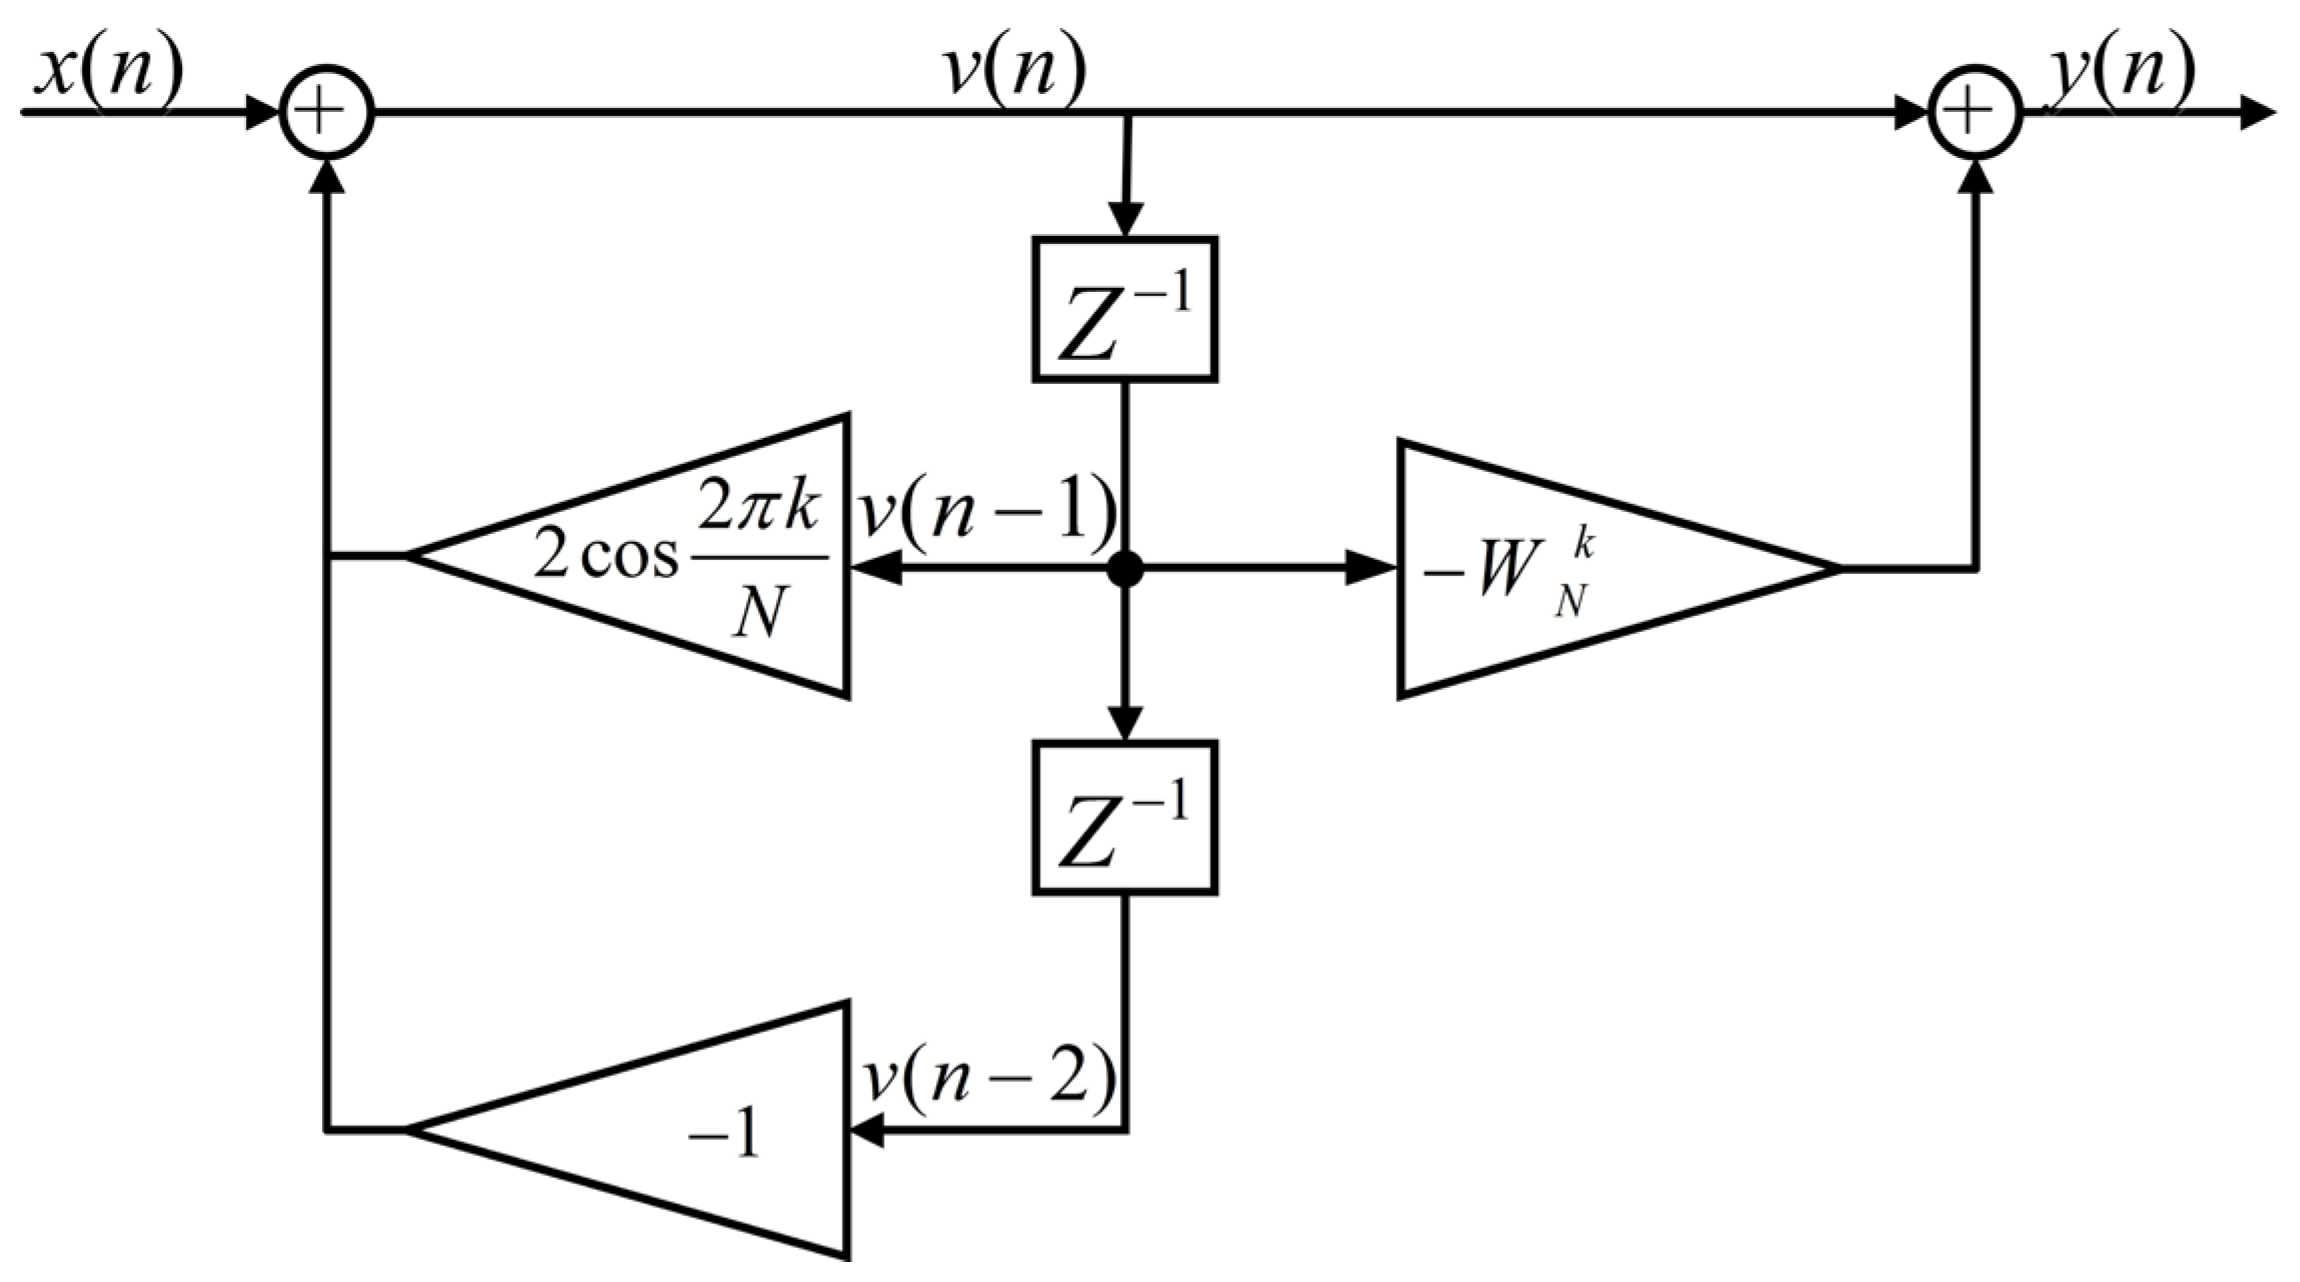
3.2. Calculation of Current Fundamental Component Using Goertzel Algorithm

TCU sets the frequency of excitation voltage input for ITSC fault diagnosis, and the current fundamental frequency can be obtained accurately. Under the condition that the exact current fundamental frequency is known, the current signals can be truncated throughout the entire cycle to avoid spectral leakage. The Goertzel algorithm can calculate only the amplitude and phase angle of the fundamental current component to reduce computational complexity and improve computational speed [33,34,35,36]. If x(n) is a sampling sequence of length N, k ∈ [0, N − 1], n ∈ [0, N − 1], where k and n are integers, then the DFT of x(n) is:
X ( k ) = n = 0 N 1 x ( n ) W N n k
In Formula (8), taking W N = e j 2 π N into the following formula, one obtains:
W N k N = e j 2 π k   N / N = e j 2 π k = 1
Multiplying Formula (9) to the right of Formula (8), one obtains:
X ( k ) = W N k N n = 0 N 1 x ( n ) W N k n = n = 0 N 1 x ( n ) W N k ( N n )
Two sequences are defined:
x e ( n ) = x ( n ) , 0 n N 1 0 , e l s e
h k ( n ) = W N k n , n 0 0 , n < 0
Formula (10) can be expressed as the convolution of the two sequences:
y k ( n ) = l = 0 N 1 x ( l ) W N k ( n l ) = x e ( n ) h k ( n )
A Z-transform is performed on Formula (13), following which the Z-transform of yk(n) is Yk(z), the Z-transform of xe(n) is Xk (z), and the Z-transform of hk(n) is Hk(z). The time-domain convolution of the two sequences is equal to the frequency domain multiplication. From Formula (12), it can be obtained thus:
H k ( z ) = 1 1 W N k z 1
1 W N k z 1 is multiplied by the numerator and denominator of Formula (14) simultaneously:
H k ( z ) = 1 W N k z 1 1 W N k z 1 1 W N k z 1 = 1 W N k z 1 1 2 cos ( 2 π k / N ) z 1 + z 2
The corresponding filter structure is shown in Figure 5, and the input–output relation of the filter is as follows:
v k ( n ) = 2 cos ( 2 π k / N ) v k ( n 1 ) v k ( n 2 ) + x ( n ) y k ( n ) = v k ( n ) W N k v k ( n 1 )
The filter output yk(N) in Figure 5 is the transformation coefficient X(k) of the N-point DFT at point k. If it is necessary to calculate the amplitude and phase angle of a specific frequency fk, the corresponding k value is:
k N = f k f s
where fs is the sampling frequency.
The amplitude and phase of a specific frequency find are calculated using the Goertzel algorithm as shown in Formulas (18) and (19):
| y ( N ) | 2 = v 2 ( N 1 ) + v 2 ( N 2 ) 2 cos 2 π k N v ( N 1 ) v ( N 2 )
θ = arg { y ( ( N ) } = arctan sin ( 2 π k / N ) v ( N 2 ) v ( N 1 ) cos ( 2 π k / N ) v ( N 2 )
Figure 5 shows that the Goertzel algorithm can calculate a yk(n) value for every x(n) collected. Data collection and computation can be carried out simultaneously, overcoming the disadvantage of DFT wherein it needs to wait for all N data to be collected before processing and to improve the calculation speed. Meanwhile, when calculating DFT, it is necessary to compute the values of all N spectral lines. If only the amplitude and phase angle of a single frequency spectral line need to be calculated, the calculation of the remaining N − 1 spectral lines will be wasted. From Formulas (18) and (19), it can be seen that the Goertzel algorithm can only calculate the amplitude and phase angle of a specific spectral line, which also saves computational costs.

4. Fault Features and Diagnostic Model of Traction Motor ITSC Faults

4.1. Fault Features of Traction Motor ITSC Diagnostic Conditions

When an ITSC fault occurs in the a-phase winding of the traction motor, the symmetry relation of the three-phase winding changes. As shown in Figure 2, when diagnostic condition Ⅰ is implemented while the traction motor is at a standstill, the b-phase and c-phase are in parallel. Inductance and resistance asymmetries exist between b-phase and c-phase winding due to an ITSC fault. The amplitude difference between the b-phase and c-phase current Δibc will occur, and the phase angle difference Δθbc will also occur. Calculating the current amplitude difference Δibc and phase angle difference Δθbc between the b-phase and c-phase, one can detect the winding asymmetries caused by the ITSC fault on b-phase or c-phase winding. Similarly, diagnostic condition Ⅱ can be applied to detect the asymmetries between the c-phase and a-phase; diagnostic condition Ⅲ can be applied to detect the asymmetries between the a-phase and b-phase. Table 2 defines six ITSC fault diagnosis fault features under three diagnostic conditions when the traction motor is at a standstill.

4.2. Random Forest Fault Diagnosis Model

The random forest is a supervised ensemble learning algorithm based on decision trees. The random forest improves the performance of a single decision tree by using random sampling with replacement using the Bootstrap method. It generates T train sets with less samples than the original sample set. This method has been shown to improve the classification accuracy of the unstable classifiers [37,38]. T train sets are utilized to generate T decision trees. When the decision tree is split, a feature subset is randomly selected from all features with equal probabilities. An optimal feature-splitting node is selected from it to make the classifier robust to noise and outliers. The voting method is used to select the category with the highest output from the T decision trees as the category to which the sample belongs. The algorithm flow of the random forest is as follows [39,40]:
(1)
The Bootstrap method is used to resample and randomly select m samples from the original dataset with M samples and generate T train subsets, S1, S2, …, ST. The number of train subset samples m should not be greater than M.
(2)
The T train sets are used to generate T corresponding decision trees C1, C2, …, CT; before selecting features on each non-leaf node, s features are randomly selected from the S features as the split feature set for the current node and the node is split using the best splitting method among these s features.
(3)
There is no restriction on the growth of each decision tree and no pruning.
(4)
A random forest consisting of T decision trees is used to identify and classify the new data set, and the voting method is adopted. The final result is determined by the number of votes.

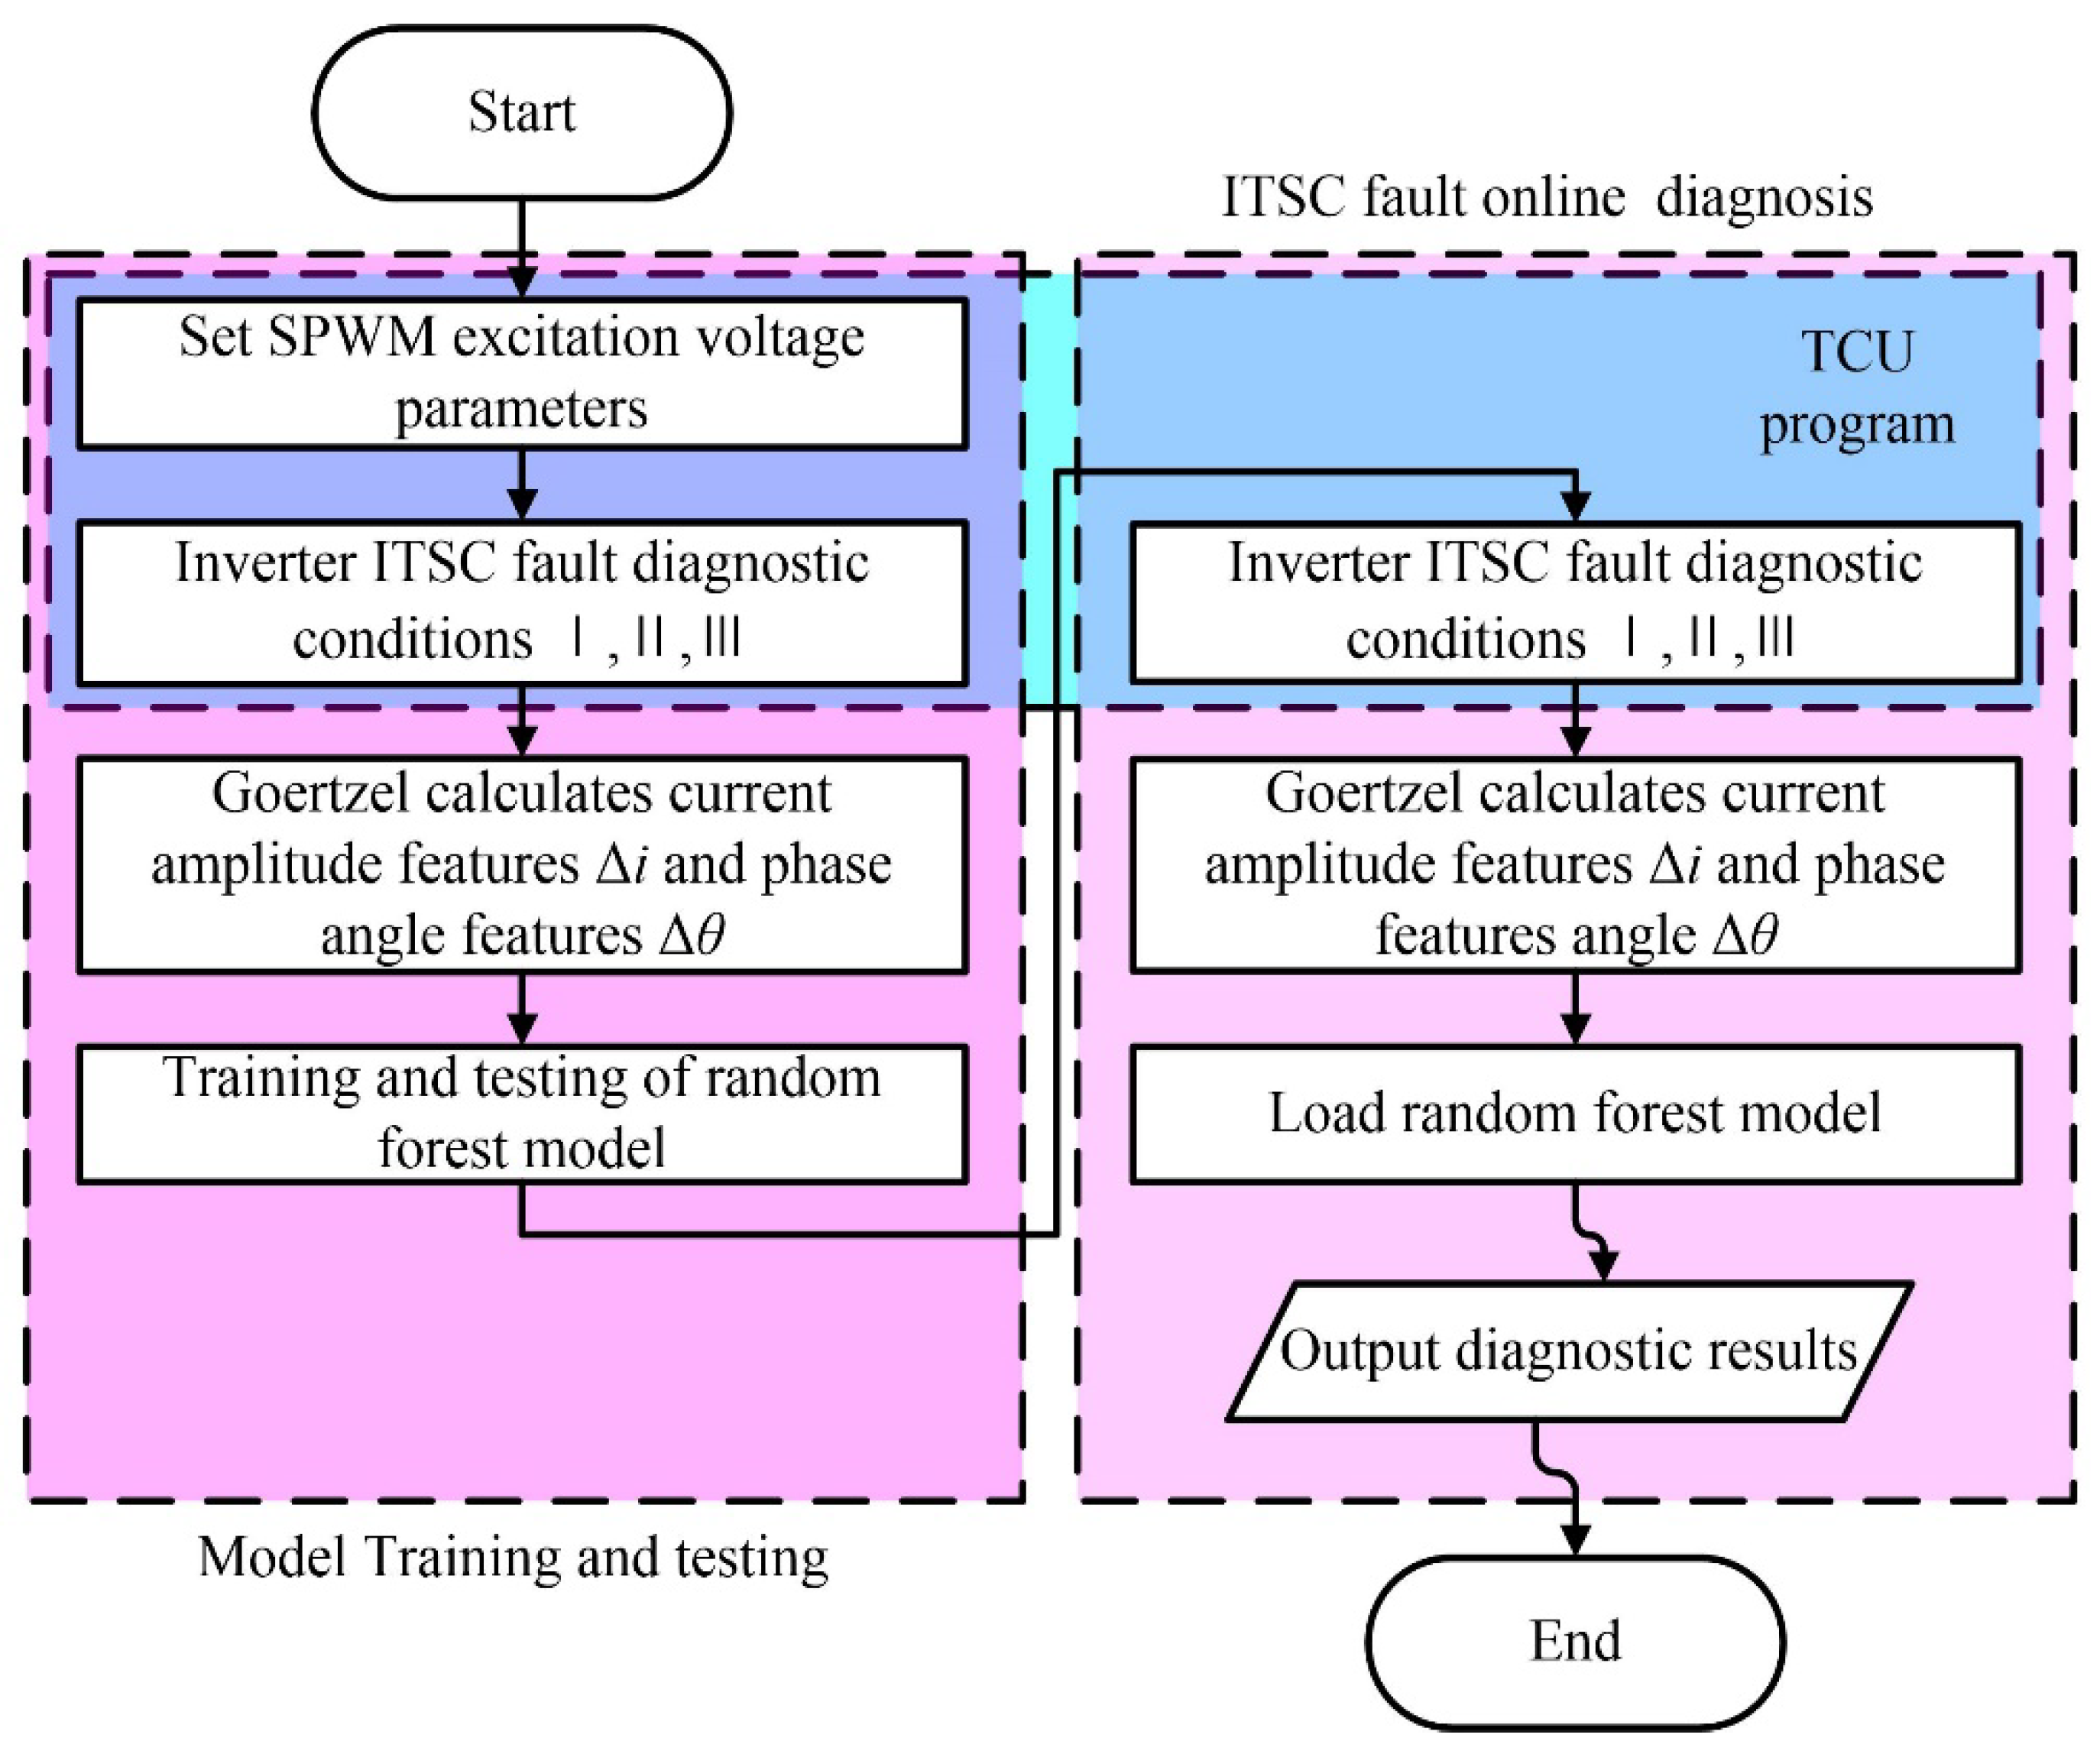
4.3. Fault Diagnosis of Traction Motor ITSC Faults

Figure 6 shows the ITSC fault flowchart for traction motor stators based on the Goertzel algorithm and the random forest. It mainly includes two parts: random forest model training and online diagnosis. In these two parts, the fault diagnostic excitation SPWM voltage parameter setting and diagnostic condition control can be embedded in the EMU TCU control program. After training the ITSC fault diagnosis model, the TCU controls the inverter to perform three fault diagnostic conditions before the traction motor is driven. The current amplitude features Δi and phase angle features Δθ need to be calculated through the Goertzel algorithm. The six fault features are input into the fault diagnosis model to diagnose the ITSC fault of the traction motor and output the diagnostic results.

5. Diagnosis for Traction Motor ITSC Fault Simulation Experimental Platform

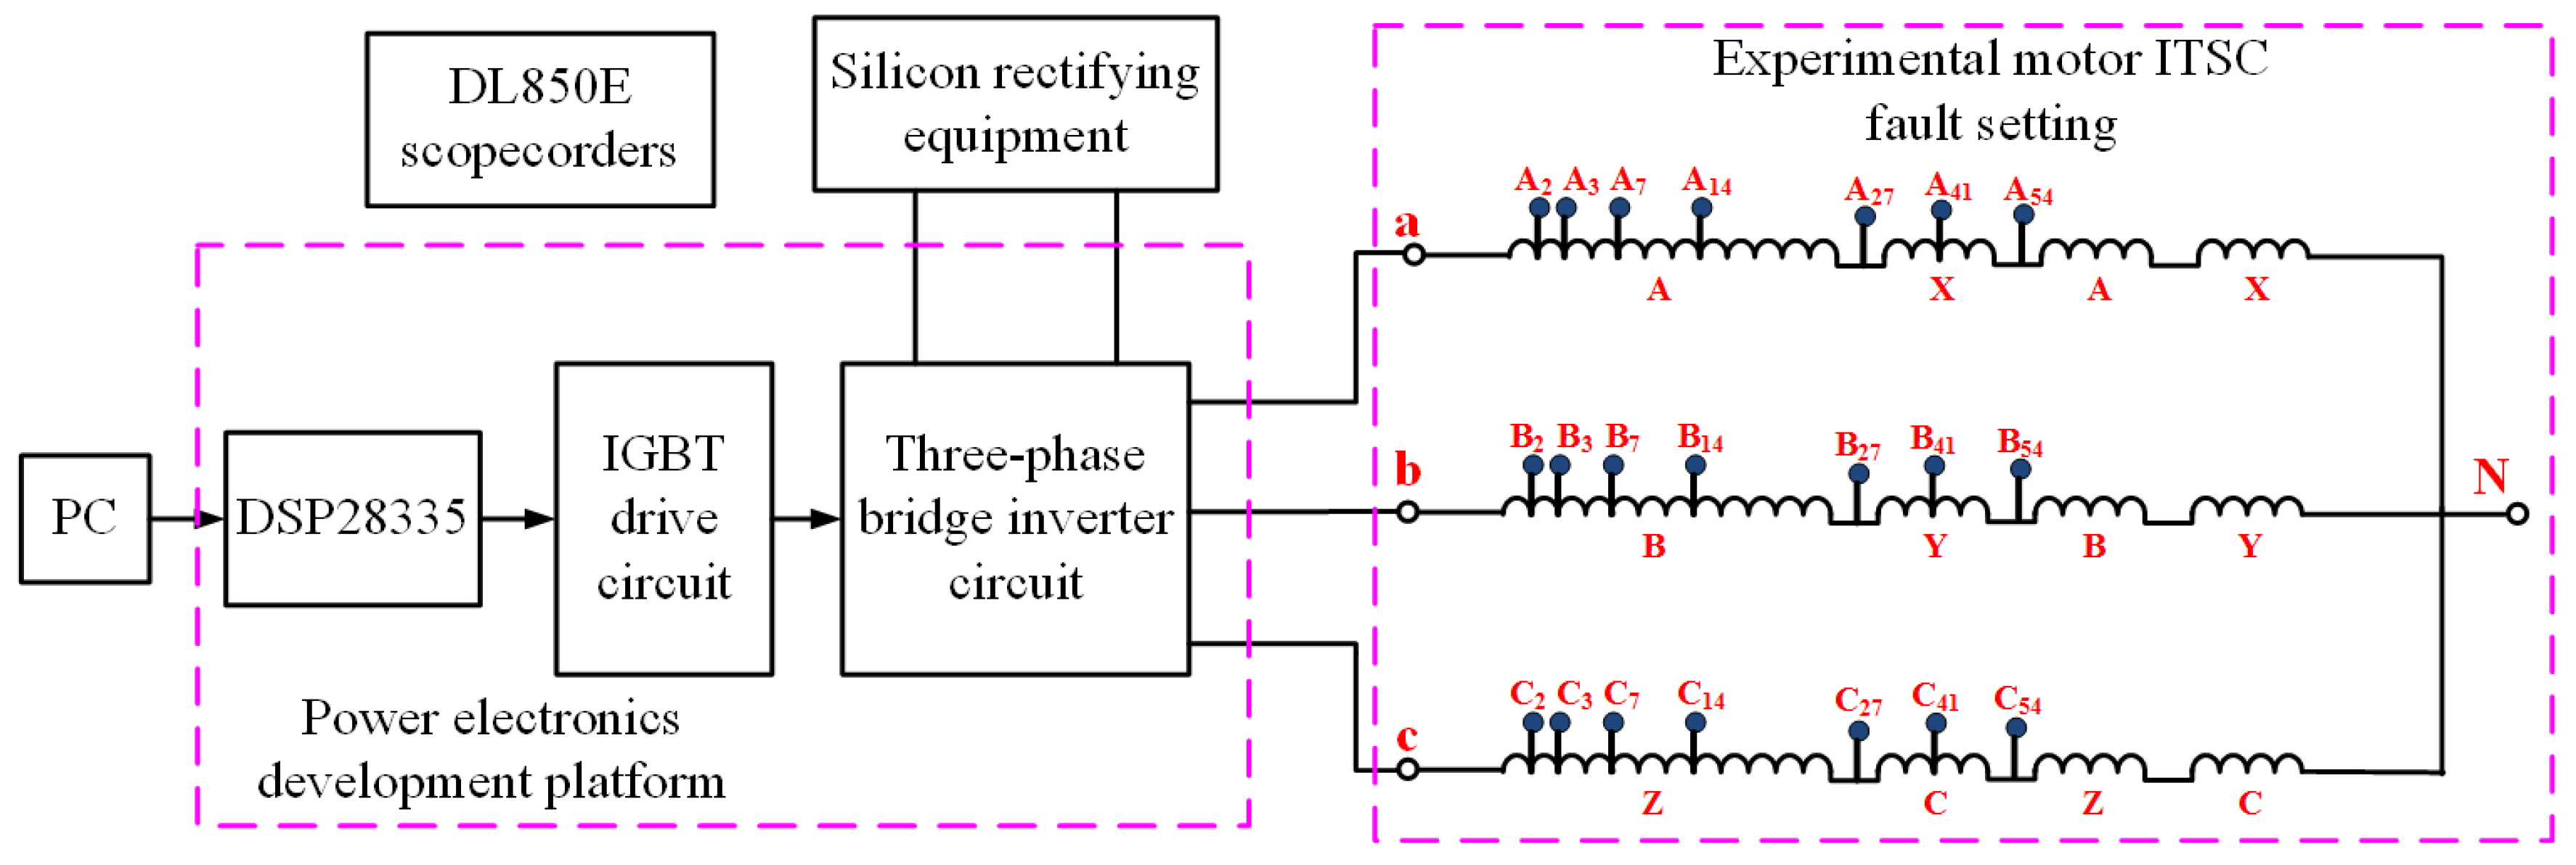
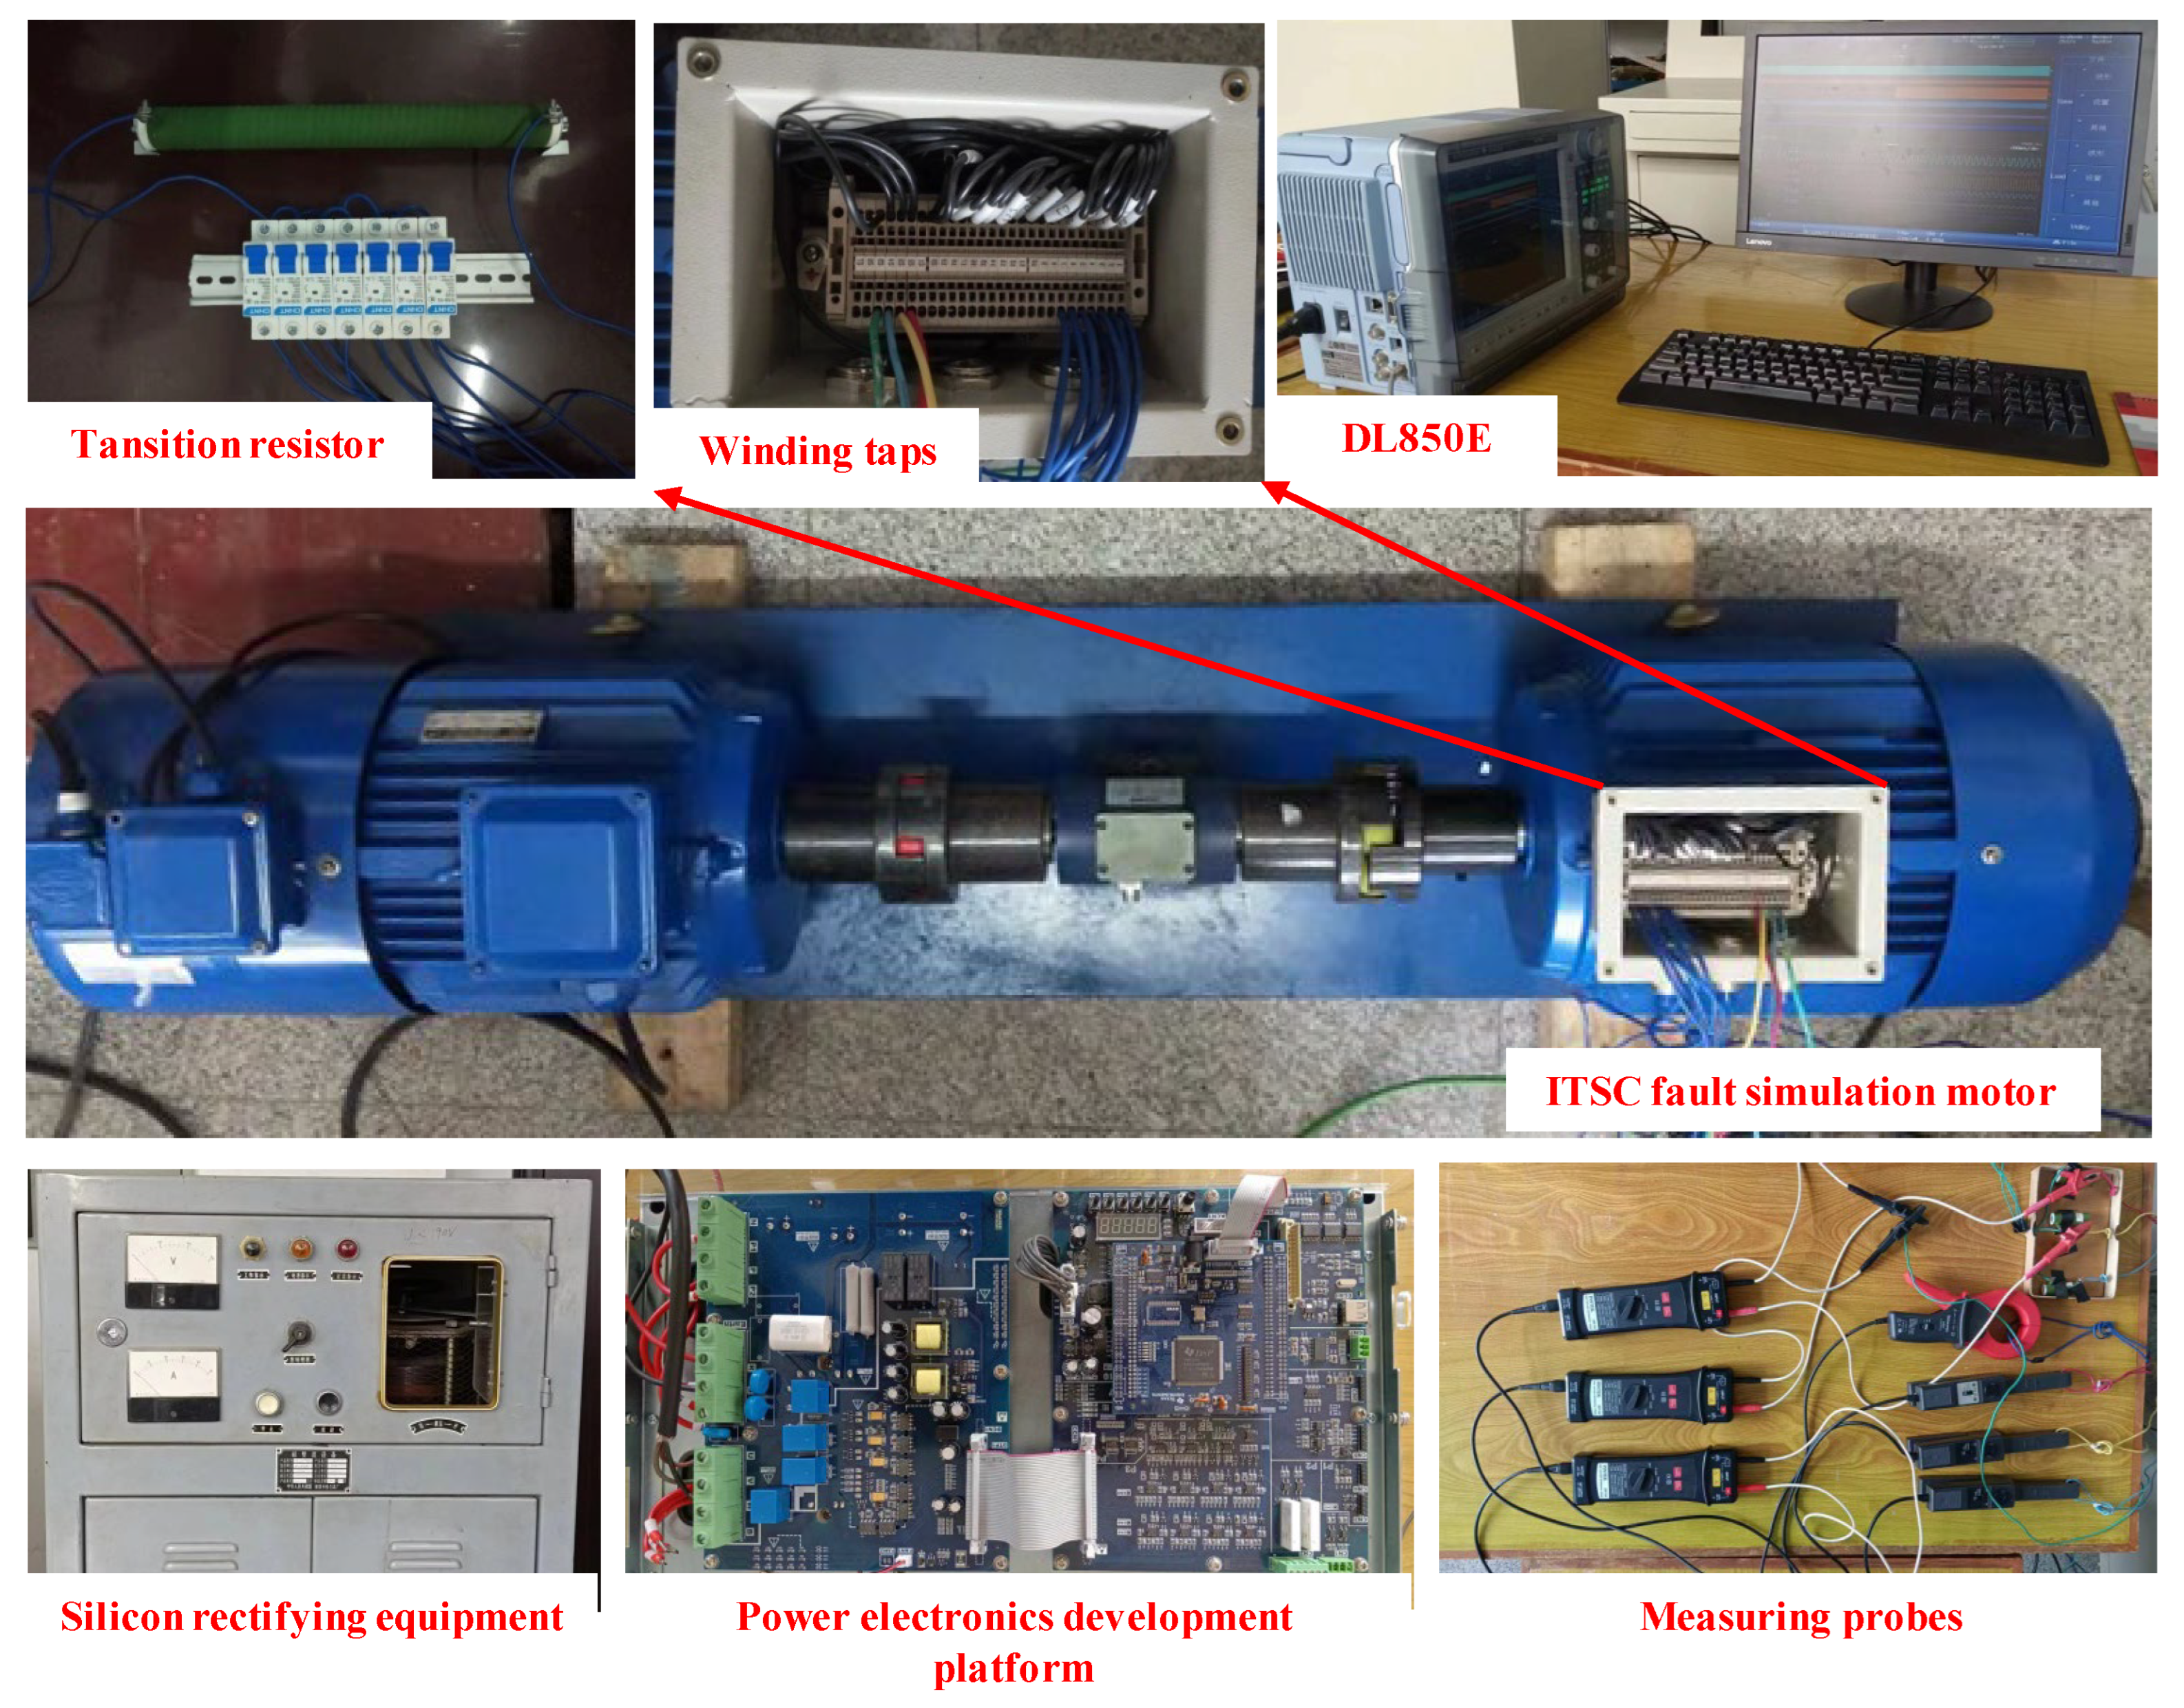
5.1. Description of the Experimental Platform

Figure 7 shows a schematic of the experimental simulation platform for an EMU’s traction motor ITSC fault diagnosis. The silicon rectifier equipment outputs a DC voltage to simulate the intermediate DC link voltage of the EMU. The power electronics development platform is composed of a DSP28335, IGBTs drive circuits, and a three-phase bridge inverter circuit composed of six IGBTs with power diodes. The fault diagnostic conditions’ control program on the PC was loaded into the DSP28335, which controls the IGBTs drive circuits to drive the three-phase bridge inverter circuit. The inverter circuit inverted the DC voltage rectified by the silicon rectifying equipment into SPWM voltages to excite the experimental motor as required for the three diagnostic conditions. The ITSC fault simulation motor adopted a three-phase squirrel cage induction motor, and the three-phase winding tap was led to the junction box during fabrication, as shown in Figure 7. The metal short-circuit fault was simulated by the direct short-circuiting of connectors, and the non-metallic short circuit was simulated by connecting resistors between the connectors.
The real equipment of the ITSC fault diagnosis simulation experimental platform of the traction motor is shown in Figure 8. The voltage and current signals were measured using voltage and current probes, and a DL850E oscilloscope was used to store the voltage and current signals. During the experiment, the DC voltage, the motor phase voltage, the short-circuit inter-turn current, and the three-phase current were measured. The DL850E oscilloscope was used to collect and record the above signals. The DL850’s LPF (low pass filter) was used for hardware, filtering voltage and current signals. The LPF cutoff frequency was 400 Hz. The sampling frequency fs was set to 2000 Hz for DL850E. The fundamental component amplitude and angle of the three-phase current measured by DL850E were calculated by using the Goertzel algorithm.

5.2. SPWM Excitation Parameters of the Experimental Platform

The parameters of the ITSC fault experimental motor and the ITSC fault diagnosis control parameters are shown in Table 3. The silicon rectifier provided a DC300V voltage for the power electronics development platform. There are no strict requirements for the selection of fr and fc. The larger the fr is, the greater the motor impedance will be. Therefore, under the same modulation index M, the motor current will decrease. Considering both the ITSC fault simulation motor nominal current and the power electronics development platform’s output capability, the output current RMS value of the power electronics development platform was adjusted by changing the fr and the modulation index M. The SPWM reference modulation wave frequency fr was 100 Hz and modulation index M was 0.4, the RMS value of the equivalent parallel-phase winding current of each diagnostic condition was about 3.5 A, and the RMS value of the series winding current was about 7 A. The carrier frequency fc was selected as 5000 Hz, and the modulation ratio N was 50.

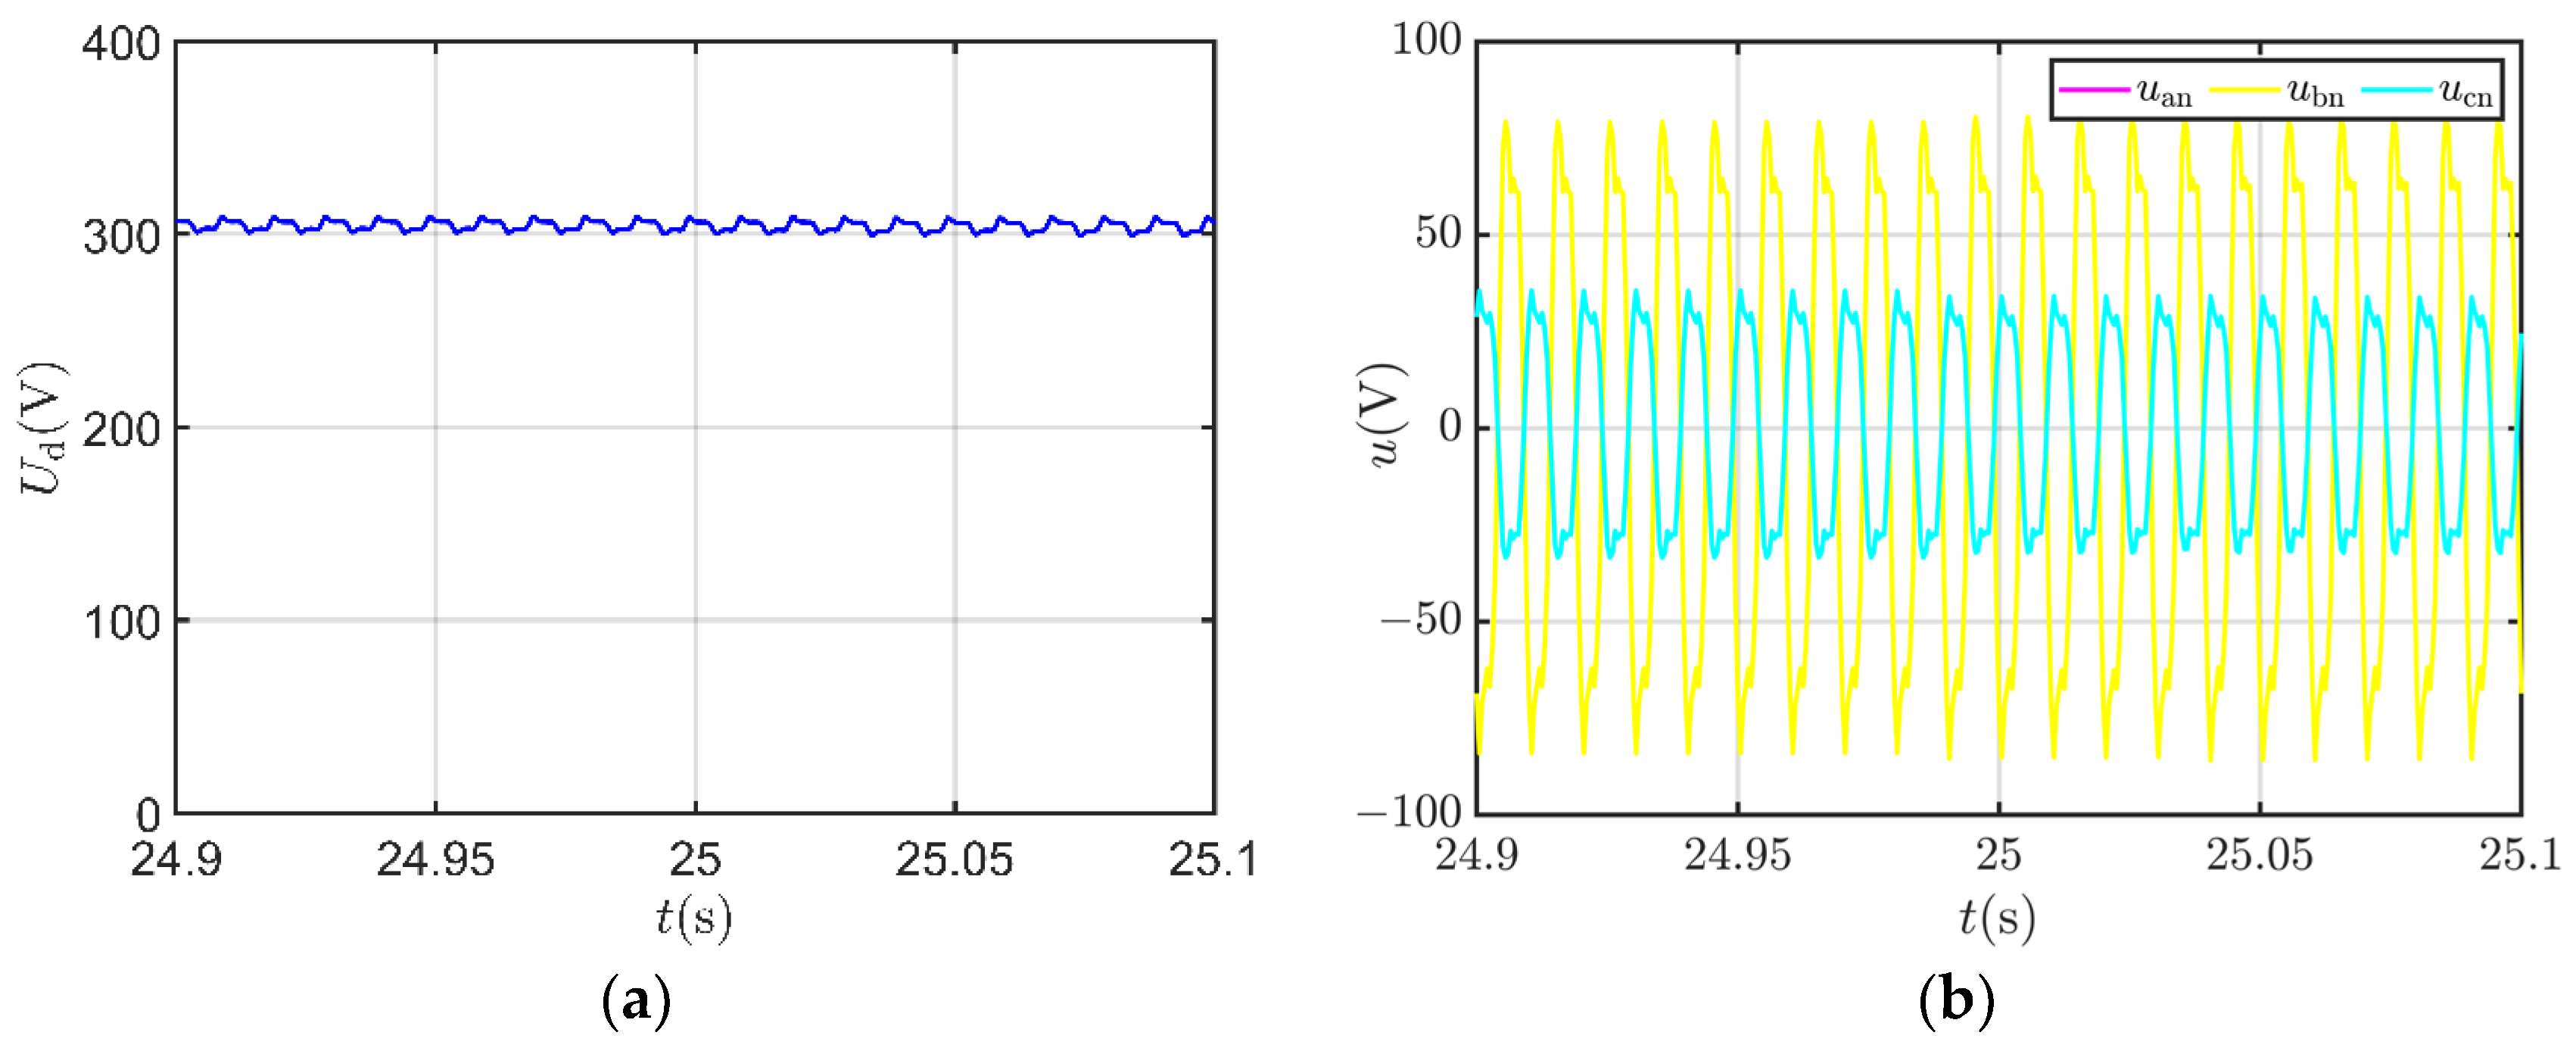
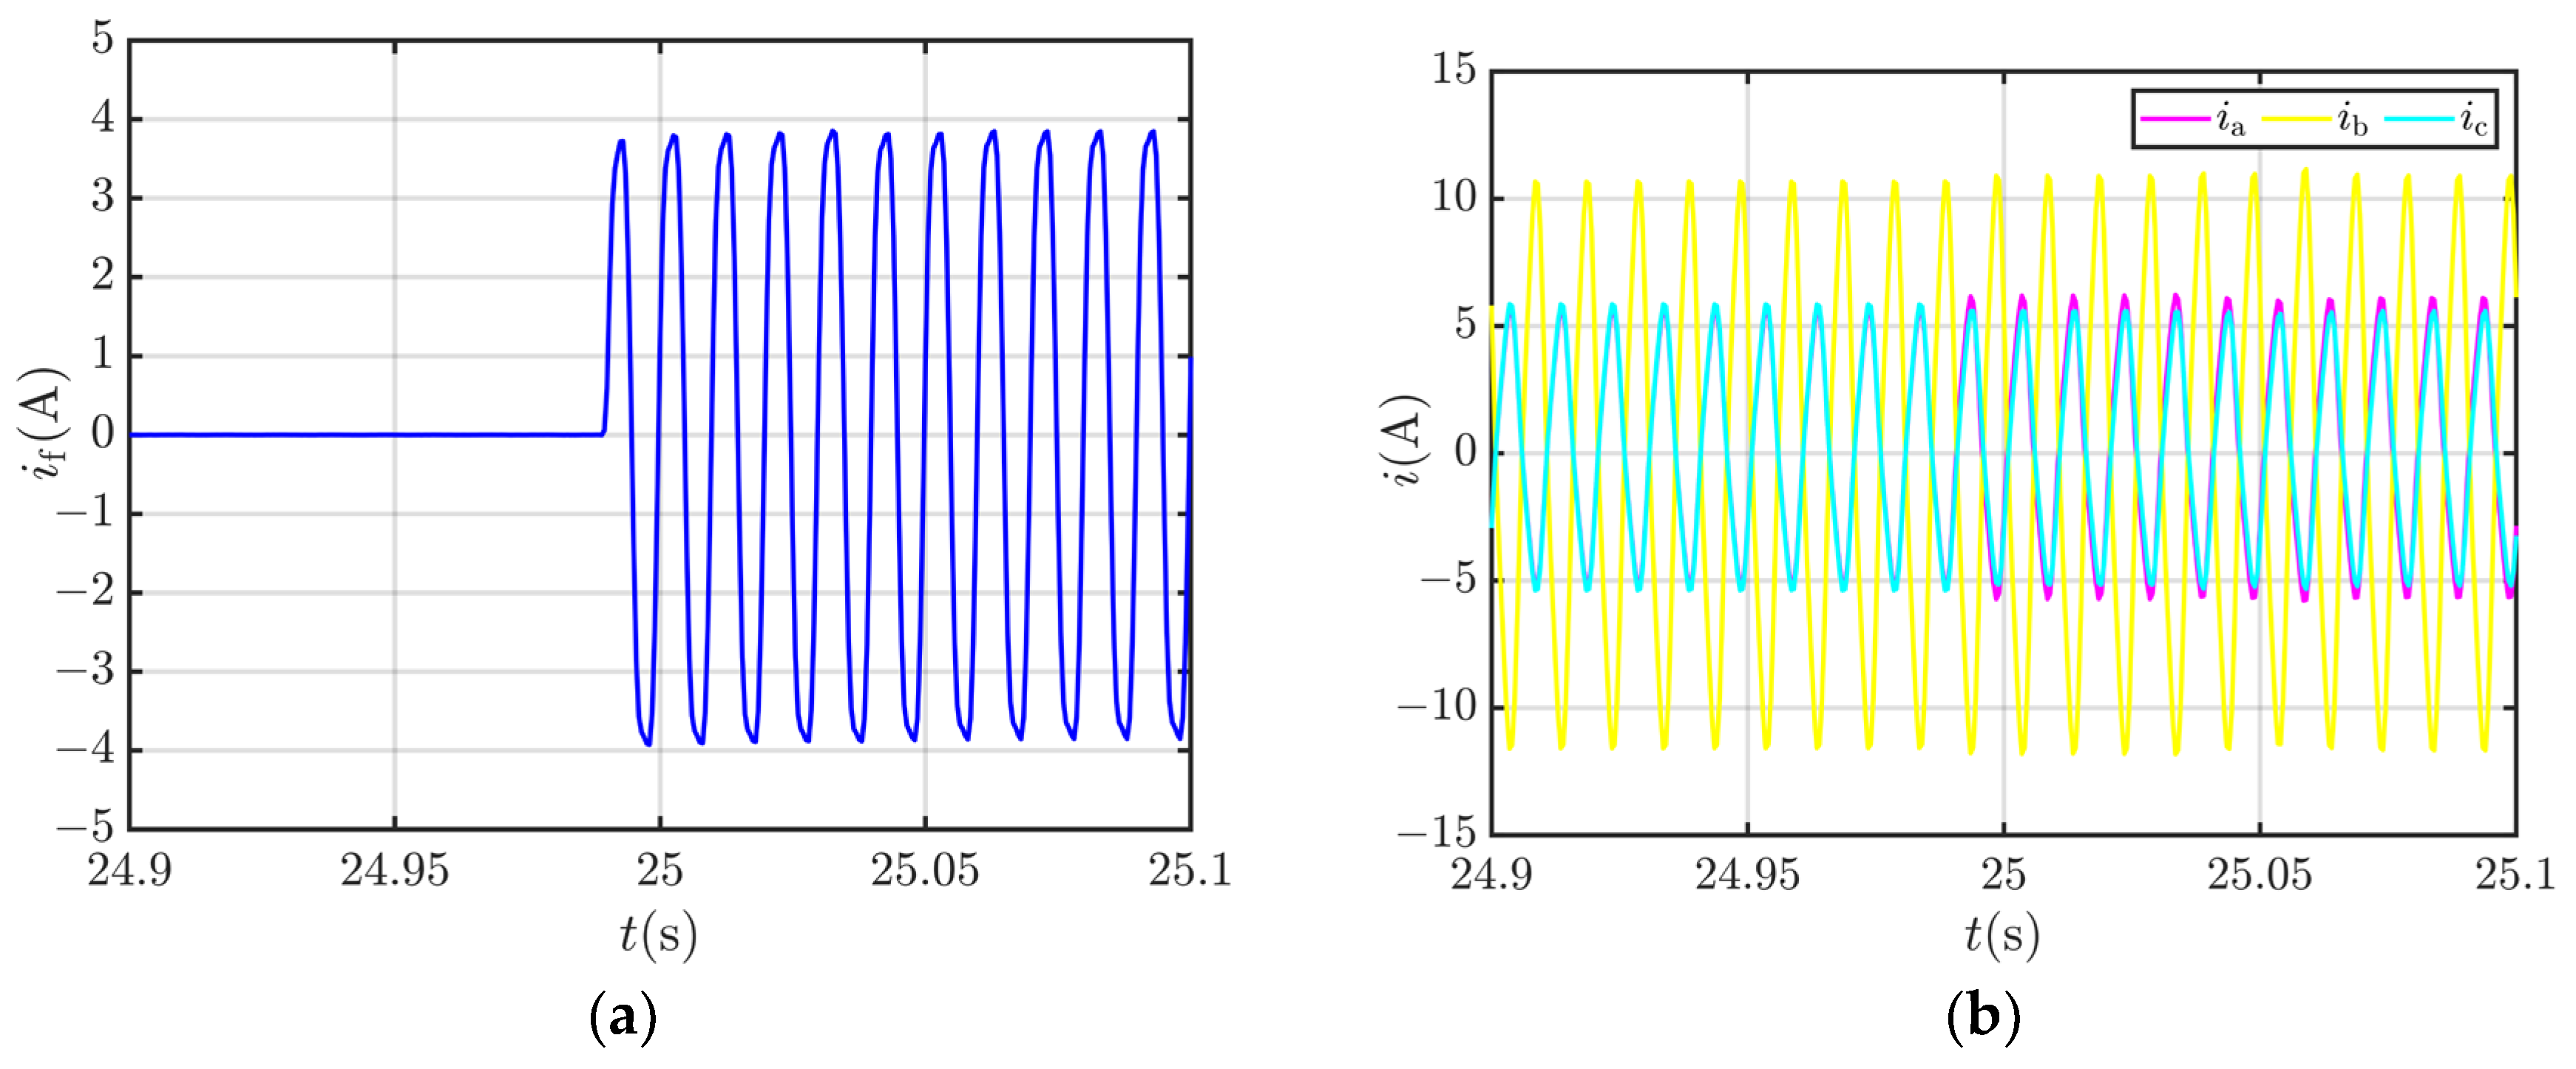
5.3. Analysis of ITSC Fault Diagnosis Signals

The measurement signals of an a-phase ITSC fault with 1Ω transition resistance and 39 short-circuit turns under diagnostic condition Ⅱ were analyzed. Figure 9a shows the DC voltage waveform output by the silicon rectifier device. Figure 9b shows the motor phase voltage waveform filtered by the LPF. The experimental induction motor phase voltages contain specific harmonic components. Under ITSC fault diagnostic condition Ⅱ, as shown in Figure 3, the induction motor is equivalent to the a-phase winding in parallel with the c-phase winding and then connected in series with the b-phase winding. The phase voltage relationship is shown in Formula (20), and the waveforms of the a-phase voltage and the c-phase voltages in Figure 9b overlap.
u an = u cn = 1 2 u bn
Figure 10a shows the short-circuit inter-turn current of the a-phase winding during an ITSC fault. After setting an ITSC fault in the a-phase, a sinusoidal current with specific harmonic components is generated between the short-circuit turns. The DL850E trigger function was used to record the occurrence time of the short-circuit faults; there was no ITSC fault in the a-phase before 24.99 s in recording time. Figure 10b shows the three-phase current of the experimental motor with a fundamental frequency of 100 Hz. When there is no ITSC fault, the phase current relation of the experimental motor under ideal conditions is shown in Formula (21); ia and ic are almost equal, and their waveforms overlap. After the ITSC fault occurs in the a-phase, there is some difference between ia and ic, and their waveforms no longer overlap.
i a = i c = 1 2 i b

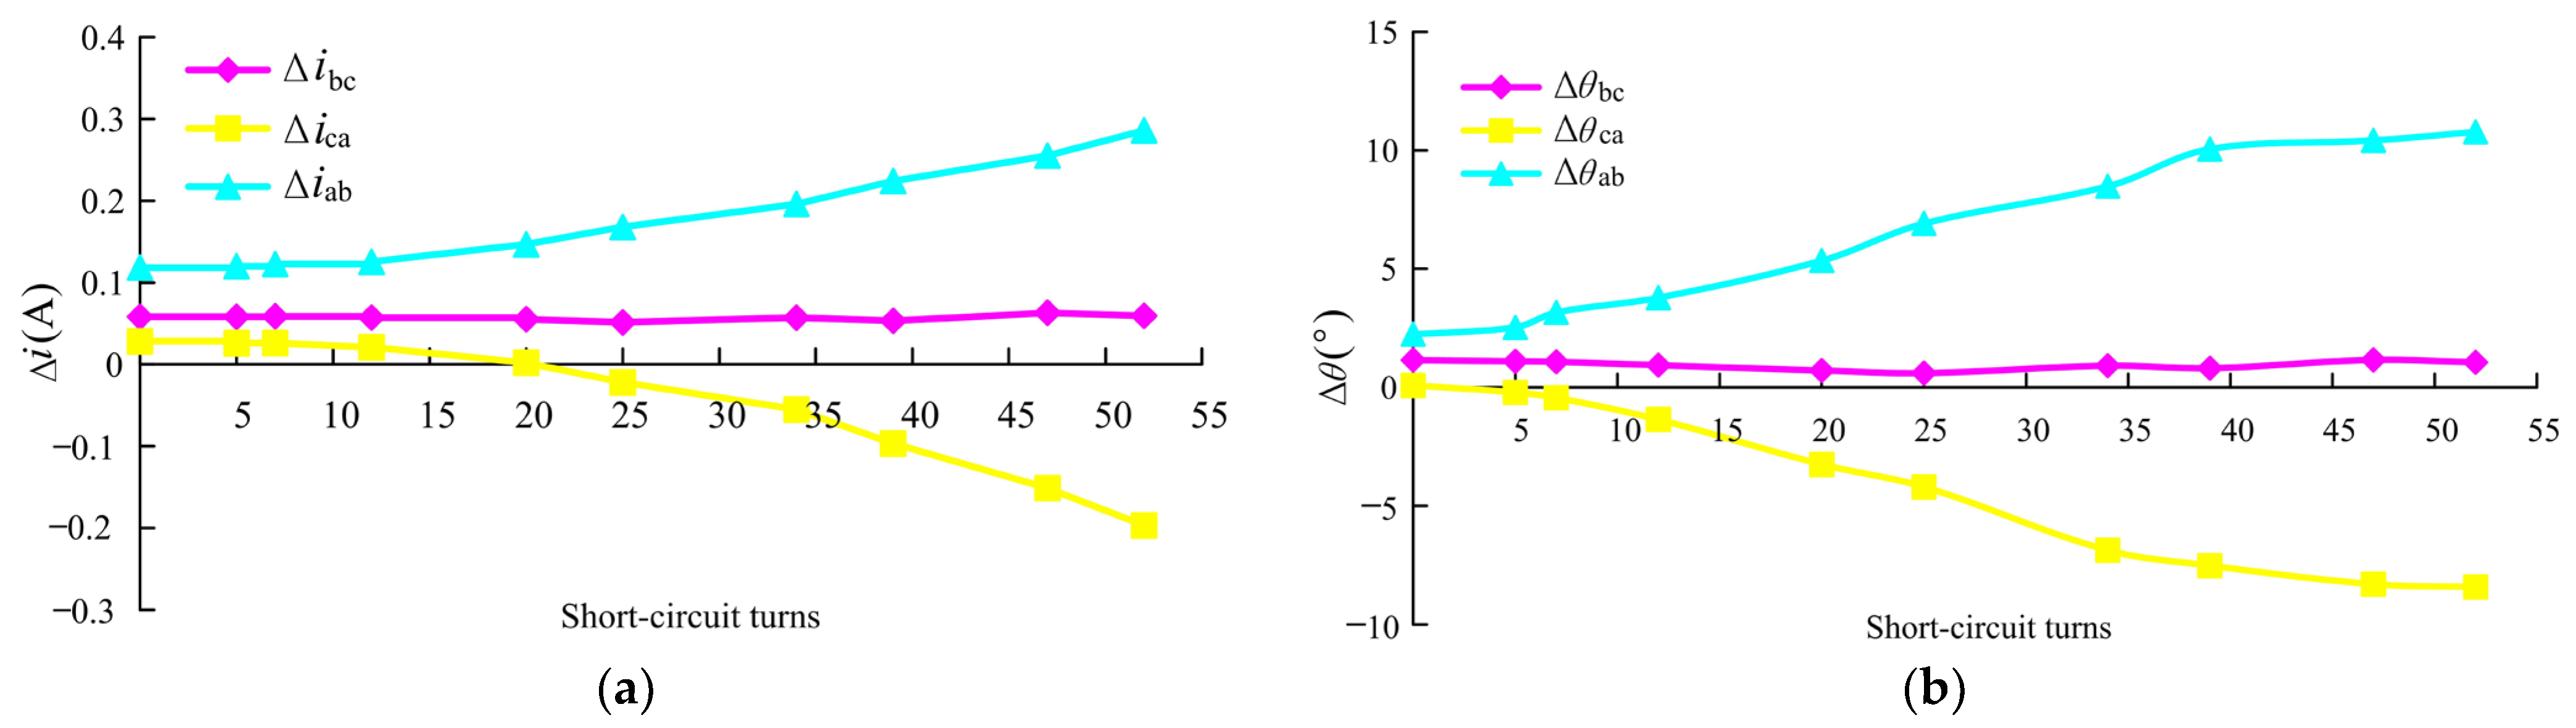
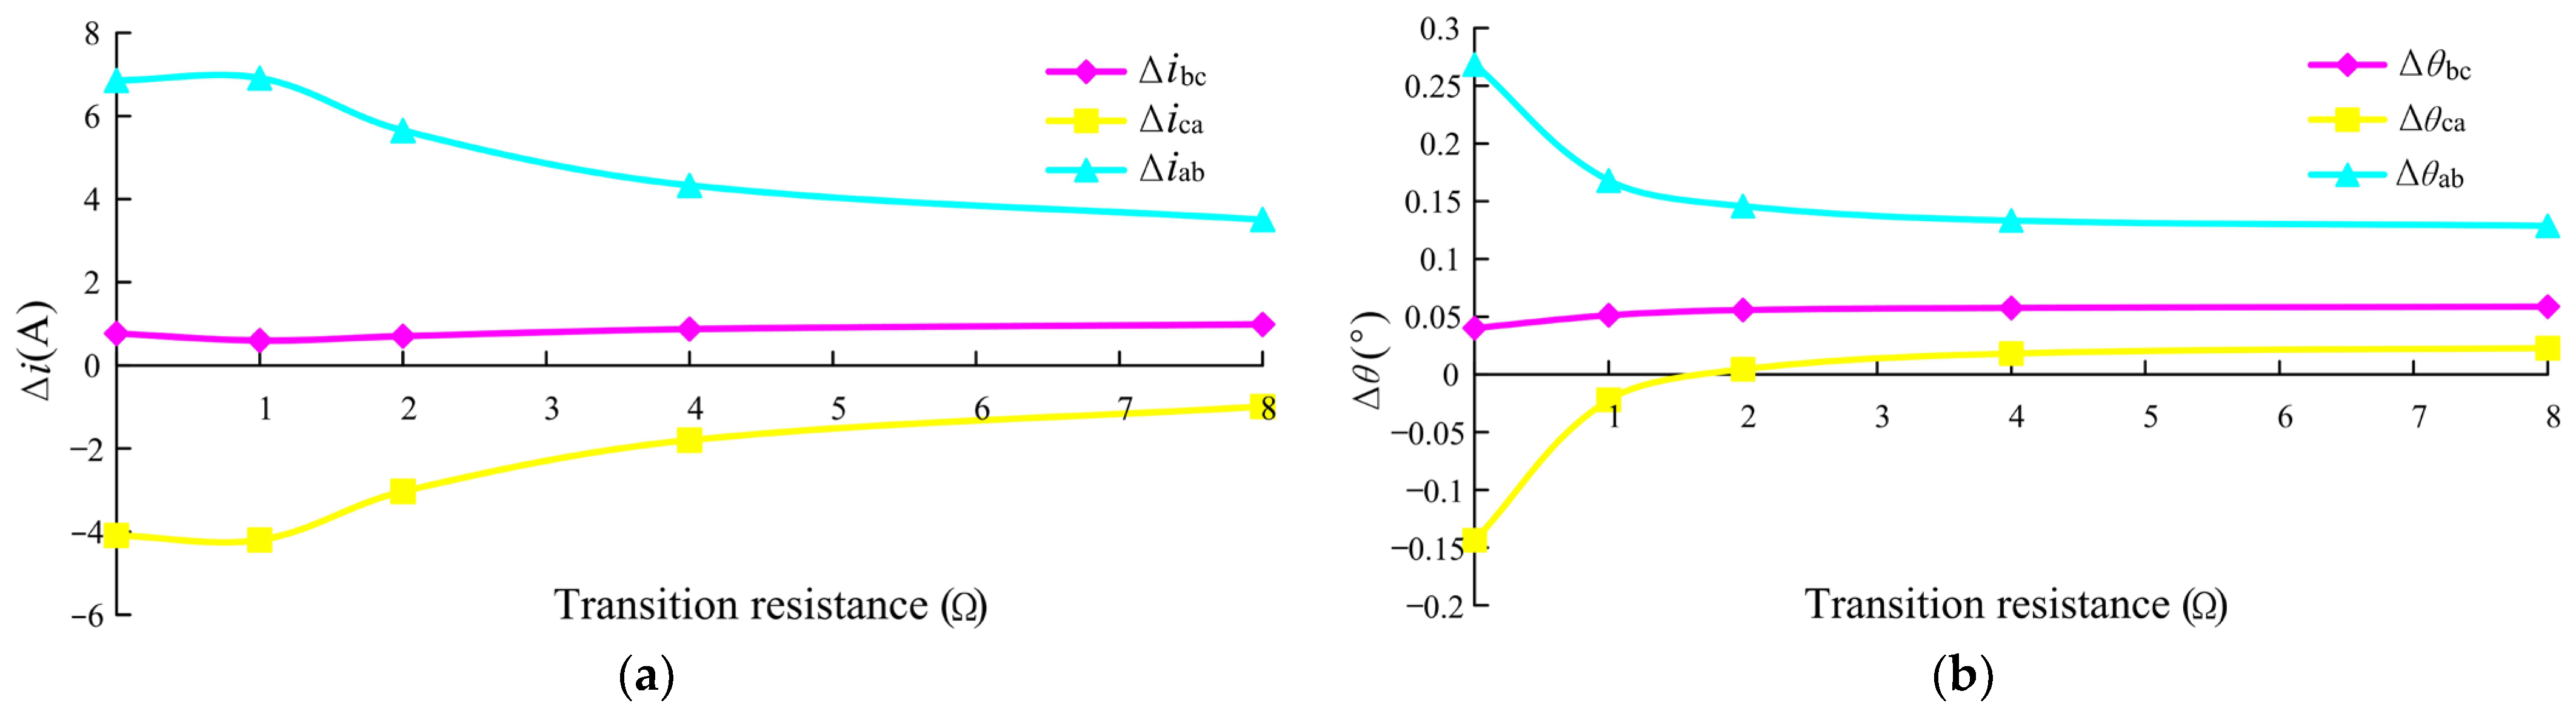
5.4. The Impact of ITSC Fault Extent on Features

The ITSC fault damage to induction motors is related to short-circuit turns and transition resistance. Full-period data truncation was used to eliminate the current fundamental frequency leakage. The six fault features under the three diagnostic conditions are defined in Table 1. Table 4 shows the fault setting parameters during the experimental process. In the case of metal short-circuiting, the transition resistance value is 0. In the case of non-metallic short circuits, four resistance values were selected as transition resistances. The second and seventh turns of each stator winding were used as the short-circuit ends. A total of 9 different short-circuit turns were obtained.
Figure 11 shows the variation of fault features with different numbers of short-circuit turns; the transition resistance of the experimental motor was 1Ω. Figure 11a shows that after the ITSC fault occurs in the a-phase, the Δibc feature remains almost unchanged with a change in short-circuit turns under diagnostic condition Ⅰ. However, Δica and Δiab significantly increase and decrease, respectively, with an increase in short-circuit turns under diagnostic conditions Ⅱ and Ⅲ, respectively. Figure 11b shows that the Δθbc feature remains almost unchanged regardless of the number of short-circuit turns under diagnostic condition Ⅰ. However, Δθca and Δθab significantly increase and decrease, respectively, with an increase in short-circuit turns under diagnostic conditions Ⅱ and Ⅲ, respectively.
Figure 12 shows the change in fault features with the transition resistance under 39 short-circuit turns. Figure 12a shows that after the ITSC fault occurs in the a-phase, the Δibc feature remains almost unchanged with the change of the transition resistance under diagnostic condition Ⅰ. However, Δica and Δiab significantly increase and decrease, respectively, with the transition resistance increase under diagnostic conditions Ⅱ and Ⅲ, respectively. Figure 12b shows that the Δθbc feature remains almost unchanged with the transition resistance under diagnostic condition Ⅰ. However, Δθca and Δθab significantly increase and decrease, respectively, with an increase in the transition resistance under diagnostic conditions Ⅱ and Ⅲ, respectively.

5.5. Fault Detection and Location Based on Random Forest Model

According to the fault experimental motor settings for ITSC simulation in Table 4, ITSC faults were set on each phase of the experimental motor. The six fault features as shown in Table 2 were measured and calculated. The train and test sets included 45 samples of ITSC faults, at different extents in each phase, and 45 healthy samples. A total of 180 samples were obtained in the experiment. The samples were labeled as healthy, a-phase ITSC fault, b-phase ITSC fault, and c-phase ITSC fault in the four types. The BP neural network, KNN, SVM, Naive Bayes, and random forest classification algorithms were used to classify the data set, and 35 samples were randomly selected as train samples and 10 as test samples from various types. Table 5 shows that among the various common algorithm classification accuracies, even the worst-performing algorithm, SVM, has relatively high classification accuracies of 95% and 97.5% on the train and test sets, respectively, indicating that the proposed fault feature extraction based on the Goertzel algorithm for traction motors in the standstill state is effective, and that it can provide reliable fault features for ITSC fault detection and location. Among several common classification algorithms, the Naive Bayes and KNN algorithms both have 100% accuracy on the test sets but 98.57% and 99.29% accuracy, respectively, on the train sets. The random forest has a classification accuracy of 100% on both the train and test sets, indicating that it can classify all the samples without misclassification. The ITSC fault can be accurately detected and located based on the Goertzel algorithm and the random forest for the ITSC fault simulation motor on the experimental platform. At the same time, the misclassified samples of the other classification algorithms were analyzed, all of which were fault samples with high transition resistance and among which a few short-circuited turns had been misclassified as healthy samples.

6. Conclusions

This article proposes a method to control the traction inverter to output ITSC fault diagnostic SPWM excitation voltage under three different diagnostic conditions when the traction motor is at a standstill. According to the diagnostic condition control logic proposed in the article, the three-phase current under each diagnostic condition generates a pulsing magnetomotive force that does not generate an electromagnetic torque. Based on the known fundamental frequency fr of the excitation voltage for ITSC fault diagnosis, the Goertzel algorithm is used to calculate the fundamental current amplitude differences Δi and phase angle differences Δθ of the equivalent parallel windings under various diagnostic conditions. The amplitude differences Δi and phase angle differences Δθ under the three fault diagnostic conditions are used as fault features. The random forest is used as the ITSC fault diagnosis model. The above method was validated using a traction motor ITSC fault diagnosis simulation experimental platform. When ITSC fault winding occurred in the equivalent parallel winding, the current amplitude difference Δi and phase angle difference Δθ were analyzed. The features changed significantly with an increase in fault extent. The ITSC fault diagnosis model based on the random forest was established with six fault features under three diagnostic conditions as input. The model can judge whether the experimental motor has an ITSC fault and locate the ITSC fault phase with 100% accuracy. The EMU traction motor ITSC fault diagnosis method proposed in the article is used before the motor starts, and it can detect ITSC faults and ensure that there are no ITSC faults before an EMU starts, but it cannot be used after the traction motors start. Future studies will focus on how to diagnose the ITSC fault in the traction motors’ running state, especially during the accelerating and decelerating unsteady states.

Author Contributions

Methodology, J.M., Y.L., J.F. and L.W.; software, G.Z. and H.L.; validation, J.M.; formal analysis, J.M. and J.H.; investigation, G.Z.; resources, J.F.; data curation, J.M. and L.W.; writing—original draft preparation, J.M., J.H., Y.L. and L.W.; writing—review and editing, J.F., H.L., L.L. and G.Z.; visualization, L.L. and H.L.; supervision, J.F. and L.W. All authors have read and agreed to the published version of the manuscript.

Funding

This research was funded by the 2021 Scientific Research Fund Project of Liaoning Provincial Department of Education (LJKZ1297).

Data Availability Statement

Not applicable.

Conflicts of Interest

The authors declare no conflict of interest.

References

  1. Lee, S.-G. A Study on Traction Motor Characteristic in EMU Train. In Proceedings of the 13th International Conference on Control, Automation and Systems, Gyeonggi-do, Republic of Korea, 22–25 October 2014. [Google Scholar]
  2. Chen, Z.P.; Wang, Z.; Jia, L.M.; Cai, G.Q. Analysis and Comparison of Locomotive Traction Motor Intelligent Fault Diagnosis Methods. Appl. Mech. Mater. 2011, 97–98, 994–1002. [Google Scholar] [CrossRef]
  3. Chao, C.; Wang, W.; Chen, H.; Zhang, B.; Shao, J.; Teng, W. Enhanced Fault Diagnosis Using Broad Learning for Traction Systems in High-Speed Trains. IEEE Trans. Power Electron. 2020, 36, 7461–7469. [Google Scholar] [CrossRef]
  4. Guo, X.; Tang, Y.; Wu, M.; Zhang, Z.; Yuan, J. FPGA-Based Hardware-in-the-Loop Real-Time Simulation Implementation for High-Speed Train Electrical Traction System. IET Electr. Power Appl. 2020, 14, 850–858. [Google Scholar] [CrossRef]
  5. Elbouchikhi, E.; Amirat, Y.; Feld, G.; Benbouzid, M. Generalized Likelihood Ratio Test Based Approach for Stator-Fault Detection in a PWM Inverter-Fed Induction Motor Drive. IEEE Trans. Ind. Electron. 2019, 66, 6343–6353. [Google Scholar] [CrossRef]
  6. Al-Ameri, S.M.; Alawady, A.A.; Yousof, M.F.M.; Kamarudin, M.S.; Salem, A.A.; Abu-Siada, A.; Mosaad, M.I. Application of Frequency Response Analysis Method to Detect Short-Circuit Faults in Three-Phase Induction Motors. Appl. Sci. 2022, 12, 2046. [Google Scholar] [CrossRef]
  7. Tallam, R.M.; Habetler, T.G.; Harley, R.G. Transient Model for Induction Machines with Stator Winding Turn Faults. IEEE Trans. Ind. Appl. 2002, 38, 632–637. [Google Scholar] [CrossRef]
  8. Kallesoe, C.S.; Vadstrup, P.; Rasmussen, H.; Izadi-Zamanabadi, R. Observer Based Estimation of Stator Winding Faults in Delta-Connected Induction Motors, a LMI Approach. In Proceedings of the IAS Annual Meeting, Tampa, FL, USA, 8–12 October 2006. [Google Scholar] [CrossRef]
  9. Angelo, C.; Bossio, G.R.; Gi Ac Cone, S.J.; Valla, M.I.; Garcia, G.O. Online Model-Based Stator-Fault Detection and Identification in Induction Motors. IEEE Trans. Ind. Electron. 2009, 56, 4671–4680. [Google Scholar] [CrossRef]
  10. Nguyen, V.; Wang, D.; Seshadrinath, J.; Ukil, A.; Krishna, M.S.; Nadarajan, S.; Vaiyapuri, V. A Method for Incipient Interturn Fault Detection and Severity Estimation of Induction Motors Under Inherent Asymmetry and Voltage Imbalance. IEEE Trans. Transp. Electrif. 2017, 3, 703–715. [Google Scholar] [CrossRef]
  11. Abdallah, H.; Benatman, K. Stator Winding Inter-turn Short-circuit Detection in Induction Motors by Parameter Identification. IET Electr. Power Appl. 2017, 11, 272–288. [Google Scholar] [CrossRef]
  12. Bachir, S.; Tnani, S.; Trigeassou, J.-C.; Champenois, G. Diagnosis by Parameter Estimation of Stator and Rotor Faults Occurring in Induction Machines. IEEE Trans. Ind. Electron. 2006, 53, 963–973. [Google Scholar] [CrossRef]
  13. Bazine, I.B.A.; Tnani, S.; Poinot, T.; Champenois, G.; Jelassi, K. On-Line Detection of Stator and Rotor Faults Occurring in Induction Machine Diagnosis by Parameters Estimation. In Proceedings of the 8th IEEE Symposium on Diagnostics for Electrical Machines, Power Electronics & Drives, Bologna, Italy, 5–8 September 2011. [Google Scholar] [CrossRef]
  14. Aswad, R.A.K.; Jassim, B.M.H. Detection and Localization of the Stator Winding Inter-Turn Fault in Induction Motors Based on Parameters Estimation Using Genetic Algorithm. J. Inst. Eng. India Ser. B 2022, 103, 405–414. [Google Scholar] [CrossRef]
  15. Nandi, S. Stator Fault Detection in Induction Machines Using Triplen Harmonics at Motor Terminal Voltage after Switch-Off. In Proceedings of the IEEE Power Engineering Society General Meeting, San Francisco, CA, USA, 12–16 June 2005. [Google Scholar]
  16. Qing, W.; Nandi, S. Fast Single-Turn Sensitive Stator Interturn Fault Detection of Induction Machines Based on Positive- and Negative-Sequence Third Harmonic Components of Line Currents. IEEE Trans. Ind. Appl. 2010, 46, 974–983. [Google Scholar] [CrossRef]
  17. El Bouchikhi, E.H.; Choqueuse, V.; Benbouzid, M. Induction Machine Faults Detection Using Stator Current Parametric Spectral Estimation. Mech. Syst. Signal Process. 2015, 52–53, 447–464. [Google Scholar] [CrossRef] [Green Version]
  18. Ghanbari, T.; Samet, H. A Kalman Filter Based Technique for Stator Turn-Fault Detection of the Induction Motors. Int. J. Emerg. Electr. Power Syst. 2017, 18, 20170071. [Google Scholar] [CrossRef]
  19. Nazemi, M.H.; Gallehdar, D.; Haghjoo, F.; Cruz, S. A Secure and Sensitive Wavelet Transform Based Technique for Stator Fault Detection in the Cases of Line-connected and Inverter-fed Induction Machines. IET Electr. Power Appl. 2021, 15, 1138–1153. [Google Scholar] [CrossRef]
  20. Almounajjed, A.; Sahoo, A.K.; Kumar, M.K. Diagnosis of Stator Fault Severity in Induction Motor Based on Discrete Wavelet Analysis. Measurement 2021, 182, 109780. [Google Scholar] [CrossRef]
  21. Lee, S.; Wang, Y.; Song, J. Fourier and Wavelet Transformations Application to Fault Detection of Induction Motor with Stator Current. J. Cent. South Univ. Technol. 2010, 17, 93–101. [Google Scholar] [CrossRef]
  22. Vinayak, B.A.; Varma, S.; Jagadanand, G. Precise Wavelet Selection for Condition Monitoring of Inverter-Fed Induction Machine. In Proceedings of the 2017 IEEE International Conference on Signal Processing, Informatics, Communication and Energy Systems (SPICES), Kollam, India, 8–10 August 2017. [Google Scholar] [CrossRef]
  23. Seshadrinath, J.; Singh, B.; Panigrahi, B.K. Single-Turn Fault Detection in Induction Machine Using Complex-Wavelet-Based Method. IEEE Trans. Ind. Appl. 2012, 48, 1846–1854. [Google Scholar] [CrossRef]
  24. Akhil Vinayak, B.; Anjali Anand, K.; Jagadanand, G. Wavelet-based Real-time Stator Fault Detection of Inverter-fed Induction Motor. IET Electr. Power Appl. 2020, 14, 82–90. [Google Scholar] [CrossRef]
  25. Yang, J.; Huang, J.; Liu, T. Diagnosis of Stator Faults in Induction Motor Based on Zero Sequence Voltage after Switch-Off. J. Zhejiang Univ. Sci. A 2008, 9, 165–172. [Google Scholar] [CrossRef]
  26. Dash, R.N.; Subudhi, B.; Das, S. A comparison between MLP NN and RBF NN techniques for the detection of stator inter-turn fault of an induction motor. In Proceedings of the 2010 International Conference on Industrial Electronics, Control and Robotics, Rourkela, India, 27–29 December 2010. [Google Scholar] [CrossRef]
  27. Mejia-Barron, A.; Tapia-Tinoco, G.; Razo-Hernandez, J.R.; Valtierra-Rodriguez, M.; Granados-Lieberman, D. A Neural Network-Based Model for MCSA of Inter-Turn Short-Circuit Faults in Induction Motors and Its Power Hardware in the Loop Simulation. Comput. Electr. Eng. 2021, 93, 107234. [Google Scholar] [CrossRef]
  28. Yi, L.; Liu, Y.; Yu, W.; Zhao, J. A Novel Nonlinear Observer for Fault Diagnosis of Induction Motor. J. Algorithms Comput. 2020, 14, 174830262092272. [Google Scholar] [CrossRef]
  29. Cherif, H.; Benakcha, A.; Laib, I.; Chehaidia, S.E.; Menacer, A.; Soudan, B.; Olabi, A.G. Early Detection and Localization of Stator Inter-Turn Faults Based on Discrete Wavelet Energy Ratio and Neural Networks in Induction Motor. Energy 2020, 212, 118684. [Google Scholar] [CrossRef]
  30. Husari, F.; Seshadrinath, J. Incipient Interturn Fault Detection and Severity Evaluation in Electric Drive System Using Hybrid HCNN-SVM Based Model. IEEE Trans. Ind. Inf. 2022, 18, 1823–1832. [Google Scholar] [CrossRef]
  31. Tian, R.; Chen, F.; Dong, S. Compound Fault Diagnosis of Stator Interturn Short Circuit and Air Gap Eccentricity Based on Random Forest and XGBoost. Math. Probl. Eng. 2021, 42, 2149048. [Google Scholar] [CrossRef]
  32. Zhang, K.; Jiang, B.; Chen, F. Multiple-Model-Based Diagnosis of Multiple Faults With High-Speed Train Applications Using Second-Level Adaptation. IEEE Trans. Ind. Electron. 2021, 68, 6257–6266. [Google Scholar] [CrossRef]
  33. Koodziejek, P.; Wachowiak, D. Fast Real-Time RDFT- and GDFT-Based Direct Fault Diagnosis of Induction Motor Drive. Energies 2022, 15, 1244. [Google Scholar] [CrossRef]
  34. Sundararajan, P.; Sathik, M.H.M.; Sasongko, F.; Tan, C.S.; Pou, J.; Blaabjerg, F.; Gupta, A.K. Condition Monitoring of DC-Link Capacitors Using Goertzel Algorithm for Failure Precursor Parameter and Temperature Estimation. IEEE Trans. Power Electron. 2020, 35, 6386–6396. [Google Scholar] [CrossRef]
  35. Papathanasopoulos, D.A.; Giannousakis, K.N.; Dermatas, E.S.; Mitronikas, E.D. Vibration Monitoring for Position Sensor Fault Diagnosis in Brushless DC Motor Drives. Energies 2021, 14, 2248. [Google Scholar] [CrossRef]
  36. Pena-Alzola, R.; Sztykiel, M.; Jones, C.E.; Norman, P.J.; Moore, G.; Pou, J.; Burt, G.M. First-Fault Detection in DC Distribution With IT Grounding Based on Sliding Discrete Fourier-Transform. IEEE Trans. Power Electron. 2021, 36, 3649–3654. [Google Scholar] [CrossRef]
  37. Prasetyo, Y.T. “The Big One” Earthquake Preparedness Assessment among Younger Filipinos Using a Random Forest Classifier and an Artificial Neural Network. Sustainability 2023, 15, 679. [Google Scholar] [CrossRef]
  38. Guo, G.; Cui, X.; Du, B. Random-Forest Machine Learning Approach for High-Speed Railway Track Slab Deformation Identification Using Track-Side Vibration Monitoring. Appl. Sci. 2021, 11, 4756. [Google Scholar] [CrossRef]
  39. Liu, J.; Xu, Q.Y.; Chen, W.S. Classification of Bird and Drone Targets Based on Motion Characteristics and Random Forest Model Using Surveillance Radar Data. IEEE Access 2021, 9, 160135–160144. [Google Scholar] [CrossRef]
  40. Chen, S.; Yang, R.; Zhong, M. Graph-based semi-supervised random forest for rotating machinery gearbox fault diagnosis. Control Eng. Pract. 2021, 117, 104952. [Google Scholar] [CrossRef]
Figure 1. Structural diagram of the EMU traction system.
Energies 16 04949 g001
Figure 2. Diagnostic condition Ⅰ inverter control.
Energies 16 04949 g002
Figure 3. Diagnostic condition Ⅱ inverter control.
Energies 16 04949 g003
Figure 4. Diagnostic condition Ⅲ inverter control.
Energies 16 04949 g004
Figure 5. Goertzel algorithm flowchart.
Energies 16 04949 g005
Figure 6. Flowchart of fault traction motor ITSC diagnosis.
Energies 16 04949 g006
Figure 7. Traction motor ITSC fault diagnosis simulation experimental platform.
Energies 16 04949 g007
Figure 8. Photographs of the traction motor ITSC fault simulation experimental platform.
Energies 16 04949 g008
Figure 9. DC voltage and experimental motor phase voltages: (a) output voltage of silicon rectifier equipment; (b) diagnostic condition Ⅱ‘s experimental motor phase voltages.
Energies 16 04949 g009
Figure 10. ITSC fault short-circuits’ inter-turn current and motor three-phase currents: (a) ITSC fault short-circuit inter-turn current; (b) ITSC fault three-phase currents.
Energies 16 04949 g010
Figure 11. Current fault features change with different numbers of short-circuit turns: (a) amplitude features Δi change with the number of short-circuit turns; (b) phase angle features Δθ change with the number of short-circuit turns.
Energies 16 04949 g011
Figure 12. Current fault features change with the transition resistance: (a) amplitude features Δi change with the transition resistance; (b) phase angle features Δθ change with the transition resistance.
Energies 16 04949 g012
Table 1. Working status of two-level traction inverter.
Mode01234567
SA00001111
SB00110011
SC01010101
Voltage vector U 0 U 1 U 2 U 3 U 4 U 5 U 6 U 7
Table 2. Definition of fault features.
Diagnostic Condition ⅠDiagnostic Condition ⅡDiagnostic Condition Ⅲ
Δibc = ibmaxicmaxΔica = icmaxiamaxΔiab = iamaxibmax
Δθbc = θbθcΔθca = θcθaΔθab = θaθb
Table 3. ITSC fault motor and diagnostic condition control parameters.
ParametersValuesParametersValues
Nominal power5.5 kWNominal frequency50 Hz
Nominal voltage380 VConnection modeY
Nominal current11.7 ANominal speed1445 rpm
Poles4Turns per phase162
Magnetizing inductance205.2 mHStator resistance1.061 Ω
Rotor resistance0.6269 ΩStator Leakage inductance3.217 mH
Rotor Leakage inductance7.349 mHInertia0.1367 kg·m2
Modulation frequency100 HzModulation index0.4
Carrier frequency5000 HzDC-link voltage300 V
Table 4. ITSC fault setting parameters.
ParametersValues
Transition resistance (Ω)0, 1, 2, 4, 8
Short-circuit turns5, 7, 12, 20, 25, 34, 39, 47, 52
Table 5. Diagnosis results of common classification models.
ModelsAccuracy of the Train SetsAccuracy of the Test Sets
BP neural network97.86%97.5%
KNN98.57%100%
SVM95%97.5%
Naive Bayes99.29%100%
Random Forest100%100%
Disclaimer/Publisher’s Note: The statements, opinions and data contained in all publications are solely those of the individual author(s) and contributor(s) and not of MDPI and/or the editor(s). MDPI and/or the editor(s) disclaim responsibility for any injury to people or property resulting from any ideas, methods, instructions or products referred to in the content.

