1. Introduction
The contemporary energy sector relies heavily on fossil fuels and nuclear energy, and the availability of clean energy sources is limited. This creates a fundamental problem regarding fossil fuel exploitation and the associated ecological degradation [
1]. It is urgent to take action to promote clean energy and restore the environment. However, limited social awareness hampers progress in the adoption of innovative and environmentally friendly energy sources. Despite some progress, natural environmental degradation is rapidly accelerating, as predicted [
2,
3]. These well-documented phenomena pose major challenges and may threaten the existence of our civilization. The current changes may be irreversible. The interconnection of the Earth in a larger structure increases the system’s inertia and is difficult to calculate precisely. Wind and solar energy are considered to be the cleanest and most ecological sources, but unpredictability is a problem. However, the continent’s interconnected power grid reduces this problem and functions as a unified energy accumulator. The advances in low-speed multi-pole generators and high-voltage semiconductor devices have overcome previous limitations in the technology of wind turbines and grid coordination. The main challenge of implementing these energy sources now lies in overcoming the obstacles of humanity itself. Wind energy has been used for thousands of years, but it presents new aspects and considerations in current use.
This publication presents the results of experimental investigations and numerical simulations of a vertical-axis H-type wind turbine, focusing on the effect of the angle between the chord profile and the plane of rotation. The subject matter of the study involves an experimental investigation carried out in a wind tunnel to analyze the influence of the blade pitch angle on the efficiency of vertical-axis wind turbines. The article is one of the planned publications based on the ongoing research of wind turbines conducted at two academic institutions: AGH University of Science and Technology in Krakow and Rzeszow University of Technology in Rzeszow. The authors present the results of tunnel tests conducted on a small unit designed for various applications, such as residential, highway, and individual homes. As a result, the contemporary perspective on renewable energy, including wind, water, and solar power, needs to be strongly reassessed in relation to theories and opinions from a few decades ago. The fundamental issue of grid integration using inverters has essentially ceased to exist [
4]. Therefore, perceiving renewable energy only in terms of large-scale units or farms is unwarranted. The creation of an energy network based on small units distributed over a large area is now justified. Even when considering this problem from a formal point of view, including permits, legal barriers, human factors, investment risks, and the risk of major failures, the challenges in distributed systems are significantly smaller. Thus, conducting research on such units is clearly sensible. Currently, there is a trend toward improving classical designs through mechanization to increase turbine efficiency and surpass the Betz limit. However, it is necessary to consider whether this approach is meaningful, as the introduction of additional moving components undoubtedly increases cost and, most importantly, reliability. The fundamental advantages of such devices lie in their simplicity and reliability. Therefore, research should focus on a more precise selection of the geometry of the structure, including the profile of the blades and the number of blades, and geometric relationships such as the length of the chord, the elongation, and the radius of curvature. There are numerous interactive dependencies that require precise research, and there is no one-size-fits-all solution. All of these considerations result in improvements in efficiency and various characteristics. There are numerous publications on achieving higher efficiency through the aforementioned mechanization, such as the use of changing variable pitch angles automatically or additional structures in the form of diffusers [
5,
6,
7,
8]. In [
5], a new augmentation stator is introduced to increase output power, using a convergent divergence channel, and the maximum speed position varied from 0.26 to 0.41. Research [
6] investigated a new Savonius turbine blade, evaluated the effects of overlap ratio, blade profile, and blade number on turbine performance, and successfully identified the best blade configuration. The output power of micro-scale wind turbines has significantly increased. Their output power evidences a significant increase, of about four to five times that of conventional wind turbines. In [
8], several aerodynamic models were analyzed, which have been used to better predict performance and design analysis of the Darrieus type rotary VAWT, and the Vortex model is considered the most accurate model. However, these often make the designs mechanically complex, and vertical turbines become directional, thus losing the fundamental advantage of omnidirectionality. This introduces a primary disadvantage of increased costs and limited reliability, leading to higher operational expenses. Reliability is a fundamental attribute in this case. The generated power is a function of both efficiency, represented by the coefficient of performance (C
p), and surface area. In some cases, optimizing the geometry of the turbine may yield greater benefits compared to incorporating supplementary mechanisms that provide marginal improvements to the coefficient of performance. By focusing on refining the geometric aspects, such as the shape, size, and configuration of the turbine, the overall performance can be significantly enhanced.
The difference between this research and many related articles is that the authors present the actual results of experimental research into the effect of pitch angles on characteristics. Some papers are focused on theoretical considerations without an accurate experimental study. Insufficient studies in this field are generally due to the limited availability of wind tunnels at research facilities conducting such reliable experiments. This solution was tested at a 1:1 scale to ensure its practical viability and effectiveness. By conducting experiments using a full-scale prototype, the researchers were able to assess the performance and functionality of the solution under real conditions. This step was crucial in validating the design and verifying its market potential. The research outcomes have been incorporated into the production of operational wind turbines.
2. Origin of Research
Issues related to wind energy are currently a significant area of interest in the field of engineering sciences, although the concept of harnessing wind energy has been known since ancient times, and various types of wind devices have been constructed to facilitate the varying complexity of aerodynamic transformations. Humanity has been using wind energy for several thousand years, as evidenced by archaeological findings. The documented beginnings of wind energy utilization date back to ancient Egypt at around 3000 BCE, where the wind was used to propel boats as a means of transportation. Significantly later, but still in antiquity, around 1800 BCE, wind-driven mechanisms such as windmills were created to power irrigation systems. In the early stages of our era, windmills were developed for grain milling, thus initiating a two-millennia-long period in which such applications predominantly defined their usage, as is presented in [
9]. With the arrival of steam engines, followed by electric machines and the utilization of electric current, windmills were essentially sidelined. The use of turbines for electricity generation only became possible in the late 19th century, or more precisely, in the early 20th century, with the invention of the electric generator. Currently, humanity is compelled to turn to these sources and return to these converters of clean and limitless energy. The primary division of wind turbines is based on their method of capturing wind energy and converting it into mechanical energy [
2]. The division mentioned leads to a fundamental classification predicated on the structure or design, thereby resulting in a perceptible categorization into:
- −
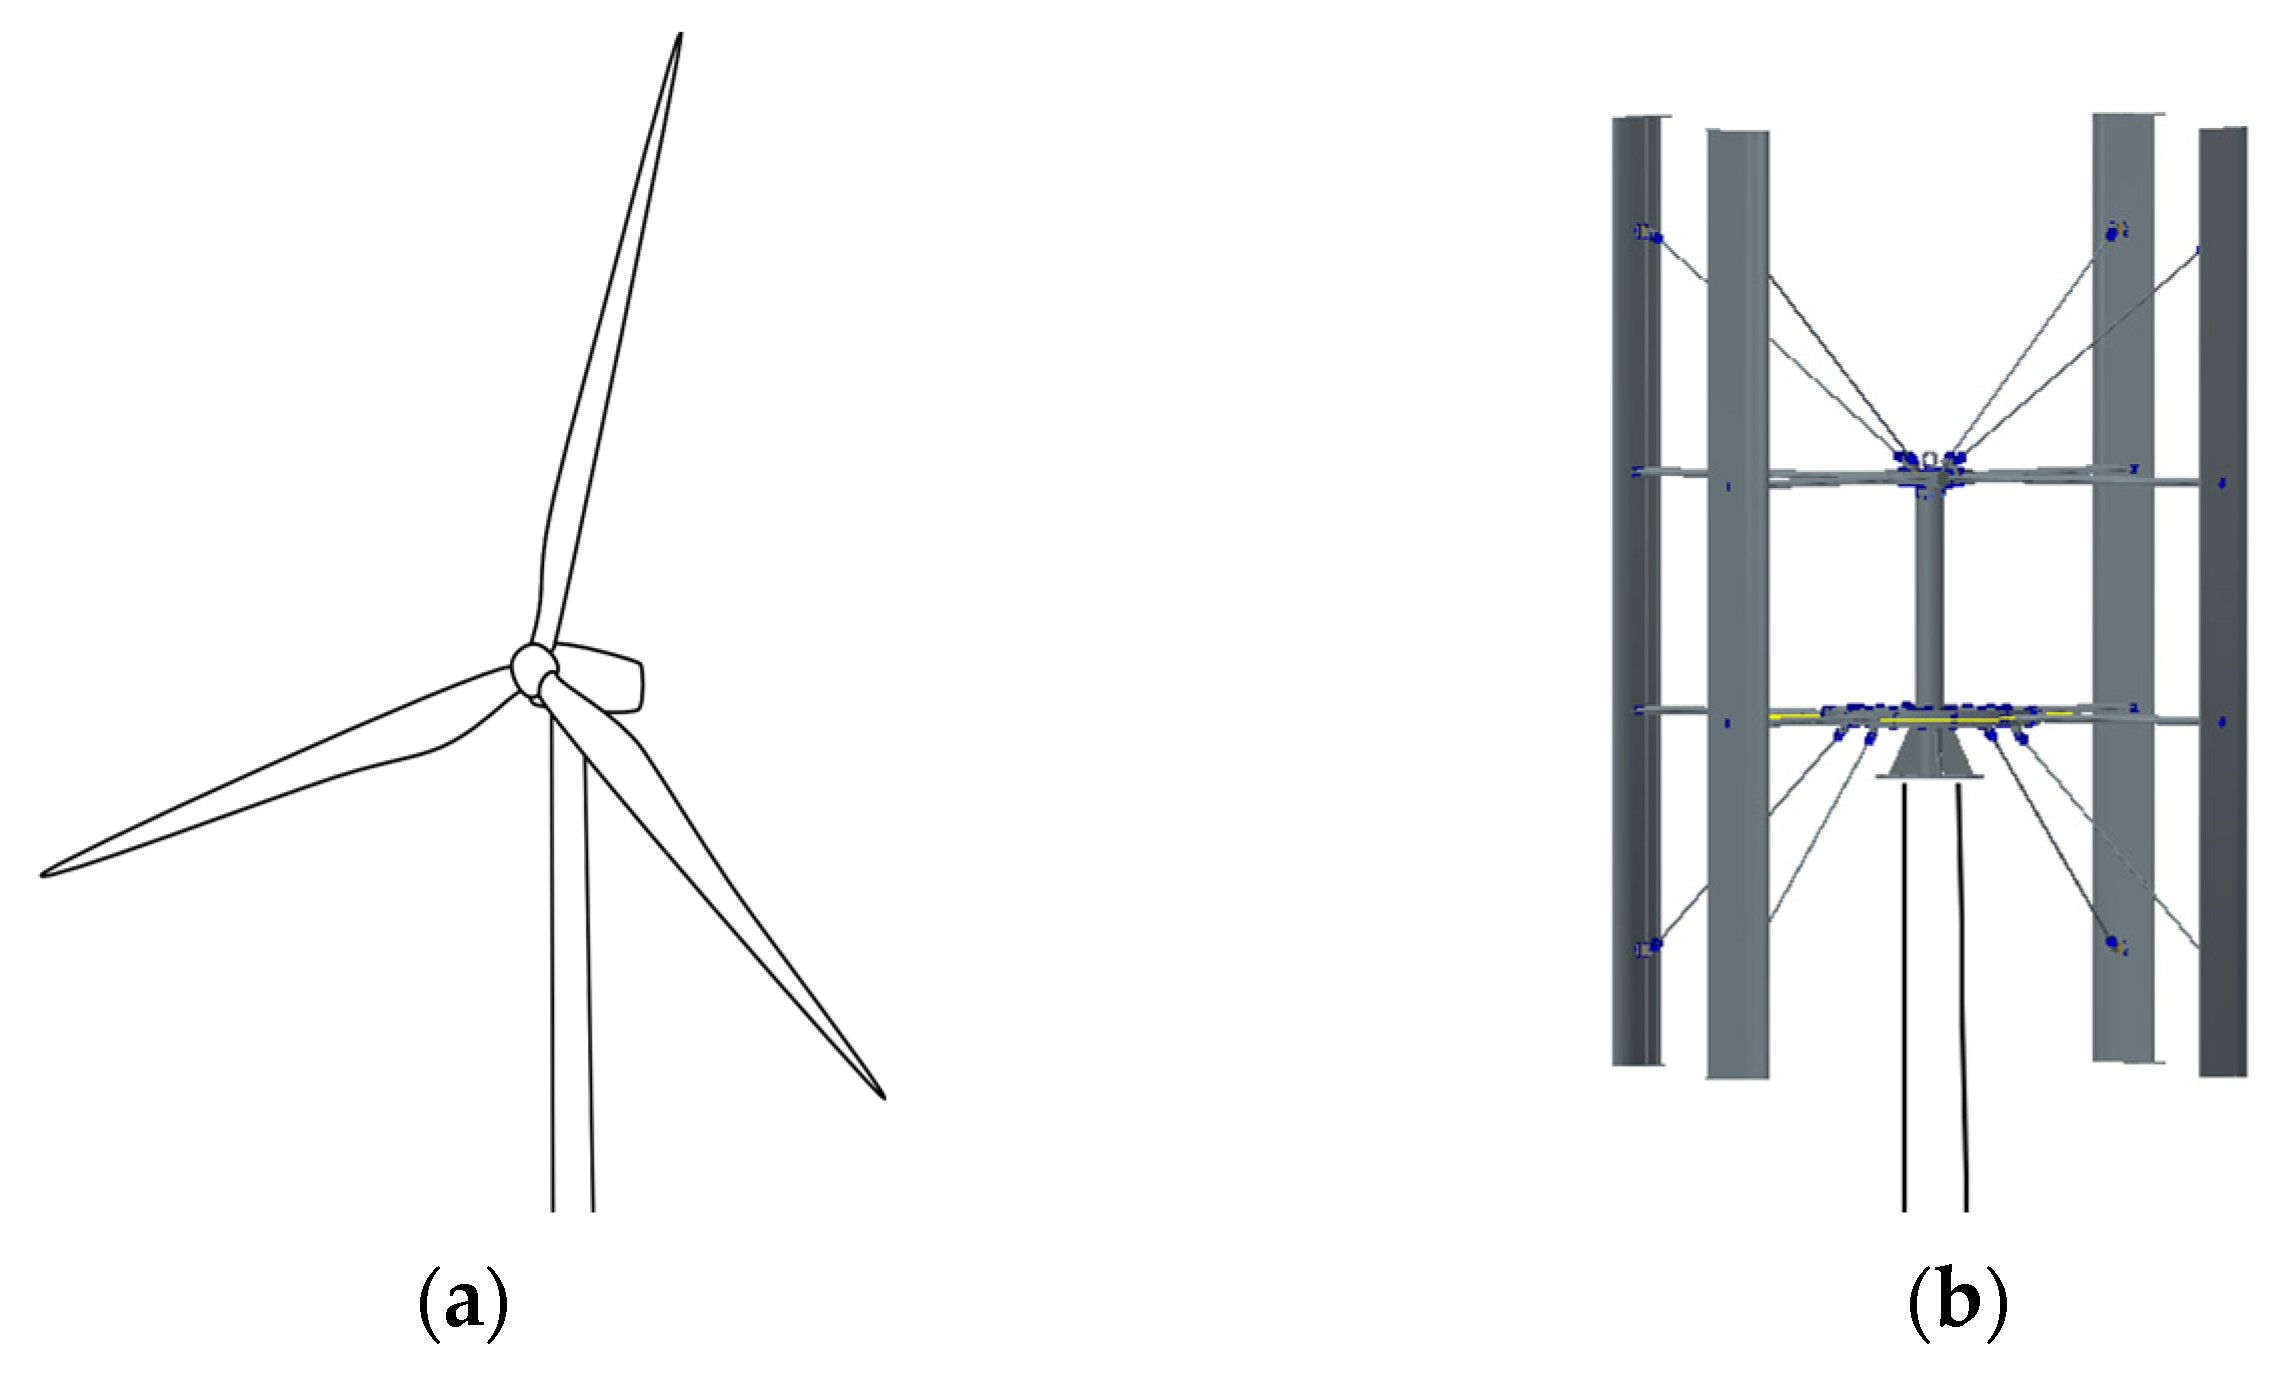
Horizontal-axis wind turbines (HAWT)-the turbine’s rotation axis is horizontal, as shown in
Figure 1a;
- −
Vertical-axis wind turbines (VAWT)-the turbine’s rotation axis is vertical, as shown in
Figure 1b.
Figure 1.
Types of wind turbines: (a) horizontal axis, (b) vertical axis.
Figure 1.
Types of wind turbines: (a) horizontal axis, (b) vertical axis.
In both types, there exists a wide range of windmills and turbine variations. Vertical-axis wind turbines, in particular, have gained significant interest in recent times due to their distinctive characteristics. In contrast, horizontal-axis turbines do not exhibit significant categorization. The most commonly encountered configuration is the three-bladed turbine, which represents a compromise between overall efficiency and start-up capability. Larger units employ variable pitch control systems, while smaller ones feature simpler designs with a fixed pitch angle. Most types leverage established principles of aerodynamics, drawing on well-established knowledge from aviation, and many of them rely on classical airfoil theory, which is presented in [
10,
11].
Turbines with horizontal axes have historically and currently broader usage; however, they suffer from a notable drawback, namely the requirement for continuous alignment with the incoming wind direction. The turbine nacelle, together with all machinery, must be able to rotate over a wide range of angles, driven by a control system that responds to changes in the direction of airflow. Consequently, there has been a quest for alternative solutions. One such solution is the vertical-axis wind turbine, which has the advantage of exhibiting omnidirectional characteristics, thereby avoiding the need for wind tracking. Irrespective of the direction of the incident airflow, the turbine maintains a consistent performance profile. In terms of construction, this configuration imparts a greater degree of simplicity; however, it engenders considerable challenges from a design and research perspective, particularly in the field of fluid dynamics. On the basis of theoretical simulations, computer programs have been used to predict the force and moment [
12], and the physical description of vertical-axis wind turbines was studied through the natural processes occurring in Darius movements when the attack angle changed direction [
13]. Vertical-axis wind turbines are presently under development and finding increased applications as lower-capacity units within distributed systems for localized power generation, while retaining the potential for grid integration. The focus of this article centers on a series of investigations conducted on a small-scale unit, approximately 1000 W, of the H-type Darius configuration, with provisions for straightforward scalability. The experimental setup involved the installation of a four-bladed turbine with a fixed pitch angle, although with the ability to be adjusted.
Continuous improvement in performance is necessary for vertical-axis wind turbines (VAWTs) to compete with horizontal-axis wind turbines (HAWTs), which currently exhibit a higher power coefficient (C
p). Research in this field has been presented based on theoretical simulations and experimental research, for wind turbines embodied in high buildings inside towers [
14], for fixed-angle turbines [
15], and by adjusting variable parameters to maximize system performance indexes in real time [
16]. Rewiev [
17] summarizes recent experimental, computational, and theoretical research efforts that have contributed to improving our understanding of, and the ability to predict interactions between, atmospheric boundary layer flows and wind turbines and wind farms. The lower C
p of vertical-axis wind turbines is due to the complex flow dynamics in their surroundings and the relatively limited amount of research conducted on VAWTs. Several studies analyzed variations in loads, moments, angle of attack, vorticity, and boundary layer phenomena as functions of pitch angle using computational fluid dynamics (CFD) simulations [
18,
19,
20,
21]. The aim of most studies has been to gain insight into the aerodynamic behavior of VAWTs and identify optimal turbine configurations, including pitch angle settings, that can improve their overall efficiency [
22,
23,
24]. One potential parameter for improving VAWT performance is the pitch angle; it has been confirmed by analyses that the right angle can provide an increase in turbine performance [
25,
26,
27].
Vertical-axis wind turbines (VAWTs) have been attracting increasing attention for their ability to capture and convert wind energy into usable electricity, onshore in dense urban areas [
28], in low-rise building blocks [
29], on the rooftop of a building [
30], and in offshore environments. These turbines offer several advantages over traditional HAWTs. One notable advantage is their ability to operate effectively in all wind directions. This inherent omnidirectional capability makes VAWTs more versatile in terms of placement and allows efficient energy extraction regardless of wind direction [
31,
32,
33].
VAWTs also offer cost advantages in addition to their operational flexibility. Their manufacturing costs are lower because of the simplicity of their blade profile and shape, which do not require intricate twists or tapers. This streamlined design reduces the complexity and expenses. In addition, the installation and maintenance costs of VAWTs are further reduced, as the generator can be conveniently located at ground level (or at sea level for offshore installations). This eliminates the need for expensive and complex tower structures commonly associated with HAWTs [
34,
35].
Another key benefit of VAWTs is their scalability. They can be easily adjusted and scaled to suit various power requirements and site conditions. Their robustness and durability contribute to their longevity and reliability, resulting in reduced maintenance needs and costs over time. Furthermore, VAWTs are known for their lower noise levels compared to HAWTs, due to their lower operational tip speed ratios λ. This characteristic makes VAWTs more suitable for urban areas where noise pollution is a concern [
36,
37]. A very interesting numerical analysis was presented in an article on the influence of tip vortices generated by airfoil profiles on the resulting vortex wake and the consequent changes in velocity profiles, which in turn affect the turbine efficiency. The aerodynamic aspects of wind turbines, especially vertical ones, are highly complex. The generated vortex paths, including those of structural elements such as the shaft and generator, can have a significant impact not only on efficiency but also on mechanical issues related to induced vibrations. Therefore, the question arises about the geometry of the structure, and as demonstrated by conducting research, there is neither a definitive solution nor a standardized response to this complex issue [
38].
The growing interest in VAWTs is driven by their versatility, cost effectiveness, scalability, robustness, and reduced noise levels. These advantages position VAWTs as a promising solution for sustainable energy generation in both offshore and urban environments [
39,
40,
41].
3. Materials and Methods
During the course of extensive aerodynamic research using wind tunnels, the authors made comprehensive measurements in a broad sense. The scope of their experimental efforts encompassed various aspects related to the aerodynamic phenomena under investigation. Through meticulous data acquisition and analysis, the authors aimed to capture a wide range of parameters and variables crucial to understanding the complex aerodynamic processes. Rotating speed, air flow velocity, torque, and electrical parameters were measured using the Daqbook 2001 modular system, consisting of a central unit and expansion modules that include an analog input card and a strain gauge measurement card. By adopting a holistic approach to measurements, the authors sought to provide a comprehensive overview of the physical phenomena. The pursuit of measurement data from multiple perspectives allowed for a more thorough examination of the intricate interplay between different factors and contributed to advancing the understanding of aerodynamics.
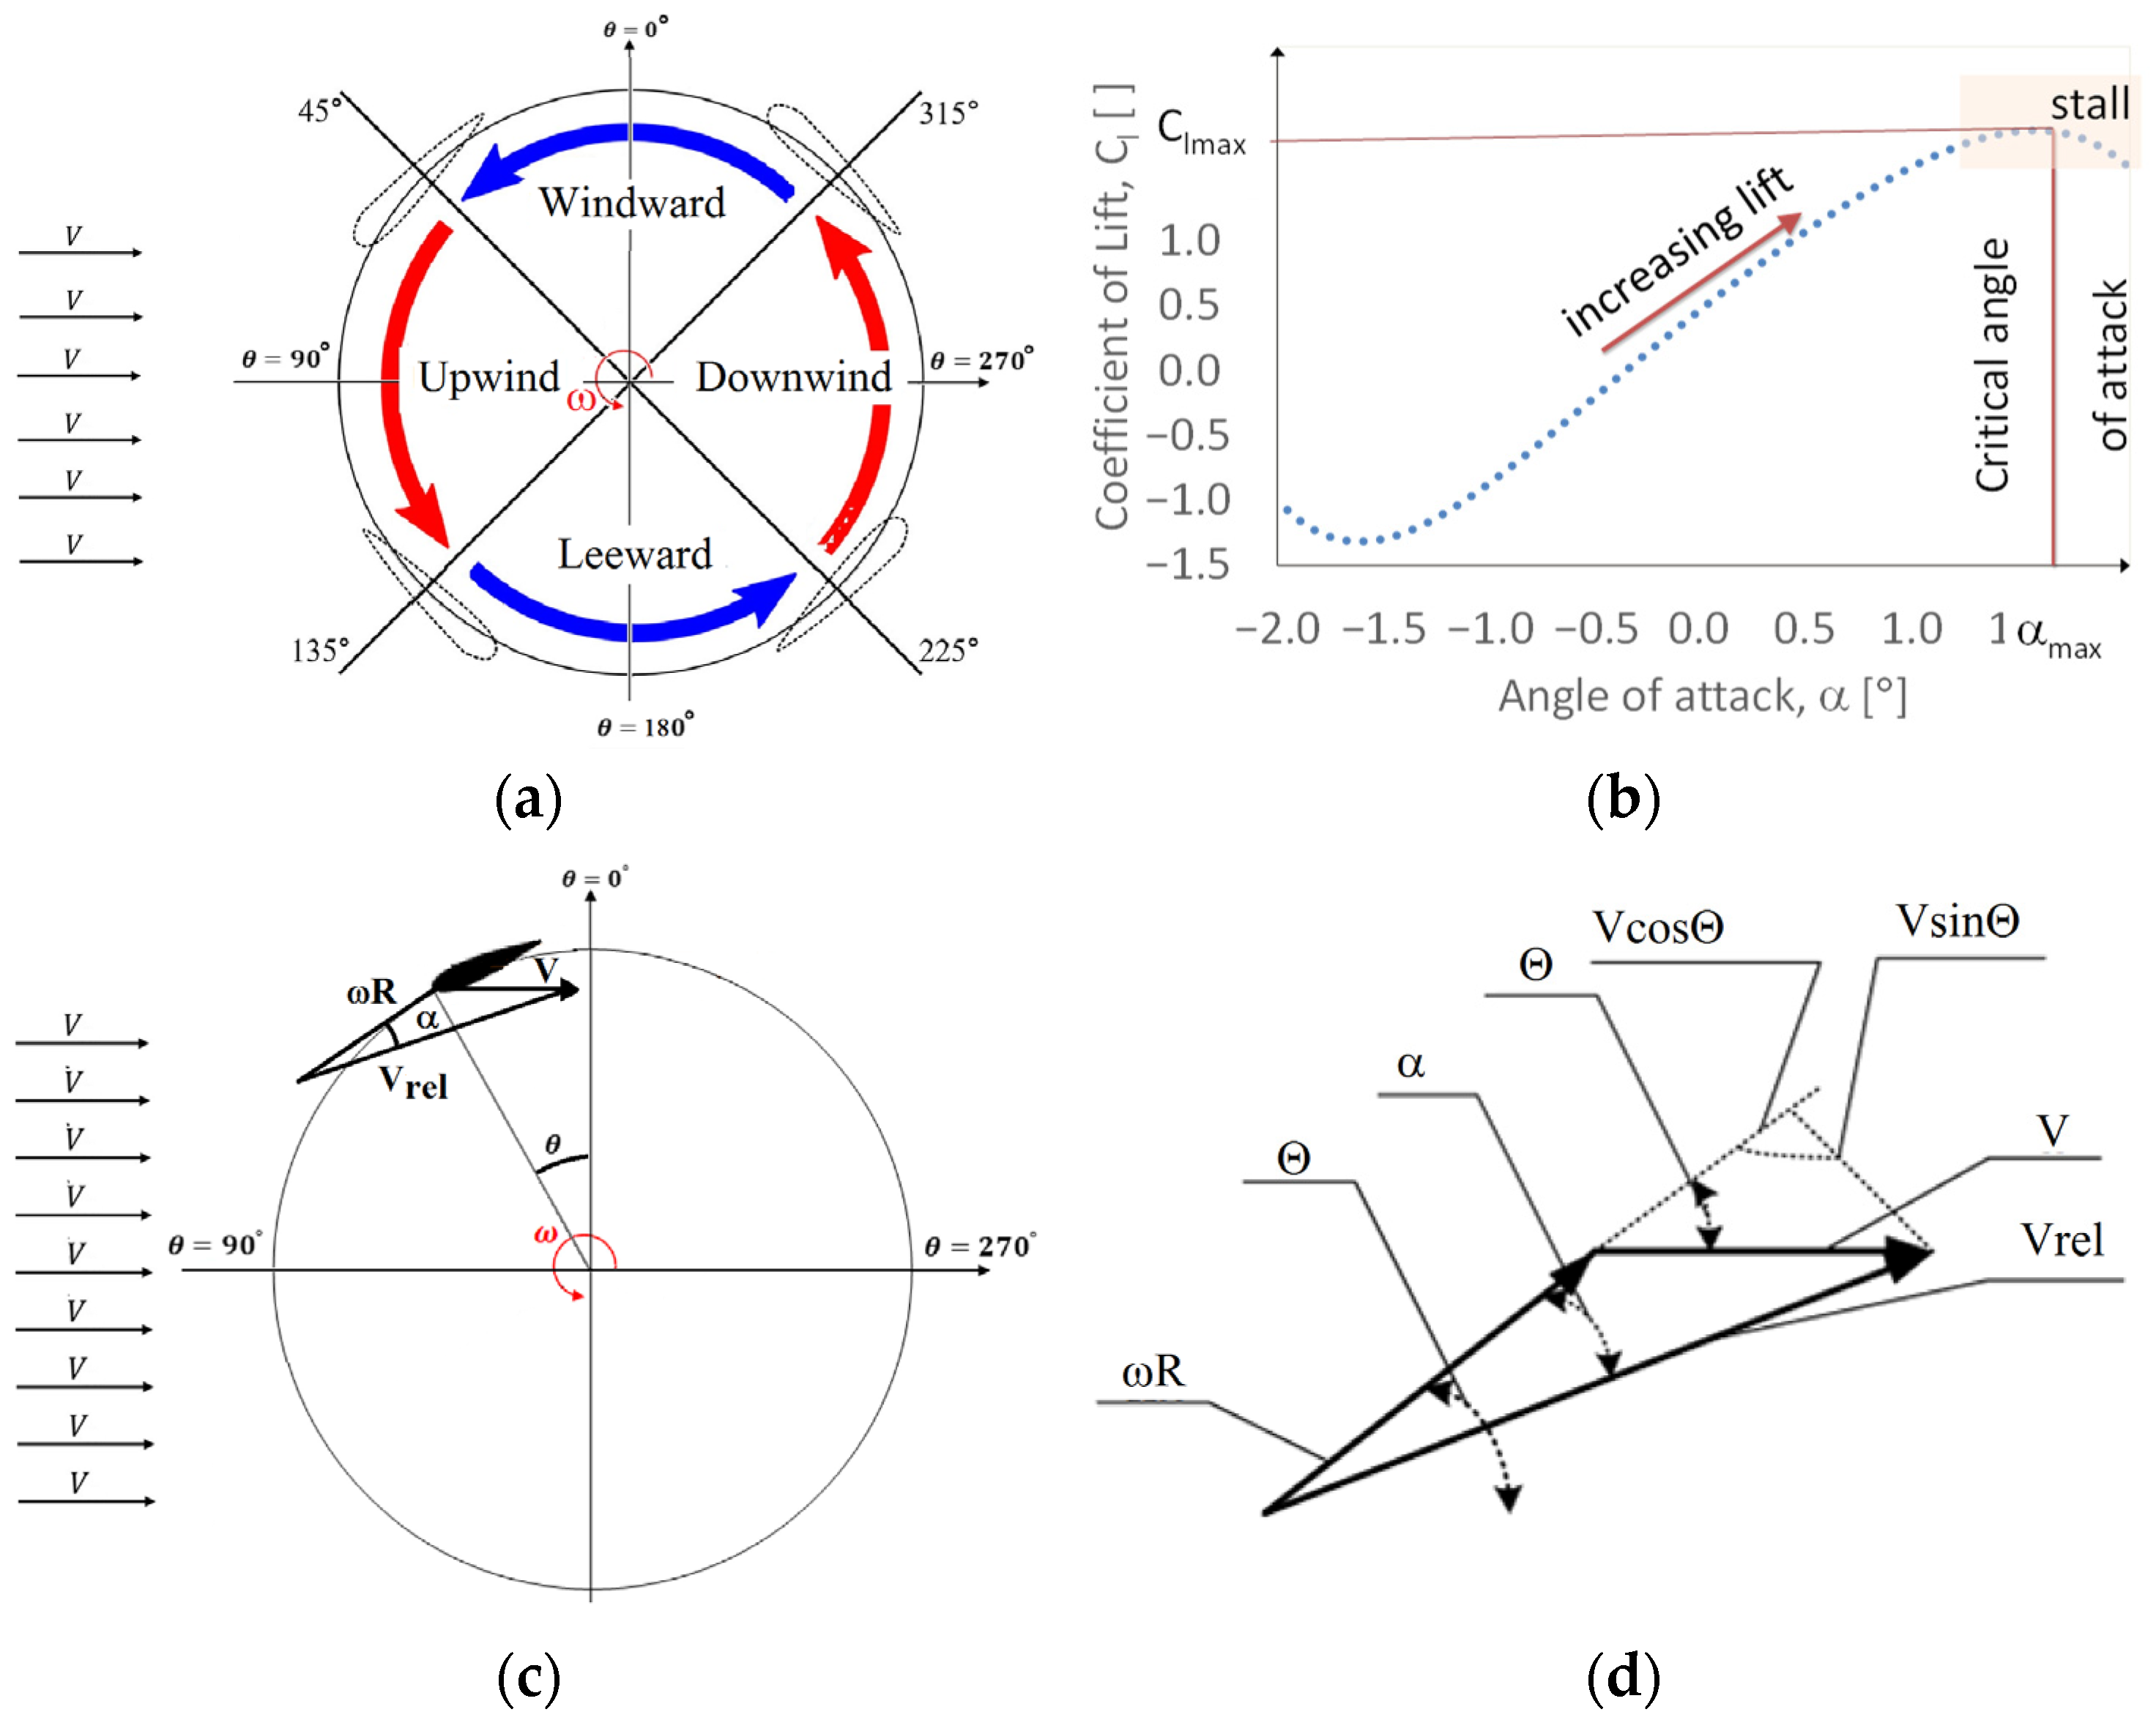
In wind energy, well-known airfoil profiles are typically used, which have been developed and validated through numerous wind tunnel tests and real-world conditions. However, these profiles are often modified to suit specific designs, maximizing their efficiency for the intended application. As a result, these profiles may differ in geometry from the classical airfoil profile. For vertical-axis turbines, in particular, it is crucial that the operating range, including the position of the critical angle of attack, is as far away as possible from the zero angle. The critical angle of attack refers to the condition wherein increasing the angle of attack beyond a certain value causes a rapid decrease in the lift coefficient value generated by the airfoil. The force generated on the airfoil, perpendicular to the chord line during airflow, is known as the lift force and is determined by the following formula [
2]:
where:
Fl—lift force generated on the airfoil, N;
Cl—lift coefficient;
S—profile area, m2;
pd—dynamic pressure during airflow, Pa.
Additionally, the participating force P
d, known as the drag force, is equal to [
3]:
where:
Fd—drag force generated on the airfoil, N;
Cd—drag coefficient;
S—profile area, m2;
pd—dynamic pressure during airflow, Pa.
The coefficients
Cl and
Cd do not have a constant value, but depend on the angle of attack. However, they do not depend solely on the angle of attack, as the shape of the curve strongly depends on the Reynolds number. The value of the lift force changes with the variation of the
Cl coefficient, which means it depends on the angle of attack and reaches its maximum value near the critical angle, beyond which it rapidly decreases. On the other hand, the drag component F
d, related to frictional resistance, increases nonlinearly with the increase in the
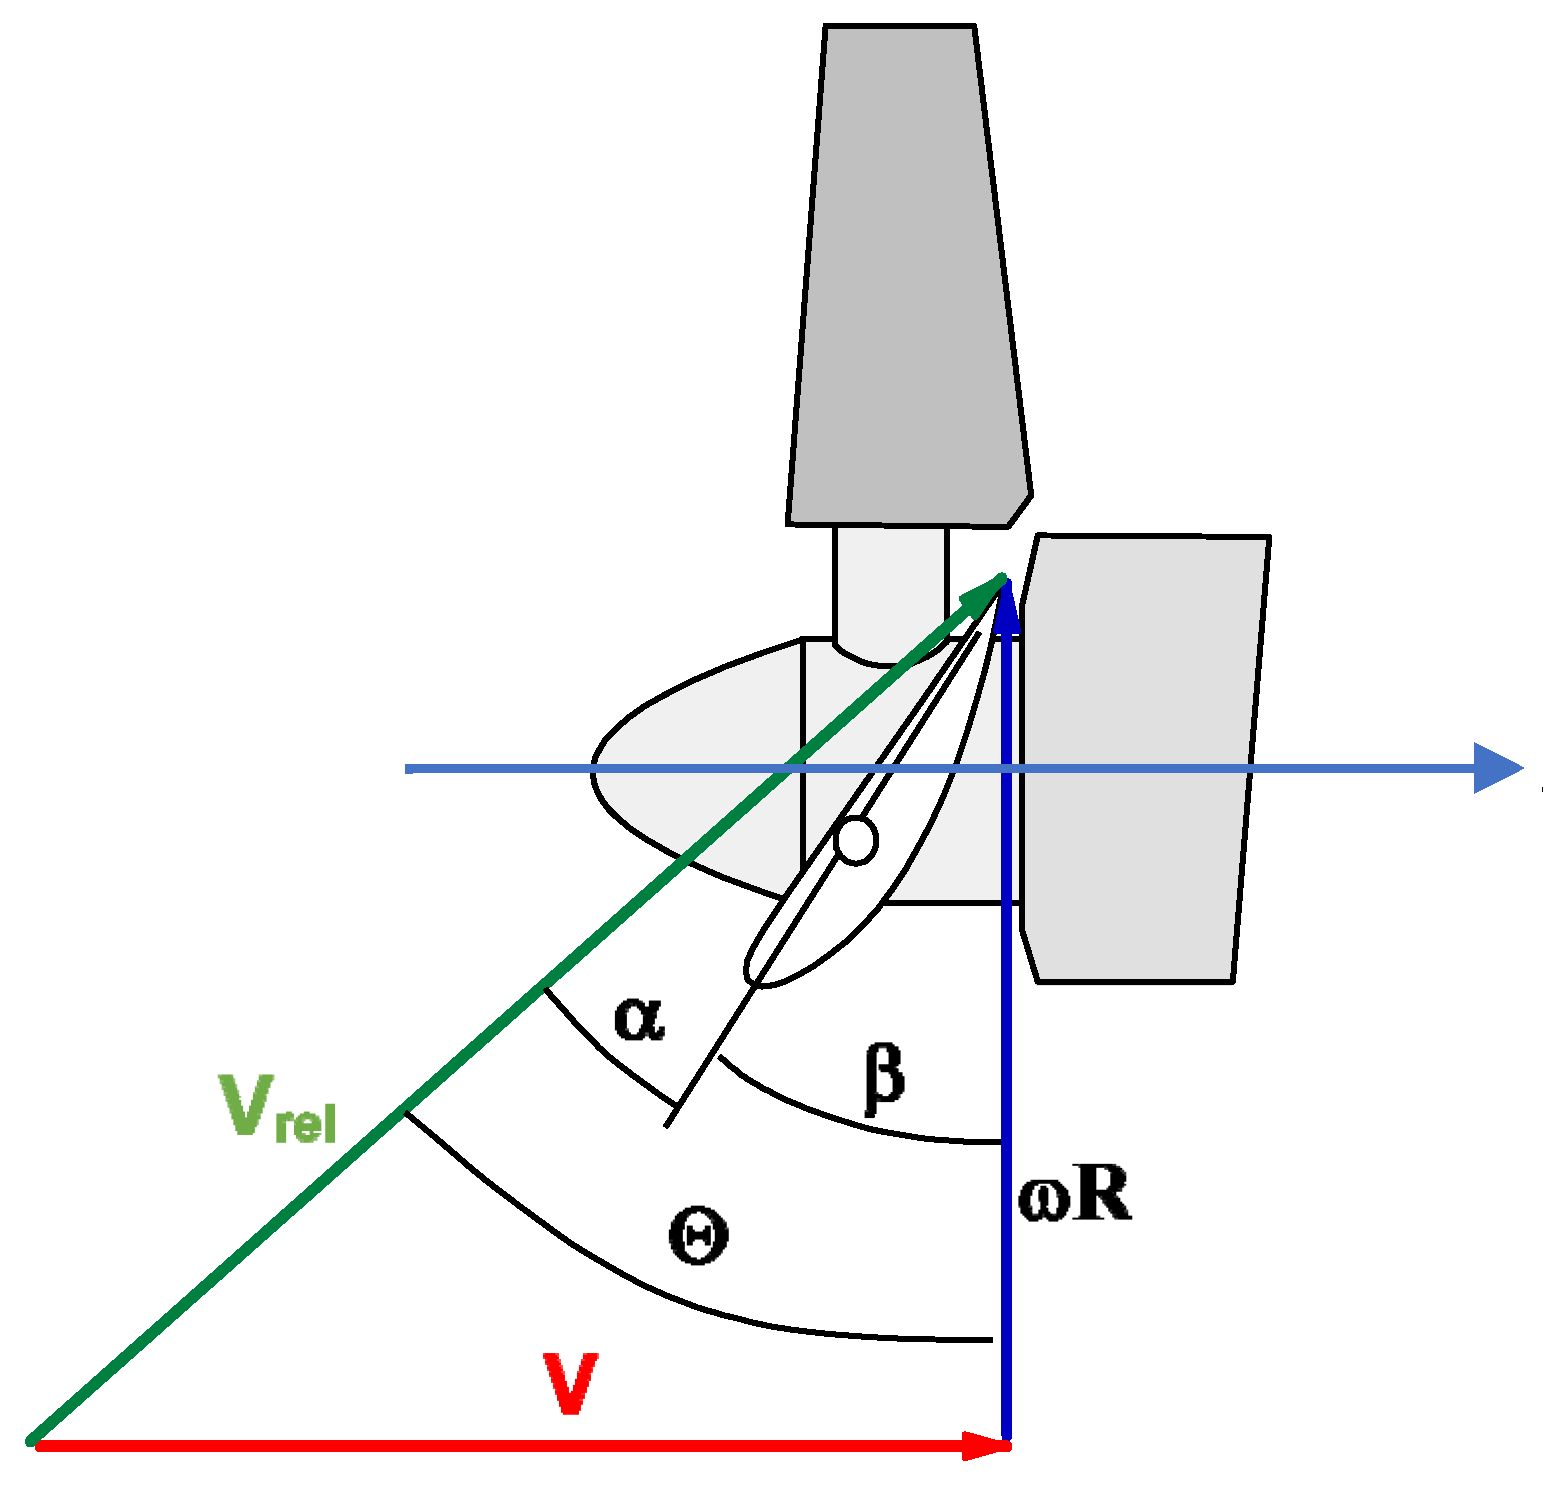
Cd coefficient as the angle of attack rises, causing a deceleration of the turbine’s rotational speed. This phenomenon is highly interactive. To clarify the concept of angle of attack, a horizontal-axis wind turbine model was used as an example, wherein this process is more transparent, as shown in
Figure 2 [
42].
The angle of attack α is the angle between the airfoil chord and the relative wind velocity V
rel, which is the resultant velocity between the inflow and the linear velocity ωR at a given radial distance. Under constant inflow conditions and constant turbine rotational speed, the angle of attack can be easily maintained close to the maximum airfoil efficiency. The value of this angle will depend on the turbine load. When the turbine load decreases, the speed increases, resulting in an increase in the component of the linear velocity ωR, leading to a decrease in the angle of attack α and thus the rotational moment that balances the forces of the inflow and the loading. On the contrary, increasing the load will reduce the rotational speed and the linear velocity vector, thereby increasing the angle of attack. Once the critical angle is exceeded, a sudden stall occurs, resulting in a decrease in lifting force and a slowdown in rotation. Returning to the initial point requires a significant reduction in load due to the significant aerodynamic hysteresis present. It should be noted that the angle of attack is not the angle between the chord line and the wind vector, but a result of the combination of the wind speed and the linear velocity vector of the blade. The relative velocity, as depicted in
Figure 2, is the result of the inflow and the rotational velocity, and this constitutes the core of the problem, contributing to the complexity of the aerodynamic phenomenon.
In the case of a vertical-axis wind turbine, the issue is more complex due to the rotational plane being parallel to the inflow direction, as shown in
Figure 3a–d. The forces exerted by individual blades around the circumferential flow show a pulsating nature, similar to the fluctuating instantaneous values of the angle of attack (AOA) as the angular position changes [
43,
44].
The variation of the angle of attack around the circumference of the vortex path can be determined using geometric relationships and knowledge of the tip speed ratio (λ or TSR), achievable for a specific turbine by performing aerodynamic tunnel tests [
45].
This implies that the angle of attack is equal to:
where:
α—angle of attack, °;
V—wind velocity, m/s;
θ—angle of blade angular position, °;
ωR—linear velocity of the blade, m/s;
λ—the tip speed ratio (TSR) of the turbine determined experimentally.
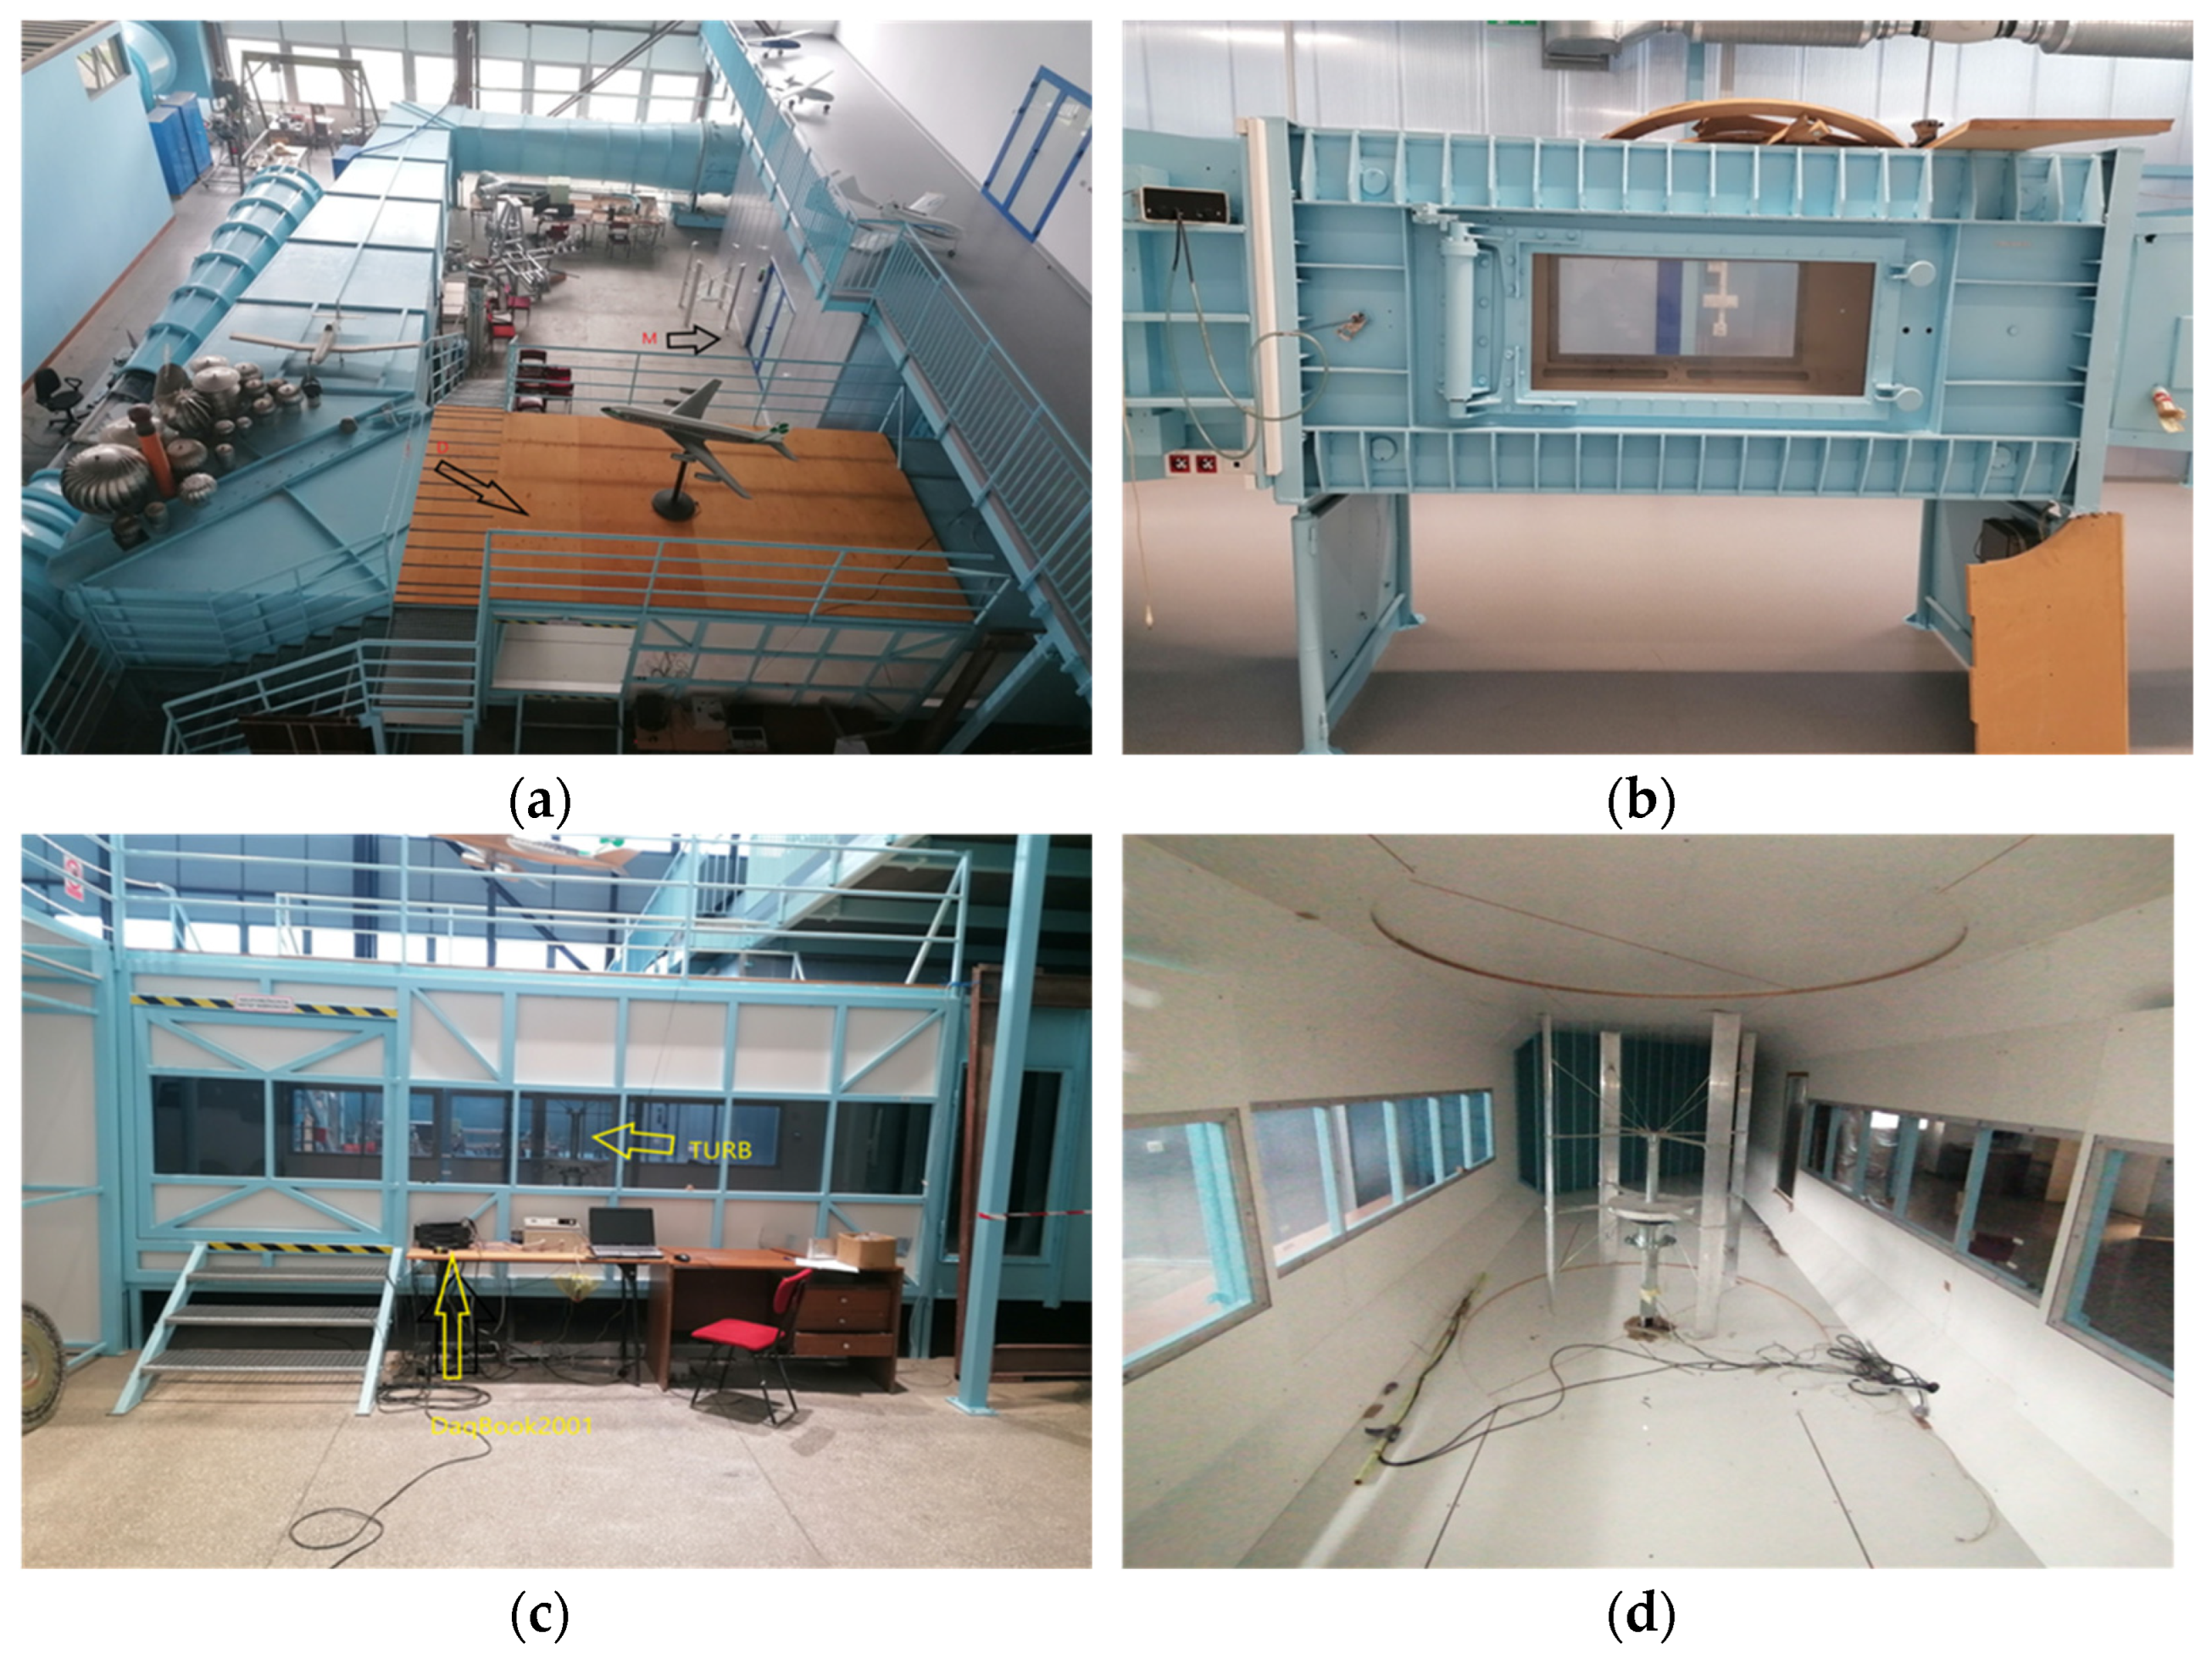
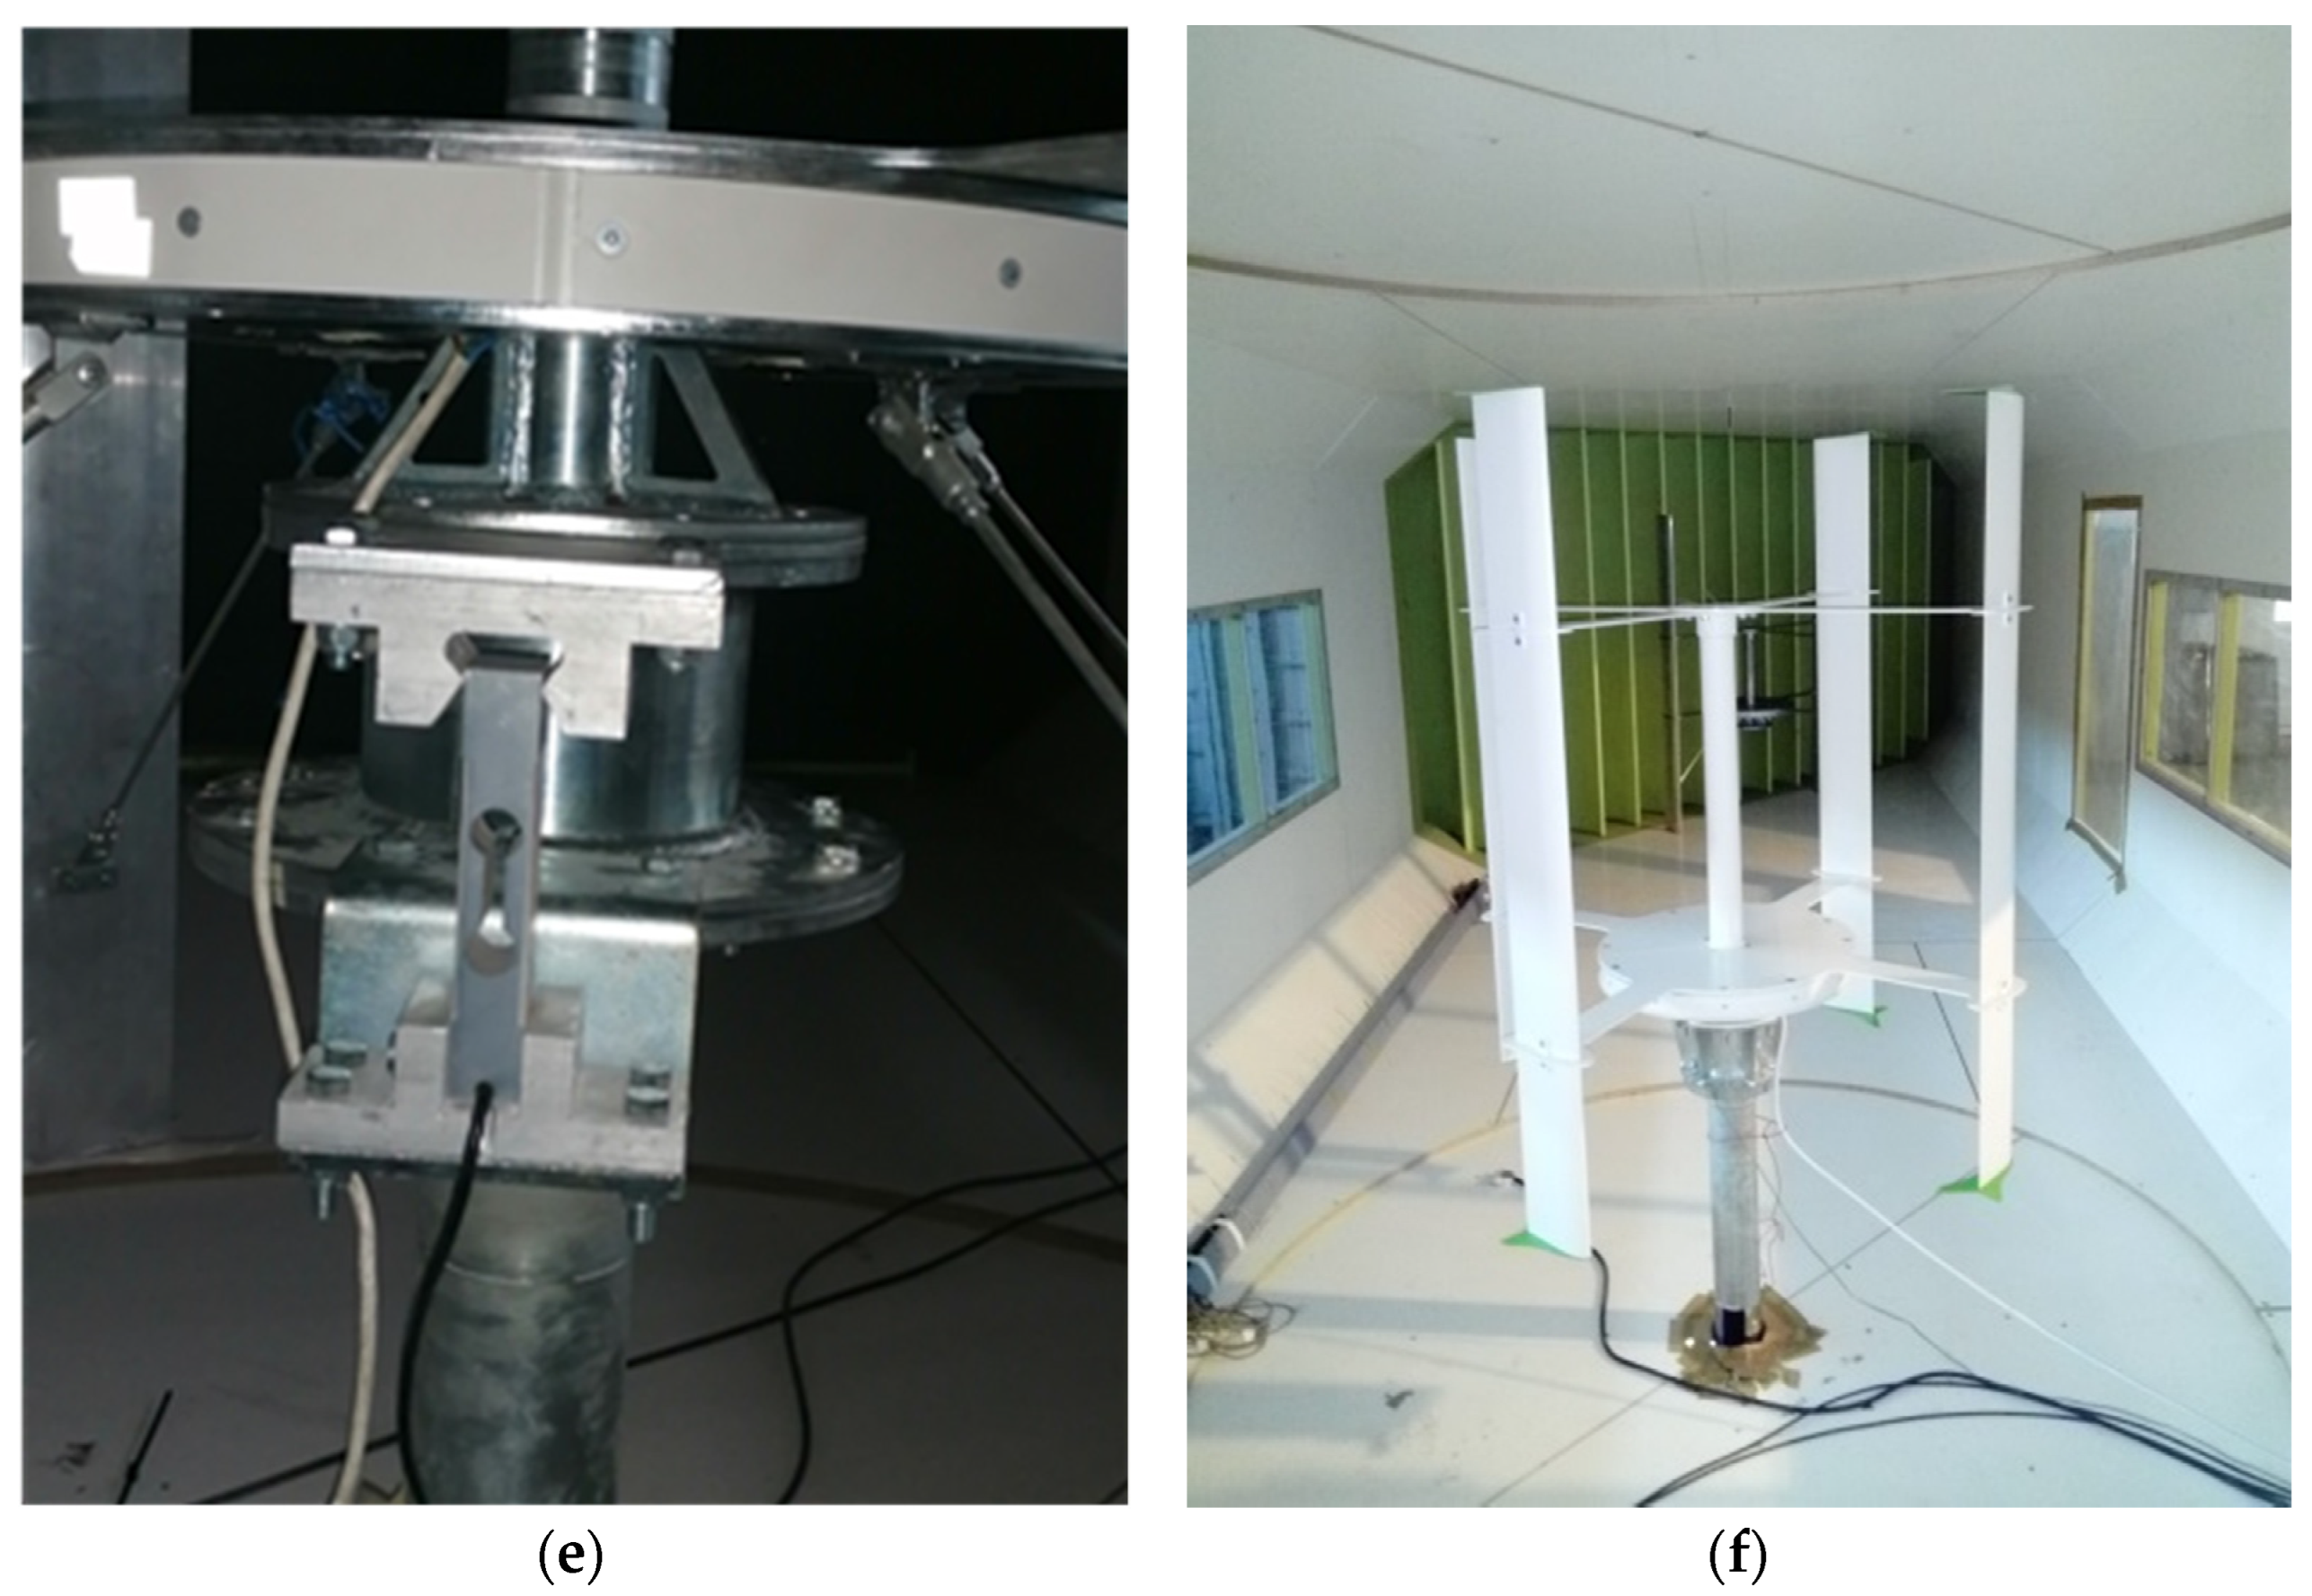
The turbine research was conducted in two facilities associated with the authors. Airfoil characteristic studies were carried out at the Wind Tunnel Laboratory of the AGH University of Science and Technology in Krakow. The general construction tests took place at the Department of Aeronautical and Aerospace Engineering of Rzeszow University of Technology in an aerodynamic tunnel with a measurement space, as shown in
Figure 4a–f [
45]. In
Figure 4a, a top view photograph of the wind tunnel is presented. It operates in a closed-circuit system. The tunnel has two high-speed measurement spaces (
Figure 4b) where the inflow velocity reaches up to 120 m/s. The dimensions of the measurement space are 0.9 m × 0.6 m × 2.5 m. The tunnel is dedicated to aerospace research and is equipped with a six-component internal strain gauge balance system, pressure scanners, and measurement systems. It is a low-turbulence tunnel with a turbulence level of T = 0.2–0.3%. The second measurement space, depicted in
Figure 4c, is dedicated to research in wind energy and construction. In this measurement space, speeds of up to 15 m/s can be achieved. The dimensions of this measurement space are 2 m × 3 m × 6 m. This section of the wind tunnel is equipped with a strain gauge aerodynamic balance system, multipoint differential pressure scanners, signal recording and analysis systems, and flow visualization tools. The vertical-axis wind turbine (
Figure 4d,f) was installed in this measurement section of the aerodynamic tunnel.
The tested model, with height dimensions h = 1.5 m, radius R = 0.55 m, and chord length c = 0.12 m, was designed to resemble a real turbine with a multi-pole generator without a starting torque. The generator load was actively and smoothly varied. A dynamometer was installed at the station to measure the shaft torque, from which the mechanical power of the turbine shaft was determined, as shown in
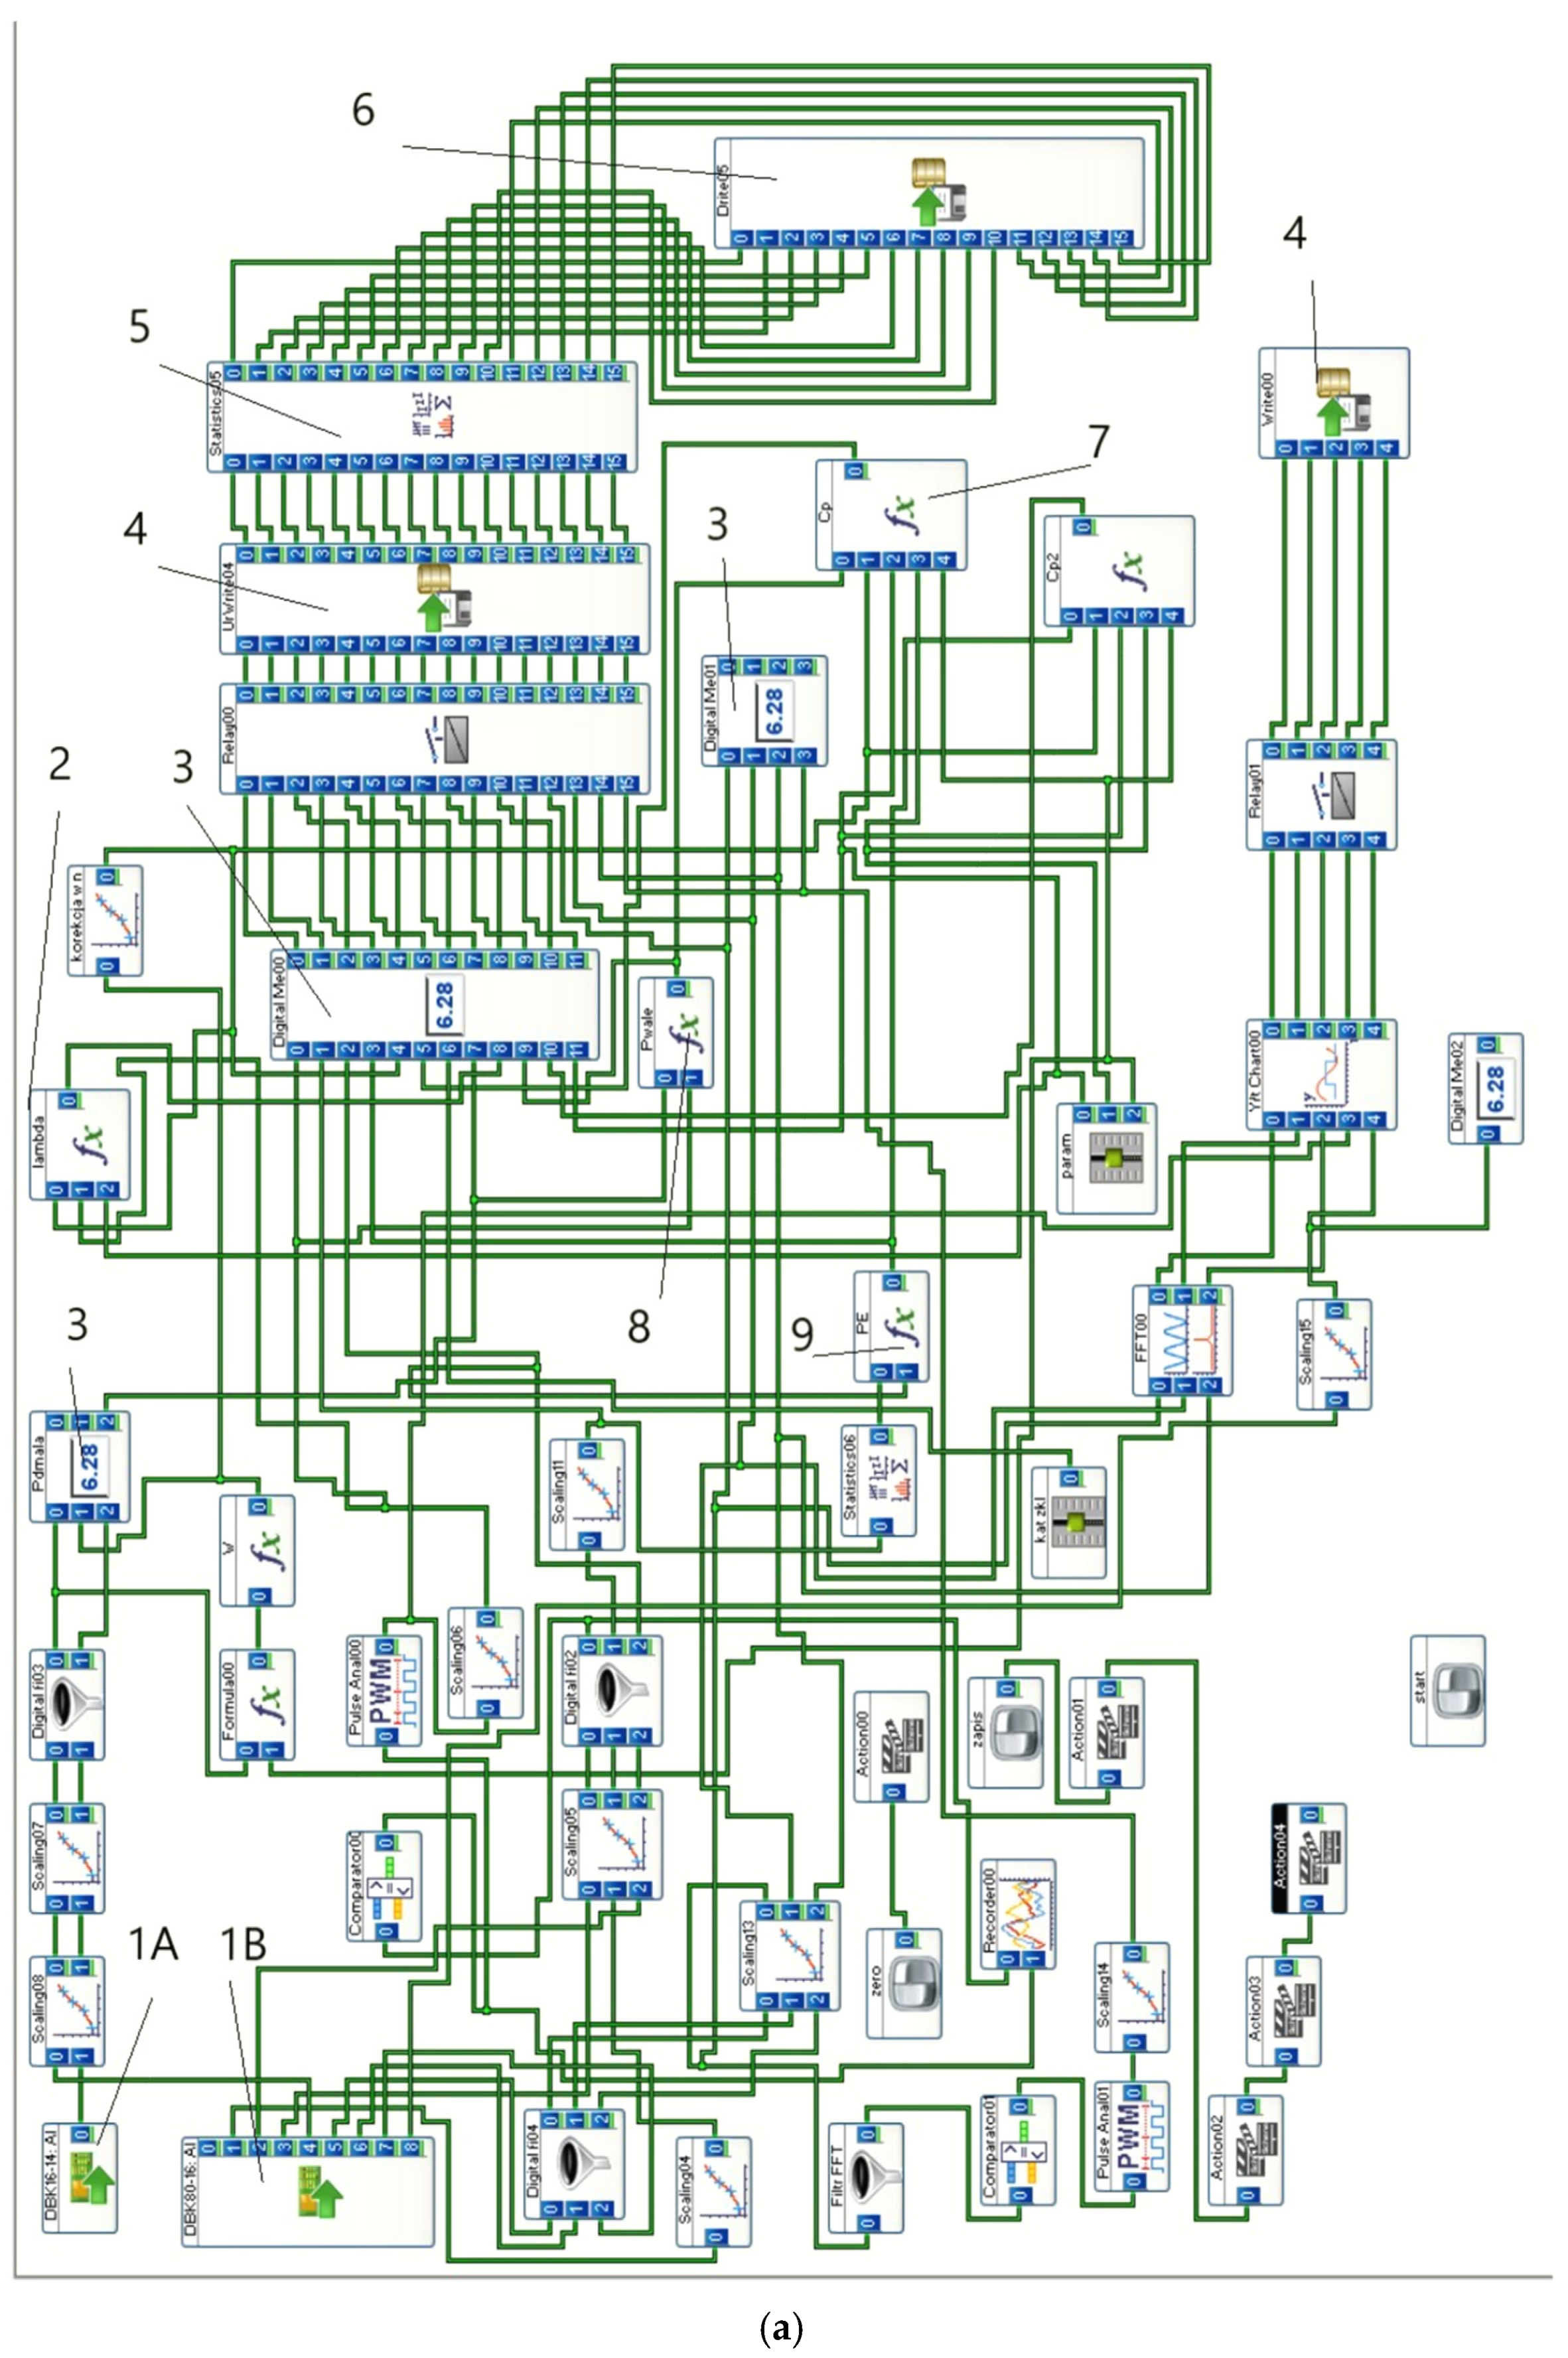
Figure 4e. The rotational speed was measured optically. All measured parameters, including inflow velocity, torque, rotational speed, and electrical parameters, were recorded at the station using the Daqbook 2001 measurement system and the DasyLab programming platform, as shown in
Figure 5a [
46]. Components of the DaqBook 2001 measurement system:
- −
DaqBook2001 central unit;
- −
DBK41-10-Slot Analog Expansion Module;
- −
DBK16 2 Channel String Gage Expansion Card;
- −
DBK80, 16-Ch. Differential Voltage Input Card with Excitation Output.
Figure 5.
Diagram of the control system and turbine loading. (a) Diagram of the control system of the measurement system for a vertical-axis wind turbine installed in the measurement section of the aerodynamic tunnel: 1A—DBK80 measurement card, 1B—DBK16 strain gauge measurement card, 2—tip speed ratio calculation module, 3—virtual device for parameter reading, 4—disk module for recording instantaneous parameters, 5—statistical module, 6—disk module for recording average parameters, 7—mathematical module for power coefficient calculations, 8—module for determining power at the shaft, 9—module for electrical power determination; (b) diagram of turbine loading, AC—three-phase generator, D1—three-phase rectifier, C2—filter, LM—Hall effect current sensors, R1—adjustable active load.
The utilized system is a modular system consisting of a central unit and expansion modules, including an analog input card and a strain gauge measurement card. The central unit ensures processing at a frequency of up to 200 kHz with 16-bit resolution. The DasyLab software allowed for the automation of the measurement process with simultaneous online parameter calculations. The aim of the study was to find the optimal prestall angle for a turbine designed to operate in conditions with relatively low average inflow velocities. The prepared program operated the measurement system by recording instantaneous values of the necessary quantities as well as averaged values. Simultaneously, in online mode, the program displayed measurement results as numerical values and graphical representations on the monitor during the course of the experiments. The system also provided information on signals from spectral analysis, the fast Fourier transform (FFT) of moment variability, and electrical signals from the generator. The program calculated power parameters based on the measured quantities. When conducting such experiments, it is important that individual readings and measurements at specific airflow velocities reach a steady-state condition. After a load change, the program waited for the controlling parameters, including the turbine rotational speed, to stabilize. This measurement methodology minimizes the contribution of cumulative mass forces.
The three-phase signal was rectified into a DC component, as shown in
Figure 5b, and loaded with variable active resistance. A strain gauge force sensor, as depicted in
Figure 4e, from which the power generated by the turbine section was calculated, measured the torque of the turbine. A reflective optical encoder measured the rotational speed. The inflow velocity was measured using pressure measurements and converted.
4. Results and Discussion
The experimental results for study of a novel modified symmetric NACA0015 airfoil profile are shown in
Figure 6,
Figure 7,
Figure 8,
Figure 9,
Figure 10,
Figure 11,
Figure 12,
Figure 13 and
Figure 14. Research was conducted to identify the minimum Re value below which the
Cl coefficient significantly decreases; to distinguish the variation of the angle of attack, the relative velocity, and variations of aerodynamic forces with the angular position of the blade; and to recognize the relationships between power coefficients and tip speed ratios for various air velocities and selected blade pitch angles.
4.1. Wind Tunnel Results
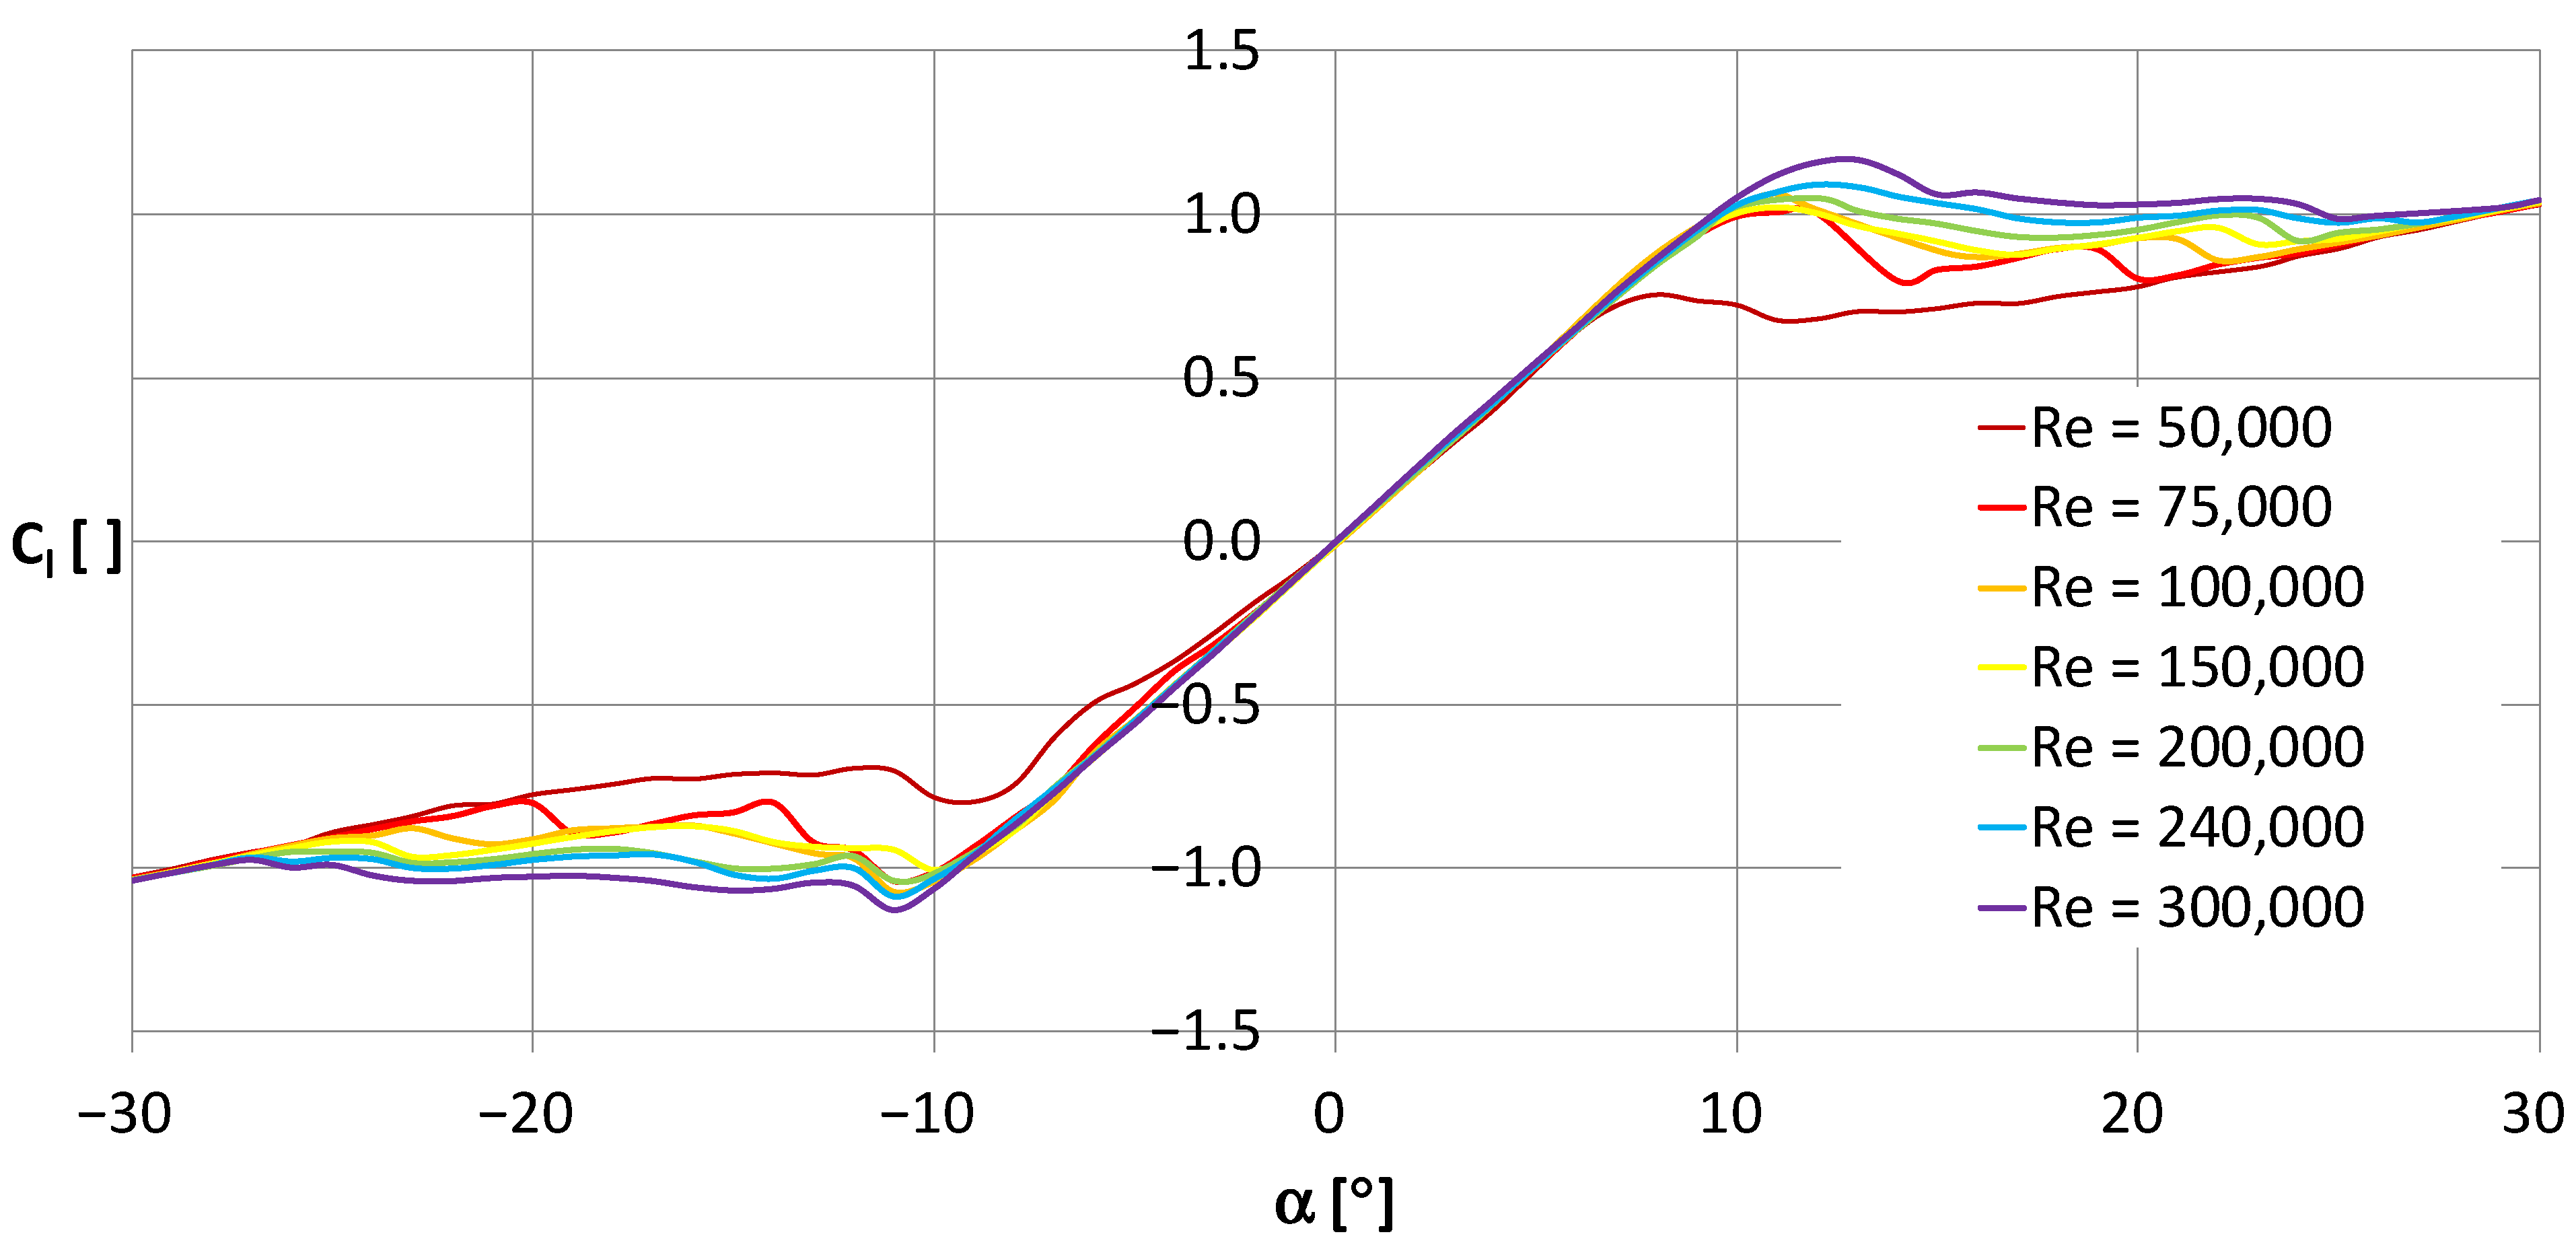
Wind is the result of converting potential energy, originating from the pressure disparity between two regions, into kinetic energy. The transformation to electrical energy process in vertical-axis turbines exhibits greater complexity compared to horizontal-axis turbines due to the rotational movement of the airfoil, inducing continuous variation in the angle of attack over a complete 360° revolution. Based on the operational principle of the turbine, which utilizes the principles of airfoil profiles, the generation of the lifting force and the subsequent torque is dependent on the airfoil angle of attack. The angle of attack of an airfoil represents the angle at which the airfoil intersects the oncoming airflow. It is necessary to determine the aerodynamic forces acting on the airfoil, such as lift and drag, and to adjust the angle of attack, the performance, and the characteristics of the airfoil, including lift, drag, and stall behavior. However, the challenge arises from the fact that this angle, defined as the angle between the chord line of the airfoil and the oncoming flow direction of the wind, considering both the wind velocity and the linear velocity of the airfoil, fluctuates around the circumference of rotation. The increase in an angle of attack increases lift up to a point. The characteristics of the innovative symmetric airfoil shows that, for the case analyzed, the maximum effective angle of attack was 14 degrees, as shown in
Figure 6. An angle of attack that is too high results in a loss of lift and causes a stall. The graph presents the characteristic curve of the investigated symmetric airfoil,
Cl = f(α), and represents the relationship between the lift coefficient and the angle of attack for various Reynolds numbers. The lift coefficient, empirically determined, depends on the angle of attack and the shape of the body.
The experimental results for a novel modified symmetric NACA0015 airfoil profile, with the experiments conducted at various angles of attack and Reynolds numbers to identify the minimum Re value below which the
Cl coefficient significantly decreases, are shown in
Figure 6. In the specific case of the investigated turbine, it had a maximum power operating point at a tip speed ratio of 2.2–2.5, obtained from wind tunnel testing. This parameter is determined at a specific wind speed for maximum power output at that particular operating point. For a horizontal-axis turbine, the analysis of angle of attack variability is more straightforward, as mentioned earlier when discussing the changes in the angle of attack. The power absorbed and extracted is balanced by the variable rotational speed, which affects the angle of attack. The effective angle of attack determines the value of the lift coefficient
Cl and, consequently, the driving force of the turbine. When the extracted power decreases, the rotational speed starts to increase, thereby reducing the angle of attack and decreasing the torque. This acts as a feedback mechanism to balance the two power sources. As expected, all this must occur within the range of operational variability relative to the polar characteristics of the profile (
Figure 6), without exceeding the critical angle.
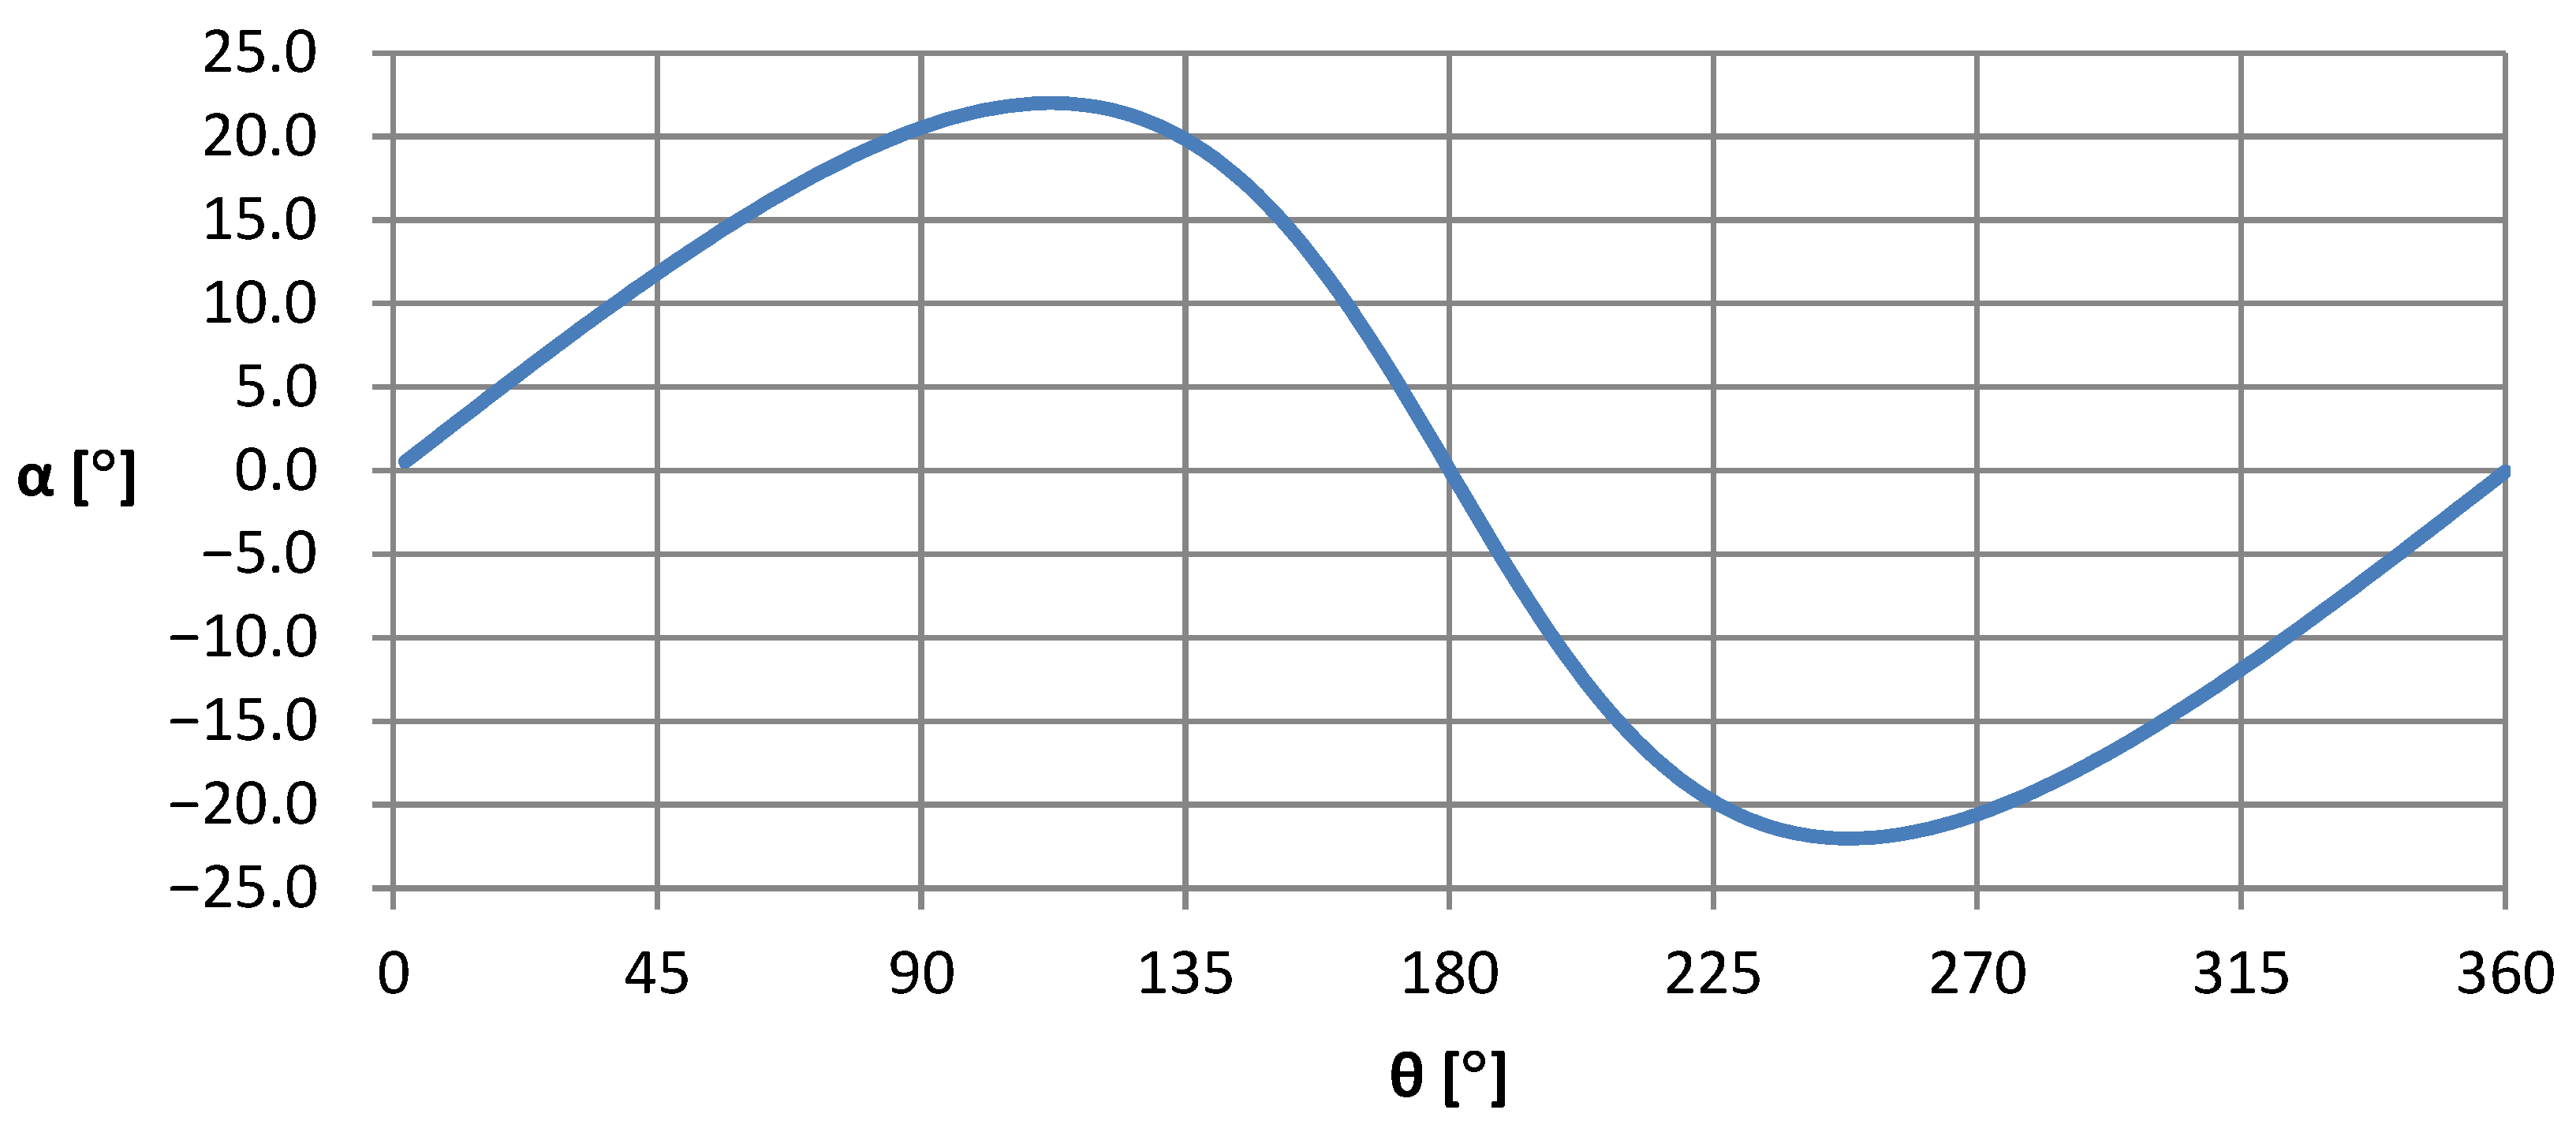
Figure 7 shows the variation of the angle of attack with the angular position of the blade for λ = 2.5 for the vertical-axis turbine being studied. The graph illustrates the computed fluctuation of the angle of attack along the all-angular position of the turbine blade. Unfortunately, the angle of attack is not directly measurable; it is virtual. Only the initial pitch angle is measurable. This angle was calculated based on geometric relationships (Equations (3) and (4)) and the determined tip speed ratio of the turbine in the aerodynamic tunnel under specific airflow conditions. The angle of attack increased, reaching its maximum value at a blade position approximately 115 degrees from the plane perpendicular to the inflow. Above that point, the angle started to decrease, reaching another maximum at approximately 240 degrees. From the characteristics of the angle of attack variation presented, it can be observed that the effective energy recovery occurred only in two positions around the entire angular position of the blade, unlike in the case of a horizontal-axis turbine, where it occurs throughout the entire angular position range of the blade in steady-state conditions. The variation of the angle of attack followed a parabolic pattern, increasing up to the critical angle and then decreasing as it transitioned to the 180-degree position on the opposite side of the blade’s plane.
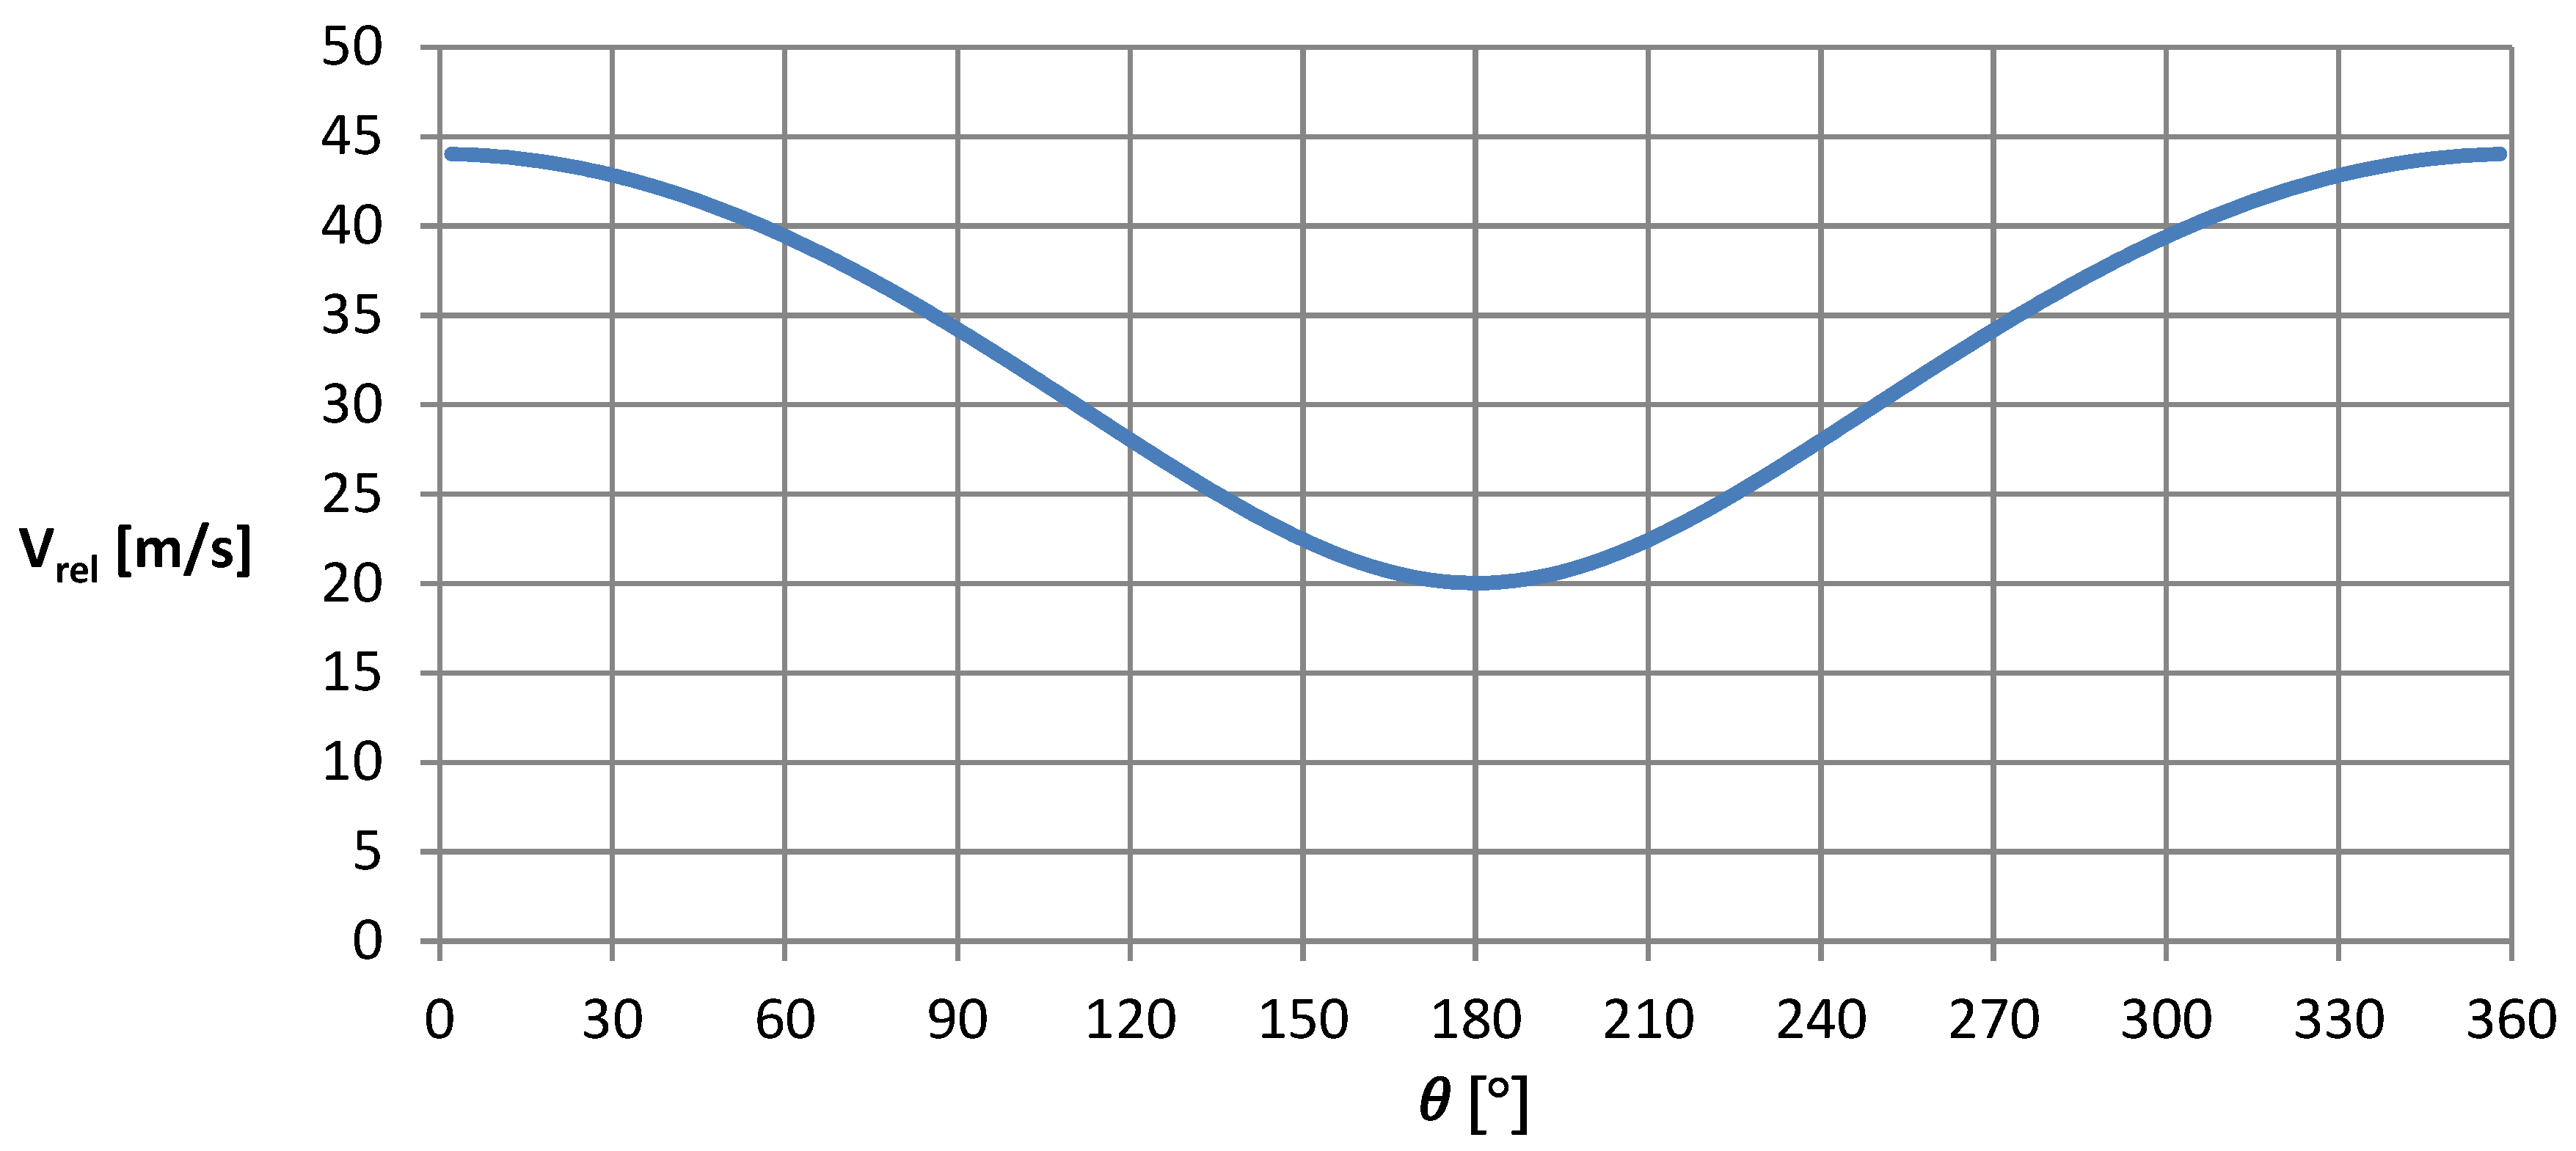
The defined angle of attack is the angle between the chord line and the direction of relative velocity. Swirling occurs in a plane parallel to the wind, so the effective velocity will vary due to the change in relative velocity, as shown in
Figure 8. The minimum occurs in the 180-degree position when the direction of linear velocity aligns with the direction of the wind. However, the maximum value occurs on the opposite side of a circle, at the arbitrary 0-degree position. In that case, the velocity vectors are opposing. Then the velocity variation represents the relationship between the velocity changes and the alignment of the wind velocity vector and the rotation of the turbine. For an airflow velocity of 12 m/s, the velocity value changes significantly while moving around the circumference from 17 to 42 m/s. This is the characteristic that distinguishes the vertical configuration from the horizontal one for wind turbines, where the tip speed coefficient remains constant under steady conditions.
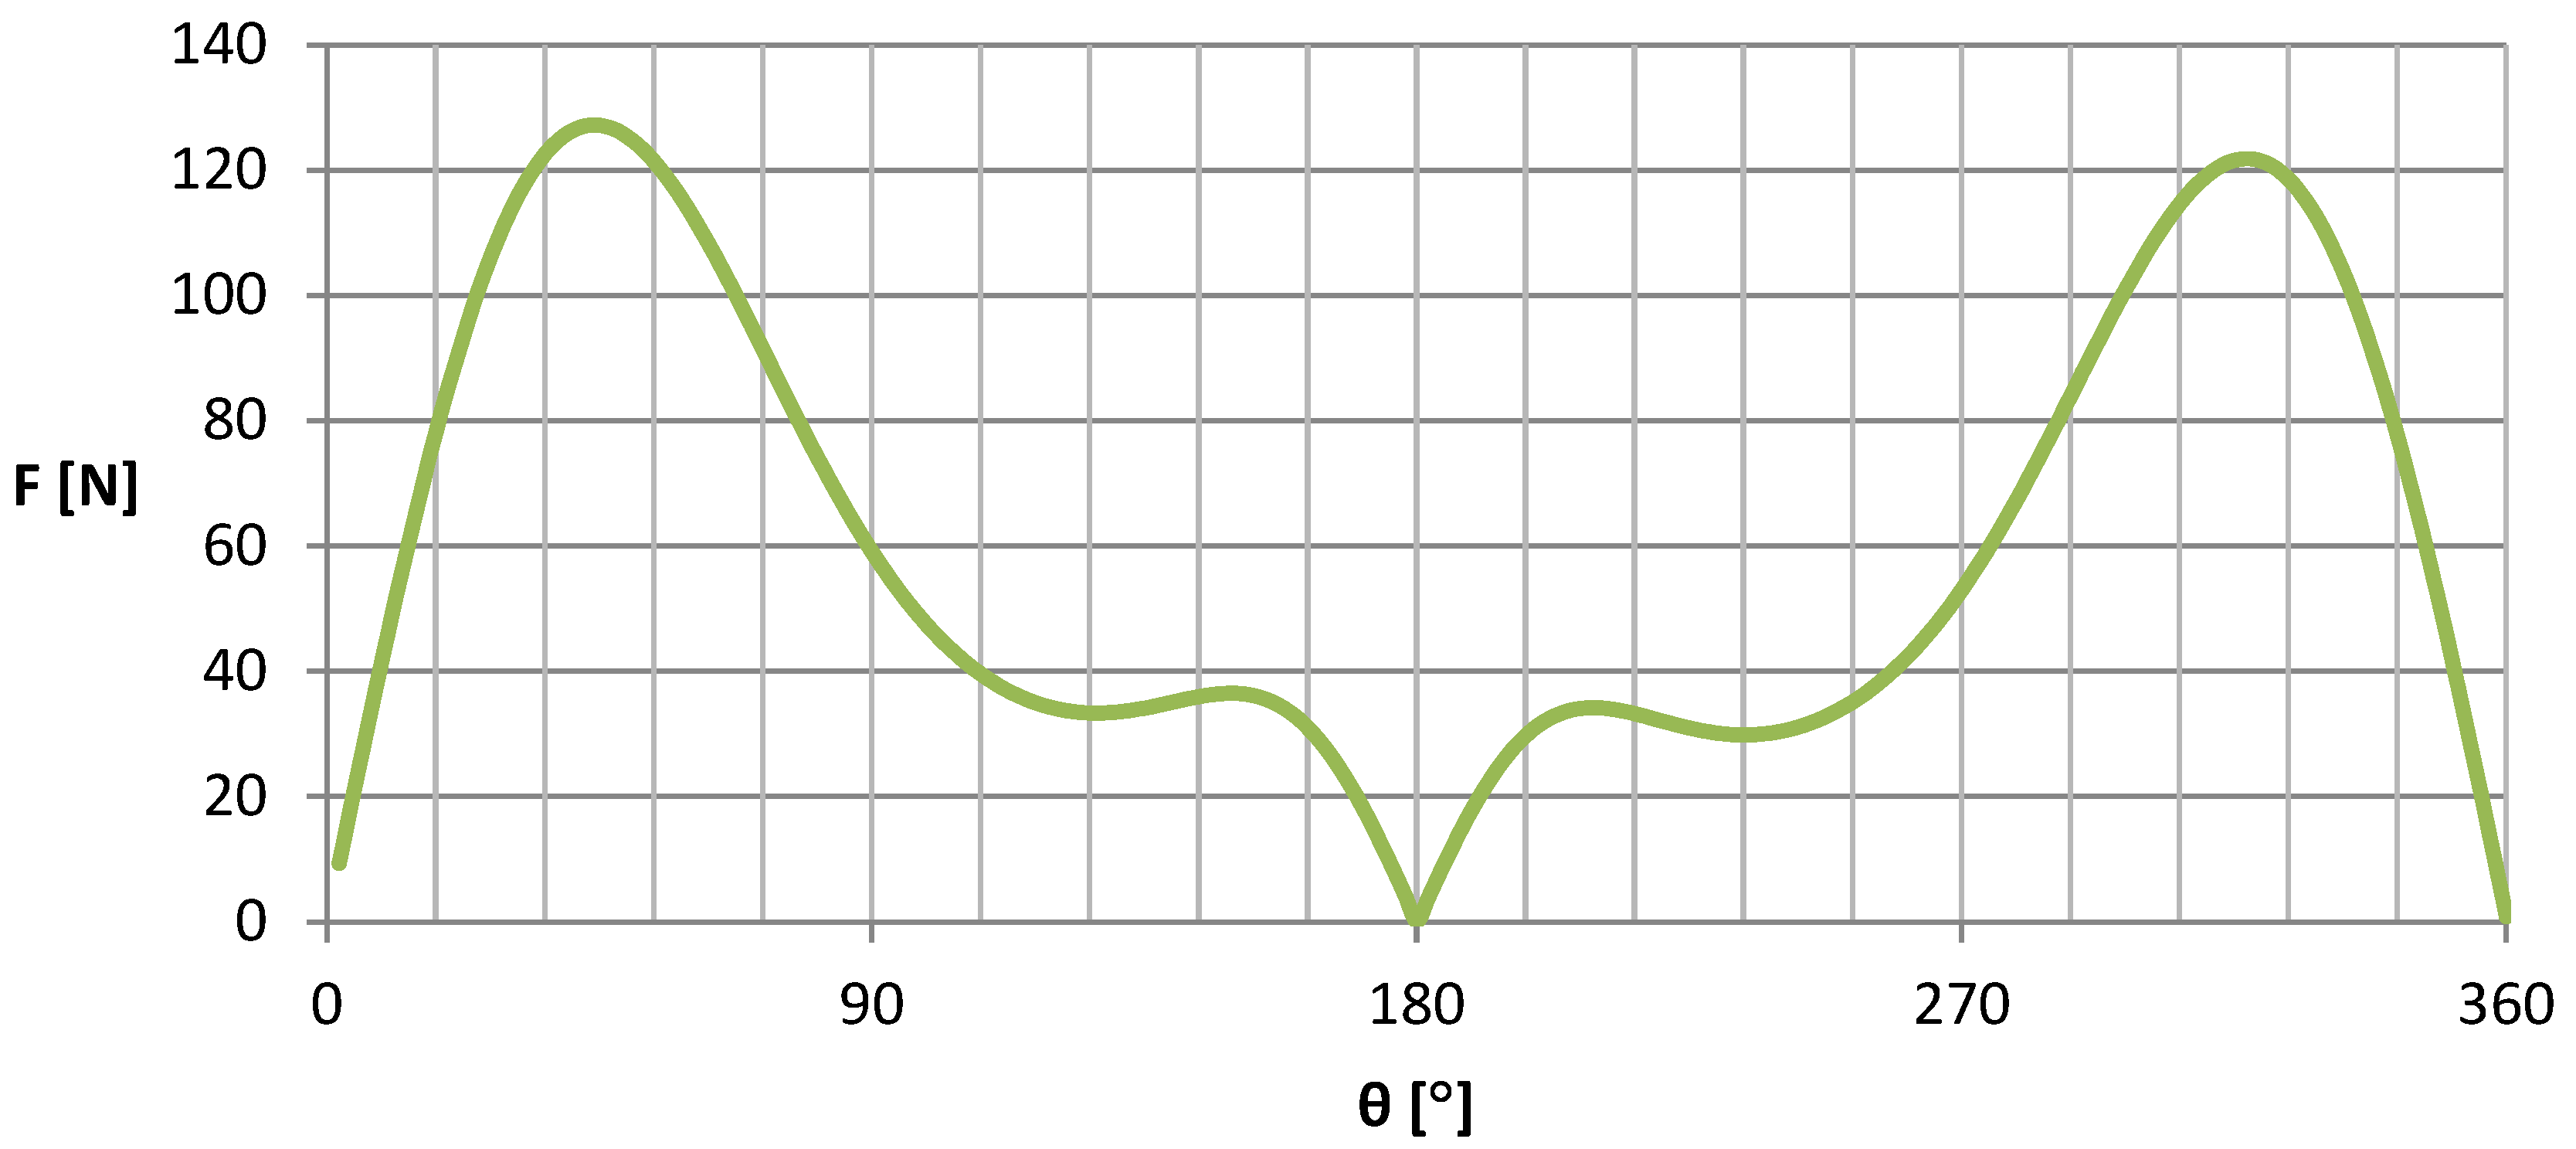
Similarly, based on current knowledge of the variation of the angle of attack as a function of the angular position, the aerodynamic forces acting on the airfoil were calculated, as shown in
Figure 9. The distinct nature of the changes in the magnitude of the aerodynamic force, which served as the driving force of the turbine, is clearly visible.
The shape of the lift force curve that generates the rotational moment (
Figure 9) for a single airfoil is variable with the position of the blade angle position Θ, in contrast to horizontal-axis wind turbines. In vertical-axis turbines, the fluid flow phenomena and aerodynamic dependencies are more intricate compared to horizontal turbines. The complexity arises from the fact that during the rotation of the turbine rotor, all the fundamental parameters that influence the magnitude of the rotational moment, including the Reynolds numbers, undergo cyclic changes. Consequently, the lift coefficient
Cl, responsible for the lift force, varies periodically. The relative velocity also varies with the position of the angle of the change in the blade and, thus, the angle of attack, as shown in
Figure 6.
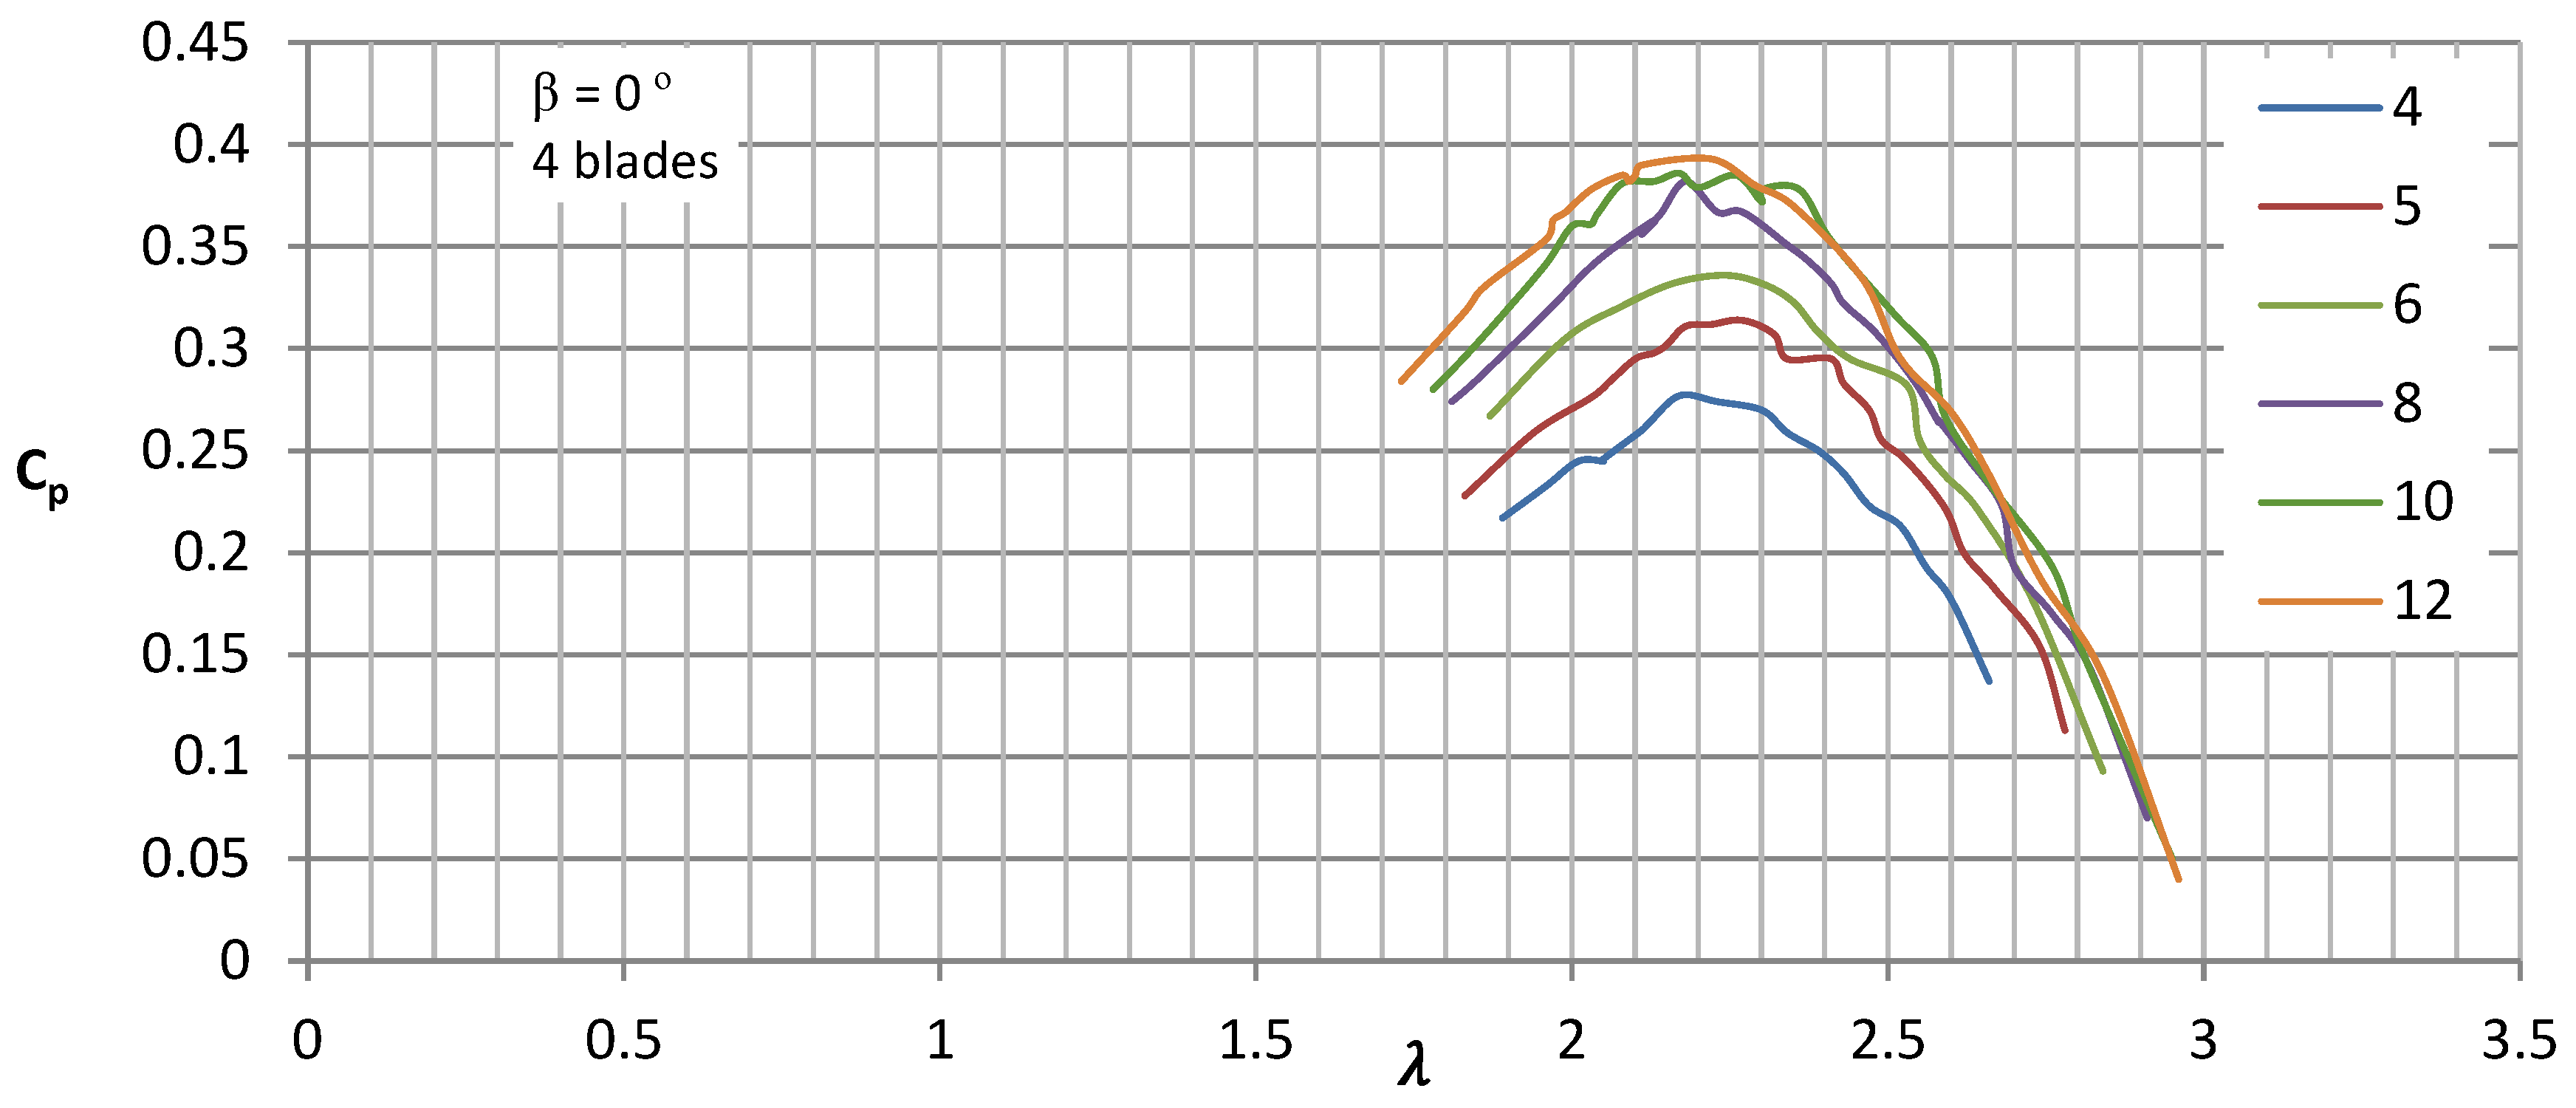
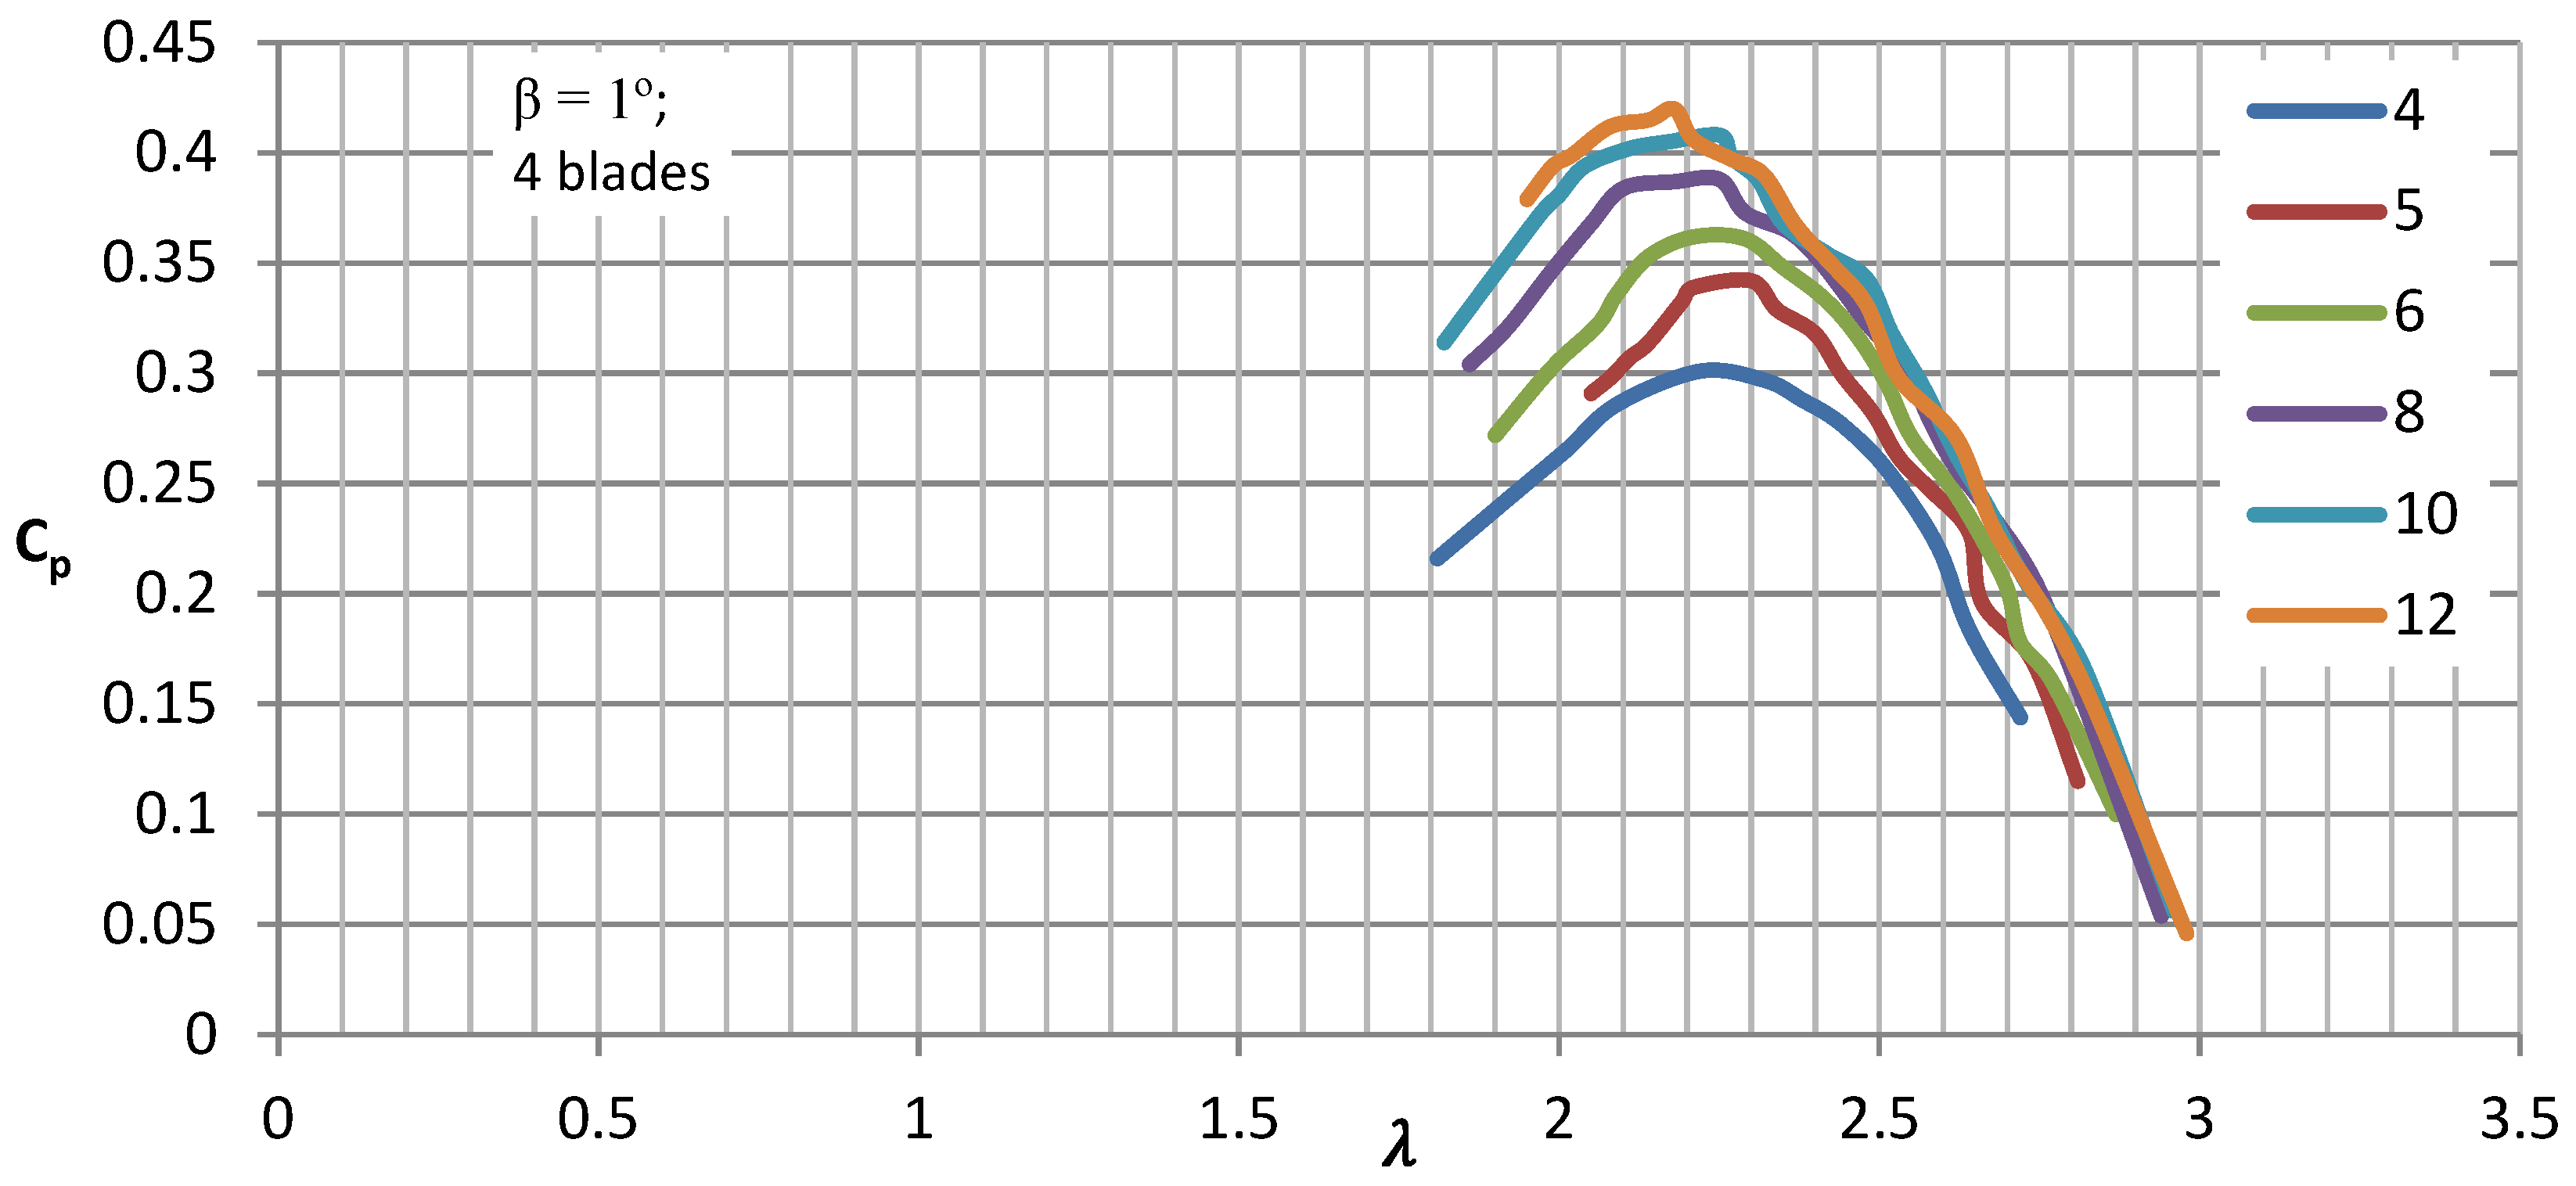
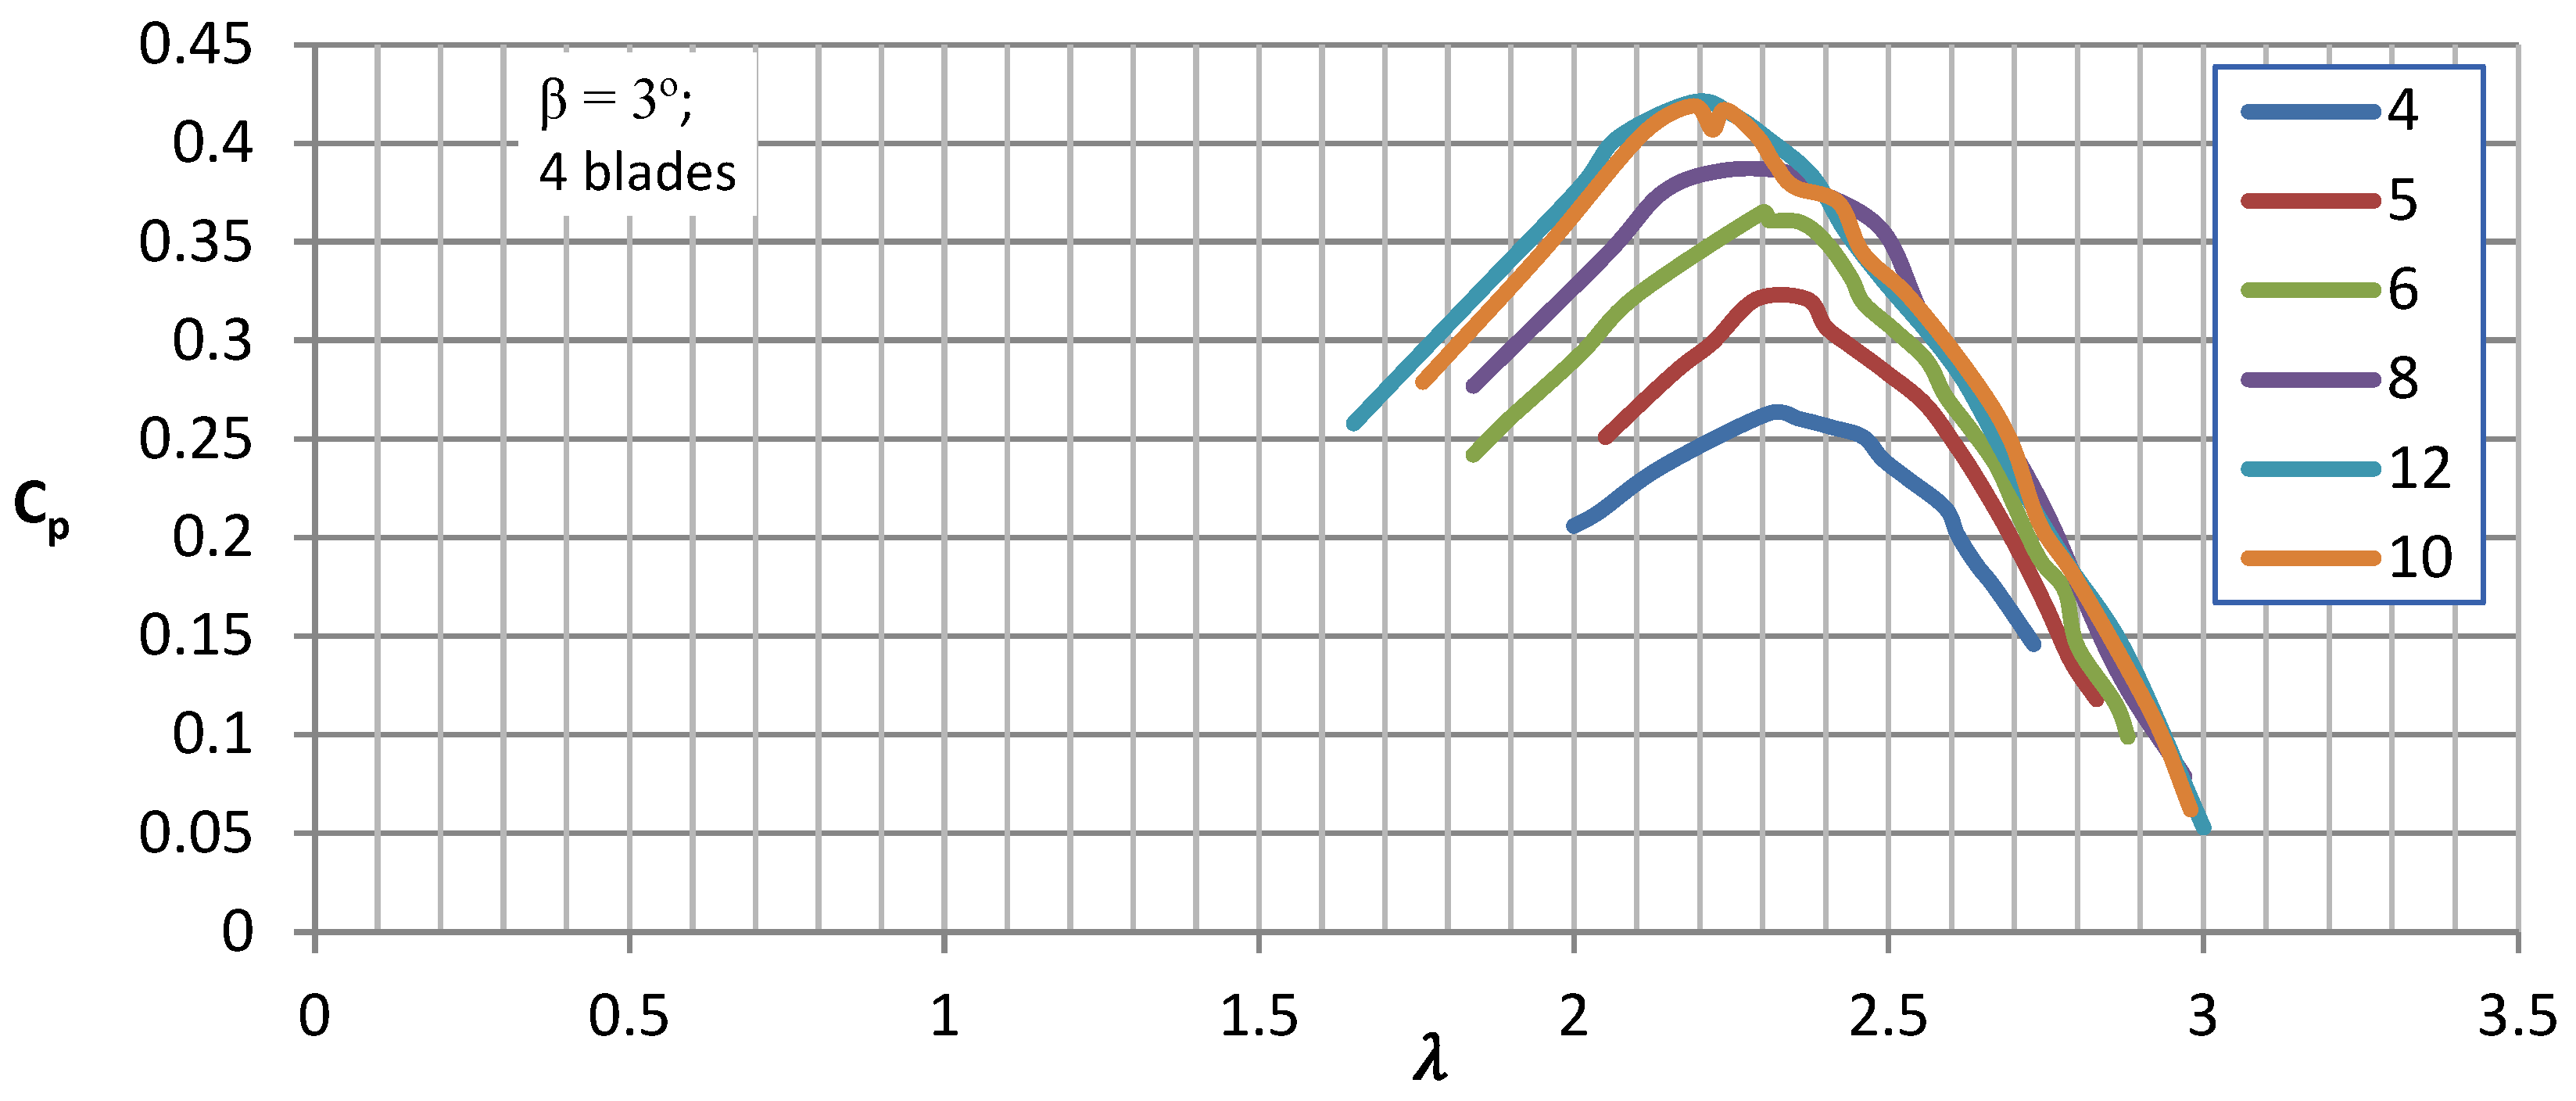
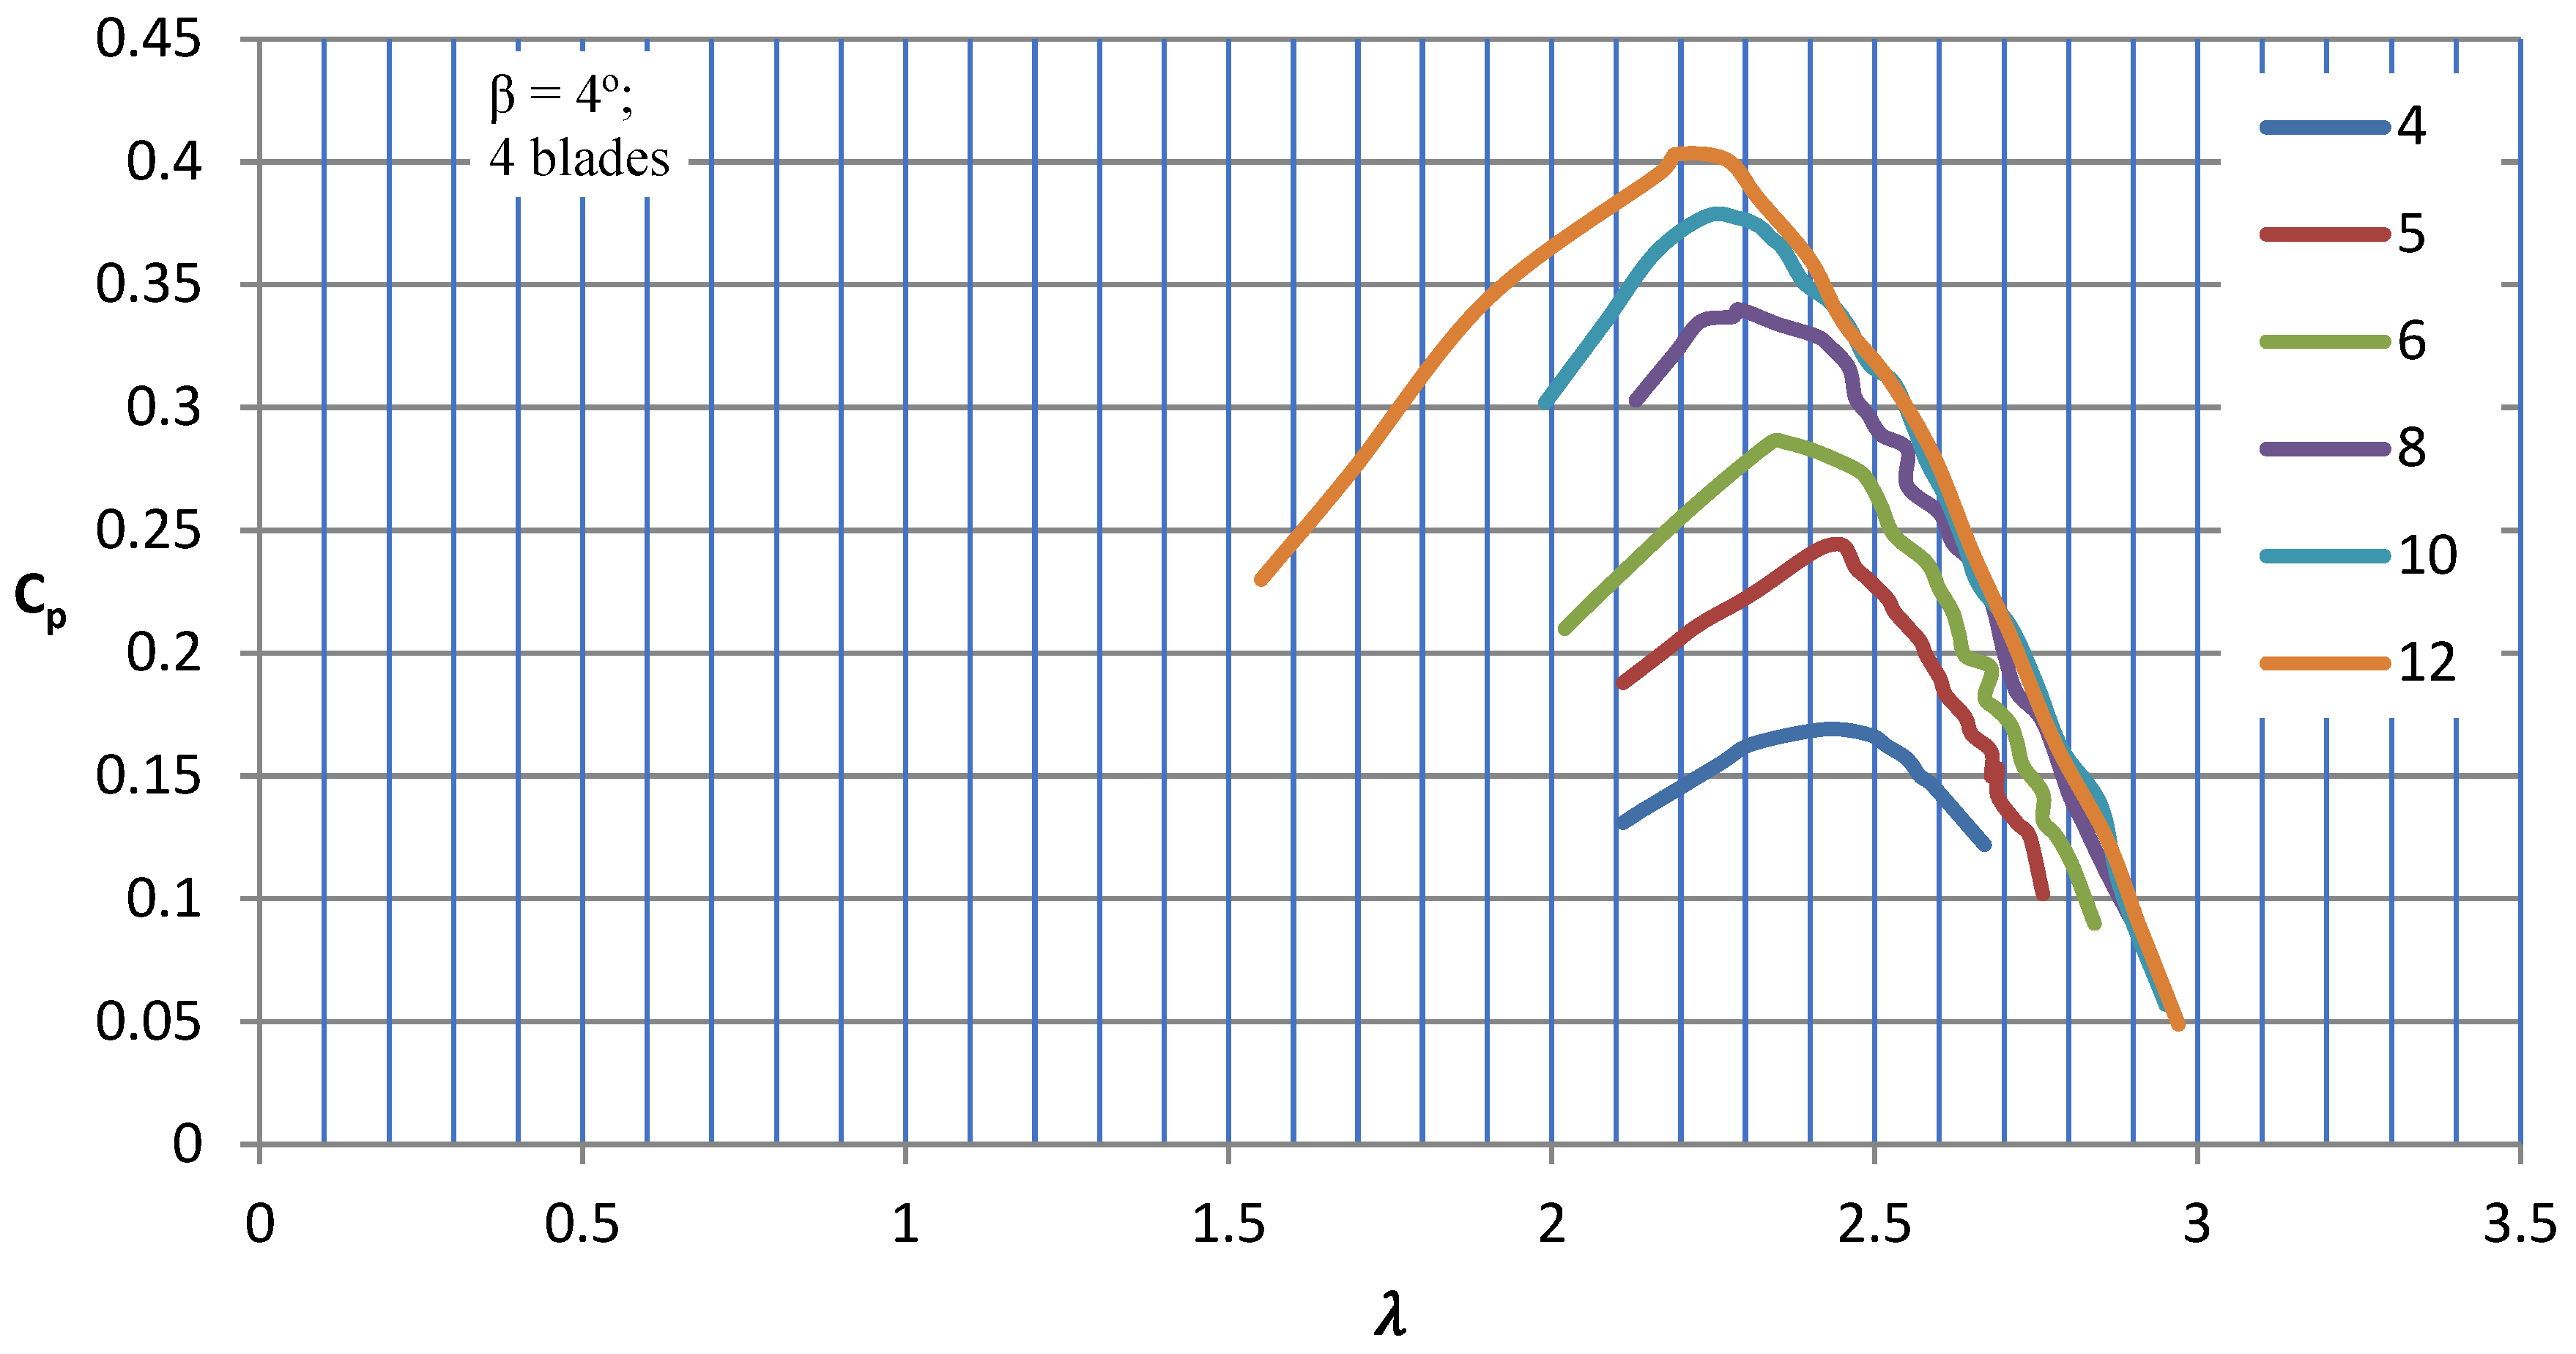
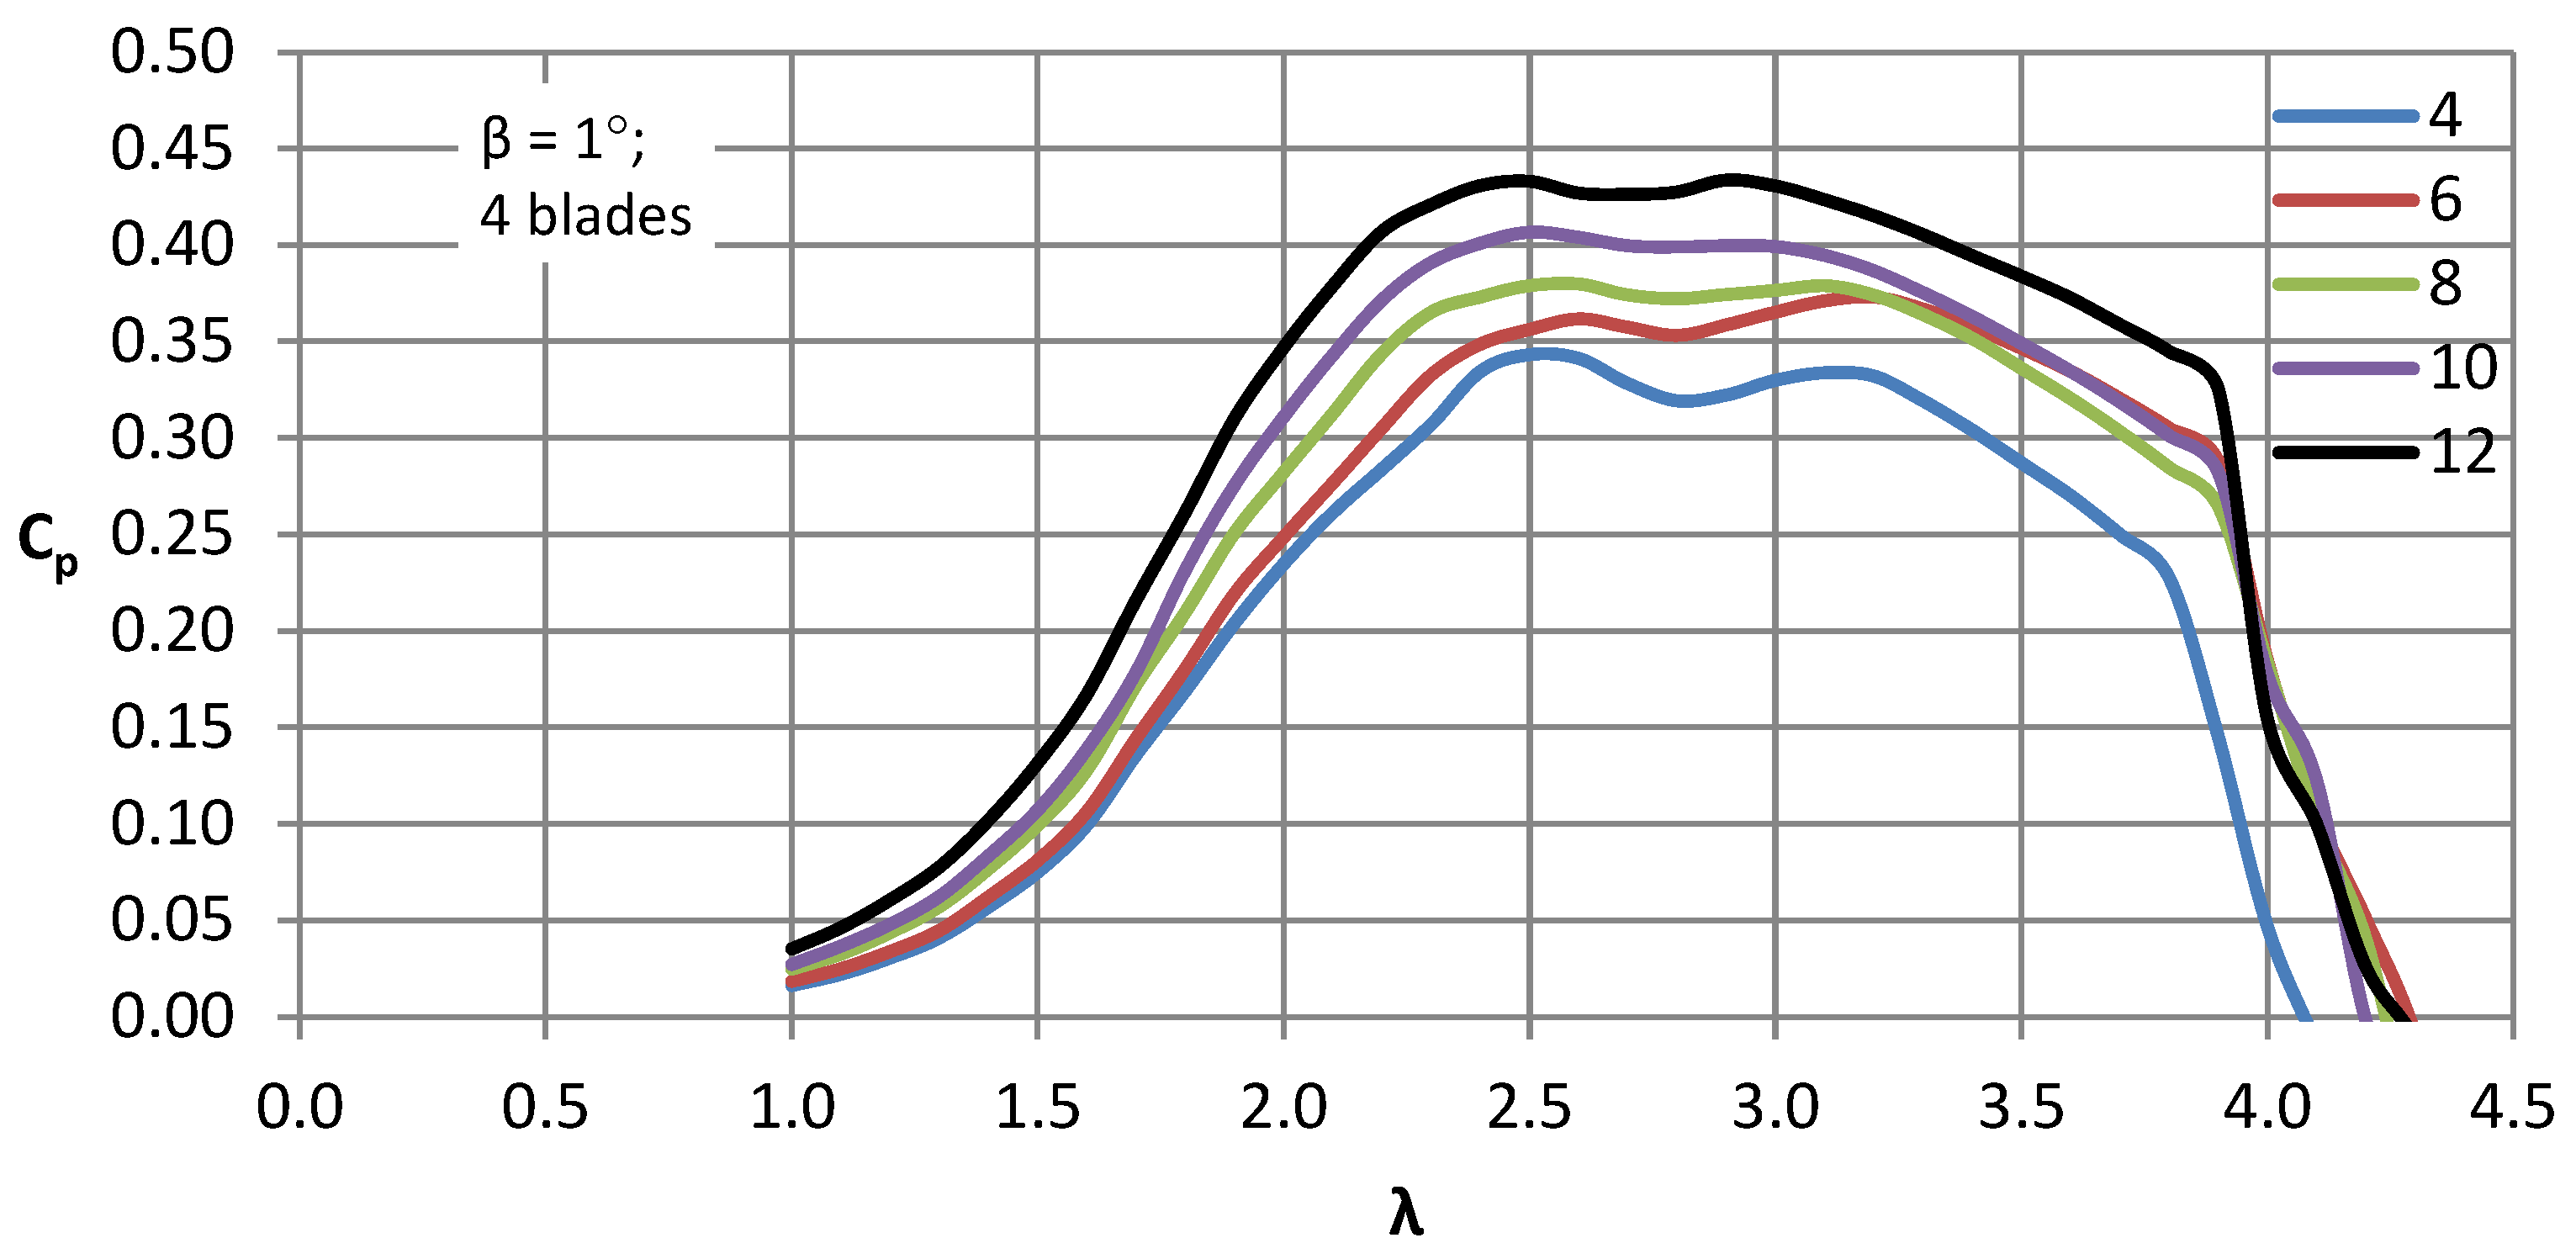
The measurement results showing the relationship between power coefficients and tip speed ratios for various air velocities and selected blade pitch angles of the wind turbine rotor blades are presented in graphs (
Figure 10,
Figure 11,
Figure 12,
Figure 13 and
Figure 14).
The sets of curves for a four-blade rotor demonstrate the influence of wind speeds ranging from 4 to 12 m/s and blade pitch angles ranging from 0 to 4 degrees on the energy conversion capabilities of the airflow. In
Figure 10,
Figure 11,
Figure 12,
Figure 13 and
Figure 14, sets of characteristic curves are presented showing the relationship between the power coefficient C
p and the tip speed ratio λ for different inflow velocities, Reynolds numbers ranging from 100,000 to 300,000, and discrete blade pitch angles of 0, 1, 2, 3, and 4 degrees. In subsequent graphs, it can be observed that as the blade pitch angle increased, the turbine efficiency increased, both at low and high velocities.
After exceeding a blade pitch angle of 3 degrees, a significant decrease in Cp could be observed, especially at low wind speeds. The lower measurement range of 4 m/s is not the starting speed, as it is significantly lower, but represents the effective production speed, which provided an appropriate range and allowed for turbine loading. For the profile studied installed on the turbine, the initial pitch angle ranged from 1 to 2 degrees, which particularly took into account the lower wind speed values. This suggests the need for highly precise model fabrication in terms of dimensional tolerances and operational stiffness, because even such a change led to significant variations in the energy utilization efficiency of the air stream.
4.2. Results of the Numerical Investigation
The experimental investigation was conducted on a vertically oriented H-type turbine with a three-phase multipole generator without a starting torque. The turbine was modeled using QBlade software, and calculations were performed under similar conditions as the experiment, covering Reynolds numbers ranging from 100,000 to 300,000. The configuration used for both experimental and numerical studies was a four-bladed turbine, which was determined to be optimal in the preceding research.
Figure 15 presents the results of the calculation of the power coefficient C
p as a function of the tip speed ratio λ for the optimal blade pitch angle, which was determined to be around 1–2 degrees based on the experimental data. The results show a significant convergence, particularly with respect to the values of the power coefficient at various wind speeds. The tip speed ratio λ also shows a close correspondence to the experimental data. However, it should be noted that the resulting characteristic curve appears slightly flatter in the upper range. This flattening may be attributed to the fact that the program does not account for all the physical parameters present in real-world conditions, such as the friction coefficient of the construction’s bearings. The results obtained from the calculations are more idealized due to the limitations of the calculation program.
Table 1 presents two research cases for two pitch angles, β = 1° and β = 4°, displaying the results of maximum C
p values and their corresponding λ values obtained from numerical calculations and experimental studies at various wind speeds. It is evident how crucial it is to find the correct initial pitch angle for the blades. In this case, a 3-degree change in pitch angle caused a significant variation in the power coefficient C
p. This effect was particularly prominent at low speeds, near the starting speed, where the C
p value was twice as small for a 1-degree pitch angle. Comparing the experimental and numerical simulation results shows a high degree of convergence. In preliminary studies, considering the profile geometry and other geometric parameters such as radius, chord length, and range of angle of attack variations, the power coefficient could be successfully applied. However, the ultimate verification could only be obtained through experimental testing.
A detailed analysis revealed that the characteristics of the results exhibit a more flattened shape in the upper region. This is likely attributed to the fact that the program used for the calculations did not account for all the relevant physical quantities that influence real-world conditions. There are various factors, including friction of bearings in the structure, that can affect the results and were not considered in the numerical model. The results obtained are more idealized and may differ from those obtained under real conditions.
4.3. Summary
After a thorough analysis of the above results, taking into account the energy conversion capabilities in terms of both the maximum power coefficient for high wind speeds and the lower range of production capabilities for low wind speeds, it has been determined that the most optimal range for the initial angle setting falls within the range of 1 to 2 degrees. Studies have shown that the initial angle has a significant impact on turbine efficiency at low speeds. This is particularly important for turbine operation in conditions where wind speeds are low, which is characteristic of low heights above ground level. Achieving the optimal initial angle within the range of 1 to 2 degrees is of significant importance for the energy conversion efficiency of the turbine under low wind speed conditions. By precisely adjusting the initial angle within this range, it is possible to achieve better turbine performance and more efficient energy production under low-speed conditions. This is particularly relevant for turbines operating at low heights above ground level, where wind speeds are limited, highlighting the crucial importance of the optimal initial angle. The results of the analysis indicate the need to consider the optimal range for the initial angle setting in the design of wind turbines intended for operation under low wind speed conditions. This allows for the attainment of maximum conversion efficiency.
The precise setting of the angle of attack is of great importance for the early exploitation of vertical-axis wind turbines under low wind speed conditions. It allows a wider range of turbine loading and increased energy production. It should be emphasized that these settings are not universal and depend primarily on the blade profile and other significant parameters such as the number of active blades, the aspect ratio, the profile elongation, and the tip speed ratio. All these parameters are strongly interconnected and therefore require accurate and individualized practical investigations. Precise adjustment of the angle of attack enables optimization of wind turbine performance, especially in conditions of low wind speed. By adapting this parameter to specific conditions, optimal utilization of the energy of the air stream can be achieved, resulting in increased electricity production. In practice, every wind turbine design requires analysis and research on the optimal angle of attack in the context of specific operating conditions. It is also important to understand that the angle of attack is not the only decisive factor in turbine efficiency. Other parameters, such as blade shape, number of blades, geometric relationships, and other design characteristics also have a significant impact on turbine performance and operation. Therefore, comprehensive studies that consider these dependencies and interactions are necessary to achieve optimal results. The precise adjustment of the angle of attack of wind turbines is crucial for their efficiency and performance under conditions of low wind speed. Individualized research, taking into account specific parameters and operating conditions, is essential to achieve the optimal shape and setting of the turbine. This can lead to increased electricity production and contribute to more efficient utilization of wind energy.
During the analysis of the results, a significant difference in the value of the power coefficient can be observed with just a 1-degree change in angle. The measurement results indicate the need to maintain high precision during construction. In addition, they highlight the significant requirements for the rigidity of the structure, which is crucial when changing the load. Analysis of the measurement results clearly points out an area that requires attention from designers and manufacturers, particularly in the case of large units. In such cases, it is necessary to achieve blade profile torsion that does not exceed 1 degree under increased load. The accuracy of construction directly influences its efficiency and performance. Even small changes in the angle of attack can lead to significant differences in the power coefficient values, which consequently affect the amount of generated energy. To achieve optimal results, it is essential to maintain high precision during the wind turbine construction and installation process. Furthermore, the rigidity of the structure arises from the need to minimize torsion of the blade profile under varying loads. Such a torsion can cause improper airflow interactions, negatively affecting the efficiency of the turbine. In the case of large units where the load is higher, limiting blade profile torsion to values not exceeding 1 degree becomes particularly crucial. Therefore, designers and manufacturers must ensure the appropriate rigidity of the structure and minimal torsion of the blade profile to achieve optimal parameters and ensure high turbine performance.
It is important to note that there is a significant approximation between the results obtained from numerical modeling and experimental testing under real conditions. However, despite the slight discrepancies, this tool can be extremely useful in the preliminary design stage of turbine structures. Numerical investigations allow for quick and efficient prediction of turbine behavior in various conditions, allowing shape and parameter optimization before engaging in time-consuming experimental tests. This numerical tool allows testing different scenarios, evaluating the influence of various factors on turbine performance, and adjusting the design to achieve better results. Despite certain simplifications and imperfections in numerical modeling, such investigations provide valuable support for the wind turbine design process, facilitating the development of more efficient solutions.
It is also important to note that the pulsating nature of the forces in the vertical axis system is a disadvantage of the turbine. However, vertical-axis wind turbines also have many advantages. First, they are characterized by simplicity of design and ease of scaling through height or elongation changes. This is significant, as it allows for the adaptation of the turbines to different conditions and requirements. Another key advantage is their omnidirectionality. This means that VAWTs can effectively harness the wind from any direction, regardless of its variability. This provides greater flexibility in choosing locations and allows the utilization of sites with varying wind conditions. Due to these characteristics, vertical-axis wind turbines deserve attention, and conducting research in this area makes sense. There is potential for further refinement of these solutions to maximize their benefits and improve their efficiency. Innovations and modifications in the field of electronics, automation, and numerical modeling can lead to even more accurate predictions and precise results for wind turbine design.
5. Conclusions
In this study, we examined the impact of blade pitch angle on the characteristics of a vertical-axis wind turbine using experimental and numerical simulation data. For the analyzed blades and pitch angle of 1 degree and wind speeds of 4 and 12 m/s, the maximum power coefficients obtained from the experiments were 0.3 and 0.42, respectively, whereas the numerical simulations yielded values of 0.35 and 0.45. For a pitch angle of 4 degrees and the same wind speeds, the experiments produced maximum power coefficients of 0.14 and 0.39, whereas the numerical simulations resulted in values of 0.18 and 0.29.
The optimal range for the initial angle setting lies between 1 and 2 degrees over a range of Reynolds numbers from 50,000 to 300,000. Precise adjustment of the pitch angle is crucial for more efficient operation of vertical-axis wind turbines under low-wind conditions. This allows a wider range of turbine load and greater energy production.
The measurement results indicate the need to maintain high precision during the construction process. There are significant requirements for the stiffness of the structure, which plays a vital role in handling the varying loads of airflow. It is important to ensure the appropriate stiffness of the structure to guarantee stability and performance under various operating conditions.
The pulsating nature of the forces acting on the turbine is a drawback; however, the simplicity of the design and the ease of scalability are positive aspects. These features enable wind turbines to be easily adjusted to different conditions and requirements.
The precise adjustment of the pitch angle is crucial for the effective operation of vertical-axis wind turbines. This requires maintaining high precision in construction and ensuring the required stiffness. Despite pulsating forces, these turbines offer advantages such as simplicity of design and scalability, allowing for adaptation to various conditions and demands.
The study findings demonstrate the effective utilization of the blade’s aerodynamic properties, potentially leading to an improved power coefficient. However, achieving such improvement requires precise blade setting with a tolerance of less than 1 degree. It is anticipated that the accurate implementation of wind turbines will have a substantial impact on energy production efficiency. The research outcomes have been incorporated into the production of operational wind turbines.
The analysis of the blade pitch angle’s impact on vertical-axis wind turbines has been conducted to date, but the findings have not been defined with high precision for various turbine configurations. Consequently, there exists a wide range of VAWT designs with different blade profiles. To converge different design strategies towards an optimal solution, further systematic research is necessary. The results obtained from the 1:1 scale testing provided valuable insights and data that support the further development and optimization of the solution.
