Article

Building a Sustainable Future: How Eco-Friendly Homes Are Driving Local Economic Development in Lisbon Metropolitan Area

by
Matheus Koengkan
1,*,
José Alberto Fuinhas
2,
Fernanda Paula Oliveira
3,
Uğur Ursavaş
4 and
Natália Moreno
5
1
University of Coimbra Institute for Legal Research (UCILeR), University of Coimbra, 3000-018 Coimbra, Portugal
2
Faculty of Economics, and Centre for Business and Economics Research (CeBER), University of Coimbra, 3004-531 Coimbra, Portugal
3
Faculty of Law, University of Coimbra Institute for Legal Research (UCILeR), University of Coimbra, Pátio da Universidade, 3004-528 Coimbra, Portugal
4
Department of Economics, Faculty of Economics and Administrative Sciences, Zonguldak Bülent Ecevit University, İncivez, 67100 Zonguldak, Turkey
5
Faculty of Law, University of Coimbra, Pátio da Universidade, 3004-528 Coimbra, Portugal
*
Author to whom correspondence should be addressed.
Energies 2023, 16(13), 4855; https://doi.org/10.3390/en16134855
Submission received: 15 May 2023 / Revised: 15 June 2023 / Accepted: 20 June 2023 / Published: 21 June 2023

Abstract

:
This article explored the impact of eco-friendly houses on economic development in the Lisbon metropolitan area. The study analyzed data from 18 municipalities between 2014 and 2020 using regression analysis with ordinary least squares (OLS) and fixed effects. The results indicate that national policies promoting residential energy efficiency positively impact economic development. Policies like subsidies, loans, and tax relief encourage homeowners to invest in energy-efficient technologies, boosting household disposable income and contributing to economic growth. The study found that an increase in the number of new constructions positively impacts economic development, leading to job creation and increased demand for construction materials and services. Additionally, growing eco-friendly houses can reduce energy consumption, lowering energy costs for homeowners and businesses and ultimately stimulating economic growth. In contrast, increasing the number of non-eco-friendly houses can have negative economic impacts. A robustness check using the method of moments quantile regression (MM-QR) confirmed the results from OLS with fixed effects, providing additional evidence supporting the robustness of the results.

1. Introduction

Buildings account for a significant share of urban energy consumption and greenhouse gas (GHG) emissions. In 2021, the building sector accounted for 30% of global final energy consumption and 27% of total energy sector emissions [1]. Buildings are also threatened by anticipated climate effects such as urban heat island effects, flooding, and other extreme weather events [2]. Therefore, in recent years, sustainable buildings have become vital to ensure environmental sustainability. Buildings play an essential role in sustainable development, and energy-efficient or green buildings are a key component of sustainable cities and low-carbon economic growth (e.g., [3,4,5,6]).
In the European Union (EU), buildings also account for a significant share of consumption. 40% of energy consumption and 36% of GHG emissions are produced by buildings, mainly resulting from usage, construction, renovation, and demolition. In the EU, the building stock is old and changes relatively slowly. More than 220 million building units, or 85% of the building stock in the EU, were constructed before 2001. As expected, most of the buildings in Europe are not energy efficient, mostly using fossil fuels for heating and cooling and old technologies and inefficient equipment [7]. Thus, the EU developed a legal framework to enhance the energy efficiency of buildings to achieve decarbonized buildings by 2050. The achievement of the EU’s climate goals implies that the building sector must reduce GHG emissions by 60% by 2030 and fully decarbonize by 2050. However, 85–95% of the existing structures are expected to still stand by 2050 [8].
Many factors, including energy policies, geography, income level, structural features, and energy infrastructure, affect energy consumption in buildings. Therefore, the residential building sector in the EU is far from homogeneous, as it varies significantly across and within member states (e.g., [9,10,11]). For instance, in the EU region, Southern European countries have lower residential sector energy consumption [12]. Portugal deserves deeper consideration among Southern European countries because of its unique characteristics (e.g., [13,14]). First, the residential sector’s final energy consumption for heating and cooling varies significantly across European countries. However, buildings in Southern European countries, including Portugal, are less resilient to climate change than in Northern European countries [15]. Second, the Portuguese building stock is old. Around 15% of Portuguese structures were constructed before 1945, and over 70% before 1990 [16]. Third, the building stock in Portugal needs renovation. About 34% of buildings in Portugal require structural and energy-related renovations, while over 50% require significant renovations to satisfy current comfort and safety requirements [17]. Finally, accounting for 17% of Portugal’s total energy consumption, the building sector is the third most energy-intensive sector [18]. Due to these reasons, focusing on energy efficiency in the Portuguese housing sector is essential for the region’s environmental quality and residents’ quality of life. It can guide other countries with similar characteristics.
Increasing the energy efficiency of houses and building houses with high energy efficiency, namely eco-friendly houses, comes with significant environmental, health, social, and economic benefits (e.g., [2,8]). Among these, the first benefit is environmental. Building energy-efficient houses can reduce GHG emissions and air pollutants, improve air and waste quality, and slow climate change. Second, energy-efficient eco-friendly houses have positive effects on health. In addition to CO2 emissions, burning fossil fuels and biomass for heating emits various air pollutants that harm human health. There is a direct relationship between energy poverty, housing conditions and health conditions, such as physical and mental problems, mortality risk, etc. [19]. Third, the social benefits of green buildings mostly refer to the contributions that improve the living standards of occupants. Green buildings can improve the overall quality of life and efficiency of occupants [20]. Therefore, one can say that housing and environmental conditions are important factors for individual human well-being. According to van Praag et al. [21], individual satisfaction or subjective well-being with different domains may be linked to satisfaction with life as a whole. In other words, satisfaction with life as a whole can be considered an aggregate concept, which can be unfolded into its domain components. Satisfaction with life as a whole depends on several factors, such as job satisfaction, financial satisfaction, and health satisfaction. One of these factors is satisfaction with housing and the environment (e.g., [22,23]). Besides, housing conditions are also closely linked to the happiness of cities and individuals. One of the factors that create happiness in cities is housing characteristics and quality.
Housing conditions are an essential factor in determining the ranking of happy cities. Many indexes (i.e., the Global Liveability Index, the Urban Environment Quality Index, Mercer Quality of Living Index) measuring the factors related to the happiness or quality of living level of cities consider housing conditions. For example, the Mercer Quality of Living Index (is based on several criteria, including housing, natural environment, and recreation [24]. Thus, one can say that housing and living conditions are essential factors affecting happiness or quality of living standards and ranking of happy cities. Fourth, the rise in eco-friendly housing has significant economic implications for a country or region (e.g., [25,26]). Building energy-efficient houses may affect local economic growth and development through several channels. First, green buildings will require significant investments in new clean, and energy-efficient technologies, which will increase productivity growth (i.e., economic growth). Second, households will likely spend less of their disposable income on energy. Due to more energy-efficient homes and technology, households will pay cheaper energy bills and can allocate funds to other goods and services. Third, a country will spend less on energy imports by decreasing demand and dependence on fossil fuels. Therefore, the country can reallocate more resources toward other investments. Fourth, green building design and construction offer significant job creation potential. Renovations of buildings are mostly labour-intensive and generate employment and investments frequently rooted in local supply chains (e.g., [2,8]).
In the literature, some authors (e.g., [7,27,28,29,30,31,32,33,34]) have investigated the impact of eco-friendly or green buildings on economic growth and development in different countries. Some studies (e.g., [35,36,37,38]) have empirically shown a positive relationship between green buildings and energy efficiency. In addition, a few recent studies (e.g., [11,12,14,15]) have focused on Portugal and examined the relationship between energy-efficient or eco-friendly houses and other factors, such as financial and fiscal incentive policies and energy efficiency regulations. Despite these studies focusing on Portugal, no study has investigated the effect of green buildings on local economic development in Portugal. As mentioned earlier, an increase in eco-friendly homes comes with environmental benefits, but it also has significant economic implications and may be important for the local development of regions.
This investigation elaborates on the following research question: How do eco-friendly or greenhouses/buildings impact economic development in the Lisbon Metropolitan area?
Two hypotheses have been formulated to indicate the potential impacts of eco-friendly or greenhouses/buildings on economic development in the Lisbon Metropolitan area:
Hypothesis 1.
Eco-friendly or greenhouses/buildings positively impact economic development in the Lisbon Metropolitan area. This hypothesis suggests that buildings constructed with eco-friendly materials and technologies may contribute positively to the economic development of the Lisbon Metropolitan area. This could be due to various reasons, such as increased energy efficiency, reduced maintenance costs, and improved air quality, which could ultimately lead to lower operating costs for businesses and stimulate economic growth in the region.
Hypothesis 2.
Eco-friendly or greenhouses/buildings do not significantly impact economic development in the Lisbon Metropolitan area. This hypothesis proposes that eco-friendly or green buildings may not significantly impact economic development in the Lisbon Metropolitan area. While these buildings may offer environmental benefits, their economic impact may be limited due to higher upfront costs and potentially longer payback periods. Furthermore, other factors such as market demand, location, and availability of financing could be more important drivers of economic development in the region.
The investigation will analyze the impact of eco-friendly houses on economic growth in 18 municipalities of the Lisbon metropolitan area from 2014 to 2020 to confirm one of these hypotheses. The study will use regression analysis with ordinary least squares (OLS) and the Method of Moments Quantile Regression (MM-QR) with fixed effects. Furthermore, the analysis will consider other factors that could potentially affect local development, including national policies for residential energy efficiency and the number of new family housing constructions and reconstructions. By doing so, the investigation aims to provide a broader perspective and a more comprehensive understanding of the relationship between local economic development and eco-friendly homes.
The literature on energy-efficient buildings and economic development is relatively scarce and innovative. Very few studies have investigated the impact of eco-friendly homes on local economic development. Thus, this paper contributes to the existing literature on three fronts. First, to the authors’ best knowledge, this study is the first to investigate eco-friendly houses’ impact on economic development in the Lisbon metropolitan area. Second, this study employs a macroeconomic approach and several econometric techniques to analyze the link between local economic development and eco-friendly houses for a sample of Portuguese municipalities within the Lisbon metropolitan area. Third, this study seeks to build on previous research on Portugal [14] by introducing a new econometric model focused on the municipalities of the Lisbon metropolitan area and analyzing the impact of eco-friendly houses on local economic growth.
This investigation is highly relevant because it provides valuable insights into the mechanisms of local economic development and eco-friendly houses. The study highlights the importance of energy-efficient buildings and emphasizes the need for better strategies and policies to promote sustainable development. The results of the investigation can be helpful for policymakers and governments to formulate more effective green policies and initiatives that can reduce total energy consumption and greenhouse gas emissions while promoting local development in Portugal. Additionally, the study could guide other European countries facing similar challenges related to sustainable development and eco-friendly housing. By providing evidence-based recommendations and insights, this investigation can contribute to developing more sustainable and environmentally responsible policies and practices in the housing and urban development field.
A systematic approach was followed by a set of scientific method steps to achieve high clarity, coherence, and structure in this investigation, as depicted in Figure 1 below.
This paper summarizes the related literature in the next section as a foundation for the subsequent sections. Section 3 presents the research methodology and data, while Section 4 discusses the empirical results. The main findings are comprehensively discussed in Section 5, and valuable policy implications are provided in the concluding Section 6.

2. Literature Review

Eco-friendly buildings offer numerous benefits recognized by various sources (e.g., [1,2,7,8,37,39,40,41,42]). These benefits range from direct contributions to balancing the energy trilemma to widespread indirect advantages, including economic, environmental, and societal benefits.
Energy-efficient buildings significantly reduce energy consumption. On average, Energy Star- and Leadership in Energy and Environmental Design (LEED-)certified buildings consume 35% and 25% less energy, respectively [43]. In the EU, building renovations resulted in annual primary energy savings of 8.8% for residential buildings and 17% for non-residential buildings from 2012 to 2016 [44]. Globally, the IEA [45] estimates that energy efficiency improvements can decrease buildings’ energy consumption by 25% between 2020 and 2030. As the building sector is a major energy consumer and a significant source of greenhouse gas (GHG) emissions ([1,7]), demand reductions achieved through energy efficiency improvements lead to more sustainable, reliable, resilient, and affordable energy systems.
Green buildings have consistently shown a strong correlation with reductions in CO2 emissions. The United States (U.S) Department of Energy (DoE) conducted a review of 22 LEED-certified buildings managed by the General Services Administration and discovered a 34% decrease in CO2 emissions, along with a 25% reduction in energy consumption and an 11% decrease in water consumption [43]. Ferrantelli and Kurnitsk [46] analyzed various building types in Estonia. They found that eco-friendly buildings could reduce CO2 emissions by at least 26% in educational buildings by 2030, based on a 24,898 Energy Performance Certificates (EPCs) database for Estonian buildings. However, Amiri et al. [47] noted that LEED and Building Research Establishment Environmental Assessment Method (BREEAM) certificates fail to account for embodied emissions. Röck et al. [48] emphasized that energy efficiency measures in buildings might be offset or outweighed by additional emissions from building materials and technical systems. A systematic review of over 650 individual building Life Cycle Assessment (LCA) studies by the authors revealed a “carbon spike” in residential buildings due to the production of building materials and systems, leading to increased embodied GHG emissions. However, office buildings showed a decrease and stabilization of embodied GHG emissions. The importance of adopting a whole lifecycle approach to buildings is increasingly recognized in the literature (e.g., [4,20,48]), and the Level(s) European framework for sustainable buildings, developed by the European Commission, underscores this concept [49]. Considering the entire life cycle of buildings could yield even greater reductions. Karlsson et al. [50] found that GHG emissions in the construction sector supply chain can be reduced by up to 40% with currently available technologies and practices, and even higher reductions of 80% by 2030 and 93% by 2045 are achievable.
Eco-friendly buildings offer various benefits, including mitigating peak loads, congestion, and supply disruptions and reducing the need for expanding energy infrastructure and imports (e.g., [8,41,43]). These energy savings enhance energy security, trade balance, and resource allocation (e.g., [43]). Furthermore, eco-friendly buildings reduce operational and maintenance costs, lowering energy bills and improving structural features (e.g., [39,41,42]). Homeowners can save an average of 15–20% on utility bills and decrease operational costs by up to 37% [51]. This saving contributes to alleviating energy poverty, increasing disposable income, and stimulating economic growth (e.g., [30,32]; [41]). For businesses, eco-friendly buildings result in substantial savings, productivity gains, and improved competitiveness, boosting the economy (e.g., [36,39,41,42]). It is important to note that empirical research on the energy-growth relationship has produced mixed and contradictory results, with varying hypotheses and rebound effects (e.g., [52,53]).
Regarding the impact of energy efficiency improvements on economic growth, the literature suggests positive effects in high-income countries (e.g., [54,55]). A Cambridge Econometrics [56] study analyzed different scenarios for the EU, showing that enhanced energy efficiency leads to the largest positive effect on Gross domestic product (GDP), with increases ranging from just above 0.3% in 2025 to 0.6% in 2030 compared to 2020 baseline levels. The minimum efficiency and REPowerEU Efficiency scenarios also result in higher GDP, ranging from 0.2% to 0.5% by 2030 (e.g., [56,57]). Studies in Portugal have found a positive relationship between energy efficiency and economic growth (e.g., [58,59]). These findings support the idea that energy efficiency is associated with sustainable growth [60].
The literature presents varying perspectives on the magnitude of the rebound effect [61], indicating that energy consumption in buildings is influenced by multiple factors. Consequently, the net savings from energy efficiency improvements differ across countries and regions (e.g., [41,57]). Context-specific policies for rebound mitigation should be implemented to address rebound effects [61,62]. Furthermore, it is essential to consider the multidimensional and long-lasting impact of energy efficiency measures and their direct and indirect benefits (e.g., [56,63,64]).
In addition to mitigating climate change and reducing greenhouse gas emissions, eco-friendly buildings contribute to improved air quality, reduced urban heat island effect, and the prevention of adverse health effects [8]. The built environment significantly impacts human health, with poor indoor conditions leading to various illnesses and diseases (e.g., [41,65]). Green buildings, on the other hand, enhance occupants’ health, comfort, and satisfaction, as evidenced by empirical studies ([66,67]). Improved indoor environments in housing and workplaces have been linked to positive outcomes such as respiratory health, mental well-being, school attendance, and increased productivity (e.g., [41]).
Besides upholding human rights, substantial savings and productivity gains can be achieved through energy efficiency improvements. Fisk’s [68] study estimated potential annual savings and productivity gains in the U.S., including improvements in worker performance, reduced sick-building syndrome symptoms, and decreased respiratory diseases and allergies. The Eurofund [31] projected that addressing severe housing inadequacies in the EU could lead to significant societal medical cost savings. For every €3 (Euros) invested in reducing housing hazards, approximately €2 (Euros) could be saved in medical costs within a year.
Energy efficiency improvements in buildings offer numerous benefits to businesses, citizens, and governments. Green buildings reduce insurance, environmental, and regulatory compliance costs and mitigate sustainability and reputational risks, including the risk of devalued assets [51]. They also command higher sales prices and rental rates, as demonstrated by various authors (e.g., [51,69,70]). The IFC [51] reports that green commercial buildings achieve sale premiums of up to 31%, faster sale times, higher occupancy rates (up to 23%), and increased rental income (up to 8%). Regarding eco-friendly dwellings, scholars have no consensus on the effect of energy performance certificates (EPCs) on transaction prices and rents. However, Koengkan and Fuinhas [71] found that performance certificates associated with green dwellings increase the value per m2 of dwelling sales in Portugal through innovative econometric and microeconomic approaches.
The green building sector has significant job creation potential. The European Commission [49] highlights that energy efficiency in buildings generates the most jobs per million euros invested. Various studies support this claim. UNEP [40] found that energy efficiency investments in new buildings and retrofits could create 9 to 30 jobs per year in manufacturing and construction for every United States dollar (USD) 1 million invested. The IEA [72] estimates that building and appliance efficiency improvements could create 10–15 jobs for every USD 1 million invested. Garrett-Peltier [73] estimates 7.49 full-time-equivalent (FTE) jobs in renewables and 7.79 FTE jobs in energy efficiency for every USD 1 million spent, with a portion of those jobs being indirect. Pollin et al. [74] estimate that building retrofits in the U.S. could create 16.7 jobs for every USD 1 million invested, including direct, indirect, and induced jobs.
The demand for energy efficiency drives high-value-added services and technological innovation, leading to investments, economic growth, and high-income jobs. Bertoldi and Rezessy [75] suggest that the market for energy efficiency services in Western Europe has substantial growth potential. Noailly [76] found that policy instruments aimed at improving building efficiency led to increased technology patenting. Green buildings may also have a positive impact on tourism (e.g., [2,77]).
The construction sector offers the greatest potential for job creation. The European Commission [49] estimates that a renovation wave could result in an additional 160,000 green jobs in the EU’s construction industry. Cambridge Econometrics [56] projects that the EU construction sector, particularly involved in retrofitting and insulation projects, could experience employment growth between 1.1% (in the minimum efficiency scenario) and 1.4% (in the enhanced efficiency scenario) by 2030.
The construction industry plays a vital role in employment and economic growth, being both labour-intensive and having a multiplier effect on the local economy [78]. The National Association of Home Builders [79] studied the local impacts of various building scenarios and found that significant income, jobs, and revenue for local governments could be generated. In Portugal, the construction sector experienced positive growth in gross value added (GVA) and employment, contributing significantly to the country’s GDP and employment rate (e.g., [80,81,82]).
Eco-friendly buildings offer several benefits, including increased tax revenues and reduced public spending on healthcare and unemployment [83]. However, few studies have comprehensively assessed the aggregated benefits of green buildings. Cambridge Econometrics [84] estimated the economic and fiscal impacts of energy-efficient homes in the United Kingdom (UK), highlighting significant returns on government investment, improved GDP, increased tax revenues, job creation, energy bill savings, CO2 reductions, and reduced natural gas imports. Copenhagen Economics [56] found that energy-saving renovations in the EU building stock would provide permanent annual societal benefits, including lower energy bills, reduced air pollution, and potential health benefits.
Additional studies have investigated the impact of eco-friendly or green buildings on economic growth and development in different countries [28]. These studies contribute to the growing body of evidence supporting the positive economic outcomes associated with eco-friendly building practices.
Few studies have examined the impact of green buildings on local economic development. Allen and Potiowsky [85] analyzed the green building cluster in Portland and estimated the wages associated with the sector. Choi et al. [86] evaluated the economic and environmental impacts of building efficiency investments in Hamilton County, Ohio, finding significant local economic impacts and job creation. However, these studies lacked broader quantitative assessments of the sector’s economic contribution. To our knowledge, no study has investigated the effect of green buildings on local economic development in Portugal. Therefore, this paper aims to contribute to the existing literature by examining the impact of eco-friendly homes on economic development in the Lisbon metropolitan area.
Green construction and renovation investments are increasing globally, with building efficiency investments reaching USD 237 billion in 2021, representing a 16% annual increase from 2020 [87]. The construction of new green buildings presents a substantial investment opportunity of $24.7 trillion by 2030, particularly in residential construction [51]. The retrofit market is also projected to grow significantly, reaching $210.37 billion in 2028 [88].
Despite these investments, the building sector is not on track to meet the decarbonization targets outlined in the Paris Agreement. The UNEP/Global Alliance for Buildings and Construction index for buildings decarbonization was far below the target in 2021 [40], and the annual energy efficiency renovation rates must increase globally to meet the goals [87]. The European Commission acknowledges the need for higher renovation rates and additional investments to meet targets [49], highlighting an investment gap in the building renovation sector.
Various authors have identified barriers to energy efficiency investments in buildings, such as high construction costs, lack of alignment of incentives, low awareness of non-energy benefits, and fragmented legal and institutional frameworks. These barriers can be addressed through well-tailored, targeted policies (e.g., [37,41,51]). Effective policy mixes that offer stability, flexibility, and simplicity can promote increased demand for retrofitting and a more responsive supply side [89]. Financial and fiscal incentive policies can also positively impact energy efficiency ratings in residential properties [11].

3. Data and Method

This section will present the data and methods for this investigation. The methodology framework that will be followed in this investigation is illustrated in Figure 2 below.
Hence, Section 3.1 will present the data/variables, while Section 3.2 will provide a detailed description of the methodology.

3.1. Data

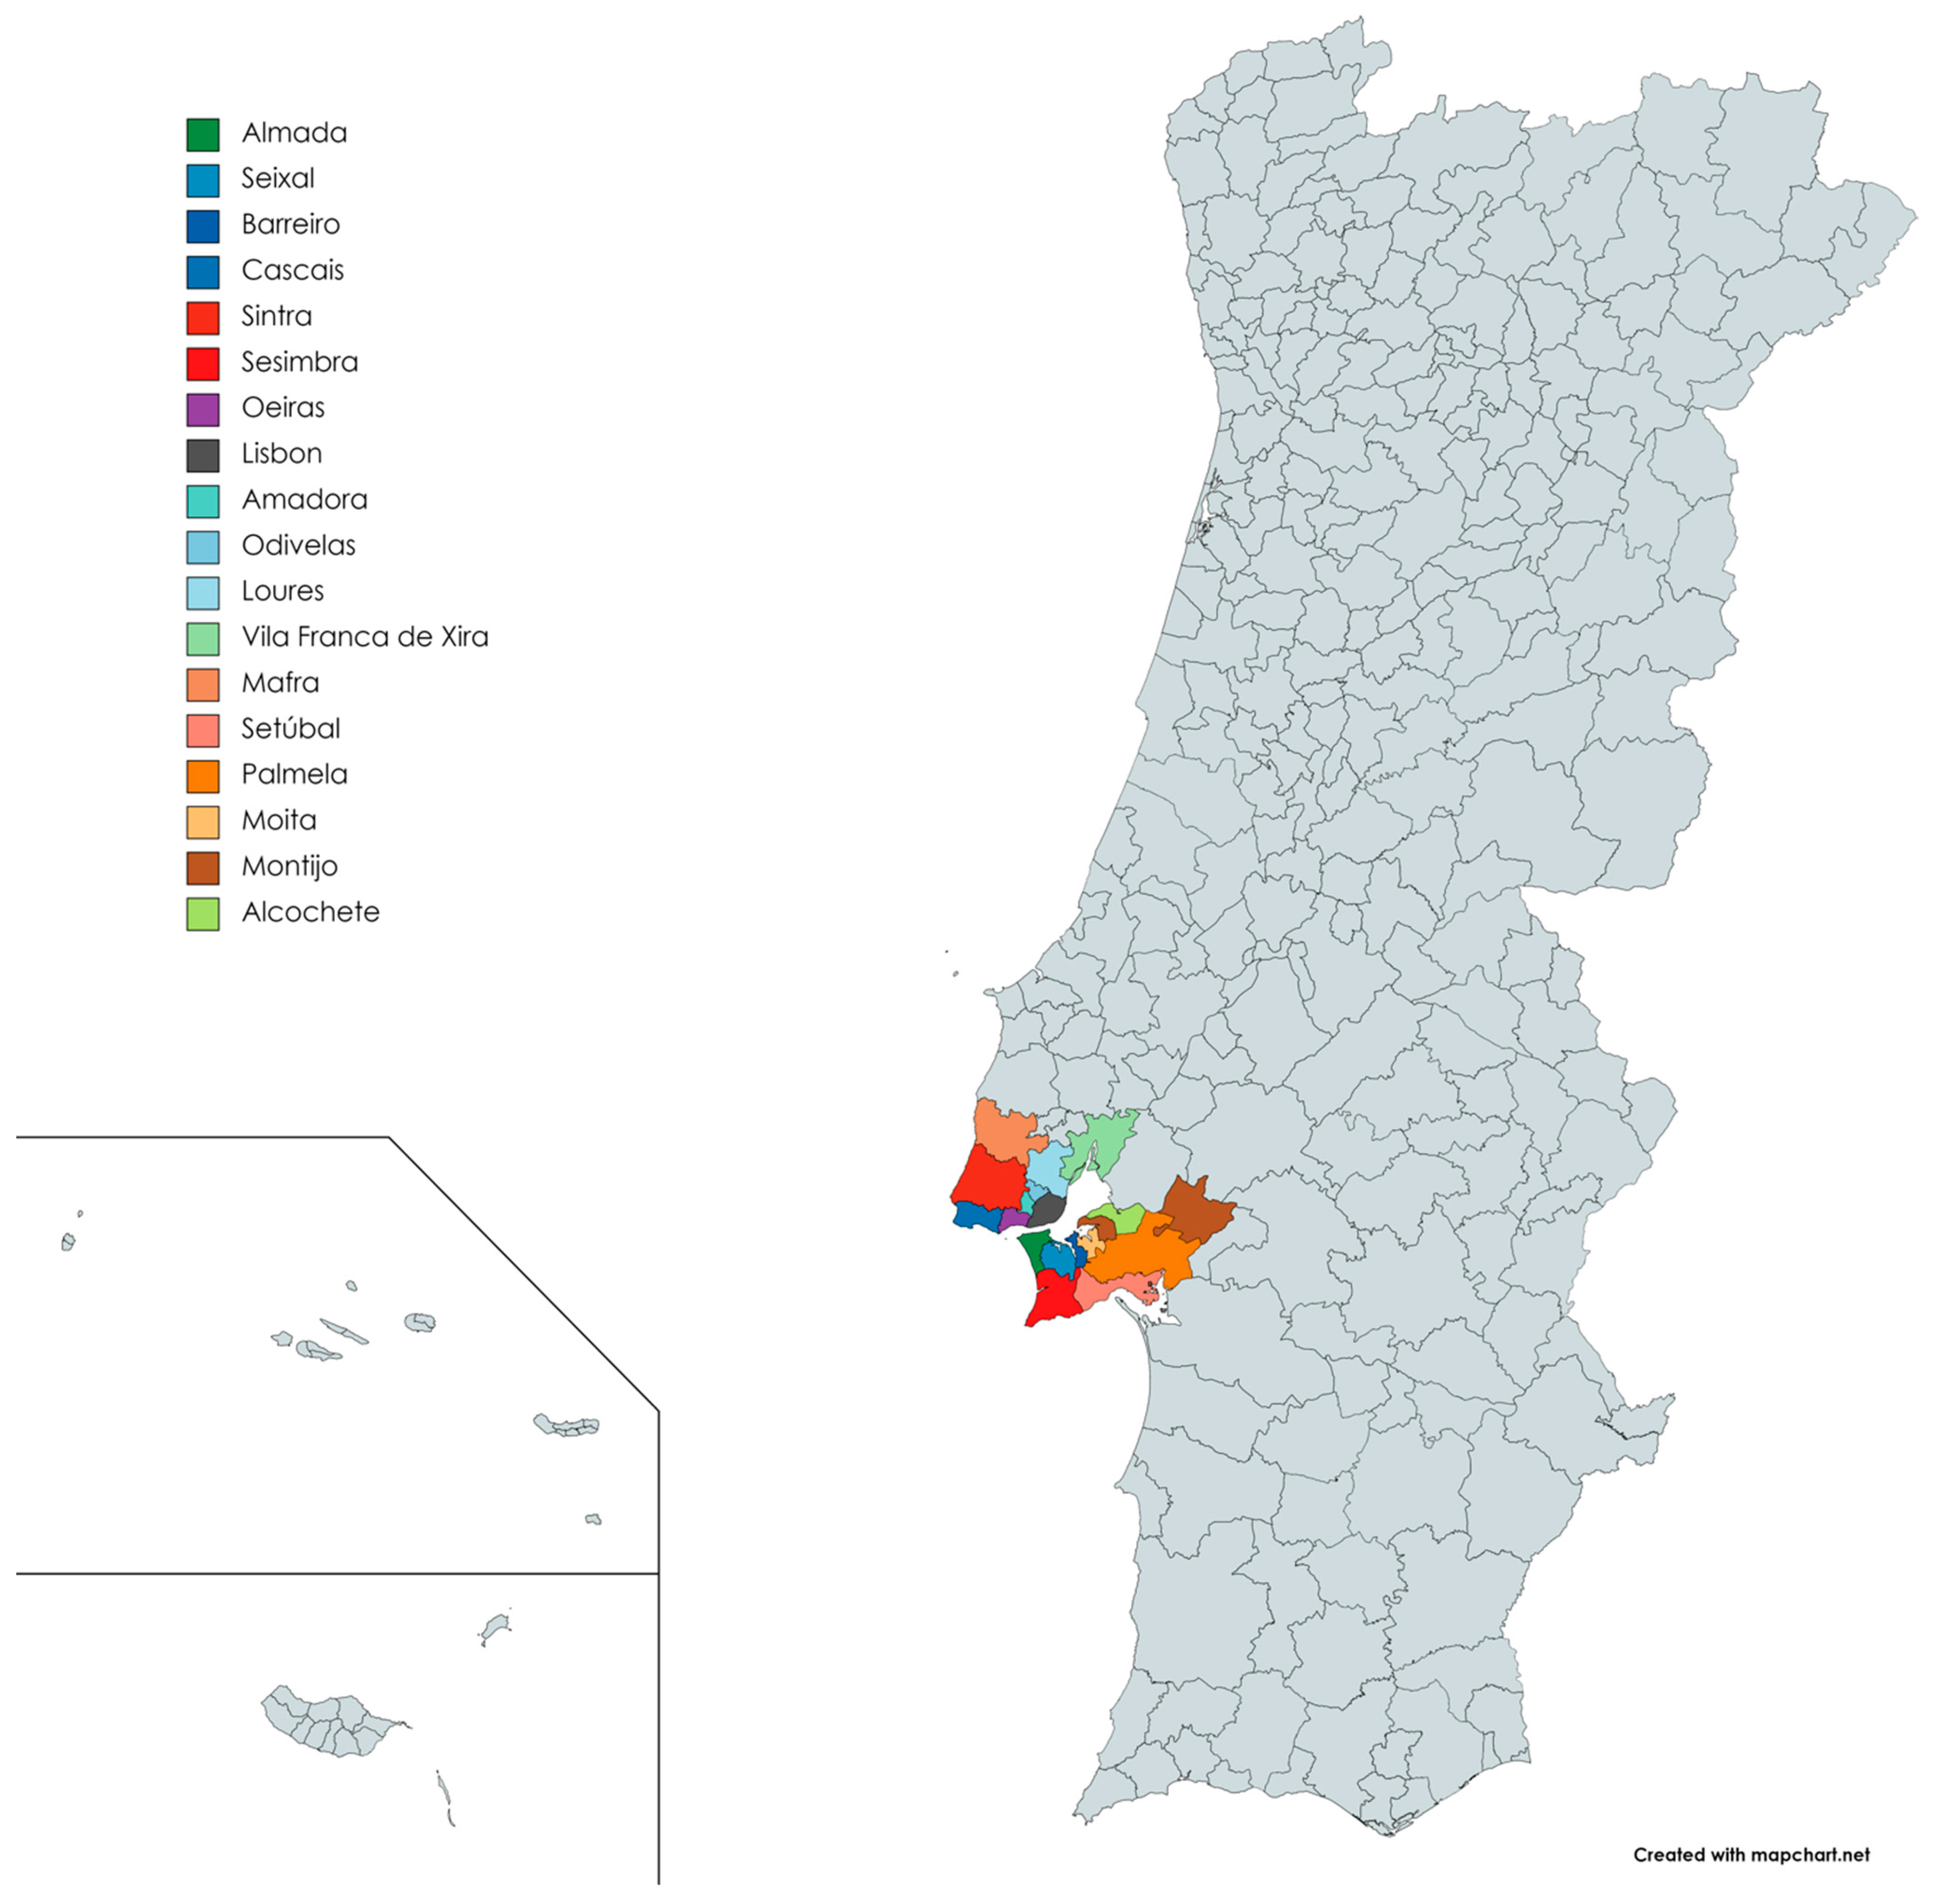
As mentioned earlier, the initial stage of our empirical investigation involves data collection. Therefore, this subsection presents the data/variables used in our empirical investigation of 18 Portuguese municipalities within the Lisbon Metropolitan Area for 2014 and 2020. The municipalities included in the study are Alcochete, Almada, Amadora, Barreiro, Cascais, Lisbon, Loures, Mafra, Moita, Montijo, Odivelas, Oeiras, Palmela, Seixal, Sesimbra, Setúbal, Sintra, and Vila Franca de Xira (see Figure 3 below).
This group of municipalities was chosen because the Lisbon Metropolitan Area, Portugal’s largest urban region, is a diverse area with varying levels of economic development. The adoption of ecological houses, which are energy-efficient and environmentally friendly, has become a crucial topic in urban planning due to the growing interest in sustainable development and reducing environmental impacts.
The Lisbon Metropolitan Area, in central-south Portugal, is categorized as a sub-region and a Nomenclature of territorial Units for Statistics (NUT) II region. Its central hub is the capital city of Lisbon. With a population of 2,871,134 residents, it is the most densely populated region in the country, with 957 inhabitants per km2. Additionally, it has the largest urban area in Portugal, covering a total area of 3001 km2, ranking as the fifth largest region in the country. This area is also recognized as the wealthiest region in Portugal, with a per capita GDP of €29,291 (Euros) in 2020 [14].
Moreover, the Lisbon Metropolitan Area is crucial in driving Portugal’s economy, serving as a hub for various industries such as finance, technology, tourism, commerce, and services. This dynamic economic landscape is further enhanced by multinational corporations, startups, and research institutions, contributing to the region’s reputation as a centre of innovation and entrepreneurship [91]. Given the diverse economic composition, including industry, services, and tourism, studying the impact of ecological houses in this area offers a unique opportunity to examine their effects on different sectors of the economy.
In addition to Lisbon, the metropolitan area encompasses several municipalities, including Amadora, Oeiras, Cascais, Sintra, and Loures. These municipalities blend residential, commercial, and industrial areas, natural landscapes, and cultural attractions. Various stakeholders within the Lisbon Metropolitan Area, such as local authorities, residents, and businesses, hold distinct perspectives on adopting ecological houses. By conducting research in this region, valuable insights can be gained regarding how different stakeholders perceive the impact of ecological houses on economic development and identify critical success factors [91].
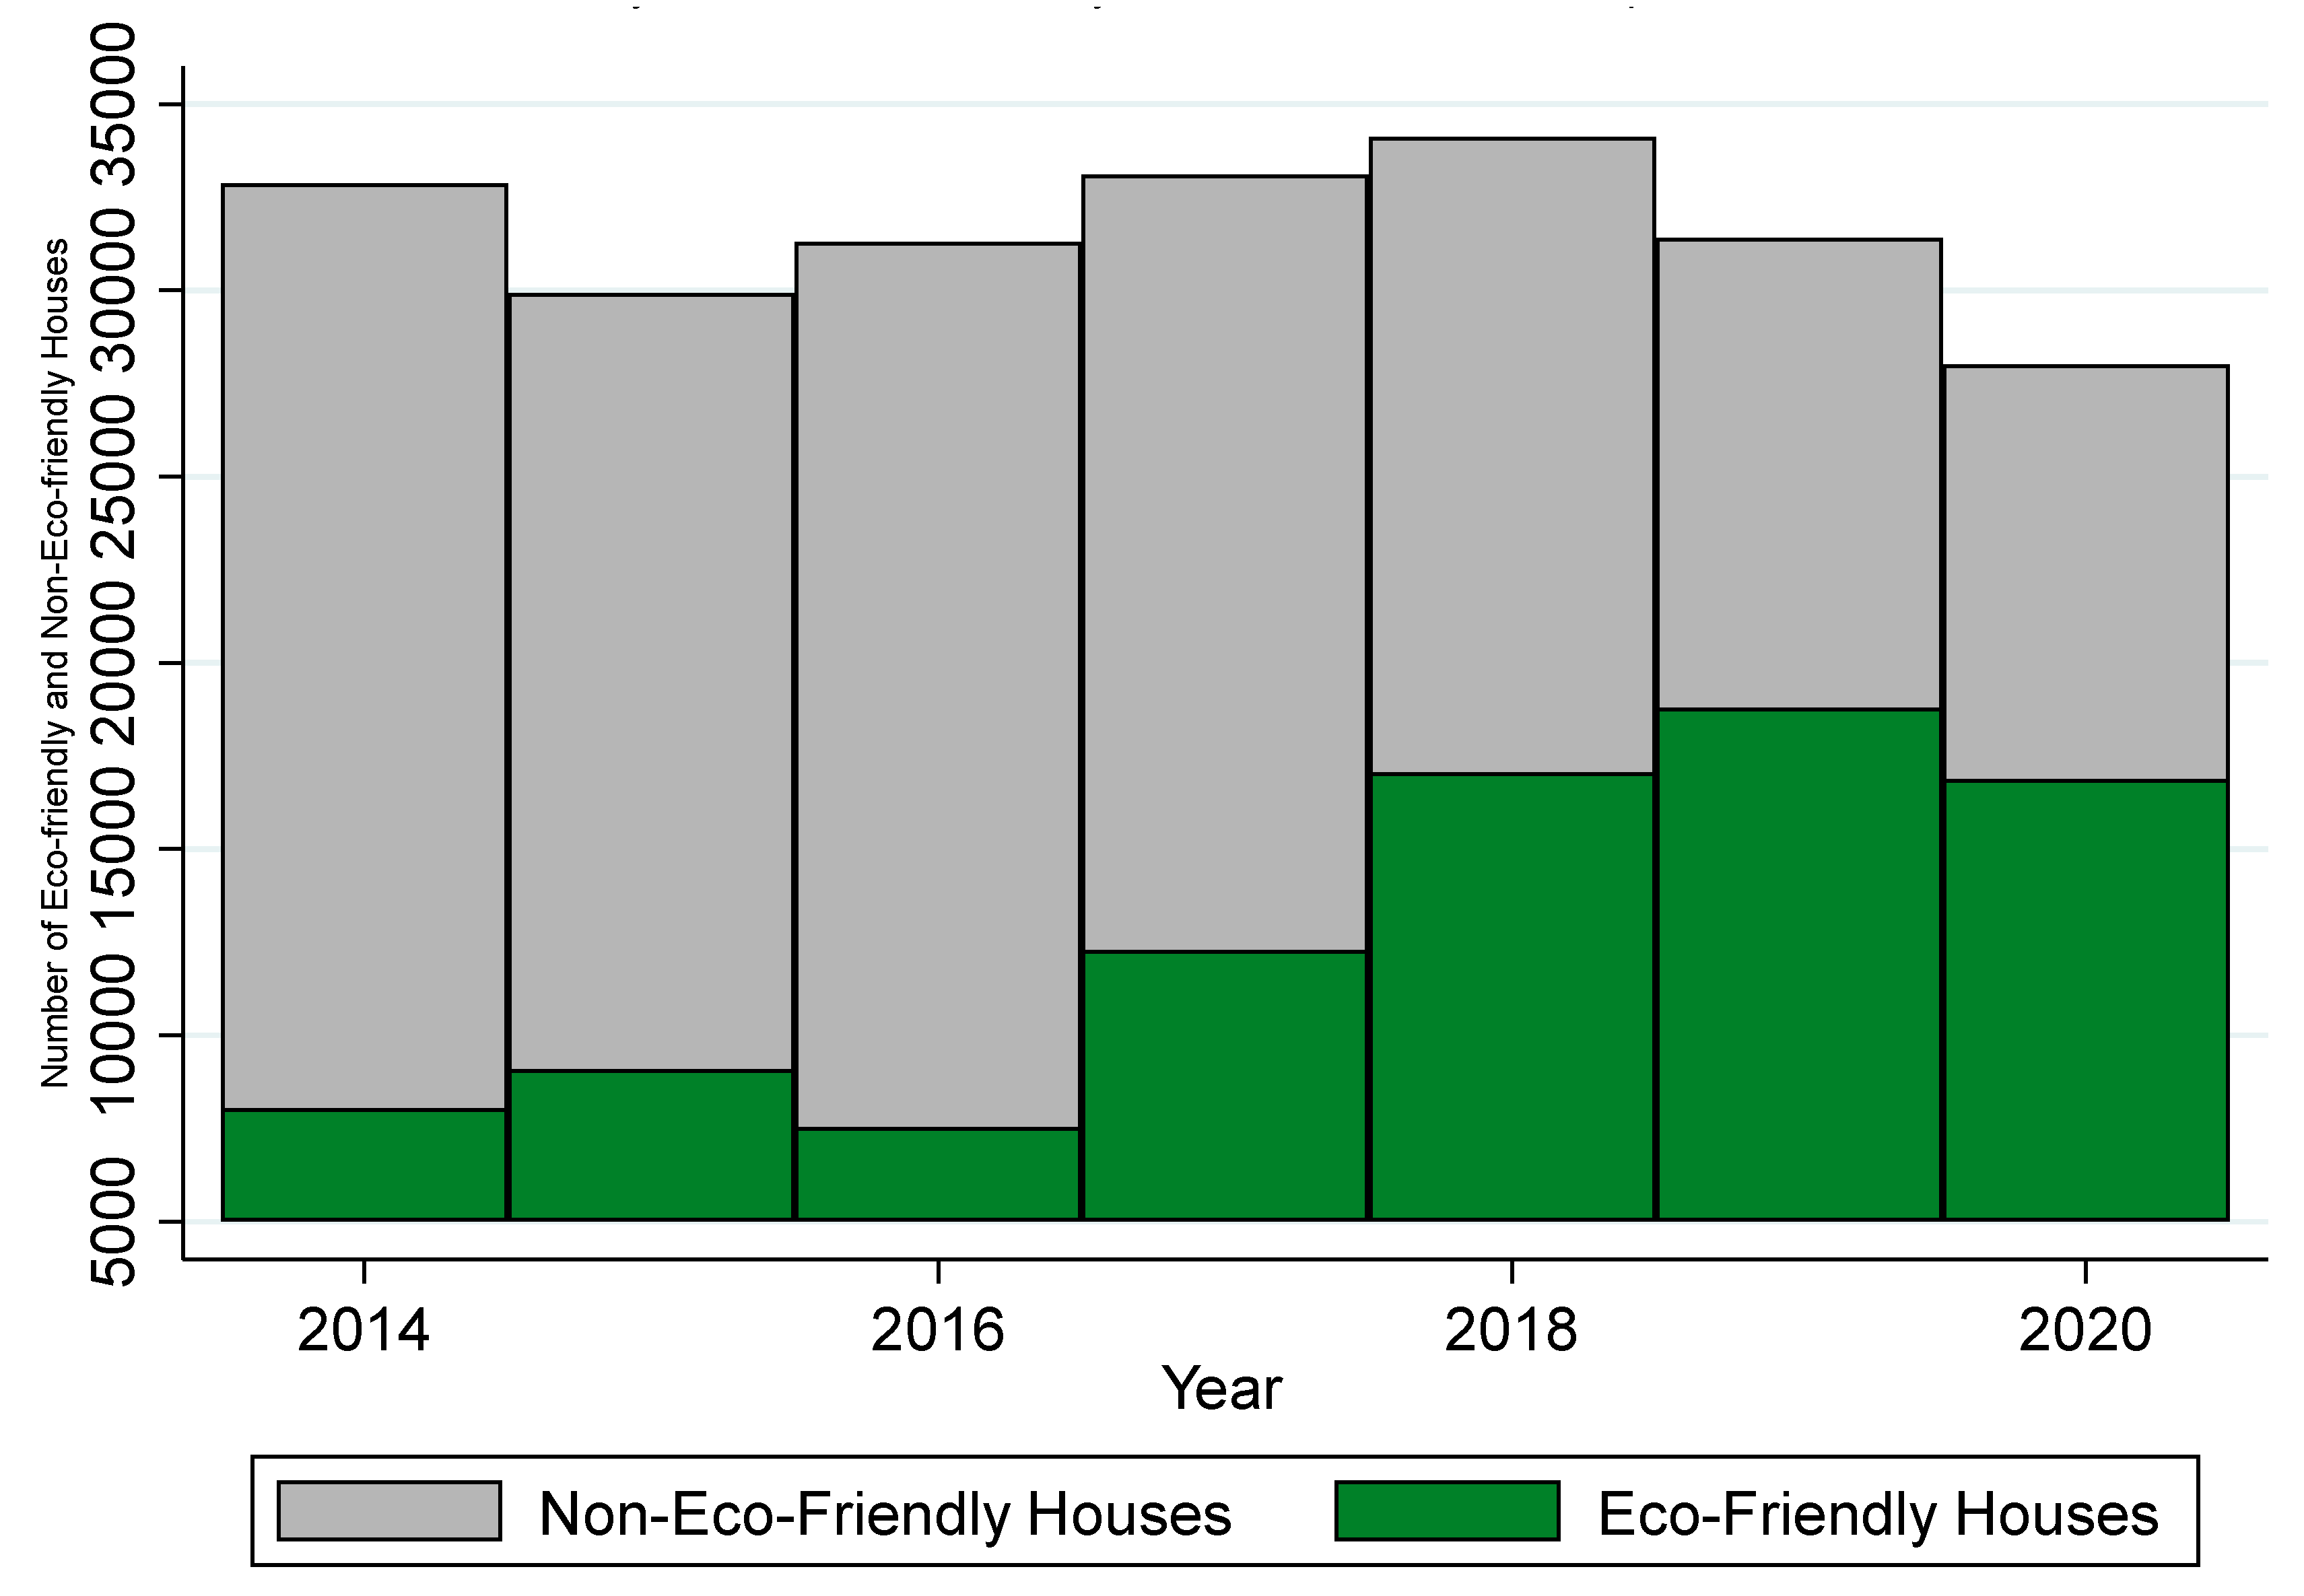
In the Lisbon Metropolitan Area, there has been a notable surge in the number of eco-friendly houses that meet high energy efficiency standards like A+, A, B, and B-, according to Koengkan and Fuinhas [71]. Specifically, there were only 8047 eco-friendly houses in 2014, but by 2020, this number had more than doubled to 16,881. In contrast, the number of non-eco-friendly houses with lower energy efficiency certifications, such as C, D, E, and F, was 32,874 in 2014. However, by 2020, this number decreased to 28,017, reflecting a positive trend towards eco-friendliness. (see Figure 4 below).
The Lisbon metropolitan area comprises various municipalities that have made significant strides towards eco-friendliness. The area’s largest number of eco-friendly houses is in Lisbon, with 29,833 houses, followed by Cascais with 6585, Seixal with 6435, and Loures with 5324. Other municipalities with high numbers of eco-friendly houses include Odivelas, Sintra, Oeiras, Mafra, Almada, Setubal, Montijo, Amadora, Vila Franca de Xira, Sesimbra, Palmela, and Barreiro. However, some municipalities still have a long way to go to increase the number of eco-friendly houses. Alcochete has the lowest number of eco-friendly houses, with only 763, followed by Moita, with just 516. Regarding non-eco-friendly houses, the highest numbers are found in Lisbon, with 86,071; Sintra, 36,925; and Cascais, 21,161. Other municipalities with high numbers of non-eco-friendly houses include Almada, Oeiras, Amadora, Seixal, Loures, Setubal, Vila Franca de Xira, Barreiro, Odivelas, Mafra, Sesimbra, Palmela, Montijo, and Alcochete (see Figure 5 below).
In the Lisbon metropolitan area, the number of houses classified as “eco-friendly” has been on the rise since 2017, which can be attributed to the property boom occurring not only in this region but also throughout Portugal. The property market in Portugal grew by 50% in the same year [93].
Since 2017, this property boom has facilitated the construction of highly energy-efficient houses, classified as “eco-friendly”. Moreover, it has also facilitated the reconstruction and revitalization of deteriorated houses with low energy efficiency, making them more environmentally sustainable. In the Lisbon metropolitan area, the number of completed dwellings for family housing in new constructions was 1132 in 2014. However, this number increased significantly, reaching 2883 by 2020 [94]. According to data from the National Institute of Statistics [95], the ratio of completed reconstructions to new constructions, expressed as the number of reconstructions completed per 100 new constructions (No.), was 1.5 in 2014. However, this ratio decreased significantly over the years and reached a value of 0.5 in 2020.
As previously mentioned, the surge in property demand in Portugal can be attributed to several factors, including tax incentives, tourism, affordable property prices, low-interest rates, political stability, social harmony, and a temperate climate [71]. Additionally, Portugal’s swift economic recovery following the Troika intervention, which spanned from 2011–2014, played a significant role. The country experienced a real Gross Domestic Product (GDP) growth rate of 0.795% in 2014, 1.79% in 2015, 2.02% in 2016, 3.51% in 2017, 2.85% in 2018, and 2.68% in 2019, but the trend was interrupted in 2020 due to the COVID-19 pandemic, with a decline of 8.30% in the real GDP growth rate [96].
The economic growth experienced in Portugal between 2014 and 2019 directly and positively impacted the Lisbon metropolitan area’s GDP per capita (base = 2016). In 2014, the GDP per capita was €27,831 (Euros), which increased to €28,373 in 2015, €28,876 in 2016, €29,682 in 2017, and €30,770 in 2018. By 2019, the GDP per capita had reached €32,029. Unfortunately, the COVID-19 pandemic 2020 led to a decline in the Lisbon metropolitan area’s GDP per capita (base = 2016), falling to €29,291 [91].
Between 2014 and 2019, households in the Lisbon metropolitan area experienced an increase in GDP per capita, allowing them to acquire new high-energy efficiency dwellings and reconstruct and requalify deteriorated dwellings with low energy efficiency. This property boom in Lisbon and Portugal was influenced by increased credit agreements for the purchase, construction, and reconstruction of permanent or secondary dwellings during the rapid economic growth from 2014–2019. In 2014, credit agreements in the Lisbon metropolitan area for such purposes were €35,105.803 (Thousands) and reached €31,213.729 (Thousands) in value in 2019 [97]. Interest rates for housing credit were also reduced during this period, dropping from 3.19% in 2014 to 1.00% in 2020 [98].
Other factors may have contributed to the increase in the number of “eco-friendly” houses and reduction of “non-eco-friendly” houses in the Lisbon metropolitan area, including the implementation of energy efficiency policies for the residential sector in Portugal. According to Koengkan et al. [12], since 2006, five energy efficiency policies have been in force in Portugal. The first policy, implemented in 2006, revised the national RSECE building code and established strict standards for HVACs energy use. The second policy, implemented in 2007, established strict standards for space cooling, heating, water heating, ventilation, and lighting interior. The third policy, implemented in 2008, comprises a set of measures aiming at an increase in energy efficiency equivalent to about 10% of the final energy consumption. The fourth policy, implemented in 2013, established strict standards for energy efficiency conditions and the use of renewable energy systems to ensure the energy performance of buildings. The fifth policy, implemented in 2020, provides incentives to promote buildings’ energy efficiency and decarbonization.
These national policies were established through various decrees and directives, including the Energy Performance of Buildings Directive and the Sustainable Buildings Directive, which set energy consumption reduction goals in 2020 and 2030. The introduction of these policies may have played a role in the reduction of the number of dwellings with low energy efficiency ratings in Portugal [76].
This investigation first identified the group of municipalities to determine the appropriate period for the empirical study. This investigation selected a time frame to provide sufficient data to meet the research objectives. Therefore, this study has chosen the period from 2014 to 2020 as the most suitable timeframe for this investigation.
The starting point of 2014 is appropriate because it aligns with the availability of data for the energy efficiency certificate ratings, which are critical components of the ECO_HOUSES and NON_ECO_HOUSES variables. These variables are a proxy of “eco-friendly” and “non-eco-friendly” houses, an essential aspect of our investigation. Likewise, this investigation chose 2020 as the endpoint for our study because it corresponds to the latest available data for some critical variables. For example, this investigation obtained GDP per capita data for all municipalities in the Lisbon metropolitan area until 2020. Additionally, this study could retrieve data on the number of completed dwellings in new constructions for family housing until 2020. 
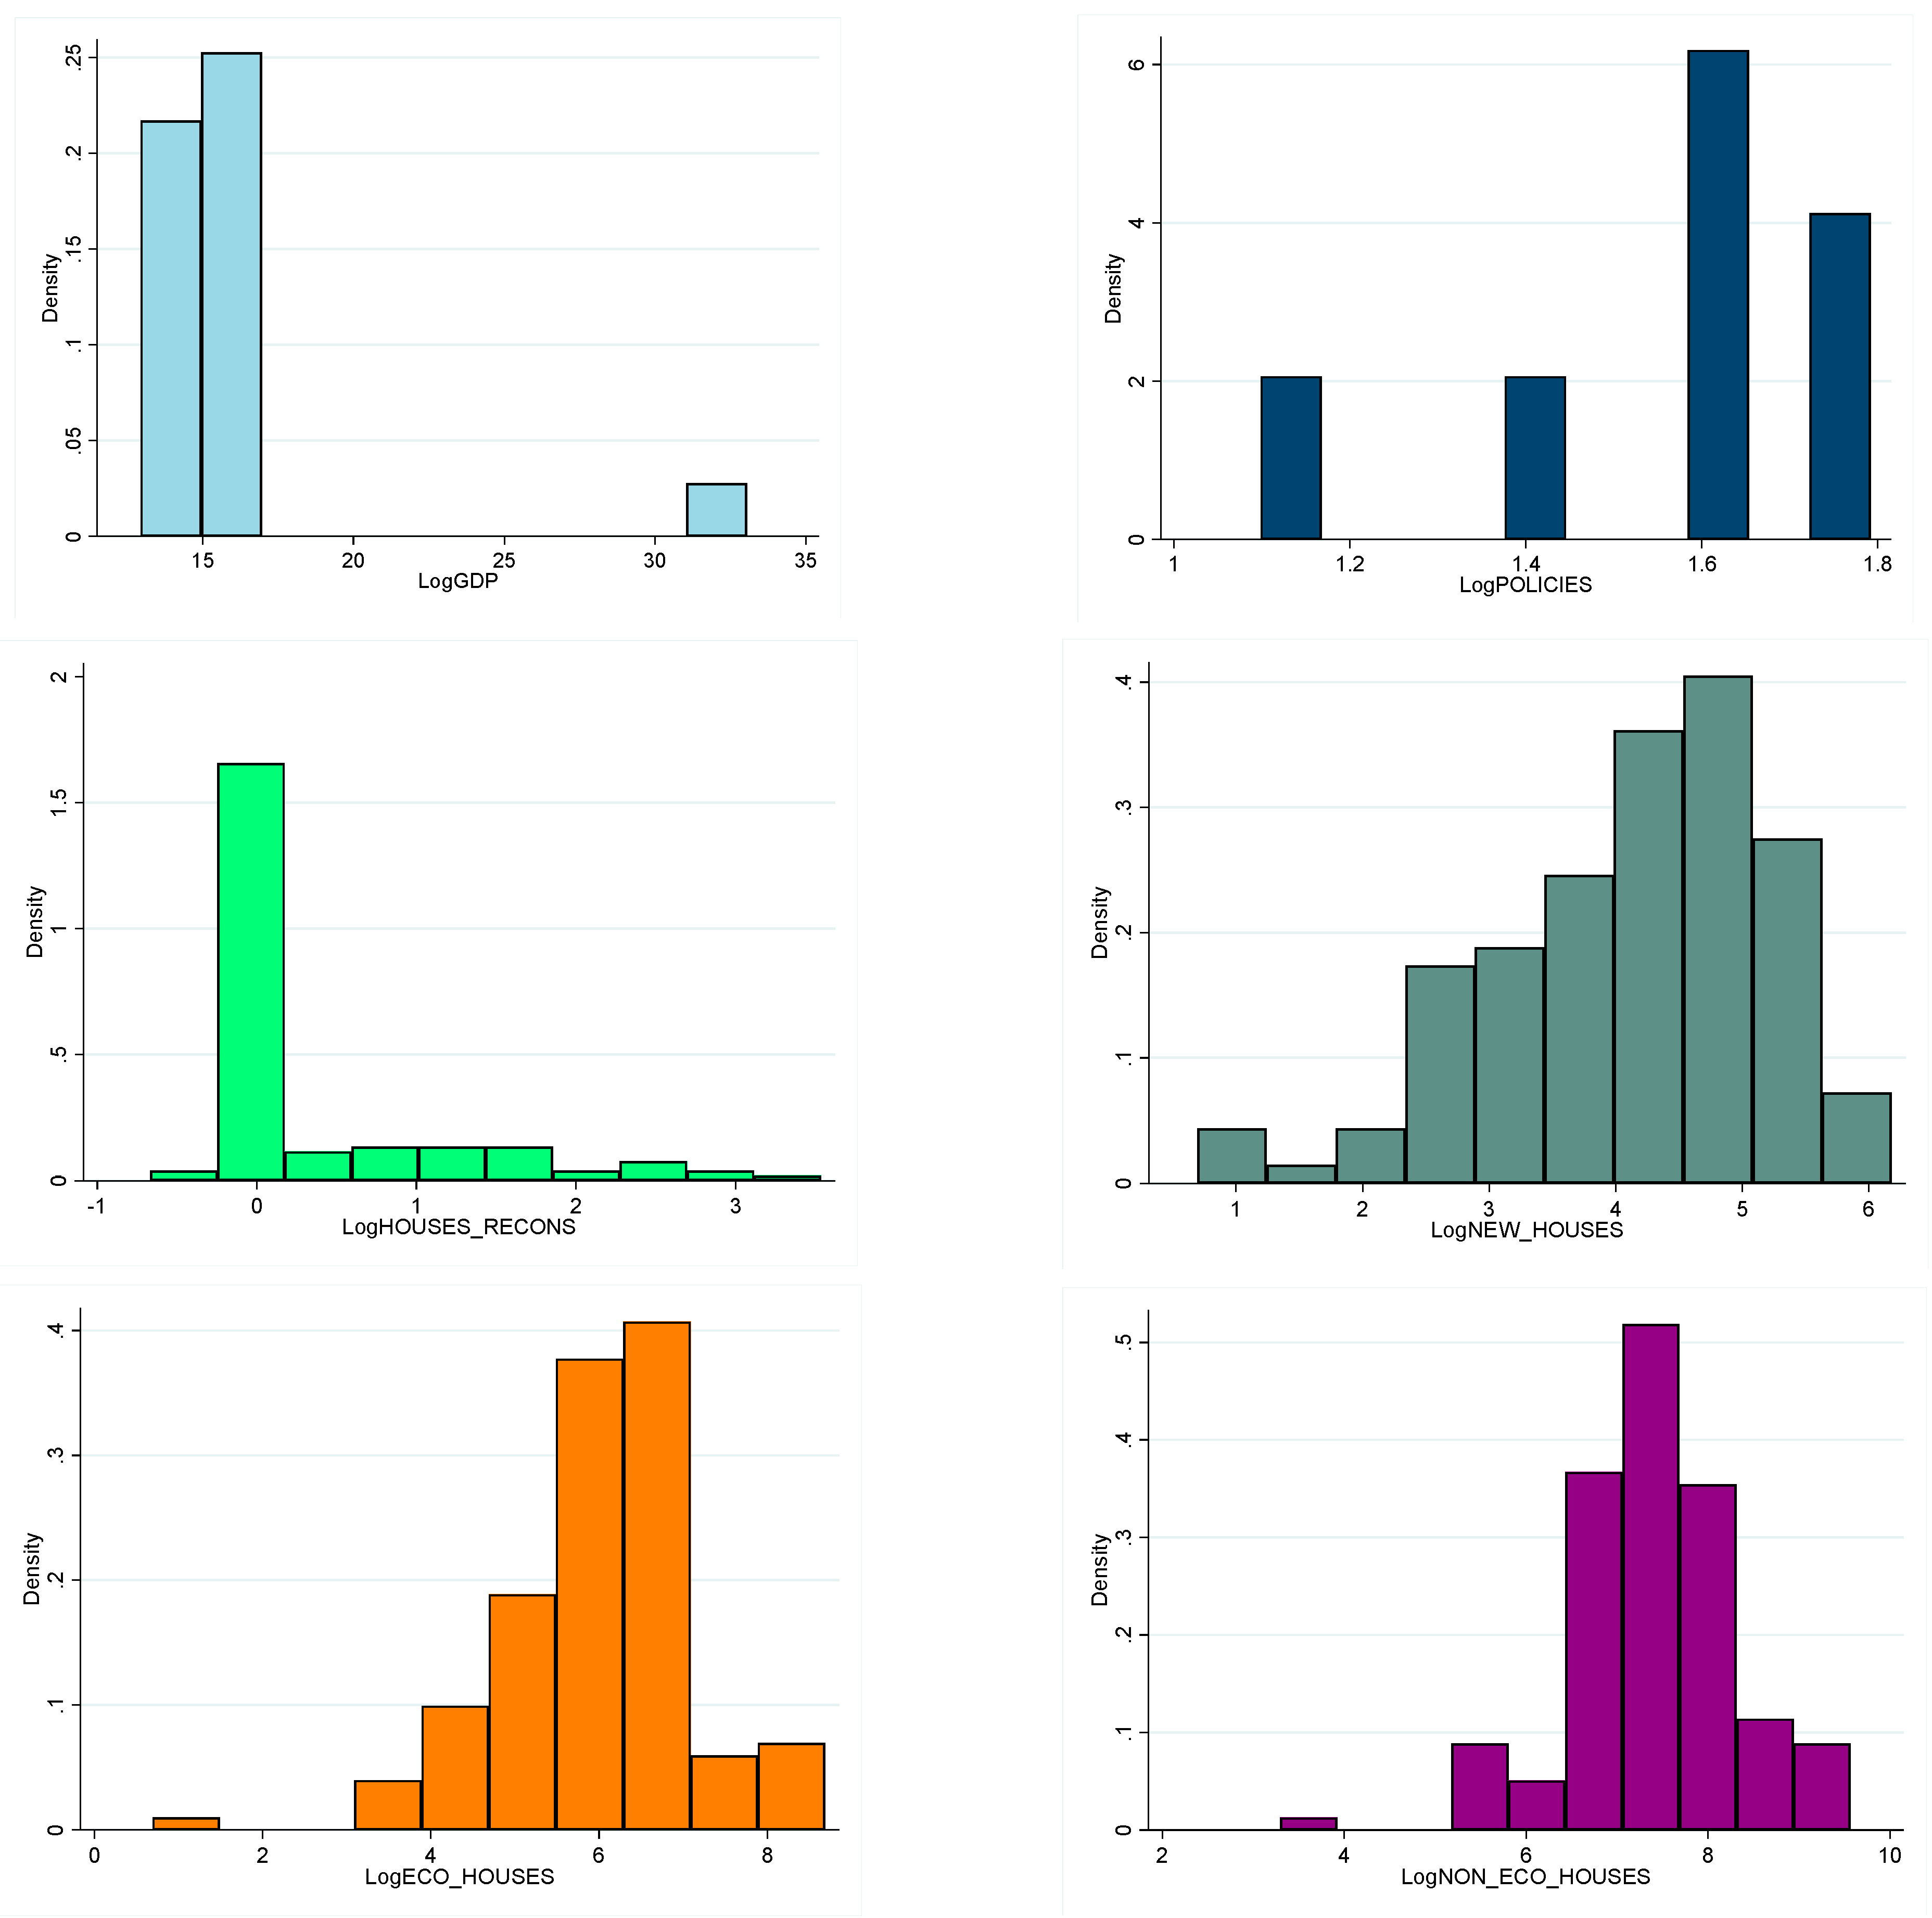
Table 1 below provides a comprehensive overview of the variables used in this empirical investigation.
The use of dependent variable GDP as a proxy for economic development is commonly employed in economic research. GDP per capita is a widely used measure of a country’s economic performance and is often used to indicate economic development. It represents the average income of individuals in a given population and is, therefore, a useful measure of the standard of living of a country’s residents. In the context of this article, the dependent variable GDP is used to assess the impact of eco-friendly houses on economic development in the Lisbon metropolitan area. It is reasonable to use GDP per capita as a proxy for economic development in this context, as it broadly measures the region’s economic performance, reflecting changes in income levels, employment rates, and economic growth.
Moreover, since the study investigates the relationship between eco-friendly houses and economic development, using GDP per capita as the dependent variable is justifiable. Changes in eco-friendly houses may impact economic development through multiple channels, such as energy consumption, employment, and household disposable income. GDP per capita provides a comprehensive measure that captures the net effect of these channels on economic development.
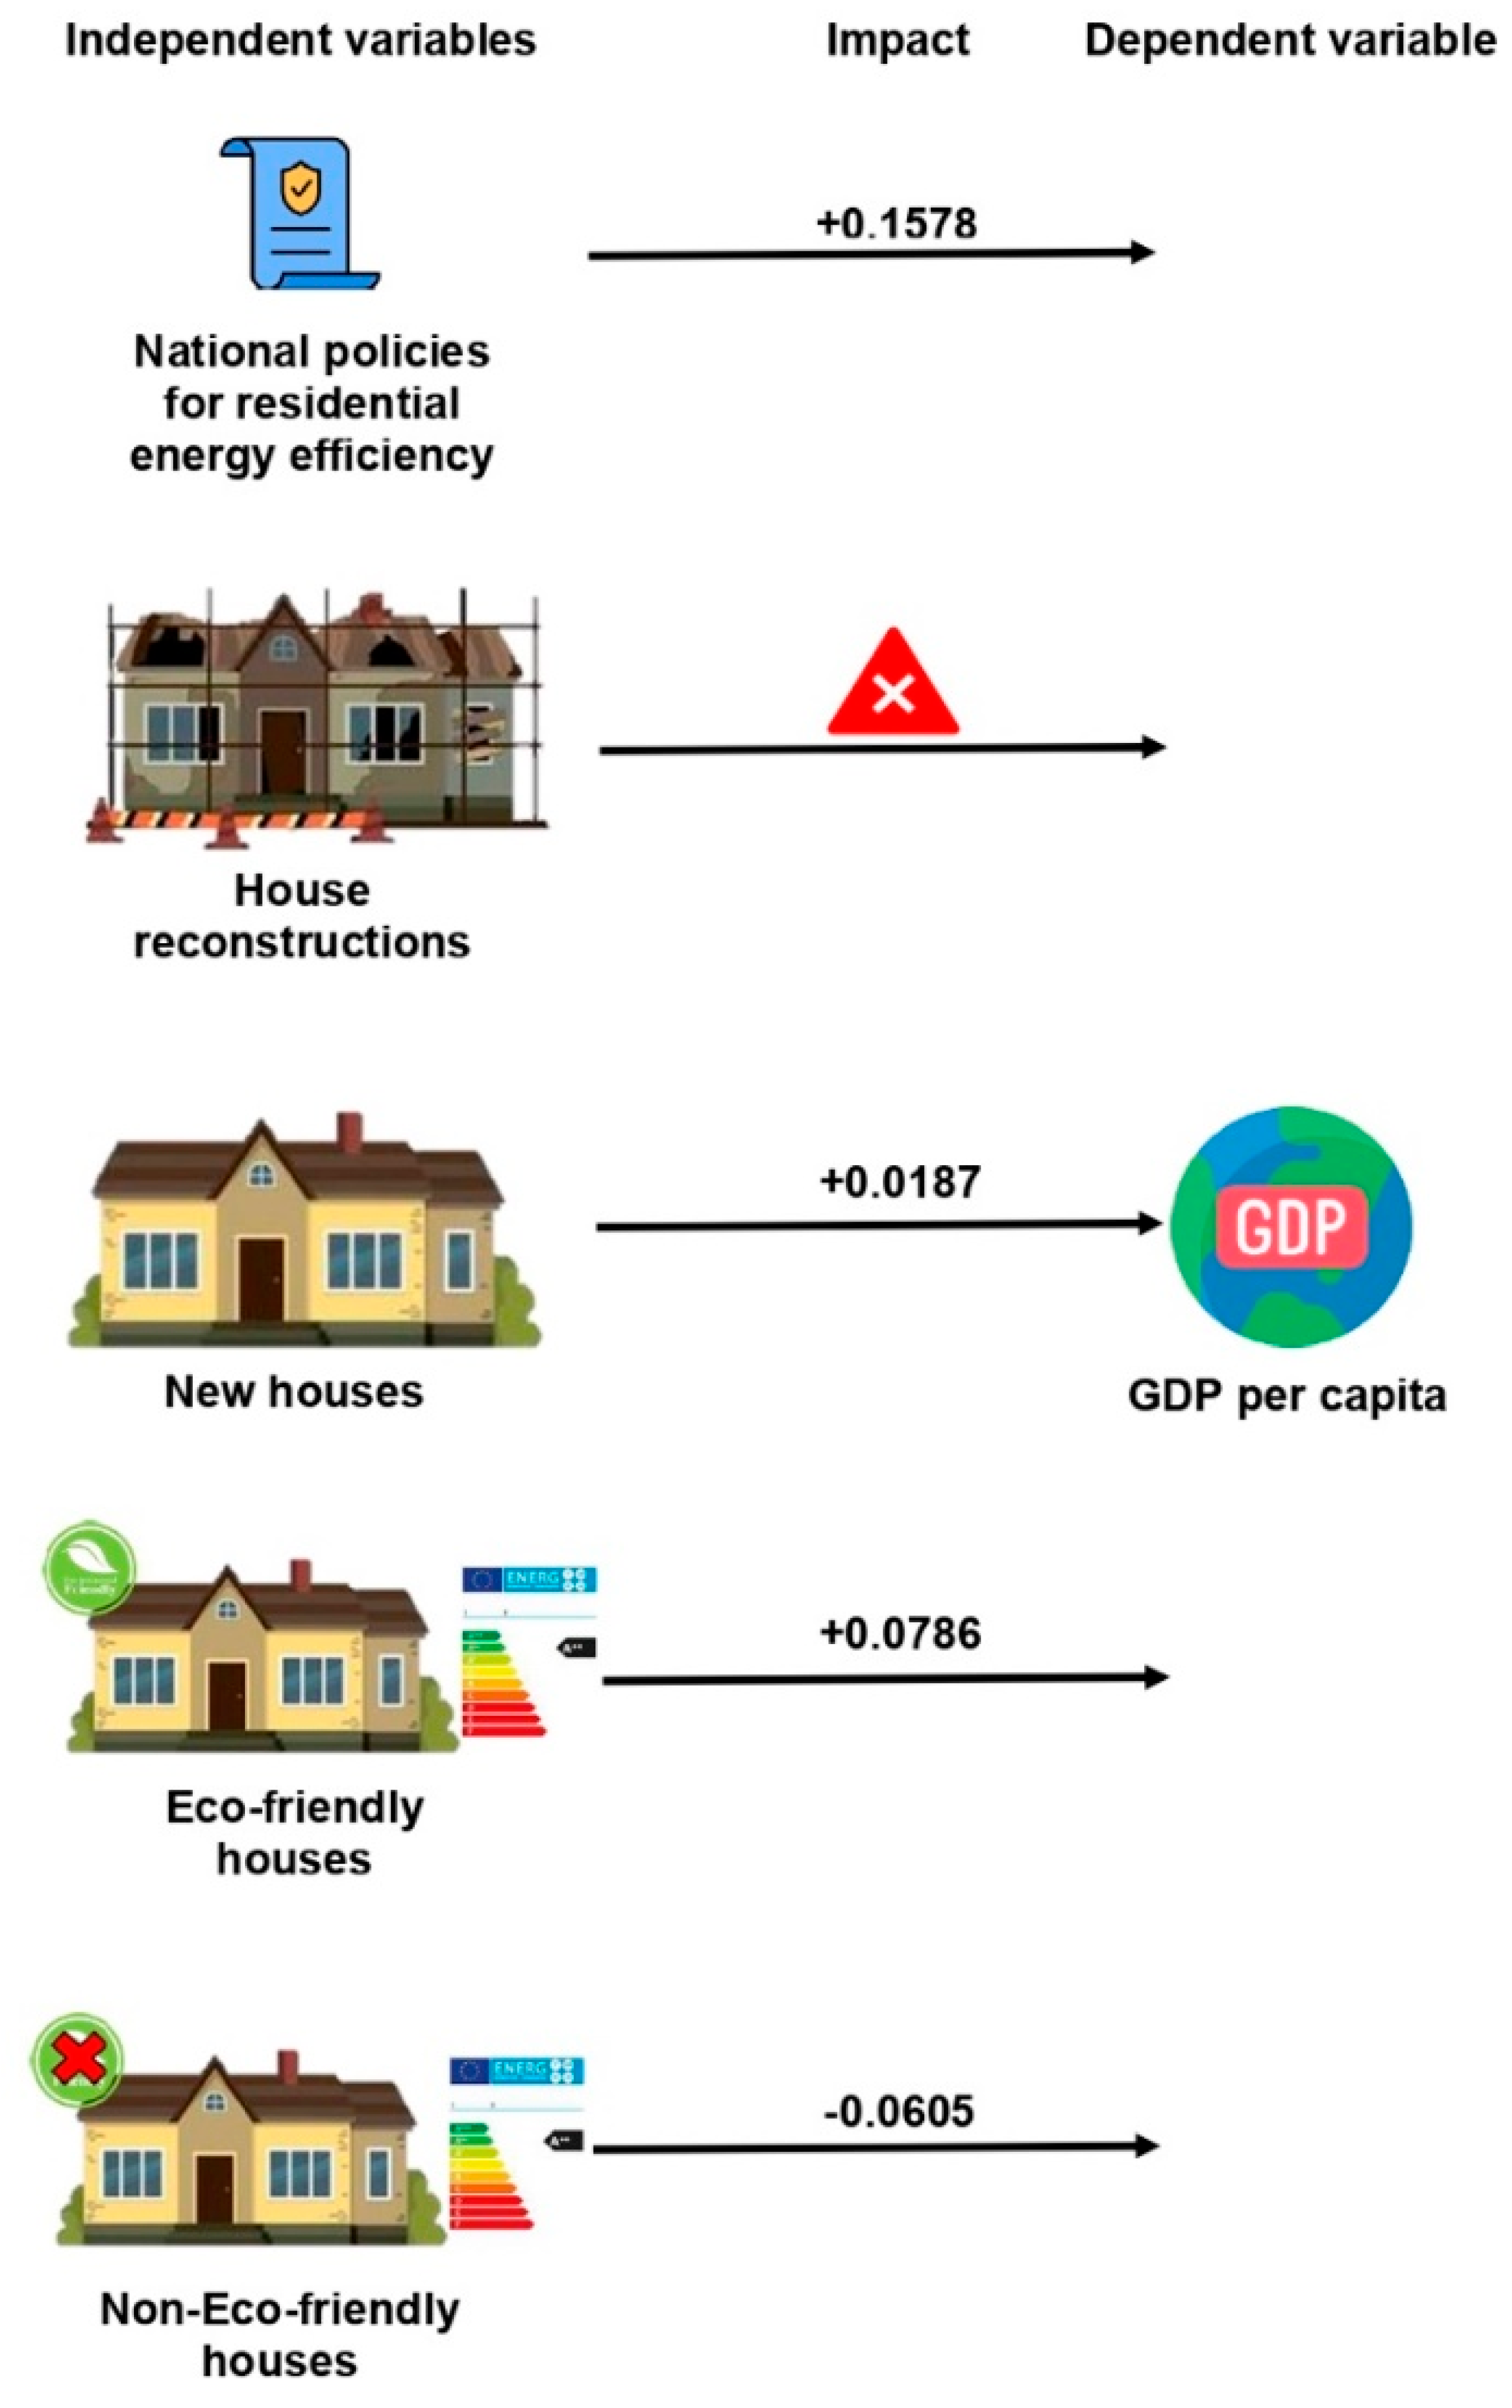
The use of independent variables such as POLICIES, HOUSES_RECONS, NEW_HOUSES, ECO_HOUSES, and NON_ECO-HOUSES to explain the dependent variable GDP is economically justified as they have significant impacts on economic growth. Policies such as subsidies, loans, and tax relief can encourage investment in energy-efficient technologies, increasing household disposable income and job creation. Completed house reconstructions can lead to economic benefits such as job creation, increased demand for construction materials and services, and improved energy efficiency of existing housing stock.
An increase in the number of newly completed houses can have far-reaching effects on the economy, such as job creation, increased economic activity, and changes in consumer spending and property values. However, it is essential to consider the environmental impact of these houses, particularly in terms of their energy efficiency.
Eco-friendly houses, certified with high energy efficiency ratings (such as A+, A, B, and B−), can contribute to environmental sustainability, higher property values, and job creation. On the other hand, non-eco-friendly houses, which have low energy efficiency ratings (such as C, D, E, and F), can negatively impact environmental sustainability, household wealth, and the construction and energy efficiency industries.
By analyzing these independent variables, we can gain valuable insights into their potential impacts on economic development. This makes it economically justified to prioritize the construction of energy-efficient and eco-friendly houses, as they can benefit both the environment and the economy.
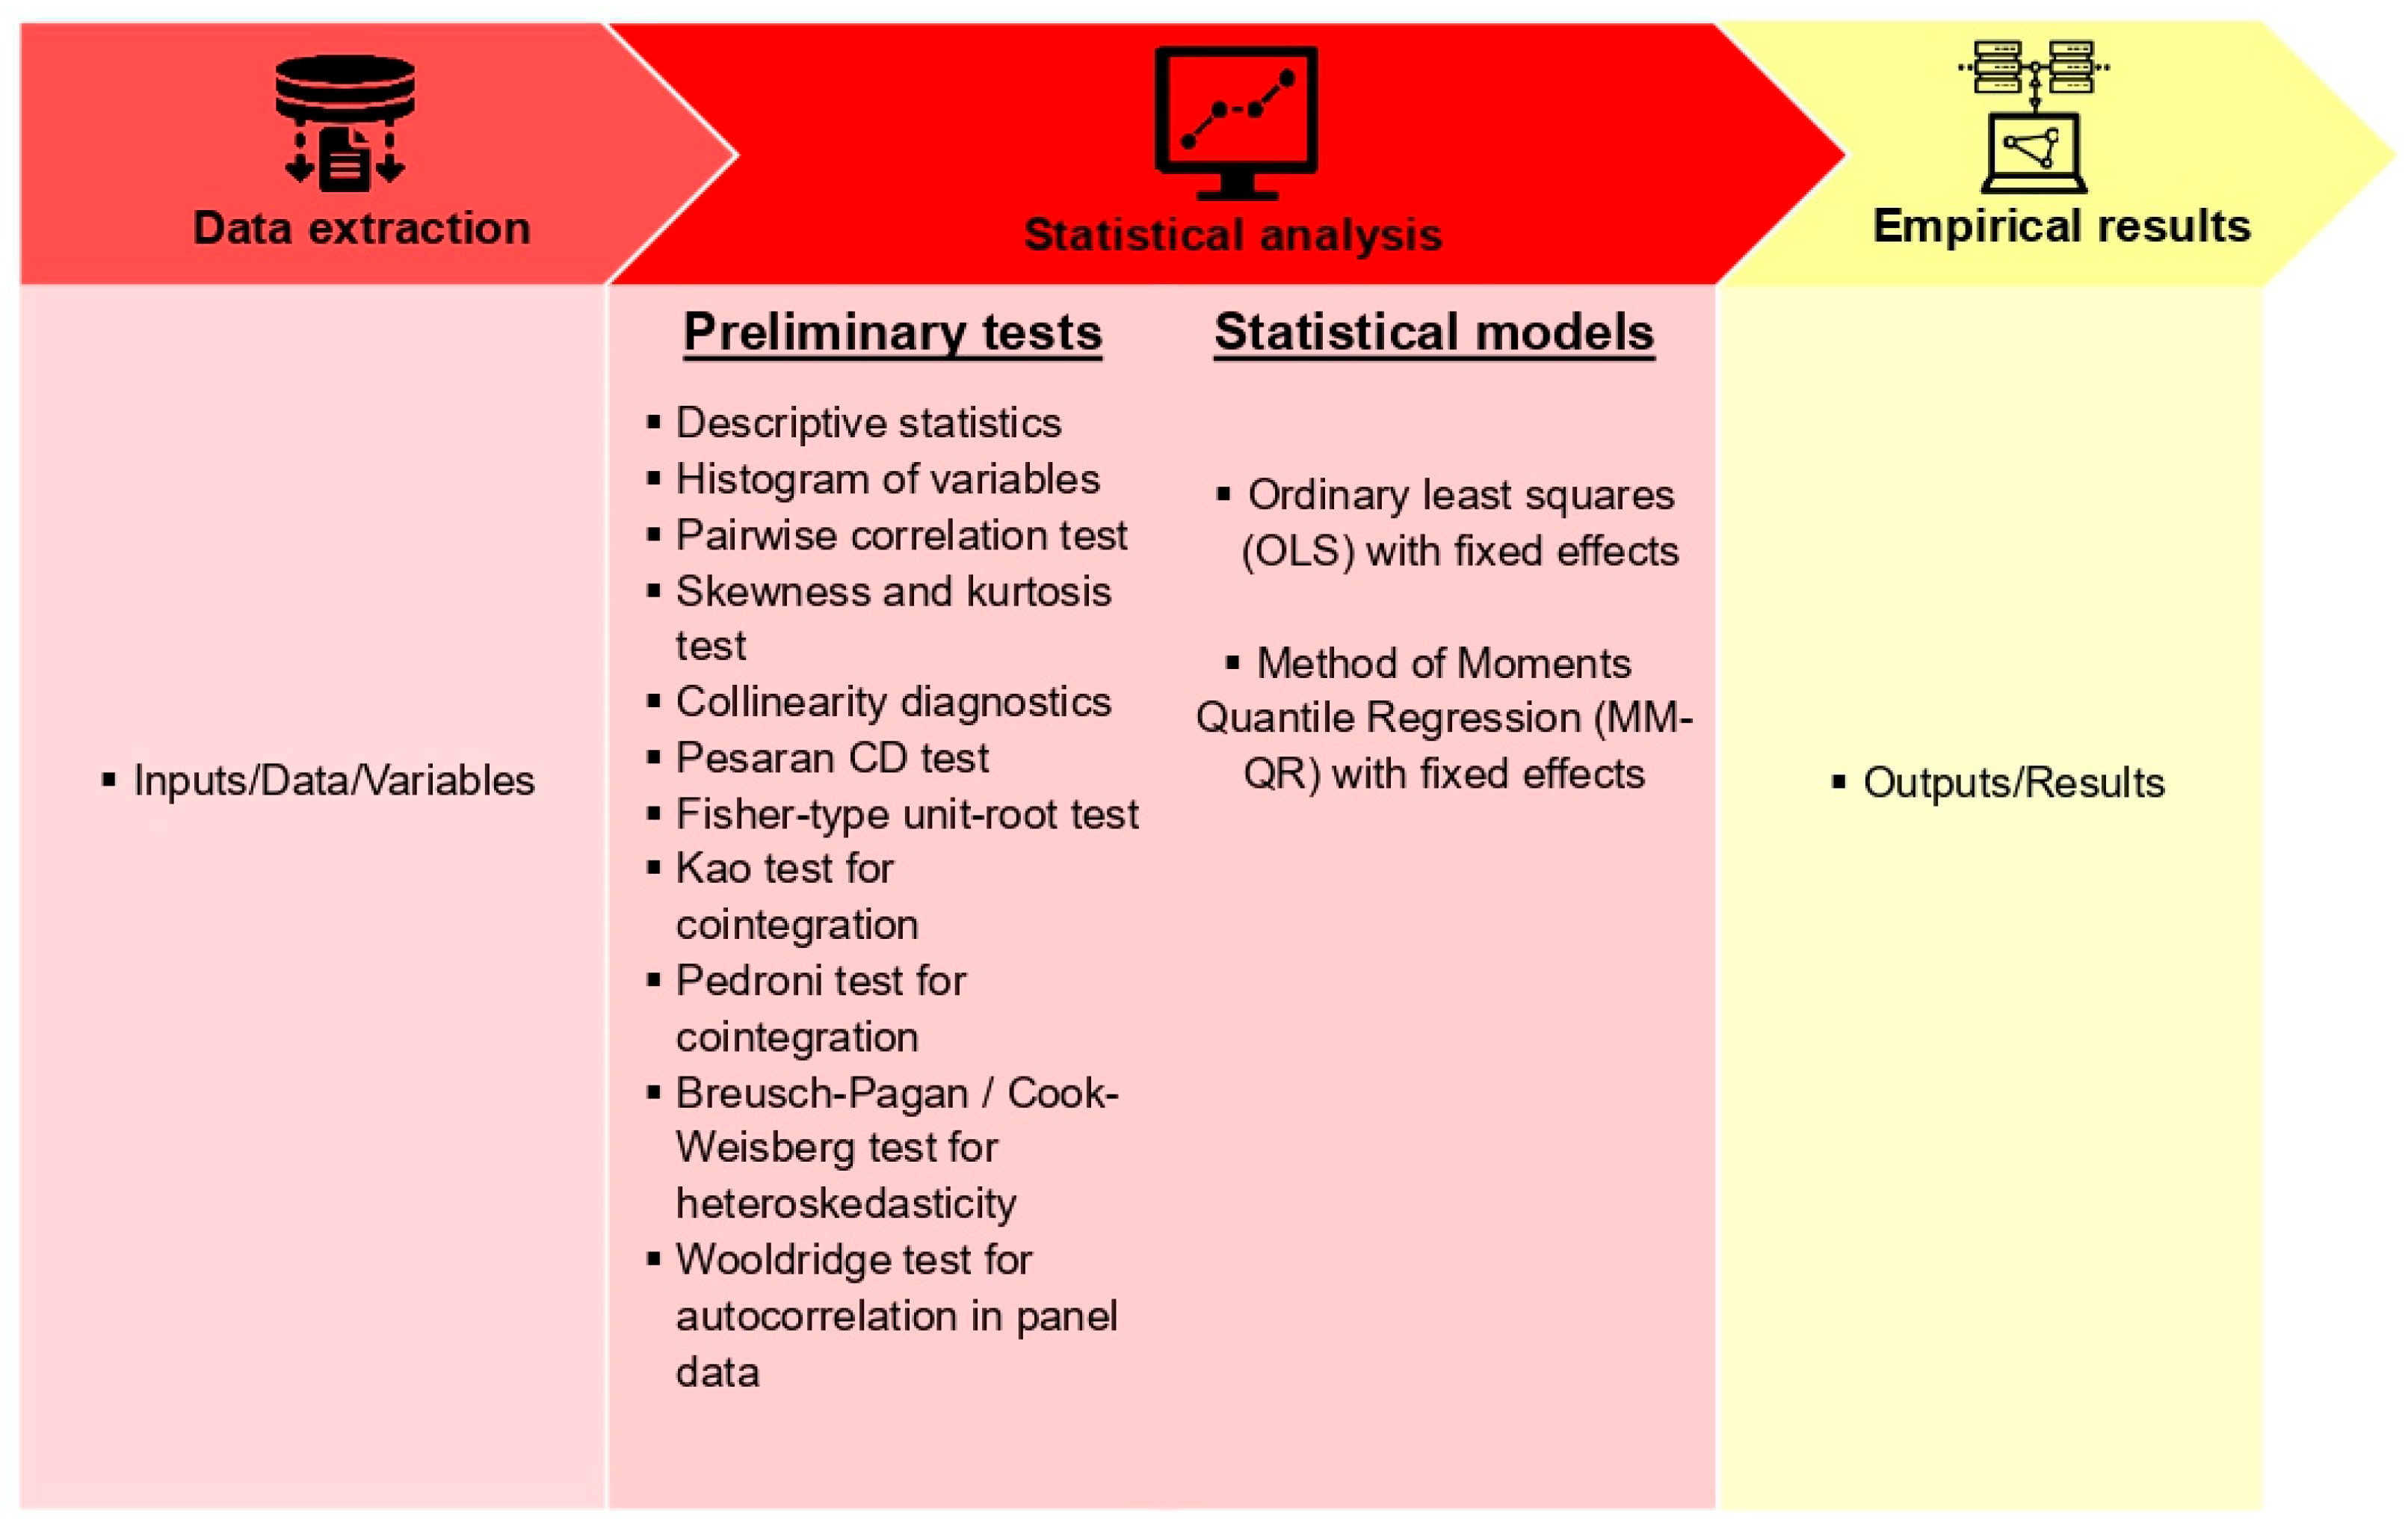
3.2. Method

This section will discuss three crucial aspects of our empirical analysis. First, we will showcase the preliminary tests conducted to evaluate the quality of our data and the assumptions required for our regression models. Second, we will delve into the OLS model regression with fixed effects, which enables us to isolate the impact of independent variables on the dependent variable while accounting for time-invariant individual or group characteristics. Finally, we will introduce the Method of Moments Quantile Regression (MM-QR) with fixed effects, which allows for a more flexible modelling of the conditional distribution of the dependent variable by estimating the conditional quantiles at various levels.

3.2.1. Preliminary Tests

The preliminary tests play a crucial role in determining the suitability of the variables used in the econometric model and in selecting the best model estimator. Therefore, before running the OLS with fixed effects and MM-QR estimators, it is necessary to perform a battery of tests to check for normality, correlation, multicollinearity, heteroscedasticity, and serial correlation. These tests include:
(i)
Descriptive statistics: Provides summary statistics such as mean, standard deviation, minimum, maximum, and quartiles for each variable.
(ii)
Histogram of variables: Displays the distribution of each variable, providing insights into its skewness, kurtosis, and potential outliers.
(iii)
Pairwise Correlation [100]: Measures the strength and direction of the linear relationship between pairs of variables.
(iv)
Skewness and kurtosis test for normality [101]: Tests whether the distribution of each variable is normal or not. The null hypothesis is that the variable is normally distributed.
(v)
Collinearity Diagnostics [102]: Tests for multicollinearity among independent variables. High levels of multicollinearity can cause problems with the estimation and interpretation of coefficients.
(vi)
Pesaran CD test [103]: Tests for cross-sectional dependence in panel data. The null hypothesis is that there is no cross-sectional dependence.
(vii)
Fisher-type unit-root test [104]: Tests for the presence of a unit root in each variable. The null hypothesis is that there is a unit root.
(viii)
Kao test for cointegration [105]: Tests for cointegration between pairs of variables. The null hypothesis is that there is no cointegration.
(ix)
Pedroni test for cointegration [106]: Another cointegration test that allows for cross-sectional dependence. The null hypothesis is that there is no cointegration.
(x)
Breusch-Pagan/Cook-Weisberg test for heteroskedasticity (e.g., [107,108]): Tests for the presence of heteroskedasticity in the error term. The null hypothesis is that there is no heteroskedasticity.
(xi)
Wooldridge test for autocorrelation in panel data [109]: Tests for autocorrelation in the error term. The null hypothesis is that there is no autocorrelation.
These tests are widely used in the econometric literature to ensure the robustness and validity of the model (e.g., [110,111,112]).

3.2.2. The Ordinary Least Squares (OLS)

The OLS (ordinary least squares) model regression with fixed effects is a statistical method used to estimate the relationship between a dependent variable and one or more independent variables while controlling for fixed effects that are constant over time and vary across individuals or groups (e.g., [113,114]). The fixed effects capture the time-invariant heterogeneity of individuals or groups and control for omitted variables that could bias the estimates (e.g., [113,114]). The general equation for the OLS model regression with fixed effects is:
y i t = a i + β 1 x 1 i t + β 2 x 2 i t + + β k x k i t + μ i t
where y i t is the dependent variable for individual i at time t , a i is the individual fixed effect, x 1 i t , x 2 i t ,   k i t are the k independent variables for individual i at time t , β 1 , β k are the corresponding coefficients, and μ i t is the error term.
The OLS model regression with fixed effects is a suitable method to identify the impact of independent variables POLICIES, HOUSES_RECONS, NEW_HOUSES, ECO_HOUSES, and NON_ECO-HOUSES on the dependent variable GDP, as it controls for time-invariant individual or group characteristics that affect both the dependent and independent variables. In the context of the housing sector, the fixed effects could capture the differences in housing policies, construction quality, and environmental regulations across municipalities, regions, or countries. By including these fixed effects, the OLS model regression can isolate the impact of the independent variables on the dependent variable while controlling for unobserved heterogeneity.
The present empirical investigation chose to employ two methods of OLS with fixed effects, namely FE Robust and FE D.-K, to estimate the relationship between the dependent and independent variables. FE Robust is a widely used method. Nevertheless, heteroskedasticity and cross-sectional dependence (spatial dependence or spatial regimes) in the data requires using a more robust estimator such as FE D.-K [115]. The FE D.-K method adjusts for heteroskedasticity and spatial dependence, improving the estimates’ accuracy and reducing the potential for biased results. Therefore, the FE D.-K method is preferred in this investigation to ensure the estimates are reliable and robust.

3.2.3. The Method of Moments Quantile Regression (MM-QR)

The Method of Moments Quantile Regression (MM-QR) with fixed effects is a statistical method used to estimate the relationship between a dependent variable and one or more independent variables while controlling for fixed effects that are constant over time and vary across individuals or groups at different quantiles of the conditional distribution [116]. The MM-QR with fixed effects is an extension of the OLS model regression with fixed effects that allows for a more flexible modelling of the conditional distribution of the dependent variable by estimating the conditional quantiles of the dependent variable at different levels (e.g., [117,118]). The general equation for the MM-QR with fixed effects is:
Q τ y i t = a i + β 1 x 1 i t + β 2 x 2 i t + + β k x k i t + μ i t
where Q τ y i t is the τ-th quantile of the dependent variable y i t for individual i at time t , a i is the individual fixed effect, x 1 i t , x 2 i t ,   k i t are the k independent variables for individual i at time t , β 1 , β k are the corresponding coefficients, and μ i t is the error term.
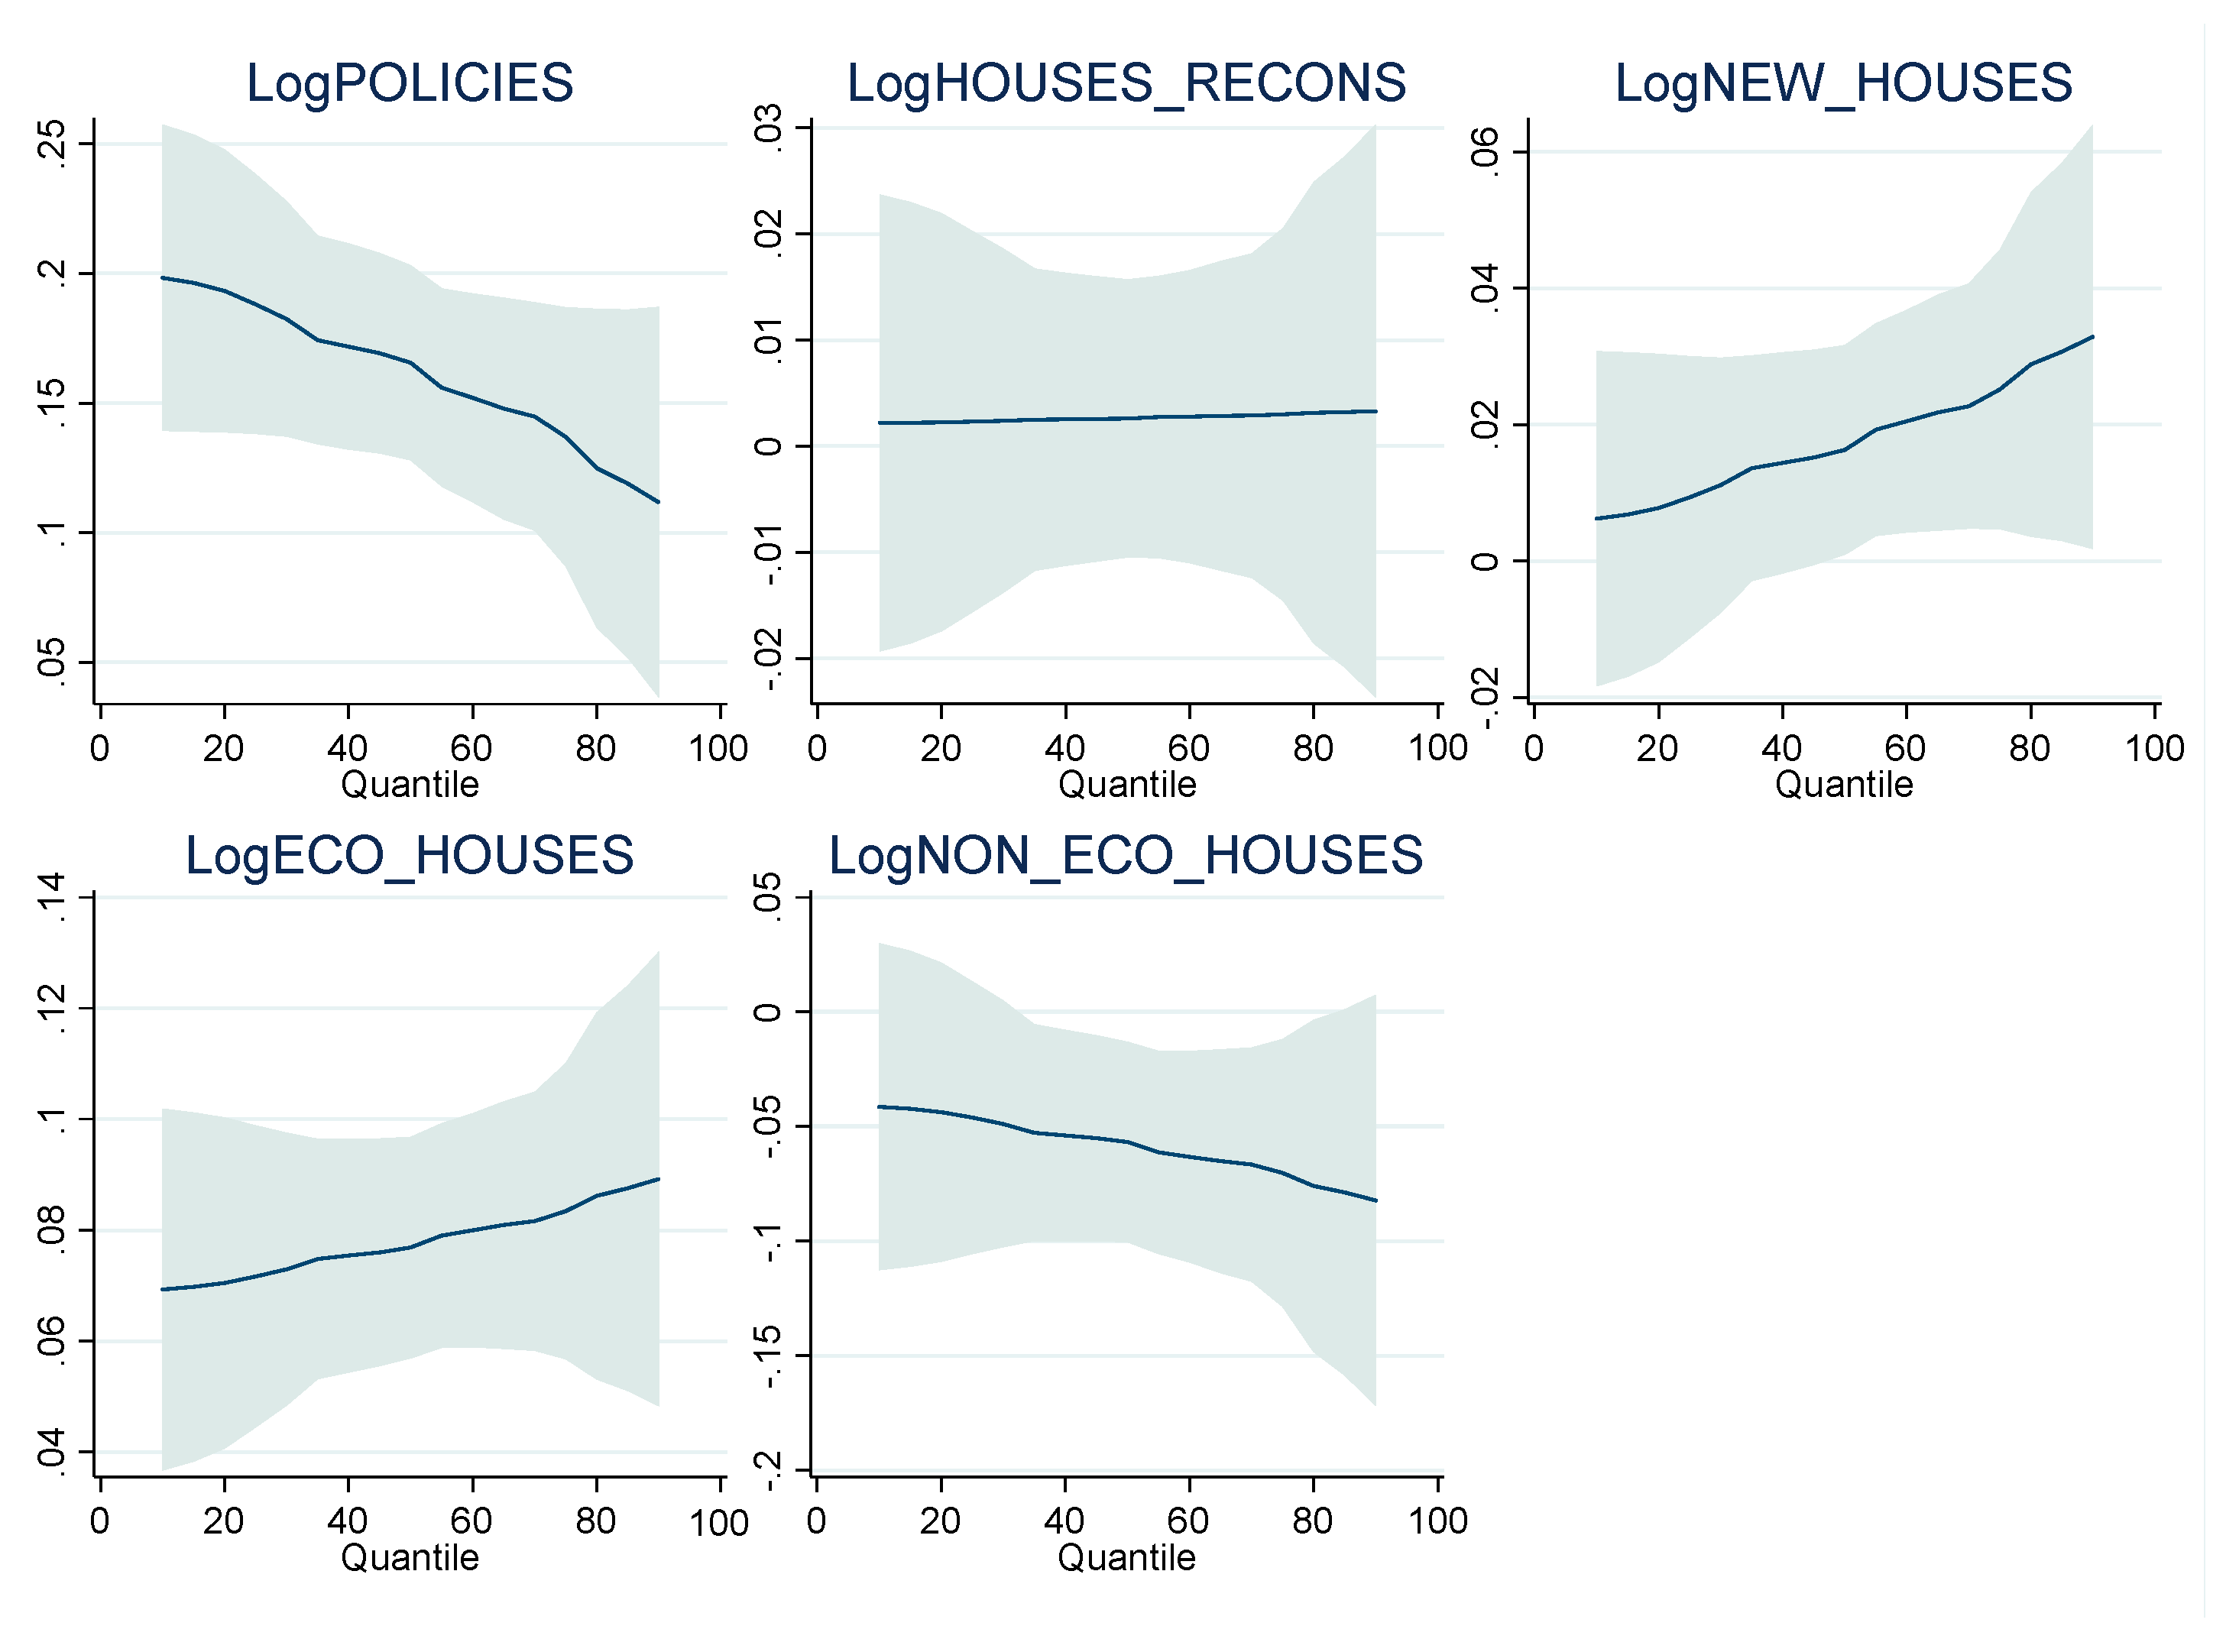
In this investigation, we used the MM-QR with fixed effects to estimate the impact of independent variables POLICIES, HOUSES_RECONS, NEW_HOUSES, ECO_HOUSES, and NON_ECO-HOUSES on the dependent variable GDP at different quantiles of the conditional distribution (25th, 50th, 75th, and 90th). By estimating the conditional quantiles, this investigation can examine whether the effect of the independent variables on GDP varies across different levels of the distribution and whether the fixed effects play a role in shaping the relationship.
Indeed, this is a suitable method for this investigation as it allows for more flexible modelling of the conditional distribution of the dependent variable while controlling for time-invariant individual or group characteristics that affect both the dependent and independent variables. In the context of the housing sector, the MM-QR with fixed effects can provide insights into how different policies and housing types affect different population segments and whether the fixed effects play a role in shaping the impact.
Moreover, the MM-QR with fixed effects is particularly useful in cases where the OLS assumptions may not hold, such as heteroskedasticity, outliers, or non-normal error terms. It also allows for the control of unobserved heterogeneity by including fixed effects. In this investigation, the MM-QR with fixed effects serves as a robustness check to ensure the validity of the OLS results and to provide additional insights into the impact of the independent variables on different parts of the conditional distribution of the dependent variable. Overall, using the MM-QR with fixed effects as a robustness check enhances the rigour and reliability of the analysis.
Indeed, this empirical investigation used the econometric software Stata 17.0. The Stata commands used in this study included sum, histogram, pwcorr, graph matrix, sktest, collin, xtcd, xtunitroot, xtcointtest kao, xtcointtest pedroni, hettest, xtserial, hausman, xtreg, and xtqreg. These commands were used to realize the preliminary tests and the model estimations.

4. Empirical Results

This section presents the empirical results of the investigation. The first step taken in this study was to calculate the preliminary tests, which included the descriptive statistics of the variables under consideration. Table 2 below displays the descriptive statistics of the variables, namely GDP, POLICIES, HOUSES_RECONS, NEW_HOUSES, ECO_HOUSES, and NON_ECO_HOUSES, which are reported in natural logarithms.
As can be seen in Table 2 above, the dependent variable LogGDP has a mean of 15.88212 and a standard deviation of 4.2190, indicating that there is a considerable amount of variability in the data. The minimum and maximum values of LogGDP are 12.9402 and 33.0508, respectively.
Indeed, the independent variable LogPOLICIES has a mean of 1.5566 and a relatively small standard deviation of 0.2269, indicating that the data points are relatively close to the mean. The minimum and maximum values of LogPOLICIES are 1.0986 and 1.7917, respectively. The independent variable LogHOUSES_RECONS has a mean of 0.4024 and a relatively large standard deviation of 0.8003, indicating that the data points are dispersed. The minimum and maximum values of LogHOUSES_RECONS are −0.6668 and 3.5351, respectively. The independent variable LogNEW_HOUSES has a mean of 4.1286 and a standard deviation of 1.1146. The minimum and maximum values of LogNEW_HOUSES are 0.6931 and 6.1793, respectively. The independent variable LogECO_HOUSES has a mean of 6.0022 and a standard deviation of 1.1382. The minimum and maximum values of LogECO_HOUSES are 0.6931 and 8.6864, respectively. Finally, the independent variable LogNON_ECO_HOUSES has a mean of 7.3893 and a standard deviation of 0.9334. The minimum and maximum values of LogNON_ECO_HOUSES are 3.2958 and 9.5672, respectively.
The second step is necessary to calculate the histogram of variables. The resulting histogram can be seen in Figure 6, which visually represents the distribution of the variables.
The histograms reveal insights into the distribution of data for each variable. The dependent variable, LogGDP, is skewed to the left, indicating that there are more observations with larger values of LogGDP and fewer observations with smaller values. The independent variable, LogPOLICIES, is skewed to the right, suggesting that there are more observations with smaller values of LogPOLICIES and fewer observations with larger values. The independent variable, LogHOUSES_RECONS, is also skewed to the left, indicating that there are more observations with larger values of LogHOUSES_RECONS and fewer observations with smaller values.
In contrast, the data for the independent variable, LogNEW_HOUSES, appears to be roughly symmetrical, suggesting that the observations are distributed relatively evenly across the range of values. Similarly, the data for the independent variable, LogECO_HOUSES, also appears to be roughly symmetrical, indicating that the observations are distributed relatively evenly across the range of values. Finally, the data for the independent variable, LogNON_ECO_HOUSES, is also roughly symmetrical, suggesting that the observations are distributed relatively evenly across the range of values.
The third step of this investigation involves calculating the Pairwise Correlation test for all variables included in the model. Table 3 below presents the results of the Pairwise Correlation test.
Table 3 above displays the Pairwise correlation coefficients among the six variables under investigation: LogGDP (A), LogPOLICIES (B), LogHOUSES_RECONS (C), LogNEW_HOUSES (D), LogECO_HOUSES (E), and LogNON_ECO_HOUSES (F). The correlation coefficients are presented in the cells where the two variables intersect. Based on the results presented in this table, the highest correlation coefficient is observed between LogECO_HOUSES and LogNON_ECO_HOUSES, with a coefficient of 0.7445. This result suggests a strong positive correlation between these two variables. Conversely, the correlation coefficient between LogGDP and LogPOLICIES is very low, at 0.0150, indicating a weak positive correlation between these variables. Indeed, the results from the Pairwise correlation matrix above confirm these results.
The fourth step of this investigation involves conducting a Skewness and Kurtosis test to assess the normality of all variables included in the model. The results of the Skewness and Kurtosis test for normality are presented in Table 4 below.
Table 4 above presents the results of skewness and kurtosis tests for normality on six variables (e.g., LogGDP, LogPOLICIES, LogHOUSES_RECONS, LogNEW_HOUSES, LogECO_HOUSES, and LogNON_ECO_HOUSES) with 126 observations. The Skewness test is used to determine if the distribution of a variable is symmetrical or skewed. The table above shows that all variables have skewness values close to 0, indicating their distributions are approximately symmetrical. However, the LogNON_ECO_HOUSES variable has a skewness value of 0.0104, slightly higher than the other variables. The Kurtosis test is used to determine if the distribution of a variable is normal or has heavy tails (leptokurtic) or light tails (platykurtic). The table shows that all variables have kurtosis values close to 0, indicating their distributions are approximately normal. However, the LogPOLICIES variable has a kurtosis value of 12.72, which is higher than the other variables. This finding suggests that the distribution of LogPOLICIES may have heavier tails than the other variables. Overall, the results suggest that the variables in the study are approximately normally distributed. The statistical significance (at the 1% level) of the chi-square test of normality indicates that these distributions are significantly different from normality, but the deviations from normality are likely small.
A collinearity diagnostics test was conducted as the fifth step of this investigation. The results of this test are presented in Table 5 below.
Table 5 above presents the results of the collinearity diagnostics test, which indicate no significant collinearity among the predictor variables. The VIF values range from 1.23 to 3.87, with an average of 1.98, suggesting a moderate correlation among the predictor variables. The square root of the VIF values ranges from 1.11 to 1.97, which further supports this finding. Additionally, the tolerance values range from 0.26 to 0.82, indicating that each predictor variable uniquely contributes to the model. The R-squared values range from 0.26 to 0.82, suggesting that each predictor variable significantly contributes to the model. The condition number is 46.2613, indicating no significant collinearity among the predictor variables. Lastly, the determinant value 0.1576 suggests that the predictor variables are not highly correlated.
As the investigation progresses, the sixth step involves conducting the Pesaran CD test to analyze the data further. The results of this test are presented in Table 6 below, providing important insights for the ongoing research.
The results from Table 6 above indicate the presence of cross-sectional dependent in the variables in the residuals of the panel data regression for most of the variables, indicating that the assumption of cross-sectional independence may not hold. Moreover, for the variable LogHOUSES_RECONS, the CD-test statistic is not reported, which means that the test could not be performed due to missing observations.
The seventh step in the investigation is conducting a panel unit-root test to examine the data further. The results of this analysis are presented in Table 7 below, which displays the outcomes of a Fisher-type unit-root test. These findings will provide valuable information for the research progress.
Based on the results presented in Table 7 above, it can be observed that the variables LogGDP, LogECO_HOUSES, and LogNON_ECO_HOUSES, all measured in natural logarithms, are non-stationary. Similarly, LogPOLICIES and LogNEW_HOUSES show boundary behaviour between I(0) and I(1). On the other hand, the variable LogHOUSES_RECONS is stationary, indicating that it does not exhibit a trend or a unit root. Furthermore, when considering the variables in their first-difference form, the test shows that dLogGDP and dLogPOLICIES are non-stationary, while dLogECO_HOUSES displays boundary behaviour between I(0) and I(1). However, the variables dLogNEW_HOUSES and dLogNON_ECO_HOUSES are stationary, indicating that they do not possess a unit root and are thus time-invariant.
When dealing with non-stationary variables, examining the possibility of cointegration is essential. Therefore, the eighth step of this investigation involves conducting a cointegration test. This test aims to identify any long-term relationships between the variables under analysis. The results from the Kao and Pedroni tests for cointegration are presented in Table 8 below, providing essential insights into the relationship between the variables.
The Kao test for cointegration indicates strong evidence to reject the null hypothesis of no cointegration between the variables at a 1% significance level. The Dickey-Fuller t statistic is −4.7917 (p-value of 0.0000), and the unadjusted Dickey-Fuller t statistic is −7.8173 (p-value of 0.0000). However, cointegration tests provide statistical evidence and should be interpreted with economic reasoning and other empirical evidence. When examining the stationary variables, the Kao test results show that the p-values of all the statistics are below the significance level of 0.05, except for the Modified Dickey-Fuller t statistic. Therefore, there is not enough evidence to conclude that there is cointegration between the variables.
The Pedroni test was also computed to confirm the Kao test results. The results indicate evidence of cointegration between the variables. The Modified Phillips-Perron t statistic is 3.9430 (greater than the critical value for the 5% significance level), and the Phillips-Perron t statistic is 1.9730 (also greater than the critical value at the 5% significance level). However, the Augmented Dickey-Fuller t statistic is −3.0849 (less than the critical value for a 1% significance level), indicating rejection of the null hypothesis of no cointegration. Based on the Pedroni test, it can be concluded that there is evidence of cointegration between the variables, suggesting a long-term relationship and a common trend.
The ninth step of this investigation involves checking for the presence of heteroskedasticity and autocorrelation in panel data. Table 9 displays the results of the Breusch-Pagan/Cook-Weisberg test for heteroskedasticity and the Wooldridge test for autocorrelation in panel data.
The results of the Breusch-Pagan/Cook-Weisberg test for heteroskedasticity, presented in Table 9, indicate that the chi-squared test statistic with one degree of freedom is 80.52, with a p-value of 0.0000. These results provide strong evidence against the null hypothesis of constant variance and suggest the presence of heteroskedasticity in the data. Similarly, the Wooldridge test for autocorrelation in panel data, also reported in Table 9, shows a statistic of F (1,17) = 177.631, with a p-value of 0.0000. These results provide strong evidence against the null hypothesis, indicating the presence of first-order autocorrelation in the panel data.
This investigation’s tenth and final preliminary test examines the presence of fixed and random effects in the econometric model. The results of the Hausman test can be found in Table 10 below.
The results of the Hausman test indicate that the test statistic is 117.60 with a p-value of 0.0000, providing strong evidence against the null hypothesis. As a result, we can conclude that the coefficients in the fixed and random effects models differ significantly. Based on these results, the fixed effects model is preferred over the random effects model.
After completing the preliminary tests, the next step is calculating the regression of OLS with fixed effects and MM-QR with fixed effects. The results of OLS with fixed effects, namely FE Robust and FE D.-K, can be found in Table 11 below. These methods were used to estimate the relationship between the dependent and independent variables. Additionally, Table 11 includes the results of the MM-QR with fixed effects, which serves as a robustness check.
Table 11 presents the regression analysis results using OLS with fixed effects. The analysis indicates that the independent variable LogPOLICIES has a positive impact of 0.1578 on the dependent variable LogGDP. This finding suggests that subsidies, loans, and tax relief can encourage homeowners to invest in energy-efficient technologies, boosting household disposable income and contributing to economic growth. Implementing infrastructure and aid programs can create job opportunities, while monitoring and obligation schemes can improve environmental sustainability and economic competitiveness.
However, the econometric model suggests that the independent variable LogHOUSES_RECONS is statistically insignificant, meaning that this variable does not have a significant impact on the dependent variable. On the other hand, the independent variable LogNEW_HOUSES has a positive impact of 0.0187 on the dependent variable LogGDP. Increasing the number of new constructions can lead to economic benefits, such as job creation and increased demand for construction materials and services. Additionally, new constructions can stimulate economic activity by increasing the housing supply, property values, household disposable income, and consumer spending.
Furthermore, the analysis shows that the independent variable LogECO_HOUSES has a positive impact of 0.0786 on the dependent variable LogGDP. Increasing eco-friendly houses can lead to economic benefits, such as lower energy consumption, reduced carbon emissions, and improved environmental sustainability, contributing to overall economic growth. Additionally, eco-friendly houses may have higher property values, increasing household wealth and disposable income and creating jobs in the energy efficiency and construction industries.
Finally, the independent variable LogNON_ECO_HOUSES has a negative impact of −0.0605 on the dependent variable LogGDP. Increasing the number of non-eco-friendly houses can lead to negative economic effects, such as higher energy consumption, increased carbon emissions, and reduced environmental sustainability, which can hinder overall economic growth. Additionally, non-eco-friendly houses may have lower property values, decreasing household wealth and disposable income and negatively impacting the construction and energy efficiency industries. The graph depicting OLS regression can, with fixed effects, be found in Appendix A.
The robustness check using MM-QR confirms the results from OLS with fixed effects. Specifically, the results in Table 11 indicate that the independent variable LogPOLICIES positively impacts the dependent variable in all quantiles. The independent variable LogHOUSES_RECONS is statistically insignificant in all quantiles, suggesting that this variable does not have a significant impact on the dependent variable. The independent variable LogNEW_HOUSES positively impacts the 50th, 75th, and 90th quantiles, indicating that an increase in the number of new constructions can lead to economic benefits across different income levels. The independent variable LogECO_HOUSES has a positive impact in all quantiles, highlighting the economic benefits of eco-friendly housing. Finally, the independent variable LogNON_ECO_HOUSES negatively impacts all quantiles, indicating the negative economic impact of non-eco-friendly housing. Therefore, the MM-QR results provide additional evidence supporting the robustness of the results from OLS with fixed effects. The graph depicting MM-QR regression can be found in Appendix B.
Indeed, the results of the OLS model regression presented in Table 11 above are succinctly summarized in Figure 7 below.
In the following section, this investigation will discuss the results of the empirical investigation that were obtained.

5. Discussion

This section will present possible explanations for the results that were found. In the literature, several authors (e.g., [119,120,121]) have found a positive impact of national policies for residential energy efficiency on economic growth.
Indeed, this positive impact can occur in several ways. First, these policies can stimulate demand for energy-efficient products and services, creating new markets and business opportunities. This situation can create new jobs, especially in the construction and energy sectors, and attract regional investments [120]. Second, improving energy efficiency in residential buildings can reduce household energy bills, freeing up resources that can be spent on other goods and services. It can increase household disposable income and consumption, which can, in turn, stimulate economic growth through the multiplier effect [119]. Third, energy efficiency policies can reduce greenhouse gas emissions, which can positively impact the environment and human health, leading to productivity gains and lower healthcare costs. Additionally, reducing energy consumption can help to reduce dependence on imported energy, improving energy security and reducing the trade deficit (e.g., [72,121]). Finally, energy efficiency policies can also help improve the quality of housing and reduce energy poverty, which can positively impact social welfare and equality ([119,120]).
The lack of impact of house reconstructions on economic growth in the Lisbon metropolitan municipalities can be explained by several factors. One factor is the high cost of reconstruction, which may not generate enough economic activity to offset the costs. Moreover, the benefits of reconstruction may be concentrated among homeowners and construction firms, while the costs may be spread among a broader population. Additionally, the economic benefits of energy-efficient renovations may be limited by high upfront costs and long payback periods, according to studies by Economidou et al. [122] and Economidou and Bertoldi [123].
Another possible explanation for the lack of impact of house reconstructions on economic growth is that they may not address underlying economic challenges in the region, such as unemployment, income inequality, or inadequate infrastructure. In some cases, investments in house reconstructions may even exacerbate these issues by displacing low-income residents and contributing to gentrification. The European Investment Bank [39] also found that the economic benefits of building renovations may be offset by financing costs, particularly for low-income households.
However, the impact of house reconstruction on economic growth may vary depending on local factors such as the state of the housing market, the availability of financing, and the specific goals of the reconstruction project. Some studies and reports, such as Savills [83], Olga and Antonios [124], and Giang and Pheng [125], have found that house reconstructions can generate significant economic benefits, particularly in areas with high levels of blight and disinvestment. Sustainable and energy-efficient reconstruction projects may also provide long-term economic benefits through reduced energy costs and improved environmental sustainability (e.g., [43,55]).
The positive impact of new houses on economic growth has been found by some authors in the literature (e.g., [79]). One possible explanation for this positive impact is related to the multiplier effect that construction activity can have on the local economy. When new houses are built, they require inputs from various sectors, such as construction materials, labour, and professional services. It generates economic activity and employment opportunities in those sectors, generating additional spending and employment throughout the local economy. New houses can attract residents and businesses, leading to additional economic benefits such as increased consumer spending, job creation, and tax revenue. In addition, new houses may contribute to revitalising blighted areas and increase the overall attractiveness of the region for investment and development [79].
A study by the National Association of Home Builders found that each new house built generates an average of 2.97 jobs for one year and $111,000 in taxes and fees for state and local governments [79]. Additionally, a study by Hoffman [126] found that housing construction significantly contributes to economic growth in metropolitan areas, particularly during periods of economic recovery. The existing literature suggests that green or eco-friendly houses can promote economic growth, as noted by several authors (e.g., [29,127]).
There are several economic explanations for the positive impact of eco-friendly houses or greenhouses on economic growth in the Lisbon metropolitan municipalities. One explanation is that eco-friendly houses can reduce energy consumption, lowering energy costs for homeowners and businesses. This, in turn, can lead to increased disposable income, which can be spent on other goods and services, ultimately stimulating economic growth (e.g., [30,32]). According to a study by the European Environment Agency, the adoption of energy-efficient measures in buildings can result in energy savings of up to 50% and provide significant economic benefits through reduced energy bills and increased economic activity [31].
Additionally, eco-friendly houses may increase property values, attracting investment and development to the area [28]. This idea is also shared by the United Nations Environment Programme (UNEP) [127], where eco-friendly buildings can lead to cost savings for homeowners and businesses and increased property values and rental rates. These economic benefits can contribute to overall economic growth. A study by the University of California, Berkeley found that green-certified buildings had a higher sale price per square foot than non-, green-certified buildings, with the price premium ranging from 3.5% to 1,3% depending on the certification level [33]. This increase in property values can lead to increased property tax revenues for municipalities, which can be used to fund public services and infrastructure.
Moreover, using green technologies in eco-friendly houses can create new business opportunities and jobs, further contributing to economic growth. For example, installing and maintaining solar panels, energy-efficient HVAC systems, and other green technologies require skilled labour, providing opportunities for job creation and economic activity. A report by the International Renewable Energy Agency [128], found that the renewable energy industry employed over 11 million people worldwide in 2018, with the potential for significant job growth in the coming years [128]. This viewpoint is also shared by Singh et al. [34], where eco-friendly buildings can positively impact employee productivity and well-being, leading to economic benefits for businesses. This includes reduced healthcare costs and increased productivity, which can contribute to economic growth. Indeed, according to Wei and Zhang [29] and European Commission [49], eco-friendly buildings can contribute to job creation, increased economic activity in the construction sector, reduced energy costs, and increased property values. These economic benefits can have a positive impact on overall economic growth.
Another possible explanation is that eco-friendly houses may contribute to a more sustainable and resilient local economy. By reducing dependence on fossil fuels and promoting renewable energy sources, eco-friendly houses can help mitigate climate change’s impacts and reduce vulnerability to energy price fluctuations. This can lead to a more stable economic environment conducive to long-term economic growth. A Global Commission on the Economy and Climate (GCEC) study found that investing in low-carbon and sustainable infrastructure could generate $26 trillion in economic benefits worldwide by 2030 [129]. The explanation provided above confirms Hypothesis (1) presented in the introduction, which suggests that eco-friendly or greenhouses/buildings positively impact the economic development of the Lisbon Metropolitan area. Therefore, this further supports the notion that sustainable construction practices can contribute to the growth and prosperity of the region.
Finally, some authors have found that non-friendly or non-greenhouses cause a negative impact on economic growth [49]. Non-friendly or non-greenhouses can have a negative impact on economic growth in the Lisbon metropolitan municipalities due to several economic factors. Firstly, non-green buildings are less energy-efficient, leading to higher energy costs for homeowners and businesses. It can reduce disposable income and limit spending on other goods and services, ultimately dampening economic growth (e.g., [130,131]). This idea is shared by Rosenow et al. [132] and Brounen et al. [133], where the authors found that buildings with poor energy efficiency can result in higher energy costs for homeowners and businesses, reducing disposable income and limiting spending on other goods and services.
Additionally, non-green buildings may negatively impact health and well-being, resulting in increased healthcare costs and reduced employee productivity [34]. Indeed, this point of view is shared by Wyon [134], where the authors found that inefficient buildings and poor indoor air quality can result in increased healthcare costs and reduced worker productivity, negatively impacting economic growth.
Furthermore, non-green buildings may contribute to climate change and associated economic costs, such as increased frequency and severity of natural disasters, which can damage property and infrastructure and disrupt economic activity [49]. The cost of climate change impacts on the economy is projected to be significant, with estimated costs of climate change for the global economy ranging from 2% to 10% of GDP by 2100 [135].

6. Conclusions and Policy Implications

The impact of eco-friendly houses on economic development in 18 municipalities Lisbon metropolitan area was studied using data from 2014 to 2020. The analysis was performed through ordinary least squares with fixed effects that revealed (i) national policies promoting residential energy efficiency have a positive impact on economic development; (ii) policies like subsidies, loans, and tax relief encourage homeowners to invest in energy-efficient technologies, boosting household disposable income and contributing to economic growth; (iii) an increase in the number of new constructions has a positive impact on economic development, leading to job creation and increased demand for construction materials and services; (iv) an increase in the number of eco-friendly houses can result in reduced energy consumption, leading to lower energy costs for homeowners and businesses and ultimately stimulating economic growth; and (v) an increase in the number of non-eco-friendly houses materializes in negative economic growth impacts. Furthermore, the robustness check using the method of moments quantile regression has confirmed the findings from ordinary least squares with fixed effects.

6.1. Policy Implications

Portugal has a huge potential to gain with eco-friendly houses. First, however, policymakers must take advantage of creating a regulatory environment that can allow building new houses to benefit from leaping several stages and taking advantage of the availability of construction-improved technologies.
Given the challenge of financing the massif cost of the energy transition from fossil to renewable energy sources is also vital to improve societies’ energy efficiency to reduce the energy demand. Accordingly, policymakers should exploit the public’s perception of the reduction in energy bills from living in eco-friendly houses to motivate people to bear the initial costs of new buildings and the reconstruction of eco-friendly dwellings.
A factor that policymakers can take advantage of is that less local pollution from using fossil fuels in warming houses increases these locations’ attractiveness and property value. Accordingly, to initiate or stimulate the transformation of traditional to eco-friendly areas, policymakers can carry out rehabilitation work in these areas.
Policymakers should not forget that cities compete between them to attract economic activity. Therefore, the attractiveness of cities is fundamental in their capacity to attract people and grow economic activity. Furthermore, increasing eco-friendly houses makes cities environmentally friendly, a major asset in this attraction.
Lisbon metropolitan area (and Portugal as a whole) has suffered from a persistent property price increase. Consequently, policymakers should be cautious and prepared to handle a possible bursting of the property speculative bubble. Furthermore, given their foremost consequences, policymakers must be cautious with the bursting of property bubbles to protect social, economic, and financial stability, prevent social inequality, and minimize regulatory risks.
Another factor that policymakers should be aware it is the role of immigration in the construction sector. This situation is especially acute in countries like Portugal, where the availability of a young workforce is scarce. Therefore, policymakers ought to create a regulatory framework that aligns immigration with the needs of the construction sector. This approach facilitates macroeconomic stabilization by avoiding sudden variations in the cost of labour.

6.2. Study Limitations

The main limitation of this research’s generalization is that the Lisbon Metropolitan Area cannot be decoupled from the troubled times that resulted in the intervention of the Troika. Indeed, the metropolitan region of the Portuguese capital was subject to several shocks that disturbed the relationships among the variables used in this study.
Another shortcoming is the influence of real estate bubbles on the stability of estimated parameters for future analysis of a post-bubble burst. Consequently, the findings can be conditional on the specificities of the period where the research was done. In the same way, the Portuguese situation, where the level of indebtedness is massive, is a challenging concern because most of the debt is foreign. This situation exposes the Lisbon Metropolitan Area to outside shocks that were impossible to assess with our model. Finally, it is important to acknowledge the limitations of our investigation, particularly regarding the feasibility of conducting a comparative analysis with similar studies in other regions. The existence of a gap in the literature on the specific topic we have examined poses a significant challenge in this regard. Despite our diligent efforts to conduct an extensive literature review, we encountered limited studies that directly explore the impact of green homes on economic development in the context of Lisbon or comparable regions. This scarcity of comparable studies hinders our ability to conduct a comprehensive comparative analysis and directly benchmark our findings against similar investigations conducted elsewhere.
This limitation sheds light on this specific domain’s relatively nascent research landscape. However, we emphasize that our study still holds great value as it fills an essential gap in the literature by providing a detailed analysis of the impact of green homes on economic development in the unique context of the Lisbon Metropolitan Area. We offer valuable insights and contribute to the broader understanding of sustainable urban development by examining the local socioeconomic factors, policy frameworks, and stakeholder perspectives. Although a direct comparative analysis is impossible, our findings provide a foundation for future research. They can serve as a reference for policymakers and practitioners seeking to implement sustainable practices in similar regions.

6.3. Further Research

The logical extension of this research is extending the analysis to how efficiently stimulate the huge Portuguese potential to gain from new dwellings. Indeed, building eco-friendly houses is an essential tool in limiting environmental damage in an era where there is no alternative but to implement it. Consequently, assessing how new dwellings can be accelerated is essential.
The finding that dwellings reconstruction does not impact economic growth is unexpected. Portugal has a stable population that ages quickly. Given that most residential property is traditional, there is a huge potential to gain with dwellings reconstruction if it was identified the reasons that are hampering its contributions to economic growth. In this case, Portugal can benefit from leaping several stages and taking advantage of improved construction technologies.
Another area needing research is the psychological factors’ role in building eco-friendly houses. Assessing them will help cope with the vast energy transition costs and fight climate changes for contemporaneous society.

Author Contributions

M.K.: Conceptualisation, Methodology, Writing e original draft preparation, Supervision, Validation, Data curation, Investigation, Formal analysis, Visualisation. J.A.F.: Reviewing, Editing, and Investigation. F.P.O.: Investigation. U.U.: Investigation. N.M.: Investigation. All authors have read and agreed to the published version of the manuscript.

Funding

UCILeR is an R&D Unit accredited and funded by FCT—Portugal National Agency within the scope of its strategic project: UIDB/04643/2020. CeBER: R&D unit funded by National Funds through FCT—Fundação para a Ciência e a Tecnologia, I.P., project UIDB/05037/2020.

Data Availability Statement

Data is available on request from the corresponding author.

Conflicts of Interest

The authors declare no conflict of interest.

Appendix A

Figure A1. OLS regression with fixed effects.
Energies 16 04855 g0a1

Appendix B

Figure A2. MM-QR regression.
Energies 16 04855 g0a2

References

  1. International Energy Agency (IEA). Buildings. 2022. Available online: https://www.iea.org/reports/buildings (accessed on 5 April 2023).
  2. Hammer, S.; Kamal-Chaoui, L.; Robert, A.; Plouin, M. Cities and Green Growth: A Conceptual Framework. OECD Regional Development Working Papers, 8. 2011. Available online: http://dl.ueb.vnu.edu.vn/handle/1247/11925 (accessed on 5 April 2023).
  3. Brown, M.A.; Southworth, F. Mitigating Climate Change through Green Buildings and Smart Growth. Environ. Plan A 2008, 40, 653–675. [Google Scholar] [CrossRef] [Green Version]
  4. Li, D.H.; Yang, L.; Lam, J.C. Zero energy buildings and sustainable development implications—A review. Energy 2013, 54, 1–10. [Google Scholar] [CrossRef]
  5. Darko, A.; Chan, A.P. Review of barriers to green building adoption. Sustain. Dev. 2017, 25, 167–179. [Google Scholar] [CrossRef]
  6. European Commission. Energy Efficiency in Buildings. 2020. Available online: https://commission.europa.eu/news/focus-energy-efficiency-buildings-2020-02-17_en (accessed on 5 April 2023).
  7. Teng, J.; Mu, X.; Wang, W.; Xu, C.; Liu, W. Strategies for sustainable development of green buildings. Sustain. Cities Soc. 2019, 44, 215–226. [Google Scholar] [CrossRef]
  8. European Climate Foundation. Building Europe’s Net-Zero Future: Why the Transition to Energy Efficient and Electrified Buildings Strengthens Europe’s Economy. 2022. Available online: https://europeanclimate.org/wp-content/uploads/2022/03/ecf-building-emissions-problem-march2022.pdf (accessed on 4 April 2023).
  9. Barbosa, R.; Vicente, R.; Santos, R. Climate Change and Thermal Comfort in Southern Europe Housing: A Case Study from Lisbon. Build. Environ. 2015, 92, 440–451. [Google Scholar] [CrossRef]
  10. Kruit, K. Zero Carbon Buildings 2050—Background Report. 2020. European Climate Foundation. Netherlands. 2020. Available online: https://policycommons.net/artifacts/2673458/zero-carbon-buildings-2050/3696526/ (accessed on 7 April 2023).
  11. Koengkan, M.; Fuinhas, J.A.; Osmani, F.; Kazemzadeh, E.; Auza, A.; Alavijeh, N.K.; Teixeira, M. Do financial and fiscal incentive policies increase the energy efficiency ratings in residential properties? A piece of empirical evidence from Portugal. Energy 2022, 241, 122895. [Google Scholar] [CrossRef]
  12. Koengkan, M.; Fuinhas, J.A.; Auza, A.; Ursavas, U. The Impact of Energy Efficiency Regulations on Energy Poverty in Residential Dwellings in the Lisbon Metropolitan Area: An Empirical Investigation. Sustainability 2023, 15, 4214. [Google Scholar] [CrossRef]
  13. Matos, A.M.; Delgado, J.M.P.Q.; Guimarães, A.S. Linking Energy Poverty with Thermal Building Regulations and Energy Efficiency Policies in Portugal. Energies 2022, 15, 329. [Google Scholar] [CrossRef]
  14. Koengkan, M.; Fuinhas, J.A.; Radulescu, M.; Kazemzadeh, E.; Alavijeh, N.K.; Santiago, R.; Teixeira, M. Assessing the Role of Financial Incentives in Promoting Eco-Friendly Houses in the Lisbon Metropolitan Area—Portugal. Energies 2023, 16, 1839. [Google Scholar] [CrossRef]
  15. Fuinhas, J.A.; Koengkan, M.; Silva, N.; Kazemzadeh, E.; Auza, A.; Santiago, R.; Teixeira, M.; Osmani, F. The Impact of Energy Policies on the Energy Efficiency Performance of Residential Properties in Portugal. Energies 2022, 15, 802. [Google Scholar] [CrossRef]
  16. Gouveia, J.P.; Palma, P. Energy Efficiency of the Housing Stock in Portugal, EP-Pedia, ENGAGER COST Action. 2021. Available online: https://www.eppedia.eu/article/energy-efficiency-housing-stock-portugal (accessed on 10 January 2023).
  17. Magalhães, S.A.; De Freitas, V.P. A complementary approach for energy efficiency and comfort evaluation of renovated dwellings in Southern Europe. Energy Procedia 2017, 132, 909–914. [Google Scholar] [CrossRef]
  18. Odyssee-Mure. Energy Profile: Portugal. 2021. Available online: https://www.odyssee-mure.eu/publications/efficiency-trendspoliciesprofiles/portugal.html (accessed on 3 April 2023).
  19. Kose, T. Energy poverty and health: The Turkish case. Energy Sources Part B Econ. Plan. Policy 2019, 14, 201–213. [Google Scholar] [CrossRef]
  20. Wang, B.; Luo, L.; Wang, F. Research on the Incremental Cost and Benefit of Green Building Based on the Whole Life Cycle. IOP Conf. Ser. Earth Environ. Sci. 2020, 580, 012015. [Google Scholar] [CrossRef]
  21. Van Praag, B.M.; Frijters, P.; Ferrer-i-Carbonell, A. The anatomy of subjective well-being. J. Econ. Behav. Organ. 2003, 51, 29–49. [Google Scholar] [CrossRef] [Green Version]
  22. Van Praag, B.; Ferrer-i-Carbonell, A. Happiness Quantified: A Satisfaction Calculus Approach; OUP: Oxford, UK, 2007. [Google Scholar]
  23. Van Praag, B.; Ferrer-i-Carbonell, A. Towards an Urban Quality of Life Index: Basic theory and econometric methods. In The Quality of Life in Latin American Cities: Markets and Perception; Inter-American Development Bank: Washington, DC, USA, 2010; pp. 65–90. [Google Scholar]
  24. MERCER. Quality of Living: Evaluating Assignment Locations. 2020. Available online: https://mobilityexchange.mercer.com/Portals/0/Content/PDF/qol-2020-evaluating-assignment-locations.pdf (accessed on 14 June 2023).
  25. Akbari, H.; Konopacki, S.; Pomerantz, M. Cooling energy savings potential of reflective roofs for residential and commercial buildings in the United States. Energy 1999, 24, 391–407. [Google Scholar] [CrossRef]
  26. Castleton, H.F.; Stovin, V.; Beck, S.B.; Davison, J.B. Green roofs; building energy savings and the potential for retrofit. Energy Build. 2010, 42, 1582–1591. [Google Scholar] [CrossRef]
  27. International Renewable Energy Agency (IEA). Multiple Benefits of Energy Efficiency: Household Savings. 2023. Available online: https://www.iea.org/reports/multiple-benefits-of-energy-efficiency/household-savings (accessed on 25 March 2023).
  28. Angrisani, G.; Bianco, V. Green Buildings and Real Estate Market Value: An Overview. Sustainability 2020, 12, 9496. [Google Scholar]
  29. Wei, X.; Zhang, Y. How do green buildings impact economic growth in China? A panel data analysis. J. Clean. Prod. 2019, 239, 118021. [Google Scholar]
  30. Ugarte, S.; Ree, V.D.B.; Voogt, M.; Eichhammer, W.; Ordoñez, J.A.; Reuter, M.; Schlomann, B.; LLoret, P.; Villafáfila, R. Energy Efficiency for Low-Income Households. Policy Department A: Economic and Scientific Policy. European Parliament. 2016. Available online: https://www.europarl.europa.eu/RegData/etudes/STUD/2016/595339/IPOL_STU(2016)595339_EN.pdf (accessed on 25 March 2023).
  31. Eurofund. Inadequate Housing in Europe: Costs and Consequences. 2016. Available online: https://www.eurofound.europa.eu/sites/default/files/ef_publication/field_ef_document/ef1604en_0.pdf (accessed on 30 April 2023).
  32. Young, R.; Hayes, S.; Nadel, S.; Herndon, G.; Barrett, J. Economic Impacts of the Energy Efficiency Provisions in the Energy Savings & Industrial Competitiveness Act of 2013 and Select Amendments. ACEEE. 2013. Available online: https://www.aceee.org/sites/default/files/pdf/white-paper/shaheen-portman-2013.pdf (accessed on 25 March 2023).
  33. Eichholtz, P.; Kok, N.; Quigley, J. Doing Well by Doing Good? Green Office Buildings. Am. Econ. Rev. 2010, 100, 2492–2509. [Google Scholar] [CrossRef] [Green Version]
  34. Singh, A.; Syal, M.; Grady, S.C.; Korkmaz, S. Effects of Green Buildings on Employee Health and Productivity. Am. J. Public Health 2010, 100, 1665–1668. [Google Scholar] [CrossRef]
  35. Torcellini, P.; Pless, S.; Deru, M.; Griffith, B.; Long, N.; Judkoff, R. Lessons Learned from Case Studies of Six High-Performance Buildings; No. NREL/TP-550-3754; National Renewable Energy Lab. (NREL): Golden, CO, USA, 2006. [Google Scholar]
  36. Ries, R.; Bilec, M.M.; Gokhan, N.M.; Needy, K.L. The economic benefits of green buildings: A comprehensive case study. Eng. Econ. 2006, 51, 259–295. [Google Scholar] [CrossRef]
  37. Balaban, O.; de Oliveira, J.A.P. Sustainable buildings for healthier cities: Assessing the co-benefits of green buildings in Japan. J. Clean. Prod. 2017, 163, S68–S78. [Google Scholar] [CrossRef]
  38. Dwaikat, L.N.; Ali, K.N. The economic benefits of a green building–Evidence from Malaysia. J. Build. Eng. 2018, 18, 448–453. [Google Scholar] [CrossRef]
  39. European Investment Bank. The Economic Appraisal of Investment Projects at the EIB, 2nd ed.; European Investment Bank: Luxembourg, 2023; pp. 1–236. Available online: https://www.eib.org/attachments/lucalli/20220169_economic_appraisal_of_investment_projects_en.pdf (accessed on 25 March 2023).
  40. United Nations Environment Programme (UNEP). Global Status Report for Buildings and Construction (Buildings-GSR). 2022. Available online: https://www.unep.org/resources/publication/2022-global-status-report-buildings-and-construction (accessed on 17 April 2023).
  41. Energy Efficiency Financial Institutions Group (EEFIG). Multiple Benefits of Energy Efficiency Investments for Financial Institutions. 2022. Available online: https://op.europa.eu/en/publication-detail/-/publication/d30ea98d-03e9-11ed-acce-01aa75ed71a1/language-en (accessed on 22 April 2023).
  42. World Green Building Council (WGBC). Beyond the Business Case. Why You Can’t Afford to Invest in a Sustainable Built Environment. 2021. Available online: https://worldgbc.org/wp-content/uploads/2022/08/WorldGBC-Beyond-the-Business-Case.pdf (accessed on 18 April 2023).
  43. USGBC. Benefits of Green Building. 2023. Available online: https://www.usgbc.org/press/benefits-of-green-building#:~:text=Operating%20cost%20savings%2C%20shorter%20payback,greater%20increase%20in%20asset%20value (accessed on 25 March 2023).
  44. European Construction Sector Observatory. Renovating the Building Envelope—Quo vadis? Trend Paper Series. 2021. Available online: https://single-market-economy.ec.europa.eu/document/download/a184e840-bd0e-433a-800c-beb6e8e762b8_en (accessed on 27 April 2023).
  45. International Energy Agency (IEA). Net Zero by 2050. A Roadmap for the Global Energy System, 3rd ed.; IEA: Paris, France, 2021; Available online: https://iea.blob.core.windows.net/assets/beceb956-0dcf-4d73-89fe-1310e3046d68/NetZeroby2050-ARoadmapfortheGlobalEnergySector_CORR.pdf (accessed on 15 August 2021).
  46. Ferrantelli, A.; Kurnitski, J. Energy Performance Certificate Classes Rating Methods Tested with Data: How Does the Application of Minimum Energy Performance Standards to Worst-Performing Buildings Affect Renovation Rates, Costs, Emissions, Energy Consumption? Energies 2022, 15, 7552. [Google Scholar] [CrossRef]
  47. Amiri, A.; Emami, N.; Ottelin, J.; Sorvari, J.; Martins, B.; Heinonen, J.; Junnila, S. Embodied emissions of buildings—A forgotten factor in green building certificates. Energy Build. 2021, 241, 110962. [Google Scholar] [CrossRef]
  48. Röck, M.; Saade, M.; Balouktsi, M.; Rasmussen, F.; Birgisdottir, H.; Frischknecht, R.; Habert, G.; Lützkendorf, T.; Passer, A. Embodied GHG emissions of buildings—The hidden challenge for effective climate change mitigation. Appl. Energy 2020, 258, 114107. [Google Scholar] [CrossRef]
  49. European Commission. A Renovation Wave for Europe—Greening Our Buildings, Creating Jobs, Improving Lives. 2020. Available online: https://eur-lex.europa.eu/legal-content/EN/TXT/?uri=CELEX%3A52020DC0662 (accessed on 20 April 2023).
  50. Karlsson, I.; Rootzén, J.; Johnsson, F.; Erlandsson, M. Achieving net-zero carbon emissions in construction supply chains—A multidimensional analysis of residential building systems. Dev. Built Environ. 2021, 8, 100059. [Google Scholar] [CrossRef]
  51. International Finance Corporation (IFC). Green Buildings. A Finance and Policy Blueprint for Emerging Markets. 2019. Available online: https://www.ifc.org/wps/wcm/connect/a6e06449-0819-4814-8e75-903d4f564731/59988-IFC-GreenBuildings-report_FINAL_1-30-20.pdf?MOD=AJPERES&CVID=m.TZbMU (accessed on 15 April 2023).
  52. Payne, J.E. A survey of the electricity consumption-growth literature. Appl. Energy 2010, 87, 723–731. [Google Scholar] [CrossRef]
  53. Apergis, N.; Payne, J. A dynamic panel study of economic development and the electricity consumption-growth nexus. Energy Econ. 2011, 33, 770–781. [Google Scholar] [CrossRef]
  54. Alola, A.; Adebayo, T.; Olanipekun, I. Examining the Energy Efficiency and Economic Growth Potential in the World Energy Trilemma Countries. Energies 2023, 16, 2036. [Google Scholar] [CrossRef]
  55. ACEEE. New Report Showcases the Far-Reaching Benefits of Energy: Compiled Data Points to Cost-Saving, Emissions-Reducing Improvements. 2022. Available online: https://www.aceee.org/press-release/2022/12/new-report-showcases-far-reaching-benefits-energy-efficiency (accessed on 25 March 2023).
  56. Cambridge Econometrics. 2030 EU Energy Efficiency Target: Multiple Benefits of Higher Ambition. 2022. Available online: https://energycoalition.eu/wp-content/uploads/2021/03/The-2030-EU-energy-efficiency-target_The-multiple-benefits-of-higher-ambition.pdf (accessed on 15 April 2023).
  57. Pollitt, H.; Alexandri, E.; Anagnostopoulos, F.; De Rose, A.; Farhangi, C.; Hoste, T.; Markkanen, S.; Theillard, P.; Vergez, C.; Voogt, M. The Macro-Level and Sectoral Impacts of Energy Efficiency Policies. Final Report Prepared for the European Commission. 2017. Available online: https://energy.ec.europa.eu/system/files/2017-07/the_macro-level_and_sectoral_impacts_of_energy_efficiency_policies_0.pdf (accessed on 15 April 2023).
  58. Sener, S.; Karakas, A.T. The effect of economic growth on energy efficiency: Evidence from high, upper-middle and lower-middle income countries. Procedia Comput. Sci. 2019, 158, 523–532. [Google Scholar] [CrossRef]
  59. Rajbhandari, A.; Zhang, F. Does energy efficiency promote economic growth? Evidence from a multicountry and multisectoral panel dataset. Energy Econ. 2018, 69, 128–139. [Google Scholar] [CrossRef] [Green Version]
  60. Marques, A.C.; Fuinhas, J.A.; Tomás, C. Energy efficiency and sustainable growth in industrial sectors in European Union countries: A nonlinear ARDL approach. J. Clean. Prod. 2019, 239, 118045. [Google Scholar] [CrossRef]
  61. Mashhadi Rajabi, M. Dilemmas of energy efficiency: A systematic review of the rebound effect and attempts to curb energy consumption. Energy Res. Soc. Sci. 2022, 89, 102661. [Google Scholar] [CrossRef]
  62. Freire-González, J.; Ho, M.S. Policy strategies to tackle rebound effects: A comparative analysis. Ecol. Econ. 2022, 193, 107332. [Google Scholar] [CrossRef]
  63. Vivanco, D.F.; Freire-González, J.; Galvin, R.; Santarius, T.; Walnum, H.J.; Makov, T.; Sala, S. Rebound effect and sustainability science: A review. J. Ind. Ecol. 2022, 26, 1543–1563. [Google Scholar] [CrossRef]
  64. Zhao, W.; Peng, P.; Guo, B.; Deng, X.; Wu, W. Comprehensive Social Cultural and Economic Benefits of Green Buildings Based on Improved AHP–FCE Method. Buildings 2023, 13, 311. [Google Scholar] [CrossRef]
  65. Health and Environmental Alliance. Healthy Buildings, Healthier People. 2018. Available online: https://www.env-health.org/wp-content/uploads/2018/05/Healthy-Buildings-Briefing.pdf (accessed on 30 April 2023).
  66. Liddell, C.; Morris, C. Fuel poverty and human health: A review of recent evidence. Energy Policy 2010, 38, 2987–2997. [Google Scholar] [CrossRef]
  67. Thomson, H.; Thomas, S.; Sellstrom, E.; Petticrew, M. Housing improvements for health and associated socio-economic outcomes. Cochrane Database Syst. Rev. 2013, 2, CD008657. [Google Scholar] [CrossRef] [Green Version]
  68. Fisk, W. Health and Productivity Gains from Better Indoor Environments and their Relationship with Building Energy Efficiency. Annu. Rev. Energy Environ. 2000, 25, 537–566. [Google Scholar] [CrossRef] [Green Version]
  69. Leskinen, N.; Vimpari, J.; Junnila, S. A Review of the Impact of Green Building Certification on the Cash Flows and Values of Commercial Properties. Sustainability 2020, 12, 2729. [Google Scholar] [CrossRef] [Green Version]
  70. Matisoff, D.; Noonan, D.; Flowers, M. Policy Monitor—Green Buildings: Economics and Policies. Rev. Environ. Econ. Policy 2016, 10, 329–346. [Google Scholar] [CrossRef] [Green Version]
  71. Koengkan, M.; Fuinhas, J.A. Heterogeneous Effect of “Eco-Friendly” Dwellings on Transaction Prices in Real Estate Market in Portugal. Energies 2022, 15, 6784. [Google Scholar] [CrossRef]
  72. International Renewable Energy Agency (IEA). Energy Efficiency. 2019. Available online: https://www.iea.org/reports/energy-efficiency-2019 (accessed on 30 March 2023).
  73. Garrett-Peltier, H. Green versus brown: Comparing the employment impacts of energy efficiency, renewable energy, and fossil fuels using an input-output model. Econ. Model. 2017, 61, 439–447. [Google Scholar] [CrossRef]
  74. Pollin, R.; Heintz, J.; Garrett-Peltier, H. The Economic Benefits of Investing in Clean Energy. How the Economic Stimulus Program and New Legislation can Boost U.S. Economic Growth and Employment. 2009. Available online: http://www.peri.umass.edu/fileadmin/pdf/other_publication_types/green_economics/economic_benefits/economic_benefits.PDF (accessed on 28 April 2023).
  75. Bertoldi, P.; Rezessy, S. Energy Service Companies in Europe. Status Report; Publications Office of the European Union: Luxembourg, 2005; ISBN 92-894-9424-7. [Google Scholar]
  76. Noailly, J. Improving the Energy Efficiency of Buildings: The Impact of Environmental Policy on Technological Innovation. Energy Econ. 2012, 34, 795–806. [Google Scholar] [CrossRef] [Green Version]
  77. Cai, G.; Zhang, M.; Zhang, X.; Xi, H.; Chen, Z.; Liu, C.; Liu, K.; Liu, K.; Xu, S.; Yu, Z. Promoting Green Buildings and Low-Carbon Design Strategies of Green B&B Rooms for Sustainable Tourism after COVID-19. Land 2023, 12, 633. [Google Scholar] [CrossRef]
  78. International Labour Organization (ILO). Employment and Social Outlook 2018: Greening with Jobs. 2018. Available online: https://www.ilo.org/wcmsp5/groups/public/---dgreports/---dcomm/---publ/documents/publication/wcms_628654.pdf (accessed on 27 April 2023).
  79. National Association of Home Builders. The Impact of Home Building in the United States and the Economic Benefits of Housing. 2015. Available online: https://www.nahb.org/-/media/NAHB/research/docs/The-Impact-of-Home-Building-in-the-US-Economy-Full-Report.ashx?la=en&hash=2D9E3C3A3C7D138F57A470CB8DE97AE4DA2A4184 (accessed on 30 March 2023).
  80. Instituto dos Mercados Públicos, do Imobiliário e da Construção (IMPIC). Relatório do Setor da Construção em Portugal. 2021. Available online: https://www.impic.pt/impic/assets/misc/relatorios_dados_estatisticos/RelConst_2021_S2.pdf (accessed on 26 April 2023).
  81. BPStat. Análise do Setor da Construção. 2022. Available online: https://bpstat.bportugal.pt/conteudos/publicacoes/1304 (accessed on 26 April 2023).
  82. EUROSTAT. Housing in Europe—2022 Interactive Edition. 2022. Available online: https://ec.europa.eu/eurostat/cache/digpub/housing/bloc-3a.html?lang=en (accessed on 27 April 2023).
  83. Savills. The Case for Housing: Impact of House Building on the UK Economy. 2010. Available online: https://pdf.euro.savills.co.uk/uk/market-insights/the-case-for-housing---spring-2010.pdf (accessed on 25 March 2023).
  84. Cambridge Econometrics. Building the Future: Economic and Fiscal Impacts of Making Homes Energy Efficient. 2014. Available online: https://www.locarla.com/pdf/Building-the-Future-Final-report_October-2014_ISSUED.pdf (accessed on 16 April 2023).
  85. Allen, J.; Potiowsky. Portland’s Green Building Cluster Economic Trends and Impacts. Econ. Dev. Q. 2008, 22, 303–315. [Google Scholar] [CrossRef] [Green Version]
  86. Choi, J.; Morrison, D.; Hallinan, K.; Brecha, R. Economic and environmental impacts of community-based residential building energy efficiency investment. Energy 2014, 78, 877–886. [Google Scholar] [CrossRef]
  87. International Renewable Energy Agency (IEA). Capturing the Multiple Benefits of Energy Efficiency. 2014. Available online: https://www.iea.org/reports/capturing-the-multiple-benefits-of-energy-efficiency (accessed on 30 March 2023).
  88. Fortune Business Insights. Energy Retrofit Systems Market. 2022. Available online: https://www.fortunebusinessinsights.com/energy-retrofit-systems-market-106331 (accessed on 16 April 2023).
  89. Kerr, N.; Winskel, M. Household investment in home energy retrofit: A review of the evidence on effective public policy design for privately owned homes. Renew. Sustain. Energy Rev. 2020, 123, 109778. [Google Scholar] [CrossRef]
  90. MapChart. Europe. 2023. Available online: https://www.mapchart.net/europe.html (accessed on 25 March 2023).
  91. INE. Produto Interno Bruto por Habitante em PPC (UE27)(Base 2016—€) por Localização Geográfica (NUTS-2013) e Tipologia urbano-Rural (Eurostat); Anual. 2023. Available online: https://www.ine.pt/xportal/xmain?xpid=INE&xpgid=ine_indicadores&indOcorrCod=0011190&contexto=bd&selTab=tab2 (accessed on 30 March 2023).
  92. SCE. Certificados Energéticos. 2023. Available online: https://www.sce.pt/estatisticas/ (accessed on 25 March 2023).
  93. Alves, V. Imobiliário Atingiu Valores Recorde em 2017. Dinheiro Vivo. 2018. Available online: https://www.dinheirovivo.pt/economia/imobiliario-atingiu-valores-recorde-em-2017-12817850.html (accessed on 28 March 2023).
  94. INE. Completed Dwellings (No.) in New Constructions for Family Housing by Geographic Localisation (NUTS-2013) and Dwelling Typology Annual (2). 2023. Available online: https://www.ine.pt/xportal/xmain?xpid=INE&xpgid=ine_indicadores&indOcorrCod=0008321&selTab=tab0&xlang=en (accessed on 30 March 2023).
  95. INE. Completed Reconstructions per 100 Completed New Constructions (No.) by Geographic Localization (NUTS-2013); Annual (2). 2023. Available online: https://www.ine.pt/xportal/xmain?xpid=INE&xpgid=ine_indicadores&indOcorrCod=0008327&contexto=bd&selTab=tab2 (accessed on 30 March 2023).
  96. PORDATA. Taxa de Crescimento Real do PIB. 2023. Available online: https://www.pordata.pt/portugal/taxa+de+crescimento+real+do+pib-2298 (accessed on 25 March 2023).
  97. PORDATA. Credit Agreement for the Purchase, Construction and Work on Permanent or Secondary Dwellings or Dwellings for Rent, as well as for the Purchase of Land for the Construction of Owner-Occupied Dwellings. 2023. Available online: https://www.pordata.pt/DB/Municipios/Ambiente+de+Consulta/Tabela/5823436 (accessed on 25 March 2023).
  98. PORDATA. Taxas de Juro sobre Novas Operações de Empréstimos (Média Anual) a Particulares: Total e por Tipo de Finalidade. 2023. Available online: https://www.pordata.pt/portugal/taxas+de+juro+sobre+novas+operacoes+de+emprestimos+(media+anual)+a+particulares+total+e+por+tipo+de+finalidade-2845-244814 (accessed on 25 March 2023).
  99. International Energy Agency (IEA). Regulation Policies for Energy Efficiency in Portugal. 2023. Available online: https://www.iea.org/policies?qs=portugal&country=Portugal (accessed on 25 March 2023).
  100. Jolliffe, I.T. Principal Component Analysis, 2nd ed.; Springer: Berlin/Heidelberg, Germany, 2002. [Google Scholar]
  101. D’Agostino, R.B.; Pearson, E.S. Tests for Departure from Normality. Biometrika 1973, 60, 613–622. [Google Scholar] [CrossRef]
  102. Belsley, D.A.; Kuh, E.; Welsch, R.E. Regression Diagnostics: Identifying Influential Data and Sources of Collinearity; Wiley: New York, NY, USA, 1980. [Google Scholar]
  103. Pesaran, M.H. General Diagnostic Tests for Cross Section Dependence in Panels; Cambridge Working Papers in Economics, No. 0435; University of Cambridge: Cambridge, UK, 2004. [Google Scholar]
  104. Fisher, R.A. Statistical Methods for Research Workers; Oliver and Boyd: Edinburgh, UK, 1932. [Google Scholar]
  105. Kao, C. Spurious regression and residual-based tests for cointegration in panel data. J. Econom. 1999, 90, 1–44. [Google Scholar] [CrossRef]
  106. Pedroni, P. Panel Cointegration; Asymptotic and Finite Sample Properties of Pooled Time Series Tests with an Application to the PPP Hypothesis. Econom. Theory 2004, 20, 597–625. [Google Scholar] [CrossRef] [Green Version]
  107. Breusch, T.S.; Pagan, A.R. A Simple Test for Heteroscedasticity and Random Coefficient Variation. Econometrica 1979, 47, 1287–1294. [Google Scholar] [CrossRef]
  108. Cook, R.D.; Weisberg, S. Diagnostics for Heteroscedasticity in Regression. Biometrika 1983, 70, 1–10. [Google Scholar] [CrossRef]
  109. Wooldridge, J.M. Econometric Analysis of Cross Section and Panel Data; MIT Press: Cambridge, MA, USA, 2002. [Google Scholar]
  110. Baltagi, B.H. Econometric Analysis of Panel Data, 5th ed.; Wiley: Hoboken, NJ, USA, 2013. [Google Scholar]
  111. Greene, W.H. Econometric Analysis; Pearson Education: Boston, MA, USA, 2012. [Google Scholar]
  112. Gujarati, D.N. Basic Econometrics, 4th ed.; Tata McGraw-Hill Education: New Delhi, India, 2003. [Google Scholar]
  113. Wooldridge, J. Introductory Econometrics: A Modern Approach; Nelson Education: Toronto, ON, Canada, 2015. [Google Scholar]
  114. Chamberlain, G. Analysis of Covariance with Qualitative Data. Rev. Econ. Stud. 1980, 47, 225–238. [Google Scholar] [CrossRef] [Green Version]
  115. Fuinhas, J.A.; Marques, A.C.; Koengkan, M. Are renewable energy policies upsetting carbon dioxide emissions? The case of Latin America countries. Environ. Sci. Pollut. Res. 2017, 24, 15044–15054. [Google Scholar] [CrossRef]
  116. Koenker, R. Quantile Regression; Cambridge University Press: Cambridge, UK, 2005. [Google Scholar]
  117. Chernozhukov, V.; Hansen, C.; Jansson, M. Handbook of Quantile Regression; CRC Press: Boca Raton, FL, USA, 2018. [Google Scholar]
  118. Firpo, S.; Fortin, N.M.; Lemieux, T. Unconditional Quantile Regressions. Econometrica 2009, 77, 953–973. [Google Scholar] [CrossRef] [Green Version]
  119. Sorrell, S.; Dimitropoulos, J.; Sommerville, M. Empirical estimates of the direct rebound effect: A review. Energy Policy 2014, 67, 729–739. [Google Scholar] [CrossRef]
  120. BPIE (Buildings Performance Institute Europe). The Economic Impact of the Directive on the Energy Performance of Buildings. 2013. Available online: https://www.bpie.eu/wp-content/uploads/2015/10/EFFIG-Financial-Interim-report.pdf (accessed on 28 March 2023).
  121. Allcott, H.; Greenstone, M. Is There an Energy Efficiency Gap? J. Econ. Perspect. 2012, 26, 3–28. [Google Scholar] [CrossRef]
  122. Economidou, M.; Todeschi, V.; Bertoldi, P. Accelerating Energy Renovation Investments in Buildings: Financial and Fiscal Instruments across the EU; Publications Office of the European Union: Luxembourg, 2019; ISBN 978-92-76-12195-4. [Google Scholar] [CrossRef]
  123. Economidou, M.; Bertoldi, P. Financing Building Energy Renovations: Current Experiences & Ways Forward; Joint Research Centre, Institute for Energy and Transport: Petten, The Netherlands, 2014; pp. 1–78. ISBN 978-92-79-39129-3. [Google Scholar]
  124. Olga, B.; Antonios, R. Housing Construction as a Leading Economic Indicator. Stud. Bus. Econ. 2019, 14, 33–49. [Google Scholar] [CrossRef] [Green Version]
  125. Giang, D.T.H.; Pheng, L.S. Role of construction in economic development: Review of key concepts in the past 40 years. Habitat Int. 2011, 35, 118–125. [Google Scholar] [CrossRef]
  126. Hoffman, A.V. Housing Heats Up: Home Building Patterns in Metropolitan Areas. Brookins. 1999. Available online: https://www.brookings.edu/research/housing-heats-up-home-building-patterns-in-metropolitan-areas/ (accessed on 25 March 2023).
  127. United Nations Environment Programme (UNEP). Buildings and Climate Change: Status, Challenges and Opportunities. 2016. Available online: https://www.unep.org/resources/report/buildings-and-climate-change-status-challenges-and-opportunities (accessed on 25 March 2023).
  128. International Renewable Energy Agency (IRENA). Renewable Energy and Jobs—Annual Review 2019. 2019. Available online: https://www.irena.org/-/media/Files/IRENA/Agency/Publication/2019/May/IRENA_RE_Jobs_Annual_Review_2019.pdf (accessed on 30 March 2023).
  129. ISSD: SDG Knowledge Hub. Global Commission Finds Bold Climate Action Could Deliver US$26 Trillion by 2030. 2018. Available online: https://sdg.iisd.org/news/global-commission-finds-bold-climate-action-could-deliver-us26-trillion-by-2030/ (accessed on 30 March 2023).
  130. United Nations Environment Programme (UNEP). The Emissions Gap Report 2017. UNEP. 2017. Available online: https://wedocs.unep.org/bitstream/handle/20.500.11822/22070/GSR2017_full_en.pdf?sequence=1&isAllowed=y (accessed on 25 March 2023).
  131. Fuerst, F.; McAllister, P. Green noise or green value? Measuring the effects of environmental certification on office values. Real Estate Econ. 2011, 39, 45–69. [Google Scholar] [CrossRef]
  132. Rosenow, J.; Platt, R.; Flanagan, B. Fuel poverty and energy efficiency obligations: A critical assessment of the supplier obligation in the UK. Energy Policy 2015, 87, 288–299. [Google Scholar] [CrossRef]
  133. Brounen, D.; Kok, N.; Quigley, J. Residential energy use and conservation: Economics and demographics. Eur. Econ. Rev. 2012, 56, 931–945. [Google Scholar] [CrossRef]
  134. Wyon, D.P. The effects of indoor air quality on performance and productivity. Indoor Air 2004, 14 (Suppl. 7), 92–101. [Google Scholar] [CrossRef]
  135. IPCC. Global Warming of 1.5 °C. 2018. Available online: https://www.ipcc.ch/sr15/ (accessed on 30 March 2023).
Figure 1. Scientific method steps. This figure was created by the authors.
Energies 16 04855 g001
Figure 2. Methodology framework. This figure was created by the authors.
Energies 16 04855 g002
Figure 3. Lisbon Metropolitan area map. This map was created with MapChart [90].
Energies 16 04855 g003
Figure 4. Number of Eco-friendly and Non-Eco-friendly houses in Lisbon Metropolitan Area from 2014 to 2020. This graph was created by data from SCE [92].
Energies 16 04855 g004
Figure 5. Number of Eco-friendly and Non-friendly houses in Lisbon Metropolitan Area Municipalities from 2014 to 2020. This graph was created by data from SCE [92].
Energies 16 04855 g005
Figure 6. Histogram of variables. Notes: “Log” means variable in the natural logarithms; The Stata command histogram was used in this test.
Energies 16 04855 g006
Figure 7. Summary of empirical results. This figure was created by the authors.
Energies 16 04855 g007
Table 1. Variables and sources.
AbbreviationVariablesSourceQR Codes
Dependent variable
GDPGDP (base = 2016) for each municipality. Indeed, this variable was built by the GDP of each region (25 NUTS III) × (population of municipality/population of the region (25 NUTS III)). This variable can serve as a proxy for economic development.Constructed variable with data from INE [93]Energies 16 04855 i001
Independent variables
POLICIESNational policies for residential energy efficiency include regulations for HVAC systems, energy certificates, the National Energy Efficiency Action Plan, building certification, and the Environmental Fund’s Sustainable Buildings program. These policies incentivize compliance with subsidies, loans, tax relief, funds, infrastructure, implementation aid, information, labelling, training, auditing, standards, monitoring, and obligation schemes. This variable was built in accumulated form, where each policy type that was implemented is represented by (1) accumulated over other policies throughout its useful life (In force) or end (e.g., 1, 1, 2, 2, 2, 3,3).IEA [99]Energies 16 04855 i002
HOUSES_RECONSNumber of completed reconstructions per 100 completed new constructions.INE [95]Energies 16 04855 i003
NEW_HOUSESNumber of completed dwellings in new constructions for family housing.INE [94]Energies 16 04855 i004
ECO_HOUSES“Eco-Friendly” Houses. This variable represents the total number of houses that have received high energy efficiency certificate ratings, such as A+, A, B, and B−. These ratings indicate that the houses use less energy and are more environmentally friendly than houses with lower ratings. Therefore, this variable can serve as a proxy for identifying the number of eco-friendly houses. Constructed variable with data from SCE [92]Energies 16 04855 i005
NON_ECO-HOUSES“Non-Eco-Friendly” Houses. This variable represents the total number of houses that have received low energy efficiency certificate ratings, such as C, D, E, and F. These ratings indicate that the houses use more energy and are less environmentally friendly than houses with higher ratings. Therefore, this variable can serve as a proxy for identifying the number of non-eco-friendly houses.Constructed variable with data from SCE [92]Energies 16 04855 i006
Notes: This table was created by the authors.
Table 2. Descriptive statistics of variables.
VariablesObsMeanStd. Dev.MinMax
LogGDP12615.882124.219012.940233.0508
LogPOLICIES1261.55660.22691.09861.7917
LogHOUSES_RECONS1260.40240.8003−0.66683.5351
LogNEW_HOUSES1264.12861.11460.69316.1793
LogECO_HOUSES1266.00221.13820.69318.6864
LogNON_ECO_HOUSES1267.38930.93343.29589.5672
Notes: “Log” means variable in the natural logarithms; The Stata command sum was used in this test.
Table 3. Pairwise Correlation.
Pairwise Correlation
Variables(A)(B)(C)(D)(E)(F)
LogGDP (A)1.000
LogPOLICIES (B)0.01501.000
LogHOUSES_RECONS (C)0.0128−0.09491.000
LogNEW_HOUSES (D)0.08130.2378 ***0.1600 *1.000
LogECO_HOUSES (F)0.12580.2421 **0.3636 ***0.5546 ***1.000
LogNON_ECO_HOUSES (E)0.1713 **−0.00790.397 ***0.2247 **0.7445 ***1.000
Pairwise Correlation Matrix
Energies 16 04855 i007
Notes: ***, **, * denote statistically significant at 1%, 5%, and 10% levels, respectively; “Log” means variable in the natural logarithms; The Stata command pwcorr was used in this test.
Table 4. Skewness and kurtosis test for normality.
VariablesSkewness/Kurtosis Tests for NormalityObs
Pr (Skewness)Pr (Kurtosis)adj chi2(2)Statistic
LogGDP0.00000.0000 0.0000***126
LogPOLICIES0.00010.784512.720.0017***126
LogHOUSES_RECONS0.00000.000142.630.0000***126
LogNEW_HOUSES0.00080.124611.580.0031***126
LogECO_HOUSES0.00050.000220.800.0000***126
LogNON_ECO_HOUSES0.01040.000415.490.0004***126
Notes: *** denotes statistical significance at 1% level; “Log” means variable in the natural logarithms; The Stata command sktest was used in this test.
Table 5. Collinearity Diagnostics.
VariablesVIFSQRT
VIF
ToleranceR-SquaredEigenvalEigenval Index
LogGDP1.231.110.81000.190016.12521.0000
LogPOLICIES1.211.100.82450.175520.75202.8539
LogHOUSES_RECONS1.291.140.77460.225430.059710.1332
LogNEW_HOUSES1.861.360.53880.461240.036412.9780
LogECO_HOUSES3.871.970.25820.741850.014620.4893
LogNON_ECO_HOUSES2.431.560.41170.588360.009325.6052
Mean VIF1.9870.002946.2613
Condition Number46.2613
Eigenvalues & Cond Index computed from scaled raw sscp (w/intercept)
Det (correlation matrix)
0.1576
Notes: “Log” means variable in the natural logarithms; The Stata command collin was used in this test.
Table 6. Pesaran CD test.
VariablesCD-Testp-ValueObs
LogGDP32.44***126
LogPOLICIES32.46***126
LogHOUSES_RECONSN.A126
LogNEW_HOUSES15.97***126
LogECO_HOUSES26.45***126
LogNON_ECO_HOUSES8.74***126
Notes: *** denotes statistical significance at 1% level; “Log” means variable in the natural logarithms; The Stata command xtcd was used in this test; N.A denotes unavailable.
Table 7. Fisher-type unit-root test.
VariablesFisher-Type Unit-Root Test
(Based on Phillips-Perron Tests)
Without TrendWith Trend
LagsInverse Normal (Z)Inverse Normal (Z)
LogGDP08.2056 0.3372
18.0925 0.1451
LogPOLICIES0−8.5486***9.5038
1−10.4421***10.8778
LogHOUSES_RECONS0−5.8195***−6.6265***
1−6.0145***−7.9411***
LogNEW_HOUSES00.0986 −4.5015***
10.0657 −6.2746***
LogECO_HOUSES02.2657 1.9285
12.6838 1.6228
LogNON_ECO_HOUSES04.3463 6.0491
13.8087 5.4698
dLogGDP00.0313 8.5471
10.2217 9.7752
dLogPOLICIES03.8931 0.1438
15.4022 −0.0773
dLogHOUSES_RECONS0−9.9940 −4.3266
1−11.1357***−4.6370***
dLogNEW_HOUSES0−8.5165***−3.3044***
1−9.9904***−5.6215***
dLogECO_HOUSES0−3.2993***0.2991
1−3.2195***−0.3345
dLogNON_ECO_HOUSES01.0892***−4.7146***
10.4446***−7.4530***
Notes: ***, denotes statistically significant at 1% level, respectively; “Log” means variable in the natural logarithms; The Stata command xtunitroot was used in this test.
Table 8. Kao and Pedroni tests for cointegration.
Kao Test for CointegrationStatisticp-Value
Modified Dickey-Fuller t1.01300.1555
Dickey-Fuller t−4.79170.0000***
Augmented Dickey-Fuller t−0.80830.2095
Unadjusted modified Dickey-Fuller t−2.78540.0027**
Unadjusted Dickey-Fuller t−7.81730.0000***
Pedroni Test for CointegrationStatisticp-Value
Modified Phillips-Perron t3.94300.0000***
Phillips-Perron t1.97300.0242**
Augmented Dickey-Fuller t−3.08490.0010**
Notes: ***, ** denotes statistically significant at 1% and 5% levels, respectively; “Log” means variable in the natural logarithms; The Stata commands xtcointtest kao, and xtcointtest pedroni were used in this test.
Table 9. Breusch-Pagan/Cook-Weisberg test for heteroskedasticity and Wooldridge test for autocorrelation in panel data.
Breusch-Pagan/Cook-Weisberg test for heteroskedasticity
chi2(1) = 80.52 ***
Wooldridge test for autocorrelation in panel data
F (1, 17) = 177.631 ***
Notes: *** denotes statistical significance at 1% level; The Stata commands hettest and xtserial were used in this test.
Table 10. Hausman test.
Modelschi2(5)Prob.
117.600.0000***
Notes: *** denotes statistically significant at 1% level; The Stata command hausman was used in this test.
Table 11. Results of OLS with fixed effects and MM-QR.
Independent VariablesMain ModelRobustness Check
OLS with Fixed EffectsMM-QR
Dependent Variable (LogGDP)Dependent Variable (LogGDP)
EstimatorsQuantiles
FEFE RobustFE. D.-K0.25 Q0.5 Q0.75 Q0.90 Q
LogPOLICIES0.1578 *********0.1881 ***0.1655 ***0.1369 ***0.1112 **
LogHOUSES_RECONS0.0027 0.00230.00260.00290.0033
LogNEW_HOUSES0.0187 *******0.00930.0163 **0.0251 **0.0329 **
LogECO_HOUSES0.0786 *********0.0716 ***0.0768 ***0.0834 ***0.0892 ***
LogNON_ECO_HOUSES−0.0605 ***−0.0605 ***−0.0605 ***−0.0461 **−0.0568 **−0.0703 **−0.0822 *
Constant15.3949 *********N.AN.AN.AN.A
Obs126126126126126126126
Graphical depiction of the impacts
Energies 16 04855 i008Energies 16 04855 i009
Notes: ***, **, * denote statistically significant at 1%, 5%, and 10% levels, respectively; “Log” means variable in the natural logarithms; N.A denotes unavailable; The Stata commands xtreg, and xtqreg were used.
Disclaimer/Publisher’s Note: The statements, opinions and data contained in all publications are solely those of the individual author(s) and contributor(s) and not of MDPI and/or the editor(s). MDPI and/or the editor(s) disclaim responsibility for any injury to people or property resulting from any ideas, methods, instructions or products referred to in the content.

