Article

State-Space Load Flow Calculation of an Energy System with Sector-Coupling Technologies

by
Sebastian Bottler
* and
Christian Weindl
Institute of High Voltage Technology, Energy System & Asset Diagnostics (IHEA), Coburg University of Applied Sciences and Arts, 96450 Coburg, Germany
*
Author to whom correspondence should be addressed.
Energies 2023, 16(12), 4803; https://doi.org/10.3390/en16124803
Submission received: 22 May 2023 / Revised: 13 June 2023 / Accepted: 15 June 2023 / Published: 19 June 2023
(This article belongs to the Special Issue Operation and Optimization of Renewable Energy Power System)

Abstract

:
This paper addresses the sector-coupling principle, highlights each associated sector’s technologies and showcases their future development, according to the German grid development plan. Furthermore, the research project ESM-Regio, and its goals in terms of simulatively analyzing the sector-coupling approach for a specific model region and future scenarios, is introduced. In this context, the key methods for modeling the electricity sector’s loading behavior are showcased. Most importantly, the state-space load flow calculation, load modeling (including the integration of the power demands of the sector-coupling technologies) and an assessment of grid operating equipment, based on thermal aging models, are described.

1. Introduction

The occurrence of the Technological Revolution in the late 19th and early 20th centuries introduced mass production and industrialization, consequently increasing the modern world’s overall energy requirements. These energy demands were met by the large-scale deployment of steam engines, alongside the introduction of new technological systems, such as electric power, inherently initializing the world’s electrification [1]. Since then, civilization’s energy-dependency, specifically in terms of electrical power, has been increasing steadily, ultimately reaching a state where a consistent, reliable energy supply is often taken for granted. Nonetheless, modern society is faced with vast and constantly evolving challenges stemming from various political, technological and environmental origins, which also pertain to, and potentially threaten, the current energy supply structure’s reliability. Many countries are experiencing a growing desire to be energy independent, and this, as well as the general strive for increased carbon-neutrality with the intention of reducing climate change, have been fundamentally influencing both the supply and consumption sides of electrical energy in today’s power grids. For example, electricity generation is continuously being decentralized by many countries, including Germany, following the large-scale development and integration of renewable energy sources (RESs). The resulting changes in terms of non-projectable feed-in behavior (resulting from the physically concomitant volatility of RESs), along with newly introduced negative (generation) load peaks (resulting from PV feed-back during the midday period) are already challenging grid operation and management in certain areas today. Furthermore, the transportation and heating sectors, that conventionally rely on fossil fuels, are gradually being electrified by the introduction of, and growing markets in, electric and hybrid electric vehicles (EVs, HEVs) and heat pumps. The climate goals set by the European Union (climate-neutrality by 2050, net-zero greenhouse gas emissions [2]) and by the German government (climate neutrality by 2045, negative net emissions by 2050 [3]) are accounted for in the grid development plans [4], published by the German transmission system operators, and depict the necessary advancements for compliance with the previously illustrated climate goals. These plans entail the phase-out of conventional energy sources (including nuclear power) and the massive expansion of RESs (especially PV and wind power). In addition, the gross electric energy consumption is forecast to increase from 533 (2019/2020) to 1106 GWh by the year 2045, emanating from the electrification of the heating, transportation and industrial sectors (see Figure 1).
The energy landscape’s transformation, brought forth by the ongoing energy transition, puts additional strain on power grids’ operating equipment and this will only continue to be amplified by future development. The intermittency being introduced by both the installation of decentralized RESs and the newly emerging demands from sector-coupling technologies, such as EVs, pose a threat to grid stability [5,6]. Furthermore, the aging characteristics of critical operating equipment, such as cables and transformers, are directly influenced by their respective loading behaviors, being particularly susceptible to overloading. Unfortunately, the life expectancy of the equipment is largely defined by a non-linear exponential relationship between the electrical isolation’s degeneration and operating temperature [7]. As a result, accelerated thermal aging occurs if the operating temperatures of cables/transformers exceed a specific threshold. The ensuing reduction of life expectancy directly correlates with the asset’s monetary depreciation. Needless to say, it is advisable to avoid such operating points at all costs to prevent the cost-intensive, premature replacement of operating equipment. A future approach for establishing and maintaining suitable operating conditions is the deployment of sector-coupling technologies offering flexibility and the intelligent controlling of these technologies to conduct traditional load management processes, as shown by [8] and illustrated in Figure 2. Thus, effectively improving an entire energy system’s economic operation.
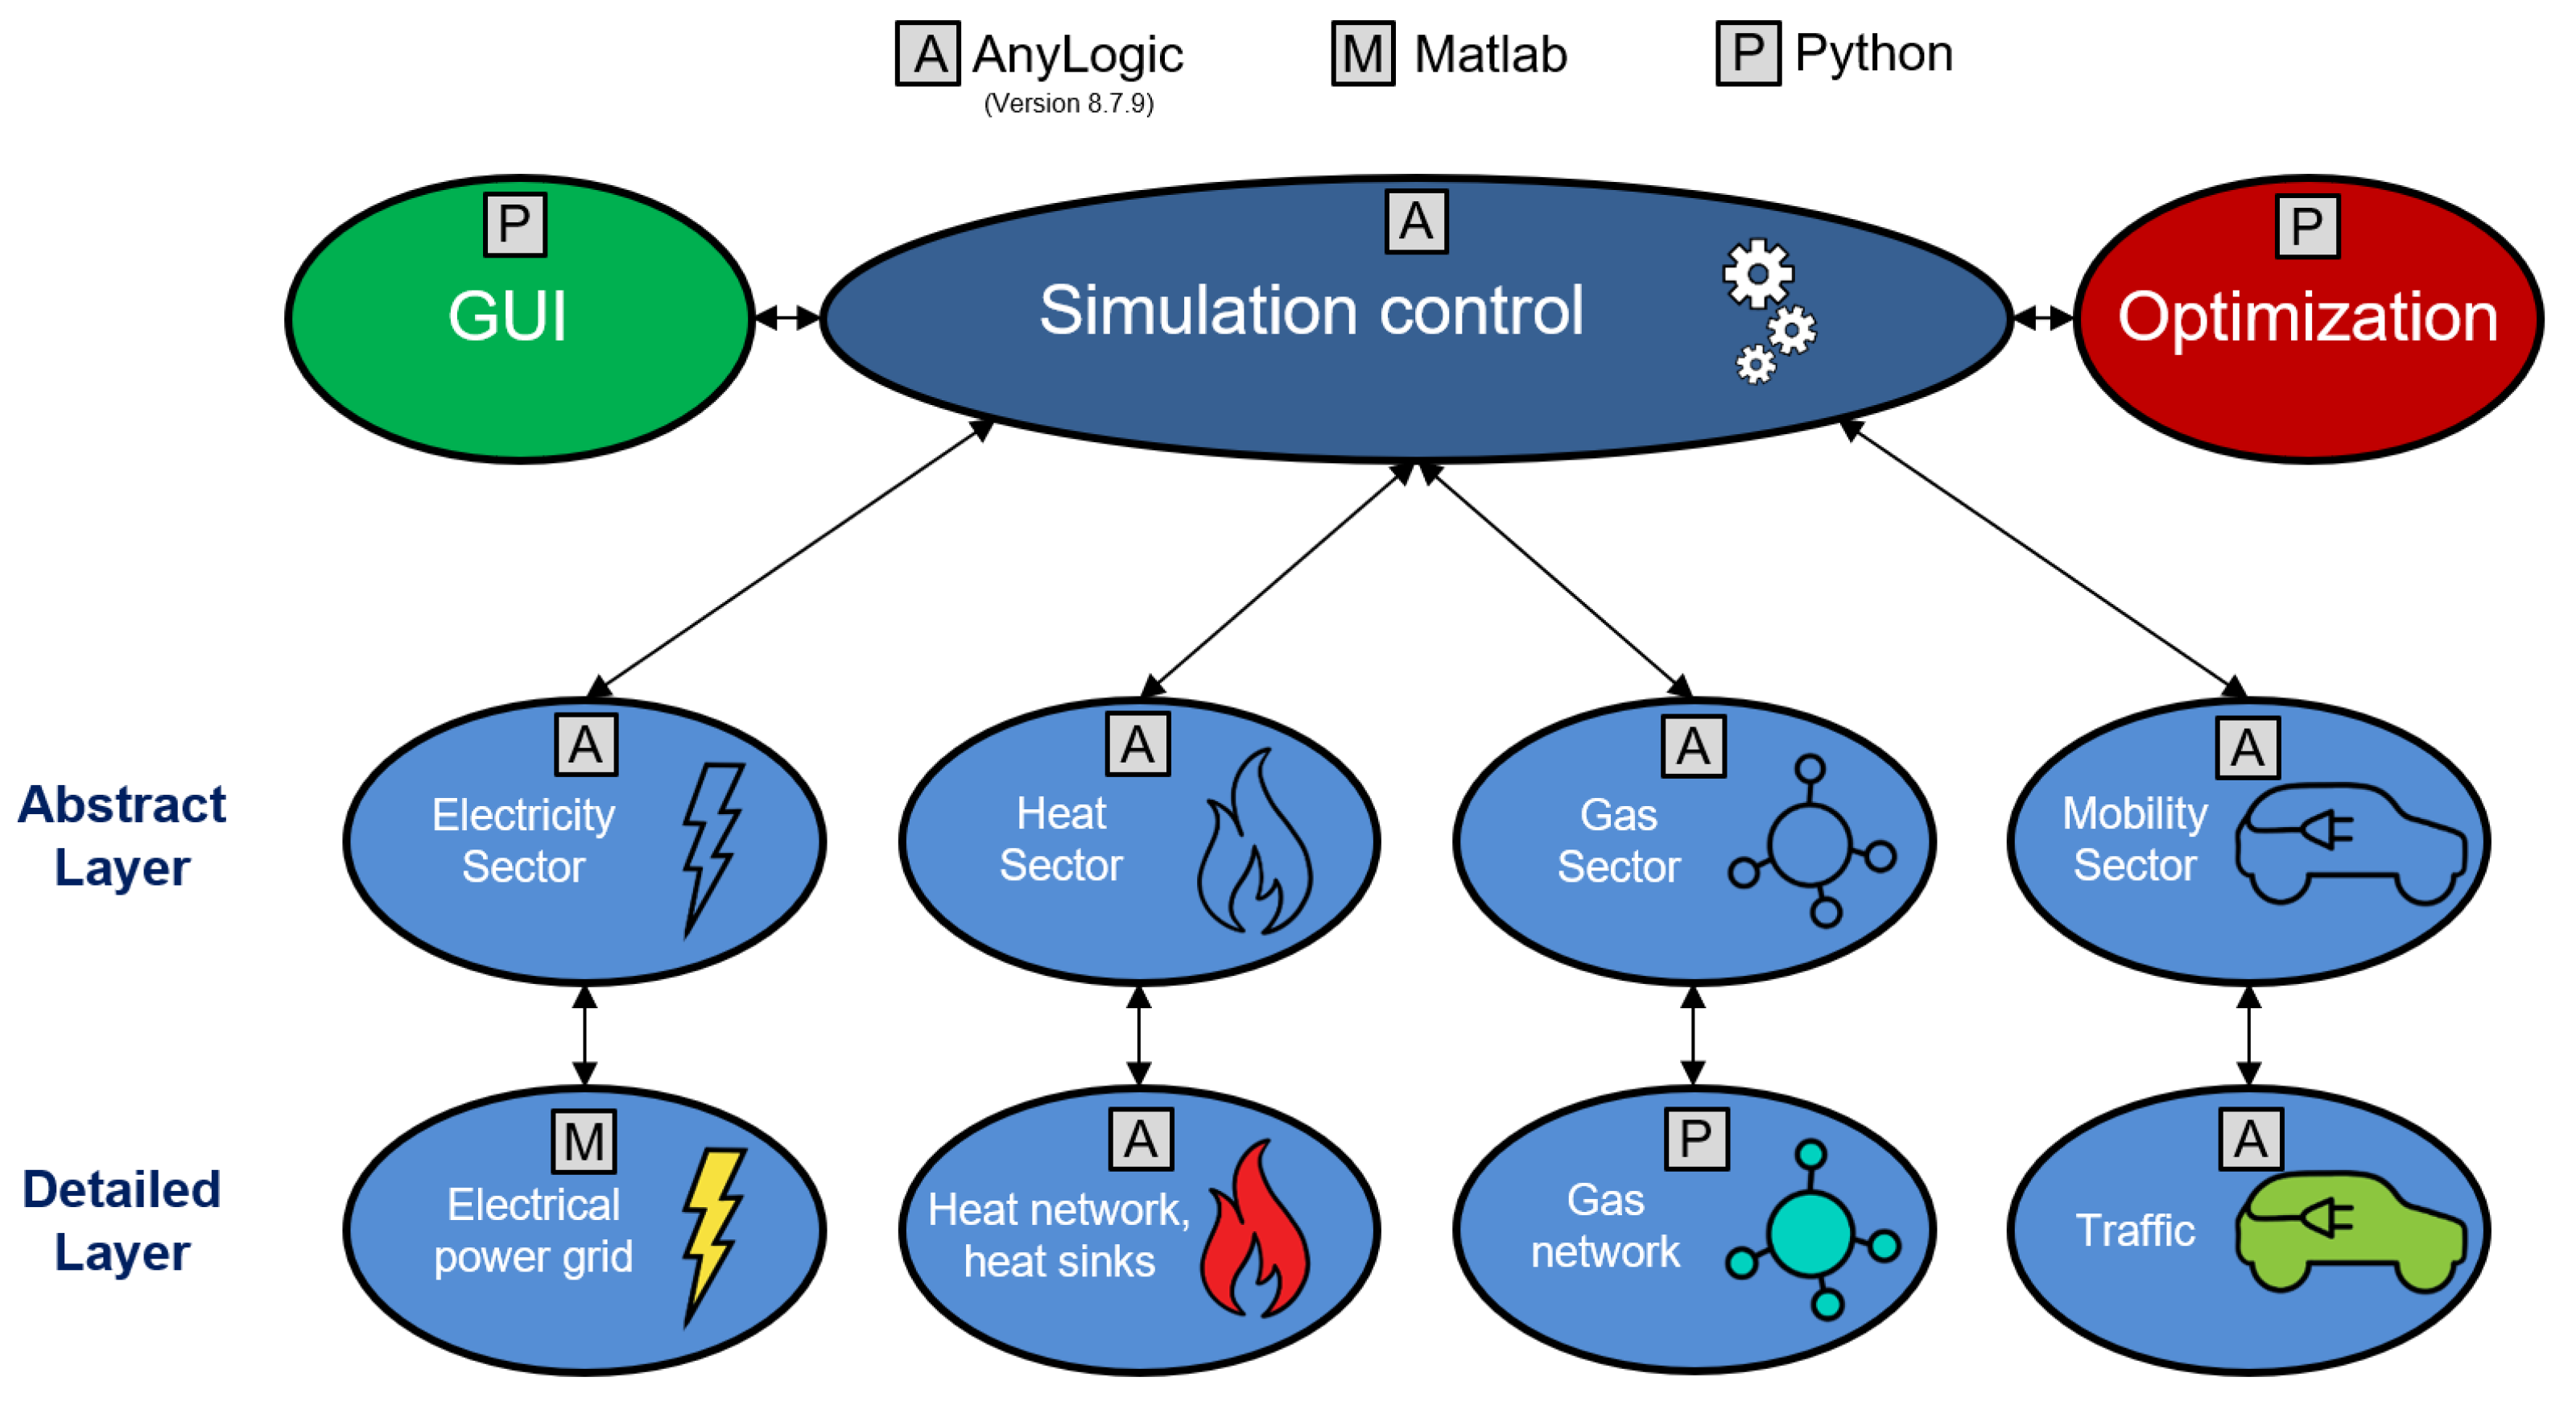
The potential of this approach is analyzed as part of the research project “ESM-Regio”, funded by the German federal ministry for economic affairs, and coordinated by the Laboratory of Computer Science 7 at the Friedrich-Alexander-Universität Erlangen-Nürnberg (FAU). Further scientific partners, based at the FAU, include the Laboratory for Energy Process Engineering and the Laboratory for Business Mathematics, and the chair of computer science III at the Julius-Maximilians-Unviersität Würzburg, as well as the Institute for High Voltage Technology Energy System and Plant Diagnostics at the Coburg University of Applied Sciences (IHEA). Industrial partners include the Energy Agency for Northern Bavaria, Nuremberg and Kulmbach (EAN), the Bayreuth Municipal Utilities and the Energy Technology Cluster of Bayern Innovativ GmbH. The research project aims to create a multi-sectoral model for the comprehensive analysis of sector-coupled energy systems of an exemplary model region for various future scenarios (2030, 2045) [9]. The main goal is the creation of an energy system model with high temporal resolution consisting of the model region’s four major energy sectors, including electricity, gas, heat and mobility. These four models individually conduct simulations, whilst also being able to depict cross-sectoral energy flows by exchanging data sets using suitable interfaces (see Figure 2) [10]. After carrying out a simulation iteration, each instance’s significant simulation results and assessment factors are separately stored in the abstract layer. The simulation control can access this level and is responsible for administering and exchanging data with the optimization layer. In this manner, the optimization layer receives all of the necessary inputs to carry out a mathematical optimization process, upon which the power values of the sector-coupling technologies (representing the flexibilities) S ̲ f l e x ( t ) are determined for the current iteration. The specified power values are relayed back to the simulation models (in the detailed layer) and incorporated in the following iteration’s simulation execution. The newly established significant simulation results and assessment factors are transferred to the optimization layer by the simulation control, initializing the ensuing iteration of the optimization process. These interconnected simulation and optimization processes are carried out successively for n iterations, until the sector-coupling technologies’ values have been ideally established, in terms of reaching a global minimum regarding the system’s operational costs.
IHEA is tasked with the load flow simulation of the model region’s medium-voltage (20 kV) distribution networks. The key tasks include the creation of realistic network models, electrical load modeling (including the integration of the flexibilities of the sector-coupling technologies) and deriving load-dependent assessment factors using thermal aging models to describe the life expectancies of critical operating equipment. These tasks are realized by implementing a load–flow calculation depicting the system’s resulting flows, which depend on the time-dependent, node-specific electrical loads integrated in the respective network models. Instead of relying on current state-of-the-art load–flow analysis tools and methods, e.g., the current iteration (Gauss–Seidel) or the Newton–Raphson approaches presented in [11,12,13], which are applied in varying research topics, as illustrated by contributions. e.g., [14,15,16,17], a novel load–flow calculation method, based on a state-space approach, is introduced and applied to calculate the system-defining flows. The aforementioned novel algorithm differs from the established state-of-the-art algorithms and uses the mathematical state-space representation to directly calculate a system’s load flow, as shown by the overview given by Blenk in [18]. This paper examines a variety of references to highlight the future development of Germany’s energy system and how these trends affect each of the major energy sectors. Furthermore, sources explaining the fundamental principles of the mathematical state-space representation, the modeling process of electrical energy storage systems and load modeling are referenced. In addition, research and standards analyzing the aging behavior of typical grid operating equipment (cables and transformers) are cited. The main focus of this publication is the presentation of the varying sector-coupling technologies that are of interest and the methods required for implementing the electricity sector’s simulation model for different scenarios using the unique state-space-based calculation.

2. Sector-Coupling Technologies

The term sector-coupling has been gaining lots of attention, due to the EU’s green deal, and is defined by van Nuffel in [19], part of a study commissioned by the EU, as follows: “Initially the concept referred to the electrification of end-use sectors like heating and transport, with the aim of increasing the share of renewable energy in these sectors and providing balancing services to the electricity sector. More recently, the concept of sector-coupling has broadened to include supply-side sector-coupling. Supply-side integration focuses on the integration of the power and gas sectors, through technologies such as power-to-gas”. The following section is dedicated to outlining each sector’s technologies which are specifically relevant for the electricity sector in accordance with the sector-coupling principle. Current trends and future outlooks are given on a federal level (commonly based on [4] for all sectors). The technologies’ applications within the scope of the research project are presented.

2.1. Mobility

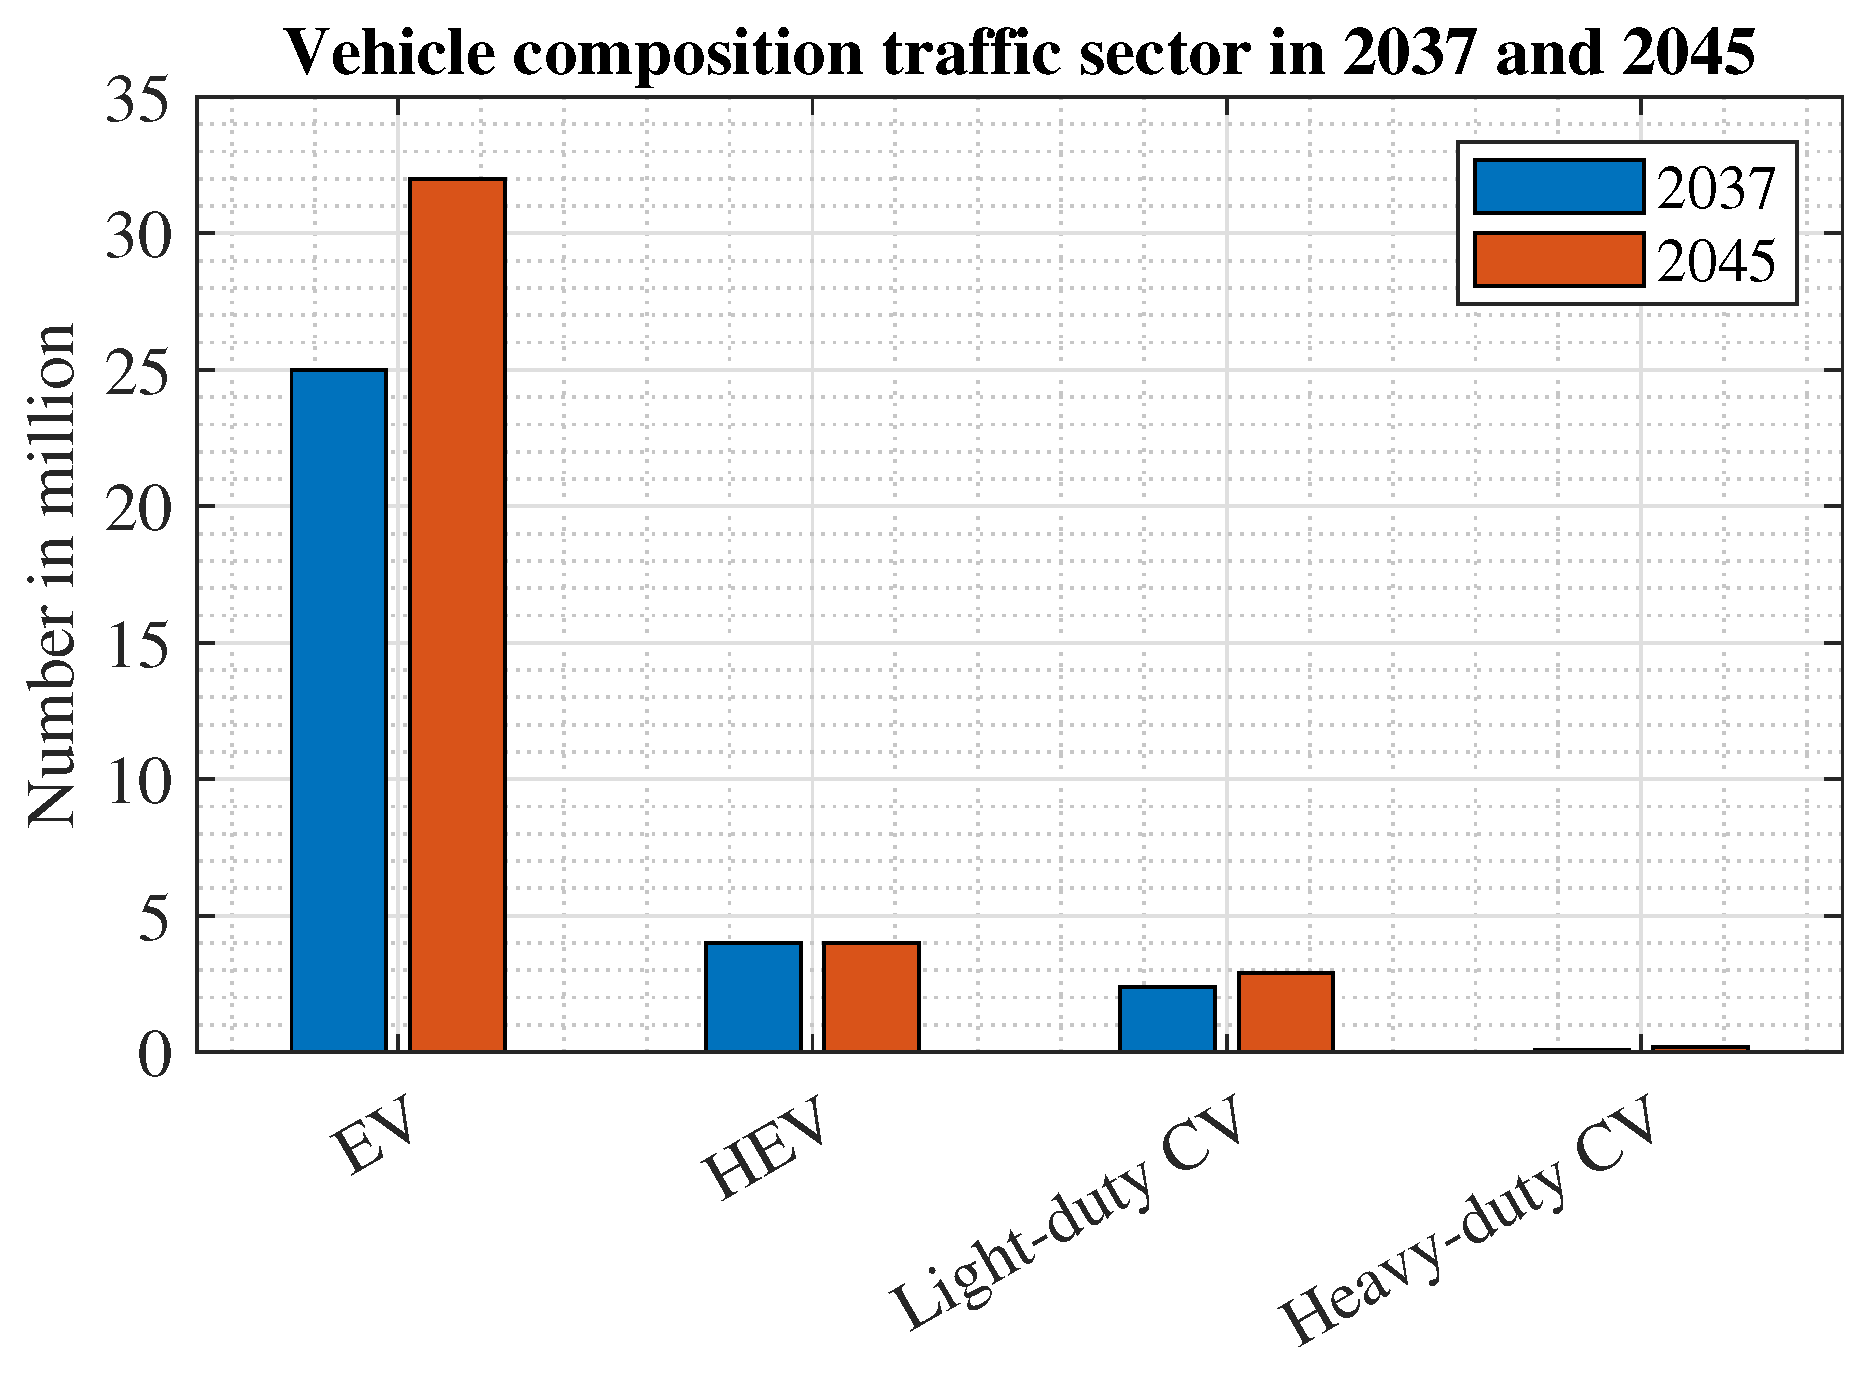
The mobility/transportation sector has traditionally relied on combustion engines burning fossil fuels to power passenger and freight vehicles. In recent years, car manufacturers around the world have been expanding their EV/HEV portfolios, yielding an increase in sales and market share. In Germany, the numbers of EVs and HEVs have risen to 620,000 and 566,000, respectively, reaching a combined 2.6% of total car stock [20]. A future prognosis depicting the traffic sector’s EV, HEV, light-duty commercial vehicle (CV), heavy-duty CV compositions for 2037 and 2045 is given by [4] and illustrated in Figure 3.
The combined capacities of EV internal batteries essentially correspond to a large virtual energy storage system (ESS), which can be intelligently used to shift loads and trim peaks. Vehicles supporting bidirectional charging can also feed power into the grid using a DC/AC converter system (either on-board or as part of the charging station). The vehicle-to-grid concept (V2G) enables EVs to effectively support the grid and holds major potential in terms of the conducting of ancillary services (frequency and voltage regulating, load balancing etc.). The calculated overviews are given by [21,22]. Within “ESM-Regio” the charging/discharging of the various types of electric vehicles is modeled, representing the junction between the mobility and electricity sectors. The cumulative, residual load being drawn by all types of EVs at node n during the time step t (expressing the mobility sector’s flexibility) is depicted by S ̲ f l e x , m , n ( t ) ,
S ̲ f l e x , m , n ( t ) = [ S ̲ m , c h , n ( t ) S ̲ m , c h , n ( t ) ]
where S ̲ m , c h , n ( t ) is the apparent power being drawn and S ̲ m , d c h , n ( t ) being fed back into the system at the n t h node within the model region. Under consideration of the constraints provided by the mobility sector’s simulation model, the optimization layer determines the values S ̲ f l e x , m , n ( t ) for the current iteration of the optimization process.

2.2. Heat

The heat sector’s energy demands relate to the energy used for space heating and cooling, as well as the process heat required by the industrial sector. According to [23], the heating sector makes up for over 50% of Germany’s total energy consumption (2019). A more detailed analysis is provided by [24], depicting the demand distribution for heat across different consumption sectors, and revealing major shares for the household (90%), industrial (74%) and commercial (58.8%) sectors. Similarly to the traffic sector, a majority of the heat sector’s energy is produced by non-renewable energy sources, primarily relying on natural gas [25]. Data published by the German federal ministry for economics and climate action suggests that the contribution of RESs to the heat sector had a share of 15.2% (2021) [26]. The heat sector’s electrification, using power-to-heat (P2H) technologies, conveys further major potential in increasing the sustainability and decarbonization of the future energy-system. The German grid development plan [4] illustrates the changes in the heat sector and establishes likely prevailing technologies. According to this plan, sustainable heat supply can be realized using various technologies, such as direct electrification, solar thermal energy, and combined heat and power plants (CHPs) (burning H2 or sustainable biomass) etc. However, the degree of efficiency that is obtainable using direct electrification technologies, such as heat pumps (HPs) and electrode boilers (EBs), suggests that these technologies constitute the future’s main heat-supplies. These developments are being adopted in both the household and commercial sectors, as well as in district heating, and are extrapolated under specific assumptions [4], yielding the results illustrated in Figure 4.
The share of CHPs burning conventional fuels (natural gas and coal) is expected to reduce and to continuously be repurposed to enable the use of (green) hydrogen as a fuel source. By 2045, all remaining CHPs are expected to exclusively operate with hydrogen. In the research project, the model region’s heating demands and district heating networks are simulated for varying future scenarios as part of the heat sector’s simulation model. The heat and electricity sectors are linked by the power consumption of the P2H technologies and the power generation by CHP. These power contributions must be provided and accordingly integrated into the electricity sector’s simulation model so that they are accounted for during the load–flow calculation. The residual load at the n t h node, at time step t, demanded by the heat sector is represented by S ̲ f l e x , h , n ( t ) in (2),
S ̲ f l e x , h , n ( t ) = [ S ̲ h , c o n , n ( t ) S ̲ h , g e n , n ( t ) ]
where S ̲ h , c o n , n ( t ) is the cumulative P2H power consumption and S ̲ h , g e n , n ( t ) the cumulative CHP power generation. These variables’ values are determined by the heat sector’s simulation model and the optimization layer, depicting the heat sector’s flexibilities.

2.3. Gas

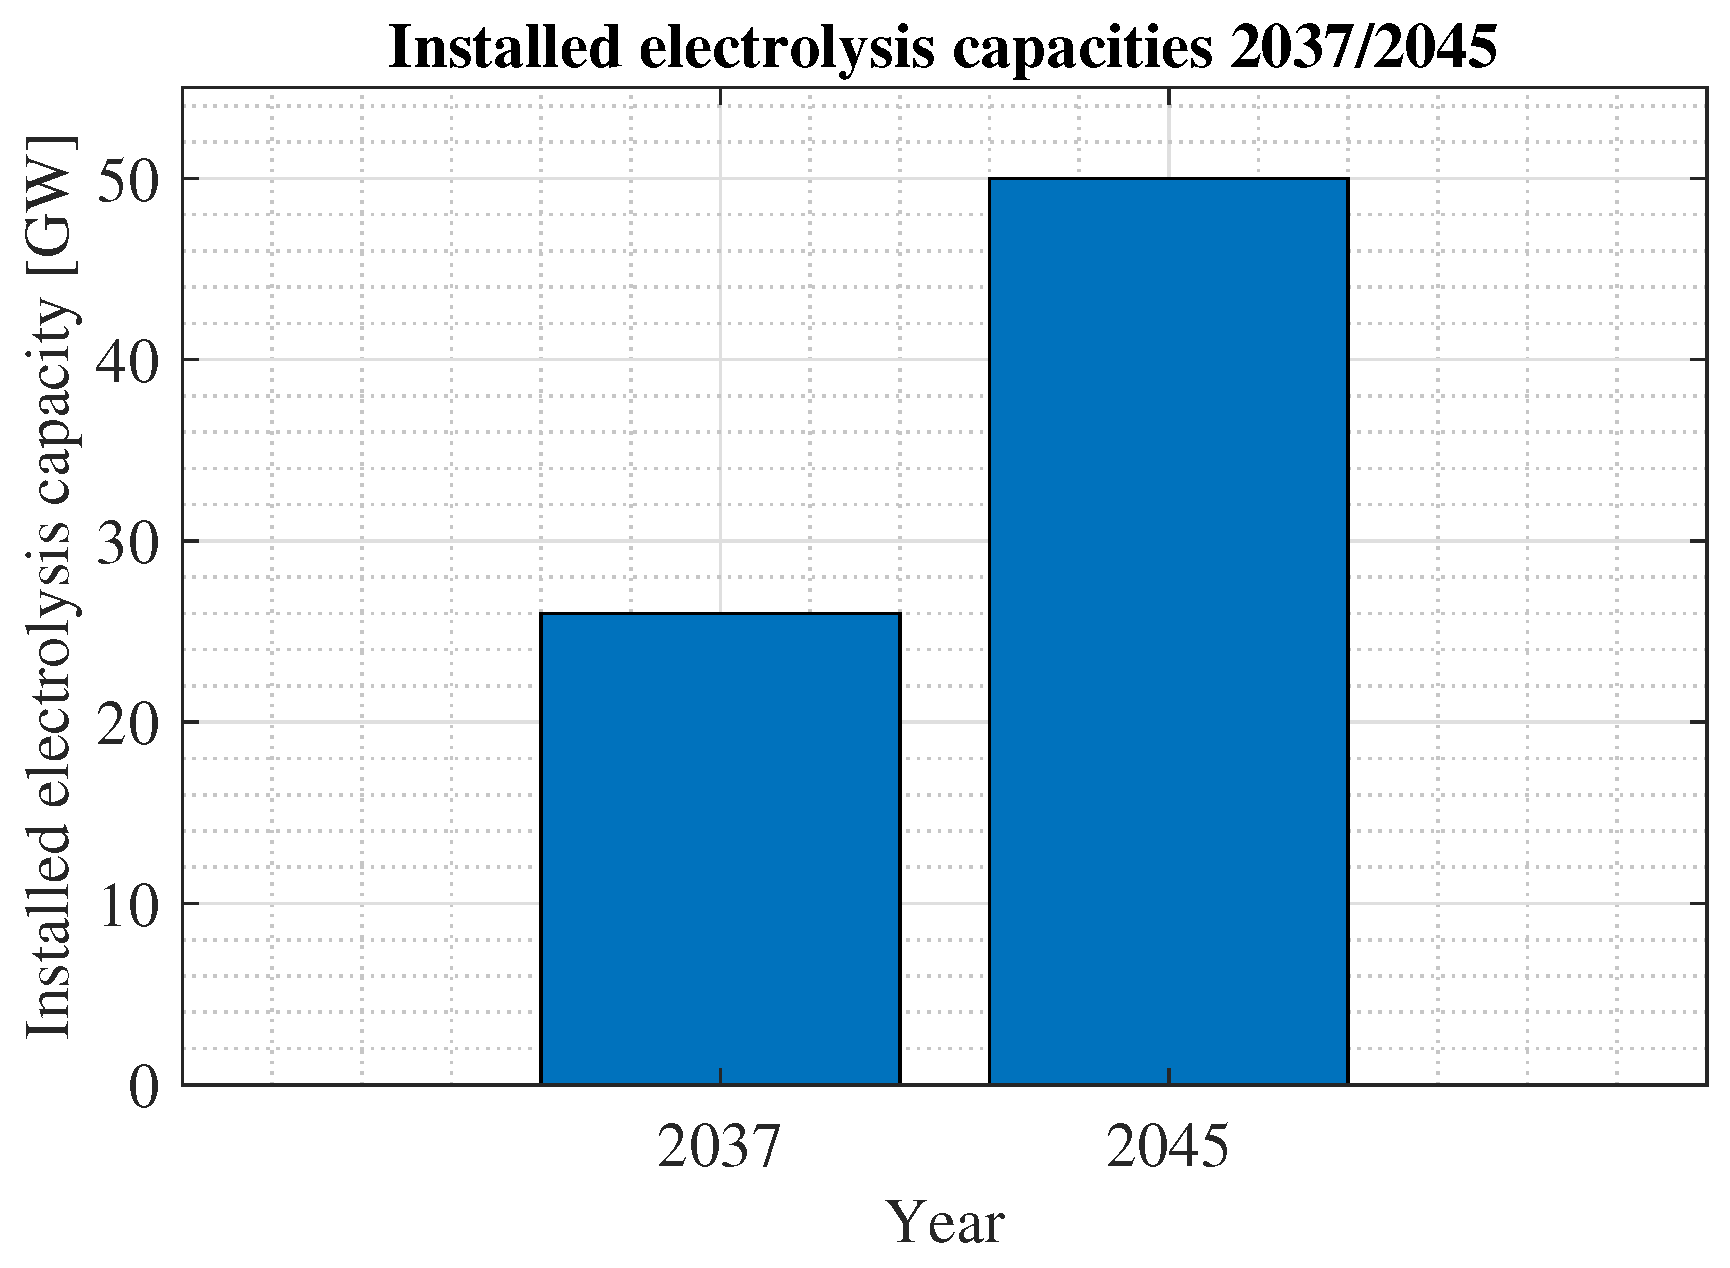
The last remaining major energy sector is the gas sector. This sector is responsible for providing its customers with natural gas (methane), primarily used for heating purposes in the private and commercial sectors or for process heating in industrial applications. Since 1995, the share of natural gas for heating in private households has risen from 37.4% to 49.5% in 2020 [27]. Furthermore, according to the German Federal Environment agency, a majority of CHPs use gas as a fuel source. In 2021, the total heat production from CHPs amounted to 228 TWh, with 109 TWh being sourced from gases [28]. Recent political events tied to the Russo-Ukrainian War (2022) have brought forth numerous economic sanctions resulting in major natural gas price increases, specifically affecting the private sector and threatening the economy. A recently conducted gas price analysis by the German Association of Energy and Water and Industries [29] clearly outlines the implications, with gas prices tripling (for households) in comparison to the post-war years. These developments solidify the need for a crisis-proof, sustainable energy supply and the phase-out of conventional natural gas applications, all of which have, consequently, risen in priority for the German government [30,31]. Despite the recent developments and insecurities concerning fossil natural gas, producing gaseous fuels via power-to-gas technologies (P2G) retains its potential and its role within the sector-coupling approach, especially due to its versatility. The P2G-concept alongside its specific applications are described by Zapf in [32] and include the following: energy storage, energy transportation, conducting of ancillary services and interconnecting of the electricity sector with the heat and mobility (via hydrogen-powered cars) sectors. Key technologies, such as electrolysis and methanation, use excess power produced by RESs to produce hydrogen and methane, respectively. In doing so, the power grid’s load is lessened and energy feedback reduced, whilst, simultaneously, sustainable green hydrogen and synthetic natural gas (SNG) are produced. A detailed overview of the fundamentals and respective functionalities of these technologies is also included in [32]. The yield of P2G plants can either be utilized directly or stored in already existing gas networks (as shown by [33]), caverns or tanks, effectively serving as long-term energy storage. Some of the major applications include powering CHP to supply district heating or industrial heat processing, or to directly feed-in electrical energy to the power grid as an ancillary service. Further feasible applications, such as power-to-liquid (P2L), are widespread but remain limited at today’s standards (costs), due to the accompanying (limited) economic viability as described in [34]. According to [4], precisely specifying the future demand for green hydrogen being used in industrial applications and/or the mobility sector is extremely difficult. In this regard, the study [35] is cited, which includes estimates in terms of Germany’s future hydrogen, P2G and P2L demands, which range from 250–650 TWh. In any case, comparing current green hydrogen production levels to future demands, suggests an inevitable, massive ramp-up of electrolysis capacity, despite assuming a major import quota (65–80%) [4]. Figure 5 shows the electrolysis capacities determined in [4] for 2037/2045.
In ESM-Regio, the gas sector’s simulation model utilizes fluid mechanic principles to depict a model region’s gas network flow, dependending on general gas and heating demands. For specific future simulation scenarios, this also entails modeling the flow of hydrogen in the model region’s pre-existing high-pressure networks, in addition to locally integrating P2G production. The gas production originating from the electricity sector’s electrical power represents the link between the electricity and gas sectors. The gas sector’s flexibility at the n t h node and at time step t, is represented by S ̲ f l e x , g , n ( t ) in (3),
S ̲ f l e x , g , n ( t ) = S ̲ g , c o n , n ( t )
where S ̲ g , c o n , n ( t ) portrays the cumulative power consumption of the P2G technologies, determined by the optimization layer.

2.4. Derivation of Simulation Scenarios

The previously highlighted sectoral considerations, derived from [4], illustrate the sector-specific future developments at the federal (national) level. The advances/changes are referenced from this common source for all sectors. By additionally incorporating local data provided by the grid operator, as well as specific census data, the model region’s future development is locally extrapolated for varying dates and simulation scenarios. A closer insight into the specific underlying methodologies is not given within the context of this paper.

3. Electricity Sector

The following section is entirely dedicated to the model region’s electricity sector. It outlines the principles of the algorithm for load–flow calculation, showcases network models, illustrates an energy storage model, describes the load modeling approach and gives insights into the thermal aging behavior of grid-specific operating equipment.

3.1. Principles for Calculating Load–Flow Using the State-Space Representation

In general, the state-space representation is a mathematical tool used for modeling a state-determined system’s outputs for varying inputs u ̲ 1 ( t ) , u ̲ 2 ( t ) ,..., u ̲ n ( t ) , state-variables x ̲ 1 ( t ) , x ̲ 2 ( t ) ,..., x ̲ n ( t ) and output variables y ̲ 1 ( t ) , y ̲ 2 ( t ) ,..., y ̲ n ( t ) . It is commonly used for modeling the behavior of linear time-invariant (LTI) systems, as shown in Figure 6, taken from [36].
Rowell defines a state-determined system, in [37], as follows: “if a system is state-determined, knowledge of its state-variables x ̲ 1 ( t ) , x ̲ 2 ( t ) ,..., x ̲ n ( t ) = x ̲ ( t ) at some initial time t 0 and inputs u ̲ 1 ( t ) , u ̲ 2 ( t ) ,..., u ̲ n ( t ) = u ̲ ( t ) for t > t 0 is sufficient to determine all future behavior of the system”. In the following, all the state-space variables are referred to using the variable z. The derivatives z ̲ ˙ ( t ) of the n state-variables are expressed by a standardized set of n-coupled first-order, ordinary differential equations as a function of the state variables z ̲ ( t ) and the system’s output variables u ̲ ( t ) , as shown in (4).
z ˙ 1 = f 1 ( z ̲ , u ̲ , t ) , z ˙ 2 = f 2 ( z ̲ , u ̲ , t ) , . . . , z ˙ n = f n ( z ̲ , u ̲ , t ) = z ˙ ̲ ( t )
These variables can be combined and equally expressed by the vector z ˙ ̲ ( t ) . The corresponding set of n differential equations can be compactly expressed in matrix form, as illustrated by (5) and (6).
z ˙ ̲ 1 ( t ) z ˙ ̲ 2 ( t ) z ˙ ̲ n ( t ) = a ̲ 11 a ̲ 1 m a ̲ 21 a ̲ 2 m a ̲ n 1 a ̲ n m · z ̲ 1 ( t ) z ̲ 2 ( t ) z ̲ n ( t ) + b ̲ 11 b ̲ 1 m b ̲ 21 b ̲ 2 m b ̲ n 1 b ̲ n m · u ̲ 1 ( t ) u ̲ 2 ( t ) u ̲ n ( t )
z ̲ ˙ ( t ) = A ̲ · z ̲ ( t ) + B ̲ · u ̲ ( t )
The system’s output variables y ̲ 1 ( t ) , y ̲ 2 ( t ) ,..., y ̲ n ( t ) = y ̲ ( t ) can be expressed in similar fashion, as shown by (7), (8).
y ̲ 1 ( t ) y ̲ 2 ( t ) y ̲ n ( t ) = c ̲ 11 c ̲ 1 m c ̲ 21 c ̲ 2 m c ̲ n 1 c ̲ n m · z ̲ 1 ( t ) z ̲ 2 ( t ) z ̲ n ( t ) + d ̲ 11 d ̲ 1 m d ̲ 21 d ̲ 2 m d ̲ n 1 d ̲ n m · u ̲ 1 ( t ) u ̲ 2 ( t ) u ̲ n ( t )
y ̲ ( t ) = C ̲ · z ̲ ( t ) + D ̲ · u ̲ ( t )
The values of the coefficients in the matrices A ̲ and B ̲ are defined by the system’s properties and depend on its specific structure and elements. Furthermore, the matrices C ̲ and D ̲ are dependent on the chosen output variables y ̲ ( t ) .
Electrical networks can also be systematically defined and analyzed using the state-space representation, as described by Blenk [18]. In this case, the previously introduced matrices are initially defined by real, non-complex values: A , B , z ( t ) and u ( t ) . Transferring a network into the state-space is achieved by applying Kirchhoff’s current and voltage laws, yielding the system’s differential equations and, ultimately, resulting in an implicit system representation. After carrying out a few matrix operations (inversion, multiplication), the system is converted into its explicit form, so that its behavior is illustrated as shown by (6), (8). The angular functions (AC current and voltages) in the non-complex variables z ( t ) , u ( t ) can be simplified using traditional AC circuit theory and the complex plane ( z ( t ) , u ( t ) z ̲ ( t ) , u ̲ ( t ) ) . By considering the state-variables in the frequency domain, the derivatives contained in vector z ˙ ̲ ( t ) are simplified and transformed to complex variables: z ̲ ˙ ( t ) j ω · z ̲ ( ω ) . Under these considerations, at fixed frequencies ω = 2 π · 50 H z = 314 1 s = c o n s t . , the system’s steady-state can be described via a complex system of equations, as shown in (9).
j · z ̲ = A · z ̲ + B · u ̲
At fixed frequencies ω , the system’s steady-state variables z ̲ can be solved, by rearranging (9). This results in (10), where A and B comprise the network’s impedances, E represents the unit matrix and u ̲ contains all voltage and/or current sources featured within the system.
z ̲ = B j · E A · u ̲
In many cases, the network’s impedances are considered to remain constant over time (at least within a specific simulation interval) A , B = c o n s t . , thus allowing (10) to be simplified even further.
z ̲ = K ̲ · u ̲
As a result, the simplified vector–matrix multiplication, portrayed in (11), is sufficient to calculate the entire system’s state-variables z ̲ . This principle remains identical for calculating electrical networks independently of their respective sizes and is, therefore, also applicable to the calculation of sophistically intermeshed electrical networks, such as power grids. In this use case, the grid’s load flow is represented by the state-variables z ̲ and can be time-dependently computed for varying loads and renewable energy feed-ins with a single mathematical operation. The calculation of the grid’s load–flow is carried out by the state-space simulator, a software which is in development at IHEA and based on the previously depicted approach. The power grid, including all of its components, such as transformers, power lines, cables, generators, loads etc., are entered into a graphical editor. The electrical behaviors of these components are mirrored via parametrized equivalent circuit models (ECMs) [38] which are stored in the software’s component libraries. The state-space transformation, i.e., the derivation of the system of differential equations, relies on the aforementioned ECMs, as well as on the grid-specific interconnections of all respective components, and is conducted by an automated algorithm. The result of the state-space transformation algorithm corresponds to a minimalistic representation of the system in a symbolic matrix, which remains valid even for time-dependently fluctuating loads for the complete duration of the simulation. In comparison to conventional load flow algorithms, such as the Newton–Raphson approach, the recurring process of establishing and solving the Jacobian Matrix for each time step of the simulation is circumvented, which, consequently, increases efficiency and reduces the necessary computational requirements. Further details and advantages of using the state-space representation for carrying out load–flow calculations can be gathered from [9,38].

3.2. Network Model

The model region’s grid operator supplies electricity to around 91,000 inhabitants in both urban and rural medium-voltage distribution sub-grids [39]. During normal operation, these sub-grids function independently. However, in the case of faults, or during maintenance work, the power grids may be coupled at various points to continuously provide electricity to their customers. The research project intends to analyze the electricity sector’s normal operating conditions, wherefore each sub-grid’s behavior is independently replicated with an individual network model. By relying on data sets provided by the grid operator, such as the electrical network plans illustrating the positioning and distribution of specific types of operating equipment (cables, transformers etc.), each sub-grid’s network model is manually assembled, based on data being entered within a graphical editor. The graphical editor (“Schematic Editor”) uses the drag-and-drop principle and enables arbitrarily placing and interconnecting components from an expandable component library. The model region’s grid-specific component types are added to the library, so that they can be specifically assigned to operating equipment. Each sub-grid is supplied by a 110/20 kV transformer, which has the task of balancing the grid’s residual load. In the network model, this role is fulfilled by the slack node, which is typically connected to a centrally placed bus bar. The bus bar represents the switching-station responsible for distributing power to each of the sub-grid’s individually connected feeders (the switchgear’s electrical behavior is not accounted for). Each feeder has a unique structure, containing a varied number of 20/0.4 kV distribution transformers and electrical loads and can feature varying degrees of intermeshing. The realization and implementation of these feeders is conducted according to the grid operator’s specifications. Exemplary electrical feeder and sub-grid excerpts, taken directly from the graphical editor, are shown in Figure 7 and Figure 8, respectively.

3.3. Energy Storage Systems

An additional sector-coupling technology integral to the research project directly associated with the electricity sector, is the stationary ESS. In Germany, these kinds of storage systems have been gaining popularity because of their combined applications with residential PV systems, as shown by [40]. This trend is justified by the potential increase in self-consumption enhancing the profitability of these kinds of systems, illustrated by the overview of case studies presented by [41]. In addition, the potential and future applicability of large-scale battery storage systems are also being analyzed by various pilot projects in Germany, depicted by the status report of [42]. This sub-section showcases the ESS model.
Within the research project, stationary ESSs are also accounted for. The development of ESSs is derived by the metrics described in [4] and mainly depends on the scenario-based expansion of roof-mounted PV systems. The cumulative flexibility provided by ESSs at the n t h node, at time step t, is given by S ̲ f l e x , e , n ( t ) ,
S ̲ f l e x , e , n ( t ) = S ̲ e , c h , n ( t ) S ̲ e , d c h , n ( t )
where S ̲ e , c h , n ( t ) is the cumulative apparent power being drawn and S ̲ e , d c h , n ( t ) being fed back into the system at the n t h node.
Modeling the electrical behavior of electrochemical storage systems (such as lithium-ion batteries) can be realized in numerous ways, commonly relying on ECM [43]. These models can yield high degrees of accuracy, but rely on a highly precise, elaborate component parametrization. A study conducted by [44] analyses a variety of ECMs and evaluates their usefulness. Despite the high obtainable degrees of accuracy, implementing these principles within the research project is not feasible, due to the models’ high complexity and the inevitable parametrization process. Instead, a simpler approach merely requiring the system’s ampacity I B a t , C r a t e d and initial state of charge (SoC) S o C ( t 0 ) is more suited. The principles of the so-called “coulomb counting”, illustrated by [45], are applied to the ESS SoC estimation within the research project. In this context, the cumulative SoC S o C n ( t ) at timestep t and node n can be calculated,
S o C n ( t ) = S o C n ( t 1 ) + Δ S o C n ( t )
where the change in SoC resulting at time step t Δ S o C n ( t ) is expressed by:
Δ S o C n ( t ) = 1 C r a t e d , n · [ η c h · I c h , n ( t ) η d c h · I d c h , n ( t ) I l o s s , n ( t ) ] · Δ t
The system’s charging and discharging efficiencies η c h , η d c h and internal losses I l o s s ( t ) can be easily incorporated. Furthermore, the charging/discharging currents I c h , n ( t ) , I d c h , n ( t ) are determined in dependency of S ̲ f l e x , e , n ( t ) . These calculations are applied for ESS at each of the power grid’s nodes. The constraints that must be adhered to by the optimization layer are characterized by the ESS fundamental parameters, including the minimum and maximum charge and discharge currents I m i n , n , I m a x , n (typically defined by the C-rate) and the charging boundaries C m i n , n , C r a t e d , n . Accordingly, the ESS power values specified by the optimization, must comply with (15), (16).
I m i n , n I c h , n ( t ) , I d c h , n ( t ) I m a x , n
C m i n , n S o C n ( t ) · C r a t e d , n C m a x , n

3.4. Load Modeling

Ensuring that the electricity sector’s simulation model achieves high levels of conformity with the model region’s power grid is very dependent on the accuracy of the load modeling approach. As Figure 8, each of the sub-grid’s feeders have numerous electrical loads, each of which illustrates the representative loading behavior of a single node. In essence, the grid operator’s data sets, containing the information of 60,000 consumers and 2250 generators, must be properly superposed and cumulated, so that they can be systematically mapped to the medium-voltage distribution grid’s 600 nodes. On the basis of this data, a time-dependent, seasonal load profile P n ( t ) must be generated for each node n. This process is described in the following sub-section.
In the preceding sections, all power values were introduced as complex apparent powers. However, in terms of analyzing the potentials of sector-coupling technologies, the reactive power share is non-significant, and, therefore, only real powers are incorporated into the load modeling process.
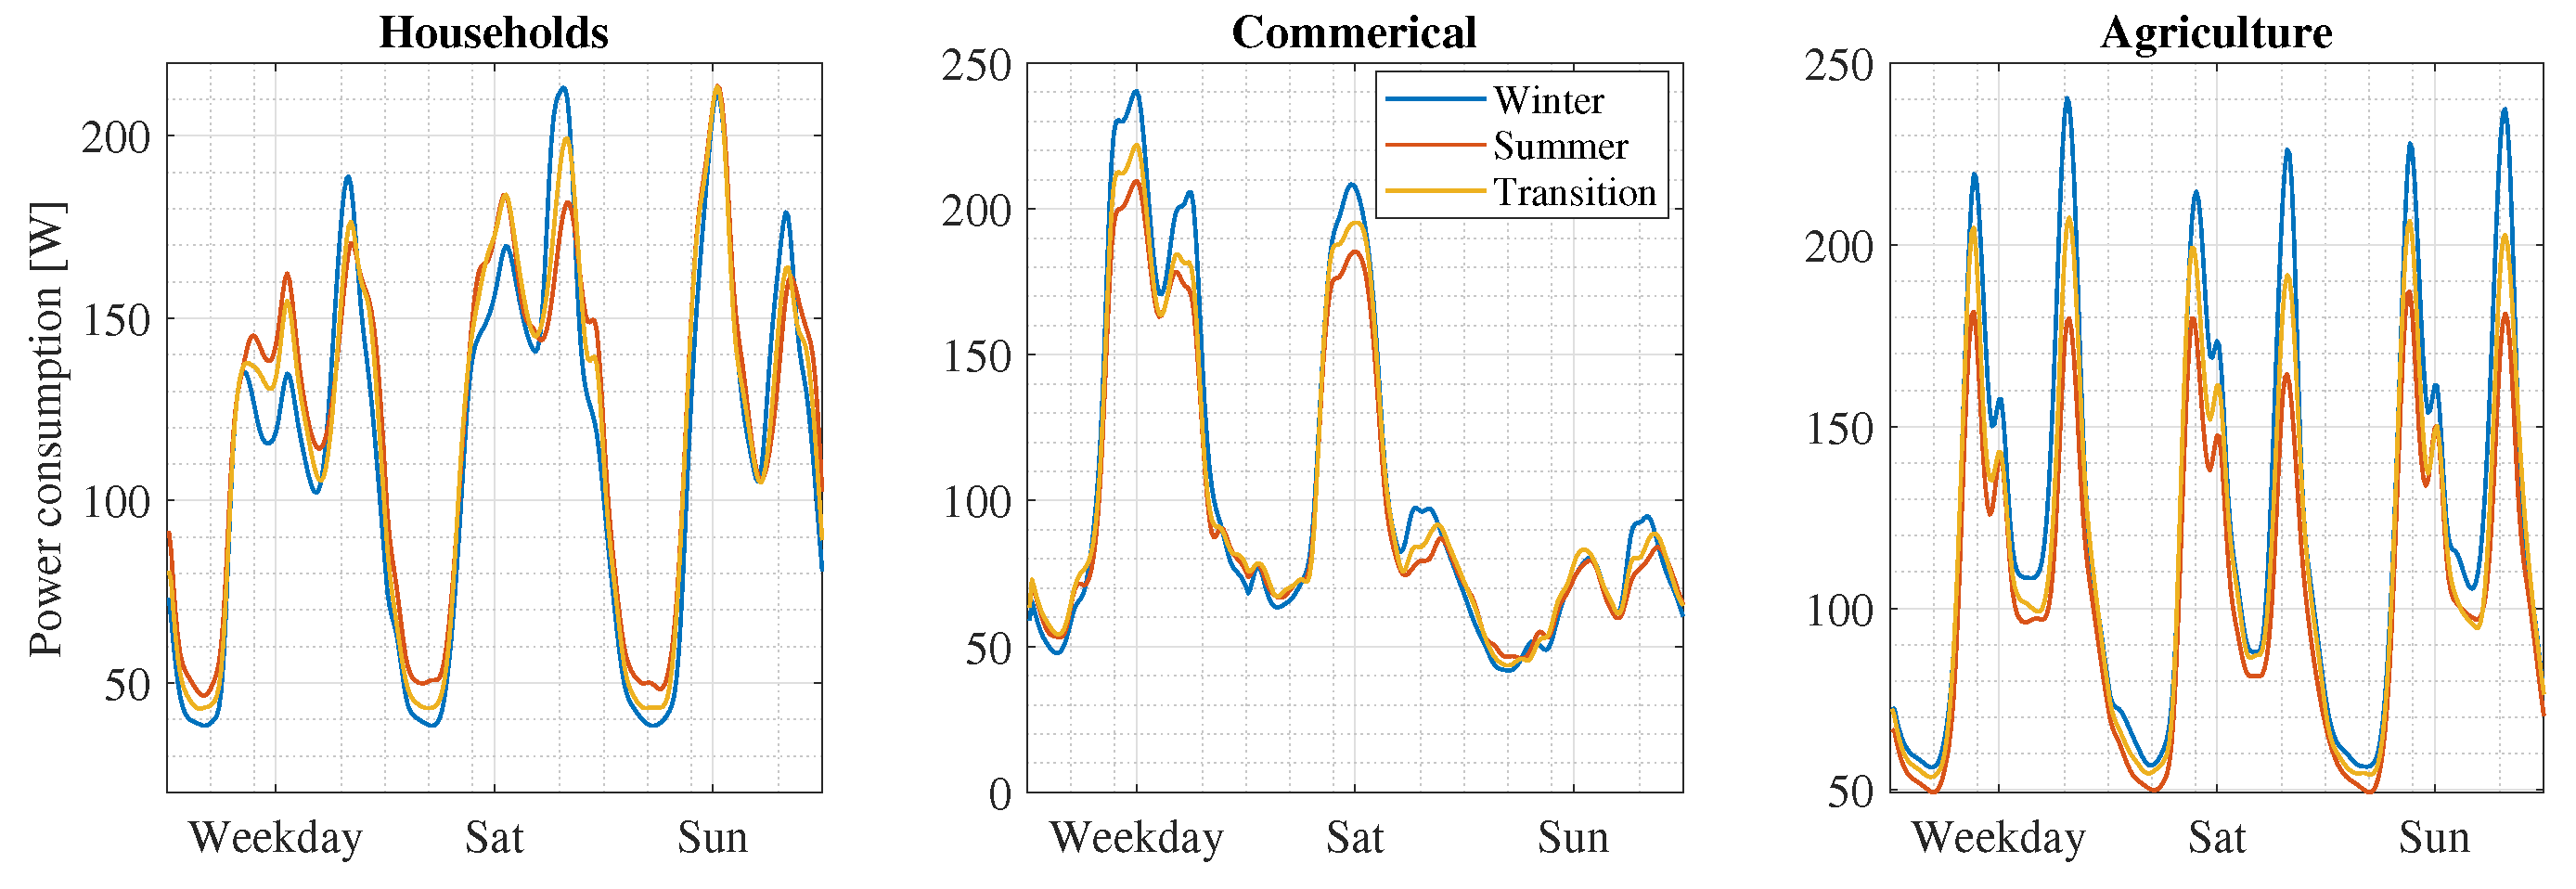
A large majority of consumers stem from the private and commercial sectors, having power consumption that is not directly measured. Instead, an annual meter reading is the only quantifiable value available for characterizing these customers. On top of that, a qualitative parameter categorizes these customers into specific groups (including household ( H 0 ), commercial ( G 0 ), agriculture ( L 0 ), and street lighting ( SB 0 )). Deriving a specific customer’s time-dependent power consumption requires an additional source of data. This additional data source is provided by standardized load profiles ( SLP ), which dictate the normalized power consumption of typecast consumer groups across the course of a day (24 h). In Germany, SLPs were initially introduced by the VDEW in 1999 and are still used by many grid operators today [46]. Some of the most relevant SLPs are shown in Figure 9.
The previously illustrated profiles are standardized to a fixed energy quantity E n o m (typically 1000 kWh). Thus, a customer’s loading behavior P ( t ) with an annual energy consumption E a , can be calculated for time step t by referring to the correct profile and scaling the standardized curve’s value P S L P , n o m ( t ) with an appropriate scaling factor S F , as shown in (17)
P S L P ( t ) = P S L P , n o m ( t ) · S F
where,
S F = E a E n o m
In an iterative process, the corresponding node, consumption type and annual energy quantity are specified for each of the 60,000 consumers. As a result, the consumer data can be matched to a distinct node and the energy quantity added to the specific SLP consumption type. By carrying out this procedure and applying it to the entire consumer data set, the cumulative, node-specific annual SLP energy quantities are determined for each of the 600 nodes and inserted into (18). Thus, the node-specific scaling factors S F n , H 0 , S F n , G 0 , S F n , L 0 , S F n , S B 0 (for each of the SLP consumption types) are established. The power values P n , H 0 ( t ) , P n , G 0 ( t ) , P n , L 0 ( t ) , P n , S B 0 ( t ) are calculated via the previously highlighted scaling factors and the respective standardized power values from each of the profiles, as specified in (17). The total power consumption at the n t h node, at time step t stemming from SLP customers P C , S L P , n ( t ) is given by (19).
P C , S L P , n ( t ) = P n , H 0 ( t ) + P n , G 0 ( t ) + P n , L 0 ( t ) + P n , S B 0 ( t )
In Germany, large consumers of energy ( E a > 100,000 kWh) are legally obligated [47] to temporally record their power consumption using the so-called registering load measurement (RLM) and to transmit this data to the grid operator. These time series are available for referencing within the scope of the load modeling process. For each node n, all affiliated RLM time series (1… N) are totaled.
P C , R L M , n ( t ) = i = 1 N R C , R L M , n , i ( t )
High flexibility is required to enable a simple approach of representing varying future simulation scenarios. In this manner, technological advances in the form of efficiency increases, or other kinds of restructuring, may be accounted for. This additional variance is implemented by the introduction of power-specific scaling factors α . Equations (19) and (20) are adjusted accordingly.
P C , S L P , n ( t ) = α H 0 , n · P n , H 0 ( t ) + α G 0 , n · P n , G 0 ( t ) + α L 0 , n · P n , L 0 ( t ) + α S B 0 , n · P n , S B 0 ( t )
P C , R L M , n ( t ) = i = 1 N α R L M , n , i · R C , R L M , n , i ( t )
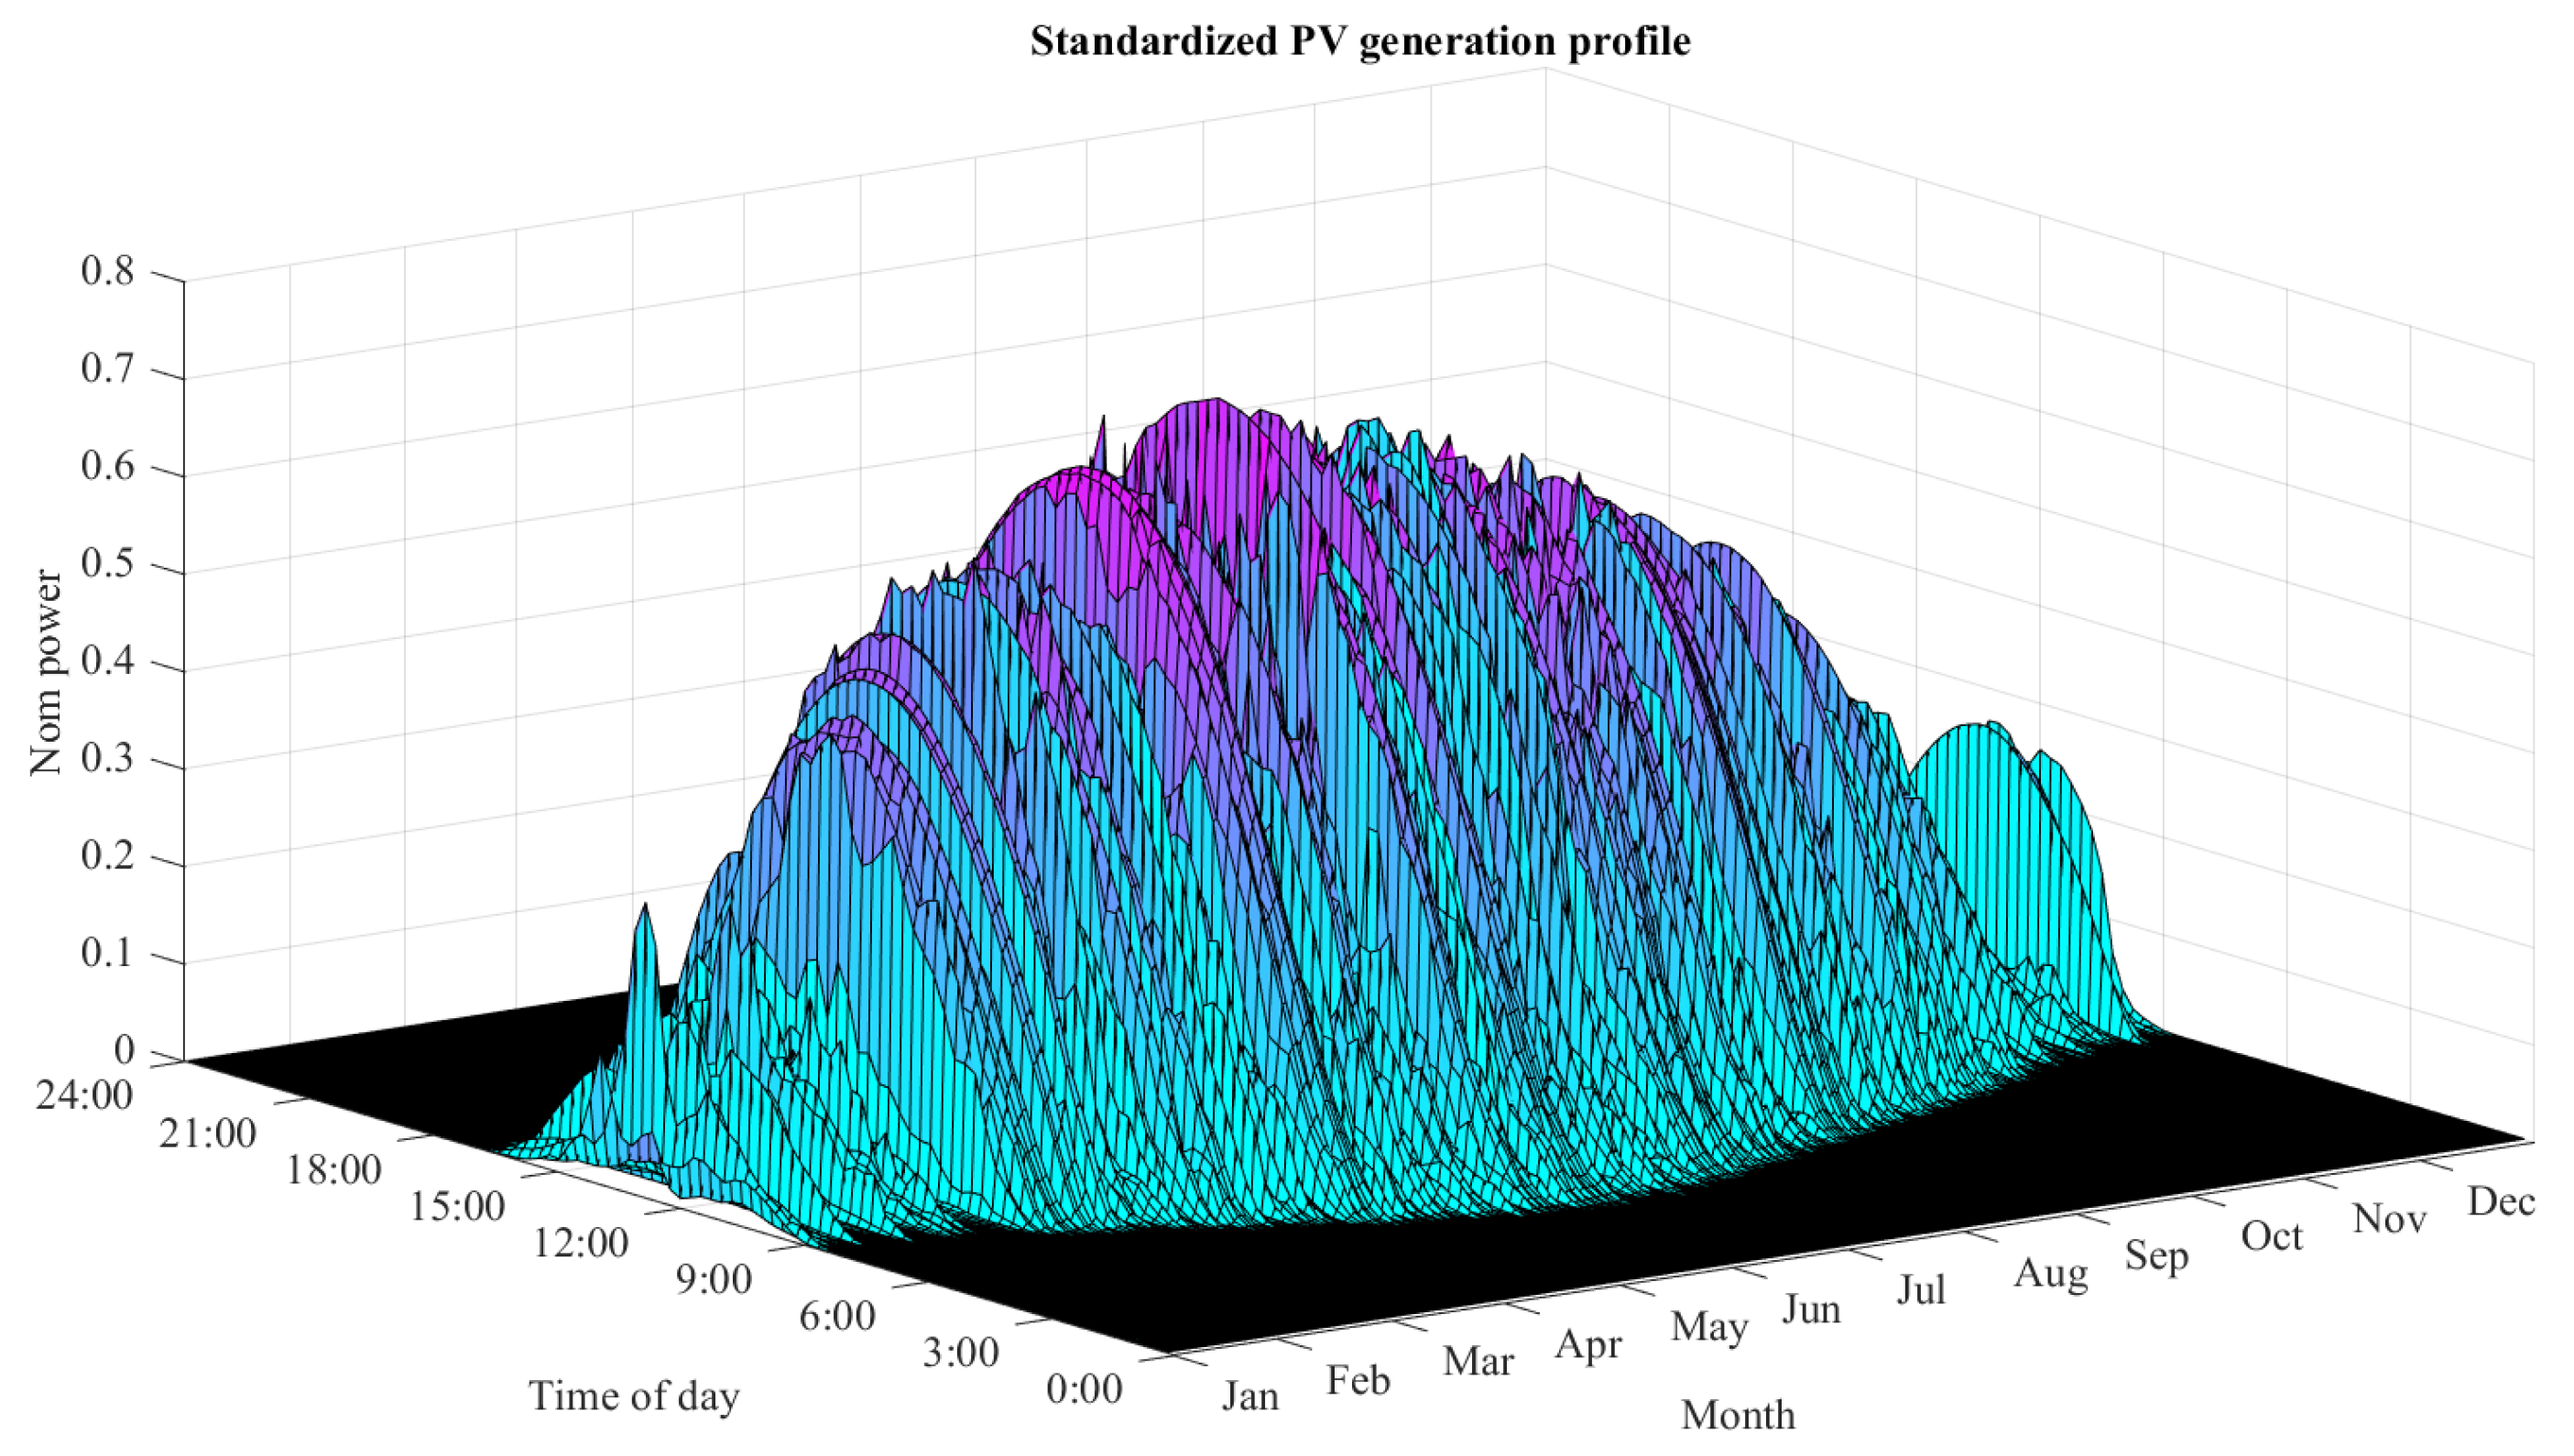
Power generation is a second quantity influencing the n t h node’s load profile P t o t , n ( t ) . Similar to the previous considerations, power generation is also split up into two groups. First, the power generation of smaller generation plants (e.g., private PV-systems) is considered. The data provided by the grid operator merely specifies the nominal power of these generators. For this reason, standardized generation profiles (SGP) are mandatory for temporally modeling the feed-in behavior of these generators. This is especially pivotal for PV-generation, as this type of energy generation is dominant for the model region. Incorporating local circumstances is critical, whereby local weather data (solar irradiance, temperature) must be considered within the standardized profiles. To visualize this concept, the local SGP for PV-generation (2021) is shown in Figure 10. The SGPs are standardized to a nominal power rating (in this case 1 kW). The time-dependent power generation P S G P ( t ) is obtained by multiplying the system’s rated power P r with the standardized profile’s values P S G P , n o m ( t ) at time step t. These types of profiles are used to depict the feed-in behavior of PV, CHP, biomass and hydropower generation plants.
P S G P ( t ) = P S G P , n o m ( t ) · P r
Each node’s cumulative, type-specific, scenario-specific power generations are determined by iteratively considering every power generation unit in the model region and totaling the node-specific rated powers P n , r , P V , P n , r , C H P , P n , r , b i o , P n , r , h y d r o . By referring to the type-specific SGB and inserting the respective aforementioned rated powers, the power generation values P n , P V ( t ) , P n , C H P ( t ) , P n , b i o ( t ) , P n , h y d r o ( t ) are calculated, as shown in (23). Sequentially, the total SGP power generation at the n t h node, at time step t P G , S G P , n ( t ) , is portrayed by (24).
P G , S G P , n ( t ) = P n , P V ( t ) + P n , C H P ( t ) + P n , b i o ( t ) + P n , h y d r o ( t )
In accordance to the RLM consumption time-series, large generation units are also obliged to report their temporal generation data to the grid operator via RLM. The generation time-series are also referenceable, wherefore their integration is carried out in the same manner as (20), shown in (25).
P G , R L M , n ( t ) = i = 1 N P G , R L M , n , i ( t )
If the optimization layer aims to include and conduct feed-in management (FIM) (especially for RESs), the previously established power contributions serve as constraints for the optimization process. A node-specific power balance P t o t , n ( t ) is established using all of the previously specified power contributions. Generally, each node’s power balance includes a constant P c o n s t , n ( t ) and flexible share P f l e x , n ( t ) .
P t o t , n ( t ) = P c o n s t , n ( t ) + P f l e x , n ( t )
The power balance’s constant share P c o n s t , n ( t ) constitutes the fixed power contributions, which cannot be altered by the optimization. Under the assumption that the optimization does not include a feed-in management, P c o n s t , n ( t ) is determined by (27).
P c o n s t , n ( t ) = P C , S L P , n ( t ) + P C , R L M , n ( t ) + P G , S G P , n ( t ) + P G , R L M , n ( t )
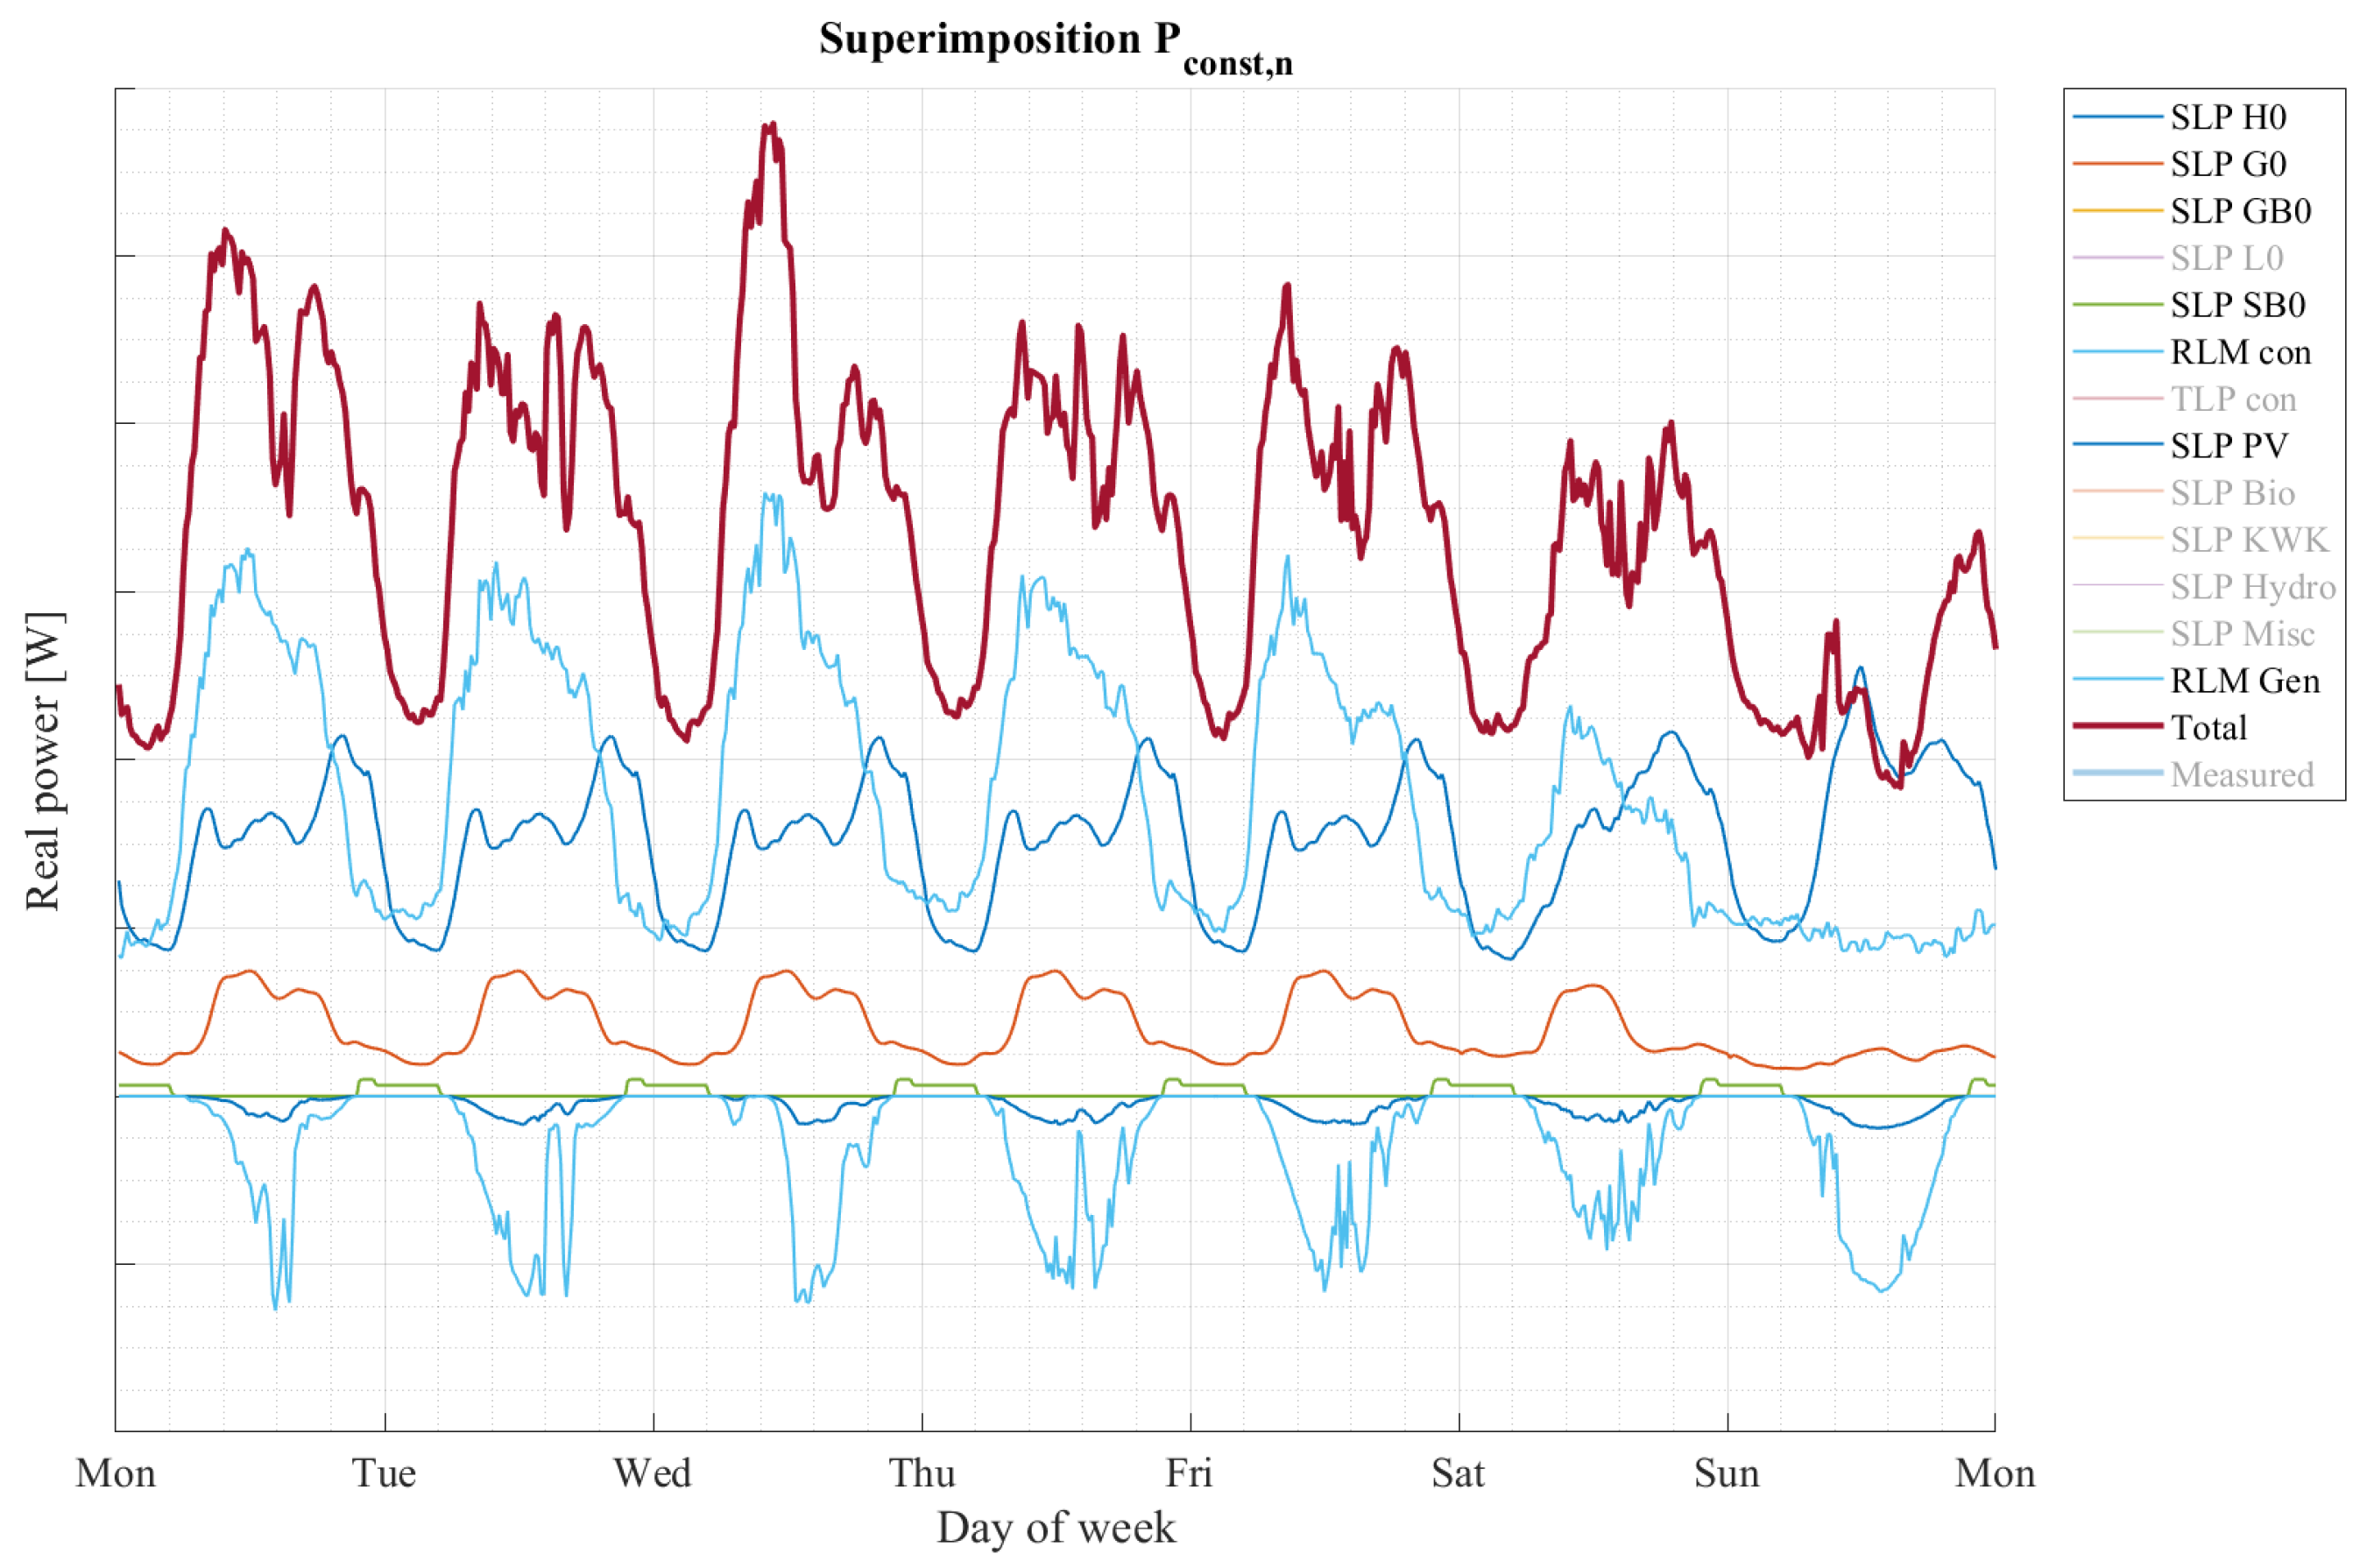
The superposed constant share’s power balance P c o n s t , n ( t ) is shown in Figure 11 for an exemplary node.
The optimized flexibilities introduced by the sector-coupling technologies’ power contributions are embedded in P f l e x , n ( t ) .
P f l e x , n ( t ) = P f l e x , m , n ( t ) + P f l e x , h , n ( t ) + P f l e x , g , n ( t ) + P f l e x , e , n ( t )
The flexible power shares in (28) portray additional loads influencing the node-specific power balance P t o t , n ( t ) (essentially resulting in an increased number of superposed plots in Figure 11). If an FIM system is implemented as part of the optimization algorithm, the power generation values serve as additional flexibilities. As a result, P f l e x , n ( t ) would incorporate these additional power values. However, these considerations are not accounted for within the context of this paper.
In conclusion, the suggested load modeling approach accounts for the different consumer types and generation units connected at each node, whilst also providing an option for integrating the power flexibilities of the sector-coupling technologies for the different simulation scenarios. As a result, time-dependent, representative load profiles are mathematically superposed for each node. The resulting time-series are easily referenceable by the load flow calculation’s algorithm.

3.5. Thermal Aging of Operating Equipment

Gauging and assessing the power grid’s operating conditions plays an essential part in the research project. In the scope of ESM-Regio, aging models are considered and implemented within the simulation model to assess the load-dependent aging factors of essential operating equipment. The following sub-section showcases the aging models for operating equipment relying on oil-immersed or synthetic cross-linked polyethylene (XLPE) insulation materials.
For technical equipment, the term life expectancy refers to the time that a technical system or object can be used without the replacement of core components or complete failure [48]. In regards to electrical operating equipment, DIN IEC 60505 states that electrical, thermal, mechanical and environmental stresses directly influence aging behavior [49]. Completely accounting for all of the aforementioned aging mechanisms with high accuracy is not viable. Details concerning mechanical and environmental stresses are not fully available as part of the electricity sector’s simulation model, directly eliminating the consideration of these influences within ESM-Regio. Electrical aging describes the effects of the electric field and voltage gradients on the insulation material’s parameters and properties which can potentially lead to partial discharges, treeing, electrolysis etc. [49]. Research conducted by [50,51] analyzes the changes in physiochemical (via Fourier transform infrared spectroscopy, X-ray diffraction) and dielectric properties (via differential thermogravimetry) resulting from artificial electrical aging. Comparatively, thermal aging is defined as the physiochemical changes resulting from degradation reactions, and polymerization and depolymerization due to increased operating temperatures [49]. Experimental research carried out by [52,53] illustrates how, for different insulation materials, electrical properties, such as volume resistivity and dissipation factors, as well as mechanical properties, including tensile strength and elongation at rupture, are influenced, over time, by varying levels of thermal stress.
The research and test results of artificial aging experiments are often used to create or parameterize already existing aging models with the intention of approximating life expectancy for variable operating/stress conditions in calculations, e.g., [54]. The literature review [55] showcases commonly used mathematical electrical and thermal aging models and multi-stress models. In this context, electrical aging is commonly defined by the inverse-power-law (IPL) and thermal aging by the Arrhenius equation. IPL (29) describes the relationship between electrical stress E and remaining life time t f ,
t f = t 0 · E E 0 b
where E 0 is the electrical life threshold at which the insulation exhibits the lifetime t 0 and b is the voltage endurance coefficient (defining the slope graph in double logarithmic representation).
The Arrhenius Equation (30) describes the kinetics of chemical reactions which are also applicable for the decomposition reactions of insulation materials, as specified by the standard DIN IEC 60216-7 [7],
K = k · e E a R · T
where K is equal to the reaction speed, k the pre-exponential factor, E a the activation energy, R the Boltzmann-constant and T the temperature (Kelvin).
Under the assumption that life expectancy L is inversely proportional to K, the Arrhenius equation can be written as shown in (31), with the constants α , β and the hotspot temperature Θ H .
L ( Θ H ) = α · e β Θ H
An alternative thermal aging model (specifically developed for oil-insulated operating equipment) is based on early research by Montsinger [56] and suggests a reference temperature threshold Θ r e f alongside a doubling factor Δ T at which the insulation material’s life expectancy is halved.
L ( T ) = L r e f 2 Θ H Θ r e f Δ T
Needless to say, insulation materials are not exposed to individual stress levels during real operation, so multi-level aging models may describe the general aging behavior more accurately. An overview of these multi-level models, including their respective pros and cons, is included in [55]. However, accurately establishing and parameterizing any of the aforementioned multi-factor aging models is dependent on experimental research and data acquisition which is out of ESM-Regio’s focus. Instead, inaccuracies arising from the usage of single-stress models are conceded to facilitate a more simplistic modeling approach. All operating points within the electricity sector’s simulation model refer to steady-state values, in which the system’s voltages tend to remain fairly constant (analogous to real operations, where the maximum permissible voltage deviation is ± 10 % according to DIN EN 50160 [57]). Consequently, the electrical aging behavior is relatively stagnant (as intrinsic switching events are not considered) and largely independent of the grid’s load. In contrast, the temperature stress level of operating equipment is directly related to its respective ampacity translating to load-dependent thermal aging. The thermal aging model’s simplicity and its load-dependency are ideally suited to, and comply with, the research project, thereby eliminating IPL from the scope of the research project’s considerations. In general, load-dependent aging factors need to be determined for the relevant types of operating equipment, such as transformers and cables, each of which is considered in the following.
The transformers under consideration are oil-immersed power transformers, having loading and aging behaviors illustrated by both the IEEE loading guide [58] and DIN IEC 60076-7 [59]. The IEEE standard also includes typical values for parametrizing (31) where α = 9.8 × 10 18 and β = 15 , 000 . Using these specifications, an accelerated aging factor (in comparison to a reference temperature Θ r e f ) F A A ( Θ H ) for variable temperatures Θ H can be determined.
F A A ( Θ H ) = α · e β Θ r e f α · e β Θ H = e 15 , 000 Θ r e f 15 , 000 Θ H
Calculating the accelerated aging factor merely requires the transformer’s hot-spot temperature Θ H as an input variable. The hot-spot temperature’s calculation Θ H is also included in [58],
Θ H = Θ a + Δ Θ T O + Δ Θ H
requiring the ambient temperature Θ a , the top-oil rise over ambient temperature Δ Θ T O and the winding hottest-spot rise over top-oil temperature Δ Θ H . The latter two terms comprise the transformer’s load-dependency and are calculated using exponential expressions containing type-specific thermal time constants. The initial and ultimate (steady-state) temperatures are calculated via the transformer’s loading percentage, depending on the respective cooling system, ratio of losses (at load – no load) and rated temperature values. Further details can be gathered from [58]. As a result, the load-dependent hot-spot temperature of any transformer within the electricity sector’s simulation model can be determined and directly input into the thermal aging model (31) to assess its thermal aging behavior.
Modern medium-voltage distribution cables are typically based on XLPE insulation materials. However, older insulation technologies, such as paper insulated lead covered cables (PILC), remain in use, also within the model region. Both cable types must be considered in regard to their thermal aging behaviors. On the one hand, a PILC relies on the same insulation material as oil-immersed transformers, and [60] suggests that the parameters listed in [58] may be transferable; although, unfortunately, experimental proof is not provided. As a result of this uncertainty in [60], relying instead on determined data. experimentally determined by [61]. for modeling the thermal aging behavior of PILC using Montsinger’s rule, is preferred. The annual degeneration rate at a reference temperature D r e f ( T r e f = 15 C) = 0.5% is given, equivalent to a reference life expectancy of 200 years. Furthermore, the doubling factor Δ T = 6.5 C is also specified. On the other hand, XLPE cables are based on a more modern insulating material which can operate at higher temperatures.
The thermal aging behavior can also be illustrated with the Arrhenius equation. Many researchers across the globe have carried out artificial aging experiments to establish/parameterize XLPE cable thermal aging models. A commonly chosen approach is to artificially age XLPE insulation material (e.g., according to DIN EN 60811-401 [62]) at different temperature levels until an end-of-life criterion, such as “50% of retention of elongation at break”, is reached. The resulting aging times are recorded and serve as the fundamental data used for establishing an Arrhenius plot. Equation (30) is mathematically transformed, yielding a linear representation of the Arrhenius equation.
l n K = E a R · 1 T + l n k
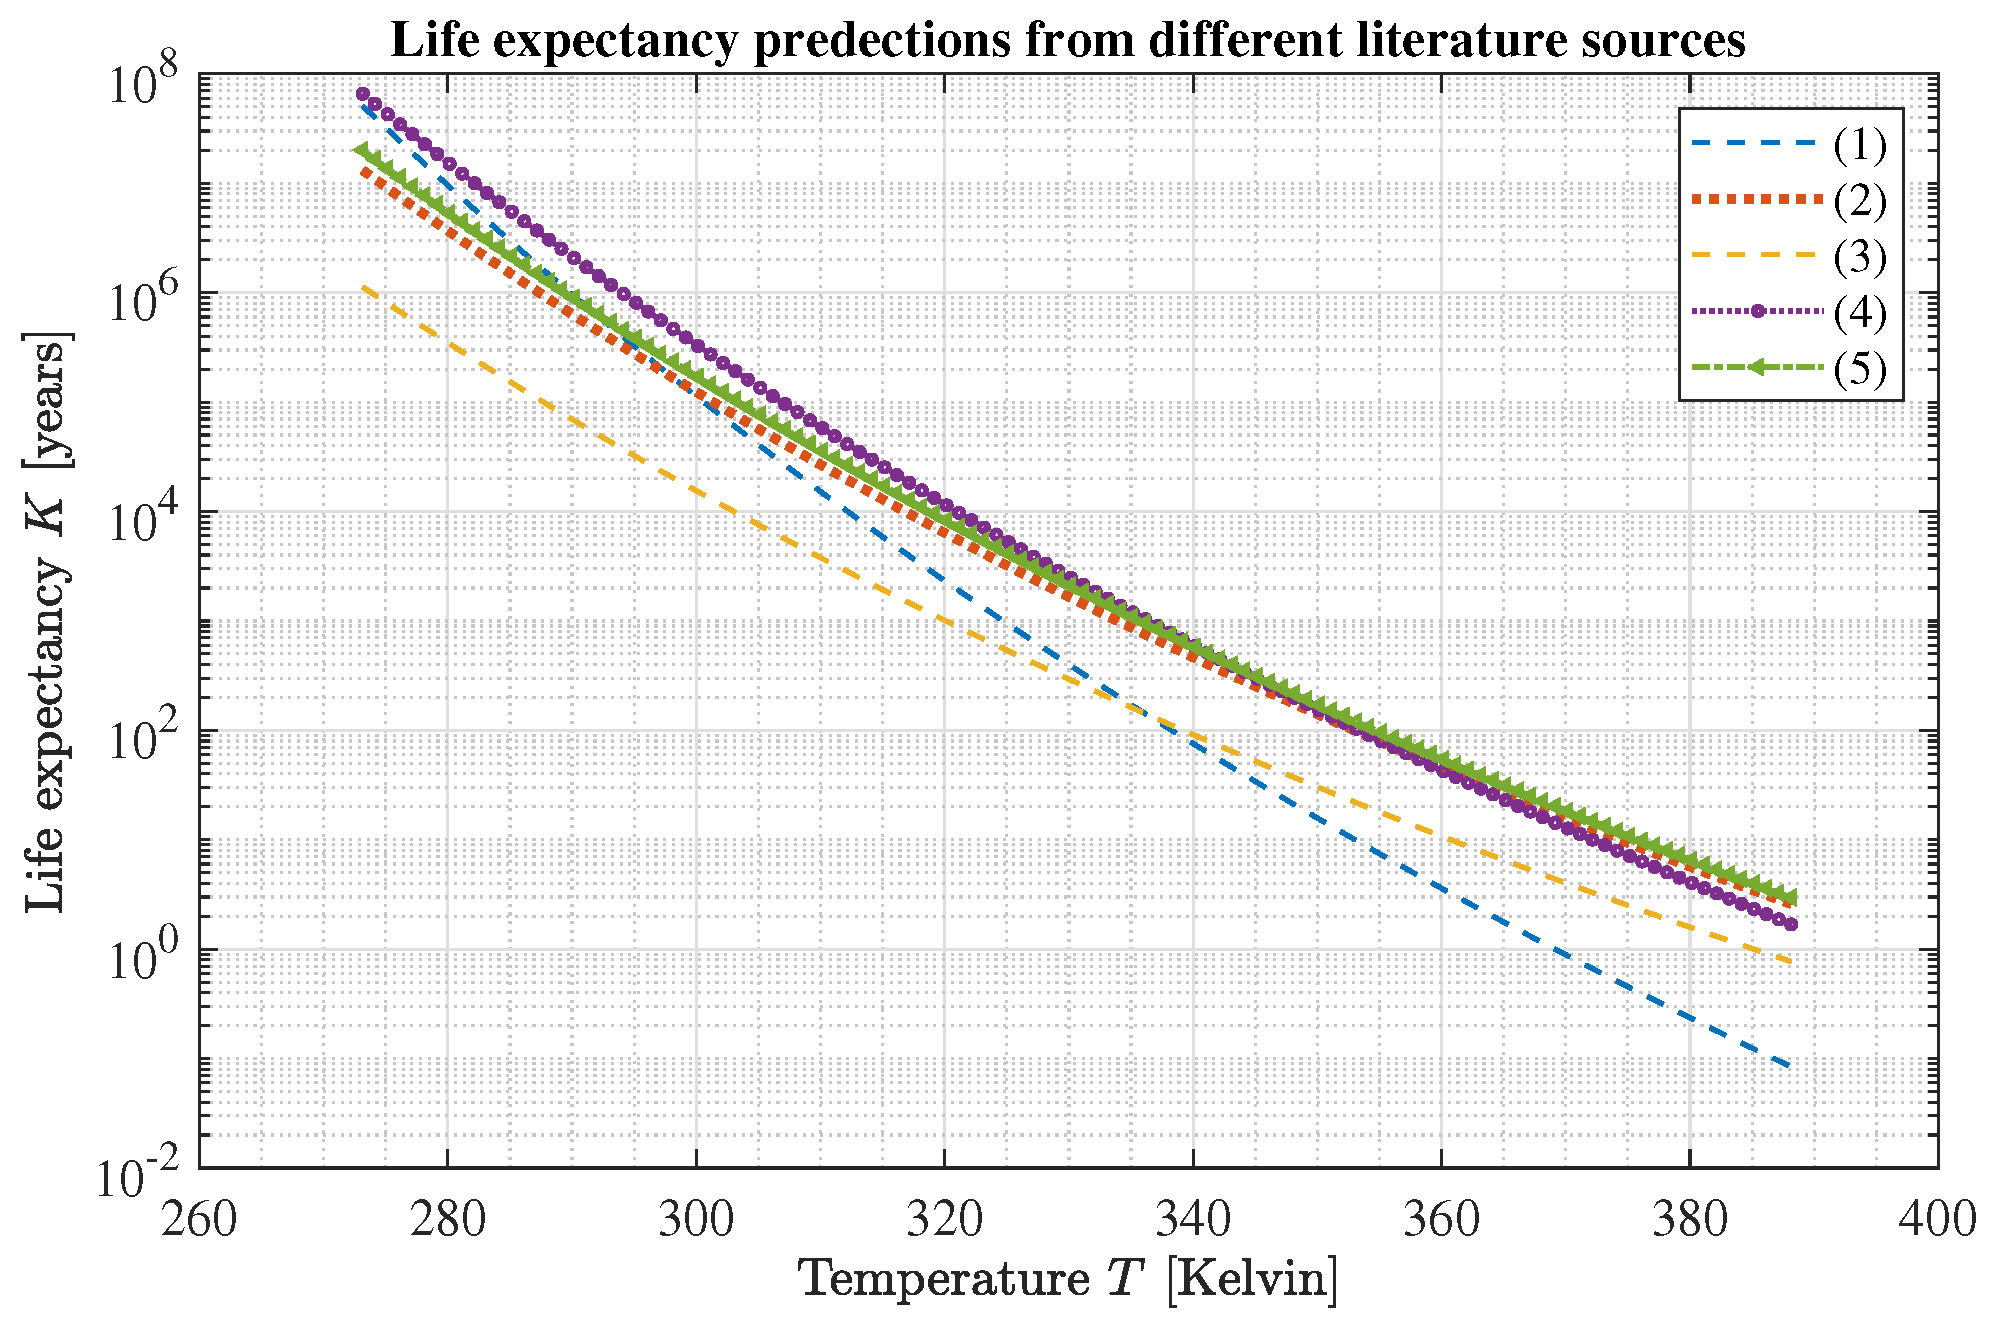
By mathematically fitting a regression line to the experimentally determined Arrhenius plot data and considering its slope and y-intercept, the parameters E a , k parametrizing the thermal aging model are established. Experiments relying and implementing this methodology were carried out by [54,63,64,65]. The previously referenced transformer standards describing loading behavior do not exist for XLPE cables. As a result, the Arrhenius parameters in (30) are based on existing research and literature which are illustrated in Figure 12.
Predicting which of the models in Figure 12 best replicates the model region’s XLPE cables is practically impossible without having access to specific comparative experimental/measurement data. Alternatively, the models best fitting the generally accepted and quoted life expectancy (at rated conditions) of 30–40 years [67] are averaged and used for the load-dependent assessment of XLPE cables within the research project. In this context, the model parameters provided by [63,65,66] are referenced. The thermal aging models of both cable types require the cable’s conductor temperature Θ c as an input variable. The conductor temperature depends on the ambient temperature Θ a and the cable’s load-dependent temperature change Δ Θ c .
Θ c = Θ a + Δ Θ c
The temperature change Δ Θ c in (36) can be expressed as a ratio of dissipation powers, and, as a result (disregarding the temperature-dependent conductor resistance) of the currents’ squares,
Δ Θ c = ( Θ m a x Θ a ) · P d P d , r a t e d = Θ m a x Θ a · I ̲ c I r a t e d 2
where Θ m a x is the highest permissible conductor temperature, P d the current power dissipation, P d , r a t e d power dissipation at rated load, I ̲ c the current conductor current and I r a t e d the cable’s highest rated power. Further details and in-depth analysis concerning the approximation of Δ Θ c are given in [60,68].
Inserting the conductor currents I ̲ c specified by the load–flow calculation into (36), enables any cable’s conductor temperature Θ c to be approximated. Depending on the cable type, the conductor temperature is entered into either (31) or (32), thus specifying a temperature-dependent life expectancy L or aging factor F A A .
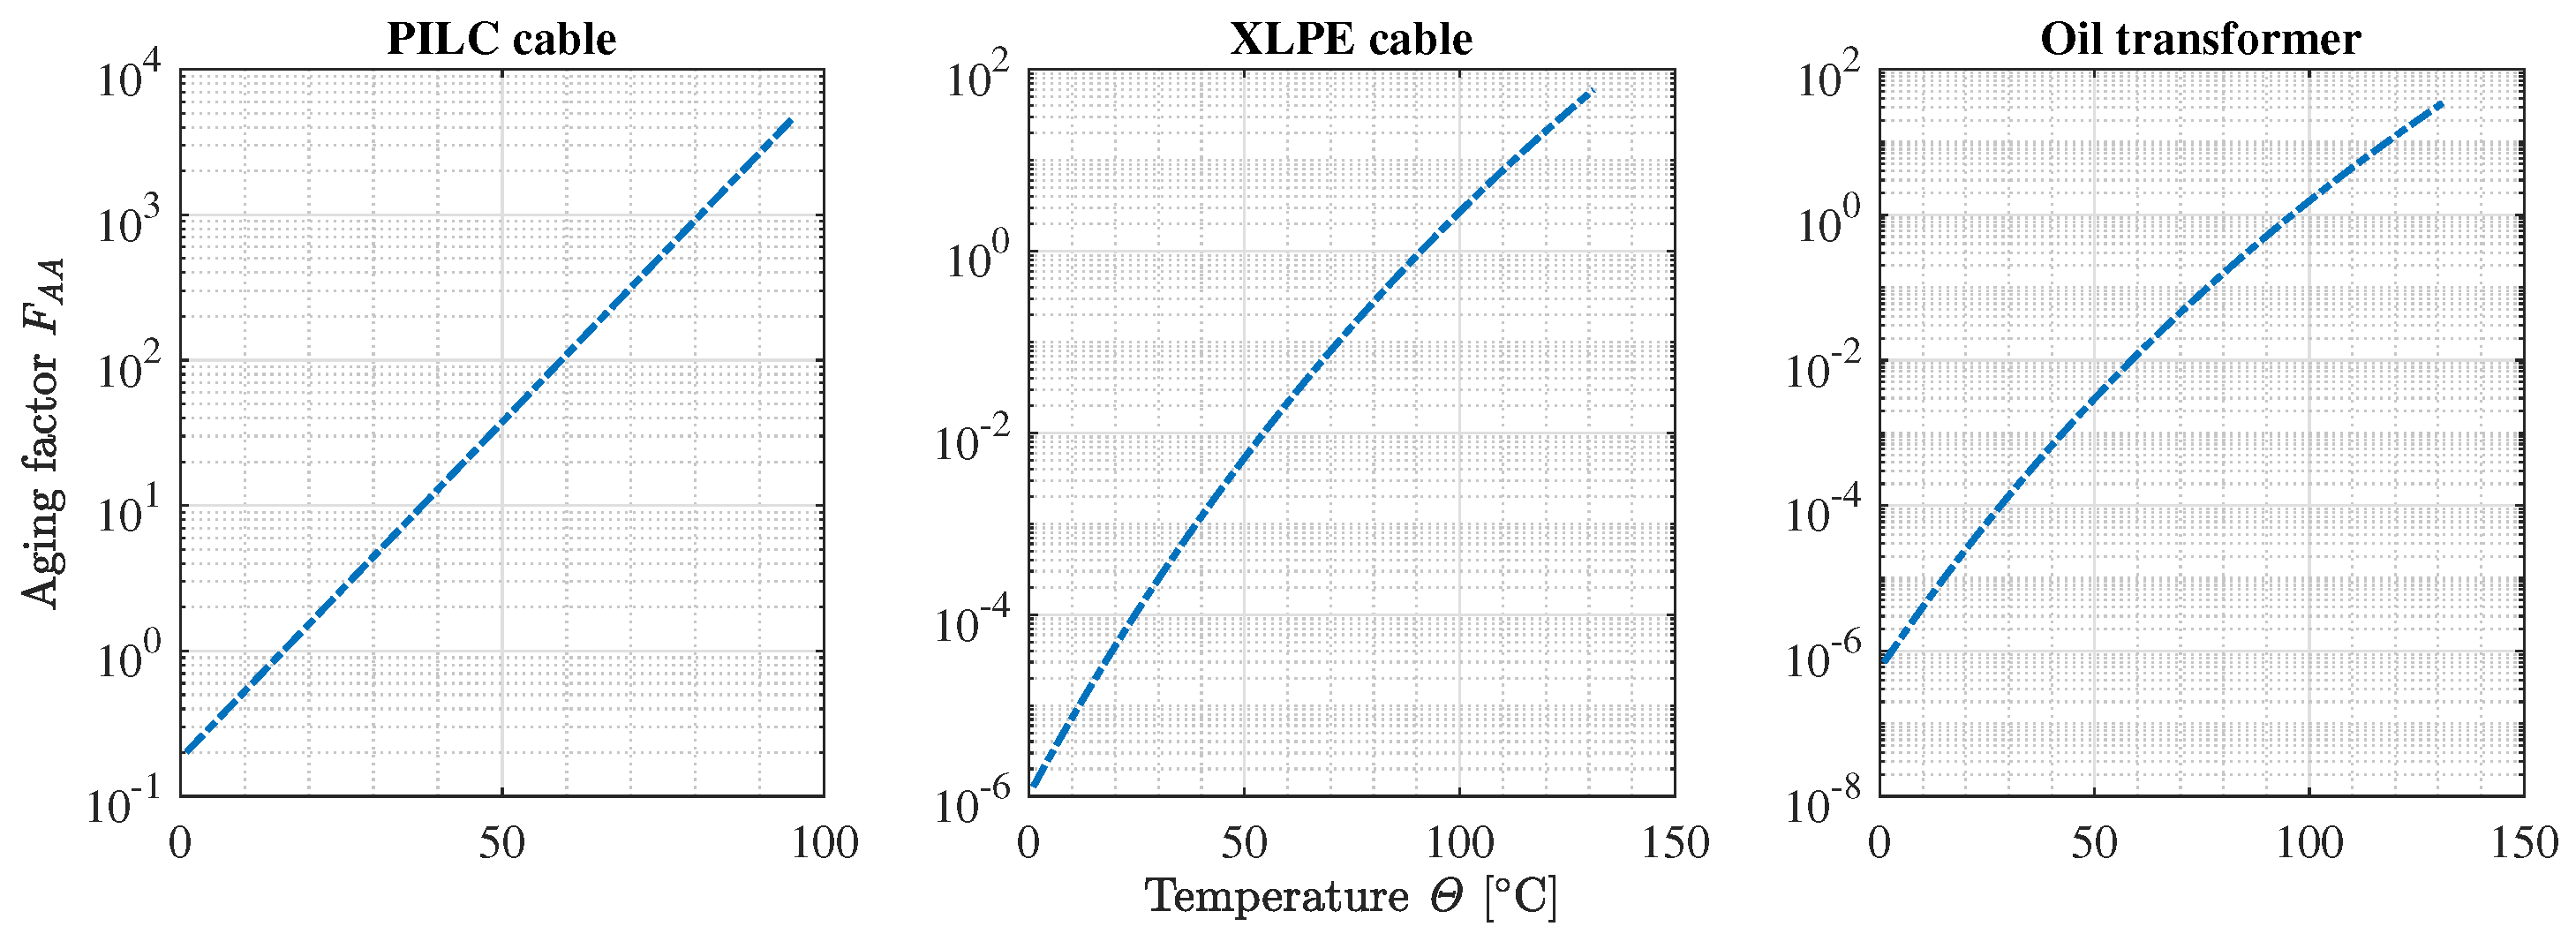
The previously showcased thermal aging models are implemented in a callable function within the simulation model. The function’s input requires the type of operating equipment to be able to reference the correct model. Additionally, the time series depicting the loading currents used to calculate the respective temperature development must also be provided. Figure 13 illustrates the function’s internally implemented aging models depicting the load- and temperature-dependent aging factors for different types of operating equipment (based on the previously highlighted considerations).

4. Conclusions

This paper highlights the key principles and methods used for implementing the electricity sector’s simulation model within the research project ESM-Regio. Although no specific results regarding the research project’s model region have been produced, the feasibility and validity of the state-space calculation algorithm are showcased and systematically compared to other established algorithms in [38], showcasing promising results. In light of these results, each of the sub-grid’s simulative network models strives to replicate the power grid’s real structure, operating equipment and loads as realistically as possible. This includes the particularly significant load modeling approach, which utilizes a node-specific power balance to efficiently compress the grid operator’s extensive consumption and generation data sets. Increased variability is obtained through the use of power-specific scaling factors which can be individually set to change any node’s loading behavior, effectively enabling the representation of arbitrary future simulation scenarios. Incorporating the sector-coupling technologies’ power contributions is achieved by merely expanding the node-specific power balance. As a result, an effective method for providing representative load profiles, depicting the nodes’ seasonal loading behavior for various simulation scenarios, is realized. Assessing the power grid’s operating conditions is conducted by considering the load-dependent aging behavior of indicative, critical operating equipment. The system’s load–flow is derived using the state-space-based load–flow calculation, upon which the asset’s loading percentages are determined. The conductor/hotspot temperatures are gauged in relation to the asset’s respective loading percentage and input to the thermal aging models. These thermal aging models output a load-dependent aging factor/life expectancy serving as an assessment factor for the optimization process. In conclusion, the provided methods and models contribute in implementing a simulation model which is able to iteratively calculate an electrical, sector-coupled system’s load–flow and gauge its operating conditions, based on indicative specific assets’ thermal aging behavior.

5. Outlook

This paper’s presented methods outline the fundamental approaches being implemented within the electricity sector’s simulation model in the scope of the research project ESM-Regio. Once the network models have been fully established, a future case study will be carried out to validate the novel algorithm’s load–flow calculation. This process will involve assembling each sub-grid’s network model in a separate, state-of-the-art load–flow simulator and comparing the simulation results. Furthermore, the electrical load modeling approach will be evaluated for each sub-grid by comparing the modeled loads with directly measured power data which is grid-specifically recorded (present state) by the system operator. In addition, the derivation and parameterization of future scenarios concerning the electricity sector and its simulation model are considered and outlined. After a successful validation, first load–flow calculations will be carried out to hopefully provide the necessary data to assess the optimization process and the specific effectiveness of using sector-coupling technologies as flexibilities.
Applying and transferring the methods presented within this paper is an important aspect. In principle, the state-space-based load–flow calculation may be used to calculate an arbitrary power grid, provided that a suitable network model is available. Establishing these state-space-based models is currently conducted via a manual process conducted in a graphical editor. However, this process may be further automated in the future to, for example, enable autonomous importing of existing network models (stemming from other software), so their load-flows can be calculated in the state-space. In addition, the introduced load modeling approach is also transferable but needs to incorporate local circumstances in order to provide realistic results. This is especially true for the standardized load and generation profiles which may vary depending on the generation and consumption behavior specific to a certain power grid. Needless to say, the locally, directly measured energy consumption and generation time series also need to be available to enable using the load modeling approach introduced in this paper.

Author Contributions

In the context of this paper, S.B. was responsible for writing the original draft, methodology, formal analysis and software. C.W. also contributed in writing, specifically in the review and editing process as well as supervision and methodology. All authors have read and agreed to the published version of the manuscript.

Funding

The research project ESM-Regio (03EI1036B) is funded by the German Federal Ministry for Economic Affairs and Climate Action.

Data Availability Statement

The fundamental data used for the future results is not publicly available as it is subject to data protection.

Conflicts of Interest

The authors declare no conflict of interest. The funders had no role in the design of the study; in the collection, analyses, or interpretation of data; in the writing of the manuscript, or in the decision to publish the results.

References

  1. Mohajan, H. The Second Industrial Revolution has brought Brought Modern Social and Economic Developments. J. Sci. Humanit. 2020, 6, 7. [Google Scholar]
  2. The European Green Deal; European Union: Brussels, Belgium, 2019.
  3. Climate Action Plan for 2050 Principles and Goals of the German Government’s Climate Policy; Federal Ministry for the Environment, Nature Conservation, Building and Nuclear Safety: Berlin, Germany, 2016.
  4. Bundesnetzagentur, Genehmigung des Szenarienrahmens 2023–2037/2045. Available online: https://www.netzentwicklungsplan.de/sites/default/files/2023-01/Szenariorahmen_2037_Genehmigung.pdf (accessed on 13 April 2023).
  5. Mohajan, H.; Schmietendorf, K.; Peinke, J.; Kamps, O. The impact of turbulent renewable energy production on power grid stability and quality. Eur. Phys. J. B 2017, 90, 222. [Google Scholar]
  6. Tavakoli, A.; Saha, S.; Arif, M.T.; Haque, M.E.; Mendis, N.; Oo, A.M.T. Impacts of grid integration of solar PV and electric vehicle on grid stability, power quality and energy economics: A review. IET Energy Syst. Integr. 2020, 2, 243–260. [Google Scholar] [CrossRef]
  7. DIN IEC 60216-7; Elektroisolierstoffe-Eigenschaften Hinsichtlich des Thermischen Langzeitverhaltens. IEC: Geneva, Switzerland, 2015.
  8. Gellings, C.W. The concept of demand-side management for electric utilities. Proc. IEEE 1985, 73, 1468–1470. [Google Scholar] [CrossRef]
  9. Model Project ESM-Regio: Optimization of the Energy System via Sector Coupling, Model Project for the Energy System in a Sample Bavarian Region. Available online: https://www.bayern-innovativ.de/de/seite/esm-regio-en (accessed on 14 April 2023).
  10. Daniel Scharrer, Reinhard German, Beiratstreffen ESM-Regio. Available online: https://www.bayern-innovativ.de/uwao-api/faila/files/bypath/pdf-dokumente/cluster-energietechnik/esm-regio/2022-04-06-zwischenberichte-beiratstreffen.pdf?mod=2022-05-18T07:30:14.637Z&published=false (accessed on 14 April 2023).
  11. Schwab, A.J. Elektro-Energiesysteme, 2. Auflage; Springer: Berlin/Heidelberg, Germany, 2008; ISBN 978-3-540-92226-1. [Google Scholar]
  12. Schäfer, K.F. Netzberechnung; Springer: Wiesbaden, Germany, 2020; ISBN 978-3-658-26732-2. [Google Scholar]
  13. Albadi, M. ‘Power Flow Analysis’, Computational Models in Engineering; IntechOpen: London, UK, 2020. [Google Scholar]
  14. Risi, B.-G.; Riganti-Fulginei, F.; Laudani, A. Modern Techniques for the Optimal Power Flow Problem: State of the Art. Energies 2022, 15, 6387. [Google Scholar] [CrossRef]
  15. Coutinho de Oliveira, C.; Bonini Neto, A.; Alves, D.A.; Minussi, C.R.; Castro, C.A. Alternative Current Injection Newton and Fast Decoupled Power Flow. Energies 2023, 16, 2548. [Google Scholar] [CrossRef]
  16. Varghese, J.P.; Sundaramoorthy, K.; Sankaran, A. Development and Validation of a Load Flow Based Scheme for Optimum Placing and Quantifying of Distributed Generation for Alleviation of Congestion in Interconnected Power Systems. Energies 2023, 16, 2536. [Google Scholar] [CrossRef]
  17. Mišurović, F.; Mujović, S. Numerical Probabilistic Load Flow Analysis in Modern Power Systems with Intermittent Energy Sources. Energies 2022, 15, 2038. [Google Scholar] [CrossRef]
  18. Blenk, T.; Weindl, C. Characteristics and Advantages of a State-Space Orientated Calculation in Regenerative Energy Systems. In Proceedings of the 2022 International Conference on Diagnostics in Electrical Engineering (Diagnostika), Pilsen, Czech Republic, 6 September 2022. [Google Scholar]
  19. Luc VAN NUFFEL, Sector Coupling: How Can It Be Enhanced in the EU to Foster Grid Stability and Decarbonize. Available online: https://www.europarl.europa.eu/RegData/etudes/STUD/2018/626091/IPOL_STU(2018)626091_EN.pdf (accessed on 14 April 2023).
  20. Anteil der Elektroautos Am Bestand der Personenkraftwagen in Deutschland von 2013 Bis 2023, KBA. 2023. Available online: https://de.statista.com/statistik/daten/studie/784986/umfrage/marktanteil-von-elektrofahrzeugen-in-deutschland/ (accessed on 14 April 2023).
  21. Mwasilu, F.; Justo, J.J.; Kim, E.K.; Do, T.D.; Jung, J.W. Electric vehicles and smart grid interaction: A review on vehicle to grid and renewable energy sources integration. Renew. Sustain. Energy Rev. 2014, 34, 501–516. [Google Scholar] [CrossRef]
  22. Ravi, S.S.; Aziz, M. Utilization of Electric Vehicles for Vehicle-to-Grid Services: Progress and Perspectives. Energies 2022, 15, 589. [Google Scholar] [CrossRef]
  23. Agentur Für Erneuerbare Energien, Endenergieverbrauch in Deutschland im Jahr 2019 Nach Strom, Wärme und Verkehr. Available online: https://www.unendlich-viel-energie.de/media/image/54221.AEE_Endenergieverbrauch_Strom_Waerme_Kraftstoffe_2019.jpg (accessed on 17 April 2023).
  24. AGEB Infographik Endenergieverbrauch Deutschland. Available online: https://ag-energiebilanzen.de/wp-content/uploads/2023/01/AGEB_Infografik_07_2023_Anwendungsbilanzen_2021.pdf (accessed on 17 April 2023).
  25. AEE Endenergieverbrauch füR Wärme und Kälte in Deutschland (Nach Energieträger) Grafik. Available online: https://www.unendlich-viel-energie.de/mediathek/grafiken/in-der-waermeversorgung-dominiert-in-deutschland-erdgas-mit-einem-anteil-von-fast-43-prozent-im-jahr-2020 (accessed on 17 April 2023).
  26. BMWk: Aktuelle Informationen. Erneuerbare Energien im Jahr 2022. Available online: https://www.erneuerbare-energien.de/EE/Navigation/DE/Service/Erneuerbare_Energien_in_Zahlen/Aktuelle-Informationen/aktuelle-informationen.html (accessed on 17 April 2023).
  27. BDEW, Beheizungsstruktur des Wohnungsbestandes in Deutschland, Anteile der Genutzten Energieträger, July 2022. Available online: https://www.bdew.de/service/daten-und-grafiken/beheizungsstruktur-wohnungsbestand/#:~:text=Seit%201995%20hat%20sich%20die,um%202%20%25%2DPunkte%20zu (accessed on 17 April 2023).
  28. Umweltbundesamt, Arbeitsgemeinschaft Energiebilanzen, KWK-Nettostromerzeugung Nach Energieträngern. 2022. Available online: https://www.umweltbundesamt.de/daten/energie/kraft-waerme-kopplung-kwk#kwk-anlagen (accessed on 17 April 2023).
  29. BDEW, BDEW-Gaspreisanalyse Januar 2023, Haushalte. 2023. Available online: https://www.bdew.de/media/original_images/2023/02/09/bdew-gaspreisanalyse_januar-2023.pdf (accessed on 17 April 2023).
  30. Bundesregierung Energiesicherheit: Klimafreundliche und Krisensichere Energieversorgung. Available online: https://www.bundesregierung.de/breg-de/themen/klimaschutz/energieversorgung-sicherheit-2040098 (accessed on 17 April 2023).
  31. BMWK, Dritter Fortschrittsbericht Energiesicherheit, Berlin. 2022. Available online: https://www.bmwk.de/Redaktion/DE/Downloads/Energie/20220720_dritter-fortschrittsbericht_energiesicherheit.pdf?__blob=publicationFile&v=12 (accessed on 17 April 2023).
  32. Zapf, M. Stromspeicher und Power-to-Gas im Deutschen Energiesystem; Springer Fachmedien Wiesbaden: Wiesbaden, Germany, 2017. [Google Scholar]
  33. Clegg, S.; Mancarella, P. Storing renewables in the gas network: Modelling of power-to-gas seasonal storage flexibility in low-carbon power systems. IET Gener. Transm. Distrib. 2016, 10, 566–575. [Google Scholar] [CrossRef]
  34. Herz, G.; Rix, C.; Jacobasch, E.; Müller, N.; Reichelt, E.; Jahn, M.; Michaelis, A. Economic assessment of Power-to-Liquid processes—Influence of electrolysis technology and operating conditions. Appl. Energy 2021, 292, 116655. [Google Scholar] [CrossRef]
  35. Stiftung Klimaneutralität, Agora Energiewende, Agora Verkehrswende, BDI, Dena, BMWK, Ariadna-Kopernikus-Projekte, Vergleich der “Big” Klimaneutralitätsszenarien. 2022. Available online: https://ariadneprojekt.de/media/2022/03/2022-03-16-Big5-Szenarienvergleich_final.pdf (accessed on 17 April 2023).
  36. Braun, A. Dynamische Systeme Modellierung Mit den Methoden der Laplace-Transformation; Springer: Wiesbaden, Germany, 2019; pp. 103–104. [Google Scholar]
  37. Rowell, D. 2 . 14 Analysis and Design of Feedback Control Systems State-Space Representation of LTI Systems. 2002. Available online: http://web.mit.edu/2.14/www/Handouts/StateSpace.pdf (accessed on 16 June 2023).
  38. Blenk, T.; Weindl, C. Fundamentals of state-space based load flow calculation of modern energy systems. Energies, 2023; in press. [Google Scholar]
  39. Stadtwerke Bayreuth, Veröffentlichung Netzrelevanter Daten STROM Nach dem Energiewirtschaftsgesetz (EnWG). 2021. Available online: https://www.stadtwerke-bayreuth.de/fileadmin/user_upload/netz/Netzinformation/strom-netzrelevanter-daten.pdf (accessed on 17 April 2023).
  40. BVES, BVES Branchenanalyse 2022, Entwicklung und Perspektiven der Energiespeicherbranche in Deutschland, Berlin. 2022. Available online: https://www.bves.de/wp-content/uploads/2022/12/BVES-Branchenanalyse-2022_v1.pdf (accessed on 15 March 2023).
  41. Rasmus, L.; Joakim, W.; Daniel, N.; Jenny, P. Photovoltaic self-consumption in buildings: A review. Appl. Energy 2015, 142, 80–94. [Google Scholar] [CrossRef] [Green Version]
  42. Figgener, J.; Stenzel, P.; Kairies, K.-P.; Linßen, J.; Haberschusz, D.; Wessels, O.; Robinius, M.; Stolten, D.; Sauer, D.U. The development of stationary battery storage systems in Germany—Status 2020. J. Energy Storage 2021, 33, 101982. [Google Scholar] [CrossRef]
  43. Thakkar, R.R. Electrical equivalent circuit models of lithium-ion battery. Manag. Appl. Energy Storage Devices 2022. [Google Scholar] [CrossRef]
  44. Hu, X.; Li, S.; Peng, H. A comparative study of equivalent circuit models for Li-ion batteries. J. Power Sources 2012, 198, 359–367. [Google Scholar] [CrossRef]
  45. Analog Devices, Coulomb Counting. Available online: https://www.analog.com/media/en/technical-documentation/technical-articles/a-closer-look-at-state-of-charge-and-state-health-estimation-techniques.pdf (accessed on 15 March 2023).
  46. Meier, H.; Fünfgeld, C.; Adam, T.; Schieferdecker, B. Repräsentative VDEW-Lastprofile. 1999. Available online: https://www.bdew.de/media/documents/1999_Repraesentative-VDEW-Lastprofile.pdf (accessed on 17 April 2023).
  47. Verordnung üBer den Zugang zu Elektrizitätsversorgungsnetzen (Stromnetzzugangsverordnung—StromNZV). 2005. Available online: https://www.gesetze-im-internet.de/stromnzv/BJNR224300005.html (accessed on 17 April 2023).
  48. Bajenescu, T. Zuverlässige Bauelemente Für Elektronische Systeme: Fehlerphysik, Ausfallmechanismen, Prüffeldpraxis, Qualitätsüberwachung; Springer Fachmedien Wiesbaden: Wiesbaden, Germany, 2020. [Google Scholar] [CrossRef]
  49. DIN EN 60505 VDE 0302-1; Bewertung und Kennzeichnung von elektrischen Isoliersystemen. IEC: Geneva, Switzerland, 2012.
  50. Hedir, A.; Slimani, F.; Moudoud, M.; Lamrous, O.; Durmus, A.; Fofana, I. Effects of electrical aging on the structural and physicochemical properties of crosslinked polyethylene (XLPE) cable insulation material. Eng. Res. Express 2022, 4, 015038. [Google Scholar] [CrossRef]
  51. Li, W.; Zheng, W.; Ren, L.; Li, H.; Zhao, X.; Wang, C.; Li, J. A Comparative Study on the Insulation Ageing of 10 kV XLPE Cable via Accelerated Electrical Test and Accelerated Water Tree Test. J. Electr. Eng. Technol. 2022, 17, 475–484. [Google Scholar] [CrossRef]
  52. Mecheri, Y.; Bouazabia, S.; Boubakeur, A.; Lallouani, M. Effect of thermal Ageing on the Properties of XLPE as an Insulating Material for HV Cables. In Proceedings of the International Electrical Insulation Conference; IET Centre: Birmingham, UK, 2013. [Google Scholar]
  53. Lawson, W.G.; Simmons, M.A.; Gale, P.S. Thermal Ageing of Cellulose Paper Insulation. IEEE Trans. Electr. Insul. 1977, EI-12, 61–66. [Google Scholar] [CrossRef]
  54. Alghamdi, A.S.; Desuqi, R.K. A study of expected lifetime of XLPE insulation cables working at elevated temperatures by applying accelerated thermal ageing. Heliyon 2020, 6, e03120. [Google Scholar] [CrossRef] [Green Version]
  55. Choudhary, M.; Shafiq, M.; Kiitam, I.; Hussain, A.; Palu, I.; Taklaja, P. A Review of Aging Models for Electrical Insulation in Power Cables. Energies 2022, 15, 3408. [Google Scholar] [CrossRef]
  56. Montsinger, V.M. Loading Transformers By Temperature. Trans. Am. Inst. Electr. Eng. 1930, 49, 776–790. [Google Scholar] [CrossRef]
  57. DIN EN 50160; Merkmale der Spannung in öffentlichen Elektrizitätsversorgungsnetzen. IEC: Geneva, Switzerland, 2020.
  58. IEEE Std C57.91-2011; IEEE Guide for Loading Mineral-Oil-Immersed Transformers and Step-Voltage Regulators. IEEE: Toulouse, France, 2012; pp. 1–123, Revision of IEEE Std C57.91-1995. [CrossRef]
  59. DIN IEC 60076-7; Leistungstransformatoren: Leitfaden für die Belastung von mineralölgefüllten Transformatoren. IEC: Geneva, Switzerland, 2023. IEC: Geneva, Switzerland, 2023.
  60. Zapf, M.; Blenk, T.; Müller, A.-C.; Pengg, H.; Mladenovic, I.; Weindl, C. Lifetime Assessment of PILC Cables with Regard to Thermal Aging Based on a Medium Voltage Distribution Network Benchmark and Representative Load Scenarios in the Course of the Expansion of Distributed Energy Resources. Energies 2021, 14, 494. [Google Scholar] [CrossRef]
  61. Huifei, J. Application of Dielectric Loss Measurements for Life Consumption and Future Life Estimation Modeling of Oil-Impregnated Paper Insulation in HV Power Cables. Master’s Thesis, Delft University of Technology, Delft, The Netherlands, 2010. [Google Scholar]
  62. DIN EN 60811-401; Kabel, isolierte Leitungen und Glasfaserkabel - Prüfverfahren für nichtmetallene Werkstoffe. IEC: Geneva, Switzerland, 2012.
  63. Lin, J.; Cai, L. Research on the thermal aging life prediction of XLPE cable. In Journal of Physics: Conference Series; IOP Publishing: Bristol, UK, 2020; Volume 1570, p. 012050. [Google Scholar] [CrossRef]
  64. Li, G.; Wang, Z.; Lan, R.; Wei, Y.; Nie, Y.; Li, S.; Lei, Q. The lifetime prediction and insulation failure mechanism of XLPE for high voltage cable. IEEE Trans. Dielectr. Electr. Insul. 2022, 30, 761–768. [Google Scholar] [CrossRef]
  65. Sun, C.; Wang, C. Assessment Study of Aging Life for Typical Defects in XLPE Cable Joints. In Proceedings of the 2020 3rd International Conference on Advanced Electronic Materials, Computers and Software Engineering (AEMCSE), Shenzhen, China, 24–26 April 2020; pp. 772–777. [Google Scholar] [CrossRef]
  66. Mutepe, R.M.; Thango, B.A.; Bokoro, P.N. Practical Study on the Lifetime Prediction of High Voltage Cross-Linked Polyethylene Cable (XLPE) using Thermal Aging. In Proceedings of the 2023 31st Southern African Universities Power Engineering Conference (SAUPEC), Johannesburg, South Africa, 24–26 January 2023; pp. 1–4. [Google Scholar] [CrossRef]
  67. Neier, T.; Knauel, J.; Bawart, M.; Antipov, D.; Kim, S. A statistical method for stastical appraisal of the power cable conditions based on the TD and PD diagsnostics result. In E3S Web of Conferences; EDP Sciences: Les Ulis, France, 2019; Volume 124, p. 02014. [Google Scholar] [CrossRef] [Green Version]
  68. Bottler, S.; Blenk, T.; Weindl, C. An approach for determining load-dependent monetary assessment factors for PILC and XLPE cables within a load flow simulation. In Proceedings of the 2022 Global Energy Conference (GEC), Batman, Turkey, 26–29 October 2022; pp. 58–64. [Google Scholar] [CrossRef]
Figure 1. RES and gross electricity consumption development for 2037 and 2045.
Energies 16 04803 g001
Figure 2. Software architecture research project ESM-Regio.
Energies 16 04803 g002
Figure 3. Vehicle composition in the mobility sector in 2037 and 2045.
Energies 16 04803 g003
Figure 4. Development of P2H technologies in the heat sector (2037/2045). (a) District heating developments; (b) Heat pump developments.
Energies 16 04803 g004
Figure 5. Installed electrolysis capacities by 2037/2045.
Energies 16 04803 g005
Figure 6. State-determined LTI system.
Energies 16 04803 g006
Figure 7. Typical (exemplary) structure of a sub-grid’s feeder in the Schematic Editor.
Energies 16 04803 g007
Figure 8. Typical (exemplary) structure of a sub-grid in the Schematic Editor.
Energies 16 04803 g008
Figure 9. SLP provided by [46] for household, commercial and agriculture consumers.
Energies 16 04803 g009
Figure 10. PV SGP (specific to the model region).
Energies 16 04803 g010
Figure 11. Graphical illustration of the superposition of P c o n s t , n t .
Energies 16 04803 g011
Figure 12. Life expectancy predictions based on literature (1: [54], 2: [63], 3: [64], 4: [65], 5: [66]).
Energies 16 04803 g012
Figure 13. Thermal aging models of different types of operating equipment.
Energies 16 04803 g013
Disclaimer/Publisher’s Note: The statements, opinions and data contained in all publications are solely those of the individual author(s) and contributor(s) and not of MDPI and/or the editor(s). MDPI and/or the editor(s) disclaim responsibility for any injury to people or property resulting from any ideas, methods, instructions or products referred to in the content.