Article

The Influence of Storage Tank Volume on the Nighttime Heat Dissipation and Freezing Process of All-Glass Vacuum Tube Solar Water Heaters

1
Gansu Institute of Architectural Design and Research Co., Ltd., Lanzhou 730000, China
2
School of Urban Construction, Wuhan University of Science and Technology, Wuhan 430065, China
*
Author to whom correspondence should be addressed.
Energies 2023, 16(12), 4781; https://doi.org/10.3390/en16124781
Submission received: 22 May 2023 / Revised: 13 June 2023 / Accepted: 15 June 2023 / Published: 18 June 2023
(This article belongs to the Special Issue Application of Renewable Energy in Buildings)

Abstract

:
The issue of freezing often occurs when using all-glass vacuum tube solar water heaters during cold winter seasons, leading to problems such as pipe ruptures and tank leakage. In order to further study the nocturnal heat dissipation and freezing characteristics of these heaters, a three-dimensional transient numerical model of their nocturnal heat dissipation was established. The model simulated the nocturnal heat dissipation process, and experimental validations were conducted through nocturnal temperature drops of the collector and temperature drops of individual tubes without a storage tank. Experimental and simulation results revealed that in clear weather conditions during cold winters in Luoyang, the all-glass vacuum tube solar water heaters experienced freezing issues during the night, with freezing predominantly starting from the bottom surface of the vacuum tubes. The frozen length along the tube wall and the thickness of ice at the bottom section reached up to 1180 mm and 5 mm, respectively. In the absence of a storage tank, the freezing situation was severe, with approximately 4/5 of the individual tubes completely frozen. Under specified operating conditions, different storage tank volumes exhibited varying degrees of freezing in the all-glass vacuum tube solar water heaters. When the volume was increased to 15 L, the temperature drop in the storage tank and the vacuum tubes decreased by 12.1% and 7.6%, respectively. Larger storage tank volumes resulted in reduced freezing risks in all-glass vacuum tube solar collectors. This study provides valuable guidance for the design and application of solar collectors and serves as a reference for the development and application of solar energy utilization technologies.

1. Introduction

The all-glass vacuum tube solar water heater is an efficient, energy-saving, and environmentally friendly device that has gradually gained widespread application in various fields [1], especially in rural areas [2]. It utilizes the heat from the sun to heat water, significantly reducing the cost of traditional energy sources and minimizing environmental pollution. However, during extremely cold winters, the all-glass vacuum tube solar water heater may encounter freezing issues, leading to problems such as pipe ruptures and tank leakage. Therefore, conducting research on the freezing process of the all-glass vacuum tube solar water heater is of significant importance in improving its effectiveness in cold regions.
Currently, scholars from both domestic and international backgrounds have conducted in-depth research on solar thermal technologies from various perspectives and methods. The focus has mainly been on solar hot water systems, which convert solar energy into heat energy through flat-plate collectors to meet the daily hot water demand. With technological advancements, the types of solar collectors have expanded, such as vacuum tube collectors [3,4], photovoltaic-thermal integration systems [5,6], and more. Furthermore, the application areas of solar collectors have also diversified, including building heating [7,8], industrial heating [9], agricultural greenhouses [10,11], and others. Katsaprakakis, D. A. proposed a solar-combi system for hot water production and swimming pool heating in the Pancretan Stadium, Crete, Greece. The results show that the proposed system can provide significant energy savings and reduce greenhouse gas emissions [12]. Subsequently, a computational simulation and dimensioning study of solar-combi systems for large sports facilities were conducted, using the Pancretan Stadium in Crete, Greece, as a case study. The results show that the proposed solar-combi system can provide significant energy savings and reduce greenhouse gas emissions [13]. Roonak Daghigh et al. conducted a comprehensive theoretical and experimental analysis of the thermal performance of a solar water heating system equipped with an evacuated tube heat pipe collector. The study combined theoretical modeling and experimental measurements to evaluate the efficiency and effectiveness of the system. The results highlighted the system’s ability to efficiently utilize solar energy for water heating purposes. This research provides valuable insights for the design and optimization of solar water heating systems, promoting the development of sustainable and efficient energy technologies [14]. The advantages of solar collectors include environmental protection, energy conservation, low cost, high reliability, and wide applicability. They can help users reduce energy costs, improve economic efficiency, and also help reduce dependence on fossil fuels to protect the environment. Among various types of solar collectors, the characteristics of vacuum tube solar collectors make them more efficient than flat-plate collectors in meeting residential and industrial hot water demands [15,16,17]. Solar water heater systems mainly consist of solar collectors and storage tanks [18]. Some studies have focused on the thermal performance aspects of solar collectors, such as heat transfer [19,20,21] and heat losses [22,23,24,25], aiming to improve their energy utilization efficiency. Many researchers have utilized numerical simulation methods to simulate and analyze solar thermal behaviors. For instance, Arman Nokhosteen et al. [26] proposed a new method based on Resistive Network Proper Orthogonal Decomposition (RNPOD) to predict the thermal behavior of heat pipe-based vacuum tube collectors, with a maximum error of 10%. This method provided valuable guidance for the design and optimization of solar collectors. Yu Yuan et al. [27] conducted theoretical analysis and experimental research on the optical–thermal performance of solar concentrators using heat pipe-based vacuum cylindrical receivers. The results showed that the concentrators had high thermal efficiency and optical performance, providing useful references and guidance for the design and optimization of solar collectors. The thermal performance of collectors is also influenced by factors such as collector structure, operating parameters (flow velocity or inlet fluid temperature), and more. For example, Bhim P. Kafle et al. [28] conducted a comparative study on the optical, structural, and thermal performances of black nickel selective coatings and commercial black organic dye-coated coatings for solar thermal collectors. The research evaluated the coatings’ spectral selectivity, surface morphology, stability, as well as their heat absorption and thermal resistance properties. The results demonstrated that the black nickel selective coatings effectively enhanced the efficiency of solar thermal collectors. These findings are of significant importance for the development of advanced coatings to improve solar energy utilization.
The thermal storage tank plays a crucial role in solar energy systems as it stores heat for later use during inactive periods. Yang Zheng et al. [29] compared different shapes of storage tanks and investigated their effects on heat storage and thermal stratification. Their research provided theoretical references and practical value for improving the performance and efficiency of solar thermal utilization systems. Li Qiong et al. [30] studied the thermal stratification issue in solar thermal storage tanks with shell-and-tube heat exchangers. The experimental results showed that the shell-and-tube heat exchanger significantly improved the thermal stratification characteristics of the storage tank, thereby enhancing the system’s thermal efficiency. They further explored the dynamic characteristics of temperature stratification in the storage tank under different operating modes through experimental simulations of solar thermal systems [31]. The results revealed different trends in temperature stratification variations under different operation modes, providing references and practical value for improving the performance and efficiency of solar thermal utilization systems. The volume of the storage tank has a significant impact on the performance of solar collectors. Weihua Lyu et al. [32] investigated the influence of tank size and air-source heat pump size on the energy-saving potential of energy storage heating systems. The research results showed that a proper match between the tank size and air-source heat pump significantly improved the system’s energy-saving effect. Mauricio Carmona [33] developed an energy and analytical model for a phase change material-based thermal storage tank. Through experimental verification and parameter studies, they explored the system’s performance under various operating conditions, providing references for improving the energy and efficiency of solar thermal utilization systems in residential applications. In practical use, the volume of the storage tank often varies depending on the specific application scenario, and this variation may affect the heat dissipation performance and freezing characteristics of the collector. Jianhua Fan [34] studied the thermal stratification issue in hot water storage tanks caused by heat losses. The experimental results showed that heat losses resulted in a relatively stable temperature stratification, albeit with a small temperature gradient, which had a certain influence on the thermal performance of solar hot water storage systems. Therefore, the volume of the storage tank has an important impact on the performance of solar collectors. In practical use, the volume of the storage tank often varies depending on the specific application scenario, and this variation may affect the heat dissipation performance and freezing characteristics of the collector, which is the focus of this study.
Significant progress has been made in addressing the freezing issues of all-glass evacuated tube solar water heaters. The research primarily focuses on reducing heat losses from the collectors, such as altering the absorber coating material, and enhancing the collector’s thermal performance, for instance, by utilizing concentrators to improve heat collection efficiency. Additionally, improvements have been made in the thermal storage tank’s heat storage capacity by altering its shape and size [35]. Despite these advancements, some challenges still remain to be addressed. Firstly, the majority of current research has been conducted in controlled indoor environments, whereas the operational conditions of all-glass vacuum tube solar water heaters in practical applications are subject to various uncertain factors, such as climate variations and storage tank volume, which can have varying impacts on the freezing process. Secondly, existing studies primarily focus on the causes and preventive measures of freezing in solar water heaters, but there is a lack of in-depth exploration into the detailed characteristics of the freezing process. Therefore, a more systematic and comprehensive investigation is needed to examine the influence of the storage tank on the freezing process of all-glass vacuum tube solar water heaters. Such research holds significant practical significance and application value in enhancing their performance in cold regions.

2. Methods

In order to investigate the impact of the storage tank on the freezing process of all-glass vacuum tube solar water heaters, a simulation model of the all-glass vacuum tube solar collector is established using the commercial software FLUENT (ANSYS-2020R2). In this section, a mathematical analysis of the heat dissipation and freezing process of the all-glass vacuum tube solar collector is conducted, followed by the development of a simulation model. Subsequently, an experimental study on the winter nighttime heat dissipation and freezing process of the all-glass vacuum tube solar water heater is conducted, and the data are monitored. Finally, the simulation model of the all-glass vacuum tube solar collector is validated.

2.1. Thermal Analysis of All-Glass Vacuum Tube Solar Collectors for Heat Dissipation

The nighttime heat dissipation process of all-glass vacuum tube solar water heaters involves complex heat transfer mechanisms, including conduction, convection, and radiation [36]. The main components contributing to nighttime heat dissipation are the storage tank and the all-glass vacuum tubes. This includes the heat loss from the storage tank, thermal radiation from the inner glass tube to the outer glass tube, convective heat transfer within the vacuum layer between the inner and outer glass tubes, convective heat transfer between the outer glass tube and the external environment, and thermal radiation from the outer glass tube to the external environment. Furthermore, the impact of sky and ground radiation heat exchange on the all-glass vacuum tube collector must be considered [37]. The total heat loss of the collector is the sum of the heat dissipated through the vacuum tubes and the insulation of the storage tank. The resistance diagram of the heat dissipation process in the all-glass vacuum tube collector is illustrated in Figure 1.
The radiative heat dissipation between the inner and outer tubes of the vacuum tube collector (in the vacuum layer) can be represented as follows:
Q o , r = 2 π r 2 l ε eff σ ( T i 4 T o 4 )
The variable Qo,r denotes the effective radiative heat transfer rate between the inner and outer tubes of the vacuum tube, W; The symbol σ represents the Stefan–Boltzmann constant, 5.67 × l0−8 W/(m2·K4); The symbol εeff represents the effective emissivity, and r2 denotes the radius of the inner tube, m.
Effective radiative heat transfer refers to the sum of the radiative emissions and reflected radiations from the object itself. The effective emissivity between the inner and outer tubes of the vacuum tube is represented as εeff:
ε eff = ( 1 ε i + 1 ε o 1 ) 1
The variable εi represents the hemispherical emissivity of the inner glass tube at temperature Ti, while εo represents the hemispherical emissivity of the outer glass tube at temperature To. The radiative heat transfer coefficient of the vacuum layer can be represented as follows:
h i , r = ε eff σ ( T i 2 + T o 2 ) ( T i + T o )
From Equation (3), the total thermal resistance of the vacuum layer, denoted as R1, can be obtained as follows:
R 1 = 1 h i , c + h i , r = 1 h i , c + σ ( T i 2 + T o 2 ) ( T i + T o ) 1 ε i + 1 ε o 1
Due to the temperature difference between the vacuum tube and the ambient environment, there is radiative and convective heat transfer between the vacuum tube and the surroundings. Specifically, for the upper half portion of the outer glass tube of the vacuum tube exposed to the sky during nighttime, the radiative heat transfer coefficient can be represented as follows:
h os , r = ε o σ ( T o 4 T sky 4 ) 2 ( T o T a )
For the lower half portion of the outer glass tube of the vacuum tube, which is in contact with the base, the radiative heat transfer coefficient can be represented as follows:
h og , r = ε o σ ( T o 4 T g 4 ) 2 ( T o T a )
To denotes the temperature of the outer glass tube, °C; Tsky represents the effective radiative temperature of the sky, °C; Tg denotes the ground temperature, °C; and Ta represents the ambient temperature of the surroundings, °C. The effective radiative temperature of the sky and the ground temperature are important parameters for the radiative heat transfer between the solar collector and the surroundings. They play a significant role in determining the lowest temperature of the solar collector and the design of solar energy systems for frost prevention. Since directly measuring the effective radiative temperature of the sky and the ground temperature is often challenging, approximate relationships proposed by researchers based on their studies on the correlations between the effective radiative temperature of the sky and the ground temperature with the ambient temperature have been adopted. Here, the expression for the effective radiative temperature of the sky can be given as follows [38]:
Tsky = −91.6 + 1.26Ta
The expression for the ground temperature can be given as follows [39]:
Tg = 1.114Ta−31.724
The total thermal resistance, R2, between the outer glass tube of the vacuum tube and the ambient environment can be represented as follows:
R 2 = 1 h oa = 1 h os , r + h og , r + h o , c = 1 ε o σ ( T o 4 T sky 4 ) 2 ( T o T a ) + ε o σ ( T o 4 T g 4 ) 2 ( T o T a ) + h o , c
hoa represents the overall heat transfer coefficient between the outer glass tube and the ambient environment. According to Equations (4) and (9), the expression for the total heat loss coefficient Up of the vacuum tube can be obtained as follows:
U p = 1 R 1 + R 2
The heat storage tank exchanges heat with the ambient environment through convective heat transfer. The parameter ht represents the heat dissipation coefficient of the heat storage tank to the ambient environment. If Ut is taken as the heat loss coefficient of the heat storage tank, the expression for the total heat loss coefficient of the solar collector, UG, can be given as follows:
UG = Up + Ut

2.2. Numerical Model for Evacuated Tube Solar Collectors

2.2.1. Simplified Physical Model

A numerical model for evacuated tube solar collectors using the commercial software ANSYS-FLUENT is established, with the use of IECM for modeling and grid generation. Due to the large overall size of the evacuated tube solar collector system and the large number of vacuum tubes (15 tubes), modeling the entire system would result in a high number of computational cells, resulting in long computation time and a large computational load, which can affect the accuracy and convergence of the model [40]. Therefore, this study adopts a modeling approach with only one representative tube as the simulation unit. The model diagram and the simulated unit are shown in Figure 2. Considering that the selected simulation unit is located in the middle position of the collector (1 < m < n) and is tilted at a 45° angle with the ground.
During modeling, the coordinate system is located at the center of the water tank. The y-axis direction is taken along the length of the vacuum tube, with a length range of −0.20 to 1.70 m. The z-axis direction is taken along the length of the thermal storage tank, with a simulated unit length range of −0.04 to 0.04 m. The x-axis direction is taken perpendicular to the yz plane, with a simulated unit range of −0.20 to 0.20 m along the x-axis direction. The inclination angle between the vacuum tube and the ground is 45°, which is represented in the simulation by different gravity terms along different axes. The geometric parameters of the simulation unit are shown in Table 1.

2.2.2. Governing Equation

When the circulation pump of the all-glass vacuum tube solar collector system stops running at night, natural convection occurs in the collector due to the temperature difference caused by the heat dissipation process. To analyze the natural flow problem, the Rayleigh number Ra is calculated to determine the flow state [38]. The characteristic length is taken as the inner diameter of the all-glass evacuated tube. Other parameters can be referred to in the properties table for water at 20 °C from the ASHRAE Handbook 2005. The following values are obtained: thermal conductivity (λ) = 0.497 W/m·K, density (ρ) = 1029.72 kg/m3, specific heat capacity (c) = 3.815 × 10³ J/kg·K, and dynamic viscosity (μ) = 1.65 × 10⁻³ kg/m·s.
According to the following formula,
ν = μ ρ
β = 1 ρ ( ρ T ) P
α = λ ρ c
R a = P r G r = v a g β Δ T L 3 v 2 = g β Δ T L 3 v a
Among them, β is the volume expansion coefficient, 1/°C; L is the fixed size, m; ΔT is the temperature difference between the fluid and the wall, °C; α is the thermal diffusion coefficient, m2/s; v is the kinematic viscosity, m2/s; and ΔT means that the temperature difference between the fluid and the wall will not exceed 10 °C. In this study, the value of ΔT is set at 2 °C.
By substituting the obtained data into Equation (15), we can calculate and derive the following result:
R a = g β Δ T L 3 v a = 9.80 × 2.93 × 10 4 × 2 × 0.047 3 1.6 × 10 6 × 1.265 × 10 7 = 2.9 × 10 6
The Nusselt number is a dimensionless parameter that represents the intensity of convective heat transfer. It also represents the ratio of the thermal resistance due to conduction in the laminar sublayer of the fluid to the thermal resistance due to convective heat transfer. For a normal boundary surface, both convective and conductive heat flows occur in parallel, and in simple cases, they are perpendicular to the average fluid flow. The calculation of the Nu is as follows:
N u = h w L λ
In the equation, hw represents the convective heat transfer coefficient of the fluid, given in W/(m2·K); L denotes the characteristic length, m. For estimating the convective heat transfer coefficient of water under atmospheric pressure in general cases, the following empirical formula can be used:
h w = 10.45 0.69 v + 0.0003 v 2 + 4.18 × 10 4 T
where v represents the velocity of water in meters per second (m/s), and T denotes the temperature of water in degrees Celsius (°C). When the velocity v of water is very small, it can be neglected. Equation (18) yields the following result:
h w = 10.45 + 4.18 × 10 4 × 20 = 10.46
By substituting the obtained data into Equation (17), we can calculate and derive the following result:
N u = h w L λ = 10.46 × 0.047 0.497 = 0.99
According to Equations (16) and (20), when Ra < 108, it corresponds to buoyancy-driven laminar flow; when 108 < Ra < 1010, it corresponds to buoyancy-driven transitional turbulence; when Ra > 1010, it corresponds to buoyancy-driven turbulent flow. For the heat transfer of water, when the Nusselt number is less than 2, it is typically considered to be in a laminar flow regime; when the Nusselt number is greater than 2, it is typically considered to be in a turbulent flow regime. Therefore, we can assume that the convective heat transfer of water occurs in a laminar flow state. During the simulation, the heat transfer within the all-glass evacuated tube is conducted through natural convection. For this purpose, a laminar flow model is chosen.
The continuity equation can be expressed as follows:
ρ t + ( ρ u ) x + ( ρ v ) y + ( ρ w ) z = 0
Among them, ρ Is the fluid density; t is the time; and u, v, and w are the velocity components in the x, y, and z directions.
The energy conservation equation, which means that the rate of increase in energy in a microelement is equal to the net heat flow rate entering the microelement plus the work performed by external forces on the microelement, is as follows:
ρ c p ( T t + u x T x + u y T y + u z T z ) = k ( 2 T x 2 + 2 T y 2 + 2 T z 2 )
Cp is the constant pressure specific heat capacity of the fluid, J/(kg·°C); T is the temperature of the fluid, °C; and k is the thermal conductivity of the fluid, W/(m·°C).

2.2.3. Boundary Condition Settings

The aim of this study is to investigate the transient flow and temperature distribution inside the vacuum tube under no solar radiation, and to analyze the heat dissipation of the all-glass vacuum tube under different thermal storage tank capacities. The simulation takes into account the fluid freezing phase change process and radiation heat transfer. The radiation model is loaded to reproduce the process of water in the vacuum tube radiating heat outwards at night. The fluid adopts a laminar model, and a pressure-based coupled solver is used. The discretization format, except for the time term, is based on a second-order upwind format. The SIMPLE algorithm is used for pressure calculation. The simulation starts at 6:00 p.m. and ends at 8:00 a.m. the next day, with a time step of 30 s and 1680 calculation steps. Each time step is iterated 20 times. The sub-relaxation factor of energy is set to 0.85, and the remaining parameters use Fluent’s default values. The iteration residual is set to 1 × 10⁻⁵.
The DO radiation model is used to simulate the outward radiation process of the heat collection tube in the model, with a radiation calculation frequency of 1, i.e., energy iteration is performed after each radiation iteration. The DO radiation model is a radiation heat transfer model in Computational Fluid Dynamics (CFD-ANSYS-2020R2) software. It is based on the principles of radiation heat transfer and solves the radiation transport equation to calculate the distribution of radiation heat transfer rate and energy on the surface of objects. The model considers various mechanisms of radiation heat transfer, including absorption, emission, and scattering, and is capable of simulating the radiation characteristics of different materials. It is primarily used for simulating and analyzing radiation heat transfer phenomena. The transient simulation uses the DO time term, with “Theta Pixels” and “Phi Pixels” set to 6. The inner and outer glass tubes of the vacuum tube are both semi-transparent dielectric materials with a refractive index of 1.5 and an absorption coefficient of 0.6. The outer glass tube of the vacuum tube adopts a mixed boundary, with a convective heat transfer coefficient of 5.8 W/m2·K, internal and external emissivity set to 1, a semi-transparent medium, and a diffuse fraction of 0.05. The insulation layer outside the water tank is made of 50 mm thick polyurethane foam material, using a mixed boundary, with a surface convective heat transfer coefficient of 12.8 W/m2·K, an opaque medium, and a diffuse fraction of 1. The inner glass tube adopts a coupled boundary with an absorbing coating on the outer surface. The absorbing coating is made of a 0.5 mm thick copper-aluminum alloy with a refractive index of 1.5 and an absorption coefficient of 1. Conjugate heat transfer is performed with a semi-transparent medium and a diffuse fraction of 1. The water in the collector involves a freezing process with a melting enthalpy of 333.55 kJ/kg. Under freezing conditions, its thermal conductivity is 0.56 W/(m·K), density is 917 kg/m3, and specific heat is 2090 J/(kg·K). The specific physical parameters are shown in Table 2 [41,42].
In the boundary conditions, the ambient temperature is given as a temperature boundary condition that varies with time by using a user-defined function (UDF) in ANSYS Fluent. A temperature polynomial function related to time is written in C language to achieve the boundary temperature changing with time, which can be set as the actual measured temperature at night. In addition, temperature monitoring points are set to monitor the changes in temperature and other parameters at different cross-sections, as shown in Table 3.

2.2.4. Mesh Independency Study

The geometry model established in this study was meshed using ICEM CFD 2020 R2. ICEM (Integrated Computer Engineering and Manufacturing) is a computer-aided engineering (CAE, ICEM CFD 2020 R2) software developed by ANSYS. It is primarily used for pre-processing complex geometries, including tasks such as mesh generation, geometry manipulation, and mesh optimization. In the context of this research, ICEM provides a reliable foundation for the simulation analysis by facilitating the pre-processing of intricate geometries and ensuring high-quality mesh generation. In order to investigate the influence of the number of mesh divisions on the numerical solution and determine a reasonable mesh division scheme, four different mesh densities were established and compared for simulation results. To simplify the calculation process for the comparison calculation, the initial temperature was set to 40 °C, and the outdoor ambient temperature was set to −10 °C, using the static condition as an example. Other parameters were set the same as the given operating conditions. After running for a certain time, the temperature comparison of each cross-section corresponding to different mesh schemes is shown in Table 4.
The number of mesh elements for schemes 1 to 4 are 281,344, 364,624, 416,240, and 504,968, respectively. The results in the table show that scheme 2, with 364,624 mesh elements, serves as the benchmark. The temperature differences for the four monitors in scheme 1, with 281,344 mesh elements, are 1.017 °C, 0.209 °C, 0.124 °C, and 0.110 °C, respectively. For scheme 3, with 416,240 mesh elements, the temperature differences for each monitor are 0.535 °C, 0.036 °C, 0.024 °C, and 0.021 °C. However, compared with scheme 3, the temperature differences for scheme 4, with 504,968 mesh elements, are 0.055 °C, 0.011 °C, 0.004 °C, and 0.004 °C, respectively. It can be seen that the more mesh elements and nodes there are, the smaller the temperature differences obtained for the four monitors, T0, P1, P2, and P3, during the simulation of heat dissipation. When the number of mesh elements reaches 446,033, further increasing the number of mesh elements and nodes has little effect on the temperature changes in the simulation results, and the temperature differences among the cross-sections are small, satisfying the requirement of mesh independence. Therefore, selecting mesh scheme 3, composed of 446,033 nodes, can reduce computational costs while maintaining computational efficiency and the reliability of the simulation results.

2.3. Heat Dissipation Experiment of All-Glass Vacuum Tube Solar Collector System

To verify the accuracy of the numerical simulation, a heat dissipation experiment platform for the all-glass vacuum tube solar collector system was established, which mainly includes the all-glass vacuum tube solar collector, bracket, water pump, thermal storage tank, thermometer, thermocouple, data acquisition instrument, etc.
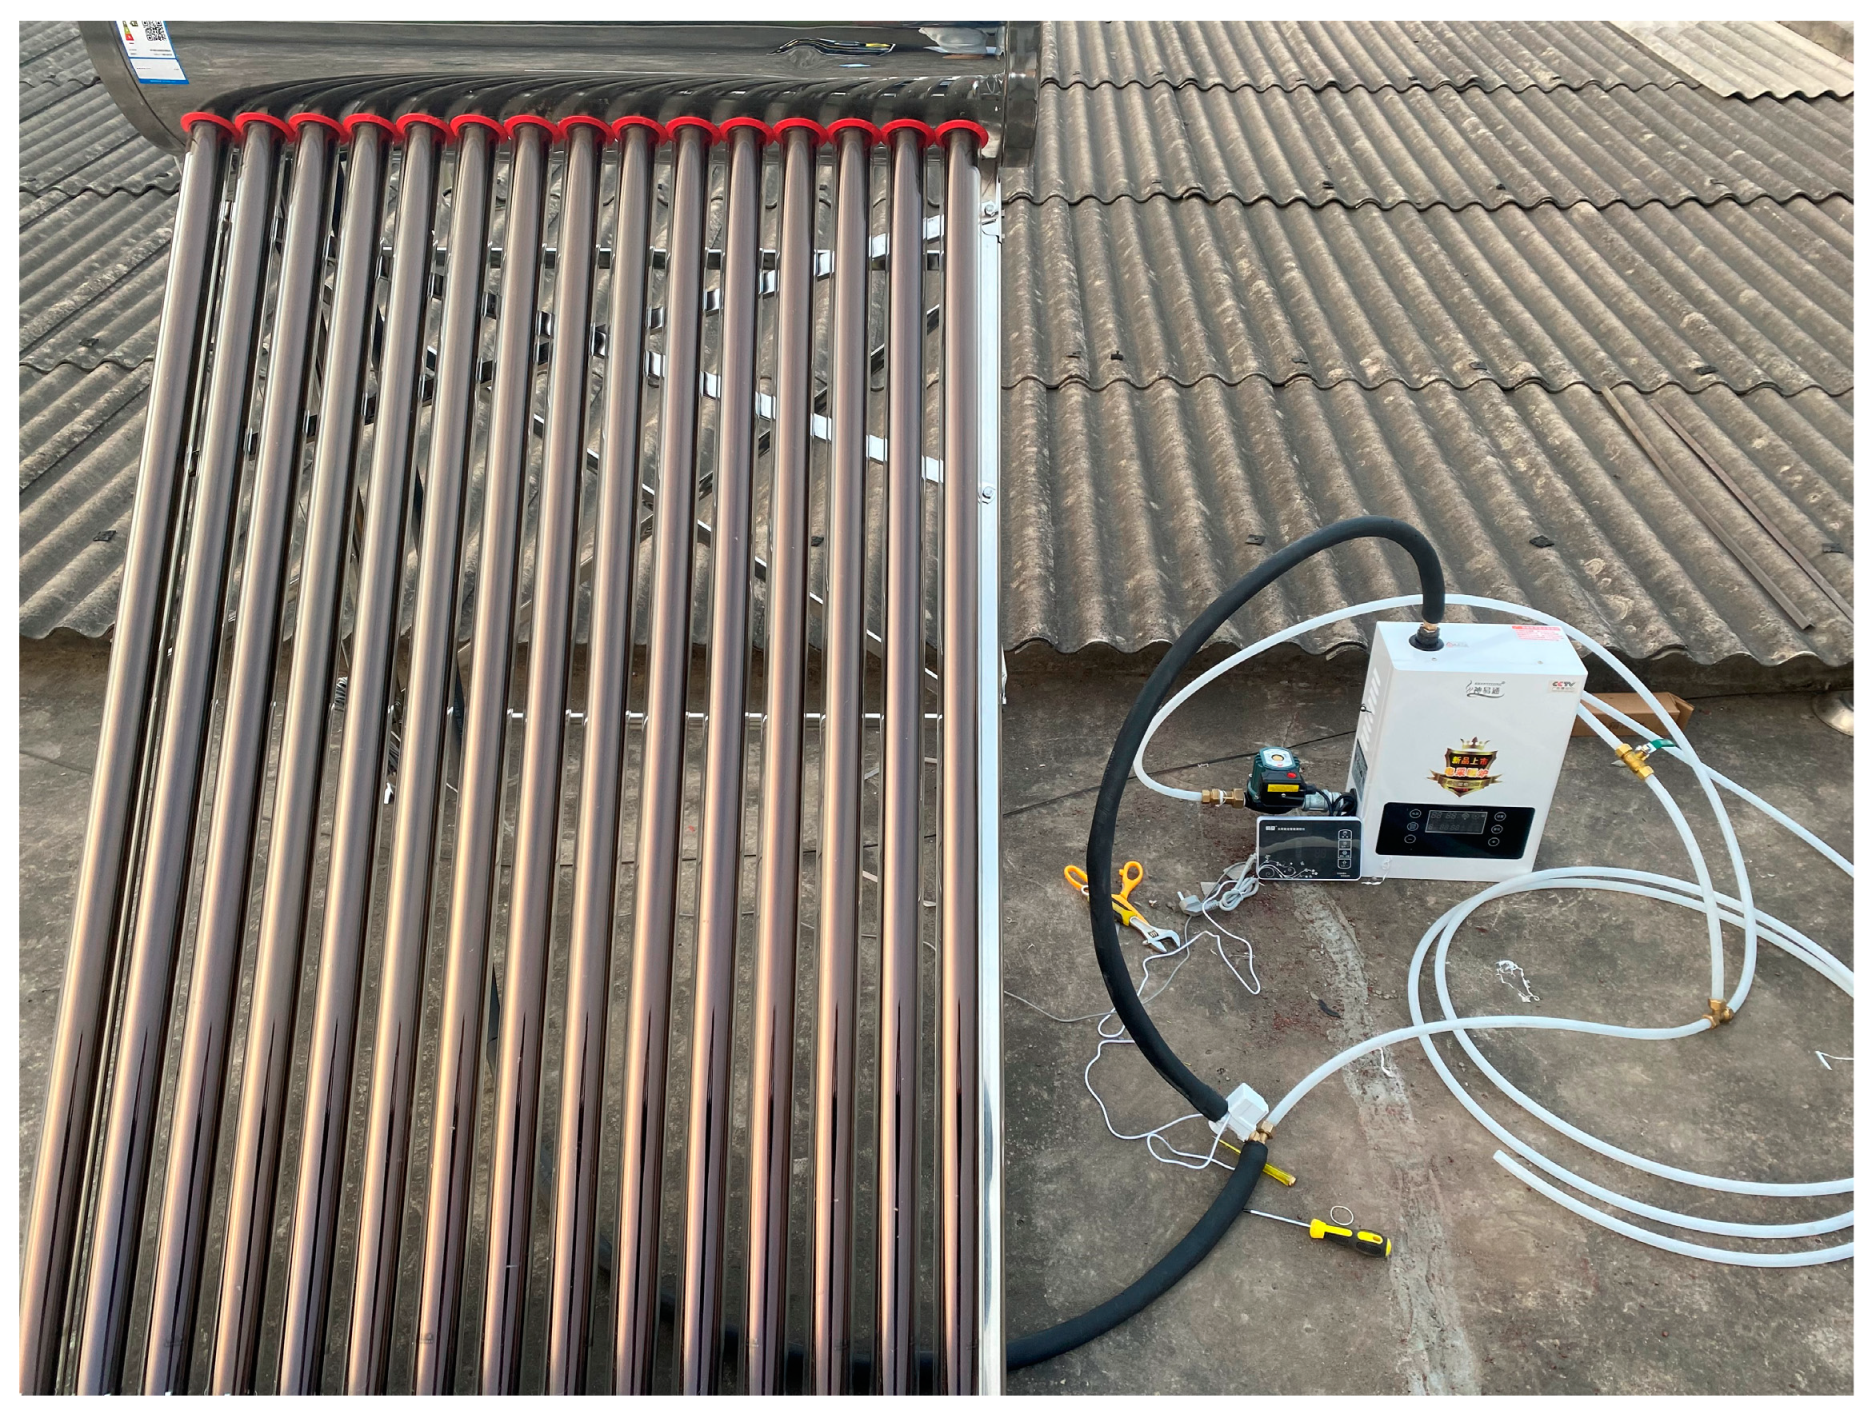
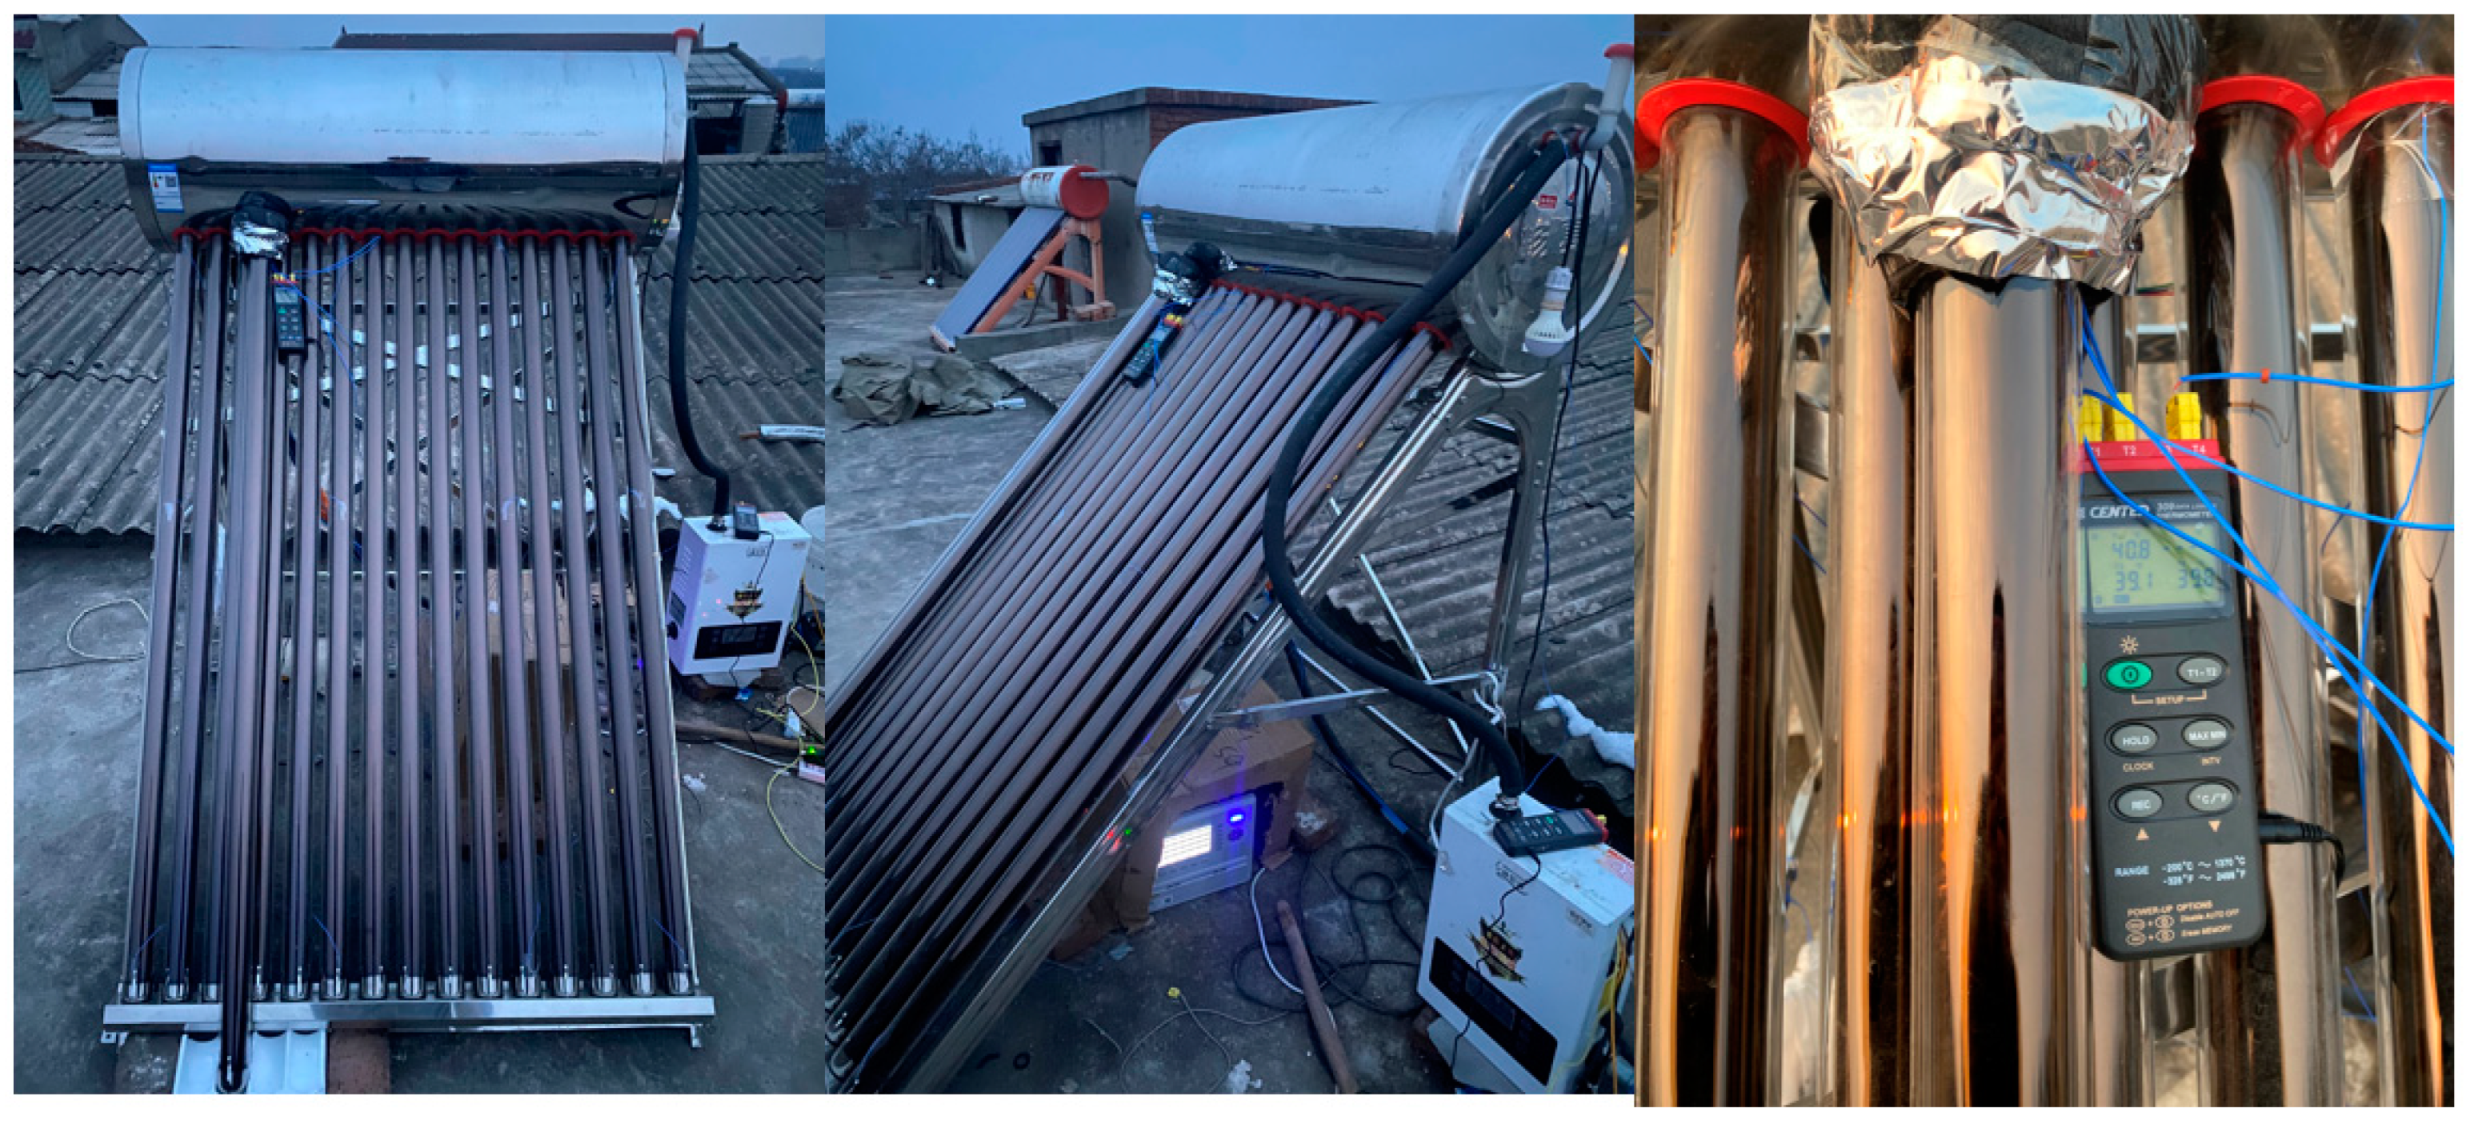
The experimental system was set up in Luoyang, China (34° N, 112° E) and consisted of 15 vacuum tubes measuring 58 mm × 1500 mm, as shown is Figure 3. The right end of the water tank had an inlet and an exhaust pipe, while the lower left end had an outlet. The solar collector’s inlet and outlet pipes were made of 2.8 mm thick polypropylene PPR fusion pipes. The glass tube covering the vacuum tube had excellent transparency, which meant that it had little obstruction to the outward heat radiation during cooling at night. The outer surface of the inner glass tube is coated with a copper–aluminum alloy coating that absorbs solar radiation. This material has gained widespread usage due to its low cost and high heat absorption efficiency [43]. To determine if there were significant differences in the cooling of each vacuum tube, three T-shaped thermocouples (−200~350 °C) were installed on the outer surface of the vacuum tubes facing the ground and sky, respectively, along the length of the vacuum tube array at the 1st, 6th, 11th, and 15th vacuum tubes from the left. The cooling of the vacuum tubes towards the ground and sky during heat radiation could be observed.
The aim of this study was to investigate the effect of different thermal storage tank volumes on the heat dissipation and freezing of the solar collector. Therefore, a single-tube solar collector was set up as a control group without a thermal storage tank, as shown in Figure 4. The upper opening of the single-tube solar collector was sealed with 50 mm thick polyurethane foam material to reduce the impact of the upper opening on the heat dissipation of the vacuum tube. Thermocouples were inserted at the bottom, middle, and top of the tube to record the internal water temperature changes. The outer surface of the glass tube covering the vacuum tube and the thermocouple data of the single-tube solar collector were automatically recorded every 1 min using a data logger (TOPRIE TP-700, the working temperature range is from −20 °C to 70 °C, and the basic measurement and display error is less than ±0.3%). In addition, the temperature of the inlet and outlet of the thermal storage tank and the air temperature in the space were measured and automatically recorded every 1 min using a data logger (Center-309, the working temperature range is from −200 °C to 1370 °C, and the basic measurement and display error is less than ±0.3%). Due to the poor transparency of the heat-absorbing coating on the outer surface of the vacuum tube’s inner glass tube, it was difficult to monitor the temperature changes in the internal liquid. Therefore, every 30 min, a thermal imaging camera (FLUKE-Ti32, the working temperature range is from −20 °C to 50 °C) was used to take pictures of each part of the outer surface of the vacuum tube to observe the temperature changes during the cooling process.
The experiment on the heat dissipation of all-glass vacuum tube solar collectors was conducted on 30 January 2022 at 6:00 p.m. in a rural area north of Luoyang. It was during the cold winter season, and the night was clear with little influence from warm air in the urban area, making it representative. The working medium inside the solar collector and the single tube was water, which was circulated and heated using a small boiler to maintain an initial temperature of 40 °C.

2.4. Experimental Data Collection and Numerical Model Validation

2.4.1. Experimental Data Collection

Due to the poor transparency of the heat-absorbing coating on the inner and outer surfaces of the vacuum tube, it is difficult to monitor the temperature changes inside. Therefore, every 30 min, thermal imaging using a FLUKE-Ti32 thermal imager is performed to capture and record the various parts of the outer surface of the vacuum tube. Since the overall size of the collector is large, the overall imaging effect of the thermal imager is not satisfactory. Therefore, the lower-left corner of the vacuum tube collector’s outer surface and the middle to the bottom part of a single vacuum tube are selected for imaging, as shown in Figure 5. The temperature at the measurement point is significantly lower than the ground temperature due to the lower sky radiation temperature compared to the ground temperature. This is caused by the reflection of the sky temperature by the heat-absorbing coating and the outer surface of the glass tube cover at the measurement point.
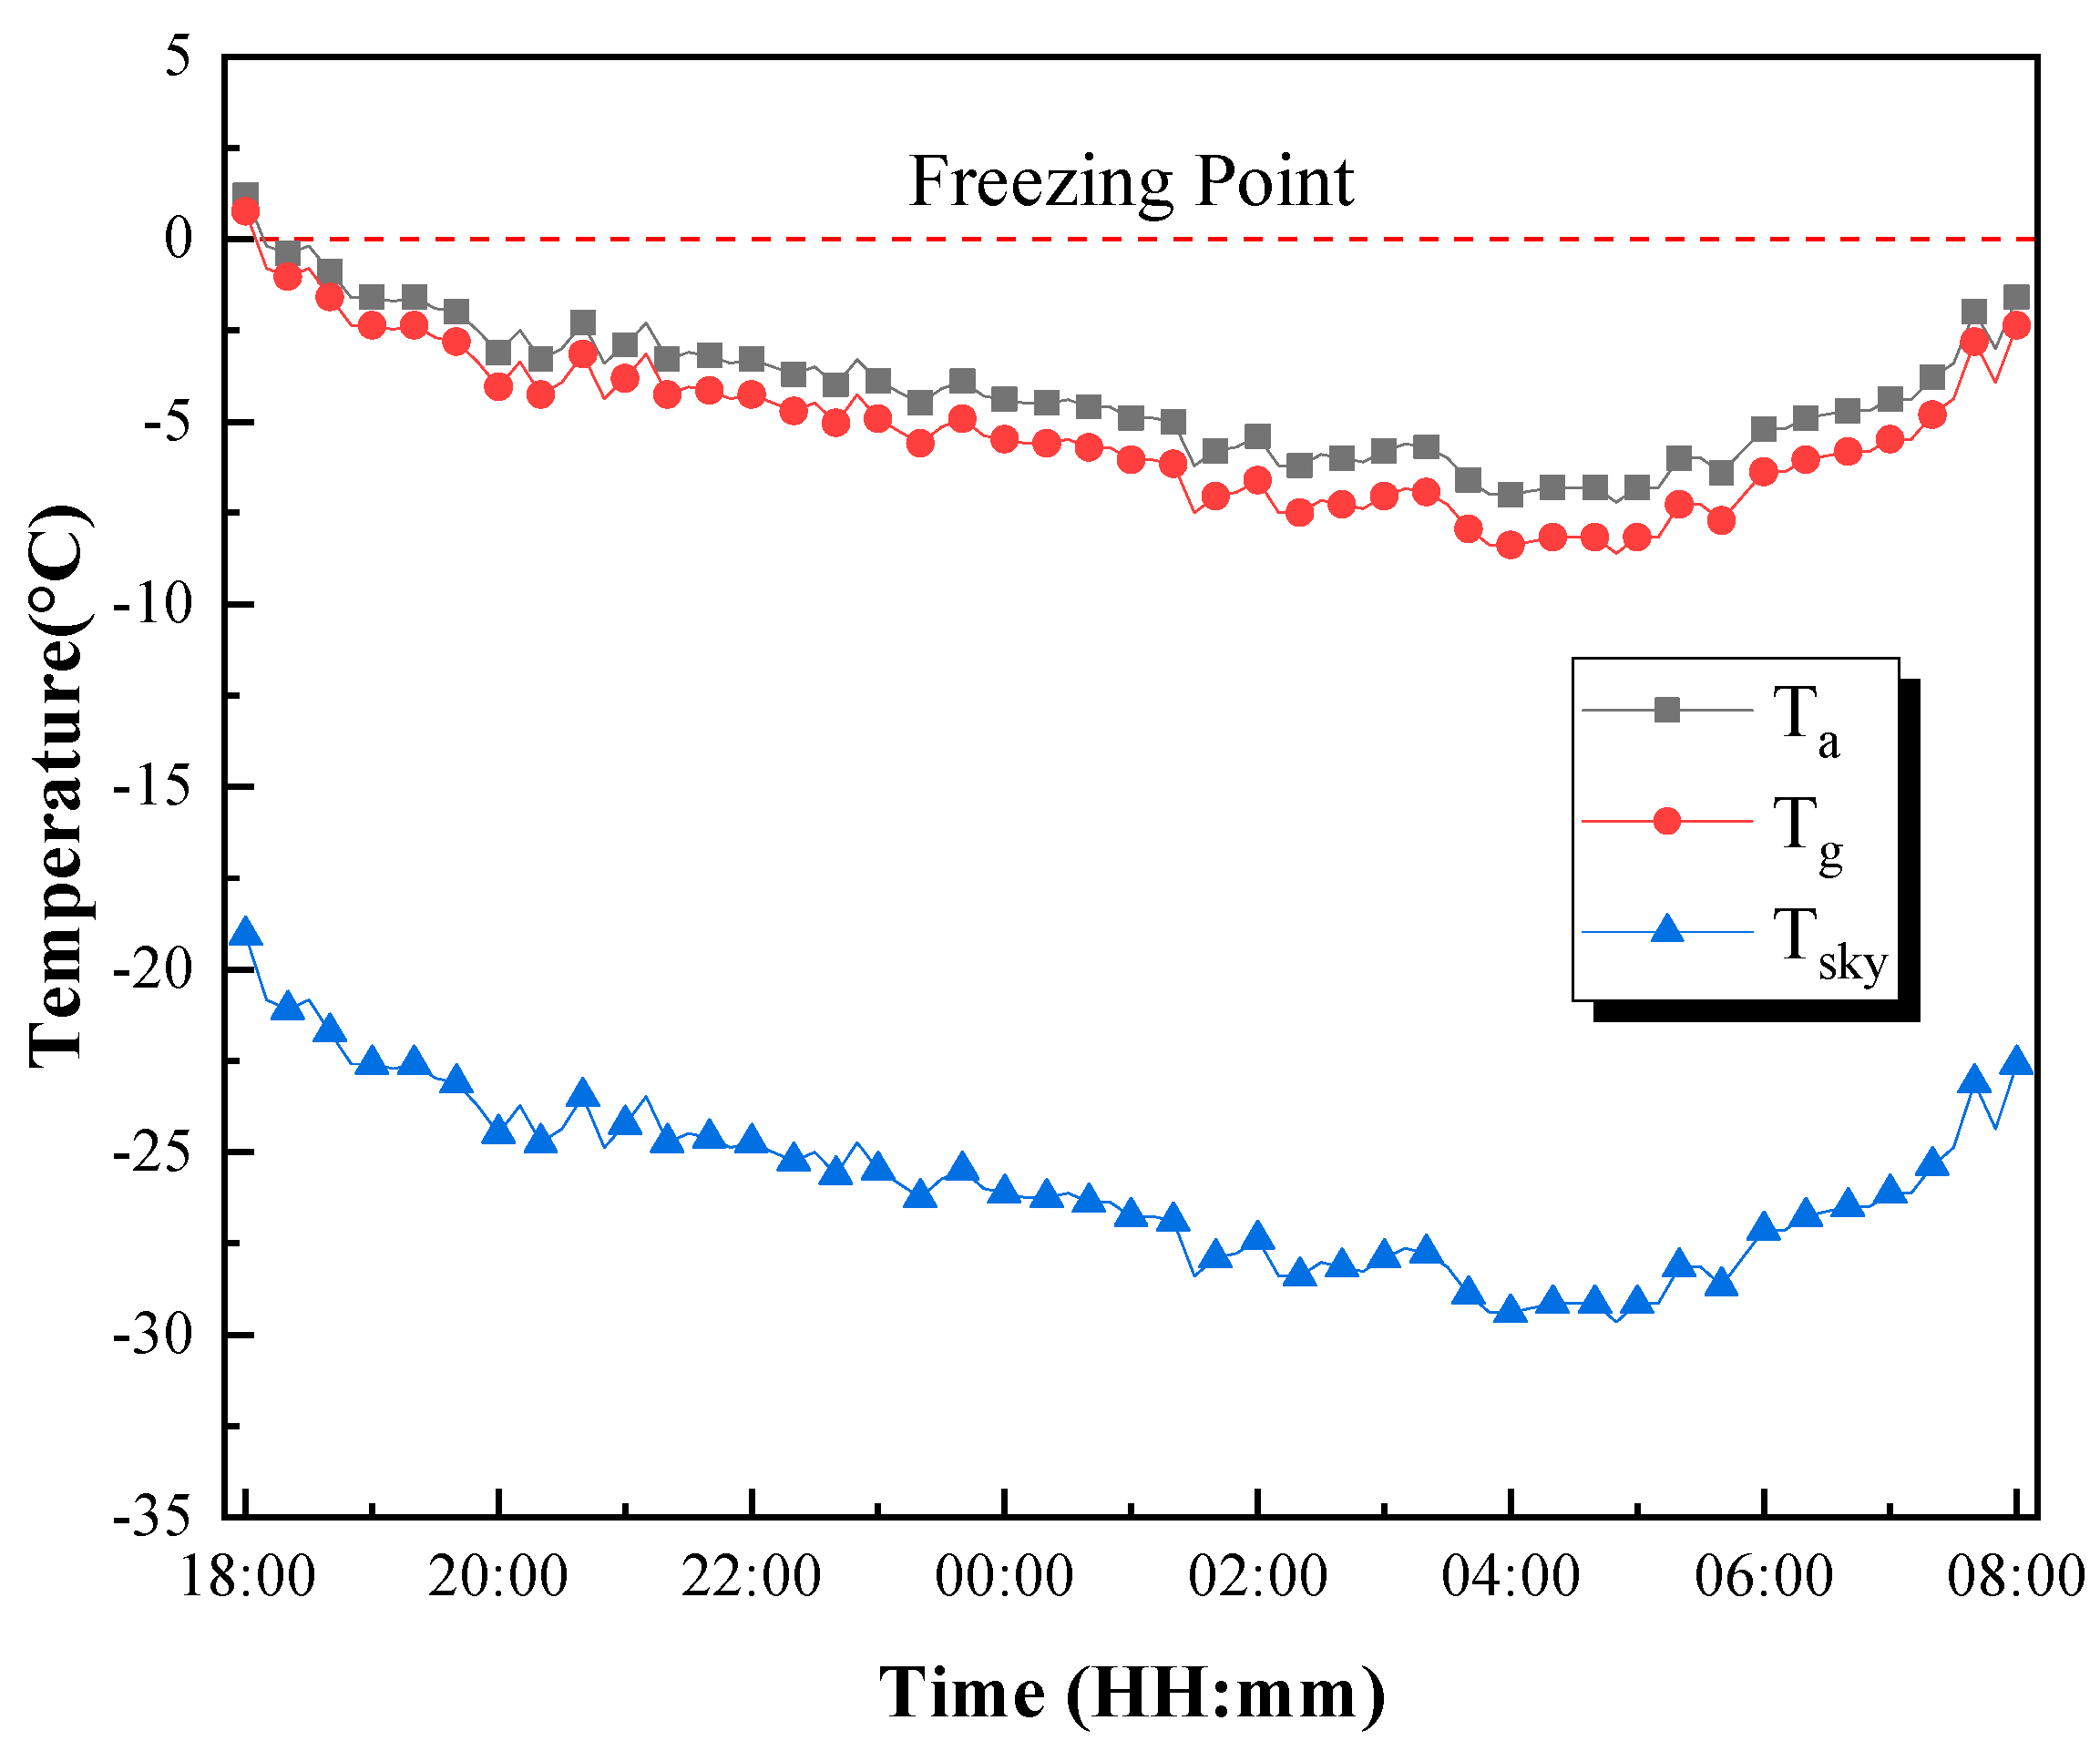
As shown in Figure 6, the environmental temperature decreases over time, and the ground temperature and sky radiation temperature are directly related to the environmental temperature. This leads to an increase in the amount of external radiative heat dissipated by the collector. As the temperature at the end of the vacuum tube gradually drops to 0 °C over time, the water temperature inside the collector decreases rapidly before reaching the freezing point. However, the rate of temperature decrease significantly reduces during the freezing process. This is because water releases latent heat and transfers it to the collector during the phase transition.
In the experimental process, as shown in Figure 7, a total of 27 T-type thermocouples were evenly installed on the upper and lower surfaces of the glass tube cover along the length direction of the 1st, 6th, 11th, and 15th vacuum tubes in the vacuum tube array, as well as at the top, middle, and bottom parts of the individual tube devices. These thermocouples were used to measure the temperature changes on the outer surface of the vacuum tubes during the nighttime radiative heat dissipation process from the collector to the sky and the ground.

2.4.2. Numerical Model Validation

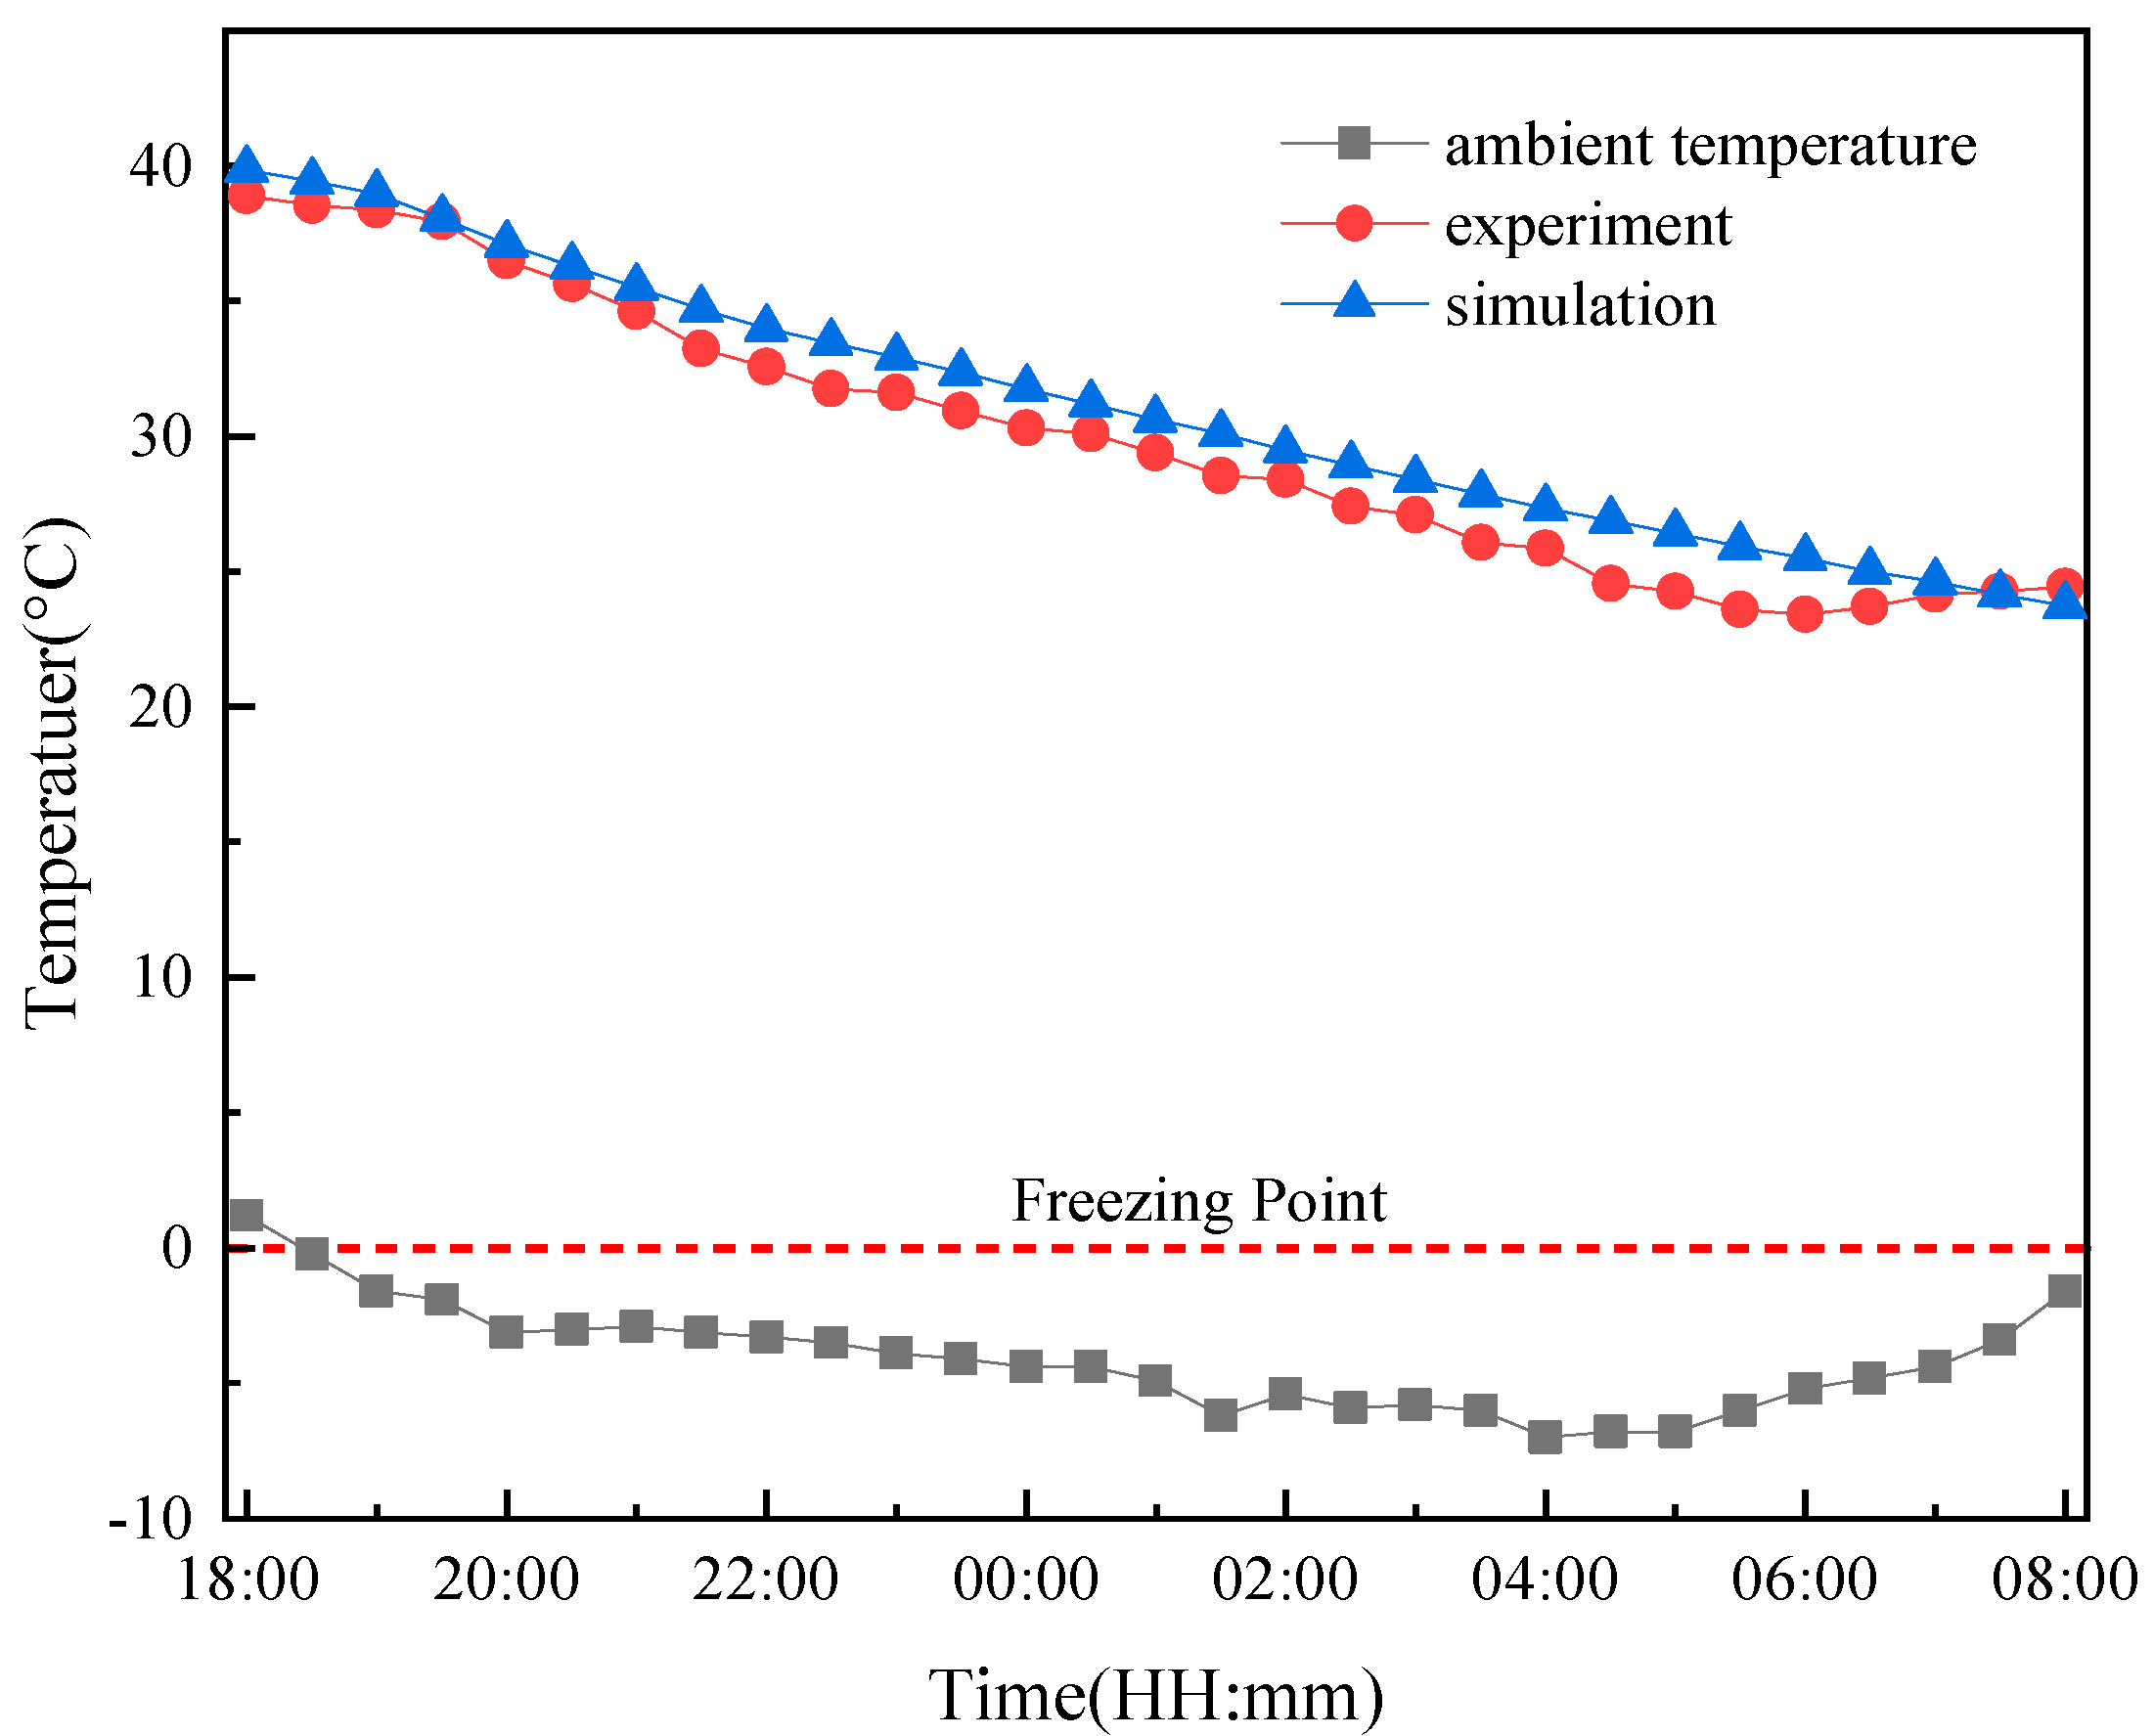
By utilizing a user-defined function (UDF), the simulated boundary temperature conditions can be set hourly. The data are based on the nighttime environmental parameters in Luoyang on 30 January 2022, as observed during the experiment. This includes the actual variations in environmental temperature, air temperature, and ground temperature throughout the experimental process. The initial temperature of the collector will be set at 40 °C. Since it is difficult to measure the temperature inside the actual vacuum tubes during the experiment, to verify the accuracy of the simulation results, the average measured temperature at the inlet and outlet of the collector during the experiment will be used as the average temperature inside the collector’s water tank. The changing temperature values at monitoring surface T0 will reflect the variations in the average temperature inside the insulated water tank during the simulation process. The comparison between the simulation results and the actual measurements is shown in Figure 8.
During the simulation, there is initially good agreement between the experimental values and the simulated values. However, as time progresses, the experimental temperature values are slightly lower than the simulated temperature values, indicating some discrepancies. This is due to the position of the temperature measurement points at the inlet and outlet of the collector during the experiment, which is located on the surface where some heat loss occurs [44]. However, the simulation process does not consider the heat loss at the inlet and outlet surfaces. Around 06:00, there is a slight upward trend in the measured temperature values, while the simulated values continue to decrease. This discrepancy is mainly because, around 06:00 in the morning, the experimental collector absorbs heat due to the increased solar radiation, resulting in a slight temperature rise. However, the simulation does not consider the influence of solar radiation and continues to decrease in temperature. Additionally, external environmental changes such as wind speed during the experiment and the precision of the experimental instruments themselves can also contribute to the discrepancies between the experimental data and the simulation results. After calculating the maximum deviation between the simulated and actual experimental temperatures during the heat dissipation process (4.70%), it can be concluded that the numerical model is relatively reliable. Therefore, this simulation can be used to predict the effects of the volume of the thermal storage tank on nighttime heat dissipation and freezing processes.

3. Analysis of Nighttime Heat Dissipation Process of All-Glass Vacuum Tube Collector

The all-glass evacuated tube collector, as well as the individual tubes, are inclined at an angle of 45°. The initial temperature inside the collector’s water tank and the tubes is uniformly distributed and set at 40 °C. There are no significant natural convection phenomena observed in any part of the system. As time progresses, the temperature gradient along the y-axis (length direction of the vacuum tubes) becomes increasingly pronounced, resulting in larger temperature differences. There are vortices at the connection between the vacuum tube and the thermal storage tank, as well as inside the vacuum tube, leading to significant mixing of hot and cold fluids. The fluid at the bottom of the vacuum tube also exhibits a certain velocity. This phenomenon is attributed to the significantly lower external temperature compared to the temperature of the collector. As the fluid inside the tank and collector dissipates heat to the surroundings, the fluid temperature near the wall surface undergoes the initial change. The decrease in temperature leads to an increase in fluid density, resulting in a natural convection effect. The colder fluid flows along the lower wall surface of the collector tube, while the higher-temperature fluid inside the tube ascends along the upper wall surface under the influence of buoyancy.
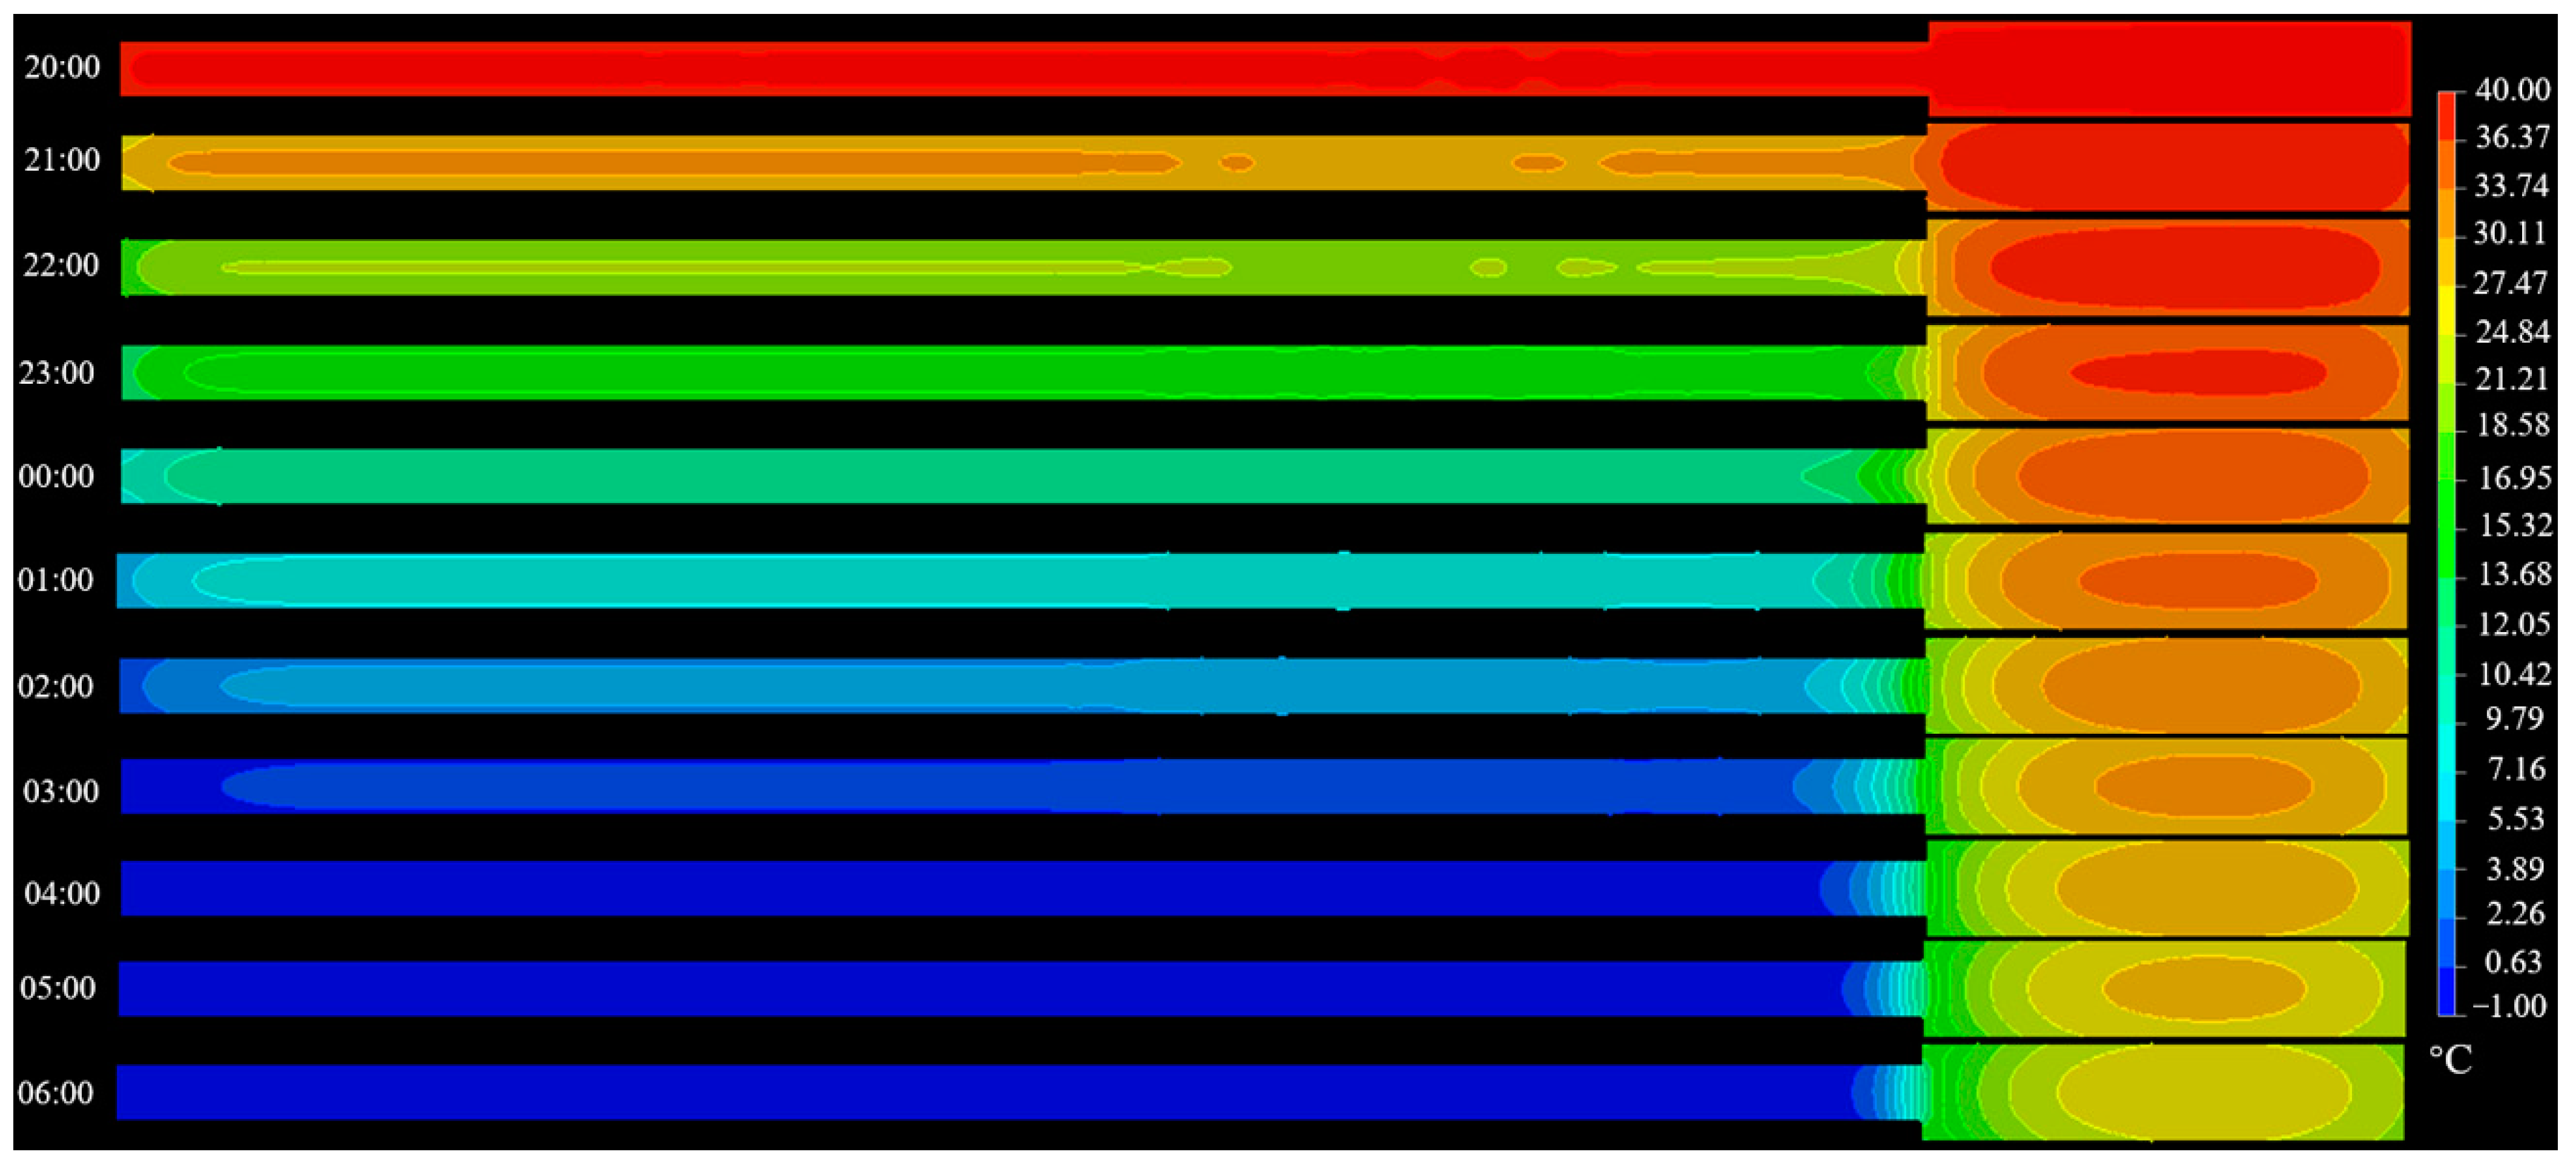
As shown in Figure 9, the temperature distribution changes as the nighttime heat dissipation progresses. The temperature of the water inside the vacuum tubes decreases at a much faster rate compared to the temperature decrease in the insulated water tank. Freezing initially occurs at the bottom end surface of the vacuum tubes. In each time period, the temperature at the tail end of the vacuum tubes is the lowest inside the tubes, and the changes are most evident compared to other time periods. The temperature at the connection between the vacuum tubes and the insulated water tank is the highest inside the system and exhibits the greatest temperature gradient and temperature difference across all time periods.
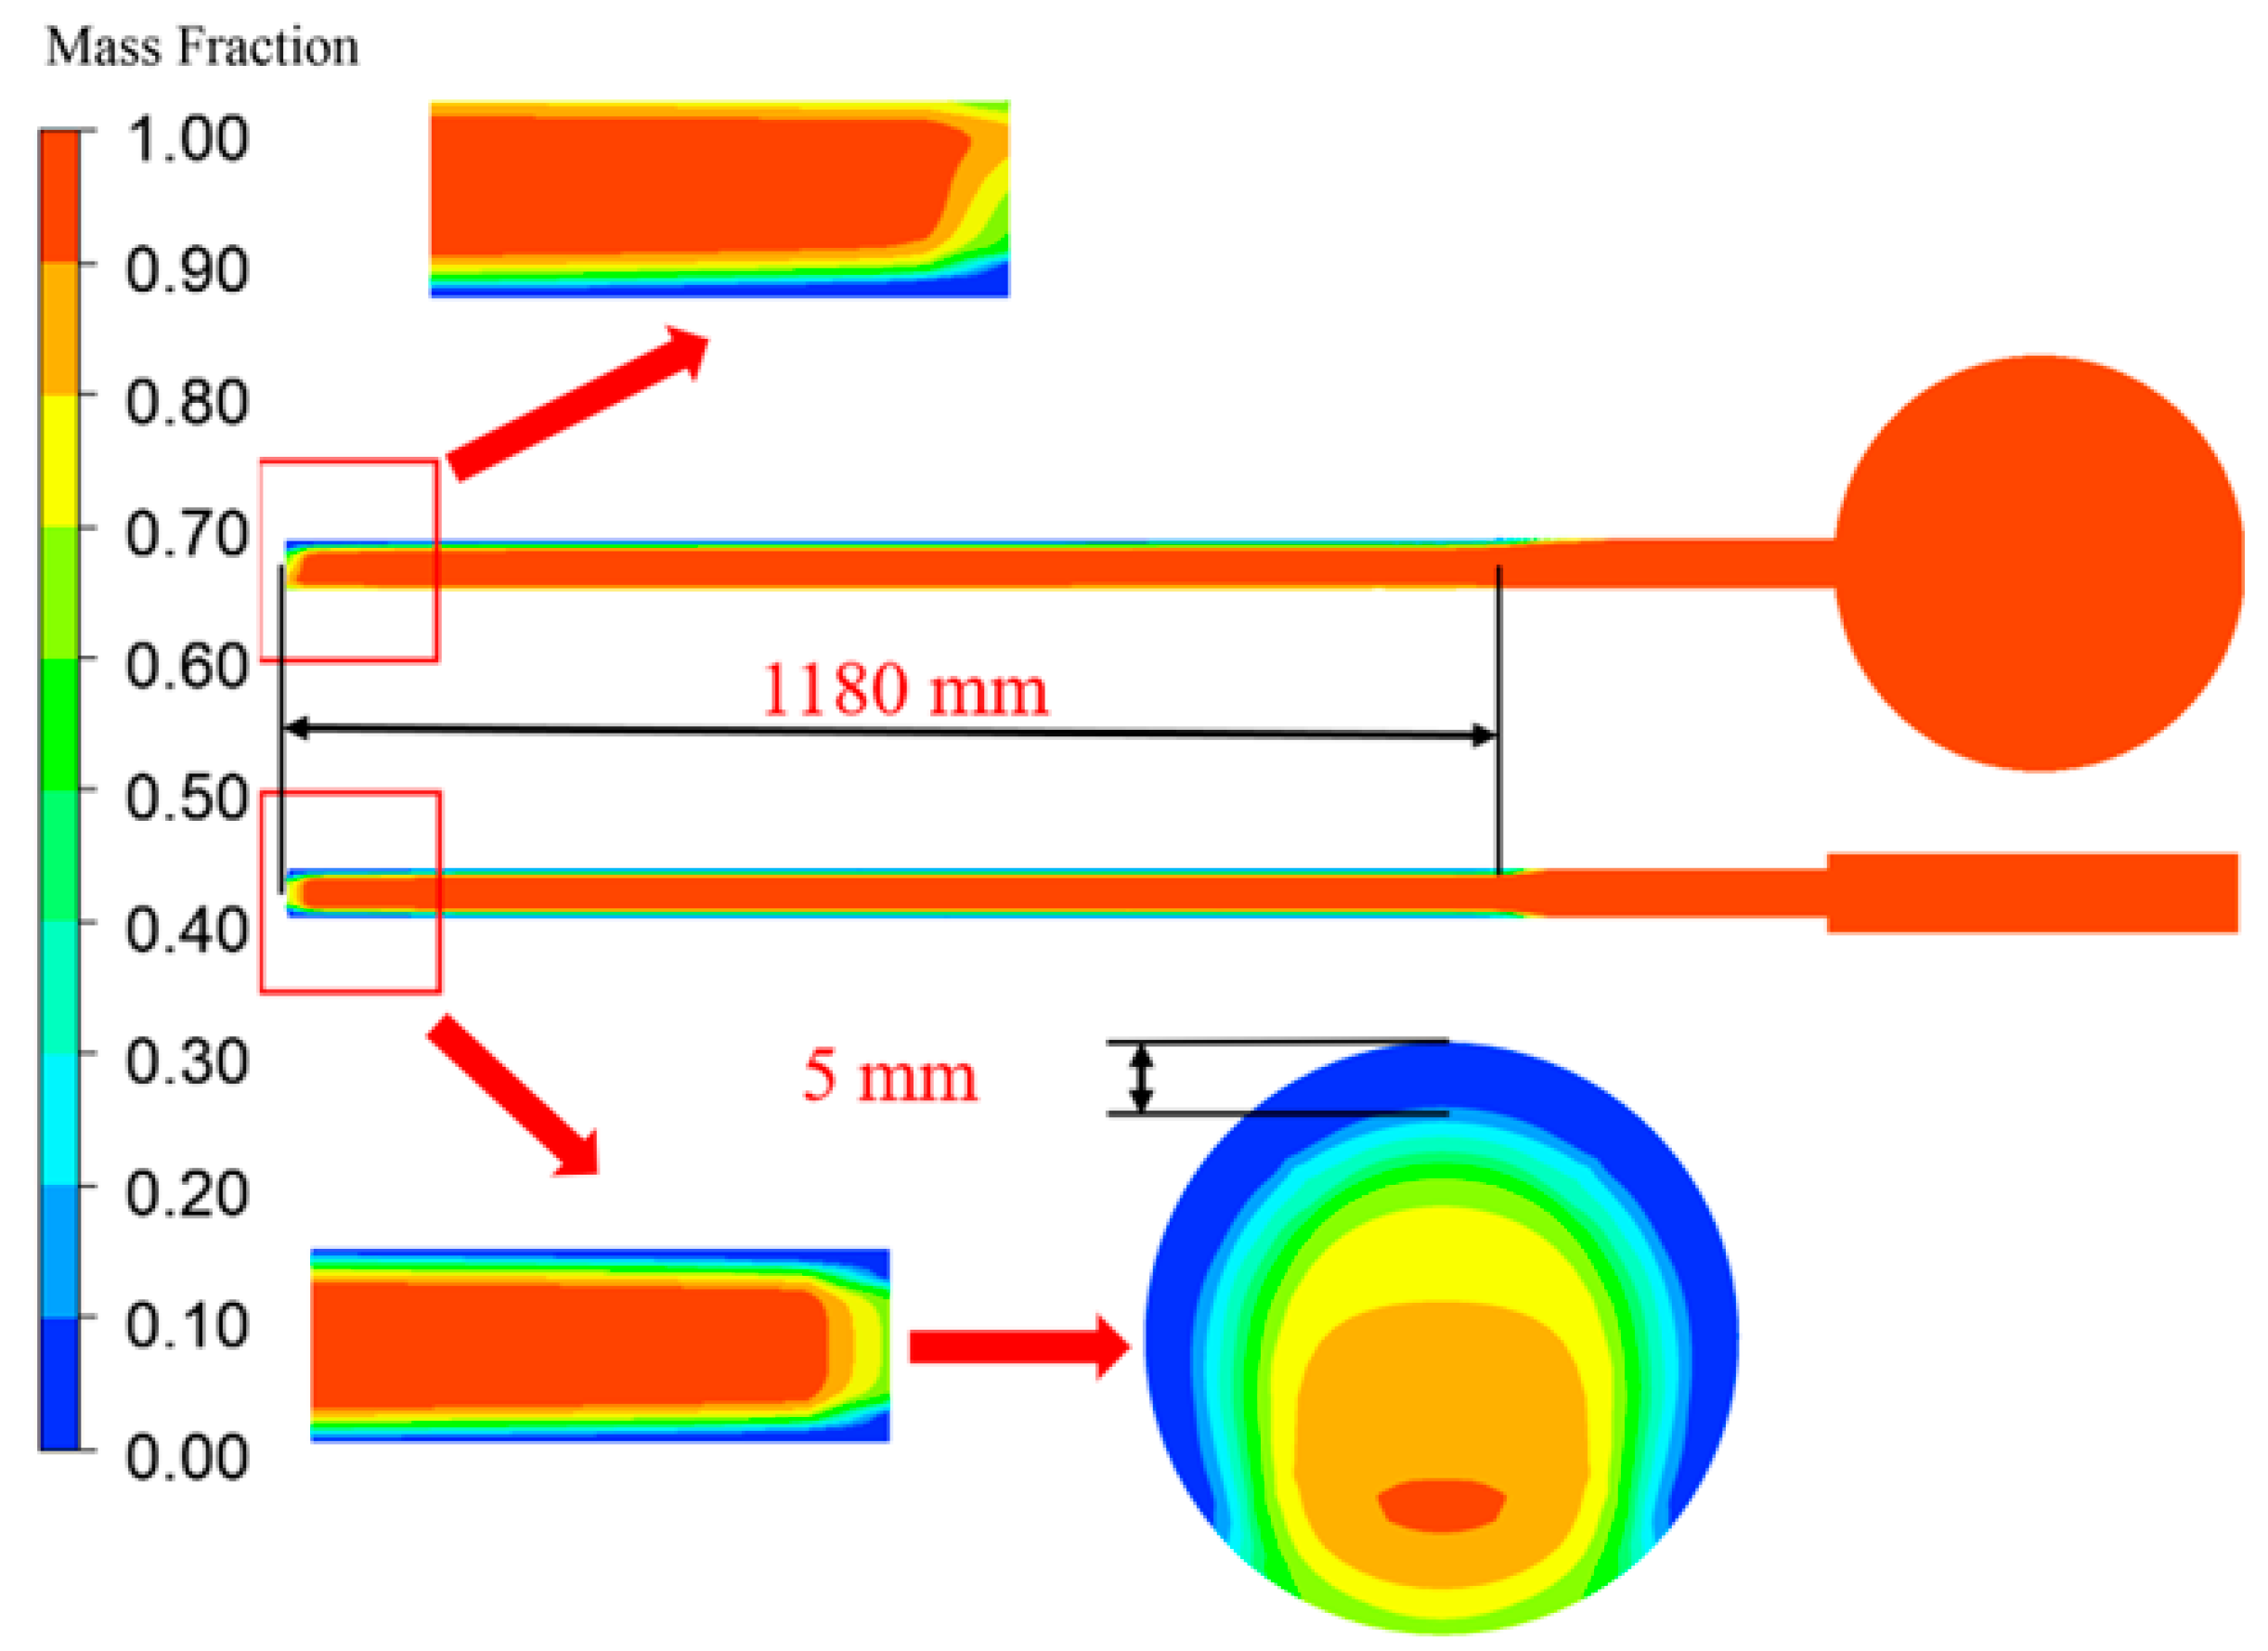
The freezing extent of the water inside the collector is shown in Figure 10. The simulated unit’s vacuum tubes start freezing first at the end of the tubes near the ground, and the freezing thickness increases with time, gradually spreading towards the center of the tubes. From the perspective of the tube length direction, the freezing gradually extends from the tail end of the vacuum tubes toward the direction of the thermal storage tank.
At the end of the heat dissipation process, specifically at 08:00 the next morning, as shown in Figure 11, the freezing thickness at the tail end of the vacuum tubes is approximately 5 mm, while the remaining section is a mixture of ice and water. The length of the frozen section is approximately 1180 mm. Among the monitoring surfaces inside the vacuum tubes, the largest temperature difference occurs at P3 before and after cooling, with a maximum temperature difference of 40.2 °C. The smallest temperature difference occurs at T0, with a minimum temperature difference of 11.9 °C.
In the control group, at the end of the heat dissipation process, the liquid fraction of water inside the vacuum tubes is shown in Figure 12. Compared to the simulated unit with a water tank, the freezing extent is more severe in the control group. The middle to the end of the vacuum tubes is completely frozen, and the freezing extends from the end towards the top. There is a significant temperature difference and a noticeable temperature gradient at the top of the vacuum tubes.
At the end of the heat dissipation process, specifically at 08:00 the next morning, as shown in Figure 13, the freezing thickness at the tail end of the vacuum tubes is 47 mm, and the bottom section is completely frozen. The freezing length along the length of the individual tube is approximately 1320 mm, indicating severe freezing. Approximately 4/5 of the tube’s length has a liquid fraction of 1, indicating complete freezing. Among the monitoring surfaces inside the vacuum tubes, the largest temperature difference occurs at monitoring surface P3 before and after cooling, with a maximum temperature difference of 40.7 °C. The smallest temperature difference occurs at monitoring surface P1, with a minimum temperature difference of 26.4 °C. By comparing Figure 10 and Figure 12, it is evident that the presence or absence of a thermal storage water tank has a significant impact on the heat dissipation and freezing processes of individual vacuum tubes with the same specifications. Therefore, the volume of the thermal storage water tank has a significant influence on the heat dissipation and freezing processes of all-glass evacuated tube collectors.

4. The Influence of Varying Volumes on the Numerical Model’s Heat Dissipation for Solar Collectors

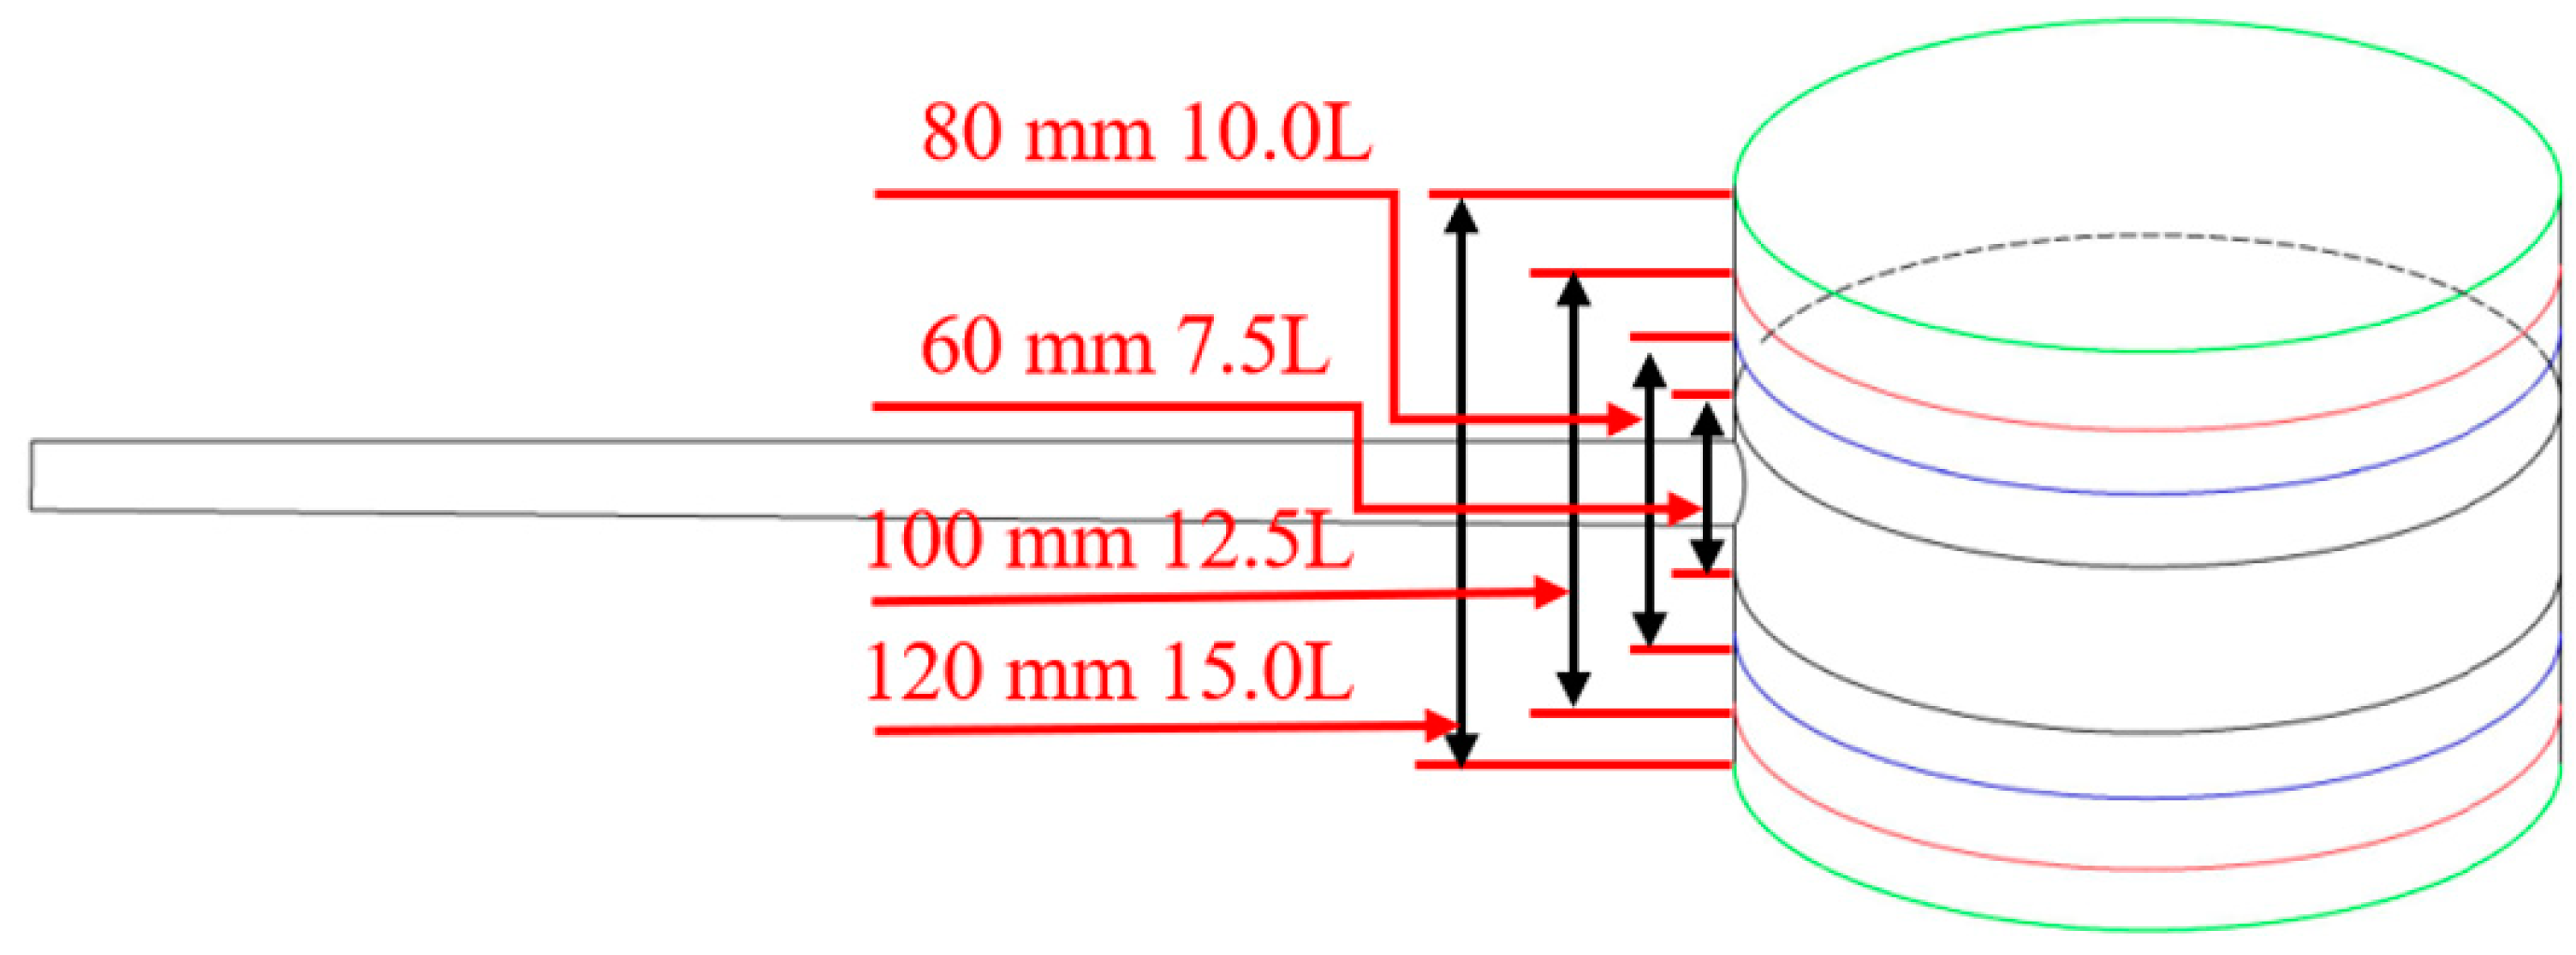
In this study, we aimed to change the volume of the thermal storage water tank by altering the length dimensions of the thermal storage unit in the simulated unit. As shown in Figure 14, we selected thermal storage water tank units with dimensions of 60 × 400 mm, 100 × 400 mm, and 120 × 400 mm (the initial thermal storage water tank size was 80 × 400 mm, 10.0 L), which corresponded to volumes of 7.5 L, 12.5 L, and 15.0 L, respectively. These dimensions were used to simulate the heat dissipation results. The simulations were conducted with an initial temperature of 40 °C and a simulation time from 18:00 in the afternoon to 08:00 the following day. The external environmental temperatures, including the effective radiation temperature of the night sky and the ground temperature, were set to the meteorological parameters of the night in Luoyang on 30 January 2022. To achieve the variation of boundary temperatures over time, a user-defined function (UDF) was employed in ANSYS Fluent to write a polynomial function that was dependent on time and defined the temperature boundary conditions.

4.1. Heat Dissipation and Freezing Process of Unit Volume of 7.5 L Heat Storage Water Tank

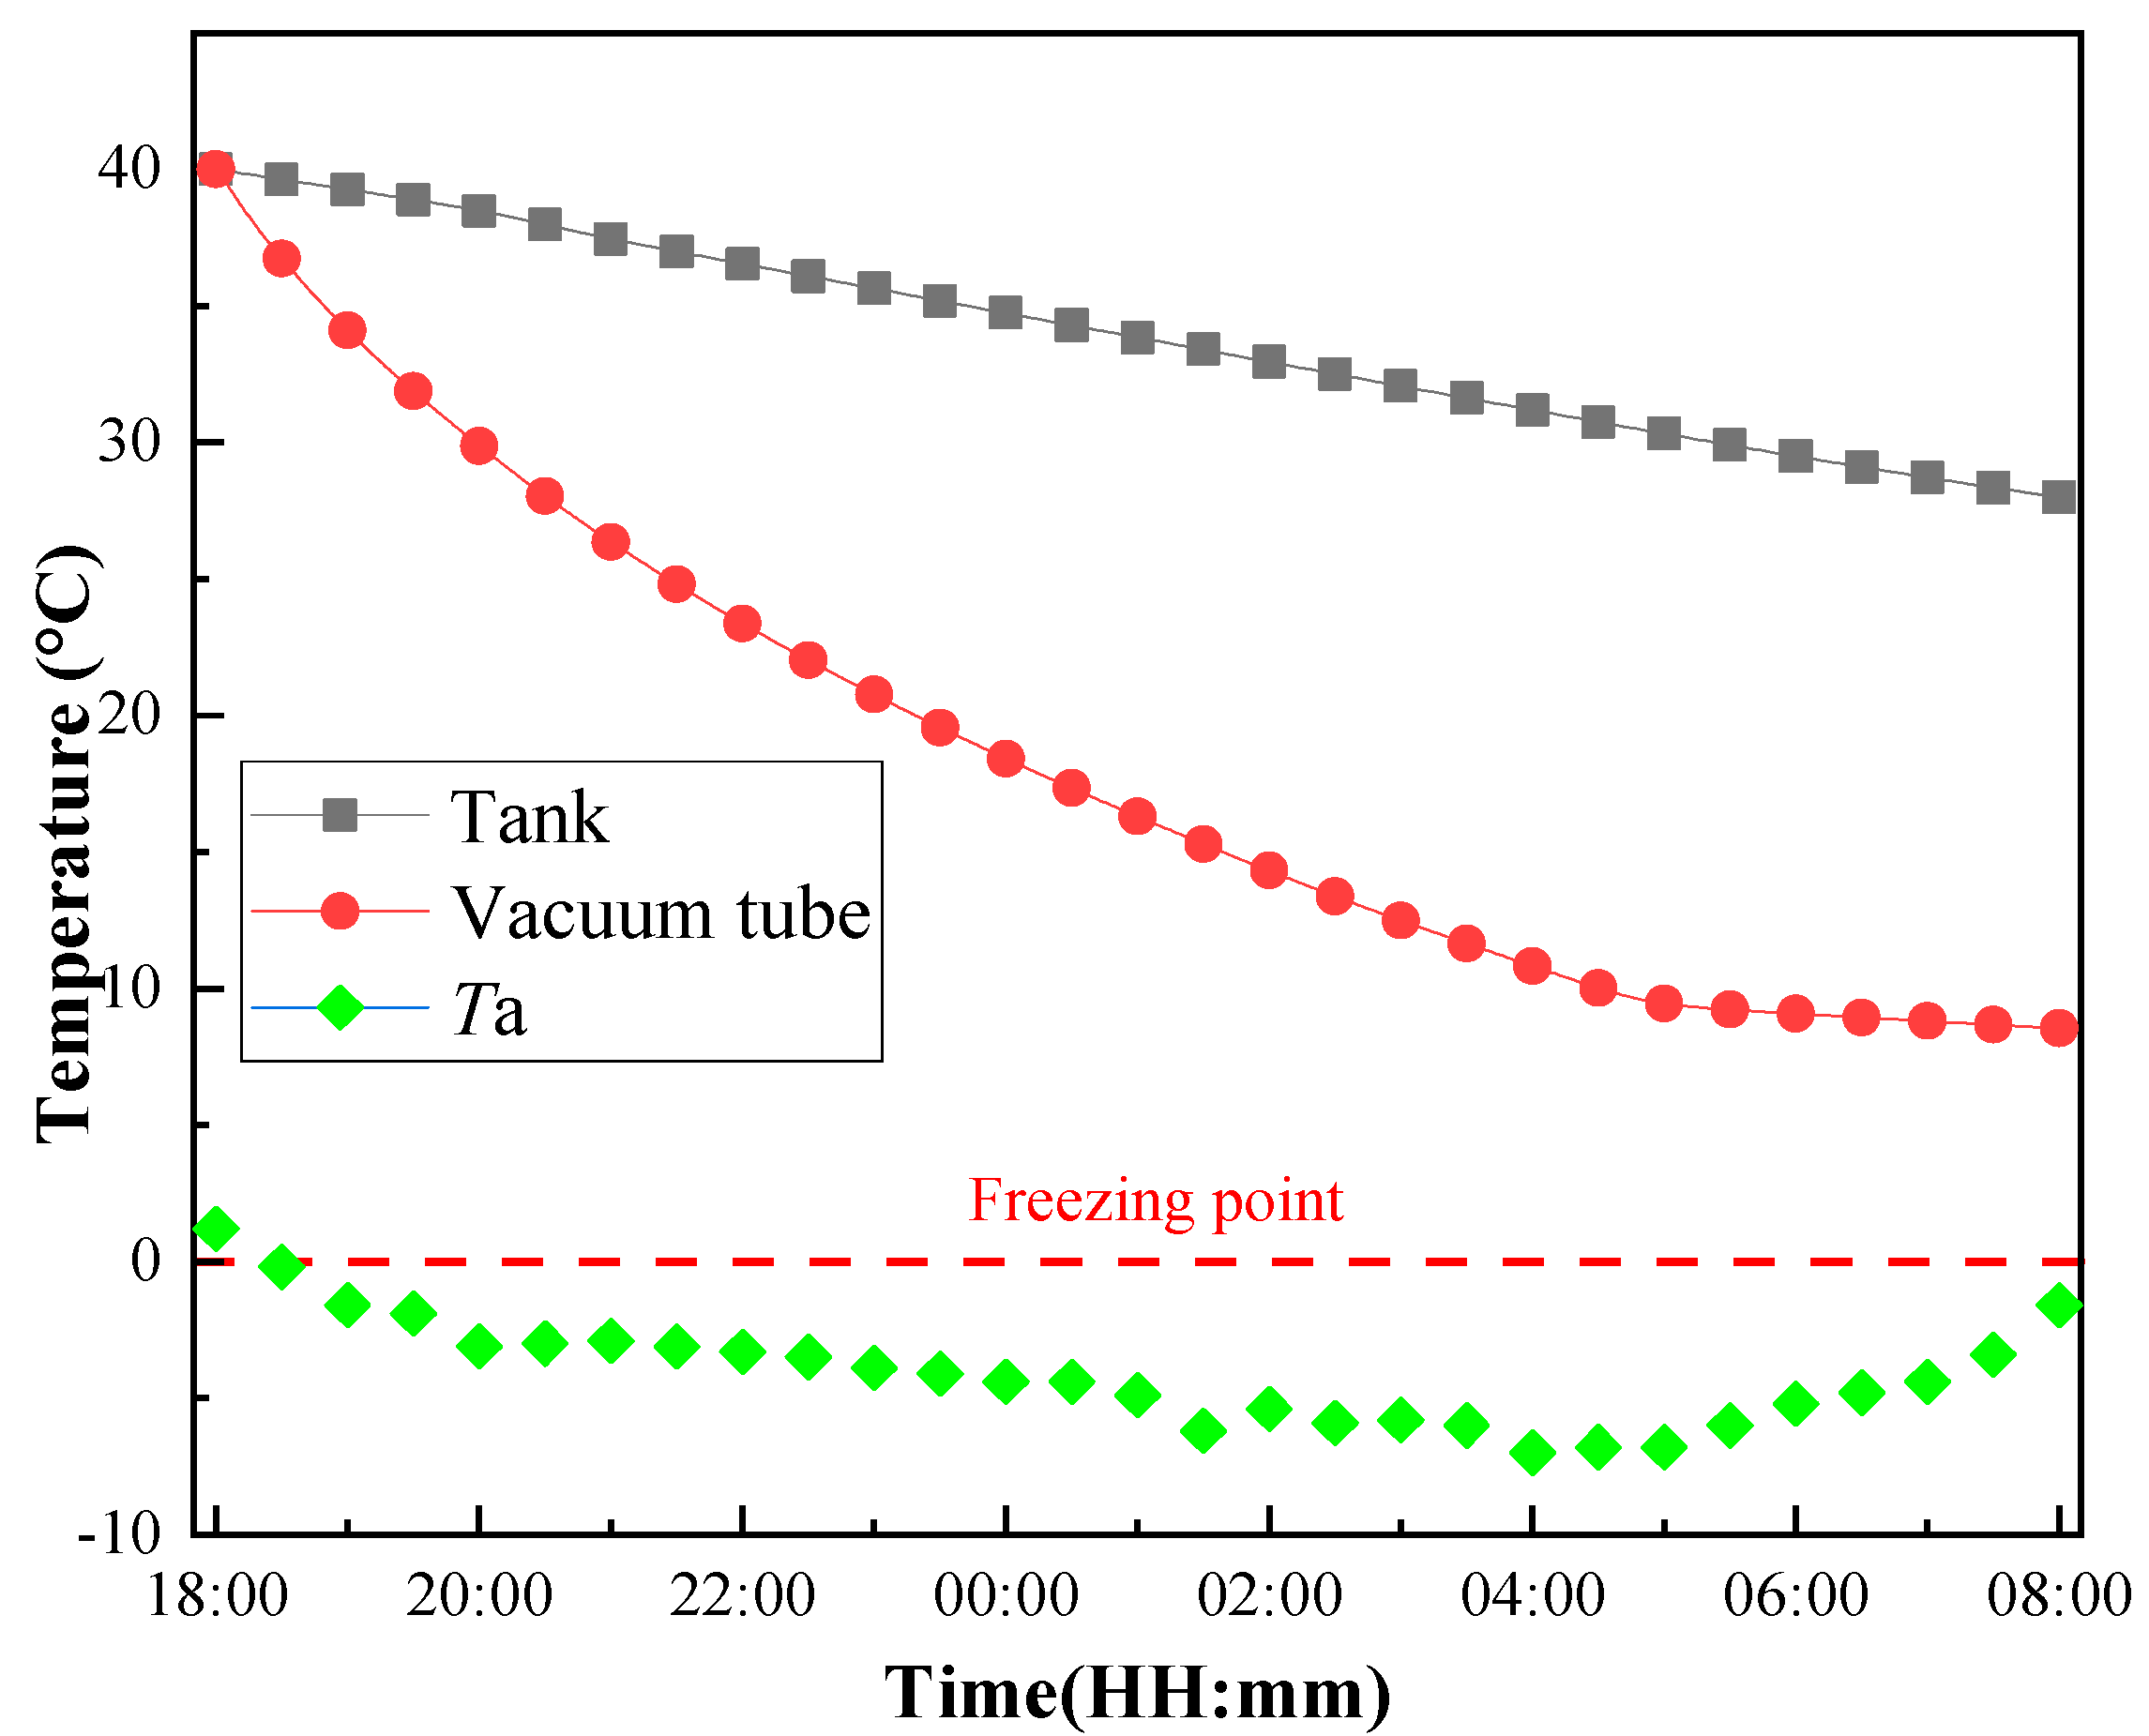
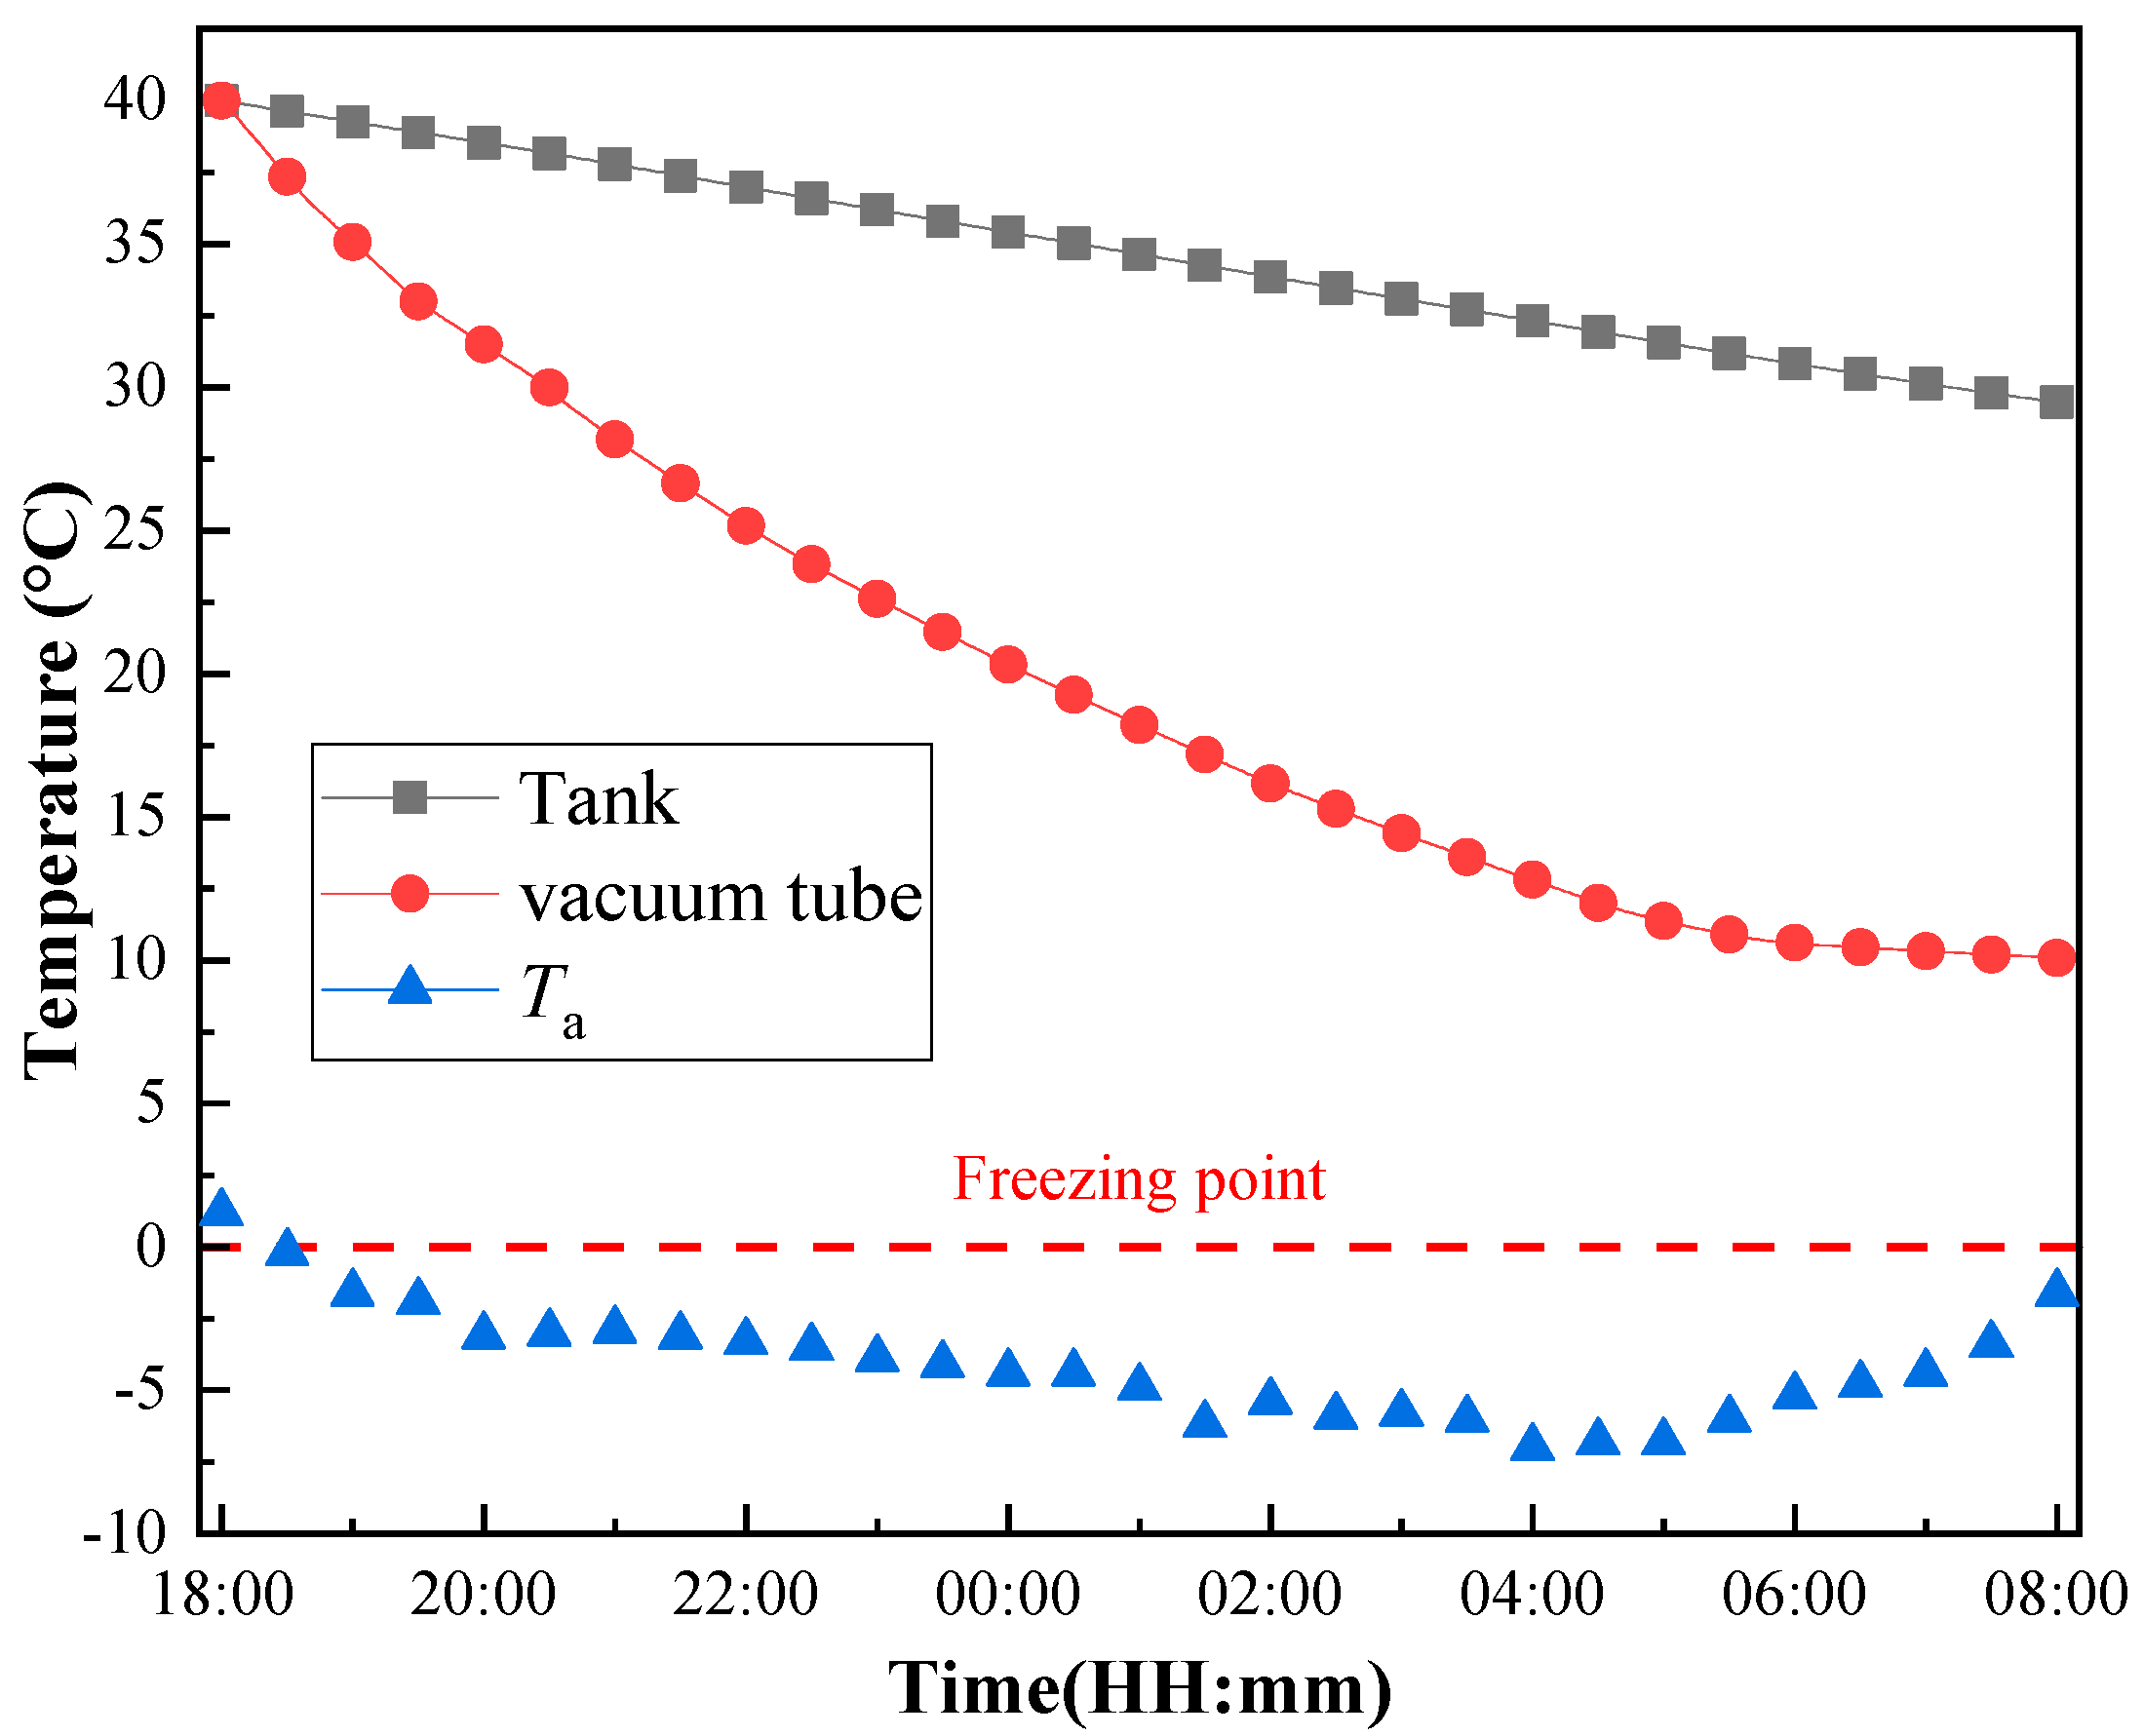
The nighttime heat dissipation temperature variations in the 60 mm × 400 mm unit storage tank are shown in Figure 15. The “Tank” curve represents the average temperature variation of the storage tank during nighttime heat dissipation, while the “Vacuum tube” curve represents the average temperature variation of the water inside the vacuum tube. According to the data shown in the figure, the average temperature of the storage tank decreased by 12.1 °C, while the average temperature of the vacuum tube decreased by 31.5 °C. The storage tank and vacuum tube experienced temperature reductions of 30.3% and 78.8%, respectively.
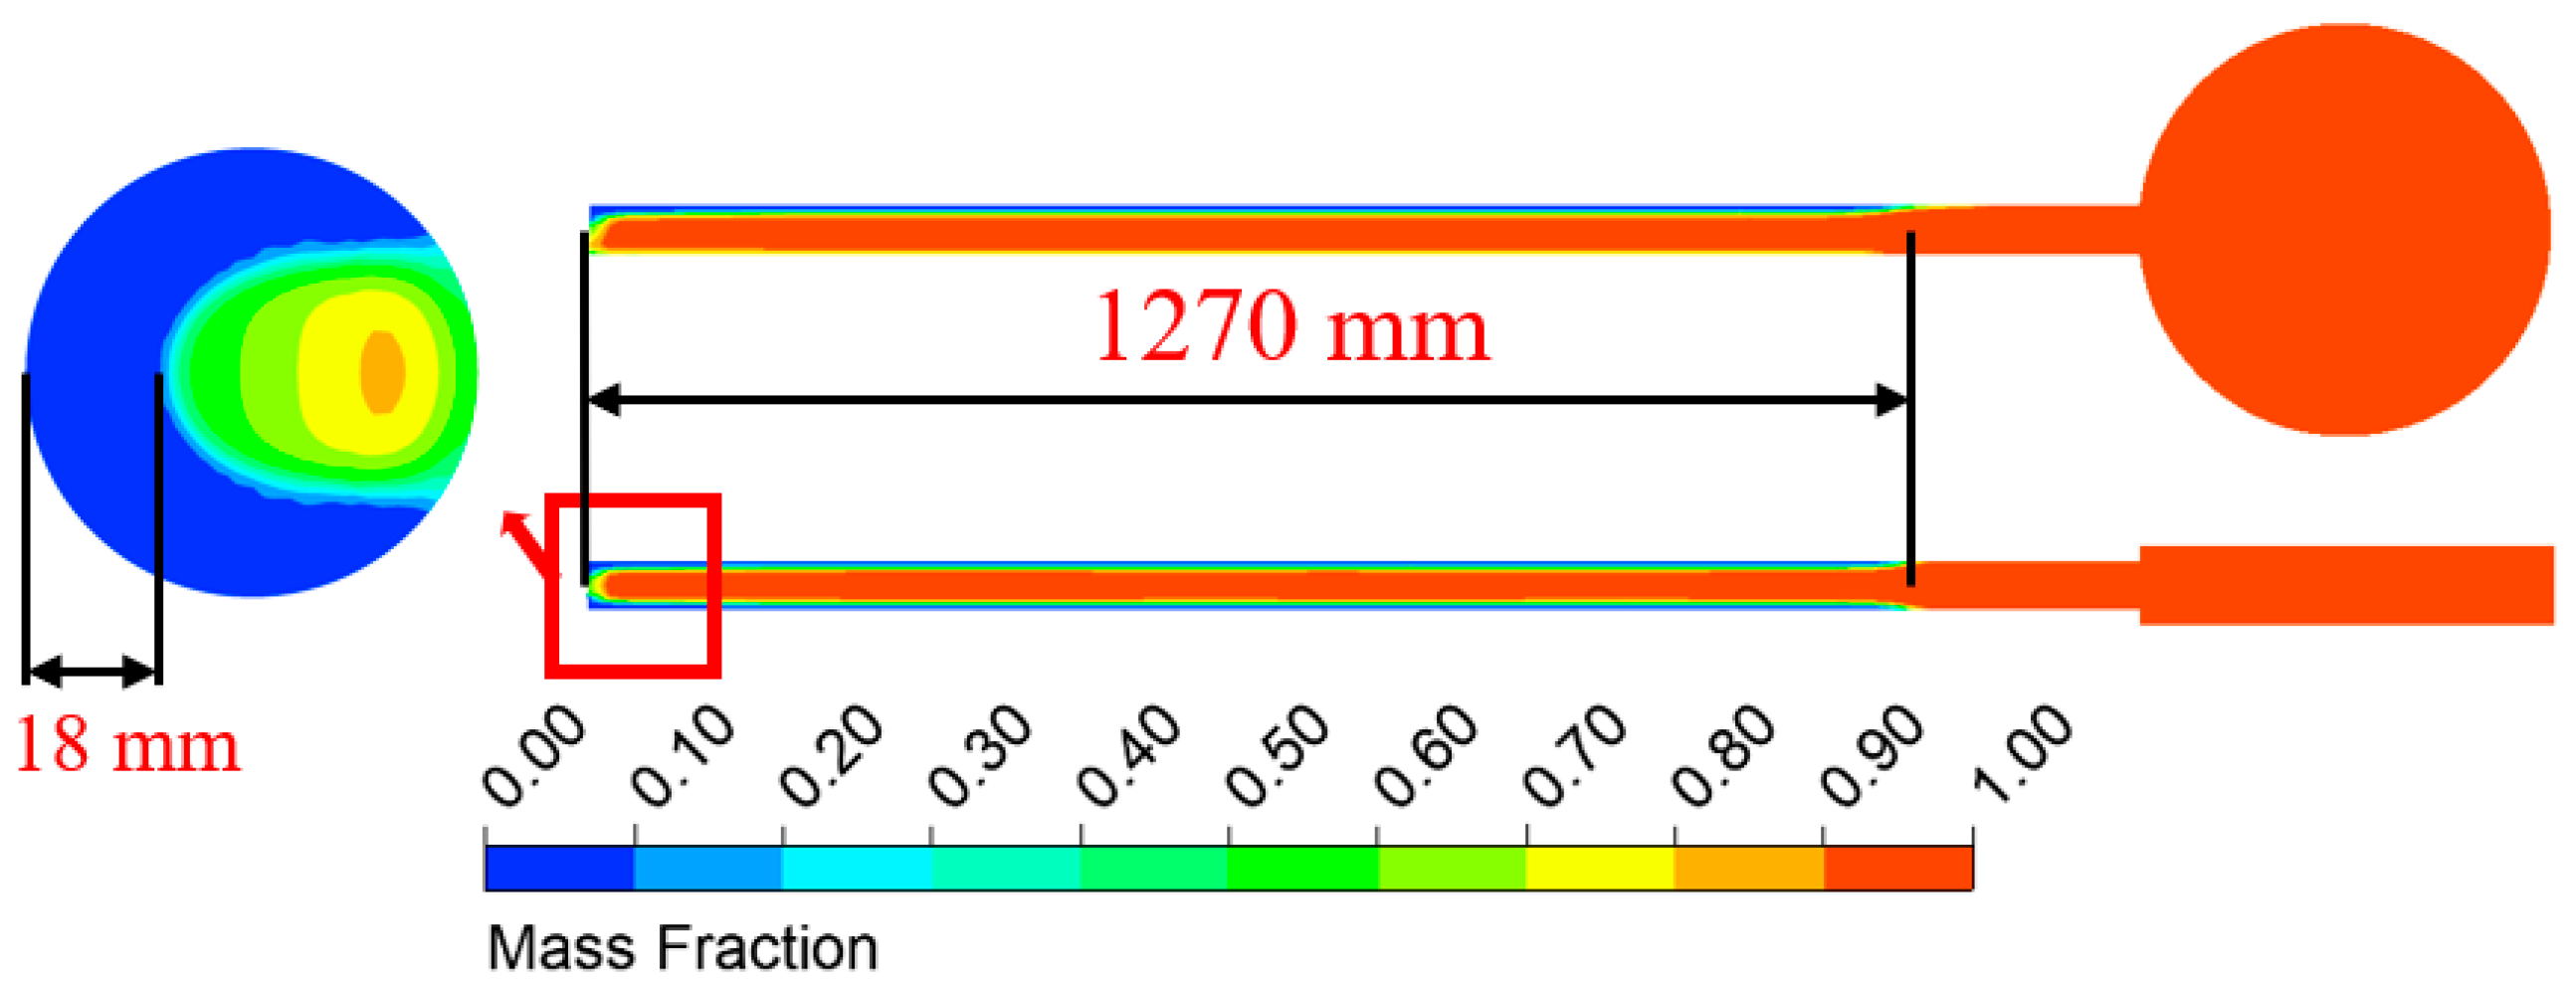
The liquid fraction of water inside the simulated unit at the end of heat dissipation is shown in Figure 16. It can be observed that under the condition of a 7.5 L storage tank volume, freezing occurs inside the vacuum tube. The freezing thickness at the end of the vacuum tube is 18 mm, while the remaining portion is in a state of ice–water mixture. The length along the vacuum tube in which freezing occurs is 1270 mm long.

4.2. Heat Dissipation and Freezing Process of Unit Volume of 1 2.5 L Heat Storage Water Tank

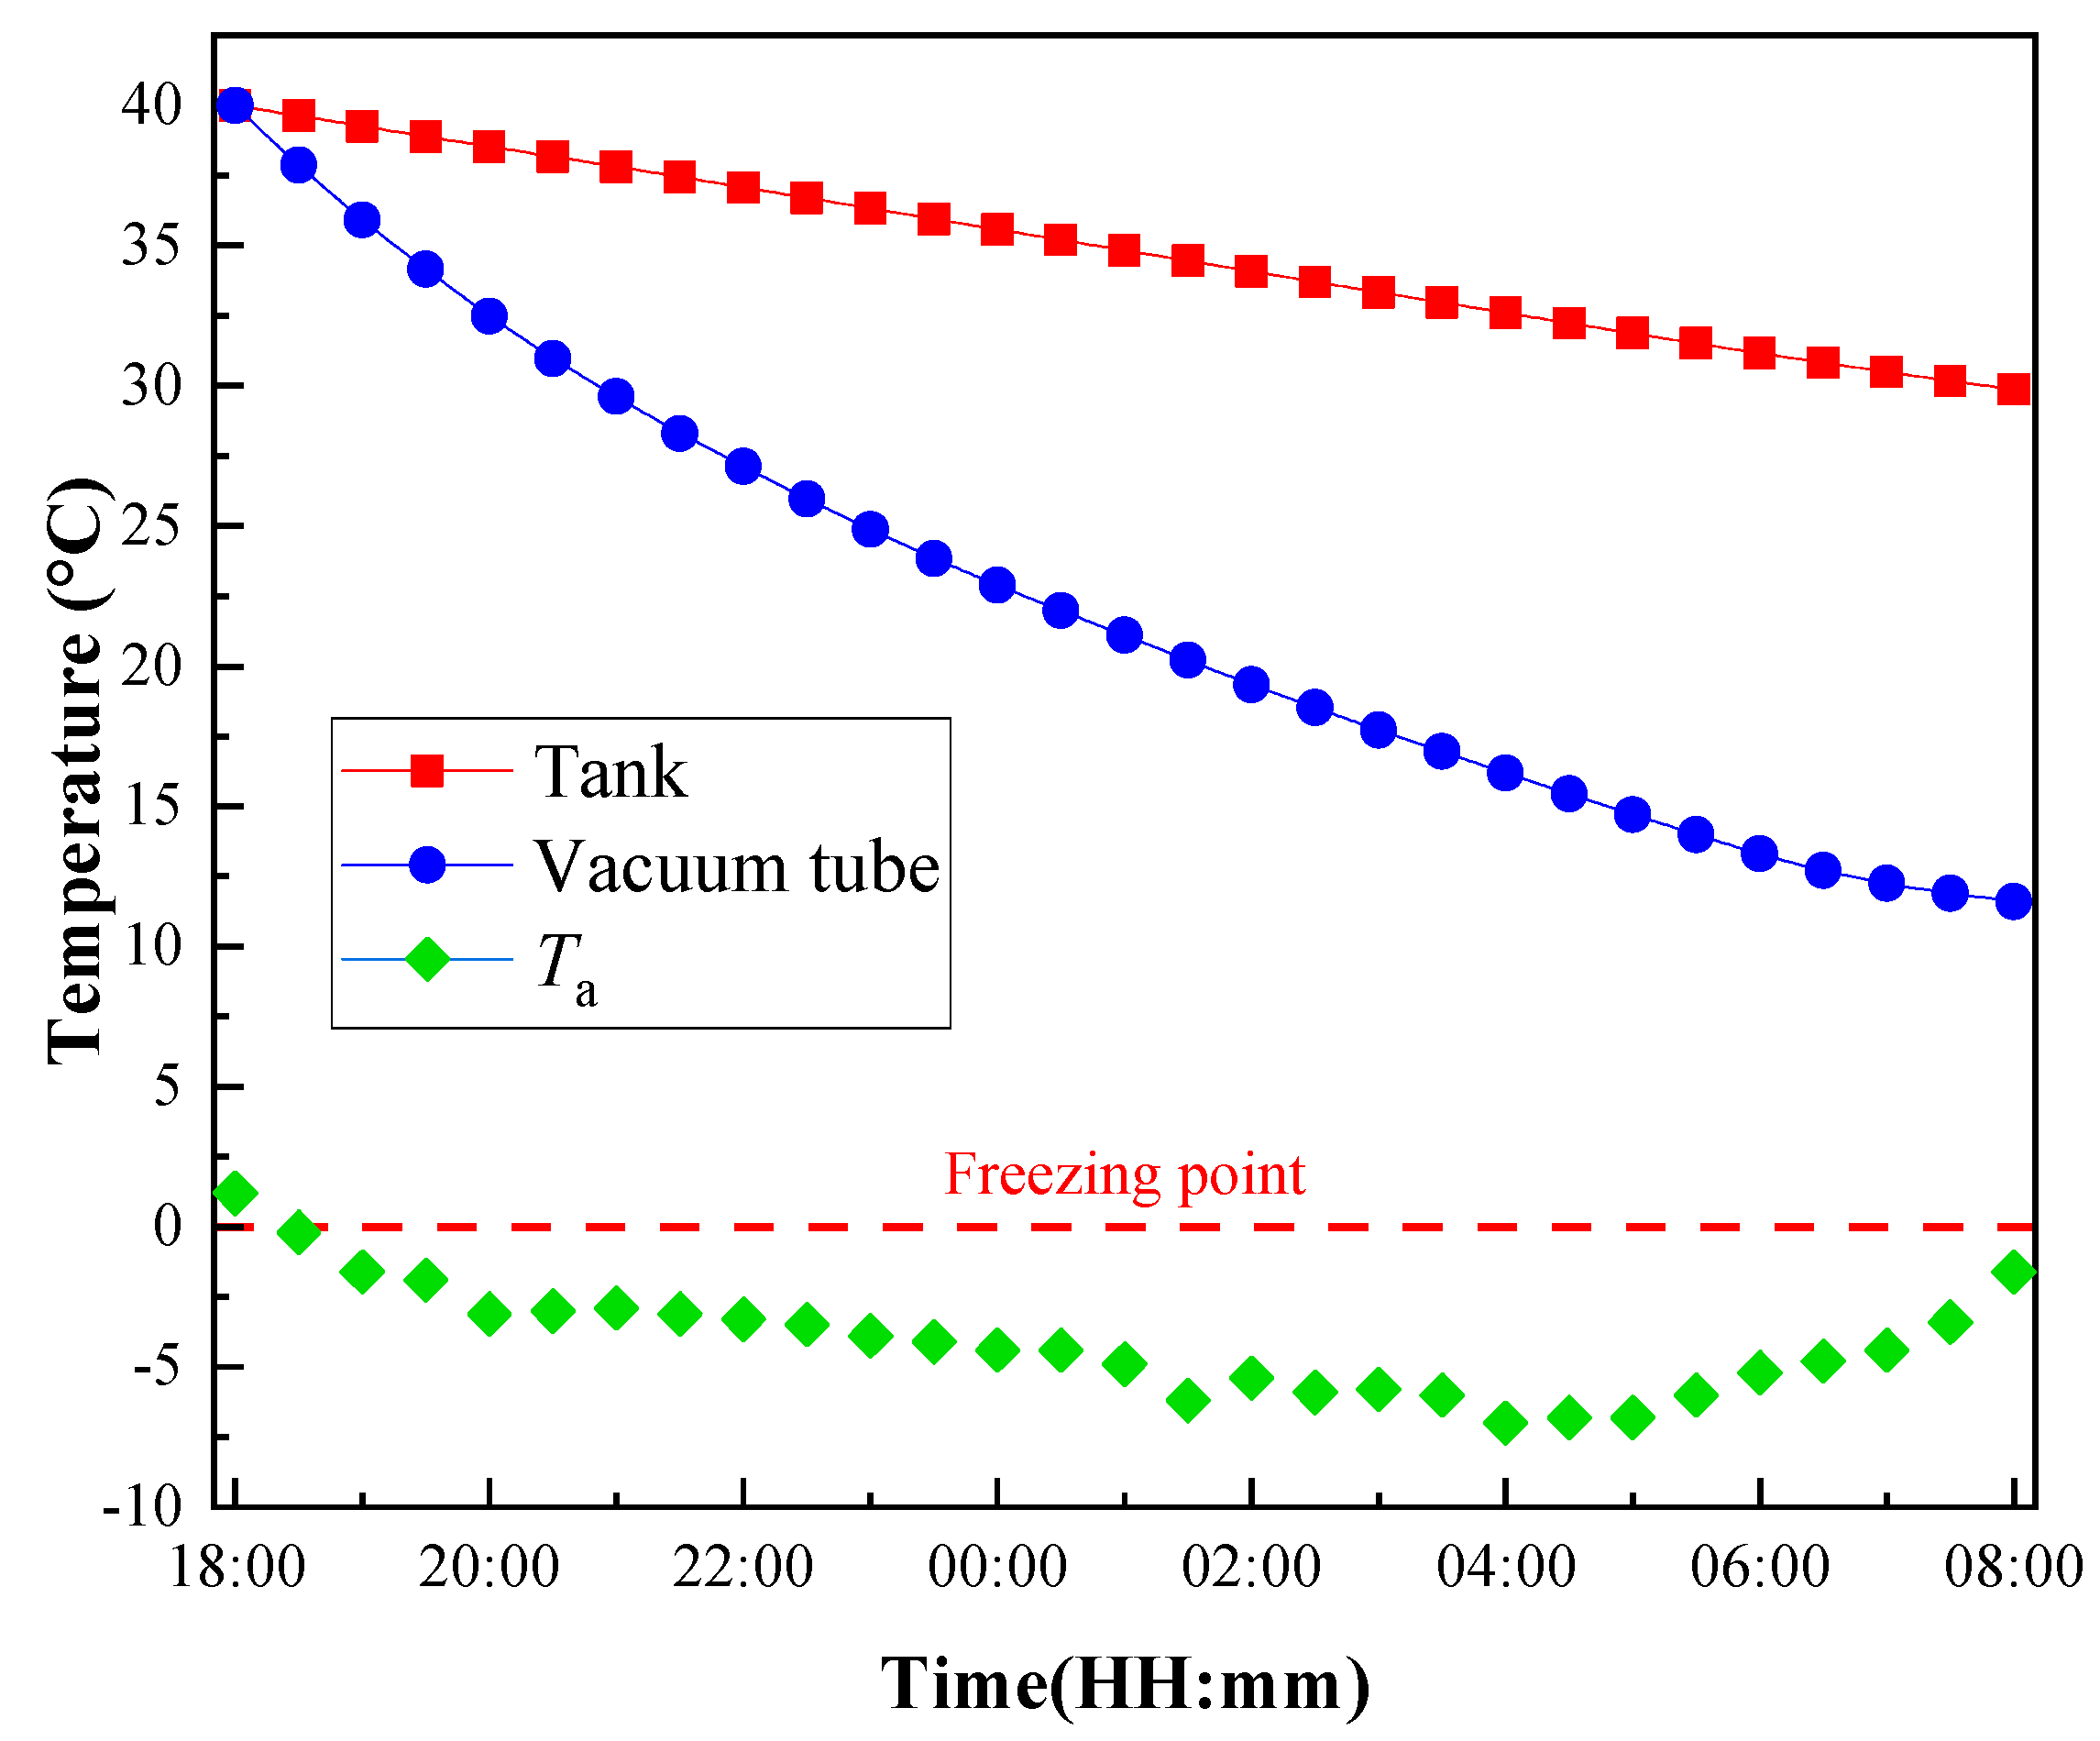
The nighttime heat dissipation temperature variation in the 100 mm × 400 mm storage tank unit is shown in Figure 17. After heat dissipation, the temperature of the storage tank decreases by 10.6 °C, and the average temperature of the vacuum tube decreases by 29.9 °C. The percentage decrease in temperature for the storage tank and the vacuum tube is 26.5% and 74.8%, respectively. The liquid fraction of water inside the collector at the end of heat dissipation is shown in Figure 18. Under the condition of a 12.5 L storage tank volume, freezing occurs inside the vacuum tube. The freezing thickness at the end of the vacuum tube is 14 mm, and the remaining portion is in a state of ice–water mixture. The length along the vacuum tube in which freezing occurs is 1135 mm.

4.3. Heat Dissipation and Freezing Process of Unit Volume of 1 5.0 L Heat Storage Water Tank

The nighttime heat dissipation temperature variation in the 120 mm × 400 mm storage tank unit is shown in Figure 19. After heat dissipation, the temperature of the storage tank decreases by 10.1 °C, and the average temperature of the vacuum tube decreases by 28.4 °C. The percentage decrease in temperature for the storage tank and the vacuum tube is 25.2% and 71.0%, respectively. The liquid fraction of water inside the collector at the end of heat dissipation is shown in Figure 20. Under the condition of a 12.5 L storage tank volume, freezing occurs inside the vacuum tube. The freezing thickness at the end of the vacuum tube is 8 mm. The length along the vacuum tube in which freezing occurs is 370 mm.
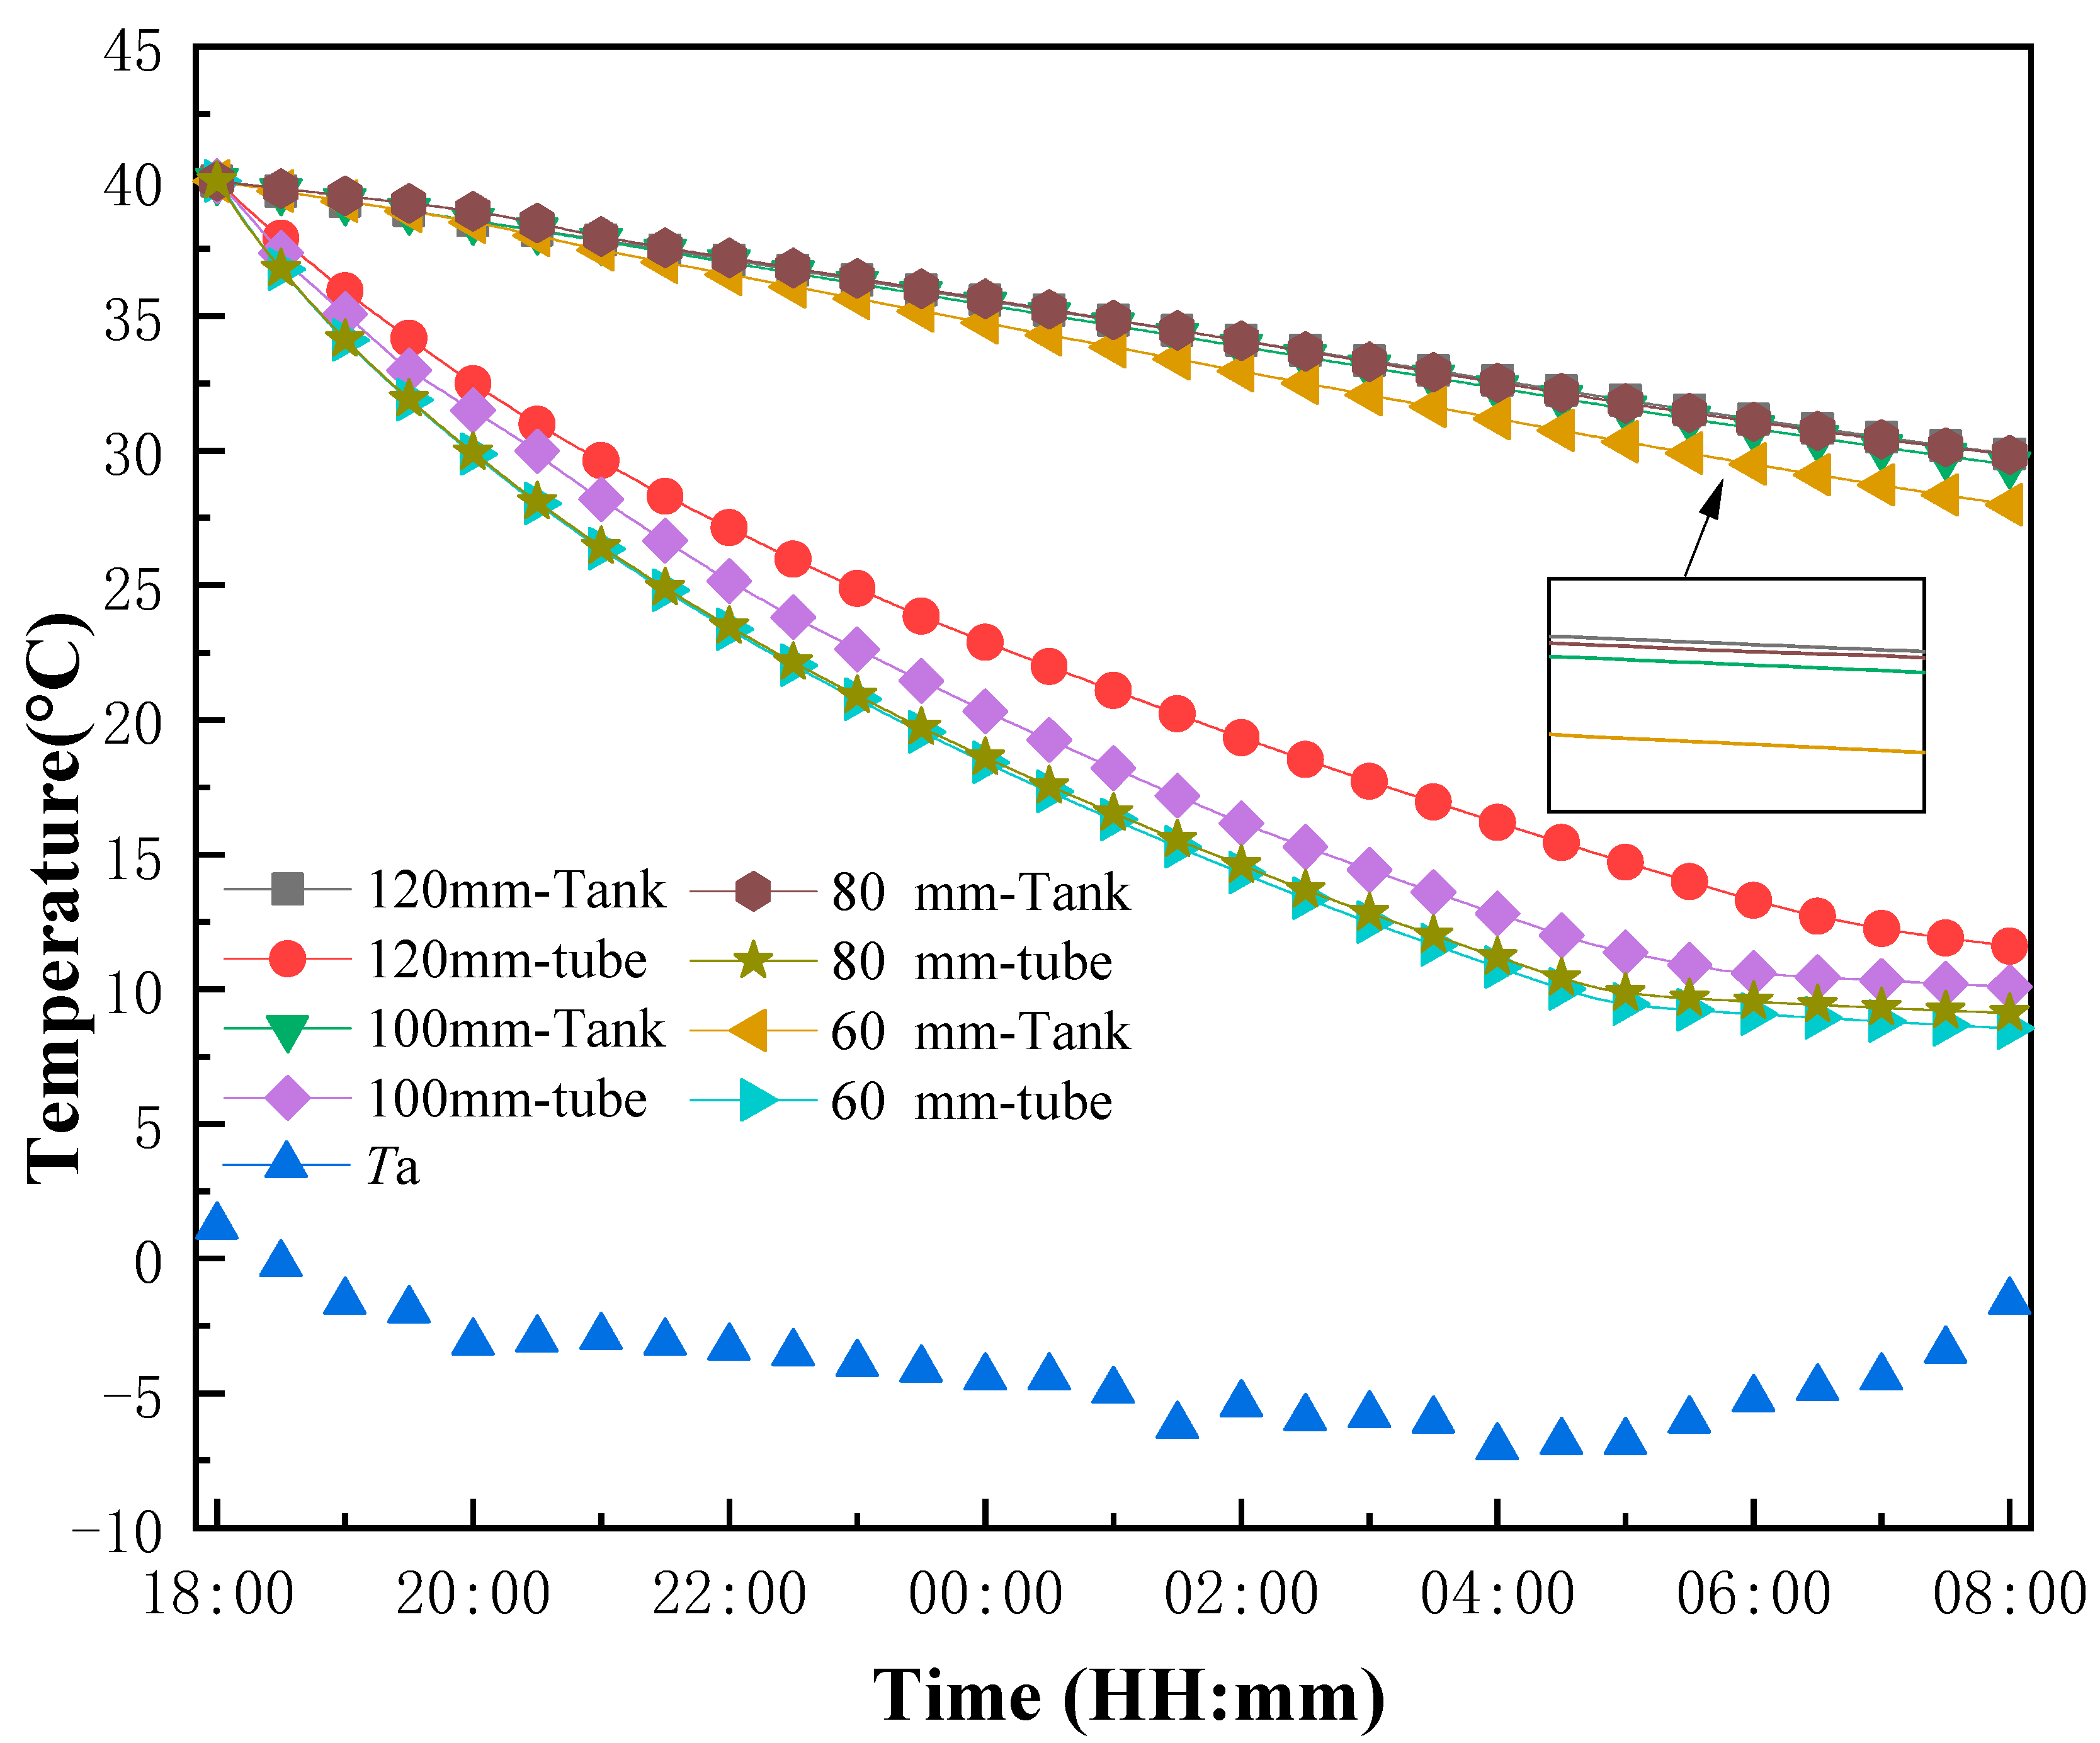
As shown in Figure 21, when compared to the initial size of the storage tank in this study, which was 80 mm × 400 mm with a volume of 10 L, the temperature decrease in both the storage tank and the vacuum tube increases by 4.5% and 3.8%, respectively, when the storage tank size is reduced to 60 mm × 400 mm with a volume of 7.5 L. On the other hand, when the storage tank size is increased to 100 mm × 400 mm with a volume of 12.5 L, the temperature decrease in the storage tank and the vacuum tube decreases by 6.5% and 4.2%, respectively. Similarly, when the storage tank size is further increased to 120 mm × 400 mm with a volume of 15 L, the temperature decrease in the storage tank and the vacuum tube decreases by 12.1% and 7.6%, respectively. It can be observed that as the volume of the storage tank increases, the decrease in temperature during nighttime is reduced, indicating lower heat loss, and the degree of freezing in the vacuum tube is decreased.

5. Conclusions

A numerical model was developed in this study to simulate the heat dissipation and freezing process of a full-glass evacuated tube solar collector during cold winter nights. The accuracy of the numerical model was validated through nocturnal temperature drop experiments conducted in the Luoyang region, as well as verification using individual evacuated tubes. Subsequently, simulations were carried out to investigate the freezing process of the full-glass evacuated tube solar collector under different conditions, including without a thermal storage tank and with thermal storage tanks of varying volumes. The main conclusions are drawn as follows:
(1)
Experimental and simulation results demonstrate that during the heat dissipation process, the temperature decrease rate of the water inside the vacuum tube is significantly higher than that of the water inside the thermal storage tank at different time intervals. Freezing primarily occurs at the bottom surface of the vacuum tube. The temperature at the end of the vacuum tube is consistently the lowest within the tube, while the temperature at the junction between the vacuum tube and the thermal storage tank is the highest and exhibits the greatest temperature gradient and temperature difference. Solar water heaters in the Luoyang region are susceptible to freezing risks;
(2)
During the heat dissipation process, the all-glass vacuum tube solar collector experiences freezing. The frost thickness at the end of the vacuum tube is approximately 5 mm, with the remaining section of the cross-section consisting of a mixture of ice and water. The length of freezing extends to about 1180 mm. In the absence of a water tank, the freezing situation is severe, with approximately 4/5 of the single tube completely frozen;
(3)
The thermal storage tank has a significant impact on the heat dissipation and freezing process of the all-glass vacuum tube solar collector. Compared to a 10 L unit storage tank, reducing the volume to 7.5 L results in an increase of 4.5% in temperature drop for the storage tank and 3.8% for the vacuum tube. Conversely, increasing the volume to 15 L leads to a decrease of 12.1% in temperature drop for the storage tank and 7.6% for the vacuum tube. These results indicate that the volume of the water tank has a significant effect on the freezing process of the solar collector. A larger water tank volume results in slower freezing and longer working time for the solar collector.
Due to the sealed nature of the all-glass evacuated tube collector, it is challenging to accurately measure the temperatures inside the water tank and various parts of the evacuated tubes. Observing the freezing conditions from the outside of the vacuum tubes is also difficult, which poses limitations on experimental monitoring. To mitigate the occurrence of frost damage in all-glass evacuated tube solar collectors, further research is needed to calculate the minimum temperature required for ice formation inside water tanks of different volumes. Additionally, an economic analysis should be conducted to assess the cost effectiveness of using different working fluids as fillers in these systems.

Author Contributions

Conceptualization, M.M. and S.L.; Methodology, X.W.; Software, X.W.; Validation, Y.W.; Formal analysis, M.M. and B.L.; Resources, T.L.; Writing—original draft, S.W. and X.W.; Visualization, Y.W. and B.L.; Supervision, S.L.; Project administration, S.W.; Funding acquisition, T.L. All authors have read and agreed to the published version of the manuscript.

Funding

This work was supported by the Opening Fund of the State Key Laboratory of Green Building in Western China (LSKF202105) and the Young Talents Project of Science and Technology Research Program of Hubei Education Department (No. Q20221110).

Data Availability Statement

The authors are unable or have chosen not to specify which data has been used.

Conflicts of Interest

The authors declare no conflict of interest.

Nomenclature

hHeat transfer coefficient, W/(m2·K)
RThermal resistance per unit length of the collector tube, (m·K)/W
TTemperature, °C
mMass, kg
cSpecific heat, KJ/(kg·K)
UHeat loss coefficient, W/K
QHeat flux, W/m2
qNet heat flux density, W/m2
HEnthalpy, J/kg
xHorizontal coordinate, m
yAxial coordinate, m
zVertical coordinate, m
ACross-sectional area, m2
LCover glass tube diameter, m
RiFrozen water fraction
VVolume, m3
DAxial length of vacuum, m
RaReynolds number
vKinematic viscosity, m2/s
CpSpecific heat capacity, KJ/(kg·K)
uHorizontal coordinate velocity component
vAxial coordinate velocity component
wVertical coordinate velocity component
tTime
s2Variance
SVariance mean
Greek letters
εEmissivity
ρDensity, kg/m3
λThermal conductivity, W/(K·m)
γLatent heat of water, J/kg
δThickness, m
αThermal diffusivity, m2/s
βVolume expansion coefficient, 1/K
Subscript
aAmbient
iInner glass tube
oOuter glass tube, cover glass tube
gGround for radiation calculation
skySky for radiation calculation
rRadiative
cConvective
effEfficient
waWater
lostHeat lost
tTank
vaVacuum
icIce
GSolar water heaters
PVacuum tube

References

  1. Thirugnanasambandam, M.; Iniyan, S.; Goic, R. A review of solar thermal technologies. Renew. Sustain. Energy Rev. 2010, 14, 312–322. [Google Scholar] [CrossRef]
  2. Syahputra, R.; Soesanti, I. Renewable energy systems based on micro-hydro and solar photovoltaic for rural areas: A case study in Yogyakarta, Indonesia. Energy Rep. 2021, 7, 472–490. [Google Scholar] [CrossRef]
  3. Wang, T.-Y.; Zhao, Y.-H.; Diao, Y.-H.; Ren, R.-Y.; Wang, Z.-Y. Performance of a new type of solar air collector with transparent-vacuum glass tube based on micro-heat pipe arrays. Energy 2019, 177, 16–28. [Google Scholar] [CrossRef]
  4. Zhu, T.-T.; Zhao, Y.-H.; Diao, Y.-H.; Li, F.-F.; Quan, Z.-H. Experimental investigation and performance evaluation of a vacuum tube solar air collector based on micro heat pipe arrays. J. Clean. Prod. 2017, 142, 3517–3526. [Google Scholar] [CrossRef]
  5. Barone, G.; Buonomano, A.; Chang, R.; Forzano, C.; Giuzio, G.F.; Mondol, J.; Palombo, A.; Pugsley, A.; Smyth, M.; Zacharopoulos, A. Modelling and simulation of building integrated Concentrating Photovoltaic/Thermal Glazing (CoPVTG) systems: Comprehensive energy and economic analysis. Renew. Energy 2022, 193, 1121–1131. [Google Scholar] [CrossRef]
  6. Abdelrazik, A.; Shboul, B.; Elwardany, M.; Zohny, R.; Osama, A. The recent advancements in the building integrated photovoltaic/thermal (BIPV/T) systems: An updated review. Renew. Sustain. Energy Rev. 2022, 170, 112988. [Google Scholar] [CrossRef]
  7. Qiao, X.; Kong, X.; Fan, M. Phase change material applied in solar heating for buildings: A review. J. Energy Storage 2022, 55, 105826. [Google Scholar] [CrossRef]
  8. Li, T.; Liu, Q.; Liu, L.; Li, Y.; Yu, J.; Wang, X.; Mao, Q. Feasibility study on solar coupled gas-fired boiler heating system retrofit in residential buildings in the HSCW zone of China. Case Stud. Therm. Eng. 2023, 42, 102698. [Google Scholar] [CrossRef]
  9. Louvet, Y.; Pag, F.; Ritter, D.; Schmelzer, C.; Vajen, K. About common but avoidable faults during planning, installation, and operation of solar heating plants in industrial applications. Sol. Energy Adv. 2022, 2, 100029. [Google Scholar] [CrossRef]
  10. Philip, N.; Duraipandi, S.; Sreekumar, A. Techno-economic analysis of greenhouse solar dryer for drying agricultural produce. Renew. Energy 2022, 199, 613–627. [Google Scholar] [CrossRef]
  11. Kumar, M.; Haillot, D.; Gibout, S. Survey and evaluation of solar technologies for agricultural greenhouse application. Solar Energy 2022, 232, 18–34. [Google Scholar] [CrossRef]
  12. Katsaprakakis, D. Introducing a solar-combi system for hot water production and swimming pools heating in the Pancretan Stadium, Crete, Greece. Energy Procedia 2019, 159, 174–179. [Google Scholar] [CrossRef]
  13. Katsaprakakis, D.A. Computational Simulation and Dimensioning of Solar-Combi Systems for Large-Size Sports Facilities: A Case Study for the Pancretan Stadium, Crete, Greece. Energies 2020, 13, 2285. [Google Scholar] [CrossRef]
  14. Daghigh, R.; Shafieian, A. Theoretical and experimental analysis of thermal performance of a solar water heating system with evacuated tube heat pipe collector. Appl. Therm. Eng. 2016, 103, 1219–1227. [Google Scholar] [CrossRef]
  15. Shafieian, A.; Khiadani, M.; Nosrati, A. Thermal performance of an evacuated tube heat pipe solar water heating system in cold season. Appl. Therm. Eng. 2019, 149, 644–657. [Google Scholar] [CrossRef]
  16. Sabiha, M.A.; Saidur, R.; Mekhilef, S.; Mahian, O. Progress and latest developments of evacuated tube solar collectors. Renew. Sustain. Energy Rev. 2015, 51, 1038–1054. [Google Scholar] [CrossRef]
  17. Elsheniti, M.B.; Kotb, A.; Elsamni, O. Thermal performance of a heat-pipe evacuated-tube solar collector at high inlet temperatures. Appl. Therm. Eng. 2019, 154, 315–325. [Google Scholar] [CrossRef]
  18. Elmetwalli, A.; Darwesh, M.; Amer, M.; Ghoname, M. Influence of solar radiation and surrounding temperature on heating water inside solar collector tank. J. Energy Storage 2021, 47, 103648. [Google Scholar] [CrossRef]
  19. Deshmukh, K.; Karmare, S.; Patil, P. Experimental investigation of convective heat transfer performance of TiN nanofluid charged U-pipe evacuated tube solar thermal collector. Appl. Therm. Eng. 2023, 225, 120199. [Google Scholar] [CrossRef]
  20. Wu, Y.; Rong, J.; Wang, D.; Zhao, X.; Meng, L.; Arıcı, M.; Liu, C.; Yang, R.; Li, D. Synergistic enhancement of heat transfer and thermal storage characteristics of shell and tube heat exchanger with hybrid nanoparticles for solar energy utilization. J. Clean. Prod. 2023, 387, 135882. [Google Scholar] [CrossRef]
  21. Pierucci, G.; Hosouli, S.; Salvestroni, M.; Messeri, M.; Fagioli, F.; De Lucia, M. Indoor thermal loss test on small-size solar receiver (UF-RT01) for process heat application. Sol. Energy Adv. 2021, 1, 100010. [Google Scholar] [CrossRef]
  22. Chandra, Y.P.; Singh, A.; Mohapatra, S.K.; Kesari, J.; Rana, L. Numerical optimization and convective thermal loss analysis of improved solar parabolic trough collector receiver system with one sided thermal insulation. Sol. Energy 2017, 148, 36–48. [Google Scholar] [CrossRef]
  23. Arés-Muzio, O.; Lizama-Tzec, I.; Macias, J.; Oskam, G.; Cahue, A.; de Coss, R.; Alvarado-Gil, J.; Cortes, C. Characterization of Thermal Losses in an Evacuated Tubular Solar Collector Prototype for Medium Temperature Applications. Energy Procedia 2014, 57, 2121–2130. [Google Scholar] [CrossRef] [Green Version]
  24. Singh, N.; Khullar, V. Experimental and theoretical investigation into effectiveness of ZnO based transparent heat mirror covers in mitigating thermal losses in volumetric absorption based solar thermal systems. Sol. Energy 2023, 253, 439–452. [Google Scholar] [CrossRef]
  25. Zhu, Y.; Li, P.; Ruan, Z.; Yuan, Y. A model and thermal loss evaluation of a direct-absorption solar collector under the influence of radiation. Energy Convers. Manag. 2021, 251, 114933. [Google Scholar] [CrossRef]
  26. Nokhosteen, A.; Sobhansarbandi, S. Novel method of thermal behavior prediction of evacuated tube solar collector. Sol. Energy 2020, 204, 761–768. [Google Scholar] [CrossRef]
  27. Yuan, Y.; Wu, G.; Yang, Q.; Cheng, R. Experimental and analytical optical-thermal performance of evacuated cylindrical tube receiver for solar dish collector. Energy 2021, 234, 121301. [Google Scholar] [CrossRef]
  28. Kafle, B.P.; Basnet, B.; Timalsina, B.; Deo, A.; Malla, T.N.; Acharya, N.; Adhikari, A. Optical, structural and thermal performances of black nickel selective coatings for solar thermal collectors. Sol. Energy 2022, 234, 262–274. [Google Scholar] [CrossRef]
  29. Yang, Z.; Chen, H.; Wang, L.; Sheng, Y.; Wang, Y. Comparative study of the influences of different water tank shapes on thermal energy storage capacity and thermal stratification. Renew. Energy 2016, 85, 31–44. [Google Scholar] [CrossRef]
  30. Li, Q.; Huang, X.; Tai, Y.; Gao, W.; Wenxian, L.; Liu, W. Thermal stratification in a solar hot water storage tank with mantle heat exchanger. Renew. Energy 2021, 173, 1–11. [Google Scholar] [CrossRef]
  31. Li, Q.; Lin, W.; Huang, X.; Tai, Y.; Ding, X.; Zhang, Y.; Gao, W. Thermocline dynamics in a thermally stratified water tank under different operation modes. Appl. Therm. Eng. 2022, 212, 118560. [Google Scholar] [CrossRef]
  32. Lyu, W.; Wang, Z.; Li, X.; Deng, G.; Xu, Z.; Li, H.; Yang, Y.; Zhan, B.; Zhao, M. Influence of the water tank size and air source heat pump size on the energy saving potential of the energy storage heating system. J. Energy Storage 2022, 55, 105542. [Google Scholar] [CrossRef]
  33. Carmona, M.; Rincón, A.; Gulfo, L. Energy and exergy model with parametric study of a hot water storage tank with PCM for domestic applications and experimental validation for multiple operational scenarios. Energy Convers. Manag. 2020, 222, 113189. [Google Scholar] [CrossRef]
  34. Fan, J.; Furbo, S. Thermal stratification in a hot water tank established by heat loss from the tank. Sol. Energy 2012, 86, 3460–3469. [Google Scholar] [CrossRef]
  35. Katsaprakakis, D.A.; Zidianakis, G. Optimized Dimensioning and Operation Automation for a Solar-Combi System for Indoor Space Heating. A Case Study for a School Building in Crete. Energies 2019, 12, 177. [Google Scholar] [CrossRef] [Green Version]
  36. Nokhosteen, A.; Sobhansarbandi, S. Numerical modeling and experimental cross-validation of a solar thermal collector through an innovative hybrid CFD model. Renew. Energy 2021, 172, 918–928. [Google Scholar] [CrossRef]
  37. Liu, H.; Zhang, S.; Jiang, Y.; Yao, Y. Simulation analysis of a solar assisted heat pump system for space heating in severe cold areas. Build. Serv. Eng. Res. Technol. 2015, 36, 500–518. [Google Scholar] [CrossRef]
  38. Khedari, J.; Waewsak, J.; Thepa, S.; Hirunlabh, J. Field investigation of night radiation cooling under tropical climate. Renew. Energy 2000, 20, 183–193. [Google Scholar] [CrossRef]
  39. Li, Q.; Gao, W.; Lin, W.; Liu, T.; Zhang, Y.; Ding, X.; Huang, X.; Liu, W. Experiment and simulation study on convective heat transfer of all-glass evacuated tube solar collector. Renew. Energy 2020, 152, 1129–1139. [Google Scholar] [CrossRef]
  40. Chen, F.; Liu, Y. Model construction and performance investigation of multi-section compound parabolic concentrator with solar vacuum tube. Energy 2022, 250, 123887. [Google Scholar] [CrossRef]
  41. Du, B.; Lund, P.D.; Wang, J. Combining CFD and artificial neural network techniques to predict the thermal performance of all-glass straight evacuated tube solar collector. Energy 2020, 220, 119713. [Google Scholar] [CrossRef]
  42. Li, T.; Wang, Z.; Yu, J.; Mao, Q. Experimental and simulation on night heat dissipation characteristics and freezing process of evacuated tube solar water heaters. Int. J. Therm. Sci. 2023, 192, 108455. [Google Scholar] [CrossRef]
  43. Taylor, R.A.; Hewakuruppu, Y.; DeJarnette, D.; Otanicar, T.P. Comparison of selective transmitters for solar thermal applications. Appl. Opt. 2016, 55, 3829–3839. [Google Scholar] [CrossRef]
  44. Jafarkazemi, F.; Abdi, H. Evacuated tube solar heat pipe collector model and associated tests. J. Renew. Sustain. Energy 2012, 4, 023101. [Google Scholar] [CrossRef]
Figure 1. Resistance diagram of heat dissipation process in all-glass vacuum tube solar collectors.
Energies 16 04781 g001
Figure 2. Schematic diagram of collector and simulation unit.
Energies 16 04781 g002
Figure 3. All-glass vacuum tube solar collector.
Energies 16 04781 g003
Figure 4. Single tube of all-glass vacuum tube solar collector.
Energies 16 04781 g004
Figure 5. Ti32 thermal imaging temperature recording.
Energies 16 04781 g005
Figure 6. Temperature changes in the external environment at night.
Energies 16 04781 g006
Figure 7. Location of measuring points for collector and single tube of vacuum tube.
Energies 16 04781 g007
Figure 8. Comparison of experimental and simulation results.
Energies 16 04781 g008
Figure 9. Cloud chart of temperature changes during heat dissipation process.
Energies 16 04781 g009
Figure 10. Liquid fraction diagram of water in the collector after heat dissipation.
Energies 16 04781 g010
Figure 11. The freezing of water in the collector at the end of heat dissipation.
Energies 16 04781 g011
Figure 12. The liquid phase fraction of water in the single tube at the end of heat dissipation.
Energies 16 04781 g012
Figure 13. The freezing of water in the single tube at the end of heat dissipation.
Energies 16 04781 g013
Figure 14. Change the size of the simulated unit heat storage water tank.
Energies 16 04781 g014
Figure 15. Night heat dissipation temperature change in unit volume of 7.5 L heat storage water tank.
Energies 16 04781 g015
Figure 16. Liquid fraction of water after heat dissipation in 7.5 L heat storage tank.
Energies 16 04781 g016
Figure 17. Nighttime heat dissipation temperature change in unit volume of 12.5 L thermal storage water tank.
Energies 16 04781 g017
Figure 18. Liquid fraction of water after heat dissipation in 12.5 L heat storage tank.
Energies 16 04781 g018
Figure 19. Night heat dissipation temperature change in unit volume of 15 L heat storage water tank.
Energies 16 04781 g019
Figure 20. The liquid fraction of water after the completion of heat dissipation in a 15 L heat storage tank.
Energies 16 04781 g020
Figure 21. Temperature changes in water tanks of different specifications.
Energies 16 04781 g021
Table 1. Simulated unit structural parameters.
ParameterUnitValue
Heat storage water tankmm80.0 × 400.0
The radius of the outer glass tube of the vacuum tubemm58
The radius of the inner glass tube of the vacuum tubemm47
Vacuum tube lengthmm1500
Size of simulation unit along the x-directionmm−200~200
Size of simulation unit along the y-directionmm−200~1700
Size of simulation unit along the z-directionmm−40~40
Table 2. Physical parameters of each material.
MaterialOptionParameter
WaterDensity (kg/m3)998.2
Specific Heat (J/kg·K)418
Thermal Conductivity (W/m·K)0.6
Refractive Index1.5
VacuumDensity (kg/m3)1.225
Specific Heat (J/kg·K)1 × 10−5
Thermal Conductivity (W/m·K)0.00204
Viscosity (kg/m·s)1 × 10−5
GlassDensity (kg/m3)2220
Specific Heat (J/kg·K)745
Thermal Conductivity (W/m·K)1.31
Refractive Index1.5
InsulationDensity (kg/m3)40
Specific Heat (J/kg·K)871
Thermal Conductivity (W/m·K)0.024
Heat AbsorberDensity (kg/m3)8300
Thermal Conductivity (W/m·K)202.4
Refractive Index1.5
Absorption Coefficient0.6
Table 3. Monitoring surface distribution.
MonitorCoordinateLocation
T0Y = 0Middle of tank
P1Y = 200Connection between tube and tank
P2Y = 800Middle of tube
P3Y = 1700Tube end
Table 4. Comparison of calculation results of different grid schemes.
Grid Scheme1234
Grid cells281,344364,624416,240504,968
Grid nodes301,418391,263446,033536,119
T0 (°C)29.08429.10129.13629.491
P1 (°C)1.0541.2631.2991.310
P2 (°C)−0.327−0.205−0.181−0.177
P3 (°C)−0.822−0.612−0.591−0.587
Disclaimer/Publisher’s Note: The statements, opinions and data contained in all publications are solely those of the individual author(s) and contributor(s) and not of MDPI and/or the editor(s). MDPI and/or the editor(s) disclaim responsibility for any injury to people or property resulting from any ideas, methods, instructions or products referred to in the content.