Abstract
This paper reviews the application of various advanced anti-icing and de-icing technologies in transmission lines. Introduces the influence of snowing and icing disasters on transmission lines, including a mechanical overload of steel towers, uneven icing or de-icing at different times, Ice-covered conductors galloping and icing flashover of insulators, as well as the icing disasters of transmission lines around the world in recent years. The formation of various icing categories on transmission lines, as well as the effect of meteorological factors, topography, altitude, line direction, suspension height, shape, and electric field on ice-covered transmission lines, are all discussed in this study. The application of various advanced anti/de-icing technologies and their advantages and disadvantages in power transmission lines are summarized. The anti/de-icing of traditional mechanical force, AC/DC short-circuit ice melting, and corona effect is introduced. Torque pendulum and diameter-expanded conductor (DEC) have remarkable anti-icing effects, and the early investment resources are less, the cost is low, and the later maintenance is not needed. In view of some deficiencies of AC and DC ice melting, the current transfer intelligent ice melting device (CTIIMD) can solve the problem well. The gadget has a good effect and high reliability for de-icing conductors in addition to being compact and inexpensive. The application of hydrophobic materials and heating coatings on insulators has a certain anti-icing effect, but the service life needs further research. Optimizing the shed’s construction and arranging several string kinds on the insulators is advisable to prevent icing and the anti-icing flashover effect. In building an insulator, only a different shed layout uses non-consumption energy.
1. Introduction
Icing is a severe natural disaster of electrical power transmission lines. It will cause severe losses to the transmission systems in many aspects and bring serious threats to power system stability and even human energy security. In 1932, the United States recorded the first accident caused by icing on overhead lines in human history [1]. This was followed by ice damage to transmission lines in Britain in 1935 and 1962 and in Italy in 1964. Since then, icing disasters have occurred on transmission lines between 1980 and 2000. The U.S. cities of Ohio, Chicago and Idaho, Quebec, and Ontario of Canada, Russia, Norway, Yugoslavia, Japan, the United Kingdom, Sweden, Finland, and Iceland suffered power transmission line failures caused by snowing and icing [2,3,4,5,6,7,8,9,10]. Since the beginning of the 21st century, the Czech Republic, Alberta, and Canada, all had also occurred serious icing disasters on power transmission lines. In 2005 and 2008, China experienced two severe snow and icing disasters on transmission lines, which caused significant economic losses [11]. In February 2021, an icing disaster occurred on the power grid in Texas, USA, resulting in millions of people without power in the cold weather of snow and icing disaster. Figure 1 shows the scene of the accident [10].
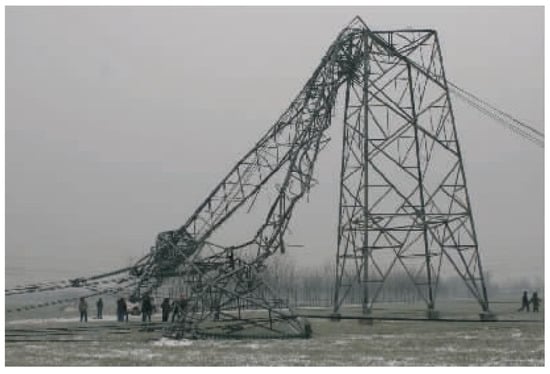
Figure 1.
The collapse of the power grid tower was caused by the snow and icing disaster [10].
To this end, scientists have conducted a significant amount of research on icing and frost resistance, made observations, engaged in theoretical analysis, conducted experiments, and studied the mechanisms underlying the icing of transmission lines and their flashover characteristics [12,13]. In addition, this study provides many effective methods to prevent and deal with the snow and icing disasters of transmission lines [14,15,16,17]. Conductor anti/de-icing technology includes mechanical de-icing [18,19,20,21,22,23,24,25,26], short-circuit ice-melting [27,28,29,30,31], torque corona discharge effect [32,33,34,35], pendulum method [36,37,38], DEC [39,40,41,42,43] and CTIIMD [44,45,46], insulator anti/de-icing technology, including the application of hydrophobic materials [47,48,49], heating coating [50,51,52], optimization of shed structure [53,54,55,56,57], and string arrangement [58,59,60,61].
Snow and icing-related power interruptions have become less frequent thanks to people’s efforts. However, in recent years, it is still happening somewhere. This paper will summarize and analyze the existing research to do a review.
2. The Failure Classification of Icing Lines
According to previous studies, transmission line icing disasters are mainly about the following four aspects [62]:
2.1. Mechanical Overloading
Mechanical overloading refers to the snow and ice attached to the steel towers, conductors, insulators, steel accessories, and other equipment, exceeding the maximum mechanical load designed for the line, causing deformation, damage, fracture, collapse, etc. For example, if the steel tower is coated in ice and the mechanical load exceeds the design, or if an unequal force causes conductors to discharge to the ground or between phases, or if the sag of the conductors is too low and causes conductors to discharge to the ground or between phases. Due to heavy ice accretion, conductors and steel towers broke because of exceeding the maximum stable mechanical load. In addition, accidents of twisting, colliding, and even breaking of insulator strings caused by heavy icing [63,64]. Seriously, a large area of transmission lines broke down, towers fell, and power outages were caused by the overloading of mechanical load. In addition, it can easily cause chain reactions, such as the icing disaster on the transmission lines in southern China in 2008.
2.2. Uneven Icing or De-Icing at Different Times
Due to the varied positions and directions of the neighboring conductors, which may result in unequal icing or de-icing at different times, the conductors caused a tension differential that slips inside the clamp, causing wear and tear, broken strands, and even the complete breakdown of the strand. Or when the ice melts, the three-phase line does not fall off at the same time, and the conductors do not swing synchronously, there will be a collision, burn and fuse, etc. If the torque is too large, it will distort the steel accessories or the steel tower, even collapse. The airflow on the windward side and the leeward side of the transmission line is different, which will lead to uneven ice accretion of all components and unilateral ice-covered conductors and insulators. Overturning, twisting or unilateral load is too heavy and the whole is not uniform, so the steel accessories and tower were out of shape, resulting in broken lines, broken strings, and tower collapse. The difference between uneven icing and de-icing at different times is that the tension difference of the former is static load, while the latter is dynamic load [65].
2.3. Ice-Covered Conductors Galloping
Under the action of wind, the conductors will be galloping, its essence is mechanical shock, for the stability of the tower and the electrical gap distance of the conductor is a great threat, it will also be considered at the beginning of the design. However, after the conductors are covered with ice, the mechanical load is further increased, self-excited oscillation and low-frequency galloping are generated under the ice wind load, and friction is generated between various objects and steel accessories, resulting in damage to the steel accessories, broken strands of the conductor, the leaning of the tower and even the collapsing of the tower [66,67,68]. When ice covered the conductor, the wind area increases, especially when it is unevenly covered, it will be galloping more violently and the amplitude is larger than that without icing, which is more likely to cause the flashover to ground or between phases. In the bealock of wind pass, it is more severe [69,70].
2.4. Icing Flashover of Insulator
When the insulators were covered with ice or the shed is bridging, the original electric field distribution will be changed, the insulators’ leakage distance will be shortened, the insulation strength will be reduced, and flashover will occur. In addition, most of the icing flashover accidents occurred in the transmission lines while the ice and snow melted. The pollution before icing melts with the ice and snow to form high conductivity liquid, which lasts a long time and has a high probability of flashover. Meanwhile, the heavier the pollution before icing, the higher the probability of flashover. According to the literature, icing flashover accidents of insulators account for the largest proportion of snowing and icing disasters on transmission lines. From 1981 to 1997, multiple icing flashover incidents occurred in Quebec and Ontario, Canada, and from 2004 to 2005 and 2011, multiple continuous icing flashover accidents occurred in power grids in East and Central China [71,72,73].
3. Formation and Influencing Factors of Icing
3.1. Formation of Icing
When the temperature drops to −5 to 0 °C, the wind speed is 3 to 15 m/s, if the relative humidity of the air is above 85%, there is fog or drizzle, the transmission line will begin to form a glaze, and if the conditions remain the same, a short time will form a very thick layer and strong adhesion of pure glaze. If the temperature continues to drop, there will be rain and snow weather, freezing rain and snow rapidly grow on the glaze surface, forming a density of 0.6 g/cm3 or more icing. If the temperature continues to drop from −15 to −8 °C, the ice layer will be covered with frost. This process will lead to the formation of glaze-rime accrete on the transmission line surface. In this process, if there are many sunny and cold weather reciprocating alternates, and the rime just begins to melt and then refreezes, it will strengthen the ice density, and will develop into a mixture of glaze and rime alternating overlap, that is, mixed rime [62,74].
The icing first grows on the windward side, and if the wind direction remains unchanged, the icing accretion thickness keeps increasing in the same direction. When the icing accretion thickness on the windward side of the conductor reaches a certain thickness, it will be twisted under the action of gravity, and the leeward side without icing will turn to the windward side and continue to grow. Finally, a circle or oval icing accretion will be formed to wrap the conductor. However, due to the differences in structure, material, arrangement, spatial position and surrounding influence, the conductors and insulators have different capturing capacities of supercooled water drop under the same environmental parameters [75]. Although the growth trend of ice thickness and icicle length of conductors and insulators is roughly the same, the growth rate is different. The ice thickness and icicle growth rate of the insulator are both higher than that of the conductor [76].
3.2. Classification of Icing
The icing of transmission lines can be generally divided into five categories: hoar frost, rime, mixed rime, glaze and snow [62,77,78,79,80].
3.2.1. Hoar Frost
When the transmission line is below 0 °C and the wind speed is low, the moisture in the air will come into contact with it and form hoar frost on the surface, which is mainly in the form of “needle” or “leaf” crystal form. The adhesion of frost is very weak, light vibration or sudden high wind speed can make the frost break away from the surface of conductors and insulators, so it can only form a thin layer on the surface of the contact. The density is about 0.05–0.3 g/cm3. Because of this characteristic, compared with other types of icing accretion, white hoar frost only has a certain effect on the electrical strength of insulators. It hardly poses a hazard to conductors and steel towers.
3.2.2. Rime
Under the drag force of the wind, the supercooled water droplets in the fog constantly collide with the conductors, insulators, and the surface of the steel tower and are trapped and condensed into rime. Its appearance is mainly “shrimp tail” or “pine needle”, which is white. Under the microscope, it mainly presents a granular structure mainly consisting of hard rime and soft rime, and the density is usually about 0.3–0.6 g/cm3. The adhesion of rime on conductors and insulators is very weak, generally in windward growth. Under certain conditions, its growth rate is speedy and often appears in the winter high-altitude mountain transmission lines.
3.2.3. Mixed Rime
It is also called hard rime. As freezing rain and fog appear alternately in the environment and condense on the transmission lines, it appears in the form of hard ice with layered and plate structure, with dispersed tiny bubbles inside, alternating transparent and opaque, strong adhesion and density of 0.6–0.8 g/cm3. Mixed rime is a composite icing process, and the transmission line is exposed to wet fog for a long time, the rime and the glaze together alternate icing, the growth rate is fast, and most of the time, the formation of mixed rime, for the transmission line equipment is more dangerous.
3.2.4. Glaze
The glaze is formed by freezing rain or large particle-size supercooled water droplets caught by transmission lines. When glaze icing, freezing rain, or supercooled water droplets hit the transmission lines and has not been completely frozen, water droplets continuously collide and icing continues to grow. The glaze is clear and transparent, occasionally mixed with impurities and bubbles. Its adhesion is firm, causing the most significant harm to the transmission line equipment, the density is close to the pure ice density of 0.917 g/cm3, and usually, a density more significant than 0.9 g/cm3 of icing is classified to glaze. Because of the short duration of freezing rain, the situation of transmission lines with pure glaze icing is less.
3.2.5. Snow
The snow on the transmission lines means that when the temperature is around 0 °C, and the wind speed is weak (less than 3 m/s), the “wet snow” particles in the air interact with the fog to attach to the equipment. Density is usually below 0.05 g/cm3. When the “wet snow” falls on the transmission lines, the snow occurs, while the dry snow and the ice crystals are too weak and will be taken away when there is a strong wind.
3.3. Influence Factor of Icing
As icing is a natural meteorological phenomenon with numerous natural conditions, many complicated and changeable factors affect the icing, so people cannot fully grasp its law and influence. The main factors affecting transmission lines icing are: meteorological conditions, geographical terrain, altitude, transmission line direction and suspension height, shape size and electric field. The differences in icing on transmission lines mainly reflect in the thickness, density, shape and form [81].
3.3.1. Meteorological Conditions
Including the ambient temperature, wind speed and direction, the diameter of water droplets in the air, etc. When transmission lines are covered with ice, the environment is generally between −15 and 0 °C, and the ambient relative humidity is above 85% [82]. At −5 to 0 °C, the diameter of the droplet is large, generally 10 to 40 um and the glaze forms easily; the average temperature of the formation of the glaze is −2 °C, and the temperature is relatively high; at −9 to −13 °C, the diameter of the droplet is usually between 5 and 35 um, easy to form mixed rime, the average temperature at −7 °C. When the temperature is −15 to −10 °C, the diameter of water droplets is generally between 1 and 20 um, which is easy to form rime. When the ambient wind speed is between 0 and 4 m/s, the ice layer thickness of conductors and insulators increases with the increase in wind speed, and the icicle growth rate of insulators before bridging is greater than that of the conductors. When the ambient temperature is between −4 and −10 °C, the icing degree of conductors and insulators increases with the decrease in temperature [83].
3.3.2. Geographical and Topography
Due to the influence of the cold current at the poles of the earth, the ice accretion of the east–west mountains are more serious than that of the north–south mountains. Windward slopes are more serious than that of leeward slopes, and bealock is more serious than that of other terrains. Micro-topography and micro-climate characteristics are easily generated in these places [84]. The water environment around the transmission lines also greatly impacts the icing accretion. When rivers and lakes are around and water vapor is sufficient, the icing situation is more serious.
3.3.3. Altitude
The height at which icing begins to form in each area is called condensation height. Due to the different environmental parameters in each region, the condensation height is also different. Above the condensation height, the higher the altitude, the ice thickness will increase. The icing near the condensation height is mainly glazed. As the height increases, the icing form transitions to mixed rime and then to rime. Based on the analysis of the observed ice accretion data of conductors in the Donbass region of the former Soviet Union, the empirical formula of the average icing accretion thickness D (cm) and altitude h (m) in this region was obtained [84]:
is the base of the natural logarithm, and are the coefficients of variation in ice accretion type and region. Rime: = 7.76, = 0.032, glaze: = 4.49, = 0.0039.
3.3.4. Transmission Lines Direction and Suspension Height
The more perpendicular the angle between the transmission line direction and the wind direction in the winter icing period, the more serious the icing. When the direction of the transmission line is parallel to the wind direction, the conductors have a feeble ability to capture water droplets and are relatively difficult to be icing; however, the effect on the insulator is not apparent. The higher the height above the ground, the higher the liquid water content in the air, the greater the wind speed, the higher the suspension height of the conductors, and the more serious the icing. Reference [85] gives the equation of the ice accretion ratio of conductors of two heights:
is the ratio of two-height icing, and represent the suspension height of the conductors, m. and are the ice thickness of the conductors at the height and , respectively, cm. respectively, represent the corresponding values of wind speed, m/s, air humidity, and capture coefficient with height.
3.3.5. Shape and Size
The shape of transmission line equipment influences the degree of icing, including the diameter of the conductor, the diameter of a rod of the composite insulator, the size of the shed, the shed space and the angle of the shed, but the influence of the various parameters is different. Based on the data analysis of the observation in Xuefeng Mountain, the literature [42] found that the thickness of the icing accretion by the conductor decreases with the increase in the diameter within the range of 5 to 25 mm, no matter it is rime, mixed rime or glaze. In the rime condition, both the rod diameter of the composite insulator and the diameter ratio of the adjacent shed greatly influence the ice weight. The ice weight increases with the rod diameter increases. The inclination angle of the shed and the shed space has little effect on ice weight. The ice weight of rime and mixed rime decreases with the decrease in shed space [86,87].
3.3.6. Influence of Electric Field
When the electric field strength is small, the weight, thickness, and density of ice accretion increase with the increase in electric field intensity. When the electric field continues to increase, the ice accretion of conductors with energized is lighter than that of non-energized [88,89]. The electric field effects the appearance, density, and weight of insulator icing. For insulators with different dielectric surfaces, the electric field has different degrees of influence on the weight of ice. Due to the polarization effect, the electric field can inhibit the formation and growth of ice branches, thus contributing to the different anti-icing characteristics of various dielectric surfaces in the electric field. However, the effect of the electric field on insulator surface icing process is mainly in the initial stage. The effect is not evident in the later stage of icing and the heavy icing area [90].
4. Anti/De-Icing Technology of Conductors
Anti/de-icing of conductors mainly refers to the conductors of overhead transmission lines. When a transmission line cannot avoid the ice-covered area, it should ensure that the conductors have sufficient anti-icing strength or timely de-icing after ice-covered. There are six main anti-icing/de-icing methods.
4.1. Mechanical De-Icing
Mechanical de-icing refers to removing the ice from the conductors by applying external force through hard objects. It generally includes artificial knock de-icing (ad hoc de-icing), pulley scraper de-icing, blasting de-icing, electromagnetic vibration de-icing, robot de-icing, etc. [91,92].
4.1.1. Manual Deicing by Striking
The earliest de-icing method is artificial knock deicing, or ad hoc de-icing, was proposed by Phlman and Landers in 1982 and required on-site operation by operators. When the overhead line is out of power, operators can directly de-icings the line manually by climbing the tower, or throw hard insulating objects from the ground to the conductors to knock off the ice, or beating the ice-covered part with long wooden sticks. When the conductors are energized, the icing is removed by striking the ice accretion with an insulating rod. A U-shaped trap can also be made on the conductors and dragged along to scrape off the icing [18]. This method is relatively primitive and requires on-site operators to perform it according to the actual situation. It only applies to transmission lines with low conductors above the ground, resulting in low de-icing efficiency and low safety.
4.1.2. Icing Rolling
Alternatively, pulley scraper de-icing, was first developed and made by Manitoba Water and Power Department, Canada. It is mainly composed of pulley, traction rope and steel blade, and are installed on the conductors. Operators on the ground use the traction rope to drag the pulley to move along the conductors. On the one hand, the pulley drives the steel blade to scrape the icing on the moving path. On the other hand, the pulley generates stress to bend the conductors, so that the icing falls off [19]. Its advantages are simple device, simple operation, effect obviously, and practicability. The disadvantage is that it requires manual operation, time-consuming and laborious, limited by mountainous terrain, steel knife damage to the conductors.
4.1.3. Blasting De-Icing
Blasting de-icing is first to select appropriate detonating cables, connect explosives in sections according to a certain distance, and lay them on the transmission line conductors that need de-icing in advance. After ice covers the conductors, they will detonate. The impact force generated by the explosion will make the ice near the laying area of the detonating cables fall off. Its advantages are low cost, quick effect, and high efficiency, but the whole line needs to lay, the installation of detonating cable and explosives is arduous. The vibration amplitude of the line after explosion is relatively large, and the blasting location of the conductor is easy to receive irreversible damage. Xie Dongsheng et al. [20] obtained a good de-icing effect through the shrinkage blasting de-icing test. Cao Yonghong et al. [21] analyzed the dynamic response of the ice-covered tower system of the transmission line after blasting de-icing using numerical simulation and proposed the de-icing scheme of single conductor and double bundled conductors.
4.1.4. Electromagnetic Vibration De-Icing
Electromagnetic vibration de-icing mainly includes electromagnetic pulse deicing and electromagnetic impact de-icing. The electromagnetic pulse method first applies to de-icing aircraft wings [22]. Its principle is that the silicon-controlled rectifier controls the discharge of the energy storage capacitor to the pulse coil, and the coil generates a strong alternating magnetic field, which induces eddy current on the plate near the coil. The plate connects to the de-icing target. Under the combined action of eddy current and the coil magnetic field, a repulsive force with high amplitude and low duration is generated. The target is slightly expanded and then contracted to crush the icing and fall off [23], the schematic diagram is shown in Figure 2, but this method can only remove the local ice accretion of the conductors and has no obvious effect on the long line. Electromagnetic force impinging de-icing is a scheme proposed by the IREQ Laboratory in Canada for de-icing double bundled conductors of UHV lines, that is, short-circuit the transmission lines at rated voltage, and the electromagnetic force generated by the short-circuit current makes the conductors collide with each other and the ice falls off [24].
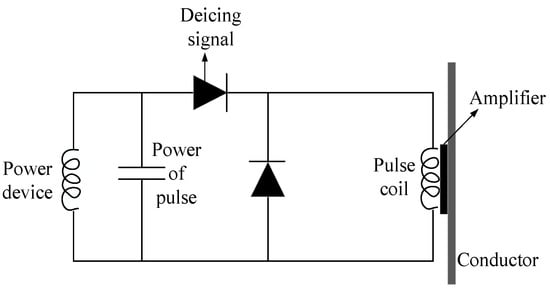
Figure 2.
Schematic diagram of electromagnetic pulse de-icing.
4.1.5. Robot De-Icing
Robot de-icing method is a remote controllable de-icing mechanical device developed based on pulley scraper de-icing, with the conductor as the path and the pulley as the walking device. In 2003, Serge Montambault and Nicolas Pouliot of IREQ of Canada first proposed HQ LineROVer vehicle as a de-icing device for transmission lines [25], as shown in Figure 3. In 2010, China Shandong Electric Power Research Institute and Hydro-Quebec Research Institute cooperated to strengthen and improve HQ LineROVer de-icing vehicle, so it has infrared detection, waterproofing and long-distance communication functions [26]. The robot de-icing methods include impact type, milling type, scrape type and percussion type.
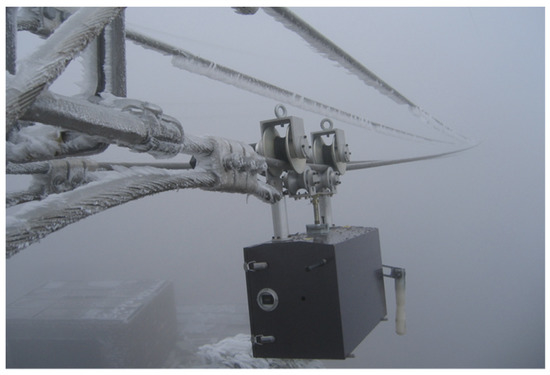
Figure 3.
De-icing robot.
4.2. Short Circuit Ice Melting
4.2.1. Basic Parameters of Short Circuit Ice Melting
Transmission lines icing and melting is a complex physical process, which is difficult to describe by exact mathematical expressions because it occurs in the wild natural environment with numerous influencing factors and substantial variability. At present, scholars from all circles have yet to reach a unified consensus on the calculation method of basic parameters of melting ice. The melting process of the conductors includes two heat exchange processes: first is the conductors generate Joule heat through the current and transfer it to the ice layer; the second is the heat exchange between the ice surface and the air through heat radiation and convection.
- The critical load current of icing
Under certain meteorological conditions, when the transmission line conductors are not covered with ice, the surface temperature is equal to 0 °C, and the conductors are in a critical state between being icing and not icing. At this time, the passing current is called the critical load current of icing [27]. The equation for calculating the critical current of AC line proposed in the literature [28] is as follows:
where is the radius of the conductor, mm; is the resistivity per unit length of the conductor, ; and are the specific heat of water and air, respectively, ; is the forced convection coefficient, ; is the local recovery coefficient; is critical load current, ; wind speed , ; ambient temperature , ; is liquid water content in the air, ; is collision coefficient of water droplets on the conductors; and is the coefficient related to convective heat transfer and evaporation and blackbody radiation.
- 2.
- Critical ice melting current
Many factors affect the melting ice of transmission lines, including wind speed, ambient temperature, current density and ice thickness. In the past process of melting ice, there was a situation in which melting ice failed for several hours or even more than 20 h. The reason is that the current was too small, smaller than the critical melting current [29]. The critical melting-ice current is the minimum current that can melt the icing of conductors under certain meteorological conditions. Reference [30] proposed the equation of the critical ice-melting current of DC short-circuit ice-melting:
is ice surface temperature, ; is the thickness of ice, ; is conductor diameter, mm; is the resistance per unit length of conductor, .
Further, the relation of was given in reference [31]:
is the radius of the ice-covered conductor, ; is the radius of the conductor, is the heat conductivity of the ice, ; and is the heat exchange coefficient between the outer surface of the ice and the air, .
4.2.2. AC Short-Circuit Ice Melting
Since the 1950s, the former Soviet Union began AC short-circuit ice melting technology research and application to the transmission line to prevent icing. According to the number of short-circuit phases, AC short-circuit ice melting includes three phases, two phases, and single-phase short-circuit ice melting. According to the short-circuit object, it includes the phase–phase type and phase–earth type ice melting [93].
- Three phases short-circuit ice melting
Three phases of short-circuit ice melting is a particular phase–phase type, which interrupts the first and last ends of the target line from the power grid. One end of the line is a three-phase short-circuit, and the other connects to the ice-melting power supply. The high energy Joule heat generated by the three-phase short-circuit current is used to melt the icing. The diagram shows in Figure 4.
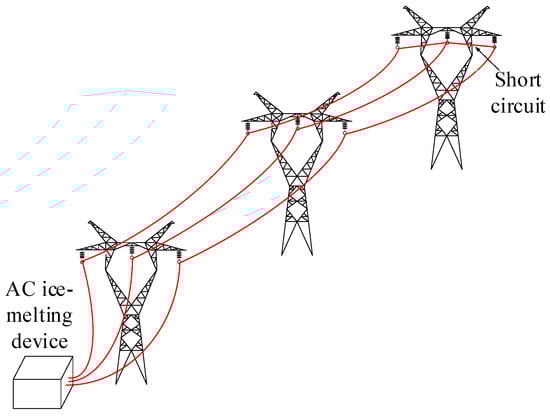
Figure 4.
Three phases short-circuit ice melting diagram.
- 2.
- Two phases short-circuit ice melting
Phase–phase type short-circuit ice melting is that two phase conductors are connected in series, and the first and last ends are, respectively, connected with the ice-melting power supply to form a loop.
- 3.
- Single phases short-circuit ice melting
One end of the single-phase conductor connects to the ice-melting power supply, the other end connects to the dedicated earth conductor, and the other end of the power supply connects to the earth electrode.
AC short-circuit ice melting needs to remove the line from the power grid, which requires high reactive power and power capacity and takes a long time to melt ice. It is not suitable for the de-icing of long transmission lines, and the ice-melting work of long lines with voltage above 500 kV is not feasible.
4.2.3. DC Short-Circuit Ice Melting
The research on DC short-circuit ice melting technology can be traced back to 1993 in Manitoba Water and Power Department, Canada. Since the AC impedance of the conductors is much greater than the DC resistance, the power supply capacity required by AC de-icing is 5 to 20 times that of DC. The DC de-icing only needs to consider the heating of the line resistance, without considering the influence of the insufficient reactive power, and the requirement on the power supply capacity is much smaller than that of AC. With the progress of controllable electrical rectifier components and HVDC technology, the technical obstacles of DC ice-melting devices have broken through, and development has been promoted [94,95]. The diagram shown in Figure 5A–C is the phase order.
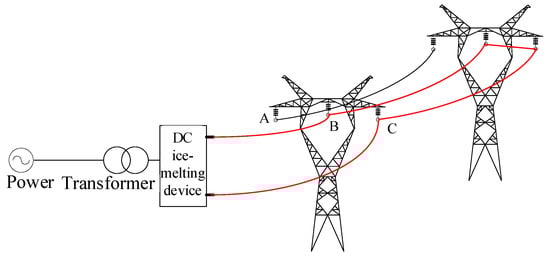
Figure 5.
DC short-circuit ice melting diagram.
- Melting ice for DC line
DC transmission lines generally use DC short-circuit melting ice. On the one hand the cross-sectional area of DC transmission line conductors is large, and AC ice-melting method cannot solve the problem effectively. On the other hand, DC ice-melting technology has many advantages over AC, and it is convenient to obtain DC ice-melting power supply. When the DC line needs to melt ice, only use the existing equipment in the substation to change the wiring mode. So that the line current increases to above the critical melting current and wait for the completion of melting ice.
- 2.
- Melting ice for AC line
Due to the outstanding advantages of DC short-circuit ice melting method, it is also applied to AC transmission lines. In the process of DC ice melting, only resistance consumes active power and emits Joule heat, and only the rectifier itself consumes a small amount of reactive power. Therefore, DC short-circuit ice melting method can target AC lines of various voltage levels.
In this regard, the research and development of the DC ice melting device is the key. It is necessary to consider the first is the capacity of the DC ice melting device and the maximum DC ice melting current it can provide. Second is the harmonic impact generated during the converter’s operation on the power grid. Third is matching the system design and power supply of the ice melting device when the substation is connected. Moreover, the cost of DC ice melting device is high, which needs to be further reduced. The length of various types of ice-melting lines determined by the capacity of DC devices is shown in Table 1 [96]:

Table 1.
Length of various types of de-icing transmission lines determined by the capacity of DC devices [96].
4.3. Corona Discharge Effect
Icing generation and growth can be inhibited by increasing the electric field intensity and corona discharge on the conductor surface. The corona discharge becomes more and more intense with the increase in electric field intensity, and the ion concentration in the surrounding space also increases. At the same time, more and more small water droplets are repulsed after being charged, and the electrical suction effect is cancelled out. The motion speed of water droplets decreases or reverses, and the collision with the conductors reduce, resulting in the reduction in the icing accretion [97].
The corona cage was used in the artificial climate room to conduct experimental research on the conductor icing and corona characteristics under AC electric field, and the surface electric field intensity of the conductor under the rime and glaze icing environment to measure the weight of icing accretion and icicle distance [32,33]. The relationship between the surface field intensity of conductor and applied voltage was obtained as follows [32]:
where and are radius of corona cage and conductor, respectively, .
When rime and glaze icing, the surface ice accretion trend is the same. When the electric field intensity of the conductor surface is less than 20 kV/cm, the ice accretion of the conductor surface increases with the increase in the electric field intensity. When the field intensity increases further, the ice accretion decreases. When covered with glaze, the percentage of icicle mass decreases with the increase in field intensity. The icicle spacing is independent of field intensity. With the increased rainfall, the icicle spacing decreases with the increase in field intensity. When the electric field is considered, the electric field intensity of the conductor is 15 kV/cm, the icing accretion of the conductor is less than that of the non-energized. The icing accretion is 0 kV/cm > 15 kV/cm > DC + 15 kV/cm > DC − 15 kV/cm. The icing condition under different electric field types shows in Figure 6, and the relationship between corona current, icing amount, icing density and electric field intensity shows in Figure 7.
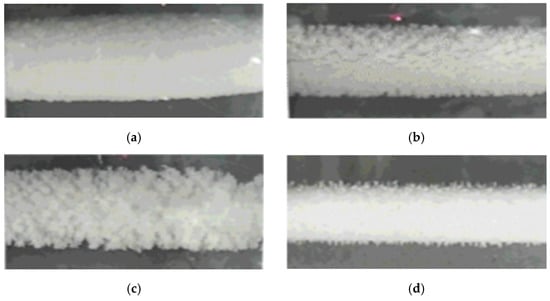
Figure 6.
Accreted icing at different electric fields of conductors. (a) 0 kV/cm. (b) AC 15 kV/cm. (c) DC + 15 kV/cm. (d) DC − 15 kV/cm.
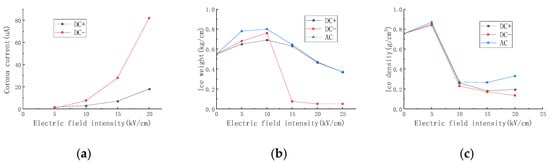
Figure 7.
Relation between corona current, ice weight, ice density and electric field intensity. (a) Relation between corona current and electric field intensity. (b) Relationship between icing accretion and the electric field intensity. (c) Relation between ice density and electric field intensity.
The reference [34] conducted an experimental study on the rime icing characteristics of a conductor under AC electric field in an artificial climate chamber. It analyzed the influence of different AC electric field intensity on the shape, weight and density of ice. The conclusion is similar to that in the literature [32], which shows that the weight and ice density of ice accretion both increase first and then decrease with the increase in AC field intensity.
Within the permissible range of electromagnetic environment, the corona effect can be achieved by increasing the surface electric field intensity of ice-covered conductors with a smaller diameter, which can use to prevent icing disasters in local areas. However, at the same time, the loss caused by corona will increase, and strong corona discharge will always occur during the non-ice-covered period [35].
4.4. Torque Pendulum
When the air-flow blows the overcooled water droplets in the air onto the surface of the conductor and collides with it, then ice accretion increases along the windward side and the center of gravity shifts to generate torque. When the torque exceeds the critical value, the ice-covered conductors will be twisted and form a cylindrical or oval ice-covered after a certain period of time. This process repeats over and over again, so that all sides of the conductor continue to be icing. The ice-covered torsion process and the schematic diagram of the torque pendulum show in Figure 8 and Figure 9:
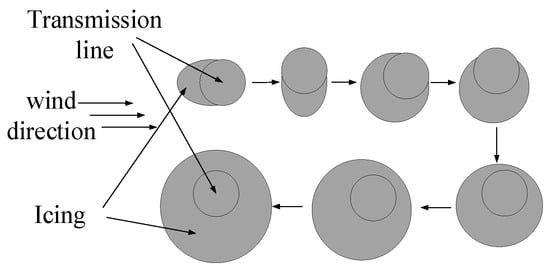
Figure 8.
Icing torsion process of conductor.
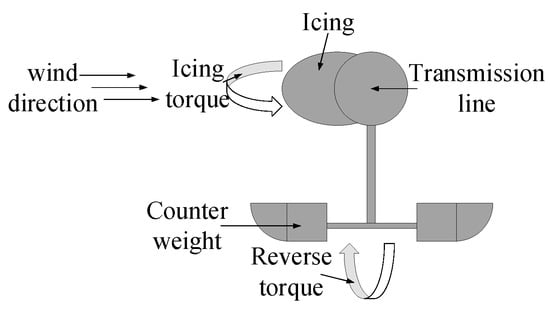
Figure 9.
Schematic diagram of the torque pendulum.
The installation of a torque pendulum provides a torque of reverse force for the icing conductor to counter the twisting tendency during the icing process on the windward side, so that the icing will continue to occur on the side of the original wind direction. However, with the increase in the weight and thickness of the ice accretion, the phenomenon that the ice bonding moment cannot resist the gravity moment of the ice itself will appear, which is a macroscopic display as the icing falls off layer by layer. Especially under the action of natural wind, the falling off will be particularly intense, so as to reduce the degree of the ice accretion and the increase in the arc stress and the strength of the mechanical stress of conductor. Then improve the safety and stability of transmission lines, the effect is obvious.
In reference [36], according to the torsional vibration excitation galloping mechanism proposed by Nigol, the weight equation of the torque pendulum was constructed, and the arrangement coefficient was calculated. Furthermore, the arrangement distance of the torque pendulum on the conductor was determined, and a distributed arrangement method was developed to inhibit the torsion and galloping of the conductors. One torque pendulum was installed at an interval of 30 m. Torsional vibration is a crucial factor for the galloping of icing conductors. Torque pendulum can inhibit self-excitation torsional and change the torsional vibration characteristics of the system, which can effectively inhibit such galloping [37,38]. Application of torque pendulum and result shown in Figure 10 and Figure 11.
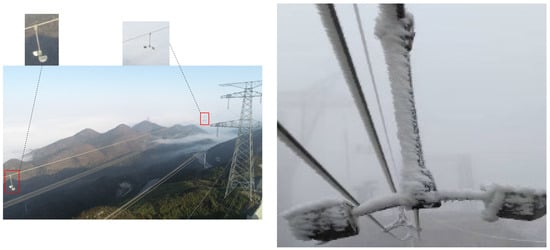
Figure 10.
Application of torque pendulum.
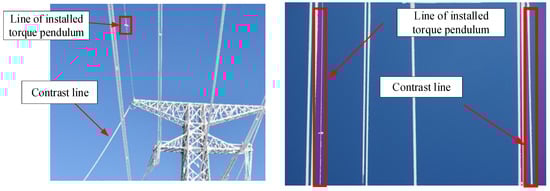
Figure 11.
Natural icing contrast of overhead ground line.
4.5. Expanded the Diameter Conductor to Replace Bundled Conductors
The DEC has the same circular section and larger outer diameter than the bundled conductors. It is based on the standard conductor specifications that meet the technical conditions, and the technology of expanding the outer diameter is adopted. Under the premise of ensuring the outer diameter required by the corona, the weight of the structure, the ice load of the transmission line, and the total weight is reduced, then reduced the rate of the icing damage of the transmission line [40]. Cross sections diagram of DEC is shown in Figure 12. In a transmission line, when the cross sections area and the wave impedance of the bundled conductors and DEC are the same, the DEC can reduce the number of sub-conductors and the icing load of the transmission line [41]. However, the cost of the DEC is higher, its diameter is larger, the installation process is complicated, and the production process also required to be higher [42].
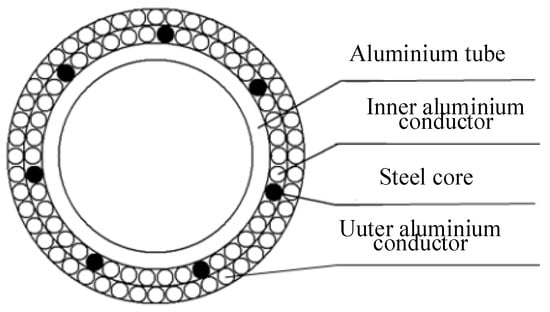
Figure 12.
Cross sections diagram of DEC.
The DEC has mainly included three types: stranded type, high-density polyethylene supported type, and aluminum tube supported type. The advantages and disadvantages are summarized in Table 2.
Table 2.
Comparison of advantages and disadvantages of different types of DECs.
Based on the concept of possible collision when the actual amounts of droplets colliding with the trajectory of droplets do not deflect, that is, the local collision coefficient (collision rate), the icing degree of DEC with different diameters under specific meteorological environment can be studied [39]:
where, is the surface arc length of the upper and lower two trajectories of droplets between the collision points and the micro-element plane on the cylinder. is the distance between the collision points and the micro-element plane when the trajectories of droplets do not deflect. By analyzing the differential equation of water droplets in air movement trajectory in the atmosphere covered with ice, the local collision coefficient of conductor surface with different diameters is calculated, and the results are shown as follows [39].
It can be seen from Figure 13 [39] that the local collision coefficient reaches the maximum at the center point, and it decreases with the increase in the outer diameter of the conductor. Therefore, under the same icing condition, the larger the outer diameter, the smaller the collision coefficient of water droplets in the gas–liquid two-phase flow, the slower the icing growth rate, and the smaller the ice thickness at the same period.
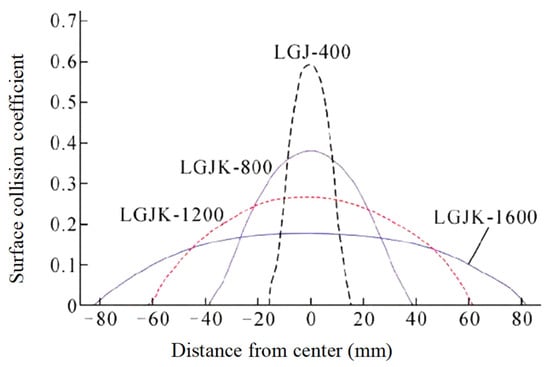
Figure 13.
Local collision coefficient of different diameters conductor surface [39].
The icing accretion of the conductor M (kg) depends on the collision coefficient, capture coefficient, freezing coefficient, wind speed, liquid water content in the air and icing time. The expression is as follows [62]:
where, α1 is the collision coefficient, α2 is the capture coefficient; α3 freezing coefficient; w is the liquid water content, kg/m3; d is conductor diameter, mm; v is wind speed, m/s; L is the length of the conductor, m; τ is icing time, s. The capture coefficient α2 and freezing coefficient α3 are basically equal to 1. Then the total weight of ice accretion n bundled conductors is Mf = nM. From the perspective of conductor diameter, the relationship between ice thickness and diameter shows in Figure 14:
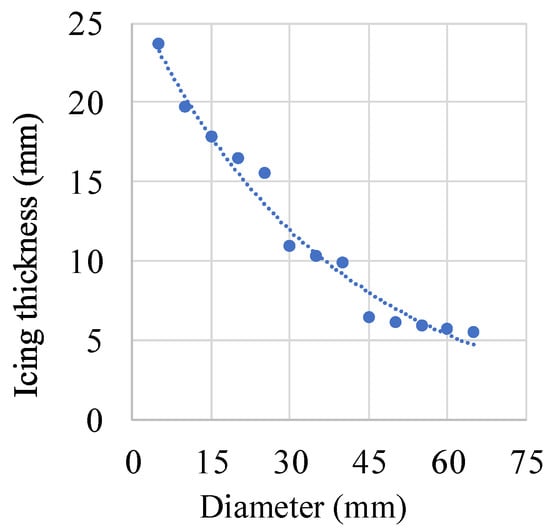
Figure 14.
Relationship between ice thickness and conductor diameter.
The icing degree is studied and compared in the scheme of the DEC replace 500 kV quad bundled conductors [43]. It found that under the same environment, the bundled conductors have a more significant collision coefficient and a larger calculated diameter, and the ice accretion of the bundled conductors is higher than that of the expanded one. The ice accretion reduction in the DEC is 30~80%. The larger the diameter, the more ice accretion reduction, as shown in Figure 15 [43]. There are aluminum tubes to replace DECs to experiment.
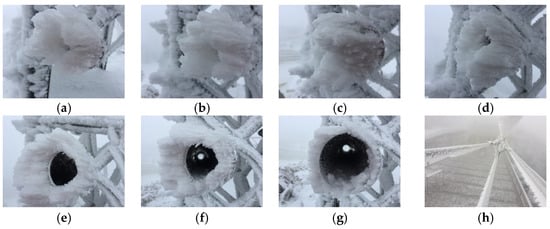
Figure 15.
Icing picture of different diameter aluminum tubes and quad bundled conductors: (a) 40 mm, (b) 50 mm, (c) 60 mm, (d) 70 mm, (e) 80 mm, (f) 90 mm, (g) 100 mm, (h) quad bundled conductors [43].
Figure 16 is the simulation diagram of gas–liquid two-phase flow characteristics of the icing by the DEC and double bundled conductors. There have been application examples of replacing bundled conductors in engineering, as shown in Figure 17, and excellent results have been achieved.
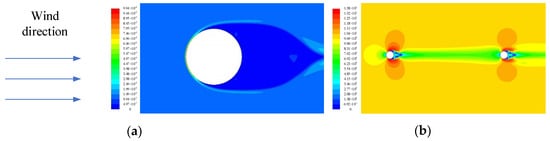
Figure 16.
Gas–liquid two-phase flow characteristics of ice-covered DEC and double-bundled conductors. (a) DEC. (b) Double bundled conductors.
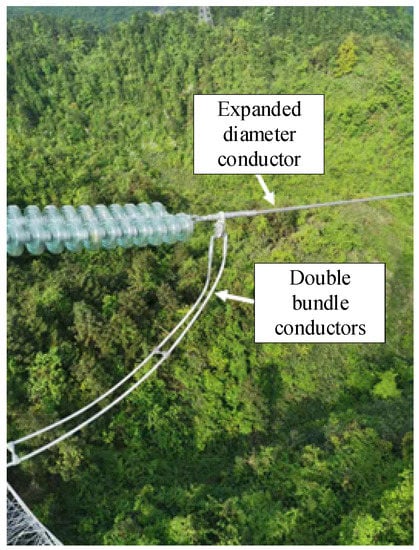
Figure 17.
Application of DEC to replace double-bundled conductors.
4.6. CTIIMD
Due to many deficiencies of ice melting devices, some research institutes have developed load current transferred ice melting devices for bundled conductors of transmission lines [44]. When the m bundled conductors run normally, each bundled conductor undertakes the transmitted current. If the load current transmitted in all is I, the average current by each one is I/m. However, the current transferred ice melting method of bundled conductors is to concentrate the total load current on a group of conductors through a switch, which includes n (m > n ≥ 1 and n ∈ N) conductors, to increase the transmitted current (I/n) on each conductor of this group. Use the overload current to generate more heat to heat and promote the ice to melt and fall off to achieve the purpose of ice melting on the conductors. After the ice melting of a group of bundled conductors are finished, the total load current is passed into the other groups successively. According to the actual line current and the required minimum ice melting current in the environment, one, two and other amount conductors can be set as a group. Finally, ice melting of the entire transmission line was realized [45,46]. The working mode of the current transferred ice melting device shows in Figure 18. The red conductors mean that there is current passing through, while the blue one means that there is no current:
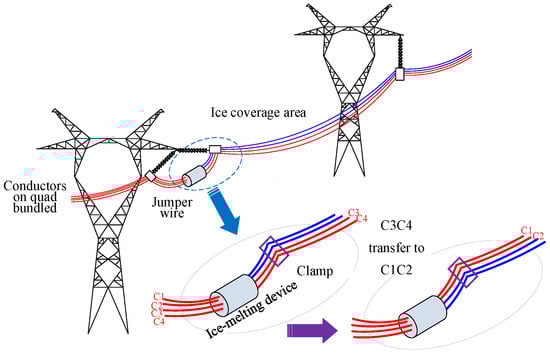
Figure 18.
Working mode diagram of current transferred ice melting device.
In order to make the current transferred ice melting device more intelligent, the ice weight sensor is installed on the line. When the ice accretion reaches the set value, the ice melting device automatically starts the switch to work. CTIIMD has been proven to have a remarkable effect in the laboratory and transmission lines many times. Compared with other ice melting devices currently in use, the device is small, the manufacturing cost is low, and the DC ice melting device which costs tens of millions. The current flowing through the line is used as the heat source without consuming additional electric energy. The operation is effortless and only requires the mobile phone APP to remotely control the switch inside the device and select the conductors that need to melt ice in batches. There is no need for a power outage and no impact on the stable operation of the power grid.
The CTIIMD was opened to check the internal condition after three years of installation tests at the test site, and no changes were found. It indicates that the tightness, durability and reliability have been verified and can withstand various tests in complex environments. Although the premise of ice melting is to reach the minimum ice melting current when the total current of the line is transferred to one group, they are the transmission lines of high-power electric energy, so the ice melting current can fully meet. If the grid is widely operational, it will save vast sums of money. The CTIIMD has been successfully put into operation on the transmission lines, and outstanding results have been achieved. Figure 19 shows the application of CTIIMD on the transmission lines, and it in the squared red line.
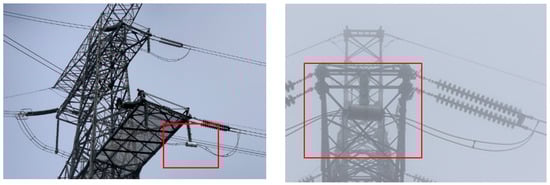
Figure 19.
The CTIIMD operation diagram on site.
5. Anti/De-Icing Technology of Insulator
The purpose of insulator anti-icing/de-icing is not only to reduce the mechanical load but also to prevent the loss of insulation resulting in flashover and power failure. At present, the main method for insulators is anti-icing, mainly from the following four aspects:
5.1. Application of Hydrophobic Materials
Superhydrophobic phenomena similar to lotus leaf greatly arouse the interest of researchers in various research fields. Hydrophobic materials have unique properties of waterproofing, anti-icing and self-cleaning, so they have essential application prospects in insulators. When the hydrophobic material is applied to the surface of the insulator, the lower surface energy of the coating will cause a weak adhesion between the ice and the coating. Moreover, prevents the continuous water film from be icing, which is more conducive to shedding the ice under the action of natural wind and gravity. Hydrophobic materials mainly include silicone oil, silicone grease, ozocerite, room temperature vulcanized silicone rubber (RTV), and durable in-place forming antifouling flashover composite coating (PRTV) [98]. Microscopic view of a material surface with droplets is shown in Figure 20.
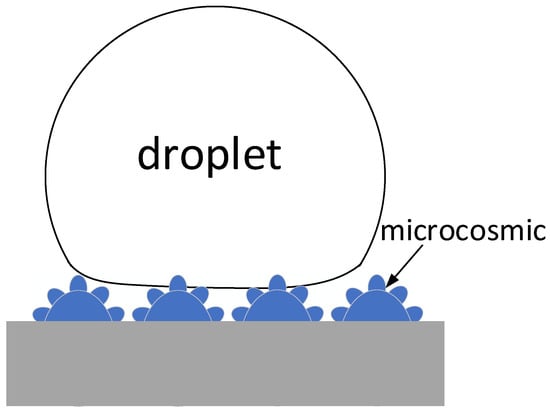
Figure 20.
Droplets attached on the surface of superhydrophobic material in microcosmic.
Micro–nano rough structure and low surface energy are the fundamental reasons for the superhydrophobic properties of lotus leaves [99,100,101]. Simply put, it creates an extremely rough structure at the microcosmic to reduce the contact area between water droplets and the surface. The greater the contact angle θ between the overcooled water droplets and the surface, the stronger the hydrophobicity of the surface and the longer the freezing time on the surface [102]. is a sign that indicates interfacial tension and is one of the important factors in determining the hydrophobic property of a substance. The is the result of the surface tension balance between solid, gas, and liquid interface. Generally speaking, when 0° < < 90°, the solid surface has hydrophilic, 90° < < 180°, the solid surface has hydrophobicity, the fewer , the better hydrophilic, the greater , the better hydrophobicity. The relationship between the and the surface energy can be described by Young’s equation:
where, γsv is the tension of solid and gas surface, γsl is the tension of solid and liquid surface, γlv is the tension of gas and liquid surface, is the contact Angle of the material. The real object of water droplets on the surface is shown in Figure 21a,b [47], and the model analysis is shown in Figure 21c. The red triangle in (a) represents the angular relationship of water droplets on the surface of a material, it is also shown in (c).
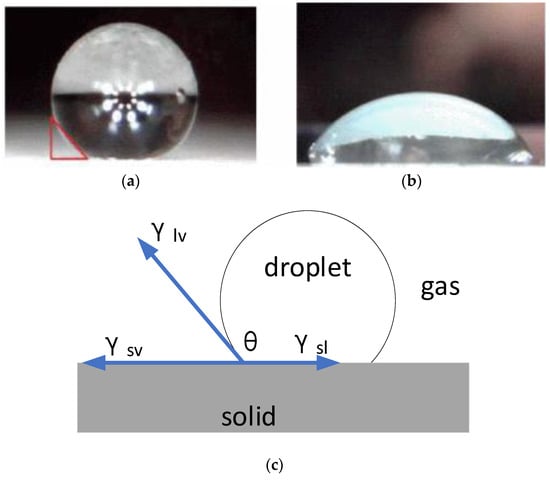
Figure 21.
Droplets on the surface. (a) Droplet on the hydrophobicity. (b) Droplet on the hydrophilic. (c) Model analysis of water droplets on solid surfaces [47].
Different hydrophobic materials show different contact angles. The LXP-70 insulator string coated with silicone acrylate resin (SAR) hydrophobic material with a contact angle of 110–150° was subjected to artificial icing and flashover tests [47]. After studying the ice morphology, density, weight growth and AC flashover voltage, it was found that the more hydrophobic the coating was, the more ice particles are formed, the ice density on the coated insulator surface is lower than that on the uncoated insulator surface. SAR coating with the θ greater than 130° can significantly reduce the ice weight of the glass insulator at the initial icing stage and increase the flashover voltage of the insulator.
In reference [48], a superhydrophobic material based on SiO2 was prepared with a θ of up to 163.6°. As the contact area and contact time between droplets and the superhydrophobic surface decreased significantly, icing on the insulator surface was prevented. Under the experimental conditions of −8°, vapor flow rate 70 L/h and 4-h icing, the coating insulator has about 50% less ice accretion than the uncoated one, and no icicle on the insulator string at low temperature, as shown in Figure 22 [49].
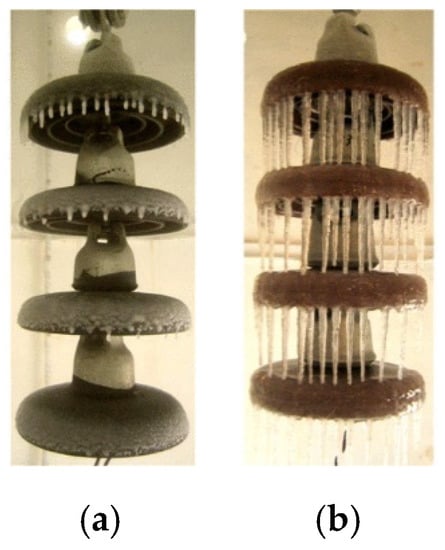
Figure 22.
Results of 4-h icing with and without a coating of insulators. (a) With coating. (b) Without coating [49].
5.2. Heating Coating
Some scholars have proposed applying a heating coating to the surface of the insulator. When the insulator is icing, it will increase the leakage current on the surface and give off heat to prevent the formation icing, so as to convert energy from the power system into heat for anti-icing [103]. This method also does not require an additional heat sources or equipment, which reduces the input of resources. It does not require transmission line shutdown or short circuit for cooperation, which can ensure that the transmission of electric energy is not affected. The application of the electric thermal coating to insulators is one of the ideas for dealing with the disaster of rain and snow freezing [104,105].
Carbon black is added to RTV coating and coated on the surface of the insulator to make it slightly conductive. By studying the black carbon content of RTV coating, the resistivity and leakage current of insulator can be controlled, and the anti-icing performance of the coating with different leakage currents can be compared [50]. The result of 2-h icing shows in Figure 23 [50]. The black carbon content of the a–d insulator is 6–9%, and the coating is 0.4 mm thick.
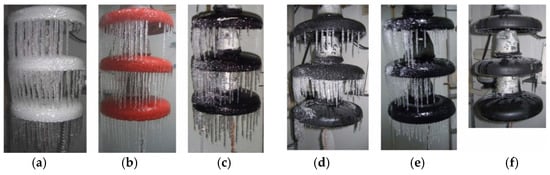
Figure 23.
Comparison of insulator ice accretion with different carbon black content coatings. (a) No coating. (b) RTV coating. (c) Coating a. (d) Coating b. (e) Coating c. (f) Coating d [50].
However, if the whole insulator is fully coated, the insulator will always be in a state of large leakage current and heating. Therefore, the “switching effect” coating method is generally adopted, that is, the lower surface is coated completely, the upper surface is coated with the outer ring, and the connection between the inner ring and the steel cap is not coated, resulting in a “blank zone”. When the icing starts, the ice conducts electricity to fill the “blank band”. Connecting the steel cap with the electrothermal coating will generate large leakage current heating, inhibiting the icing generation and growth. The literature [51] quantified the influence of coating position on the anti-icing effect and studied the position of semiconductor coating on the surface of large-diameter insulators. It found that the size and position of the “blank zone” had a great influence on the leakage current on the surface of insulators and are the important factors affecting the anti-icing effect of the electrothermal coating. The “blank zone” should be set at the edge of the shed, and the width should be moderate, 5 to 7 cm can achieve a better anti-icing effect. “Switching effect” coating insulators are shown in Figure 24:
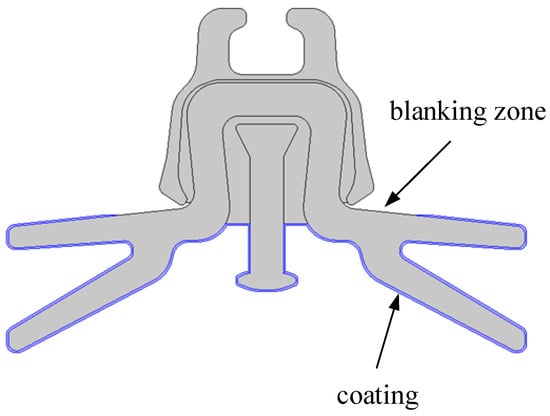
Figure 24.
Schematic diagram of “switching effect” electrothermal coating.
There is also photoelectric mixed coating for insulator anti-icing [52]. The important parameter of photothermal anti-icing coating is solar radiation energy absorption rate (SREAR). The SREAR is the ratio of the solar energy absorbed by the surface of an object per unit area to the total solar energy reached by the sun. The higher the absorption rate of solar energy, the stronger the ability of the object to absorb solar thermal radiation. Common photothermal materials are: intrinsic absorption materials, ceramic–metal composite materials and spinel materials.
The heating coating is useful for preventing glaze on insulators, but it cannot reduce the accumulation of rime [106]. Meanwhile, the durability of both heating coating and hydrophobic coating under continuous high pressure and outdoor insulator stress needs further research.
5.3. Optimization of the Shed Structure
Many studies have shown that [107,108,109,110,111,112] insulator shed configuration has a great influence on the icing and the flashover voltage, but under heavy icing conditions, the influence of shed structure is not obvious [53,76,113]. When the natural icing occurs, the influence law of shed structure on insulator icing growth is consistent with the results of the artificial experiment. For porcelain and glass insulators, it can be considered to change the shed structure by positing and mixing large and regular-size insulators in proportion. For composite insulators, large (medium) and small sheds can be made in proportion to change the shed structure, which increases the difficulty of ice bridging and increases the icing flashover voltage [114]. However, determining the value and proportion of shed diameter under different external environments is the focus of researchers. The discharge path of composite insulators is shown in Figure 25 [114]:
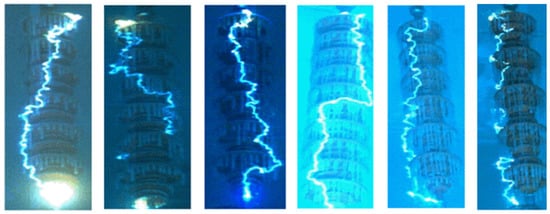
Figure 25.
Discharge path of composite insulators of different types [114].
Adding an appropriate number of large sheds to insulators can improve their electrical performance under icing conditions. In the study of icing on 330 kV composite insulators, in the condition of the same icing severity, the ice accretion on composite insulators with large shed is higher than that on insulator strings of the standard ceramic insulators. When the ice thickness is 13 mm, the U50% flashover voltage of composite insulators with large sheds is about 10% higher than that of those without large sheds [53]. In the literature [54], DC ice flashover characteristics of two composite insulators were tested. The ice thickness in the test was 5–30 mm, and the two samples were different only in the arrangement of large shed spacing. The test results show that the average flashover voltage of insulator samples with large shed spacing is higher than that of small spacing as the ice thickness increasing. When the ice thickness is 5 mm, the average flashover voltage is 9.2% higher, but the percentage decreases with the ice thickness increases. When the ice thickness is 30 mm, the average flashover voltage is only 3.0% higher.
Through simulation and experiment, the influence of several parameters of UHV composite pillar insulator shed tilt angle, rod diameter, shed spacing, and the ratio between the large-shed diameter and small-shed diameter on icing were studied [55]. It was found that in order to minimize the weight of icing, the insulator up tilt angle, down tilt angle, rod diameter, and shed ratio of insulator should be smaller, and the shed distance is around 48 mm. The icicles between the sheds are not easy to bridge by using the extended shed structure, and the ice flashover voltage gradient increases along the creepage distance. The extended shed structure is adopted to replace part of the small shed, which can effectively prevent ice bridging and improve the ice flashover voltage.
In the literature [56], 12 typical 220 kV composite insulators were tested of energized and non-energized icing, shown in Figure 26 [56]. It was found that when the shed spacing is larger, the length of icicles and the ice thickness become larger, while the icicle diameter is relatively smaller. The greater ratio of shed spacing and shed spread is beneficial to delay the icicle bridging and promote the growth of the ice layer on the shed surface. Although this will lead to an increase in the conductivity of the water film on the shed surface, the larger shed spacing hinders the flashover more. The differences in the ratio of icicle air gap arc during the flashover are one of the main reasons causing differences in icing flashover voltage for composite insulators with different shed configurations [57].
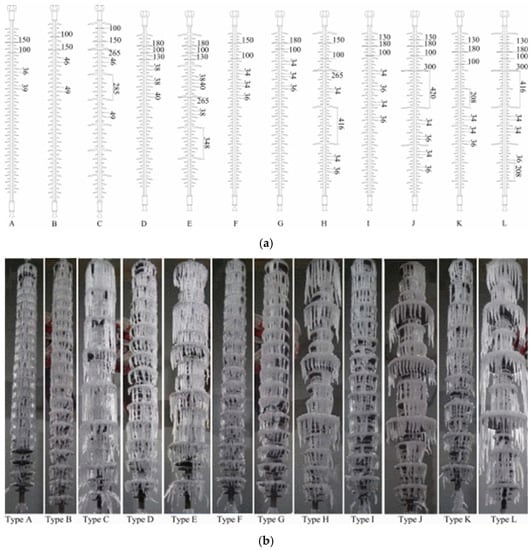
Figure 26.
The contrast of parameters and icing situation of composite insulators of different types. (a) Insulator types. (b) Icing situation of different types of composite insulators [57].
5.4. String Arrangement
The literature has shown that insulator string arrangement has a great influence on ice flashover voltage, including standard arrangement, connected with alternately large and small diameter sheds (CALSDS) arrangement, V and Λ shaped arrangement, horizontal arrangement and inverted T-shape (丄 shape) arrangement [115,116].
Due to the effect of gravity, all the rainwater falls straight down from the surface of the insulator. When the insulators are icing seriously, icicles bridge the insulator shed through the gap to greatly shorten the creepage distance. In this case, the icicle bridging can be effectively blocked by redesigning the arrangement of insulator strings or inserting large-diameter insulators, which will also affect the electric field and voltage distribution. The general relation between icing flashover voltage and string length of icing insulator string can be expressed as [117]:
where: is a constant related to the degree of icing, the structure of insulators, the degree of pollution before icing, etc. is the number of insulators. is the linearity coefficient. When = 1, it is linear; when < 1, it is nonlinear. and can be obtained by fitting test data.
The equation of and and the surface salt density of the insulator:
is the coefficient. is the characteristic index of the effect of on . is the characteristic index of the effect of on .
Connected with alternately large and small diameter sheds (CALSDS) (“2 + 1 “, “3 + 1” and “4 + 1”, etc.) have a great influence on the icing flashover voltage of insulator string. Under the polluted icing condition, the flashover voltage of insulator strings arranged by “3 + 1” CALSDS is about 14.6–18.1% higher than that of standard strings, and arranged by “4 + 1” CALSDS is about 10.1–13.1% higher than that of standard, respectively. The “2 + 1” is lower than that of “3 + 1” and “4 + 1”, Figure 27 [58]. For the V type and Λ type, “2 + 1” and “3 + 1” arrangement, the icing flashover voltage is influenced by the ice thickness. The thicker the ice, the less improvement. Both type V and Λ arrangement can significantly improve the icing flashover voltage, mainly because of the following reasons: the insulator shed is not easy to be bridged by icing, and due to thermal buoyancy, part of the arc can easily float upward from the insulator, so the arc can dissipate heat more easily [59].
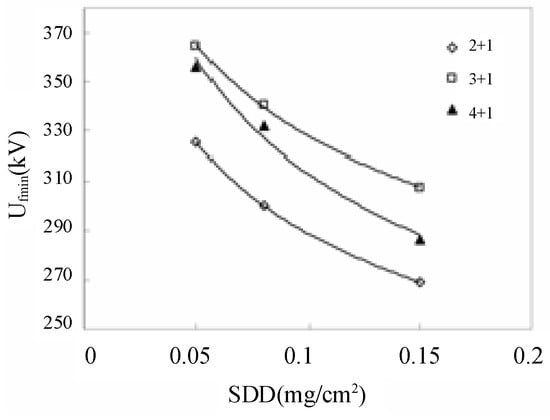
Figure 27.
The relationship of CALSDS arrangement icing flashover voltage and SDD [59].
For II arrangement, increasing the distance between the two insulators can improve flashover voltage performance. When the distance increases from 450 to 650 mm, the flashover voltage of the standard insulator string and with large shed increases by 3.2% and 7.1%, respectively [60]. When the string connection angle widely used in the transmission line is 60°, the flashover situation of the insulator string of V and Λ shape arrangement under wet snow conditions is shown in Figure 28 [60].
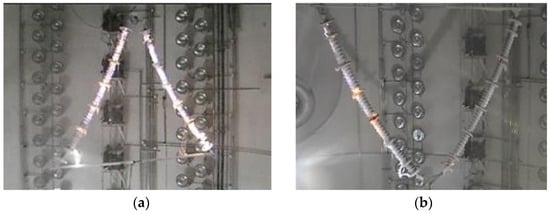
Figure 28.
Flashover situation of insulator string of 60° Λ and V arrangement. (a) Λ shape arrangement. (b) V shape arrangement [60].
For the inverted T-shape arrangement of the insulator string, the icicle growing down has less impact on the gap between the insulator shed, the arc development along the insulator surface in the process of flashover, there is no arc bridge shed phenomenon. The authors of [61] studied the icing and flashover of glass insulator strings arranged in inverted T shape, and compared the inverted T-shape arrangement of “8 + 1”, “7 + 2”, “6 + 3” and “5 + 4” with type I. When the strings were arranged in inverted T shape, the U50% increased by 6.66~15.37% compared with type I. The leakage current of the inverted T string is reduced by 3.84~18.50% compared with that of type I. Meanwhile, the higher the proportion of horizontal insulators, the higher the icing flashover voltage. The icing situation is shown in Figure 29 [61], and the is icing thickness. Figure 30 is the application of inverted T-shape insulator strings in transmission lines.
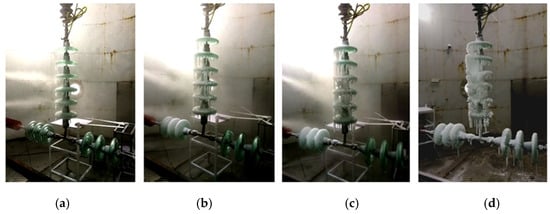
Figure 29.
Inverted T-shaped arrangement icing situation of insulator string with different degrees. (a) D = 5 mm. (b) D = 10 mm. (c) D = 15 mm. (d) D = 20 mm [61].
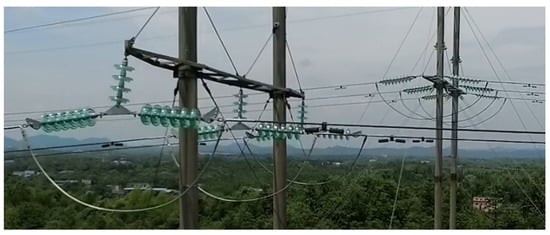
Figure 30.
Application of inverted T-shaped insulator strings in transmission lines.
6. Conclusions
Based on the literature, this review comprehensively expounds on the current situation and technical application of transmission lines icing, including the aspects of snowing and icing disasters of the power grid, icing characteristics and anti/de-icing methods of conductors and insulators. The conditions or influences of the formation of icing mainly include temperature, wind speed, humidity and water droplets bonded on the transmission line. As long as one of the links is hindered, the icing can be effectively prevented. When the icing has formed, it can be melted and make it falls off from the surface of the transmission line. For conductors, the most widely used method is DC ice melting, the State Grid Corporation and Southern Power Grid Corporation of China have used it on a large scale in recent years, effectively solving multiple icing disaster crises in the power grid. However, the cost of the DC ice melting device is very high, and the power needs to be cut off. AC ice melting is not applicable to long-distance transmission lines with high voltage levels. The current transfer intelligent ice melting device can effectively solve various problems of AC/DC ice melting and has a wide application prospect. It has been running in the transmission lines of China Southern Power Grid Corporation and achieved good effect. Traditional mechanical de-icing has developed to the present, which mainly relies on a robot with a blade on its conductors to remove the ice. The de-icing process causes great damage to the conductors. The corona discharge effect has a certain effect on reducing ice accretion, but corona loss is too large and limited by electromagnetic environment, so the application is limited. DEC and torque pendulum has obvious anti-icing effects, simple structure and great potential. As far as insulators are concerned, there are very few devices targeted to de-icing. Insulators coated with hydrophobic coatings will weaken the adhesion of water droplets in the air on the surface, thus hindering the development of icing, but the hydrophobic long-term performance and service life need to be further tested. When the ice is covered on the blank zone of the heating coating insulator, the leakage current increases and the heat is generated, which hinders the occurrence of icing, but it greatly reduces the pollution flashover voltage of the transmission line. The shed structure is applicable to composite insulators, and the CALSDS arrangement applies to porcelain and glass insulators. Changing the size shed ratio and disk diameter can hinder the ice bridging and improve the flashover voltage during light icing, but the effect is not obvious when the icing is heavy. Icing flashover voltage can be improved by changing the string arrangement, in which the inverted T, Λ and V arrangements have obvious effects. However, the string arrangement may be restricted by the environment in actual transmission lines. Each of these methods can play a good role in anti-icing insulators, widely used, but there are also disadvantages. In the future, the development of anti/de-icing technology of transmission lines, first is to explore fast, efficient and intelligent device, but also need it to have the function of non-manual intervention and non-power failure; the second is that the anti/de-icing research on such new energy power systems, such as wind turbine blade icing.
Author Contributions
Conceptualization, formal analysis, review, Z.Z.; references collecting and original draft preparation, editing, H.Z.; editing, review, S.Y.; editing, review, W.Z. All authors have read and agreed to the published version of the manuscript.
Funding
This research is supported by the Science and Technology Project of State Grid Corporation (Grant No. 5108-202218280A-2-322-XG).
Institutional Review Board Statement
Not applicable.
Informed Consent Statement
Not applicable.
Data Availability Statement
Not applicable.
Conflicts of Interest
The authors declare no conflict of interest. The funders had no role in the design of the study; in the collection, analyses, or interpretation of data; in the writing of the manuscript, or in the decision to publish the results.
References
- Imai, I. Studies on Ice Accretion. Res. Snow Ice 1953, 1, 35–44. [Google Scholar]
- Farzaneh, M.; Chisholm, W.A. Insulators for Icing and Polluted Environments; John Wiley & Sons: Hoboken, NJ, USA, 2009. [Google Scholar]
- Barat, A.; Guo, Q.; Fan, F.; Guo, X.; Zhang, Q. Analysis and Design of Transmission Line Icing Monitoring System Based on Optical Fiber Sensing. In Proceedings of the 2022 IEEE 10th Joint International Information Technology and Artificial Intelligence Conference (ITAIC), Chongqing, China, 17–19 June 2022; pp. 1846–1849. [Google Scholar] [CrossRef]
- Richardson, A. Dynamic analysis of lightly iced conductor galloping in two degrees of freedom. Generation, Transmission and Distribution. IEE Proc. C 1981, 128, 211–218. [Google Scholar]
- Morgan, V.; Swift, D.A. Effect of ice loads on overhead-line conductors. Electron. Power 1965, 11, 22–23. [Google Scholar] [CrossRef]
- Makkonen, L. Estimation of wet snow accretion on structures. Cold Reg. Sci. Technol. 1989, 17, 83–88. [Google Scholar] [CrossRef]
- Ihara, S.; Yamabe, C.; Ushio, S. Breaking of ice using pulsed power. In Proceedings of the Conference Record of the 2006 Twenty-Seventh International Power Modulator Symposium, Arlington, VA, USA, 14–18 May 2006; p. 342. [Google Scholar]
- Baliberdin, L.; Kozlova, M.; Shershnev, Y. Model group of controlled installation for melting ice on transmission line conductors. In Proceedings of the 2005 IEEE Russia Power Tech, St. Petersburg, Russia, 27–30 June 2005; pp. 1–5. [Google Scholar]
- Kannus, K.; Lahti, K. Laboratory Investigations of the Electrical Performance of Ice-covered Insulators and a Metal Oxide Surge Arrester. IEEE Trans. Dielectr. Electr. Insul. 2007, 14, 1357–1372. [Google Scholar] [CrossRef]
- Yang, J.; Li, Z.; Yang, F.; Huang, T. Analysis on the characteristics of ice-covered power grid disaster and tower toppling in 2008. Adv. Power Grids Hydropower 2008, 4, 4–8. (In Chinese) [Google Scholar]
- Dong, B.; Jiang, X.; Yin, F. Development and prospect of monitoring and prevention methods of icing disaster in China power grid. IET Gener. Transm. Distrib. 2022, 16, 4480–4493. [Google Scholar] [CrossRef]
- Zhou, X.; Zhu, Y.; Zhang, Y.; Li, H. A Review of Anti-icing and De-icing Technology of Overhead Ground Wire. In Proceedings of the 2022 International Symposium on Electrical. Electronics and Information Engineering (ISEEIE), Chiang Mai, Thailand, 25–27 February 2022; pp. 282–286. [Google Scholar] [CrossRef]
- Peng, S.; Hao, W.; Zhai, Y. Review of the research on icing mechanism of transmission lines and ice-melting technologies. In Proceedings of the 2015 5th International Conference on Electric Utility Deregulation and Restructuring and Power Technologies (DRPT), Changsha, China, 26–29 November 2015; pp. 1648–1652. [Google Scholar] [CrossRef]
- Yan, X.; Yuebin, Z.; Guobang, B.; Wanyu, C.; Liuqing, Y.; Wenyong, Y.; Qiansu, L.; Ronghua, Z.; Shukai, X.; Chuang, F. Research on MMC de-icing system capable of power grid interconnection. In Proceedings of the 2021 Annual Meeting of CSEE Study Committee of HVDC and Power Electronics (HVDC 2021), Beijing, China, 28–30 December 2021; pp. 29–38. [Google Scholar] [CrossRef]
- Liu, Y.; Farzaneh, M.; Du, B. Investigation on shed icicle characteristics and induced surface discharges along a suspension insulator string during ice accretion. IET Gener. Transm. Distrib. 2017, 11, 1265–1269. [Google Scholar] [CrossRef]
- Guo, J.; Li, J.; Rong, C.; Dong, Z.; Guan, W.; Zheng, Y.; Tan, L. Effectiveness Evaluation System and Evaluation Method for Anti-ice Damage Technical Transformation Project of Overhead Lines. In Proceedings of the 2019 IEEE 3rd International Electrical and Energy Conference (CIEEC), Beijing, China, 7–9 September 2019; pp. 314–319. [Google Scholar] [CrossRef]
- Yan, X.; Li, J.; Li, L.; Huang, Z.; Hu, J.; Lu, M. An OH-PDMS-modified nano-silica/carbon hybrid coating for anti-icing of insulators part II: Anti-icing performance. IEEE Trans. Dielectr. Electr. Insul. 2016, 23, 2165–2173. [Google Scholar] [CrossRef]
- Zhu, Y.; Tan, Y.; Huang, Q.; Huang, F.; Zhu, S.; Mao, X. Research on Melting and De-icing Methods of Lines in Distribution Network. In Proceedings of the 2019 IEEE 3rd Conference on Energy Internet and Energy System Integration (EI2), Changsha, China, 8–10 November 2019; pp. 2370–2373. [Google Scholar] [CrossRef]
- Liu, C.; Qin, J.; Hao, Y.; Li, G.; Chen, Y. Research on Verification Test of Tension Stringing for UHV Transmission Line Project. In Proceedings of the 2020 IEEE Sustainable Power and Energy Conference (iSPEC), Chengdu, China, 23–25 November 2020; pp. 1766–1771. [Google Scholar] [CrossRef]
- Xie, D.; Song, W.; Wang, W.; Sun, T.; Huang, T.; Cai, X. Research on ice removal blasting parameters of HV Transmission Lines. J. North Univ. China 2018, 39, 746–751. (In Chinese) [Google Scholar]
- Cao, Y.; Xue, K.; Miao, L.; Li, H.; Guan, X.; Zhang, J.; Li, G. Dynamic response analysis of ice tower line system after blasting deicing. J. North Univ. China: Nat. Sci. Ed. 2019, 040, 198–205. (In Chinese) [Google Scholar]
- Zumw, A.; Muwller, A. Flight and Wind Tunnel Tests of an Electro-Ipulse De-icing System. In Proceedings of the AIAA /NASA General Aviation Technology Conference, Hampton, VA, USA, 10–12 July 1984; pp. 10–12. [Google Scholar]
- Jiang, X.; Chen, Y.; Huang, T.; Wang, M.; Huang, H. Electro-impulse de-icing (EIDI) test of aircraft wing leading edge. In Proceedings of the 22nd International Symposium on High Voltage Engineering (ISH 2021), Xi’an, China, 21–26 November 2021; pp. 66–71. [Google Scholar] [CrossRef]
- Landry, M.; Beauchemin, R.; Venne, A. De-icing EHV overhead transmission lines using electromagnetic forcess generated by moderate short-circuit current. C. In Proceedings of IEEE 9th International Conference on Transmission and Distribution Construction, Operation and Live-line Maintenance, Montreal, QC, Canada, 8–12 October 2000; pp. 94–100. [Google Scholar]
- Montambault, S.; Pouliot, N. The HQ LineROVer: Contributing to innovation in transmission line maintenance. In Proceedings of the 2003 IEEE 10th International Conference on Transmission and Distribution Construction, Operation and Live-Line Maintenance, Orlando, Orlando, FL, USA, 6–10 April 2003; pp. 33–40. [Google Scholar]
- Zhao, J.; Guo, R.; Cao, L.; Zhang, F. Improvement of LineROVer: A mobile robot for de-icing of transmission lines. In Proceedings of the 2010 1st International Conference on Applied Robotics for the Power Industry, Montreal, QC, Canada, 5–7 October 2010; pp. 1–4. [Google Scholar]
- Li, K.; Du, L.; Han, W. Icing Analysis of Transmission Lines Considering the Current Heat. In Proceedings of the 2011 Asia-Pacific Power and Energy Engineering Conference, Wuhan, China, 25–28 March 2011; pp. 1–4. [Google Scholar] [CrossRef]
- Sun, C.; Jiang, X.; Xiong, Q.; Yi, H. Analysis of Critical Conditions for Ice Coating and Dry-Wet Growth of Conductors. Proc. CSEE 2003, 3, 141–145. (In Chinese) [Google Scholar]
- Jiang, X.; Fan, S.; Zhang, Z.; Sun, C.; Shu, L. Simulation and Experimental Investigation of DC Ice-Melting Process on an Iced Conductor. IEEE Trans. Power Deliv. 2010, 25, 919–929. [Google Scholar] [CrossRef]
- Jiang, X.; Fan, S.; Hu, J.; Zhang, Z.; Sun, C. Critical Current Analysis of DC Short-circuit Ice Melting in Transmission Lines. Proc. CSEE 2010, 30, 111–116. (In Chinese) [Google Scholar]
- Shu, L.; Luo, B.; Jiang, X.; Hu, Q.; Li, T.; Lan, Q. Intelligent loop current critical melting ice thawing method and its current research. J. Electrotech. 2012, 27, 26–34. (In Chinese) [Google Scholar]
- Yin, F.; Farzaneh, M.; Jiang, X. Corona investigation of an energized conductor under various weather conditions. IEEE Trans. Dielectr. Electr. Insul. 2017, 24, 462–470. [Google Scholar] [CrossRef]
- Yin, F.; Farzaneh, M.; Jiang, X. Influence of AC electric field on conductor icing. IEEE Trans. Dielectr. Electr. Insul. 2016, 23, 2134–2144. [Google Scholar] [CrossRef]
- Huang, Y.; Jiang, X.; Hou, L.; Zhu, M.; Han, X. Experimental Study on Reducing Icing on Conductor Using Self-heating Ring. In Proceedings of the 2018 IEEE International Conference on High Voltage Engineering and Application (ICHVE), Athens, Greece, 10–13 September 2018; pp. 1–4. [Google Scholar] [CrossRef]
- Yin, F.; Farzaneh, M.; Jiang, X. Laboratory investigation of AC corona loss and corona onset voltage on a conductor under icing conditions. IEEE Trans. Dielectr. Electr. Insul. 2016, 23, 1862–1871. [Google Scholar] [CrossRef]
- Zhang, Z.; Jiang, X.; Liu, J.; Lei, Y.; Li, R.; Fu, H. Distributed Hanging Weight Arrangement Method for Restraining Torsion and Dancing of Conductor. Patent CN112332353B, 21 December 2021. (In Chinese). [Google Scholar]
- Desai, Y.; Yu, P.; Popplewell, N. Perturbation-based finite element analysis of transmission line galloping. Sound Vibr. 1996, 191, 469–489. [Google Scholar] [CrossRef]
- Florea, G.; Florea, M.; Tibuliac, S.; Vaju, M.; Oltean, M.; Mateescu, E. Upgrading the Romanian 400 kV lines with 2 and 3 subconductors per phase to reduce the risk of galloping occurance and the galloping amplitudes by the installation of torsional dampers and detuners, live-line procedures. In Proceedings of the 2016 IEEE PES 13th International Conference on Transmission & Distribution Construction, Operation & Live-Line Maintenance (ESMO), Columbus, OH, USA, 12–15 September 2016; pp. 1–5. [Google Scholar] [CrossRef]
- Wang, X.; Yu, J.; Liu, Z.; Qin, Z.; Jiang, X.; Hu, Q. Comparison of Icing on Equivalent DEC and Bundled Conductors. High VOLTAGE Technol. 2022, 48, 2698–2705. (In Chinese) [Google Scholar] [CrossRef]
- He, J.; Li, X. Application Analysis of Expanded Conductor in 1000kV UHV Double-Circuit Line. AMM 2014, 664, 318–325. [Google Scholar] [CrossRef]
- Si, J.; Zhu, K.J.; Wan, J.C.; Yang, J.L.; Liu, L.; Ding, Y. Parametric Study on Simulation Modeling of DEC. In Advanced Materials Research; Trans Tech Publications, Ltd.: Bäch, Switzerland, 2013; Volume 815, pp. 69–72. [Google Scholar] [CrossRef]
- Jiang, X.; Fan, C.; Xie, Y. New method of preventing ice disaster in power grid using expanded conductors in heavy icing area. IET Gener. Transm. Distrib. 2019, 13, 536–542. [Google Scholar] [CrossRef]
- Bi, C.; Jiang, X.; Han, X.; Yang, Z.; Ren, X. Anti-icing Method Using Expanded Wire instead of Split Wire. Trans. China Electrotech. Soc. 2020, 35, 2469–2477. (In Chinese) [Google Scholar] [CrossRef]
- Huneault, M.; Langheit, C.; St-Arnaud, R.; Benny, J.; Audet, J.; Richard, J.-C. A dynamic programming methodology to develop de-icing strategies during ice storms by channeling load currents in transmission networks. IEEE Trans. Power Deli. 2005, 20, 1604–1610. [Google Scholar] [CrossRef]
- Jiang, X.; Wang, Y.; Shu, L.; Zhang, Z.; Hu, Q.; Wang, Q. Control scheme of the de-icing method by the transferred current of bundled conductors and its key parameters. IET Gener. Transm. Distrib. 2015, 9, 2198–2205. [Google Scholar] [CrossRef]
- Meng, Z.; Wang, Y.; Jiang, X.; Fan, S. Asynchronism of ice shedding from the de-iced conductor based on heat transfer. IET Sci. Meas. Technol. 2016, 10, 389–395. [Google Scholar]
- Hu, J.; Lan, B.; Xu, K.; Jiang, X.; Zhang, Z.; Shi, B.; Yang, H.; Wu, Y. Artificial icing and AC flashover tests on glass insulators with silicone acrylate resin hydrophobic coatings. IEEE Trans. Dielectr. Electr. Insul. 2016, 23, 1038–1047. [Google Scholar] [CrossRef]
- Li, X.; Yang, B.; Zhang, Y.; Gu, G.; Li, M.; Mao, L. A study on superhydrophobic coating in anti-icing of glass/porcelain insulator. Sol-Gel Sci. Technol. 2014, 69, 441–447. [Google Scholar] [CrossRef]
- Liao, W.; Jia, Z.; Guan, Z.; Wang, L.; Yang, J.; Fan, J.; Su, Z.; Zhou, J. Reducing Ice Accumulation on Insulators by Applying Semiconducting RTV Silicone Coating. IEEE Trans. Dielectr. Electr. Insul. 2007, 14, 1446–1454. [Google Scholar] [CrossRef]
- Zhao, Z.; Chen, H. Development of high-efficient synthetic electric heating coating for anti-icing/de-icing. Surf. Coat. Technol. 2018, 349, 340–346. [Google Scholar] [CrossRef]
- Sun, Z.; Jia, Z.; Wei, X.; Guan, Z. Optimization of Anti-icing Structure of Insulators Partially Coated with Semi-conductive Coating. Proc. CSEE 2012, 32, 132–138+201. (In Chinese) [Google Scholar] [CrossRef]
- Yin, F.; Jiang, X.; Farzaneh, M.; Hu, J. Electrical performance of 330-kV composite insulators with different shed configurations under icing conditions. IEEE Trans. Dielectr. Electr. Insul. 2015, 22, 3395–3404. [Google Scholar] [CrossRef]
- Lan, S. Study on the Anti-Icing Effect of Composite Insulator Coated with Photoelectric Mixed Coating; Chongqing University: Chongqing, China, 2019; (In Chinese). [Google Scholar] [CrossRef]
- Farzaneh, M.; Zhang, J.; Volat, C. Effect of insulator diameter on AC flashover voltage of an ice-covered insulator string. IEEE Trans. Dielectr. Electr. Insul. 2006, 13, 264–271. [Google Scholar] [CrossRef]
- Huang, Y.; Jiang, X.; Virk, M. Ice accretion study of FXBW4-220 transmission line composite insulators and anti-icing geometry optimization. Electr. Power Syst. Res. 2021, 194, 107089. [Google Scholar] [CrossRef]
- Hu, Q.; Wang, S.; Shu, L.; Jiang, X.; Qiu, G.; Li, H. Influence of shed configuration on icing characteristics and flashover performance of 220 kV composite insulators. IEEE Trans. Dielectr. Electr. Insul. 2016, 23, 319–330. [Google Scholar] [CrossRef]
- Hu, Q.; Wang, S.; Shu, L.; Jiang, X.; Liang, J.; Qiu, G. Comparison of AC icing flashover performances of 220 kV composite insulators with different shed configurations. IEEE Trans. Dielectr. Electr. Insul. 2016, 23, 995–1004. [Google Scholar] [CrossRef]
- Zhang, Z.; Jiang, X.; Sun, C.; Hu, J.; Huang, H.; Gao, D. Influence of insulator string positioning on AC icing flashover performance. IEEE Trans. Dielectr. Electr. Insul. 2012, 19, 1335–1343. [Google Scholar] [CrossRef]
- Jiang, X.; Zhao, S.; Hu, J.; Zhang, Z.; Shu, L. Study of DC flashover performance of ice-covered insulators at high altitude. IEEE Trans. Dielectr. Electr. Insul. 2013, 20, 391–400. [Google Scholar] [CrossRef]
- Xu, J.; Yin, F.; Li, L.; Wen, Q.; Wang, H.; Liu, S.; Jia, Z.; Farzaneh, M. Wet Snow Flashover Characteristics of 500-kV AC Insulator Strings with Different Arrangements. Appl. Sci. 2019, 9, 930. [Google Scholar] [CrossRef]
- Huang, Y.; Jiang, X.; Virk, M. Study of inverted T-shape insulator strings in icing conditions. Cold Reg. Sci. Technol. 2020, 173, 103021. [Google Scholar] [CrossRef]
- Jiang, X.; Yi, H. Transmission Line Icing and Protection; China Electric Power Publisher: Beijing, China, 2002. (In Chinese) [Google Scholar]
- Lu, J.; Guo, J.; Jian, Z.; Yang, Y.; Tang, W. Dynamic Assessment of Resilience of Power Transmission Systems in Ice Disasters. In Proceedings of the 2018 International Conference on Power System Technology (POWERCON), Guangzhou, China, 6–8 November 2018; pp. 7–13. [Google Scholar] [CrossRef]
- Runhua, W. Analysis of the accident based on low temperature, snowstorm, ice, coagulation. In Proceedings of the 2008 China International Conference on Electricity Distribution, Guangzhou, China, 10–13 December 2008; pp. 1–7. [Google Scholar] [CrossRef]
- Kunpeng, J.; Jingshan, H.; Jialun, Y.; Bin, Z.; Jian, W.; Bin, L.; Xueping, Z.; Lichun, Z. Dynamic analysis and suppression method of bundled conductors following ice shedding. In Proceedings of the 2021 IEEE Sustainable Power and Energy Conference (iSPEC), Nanjing, China, 23–25 December 2021; pp. 1596–1601. [Google Scholar] [CrossRef]
- Hu, J.; Yan, B.; Zhou, S.; Zhang, H.; Li, H.; Miao, C. Parameter Study on Galloping of Iced Bundled Conductors. In Proceedings of the 2010 Asia-Pacific Power and Energy Engineering Conference, Chengdu, China, 28–31 March 2010; pp. 1–4. [Google Scholar] [CrossRef]
- Lu, J.; Wang, Q.; Wang, L.; Yang, L.; Xu, X.; Li, L. Research on galloping and insulation characteristics of 500kV crescent-shaped iced quad bundle conductor. In Proceedings of the 2018 12th International Conference on the Properties and Applications of Dielectric Materials (ICPADM), Xi’an, China, 20–24 May 2018; pp. 941–947. [Google Scholar] [CrossRef]
- Wu, D.; Cao, H.; Li, D.; Yang, S. Energy-Efficient Reconstruction Method for Transmission Lines Galloping with Conditional Generative Adversarial Network. IEEE Access 2020, 8, 17310–17319. [Google Scholar] [CrossRef]
- Akagi, Y.; Koyama, S.; Ohta, H.; Nishizawa, H.; Nagata, Y.; Oka, T. Development of anti-galloping device for UHV transmission line. IEEE/PES Transm. Distrib. Conf. Exhib. 2002, 3, 2158–2161. [Google Scholar] [CrossRef]
- Huang, Q.; Tan, Y.; Mao, X.; Zhu, S.; Zhou, X. Study on Melting Ice Current Characteristics under Low Temperature and High Wind Speed. In Proceedings of the 2021 IEEE 5th Conference on Energy Internet and Energy System Integration (EI2), Taiyuan, China, 22–24 October 2021; pp. 4382–4385. [Google Scholar] [CrossRef]
- Cigre, T. Influence of ice and snow on the flashover performance of outdoor insulators, part I: Effects of snow. Electra 2000, 188, 55–69. [Google Scholar]
- Lu, J.; Zeng, M.; Zeng, X.; Fang, Z.; Yuan, J. Analysis of Ice-Covering Characteristics of China Hunan Power Grid. IEEE Trans. Ind. Appl. 2015, 51, 1997–2002. [Google Scholar] [CrossRef]
- Juan, W.; Chuang, F.; Yiping, C.; Hong, R.; Shukai, X.; Tao, Y.; Licheng, L. Research and Application of DC De–Icing Technology in China Southern Power Grid. IEEE Trans. Power Deliv. 2012, 27, 1234–1242. [Google Scholar] [CrossRef]
- Guo-te, L.; Yan-peng, H.; Yan, C. A comparative study of icing mechanism between soft rime and hard rime for the operating insulators. In Proceedings of the IEEE Annual Report Conference on Electrical Insulation and Dielectric Phenomena (CEIDP), Chenzhen, China, 20–23 October 2013; pp. 374–377. [Google Scholar]
- Jiang, X.; Xiao, D. Analysis of the Physical Process of Conductor Surface Icing. In Proceedings of the 2010 Academic Conference of Chongqing Society of Electrical Engineering, Chongqing, China, 29 October 2010; p. 89. (In Chinese). [Google Scholar]
- Zhang, Z.; Zhang, D.; Huang, H.; Jiang, X.; Gao, D. Study of the icing growth characteristic and its influencing factors for different types of insulators. Turk. J. Electr. Eng. Comput. Sci. 2016, 24, 63. [Google Scholar] [CrossRef]
- Zhuang, W.; Zhang, L.; Yang, Y. Research on Ice Accumulation of Transmission Lines in Xinjiang. In Proceedings of the 2022 Power System and Green Energy Conference (PSGEC), Shanghai, China, 25–27 August 2022; pp. 1012–1015. [Google Scholar] [CrossRef]
- Yiwei, X.; Yanpeng, H. Research of morphology of soft rime on suspension insulator for transmission line. In Proceedings of the 2013 Annual Report Conference on Electrical Insulation and Dielectric Phenomena, Chenzhen, China, 20–23 October 2013; pp. 319–322. [Google Scholar] [CrossRef]
- Bin, F.L.G.; Rong, Z.F.; Gang, L.; Hong, Y.; Chao, Q.G.; Liangchi, S.; En, Y.; Xiang, L. A Research of Drawing and Application of Distribution Diagram of Yunnan Ice Region Based on the Typical Ice Model of Low Latitude Plateau Area. In Proceedings of the 2018 International Conference on Power System Technology (POWERCON), Guangzhou, China, 6–8 November 2018; pp. 3440–3447. [Google Scholar] [CrossRef]
- Huang, W.; Hu, B.; Shahidehpour, M.; Sun, Y.; Sun, Q.; Yan, M.; Shao, C.; Xie, K. Preventive Scheduling for Reducing the Impact of Glaze Icing on Transmission Lines. IEEE Trans. Power Syst. 2021, 37, 1297–1310. [Google Scholar] [CrossRef]
- Bin, F.; Lixing, Z.; Zhe, T. The Study on Factors Influencing the Ice-Melting Performance of Transmission Line. In Proceedings of the 2013 Fourth International Conference on Intelligent Systems Design and Engineering Applications, Zhangjiajie, China, 6–7 November 2013; pp. 710–713. [Google Scholar] [CrossRef]
- Shen, Q.; Li, X. Method to Calculate the Critical Non-Icing Current on Transmission Line Considering the Impact of Humid Air Parameters. In Proceedings of the 2010 Asia-Pacific Power and Energy Engineering Conference, Chengdu, China, 28–31 March 2010; pp. 1–4. [Google Scholar] [CrossRef]
- Gu, X.; Wang, H.; Liu, H.; Zhao, L.; Li, H. Expert System of Ice Prevention on Overhead Transmission Lines. In Proceedings of the 2010 International Conference on Intelligent Computation Technology and Automation, Changsha, China, 11–12 May 2010; pp. 273–276. [Google Scholar] [CrossRef]
- Jiang, X. Research on Icing Mechanism of Transmission Lines and Icing Law and Influencing Factors in the Three Gorges Area; Chongqing University: Chongqing, China, 1997. (In Chinese) [Google Scholar]
- Yunnan Electric Power Design Institute; Yunnan Institute of Meteorological Science. Study on Icing of Power Lines in High Altitude Area of Yunnan; Yunnan Science and Technology Publisher: Yunnan, China, 1983. (In Chinese) [Google Scholar]
- Xingliang, J.; Quanlin, W.; Zhijin, Z.; Lichun, S.; Jianlin, H.; Qin, H.; Yang, P.; Yi, C. Estimation of rime icing weight on composite insulator and analysis of shed configuration. IET Gener. Transm. Distrib. 2018, 12, 650–660. [Google Scholar] [CrossRef]
- Ren, X.; Jiang, X.; Li, Z.; She, Q. Effect of Diameter and Height on Ice Thickness of Cylinder. In Proceedings of the 2019 IEEE 3rd International Electrical and Energy Conference (CIEEC), Beijing, China, 7–9 September 2019; pp. 1343–1347. [Google Scholar] [CrossRef]
- Farzaneh, M.; Laforte, J. Ice Accretion on Conductors Energized by AC or DC-Laboratory Investigation of Icing treeing. Int. J. Offshore Polar Eng. 1994, 4, ISOPE-94-04-1-040. [Google Scholar]
- Farzaneh, M.; Drapeau, J. AC Flashover Performance of Insulators Covered with Artificial Ice. IEEE Transm. Power Deliv. 1995, 10, 1038–1051. [Google Scholar] [CrossRef]
- Yang, Z.; Jiang, X.; Huang, Y.; Hu, J.; Han, X. Influence of electric field on the ice-coating process of insulators with a different dielectric surface. IET Sci. Meas. Technol. 2020, 14, 585–592. [Google Scholar] [CrossRef]
- Hong, Z.; He, K.; Xu, Y.; Fang, H.; Zuo, Q.; Li, Z. Design and Research on Impact Deicing Mechanism of Cable Climbing Robot. In Proceedings of the 2021 International Conference on Computer, Control and Robotics (ICCCR), Shanghai, China, 8–10 January 2021; pp. 70–74. [Google Scholar] [CrossRef]
- Huang, X.; Wei, X. A new on-line monitoring technology of transmission line conductor icing. In Proceedings of the 2012 IEEE International Conference on Condition Monitoring and Diagnosis, Bali, Indonesia, 23–27 September 2012; pp. 581–585. [Google Scholar] [CrossRef]
- Yunqing, B.; Kongjun, Z.; Ke, Z. The Research of DC Deicing Technology in Power Line. In Proceedings of the 2006 International Conference on Power System Technology, Chongqing, China, 22–26 October 2006; pp. 1–7. [Google Scholar] [CrossRef]
- Li, R.; Zhao, W.; Bai, T.; Zhang, Q.; Zhou, F.; Pu, Y. Influence of harmonics of DC ice melting device on MOA leakage current. In Proceedings of the 2020 4th International Conference on HVDC (HVDC), Xi’an, China, 6–9 November2020; pp. 468–471. [Google Scholar] [CrossRef]
- Jianming, W.; Chuandong, L.; Qi, W.; Xiaojie, C.; Jian, Z. Research on operation control measure of UHVDC line and its nearby power grid. In Proceedings of the 2016 IEEE International Conference on Power System Technology (POWERCON), Wollongong, NSW, Australia, 28 September–1 October 2016; pp. 1–4. [Google Scholar] [CrossRef]
- China Southern Power Grid Corporation. Technology and Application of Anti-icing and Melting in Power Grid; China Electric Power Publisher: Beijing, China, 2010. (In Chinese) [Google Scholar]
- Li, Y.; Zhang, X.; Gao, S.; Tang, X.; Li, P.; Li, Y.; Guo, Y.; Wu, G. Effect of Water Droplets on the Corona Discharge Characteristics of Composite Insulators in Arid Areas. In Proceedings of the 2019 2nd International Conference on Electrical Materials and Power Equipment (ICEMPE), Guangzhou, China, 7–10 April 2019; pp. 467–472. [Google Scholar] [CrossRef]
- Arshad; Momen, G.; Farzaneh, M.; Nekahi, A. Properties and applications of superhydrophobic coatings in high voltage outdoor insulation: A review. IEEE Trans. Dielectr. Electr. Insul. 2017, 24, 3630–3646. [Google Scholar] [CrossRef]
- Kako, T.; Nakajima, A.; Kato, Z.; Uematsu, K.; Watanabe, T.; Hashimoto, K. Adhesion and Sliding of Snow on Hydrophobic Solid Surface. J. Ceram. Soc. Jan. 2002, 110, 186–192. [Google Scholar] [CrossRef]
- Feng, L.; Li, S.; Li, Y.; Li, H.; Zhang, L.; Zhai, J.; Song, Y.; Liu, B.; Jiang, L.; Zhu, D. Super-hydrophobic Surfaces: From Natural to Artificial. Adv. Mater. 2002, 14, 1857–1860. [Google Scholar] [CrossRef]
- Arianpour, F.; Farzaneh, M.; Kulinich, S. Ice Adhesion and Hydrophobic Properties of Coatings Based on Doped RTV Silicone Rubber. In Proceedings of the IWAIS XIII, Andermatt, Switzerland, 8–11 June 2009. Section 6. [Google Scholar]
- Tadanaga, K.; Katata, N.; Minami, T. Super-Water-Repellent A12O3 Coating Films with High Transparency. J. Am. Soc. 1997, 80, 1040–1042. [Google Scholar]
- Wei, X.; Jia, Z.; Sun, Z.; Guan, Z.; Macalpine, M. Development of anti-icing coatings applied to insulators in China. IEEE Electr. Insul. Mag. 2014, 30, 42–50. [Google Scholar] [CrossRef]
- Momen, G.; Farzaneh, M. Study of ice accumulation on nanocomposite semiconducting coatings. In Proceedings of the 2010 Annual Report Conference on Electrical Insulation and Dielectic Phenomena, West Lafayette, IN, USA, 17–20 October 2010; pp. 1–4. [Google Scholar] [CrossRef]
- Xu, Z.; Jia, Z.; Li, Z.; Wei, X.; Guan, Z.; Macalpine, M.; Zhao, Y.; Li, Y. Anti-icing performance of RTV coatings on porcelain insulators by controlling the leakage current. IEEE Trans. Dielectr. Electr. Insul. 2011, 18, 760–766. [Google Scholar] [CrossRef]
- Wei, X.; Jia, Z.; Sun, Z.; Liao, W.; Qin, Y.; Guan, Z.; Xu, Z.; Peng, X. Study of anti-icing performance of insulator strings bottom-coated with semiconductive silicone rubber coating. IEEE Trans. Dielectr. Electr. Insul. 2012, 19, 2063–2072. [Google Scholar] [CrossRef]
- Cherney, E. Flashover performance of artificially contaminated and iced long-rod transmission. IEEE Trans. Power Appar. Syst. 1980, 99, 46–52. [Google Scholar] [CrossRef]
- Yang, Q.; Sima, W.; Deng, J.; Sun, C.; Hu, J. Shed Configuration Optimization for Ice-Covered Extra High Voltage Composite Insulators. J. Adhes. Sci. Technol. 2012, 26, 575–591. [Google Scholar] [CrossRef]
- Hu, Q.; Shu, L.; Jiang, X.; Sun, C.; Zhang, Z.; Hu, J. Effects of shed configuration on AC flashover performance of ice-covered composite long-rod insulators. IEEE Trans. Dielectr. Electr. Insul. 2012, 19, 200–208. [Google Scholar] [CrossRef]
- Lu, J.; Hu, J.; Fang, Z.; Qiao, X.; Zhang, Z. Electric Field Distribution and AC Breakdown Characteristics of Polluted Novel Lightning Protection Insulator under Icing Conditions. Energies 2021, 14, 7493. [Google Scholar] [CrossRef]
- Li, P.; Fan, J.; Li, W.; Su, Z.; Zhou, J. Flashover performance of HVDC iced insulator strings. IEEE Trans. Dielectr. Electr. Insul. 2007, 14, 1334–1338. [Google Scholar] [CrossRef]
- Ale-Emran, S.; Farzaneh, M. Experimental Design of Booster-Shed Parameters for Post Insulators under Heavy Icing Conditions. IEEE Trans. Power Deliv. 2015, 30, 488–496. [Google Scholar] [CrossRef]
- Hu, J.; Sun, C.; Jiang, X.; Zhang, Z.; Shu, L. Flashover performance of pre-contaminated and ice-covered composite insulators to be used in 1 000 kV UHV AC transmission lines. IEEE Trans. Dielectr. Electr. Insul. 2007, 14, 1347–1356. [Google Scholar] [CrossRef]
- Jiang, X.; Dong, B.; Zhang, Z.; Yin, F.; Shu, L. Effect of shed configuration on DC flashover performance of ice-covered 110 kV composite insulators. IEEE Trans. Dielectr. Electr. Insul. 2013, 20, 699–705. [Google Scholar] [CrossRef]
- Yan, S.; Wan, Q.; Xu, Z. Experimental study on the flashover characteristics of 500 kV AC ice-covered insulator string under different arrangement. High Volt. Eng. 2011, 37, 3129–3134. [Google Scholar]
- Porkar, B.; Farzaneh, M. DC Flashover Performance of an Inclined Insulator String Under Heavy Icing Conditions. In Proceedings of the 2015 IEEE 11th International Conference on the Properties and Applications of Dielectric Materials (ICPADM), Sydney, Australia, 19–22 July 2015. [Google Scholar]
- Jiang, X.; Lu, J.; Du, Y.; Yuan, J. AC Ice Flash Characteristics of Insulator String with Interplug Arrangement. Proc. CSEE 2009, 29, 12–16. (In Chinese) [Google Scholar]


Disclaimer/Publisher’s Note: The statements, opinions and data contained in all publications are solely those of the individual author(s) and contributor(s) and not of MDPI and/or the editor(s). MDPI and/or the editor(s) disclaim responsibility for any injury to people or property resulting from any ideas, methods, instructions or products referred to in the content. |
© 2023 by the authors. Licensee MDPI, Basel, Switzerland. This article is an open access article distributed under the terms and conditions of the Creative Commons Attribution (CC BY) license (https://creativecommons.org/licenses/by/4.0/).