Article

Long-Term Scenarios of Indonesia Power Sector to Achieve Nationally Determined Contribution (NDC) 2060

by
Satria Putra Kanugrahan
1,* and
Dzikri Firmansyah Hakam
2
1
PT PLN (Persero), Jakarta 12160, Indonesia
2
School of Business and Management, Institut Teknologi Bandung, Bandung 40132, Indonesia
*
Author to whom correspondence should be addressed.
Energies 2023, 16(12), 4719; https://doi.org/10.3390/en16124719
Submission received: 4 May 2023 / Revised: 28 May 2023 / Accepted: 9 June 2023 / Published: 14 June 2023

Abstract

:
This study aims to assess the feasibility of achieving Indonesia’s net-zero emissions target by 2060 through a model of future power generation using renewable energy sources using the Low Emissions Analysis Platform (LEAP) software. There are five projected power generation scenarios in this research: the reference (REF) scenario, the conservative (CON) scenario, the moderate (MOD) scenario, the progressive (PRO) scenario, and the advanced (ADV) scenario. The availability of renewable energy technology differentiates each scenario. The ADV scenario, which utilizes nuclear power and energy storage, achieves the 100% renewable energy target by 2060 at the lowest total cost. However, the costs of CON and MOD are not significantly higher. Indonesia should decommission existing fossil fuel power plants and construct more renewable energy power plants to achieve the net-zero emissions target. Based on the simulation, biomass energy is the least favorable type of energy. Solar becomes an option only when other renewable energies are at their maximum potential capacity. Furthermore, nuclear energy and energy storage is essential for Indonesia to achieve the renewable target.

1. Introduction

In the September 2022 submission of the Enhanced Nationally Determined Contribution (NDC) document at the United Nations Framework Convention on Climate Change (UNFCCC), Indonesia has established a new target of attaining net-zero emissions by 2060. This represents a 10-year extension from the government’s initial proposal in the NDC, which originally aimed to achieve net-zero emissions by 2050, as per the initial agreement [1,2,3]. In order to achieve this goal, Indonesia has laid out four core principles [4], which include increasing electrification, the adoption of renewable energy, a reduction in fossil fuels, and the utilization of clean fuels and energy storage.
The energy transition from fossil to green energy in the electricity sector will play a significant role in achieving Indonesia’s NDC target. For many years, Indonesia has predominantly relied on fossil fuels to generate electricity, with fossil power plants accounting for 87% of the country’s total capacity of 62,449 GW in 2020 [5,6]. On the other hand, despite growth, the amount of power produced from renewable sources is still less than 1% [5,6]. As a result, in order to meet the net-zero emissions objective, Indonesia must decommission existing fossil-fuel power facilities and build more renewable power plants.
This study aims to develop a model of Indonesia’s future power generation between 2022 and 2060 to support the country’s goal of achieving net-zero emissions by 2060. The Low Emissions Analysis Platform (LEAP) software will be used to run the model, which will focus on generating all electricity from renewable sources. The study will provide a techno-economic analysis of the country’s projected growth in electricity generation while taking into account the goal of net-zero emissions. Indonesia-specific data such as load curve data and the variable renewable energy availability curve will be used to obtain a comprehensive analysis.
This research has two novelties compared to previous research. First, it models Indonesia’s power generation expansion plan for the period 2022–2060. Second, it provides a model for Indonesia’s power sector to achieve zero carbon in 2060. The findings of this study will provide new perspectives on Indonesia’s future power policy and contribute to achieving the net-zero emissions target. The results of this study will help policymakers and stakeholders understand the feasibility and economic implications of transitioning to 100% renewable energy in the electricity sector. Moreover, this study can help identify the necessary policy measures that need to be implemented to support Indonesia’s energy transition.
The remaining portions of this paper proceed as follows: Section 2 elaborates on the Indonesian power sector and conducts a literature review of previous research on energy modeling to achieve the net-zero carbon in Indonesia. The input data, simulation scenarios, and LEAP modeling methods are all described in Section 3. Section 4 discusses and evaluates the outcomes of the LEAP modeling. Section 5 summarizes the results, discusses the study’s shortcomings, and makes recommendations for further research.

2. Literature Review

2.1. Indonesia’s Power Sector

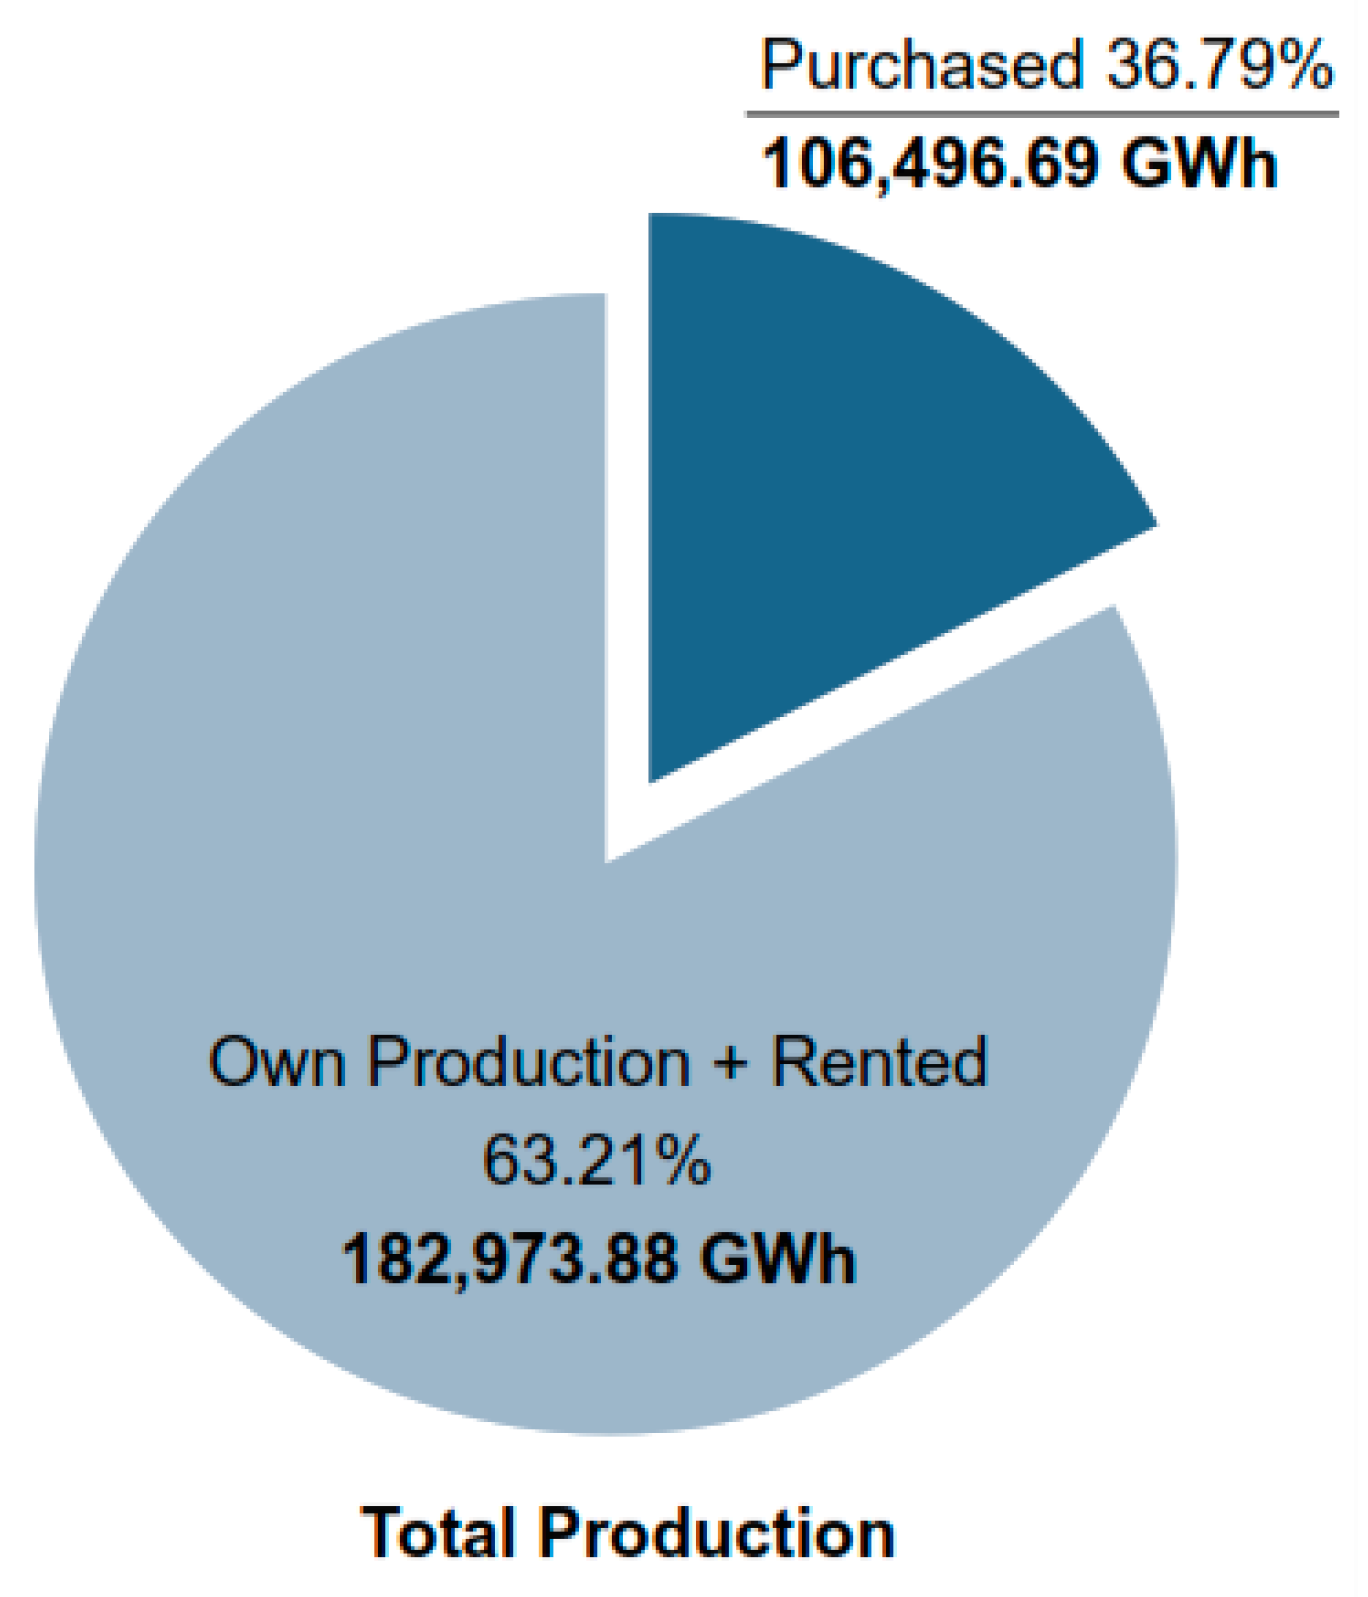
The energy market in Indonesia has experienced significant growth in response to increased demand for electricity over the past decade, as shown in Figure 1 [6,7]. PT PLN (Persero), the Indonesian state-owned electricity company, produced 156 Terawatt-hours (TWh) of electricity in 2010. By 2021, the number increased to more than 300 TWh [5], as can be seen in Figure 2. To meet this increasing demand, the government launched the 35,000-megawatt (MW) program in 2015, which aimed to build new power plants with a total power generation capacity of 35,000 MW by 2020 [8,9]. However, despite the government’s goal to diversify its energy mix, coal-fired power plants dominated the program, accounting for 57% of additional power generation capacity [10], while the renewable energy power plant’s total capacity was only 2000 MW [11,12].
At the end of 2021, Indonesia’s total installed power generation capacity was 64.5 gigawatts (GW), with the majority (69%) operated by state-owned electricity company PT Perusahaan Listrik Negara (PLN) [5,13]. The remaining capacity was operated by independent power producers, operating permit holders, private power utilities, and the government. Despite having significant renewable energy potential, as can be seen in Table 1, with a total capacity of 1257.3 GW comprising hydropower, geothermal, bioenergy, solar, wind, and ocean energy, Indonesia’s renewable energy accounts for less than 1% of the total electricity generated by the end of 2021 [6,14].
Indonesia’s government has emphasized the importance of diversifying the country’s energy mix to reduce its reliance on fossil fuels and enhance energy security. Indonesia has significant potential for renewable energy, and increasing its use can help mitigate climate change, promote energy independence, and create new economic opportunities. However, to achieve this goal, Indonesia must overcome various challenges, such as regulatory barriers, lack of investment, and infrastructure development [15,16].

2.2. Previous Research

The study of the literature focuses on prior research related to Indonesia’s energy transition to net-zero emissions, particularly those that use LEAP software. Zhong et al. [17] proposed a LEAP model of Indonesia’s energy system to study various energy profiles and emission trajectories that match the country’s climate ambitions. The authors created four scenarios: business-as-usual (BAU), the current policy scenario (CPS), renewable enhancement (REE), and net-zero emissions (NZE). The research revealed that the primary strategies for Indonesia to meet its net-zero target involve an energy transition to renewables, electrification, energy efficiency improvement, and carbon capture and storage. While these steps may decrease Indonesia’s final energy consumption by 33% by 2060, Indonesia’s final energy consumption would still increase by 375% from 2018.
Kanugrahan et al. [18,19,20] explored Indonesia’s power generation development plans to achieve renewable energy targets. Using the LEAP software, the authors created four cases: business as usual (BAU), cost optimization (CO), national plan (NP), and zero-carbon (ZC). The business as usual (BAU) scenario, based on the existing electricity generating roadmap in Indonesia, is not financially efficient and does not achieve the country’s renewable energy ambitions. The cost optimization (CO) scenario is the most cost-effective approach for Indonesia to reach its renewable energy ambitions, but it requires further research. The NP scenario is slightly more costly than the CO scenario, but it is viewed as more reliable. The zero-carbon (ZC) scenario has the highest investment cost to meet Indonesia’s renewable energy ambitions, yet it is the only way of attaining completely carbon-free emissions by 2050. Indonesia will need to invest in breakthroughs in clean energy technology, novel forms of renewable energy, and power storage to reach zero-carbon emissions by 2050.
Handayani et al. [21,22,23] evaluated the ability of the Association of Southeast Asian Nations (ASEAN) to achieve zero carbon emissions in the power industry by 2050. The study applied the Low Emissions Analysis Platform (LEAP) model to simulate three scenarios: business as usual, renewable policy, and net-zero emissions. The research concluded that achieving net-zero emissions was technically possible, but it would necessitate significant investment in renewable energy and energy-saving technology. In the long term, the research concludes, the net-zero emissions scenario would be more economical than the business-as-usual scenario. The article finds that ASEAN may attain net-zero emissions in its power sector by 2050, but ASEAN nations will need massive investment and a significant political will from the government.
Sani et al. [24] investigated the potential for decarbonizing the power sector in Sumatra, Indonesia. The study used the Low Emissions Analysis Platform (LEAP) software tool to model the power sector in Sumatra. The study finds that it is possible to reduce emissions by 70% by 2050 while still meeting the region’s electricity demand. The key to decarbonization is to invest in renewable energy sources, such as solar and wind power, and to improve energy efficiency. The study also finds that decarbonization can be cost-effective. In fact, the cost of decarbonizing the power sector in Sumatra is lower than the cost of continuing to rely on fossil fuels. This is due to the falling costs of renewable energy and the increasing efficiency of renewable energy technologies.
The IEA [7] report offers an in-depth assessment of the methods and strategies that Indonesia may use in order accomplish zero carbon in 2060. According to the analysis, Indonesia can achieve net-zero emissions while preserving economic growth and boosting energy availability. However, major investment and policy changes are required. Accelerating the implementation of energy efficiency, renewable energy, and electrification is critical to achieving net-zero emissions. Indonesia will likewise have to reduce its usage of coal over time, but it can nevertheless maintain a role in the world’s coal business by supplying high-quality coal. The shift to net-zero emissions will necessitate major investment and regulatory adjustments. Foreign assistance and backing may assist Indonesia in achieving net-zero emissions.
The summary of previous research on Indonesia’s power system can be seen in Table 2. Previous research indicates that Indonesia should transition towards renewables, electrification, energy efficiency improvement, and carbon capture and storage to achieve its net-zero emissions target. The use of LEAP models has been instrumental in identifying cost-effective pathways towards net-zero emissions. Furthermore, the studies suggest that the adoption of renewable energy and energy storage technologies will be more cost-effective than carbon capture and storage in the long run.

3. Methodology

3.1. LEAP Software

The use of energy modelling software has become increasingly important in recent years as the world has become more focused on sustainable energy sources. One software that has gained popularity is the LEAP (Low Emissions Analysis Platform) modelling software. LEAP is a comprehensive energy modelling software that allows users to simulate the energy system of a region or country over a long period of time. It was developed by the Stockholm Environment Institute (SEI) in 1993 and has since been used by researchers, policymakers, and energy planners around the world [25,26].
LEAP modelling works by simulating the energy demand, supply, and infrastructure of a region or country. It uses a bottom-up approach where it models individual sectors such as residential, commercial, industrial, and transport, and then aggregates them to create an overall energy system. The software also considers various factors such as population growth, economic development, energy prices, and technological advancements. It allows users to create scenarios to test different policy options and explore the potential impact of different energy systems on the environment and economy. LEAP is a powerful tool for decision-makers who need to make informed choices about energy investments, policies, and regulations [22,25].
One of the key components of LEAP modelling is its ability to integrate renewable energy sources into the energy system. The software includes a comprehensive database of renewable energy technologies and their associated costs and performance characteristics. Users can select different renewable energy technologies and simulate their deployment over time. LEAP also allows users to test the impact of policies and regulations on renewable energy deployment, such as subsidies, feed-in tariffs, and carbon pricing. This feature of LEAP is particularly valuable in helping policymakers design effective policies to accelerate the deployment of renewable energy technologies [22,25,27].

3.2. Simulation Scenarios and Input Data

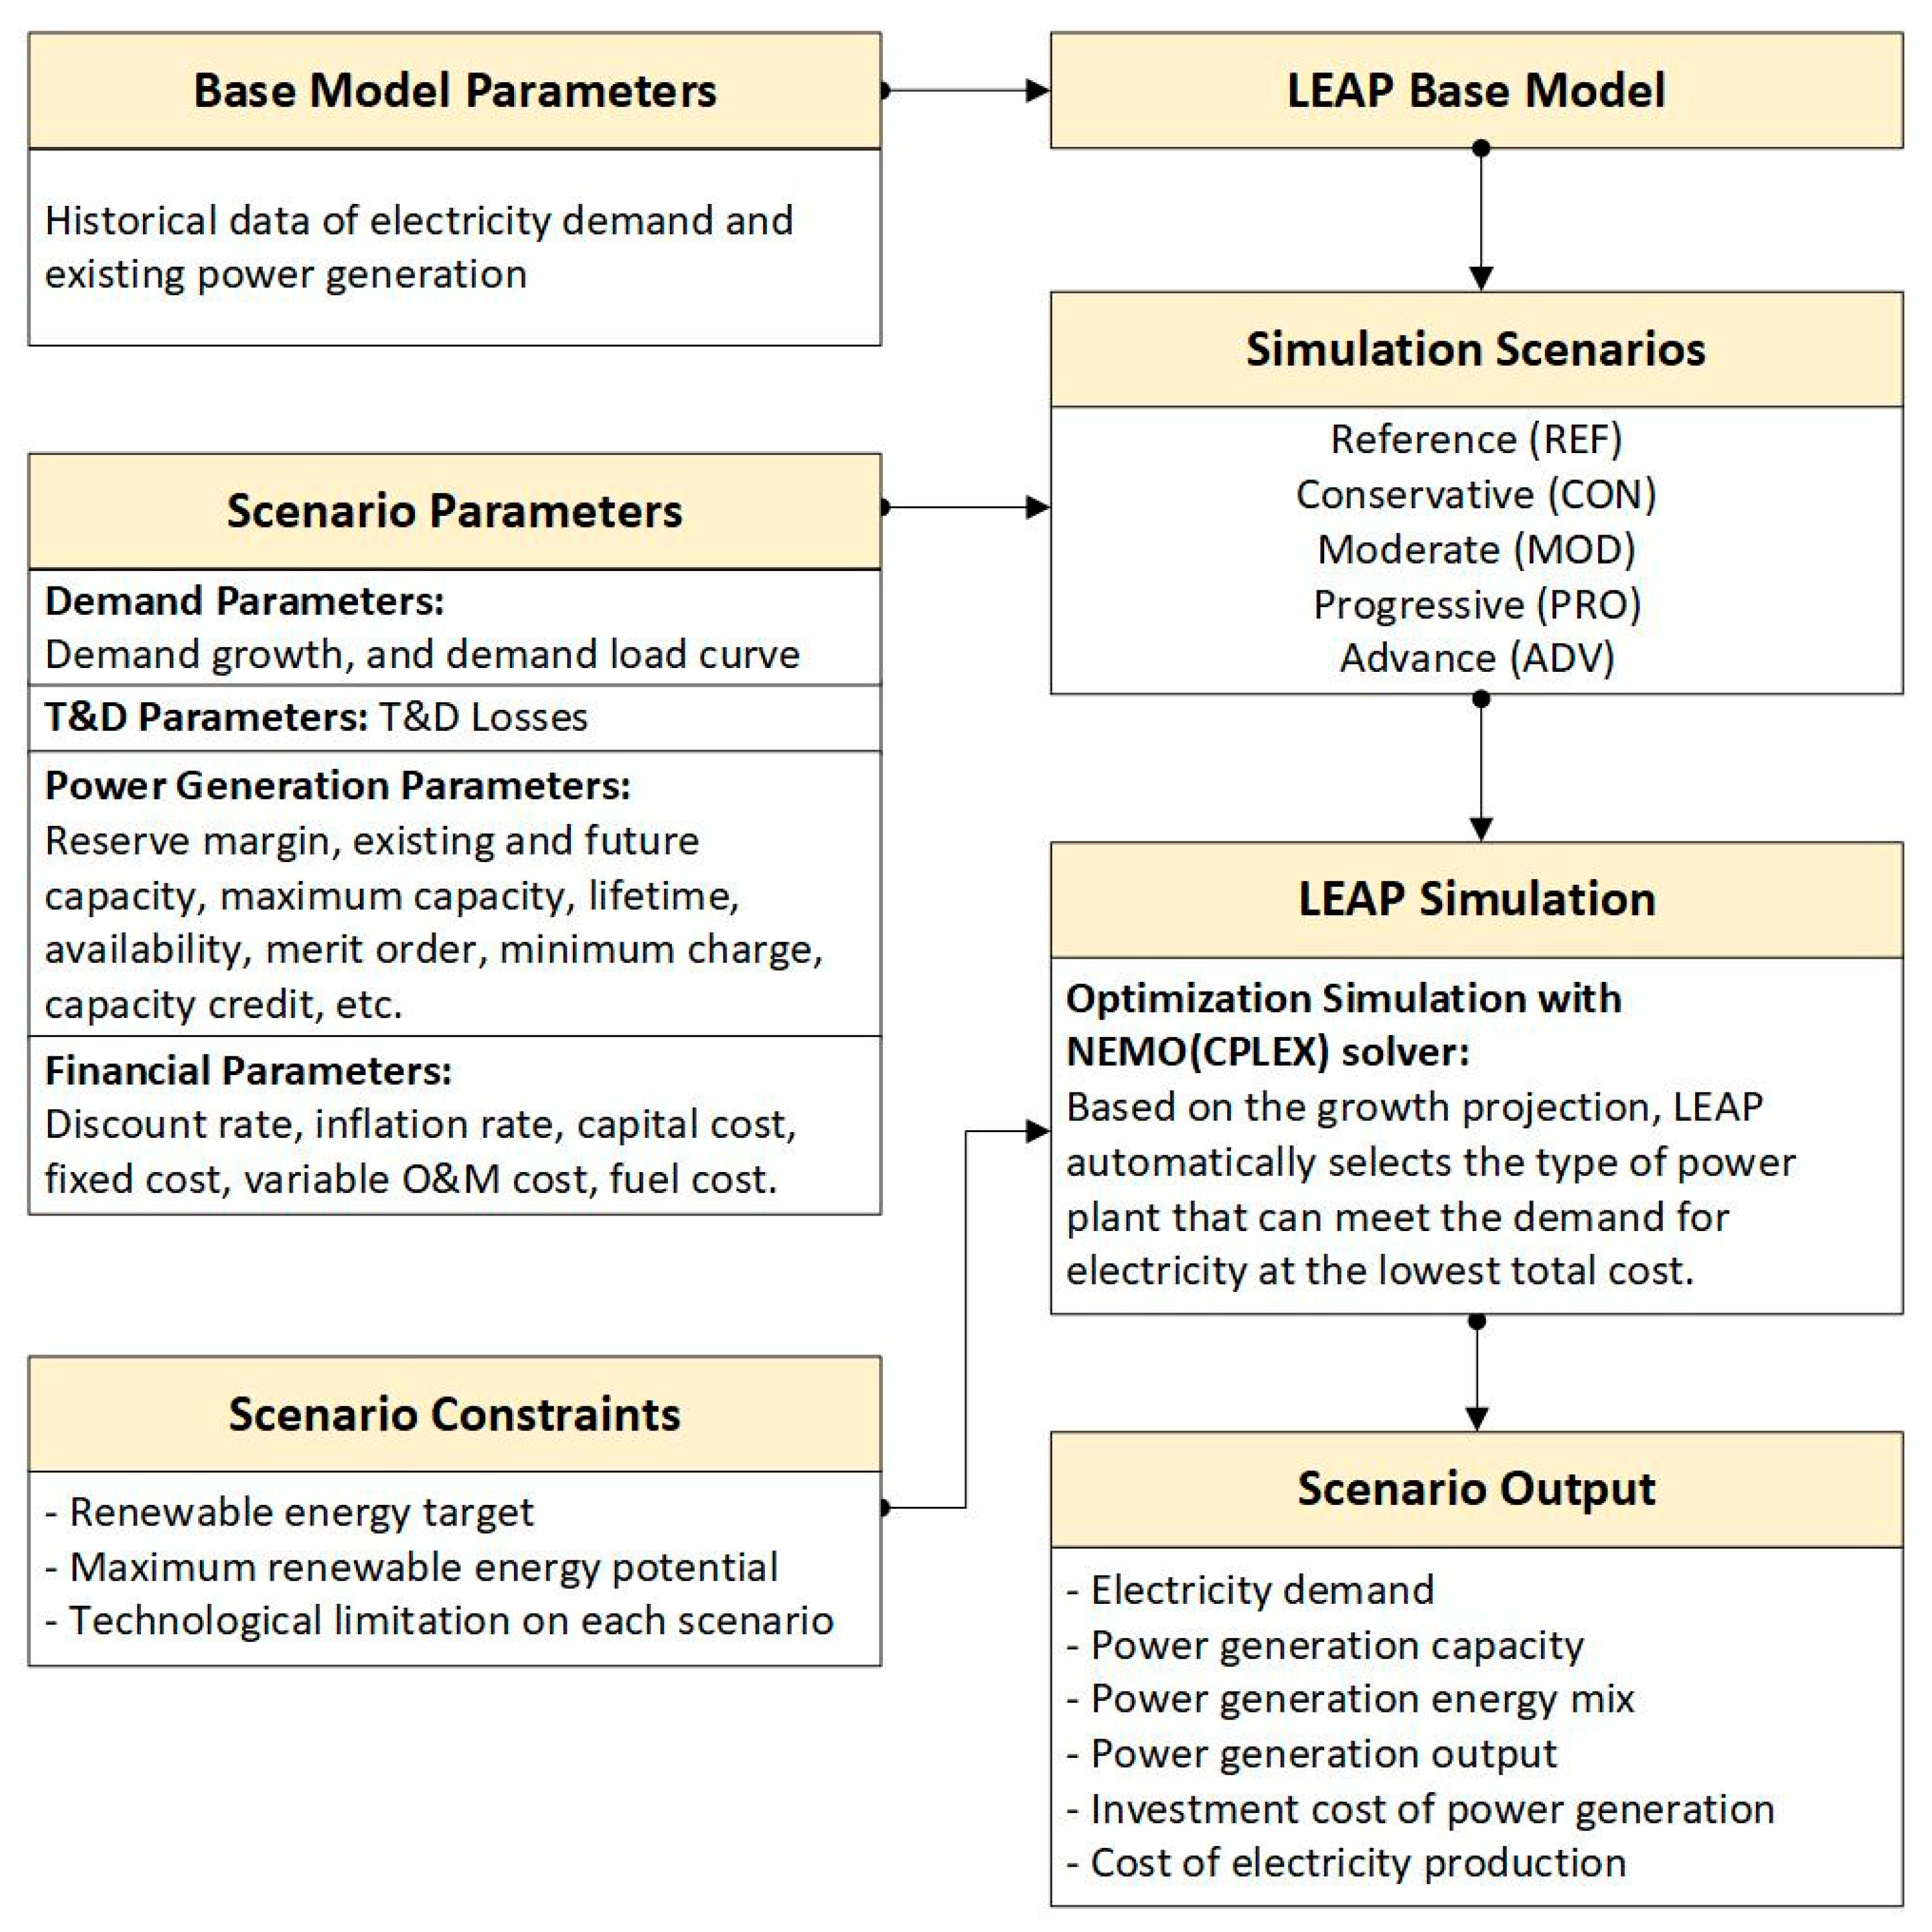
This research aims to project the future of Indonesia’s power system using the LEAP model. The research focuses on providing an overview of Indonesia’s future power generation for the period of 2021–2060. The electricity system is modeled as a single system based on the data available up to January 2022. Figure 3 shows the research framework in this research. The first step in creating the scenario projection is establishing a base model that reflects the current state of the power system in Indonesia. The base model is composed of historical data from 2012 to 2021, which include electricity demand, transmission and distribution losses, load curve, and power generation parameters.
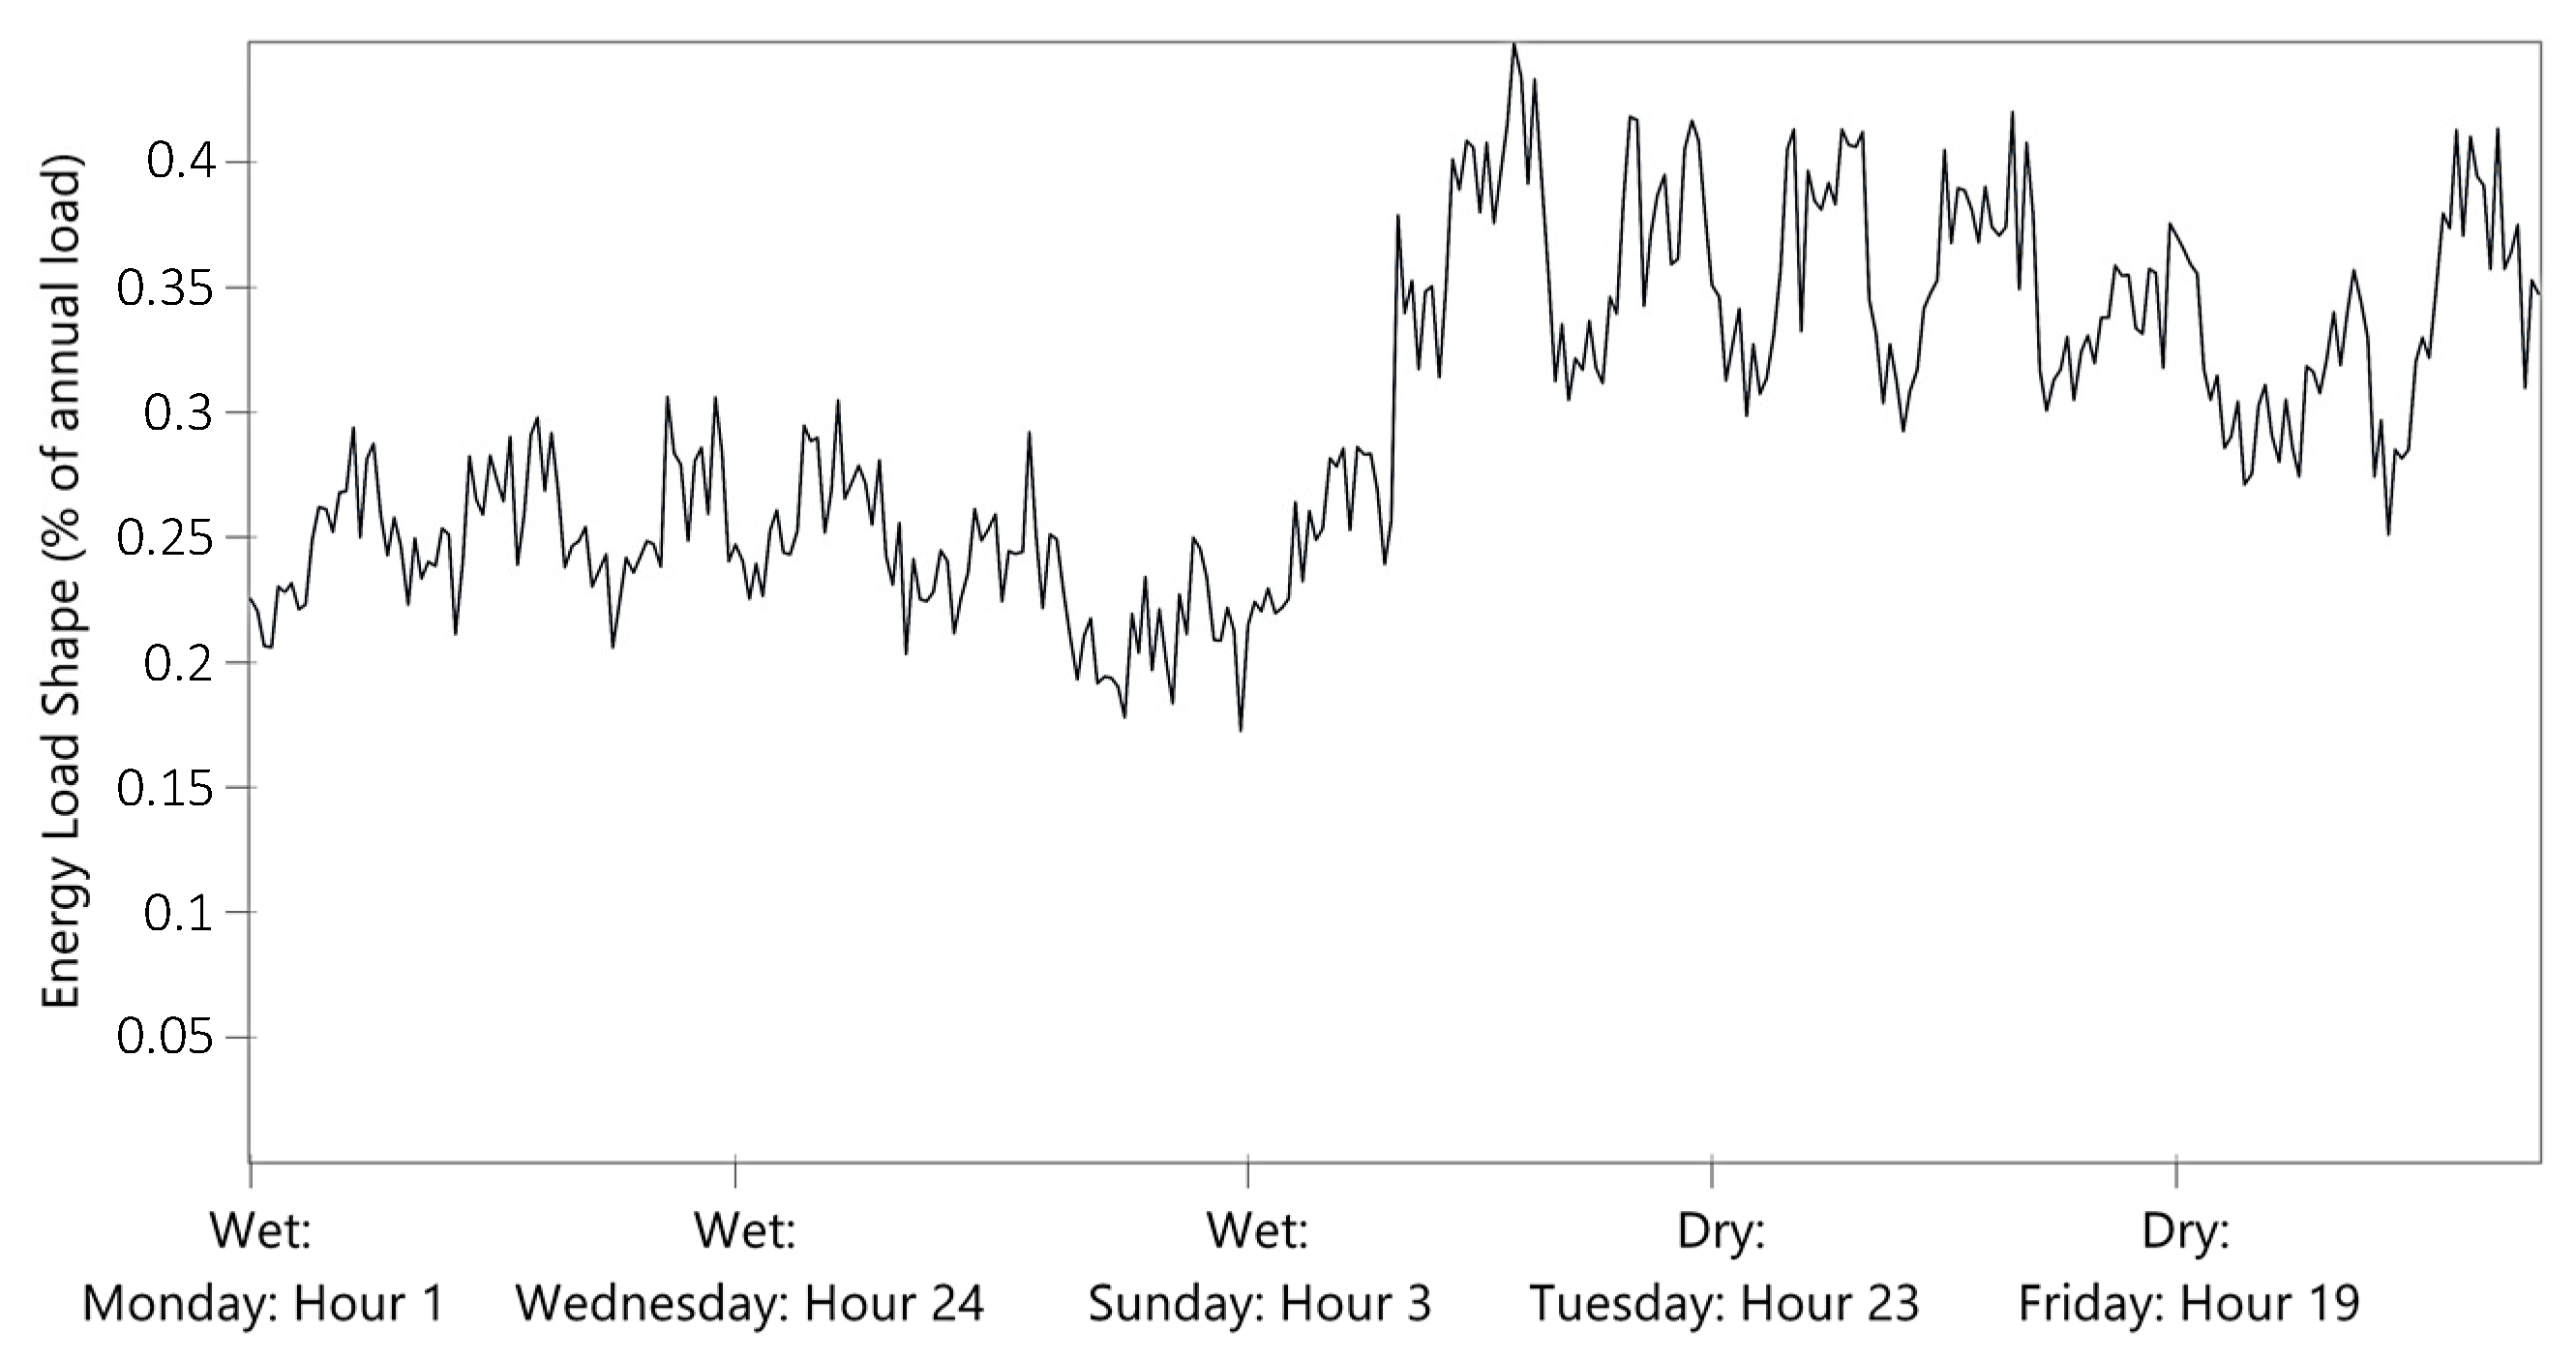
LEAP’s base model requires several parameters, as shown in Table A1 in the Appendix A. To create the base model, the input data for electricity demand are the national electricity consumption values from 2012 to 2021. The power system transmission and distribution losses, and the load curve are also based on the actual values in 2021. The load curve model is presented in Figure A1; for the whole projection time frame, the load curve of Indonesia’s energy consumption is expected to be identical every year. Several power generation model parameters are also taken from previous research, as in Table A2.
Once the base model is established, the next step is to create a demand model. LEAP is a demand-driven model, which means that the projected demand parameter will influence the power generation outcome. For this research, the demand model is based on the PLN Electricity Business Plan annual growth projection, as much as 4.5% per year.
After the total demand is determined, LEAP will determine the total power of the power generation module that needs to be produced. There are five projected power generation scenarios in this research: the reference (REF) scenario, the conservative (CON) scenario, the moderate (MOD) scenario, the progressive (PRO) scenario, and the advanced (ADV) scenario. One of the critical aspects of this research is achieving the renewable energy target in the projected power generation model using several types of technologies. Therefore, the criteria distinguishing one scenario from another are the renewable energy technologies that each scenario can use to achieve the renewable target.
This study considers various types of energy mixes for future capacity expansion, such as coal, diesel, geothermal, hydro, solar, biomass, natural gas, wind, and nuclear. However, the simulation does not include ocean energy due to the lack of reference to this technology. The research also implemented the solar and wind curve availability, and the renewables’ energy potential capacity is limited to the maximum available potentials in Indonesia. The battery energy storage system modeled in this study is defined as Li-ion technology. Moreover, the LEAP model will select the power generation technology with the least cost by default. At the end of the lifetime of each type of technology, the simulation assumes that the value of each technology is zero. Therefore, it should be replaced with a new resource.
The REF scenario is fossil-fuel dependent with conventional renewable energy technology, and no specific target for renewable energy. The CON scenario has renewable energy targets of 23% in 2025, 28% in 2038, and 100% in 2060. It uses conventional renewable energy technology such as hydro, wind, solar, and geothermal power with no energy storage. The MOD scenario also has renewable energy targets of 23% in 2025, 28% in 2038, and 100% in 2060, but it uses energy storage technology in addition to conventional renewable energy technology. The PRO scenario has the same renewable energy targets as the previous scenarios, but it also includes nuclear power, without energy storage. Finally, the ADV scenario has the same renewable energy targets, but it includes both nuclear power and energy storage in addition to conventional renewable energy technology.

4. Scenario Results

This section is divided into four segments. The initial part elaborates on the projection of electricity demand in Indonesia from 2021 to 2060. The second part presents the results of simulations for the five scenarios outlined in Section 3. The third part discusses the findings related to the investment costs. Finally, the fourth part compares the outcomes of the simulations with those of other research focused on Indonesia’s power system.

4.1. Demand Projection

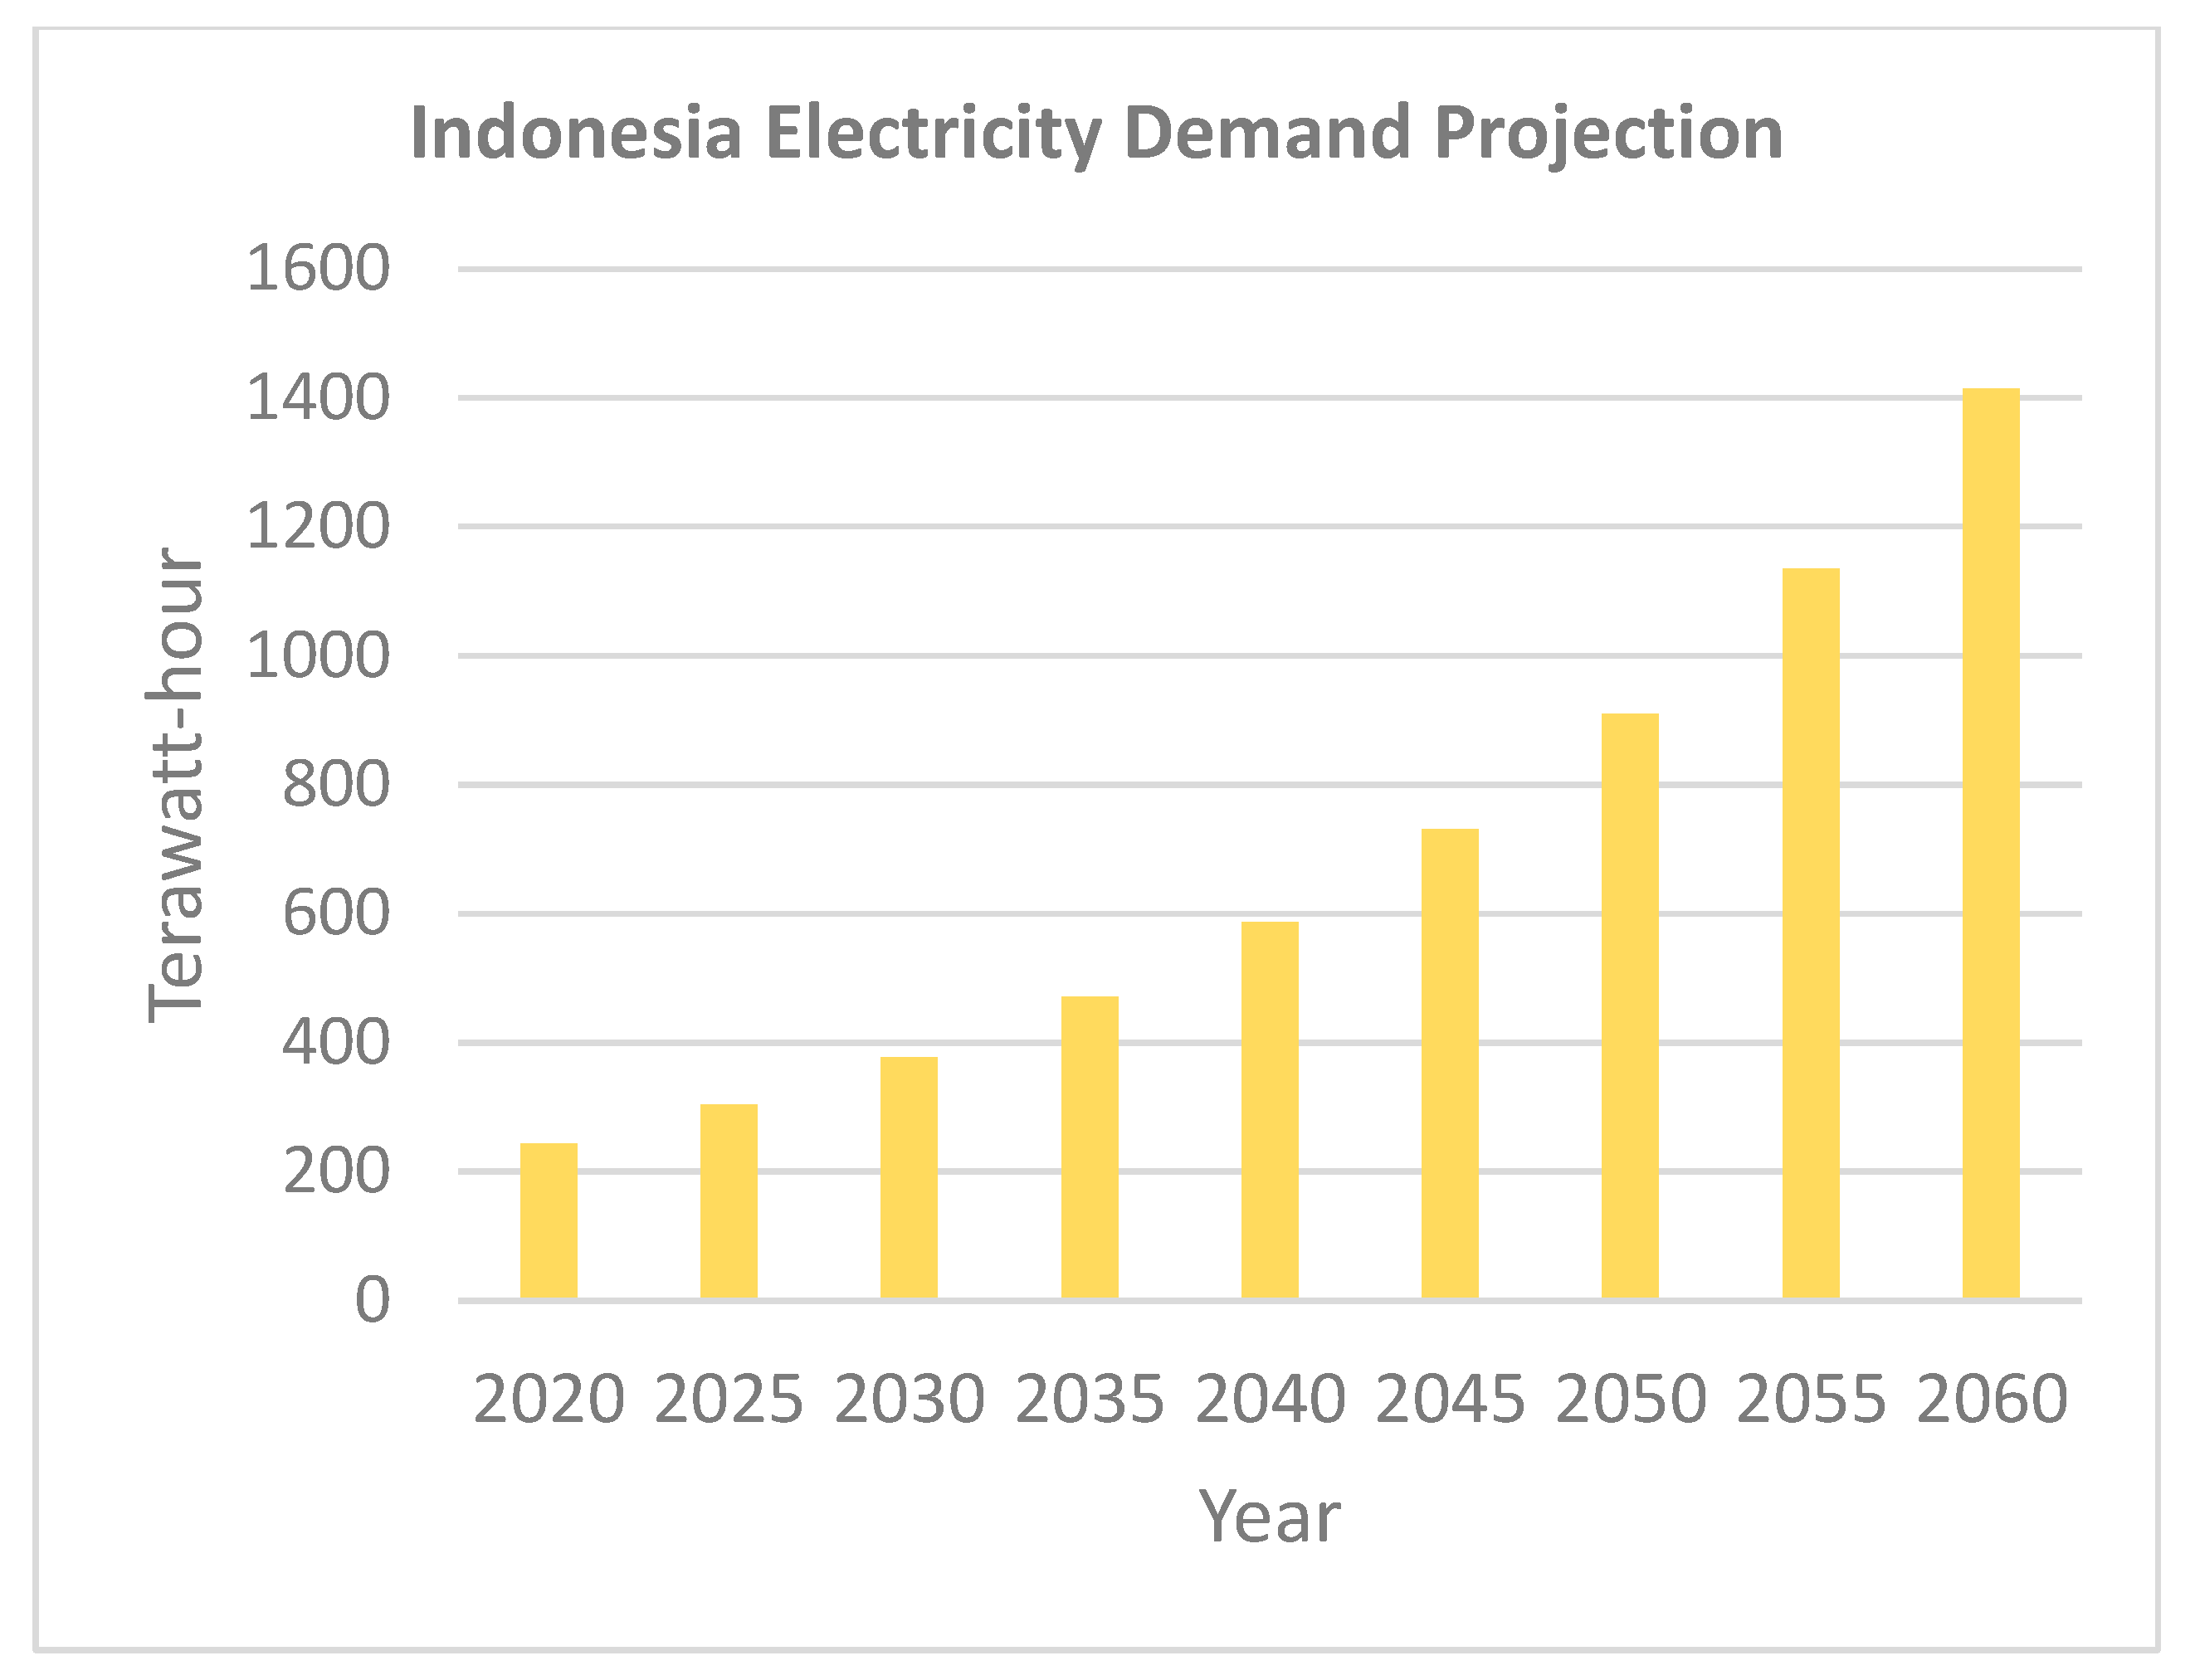
In Figure 4, Indonesia’s electricity demand is projected to reach 1413 TWh by 2060, more than five times the electricity demand in 2021. In 2060, Indonesia is expected to have a total population of 319 million person [28]; hence, the country’s per-capita energy consumption would increase to 4423 kWh/capita based on the LEAP result. This result is in line with the report published by the IEA, which states that by 2060, the energy consumption of the Indonesian population will reach 4400 kWh per capita [7]. Furthermore, more than 1500 TWh of electricity will be required to meet the demand of electricity in 2060.

4.2. Power Generation Expansion

4.2.1. Reference Scenario (REF)

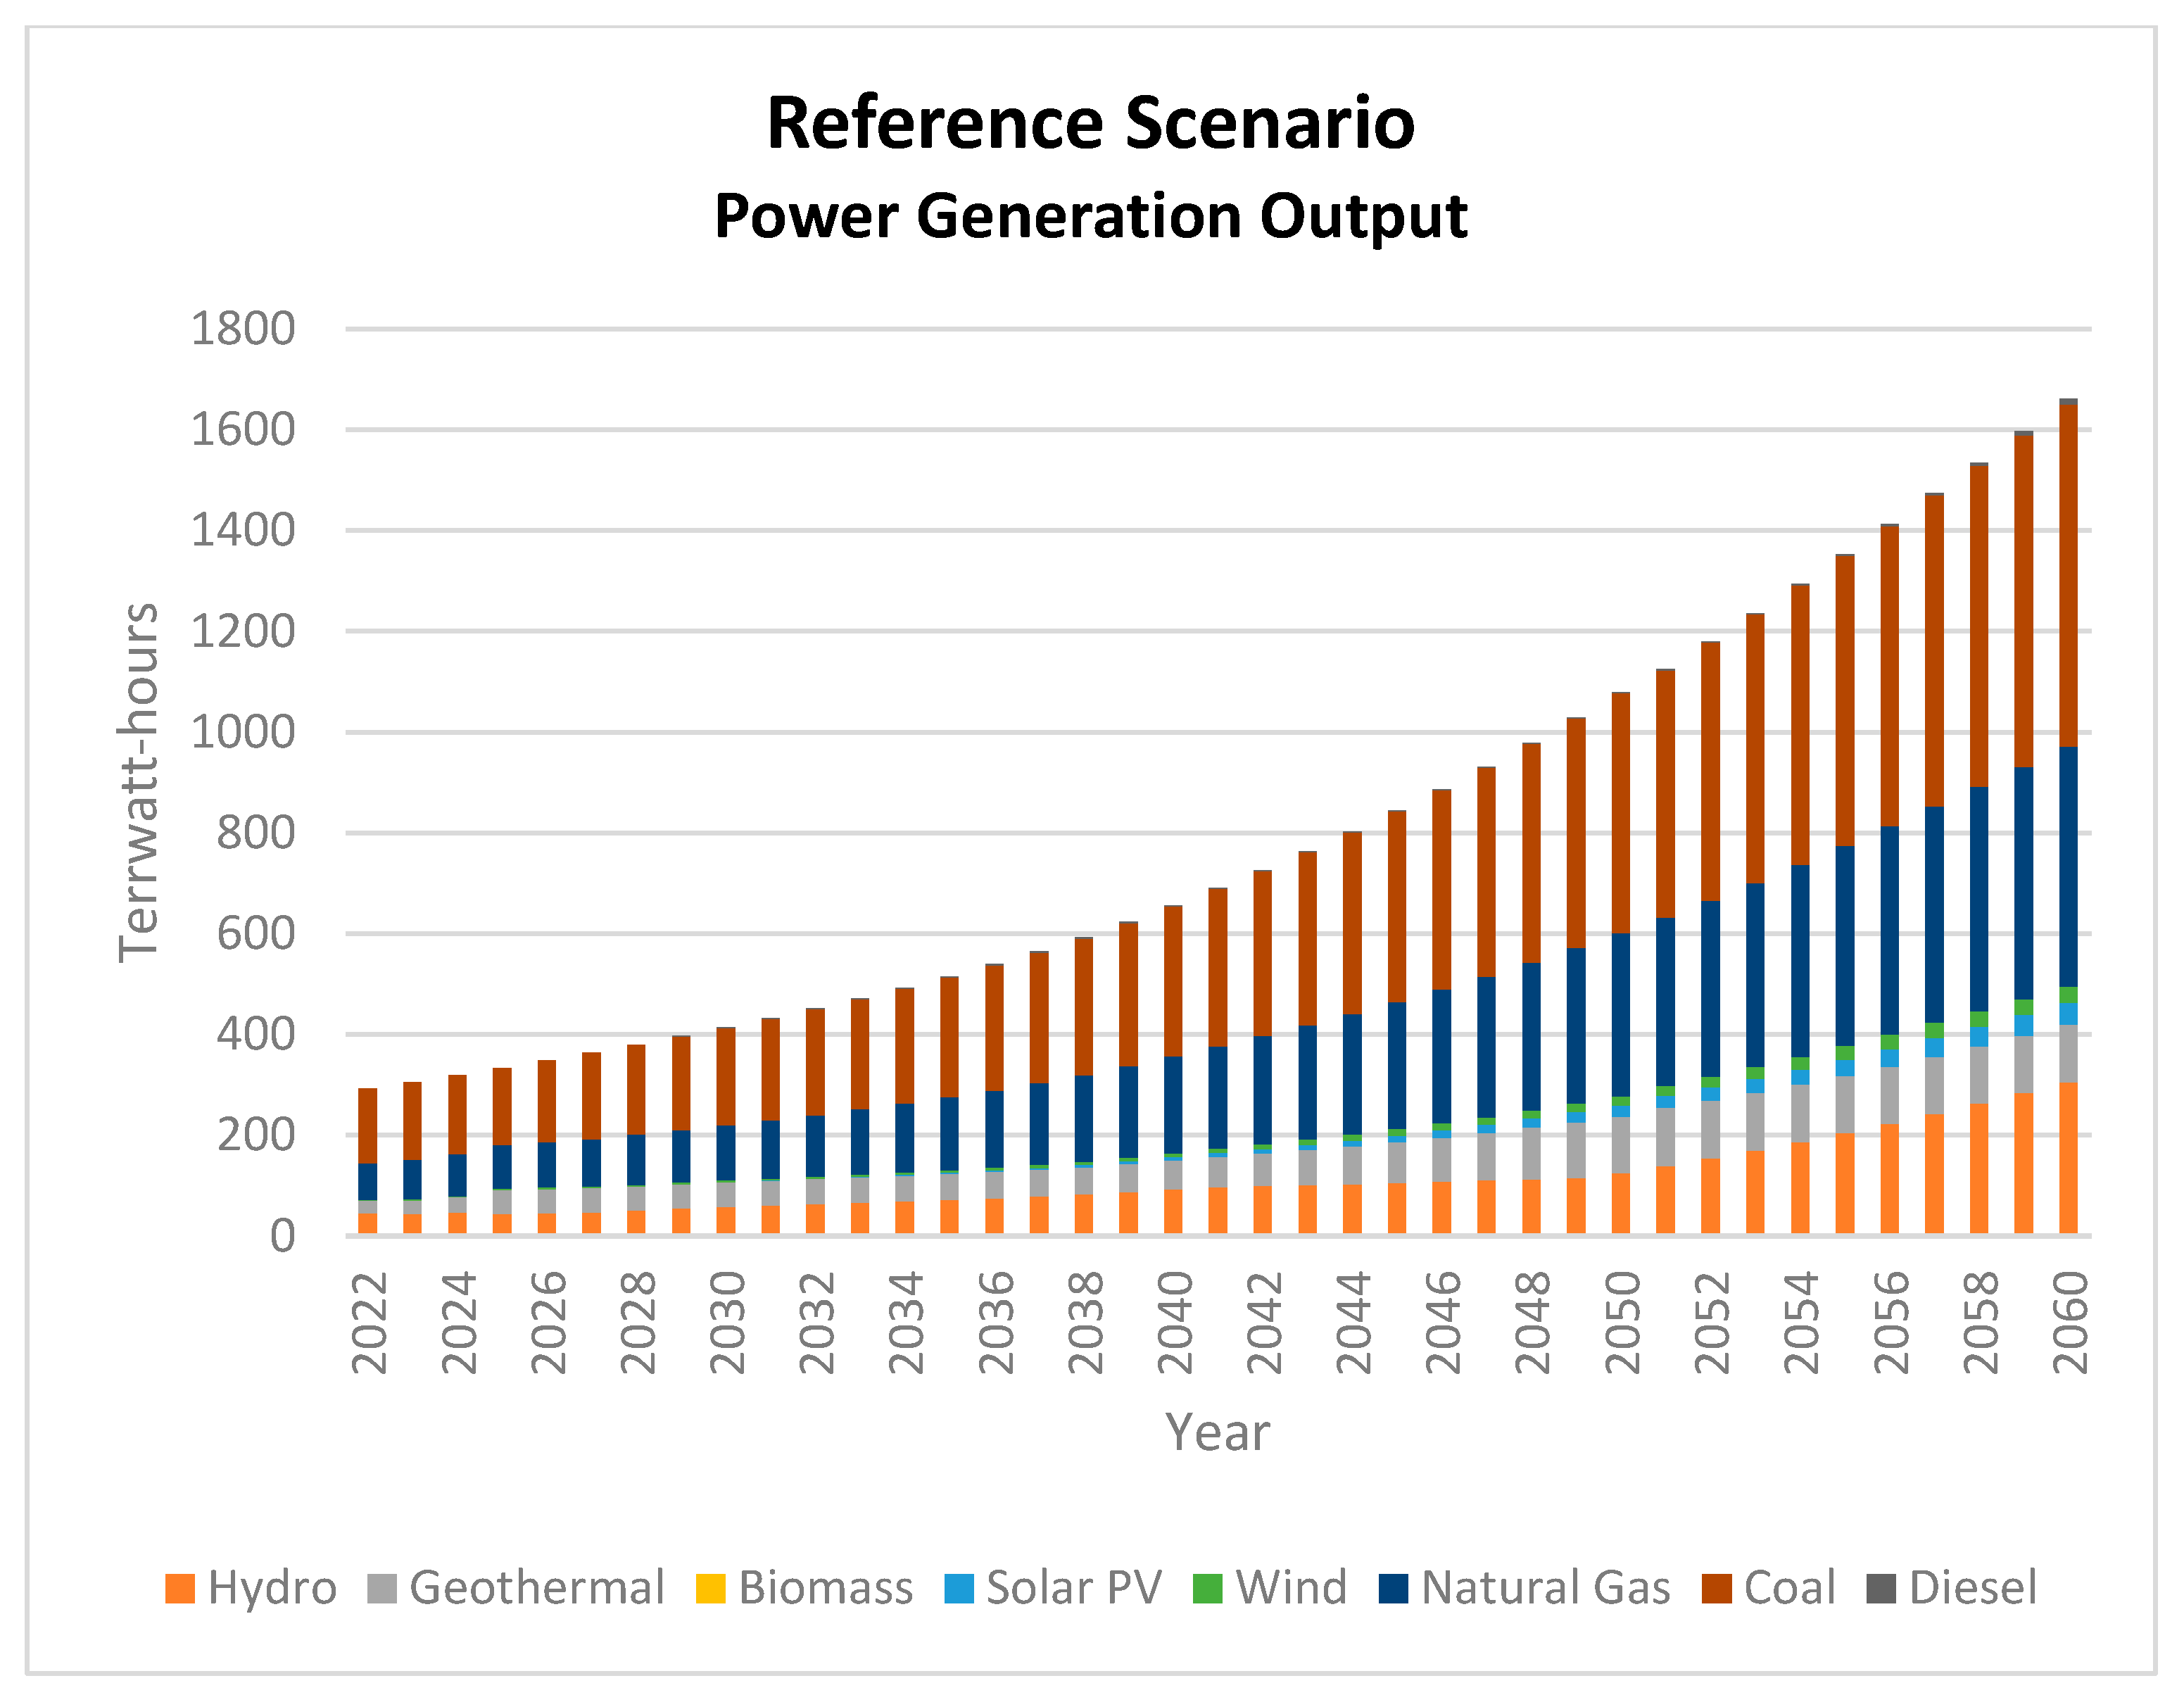
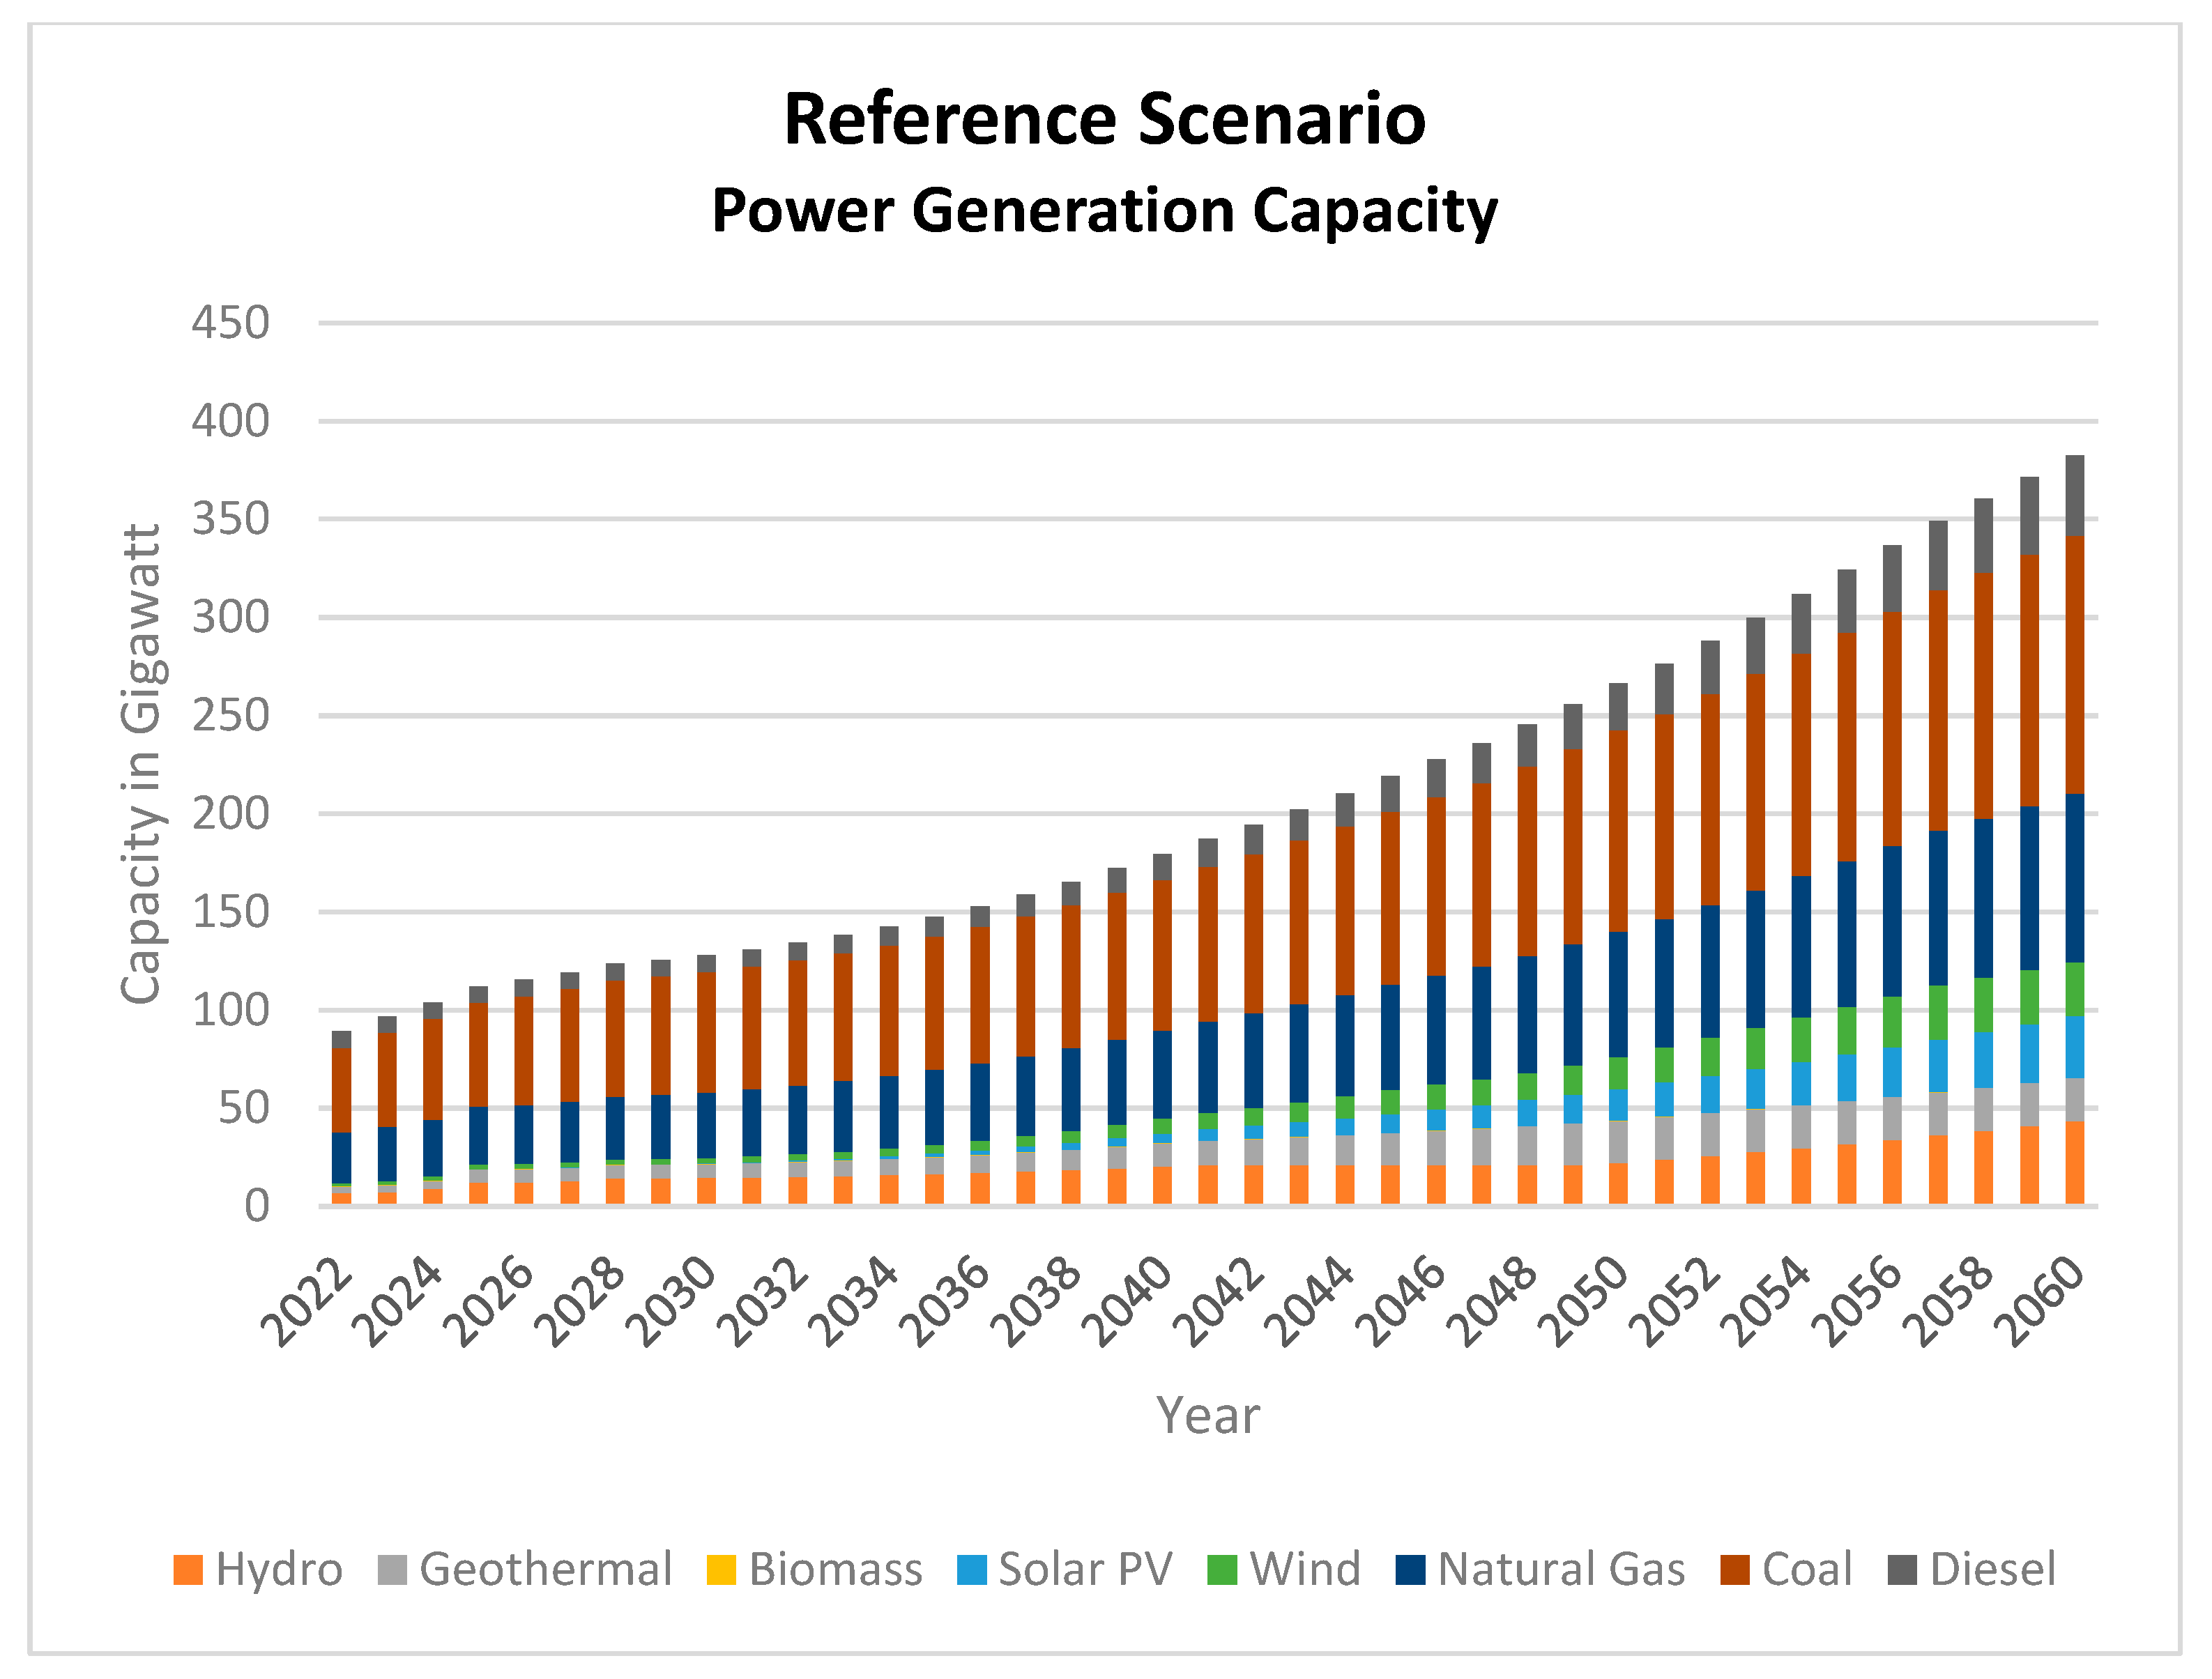
The simulation results for the REF scenario, which ignores the renewable energy target and continues to use fossil-based power plants, reveal that coal and natural gas energy will be the primary sources of energy from 2021 to 2060. The data show that total energy production is expected to increase from 413.22 TWh in 2030 to 1661.67 TWh in 2060, as can be seen in Table 3 and Figure 5. The total capacity is expected to increase from 127.80 GW in 2030 to 382.55 GW in 2060, as shown in Table 4 and Figure 6.
Throughout the simulation years, the coal power plant becomes the largest source of power in this scenario. Coal contributes more than 40% of the total energy production. Meanwhile, natural gas contributes an average of 28%, the second largest source of energy in this scenario. The share of renewable energy sources is also expected to increase, from less than 1% in 2020 to 29.75% in 2060. The largest contributor of renewable energy is hydropower, with an average output of 14%. Despite no zero-carbon energy target being specified in the REF scenario, the percentage of renewable energy in 2025 is 28.49%, and 29.75% in 2060. However, assuming that electricity production expansions will depend on the lowest-cost approach, both natural gas and coal are going to remain two of the most significant energy sources until 2060.

4.2.2. Conservative Scenario (CON)

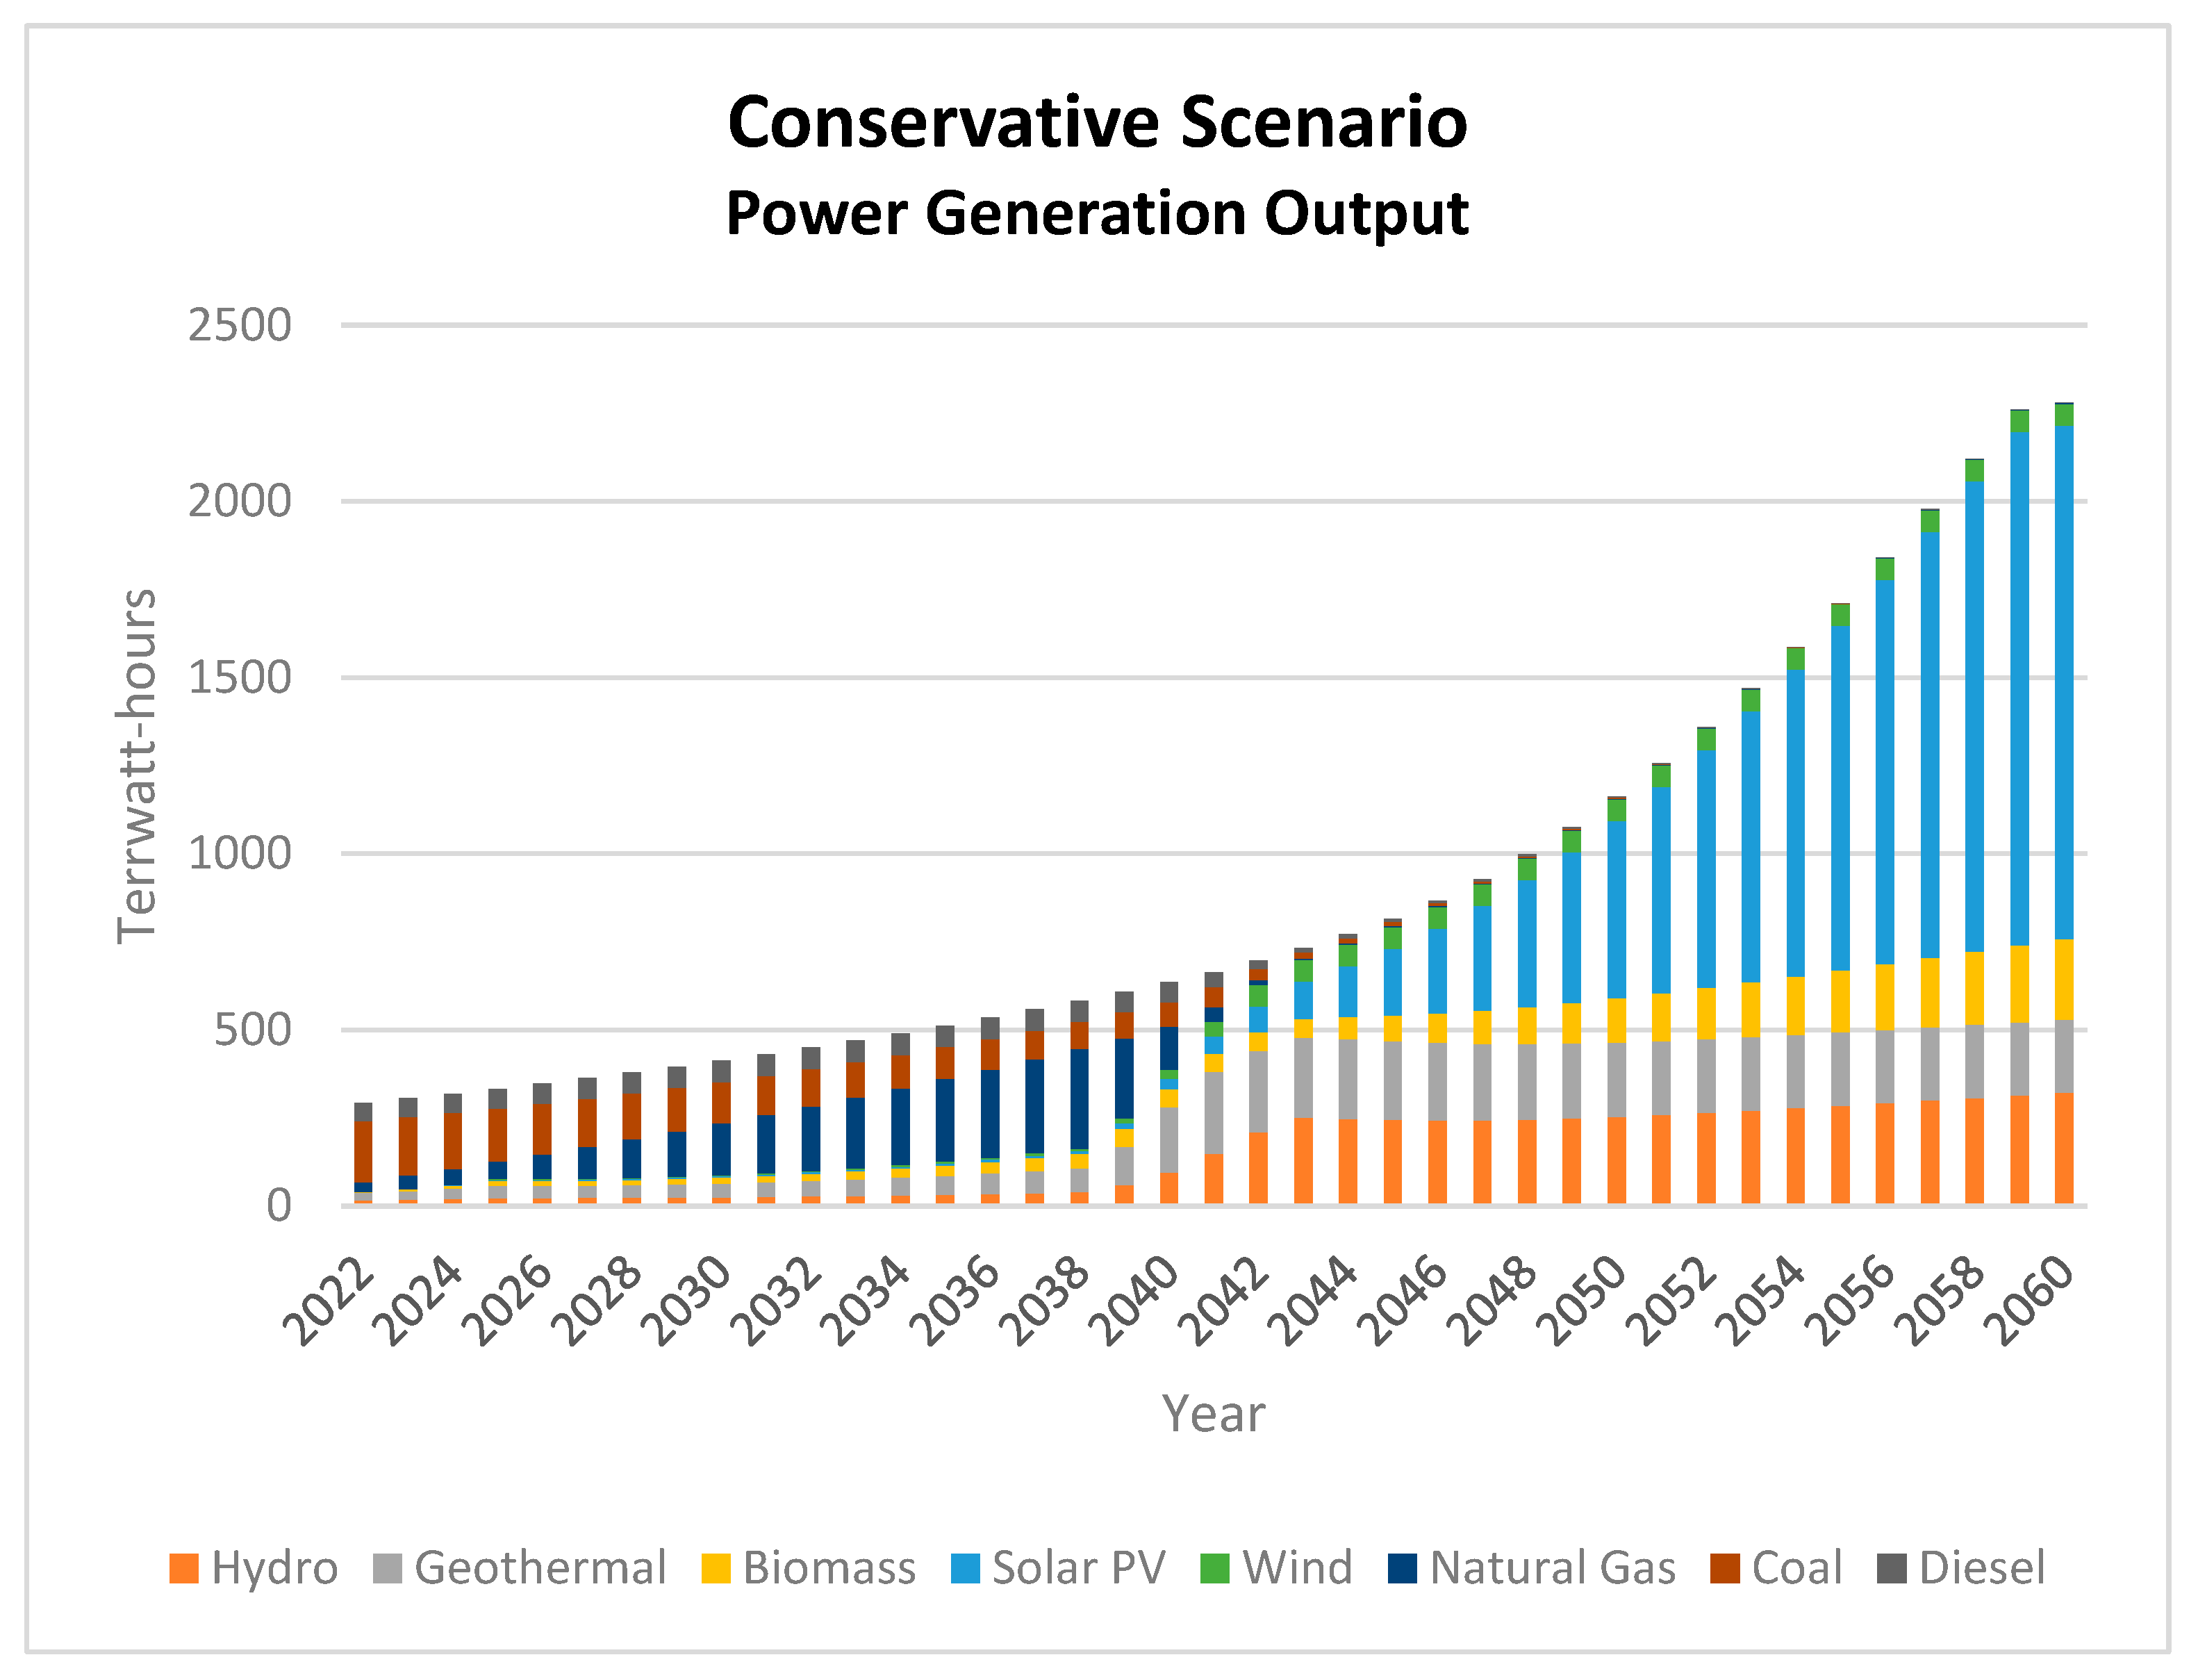
The CON scenario seeks to achieve the renewable energy goal with the use of conservative renewable energy technology, without energy storage or nuclear power. The simulation shows that the total energy production in 2060 is 2280.51 TWh, as can be seen in Table 5 and Figure 7. In the CON scenario, more than half of Indonesia’s energy will still be derived from fossil fuels in 2039, with natural gas being the prime source of energy. By 2040, fossil fuel energy will account for 39% of total energy consumption, with renewable energy accounting for the remainder. In this scenario, hydro and geothermal energy will play a significant role until 2040, after which solar energy will develop exponentially. However, in 2060, the CON scenario only achieves 99% renewable energy in the energy mix.
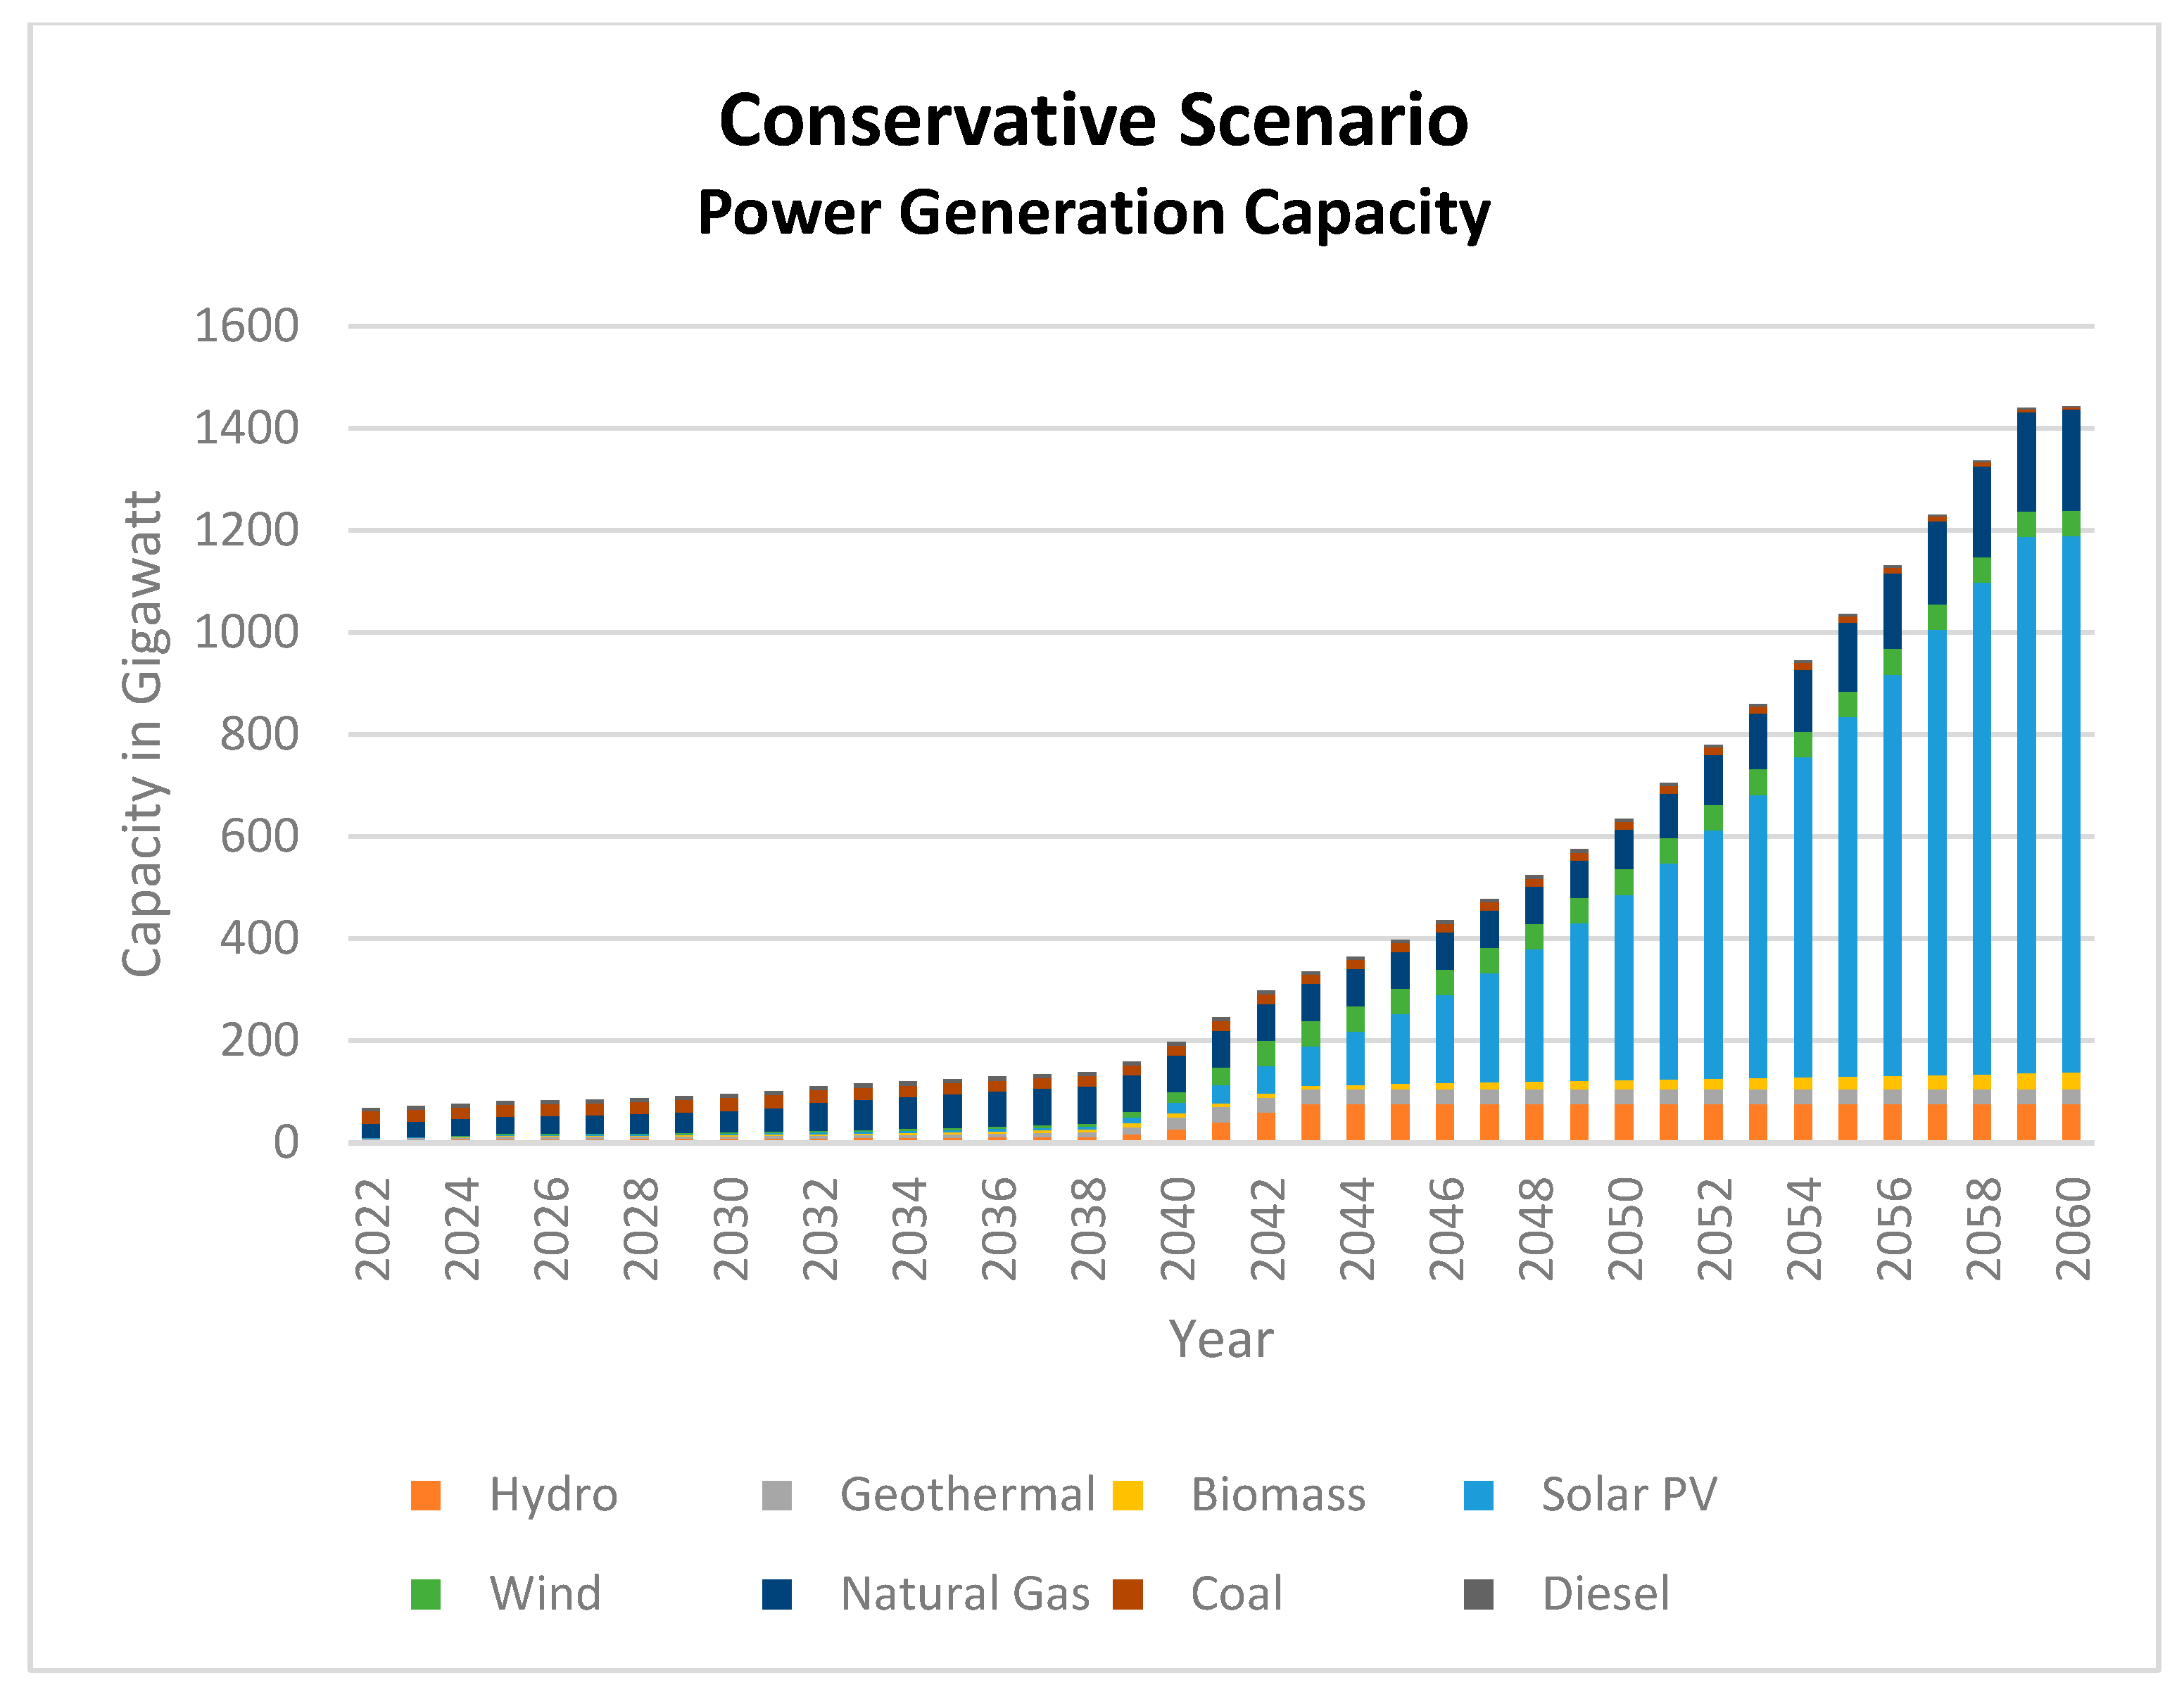
Table 6 and Figure 8 show that the CON scenario’s total electricity generation capacity in 2060 will be 1442.2 GW, or about four times that of the REF scenario. The much higher installed capacity is because 86% of the installed capacity comes from renewable energy sources, which have a lesser availability rate than fossil fuels, requiring more installed capacity to compensate for the demand. The simulation shows that even if all conventional renewable resources are fully utilized, Indonesia will fail to achieve its zero-carbon target. Therefore, Indonesia will need to find more sources of conventional renewable energy to achieve the zero-carbon goal. It is also beneficial to incorporate energy storage or nuclear power.

4.2.3. Moderate Scenario (MOD)

The MOD scenario is designed to achieve the renewable energy target by utilizing conventional technology alongside a battery energy storage system (BESS). The incorporation of energy storage allows for the optimal utilization of renewable energy power plants, even during periods of low demand. According to the simulation, the MOD scenario is capable of meeting 100% of the demand from renewable sources by 2050, a decade ahead of the 2060 target. The total power generated in 2060 is projected to reach 1688.04 TWh, as outlined in Table 7 and Figure 9. Solar energy emerges as the primary source, contributing to 65% of the total power generated, followed by hydro and geothermal energy with shares of 19.08% and 12.25%, respectively.
In terms of installed capacity, the MOD scenario predicts a total of 1339.16 GW in 2060, as presented in Table 8 and Figure 10. This capacity is significantly lower compared to the CON scenario due to the presence of energy storage. The energy storage capacity itself amounts to 299 GW, accounting for 22% of the total installed capacity. Solar capacity reaches 794.92 GW, representing 75.6% of Indonesia’s solar potential capacity. However, the capacities of hydro, geothermal, and wind energy are fully maximized, with hydro capacity at 75.0 GW, wind capacity at 46.34 GW, and geothermal capacity at 28.98 GW. This is mainly due to the high investment costs and limited availability of other renewable energy sources, making hydro and geothermal energy more favorable options. Additionally, there is still a provision for fossil fuel backup power plants, including natural gas, coal, and diesel, totaling 94.63 GW, which accounts for approximately 7% of the total installed capacity.

4.2.4. Progressive Scenario (PRO)

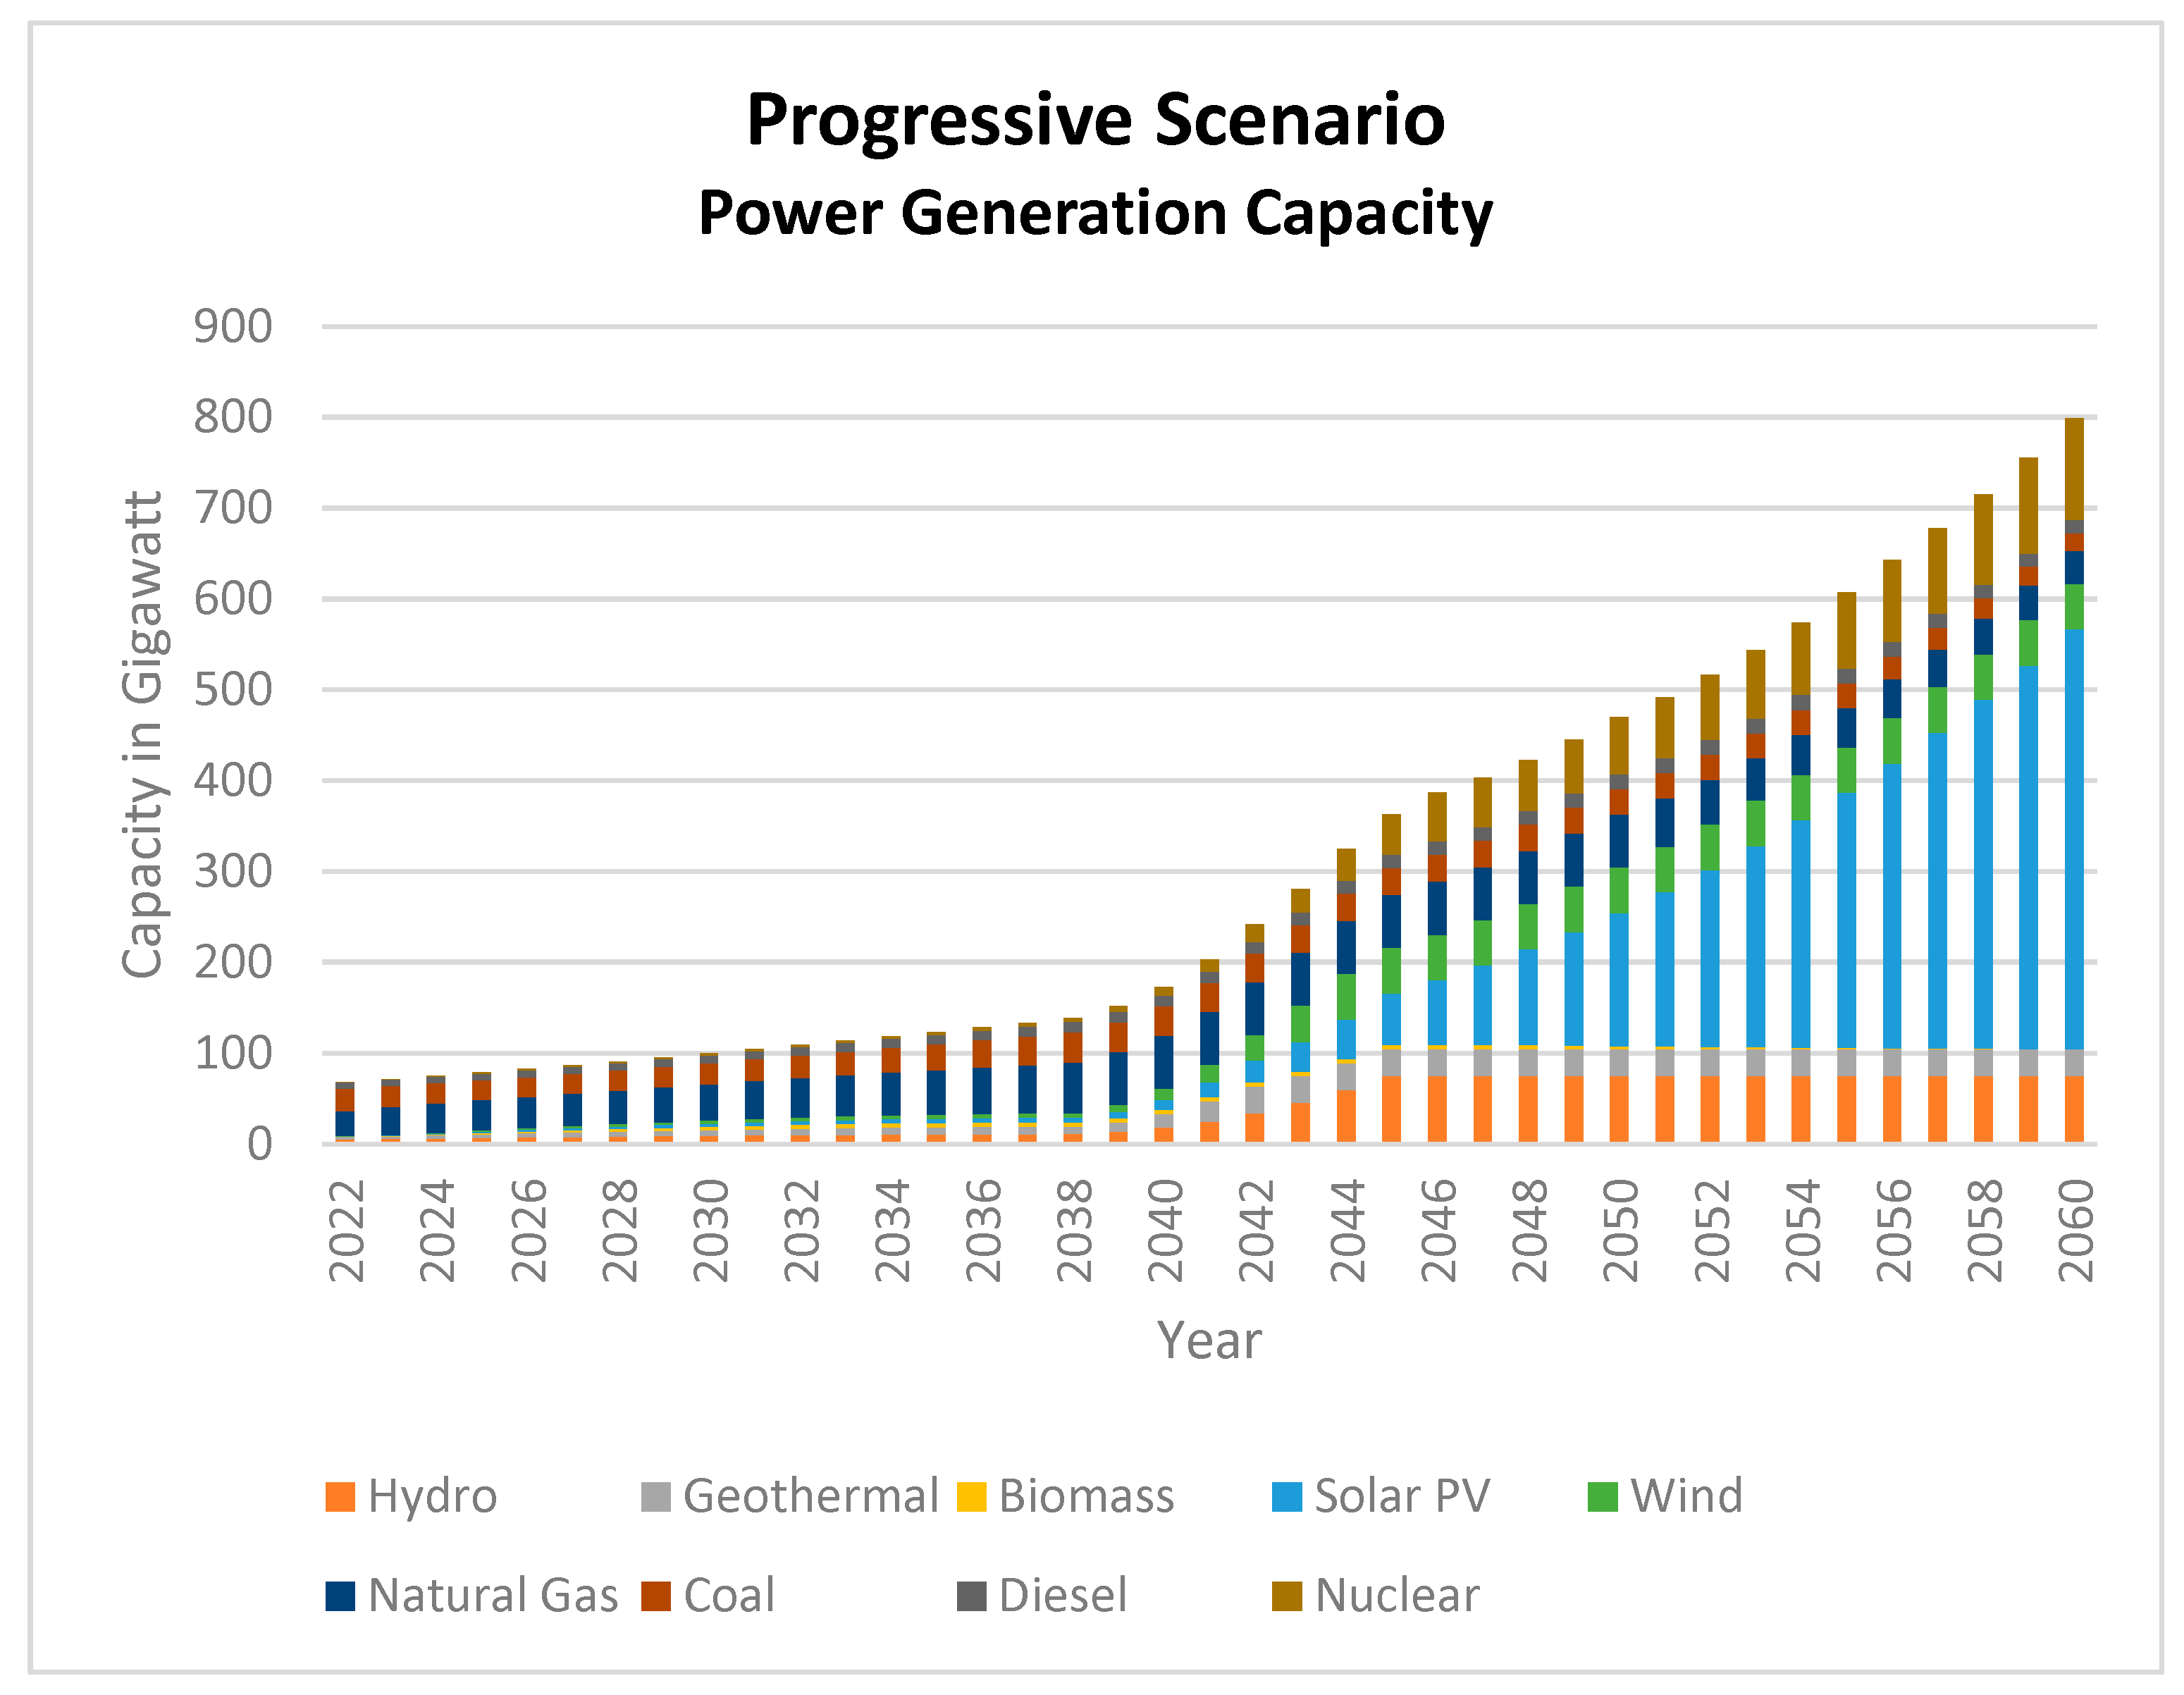
The PRO scenario aims to achieve complete reliance on renewable energy by 2060 through the use of conventional technology and nuclear power, without incorporating energy storage. In the PRO scenario, it is possible to achieve zero carbon emissions by 2060. The simulation results indicate that the inclusion of nuclear power significantly reduces the total capacity needed for electricity generation. In 2060, the power generation capacity is 798.91 GW, as shown in Table 9 and Figure 11. The capacity of nuclear power plants is 112.32 GW, which accounts for approximately 14% of the total capacity.
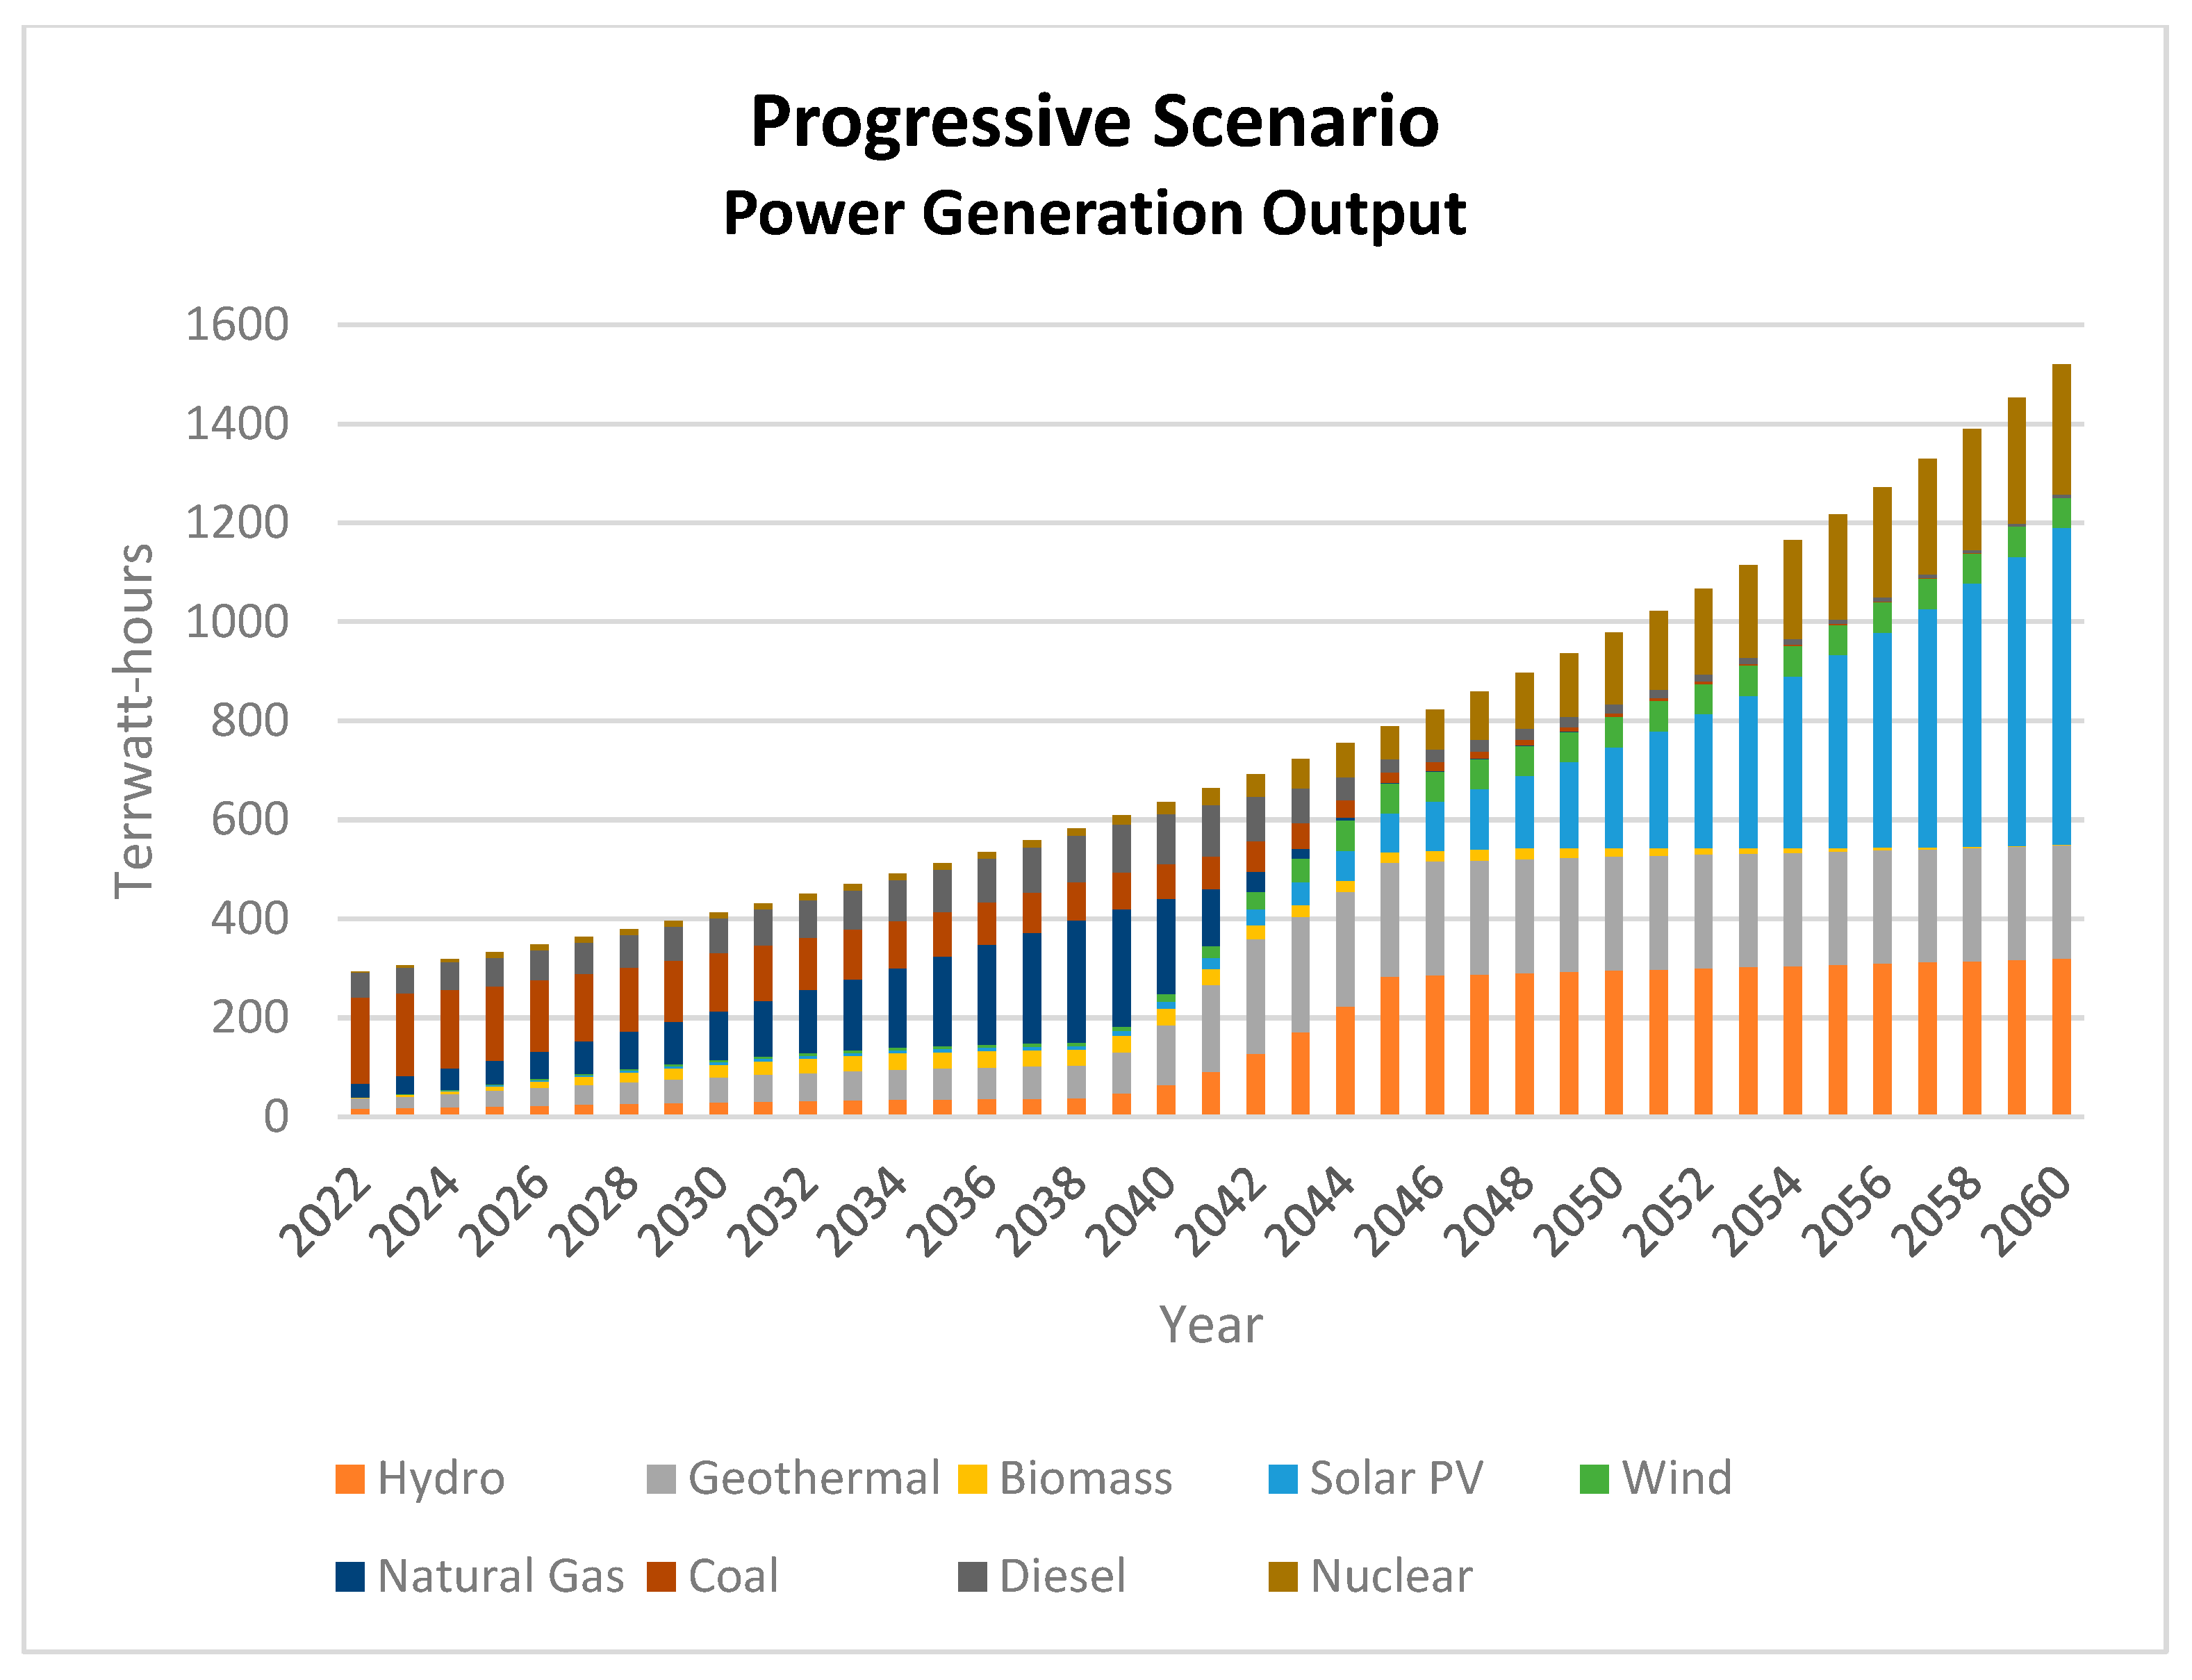
In 2060, the total energy production in the PRO scenario will be 1520.32 TWh. Although the nuclear capacity represents only 14% of the total installed capacity, it contributes to 17.32% of the power generated in 2060, as depicted in Table 10 and Figure 12. On the other hand, the solar capacity is 461.64 GW, equivalent to 43.8% of Indonesia’s solar potential capacity. Together, solar and nuclear power account for 59.4% of the total power output in 2060. In this scenario, even with the inclusion of nuclear power, the hydro, geothermal, and wind energy sources are fully utilized to their maximum potential capacity. This indicates that these types of energy sources offer the highest output per investment cost, even when compared to nuclear power.

4.2.5. Advanced Scenario (ADV)

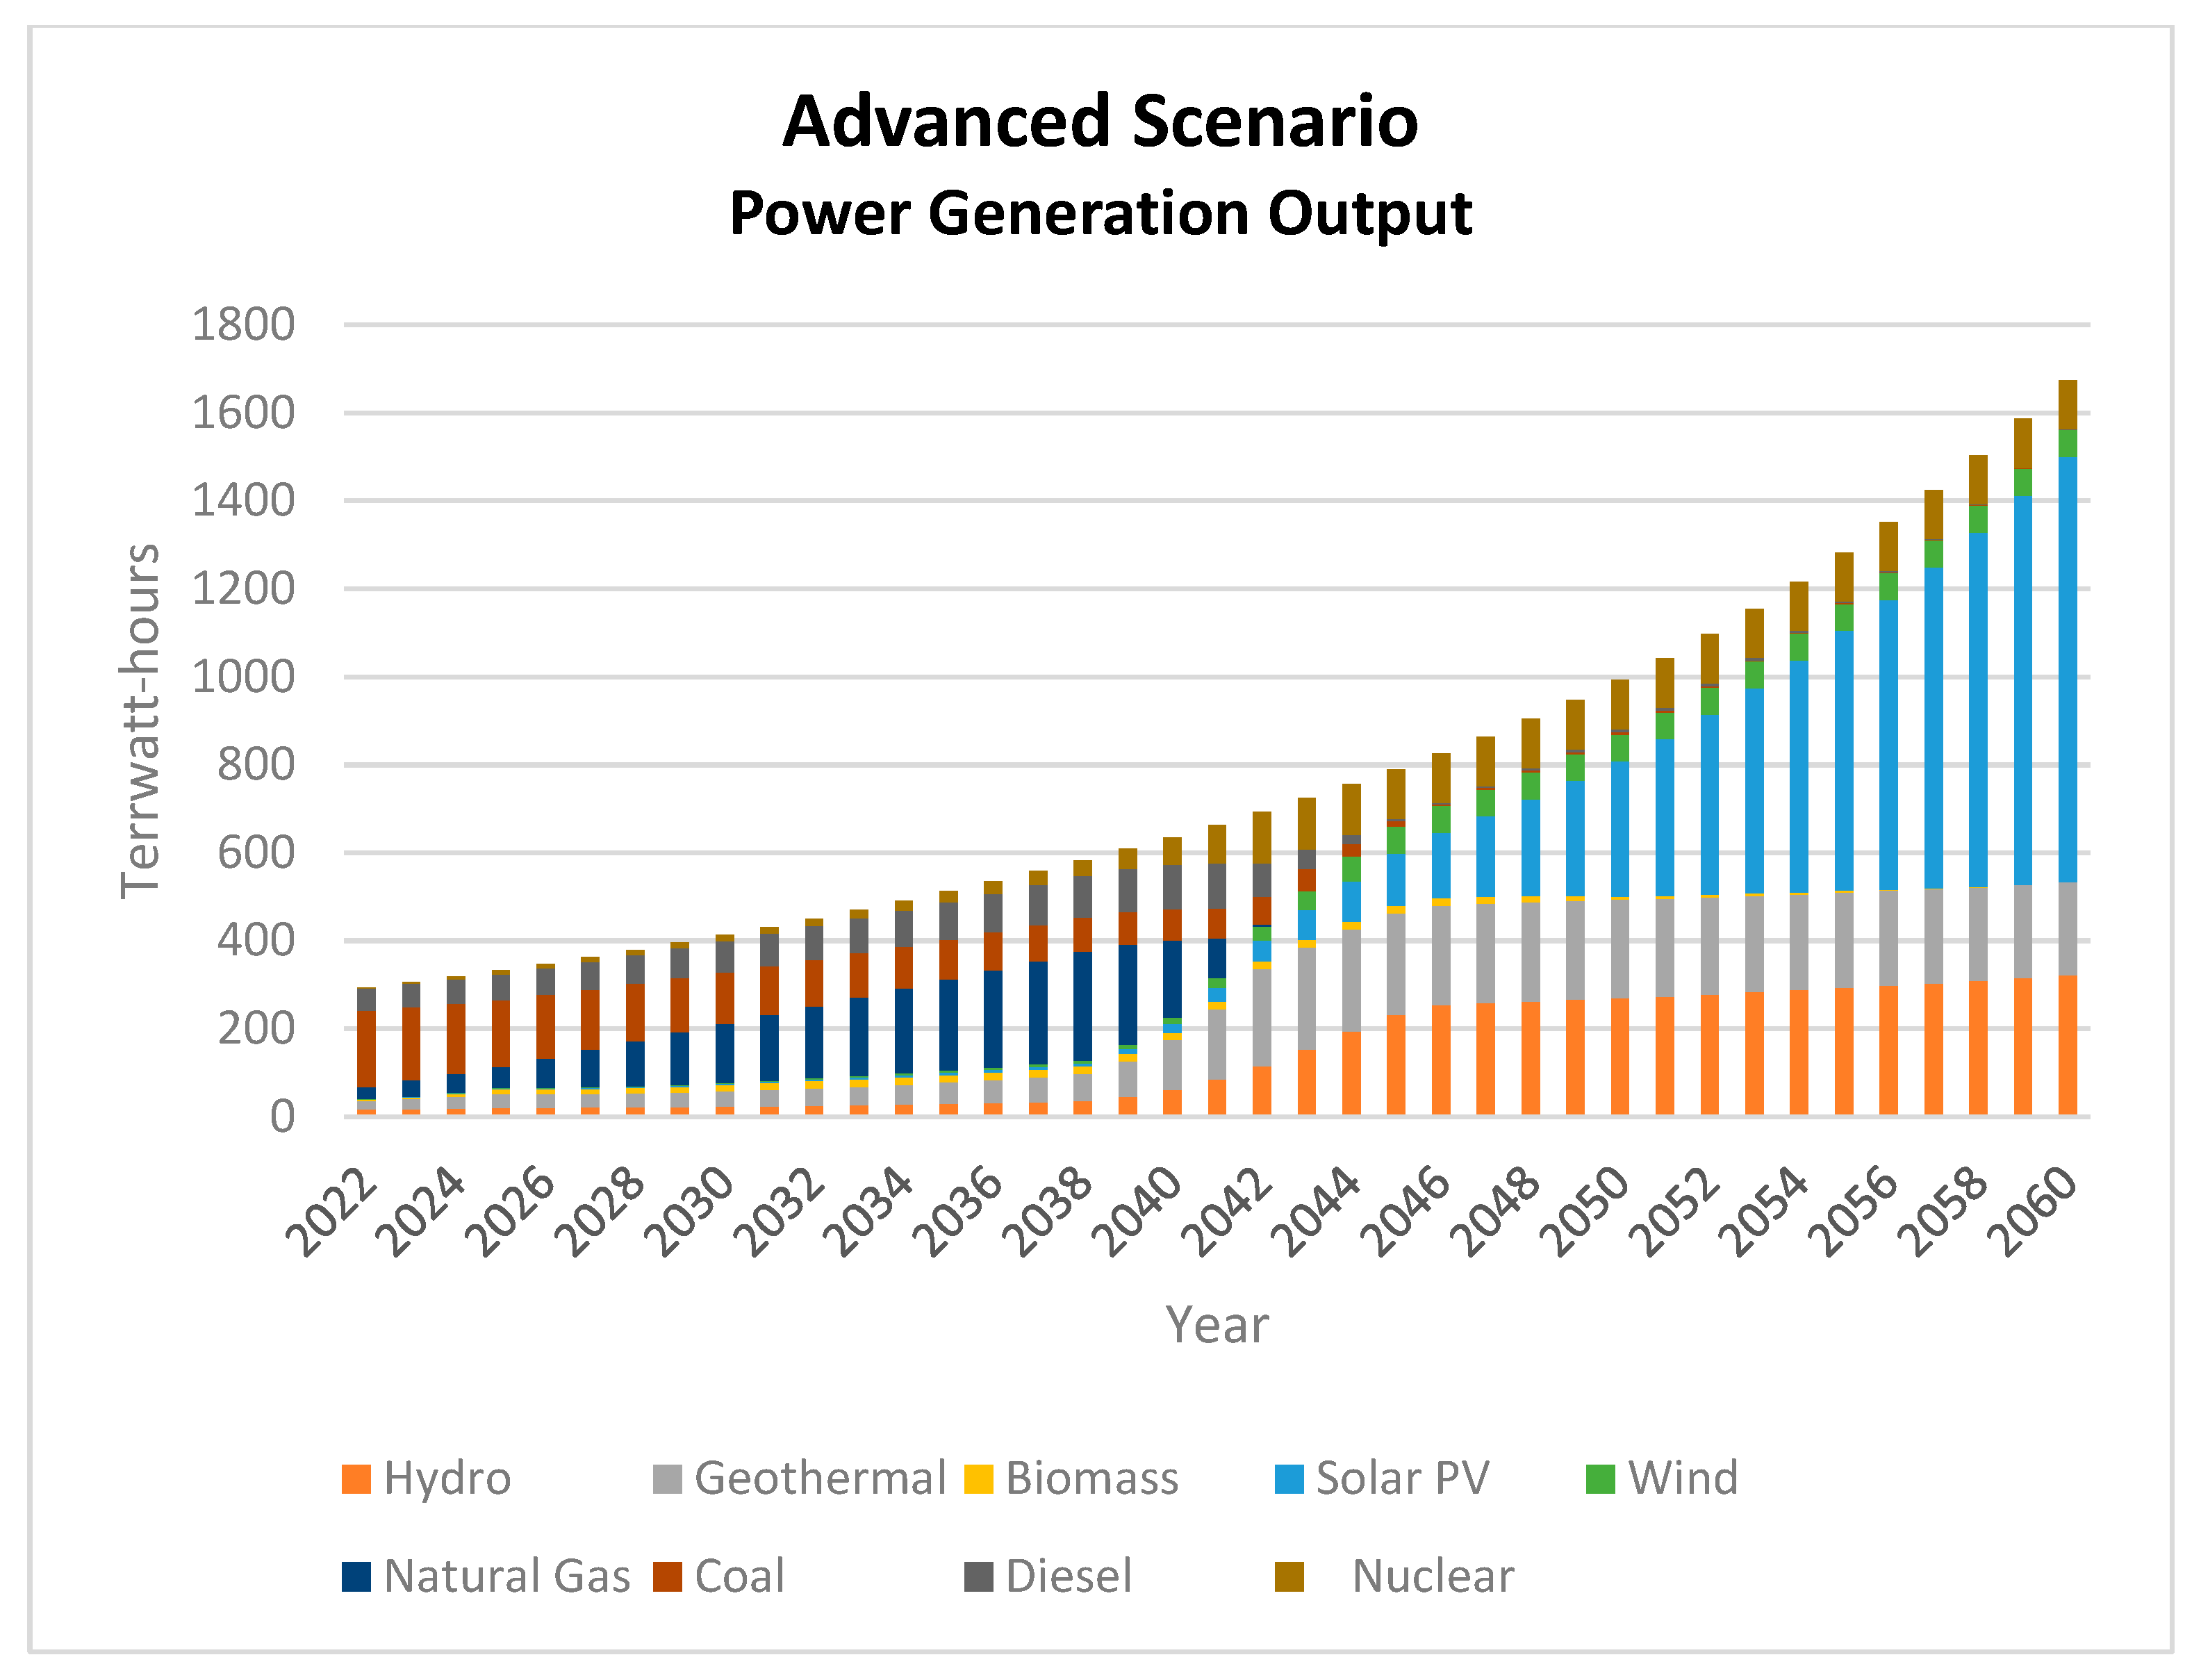
The ADV scenario employs conventional technologies, nuclear power and battery energy storage (BESS), to achieve complete reliance on clean energy by 2060. In 2060, the electricity generation output in the ADV scenario is projected to reach 1674.13 TWh, as shown in Table 11 and Figure 13. Solar power dominates the output, accounting for 57.76% of the total power generated. It is followed by hydro at 19.24%, geothermal at 12.57%, wind at 3.66%, and nuclear power at 6.62%. Output from natural gas, coal, biomass, and diesel is negligible, each contributing less than 0.01%. The incorporation of energy storage has resulted in increased output from solar energy while reducing the output from other renewable energy sources.
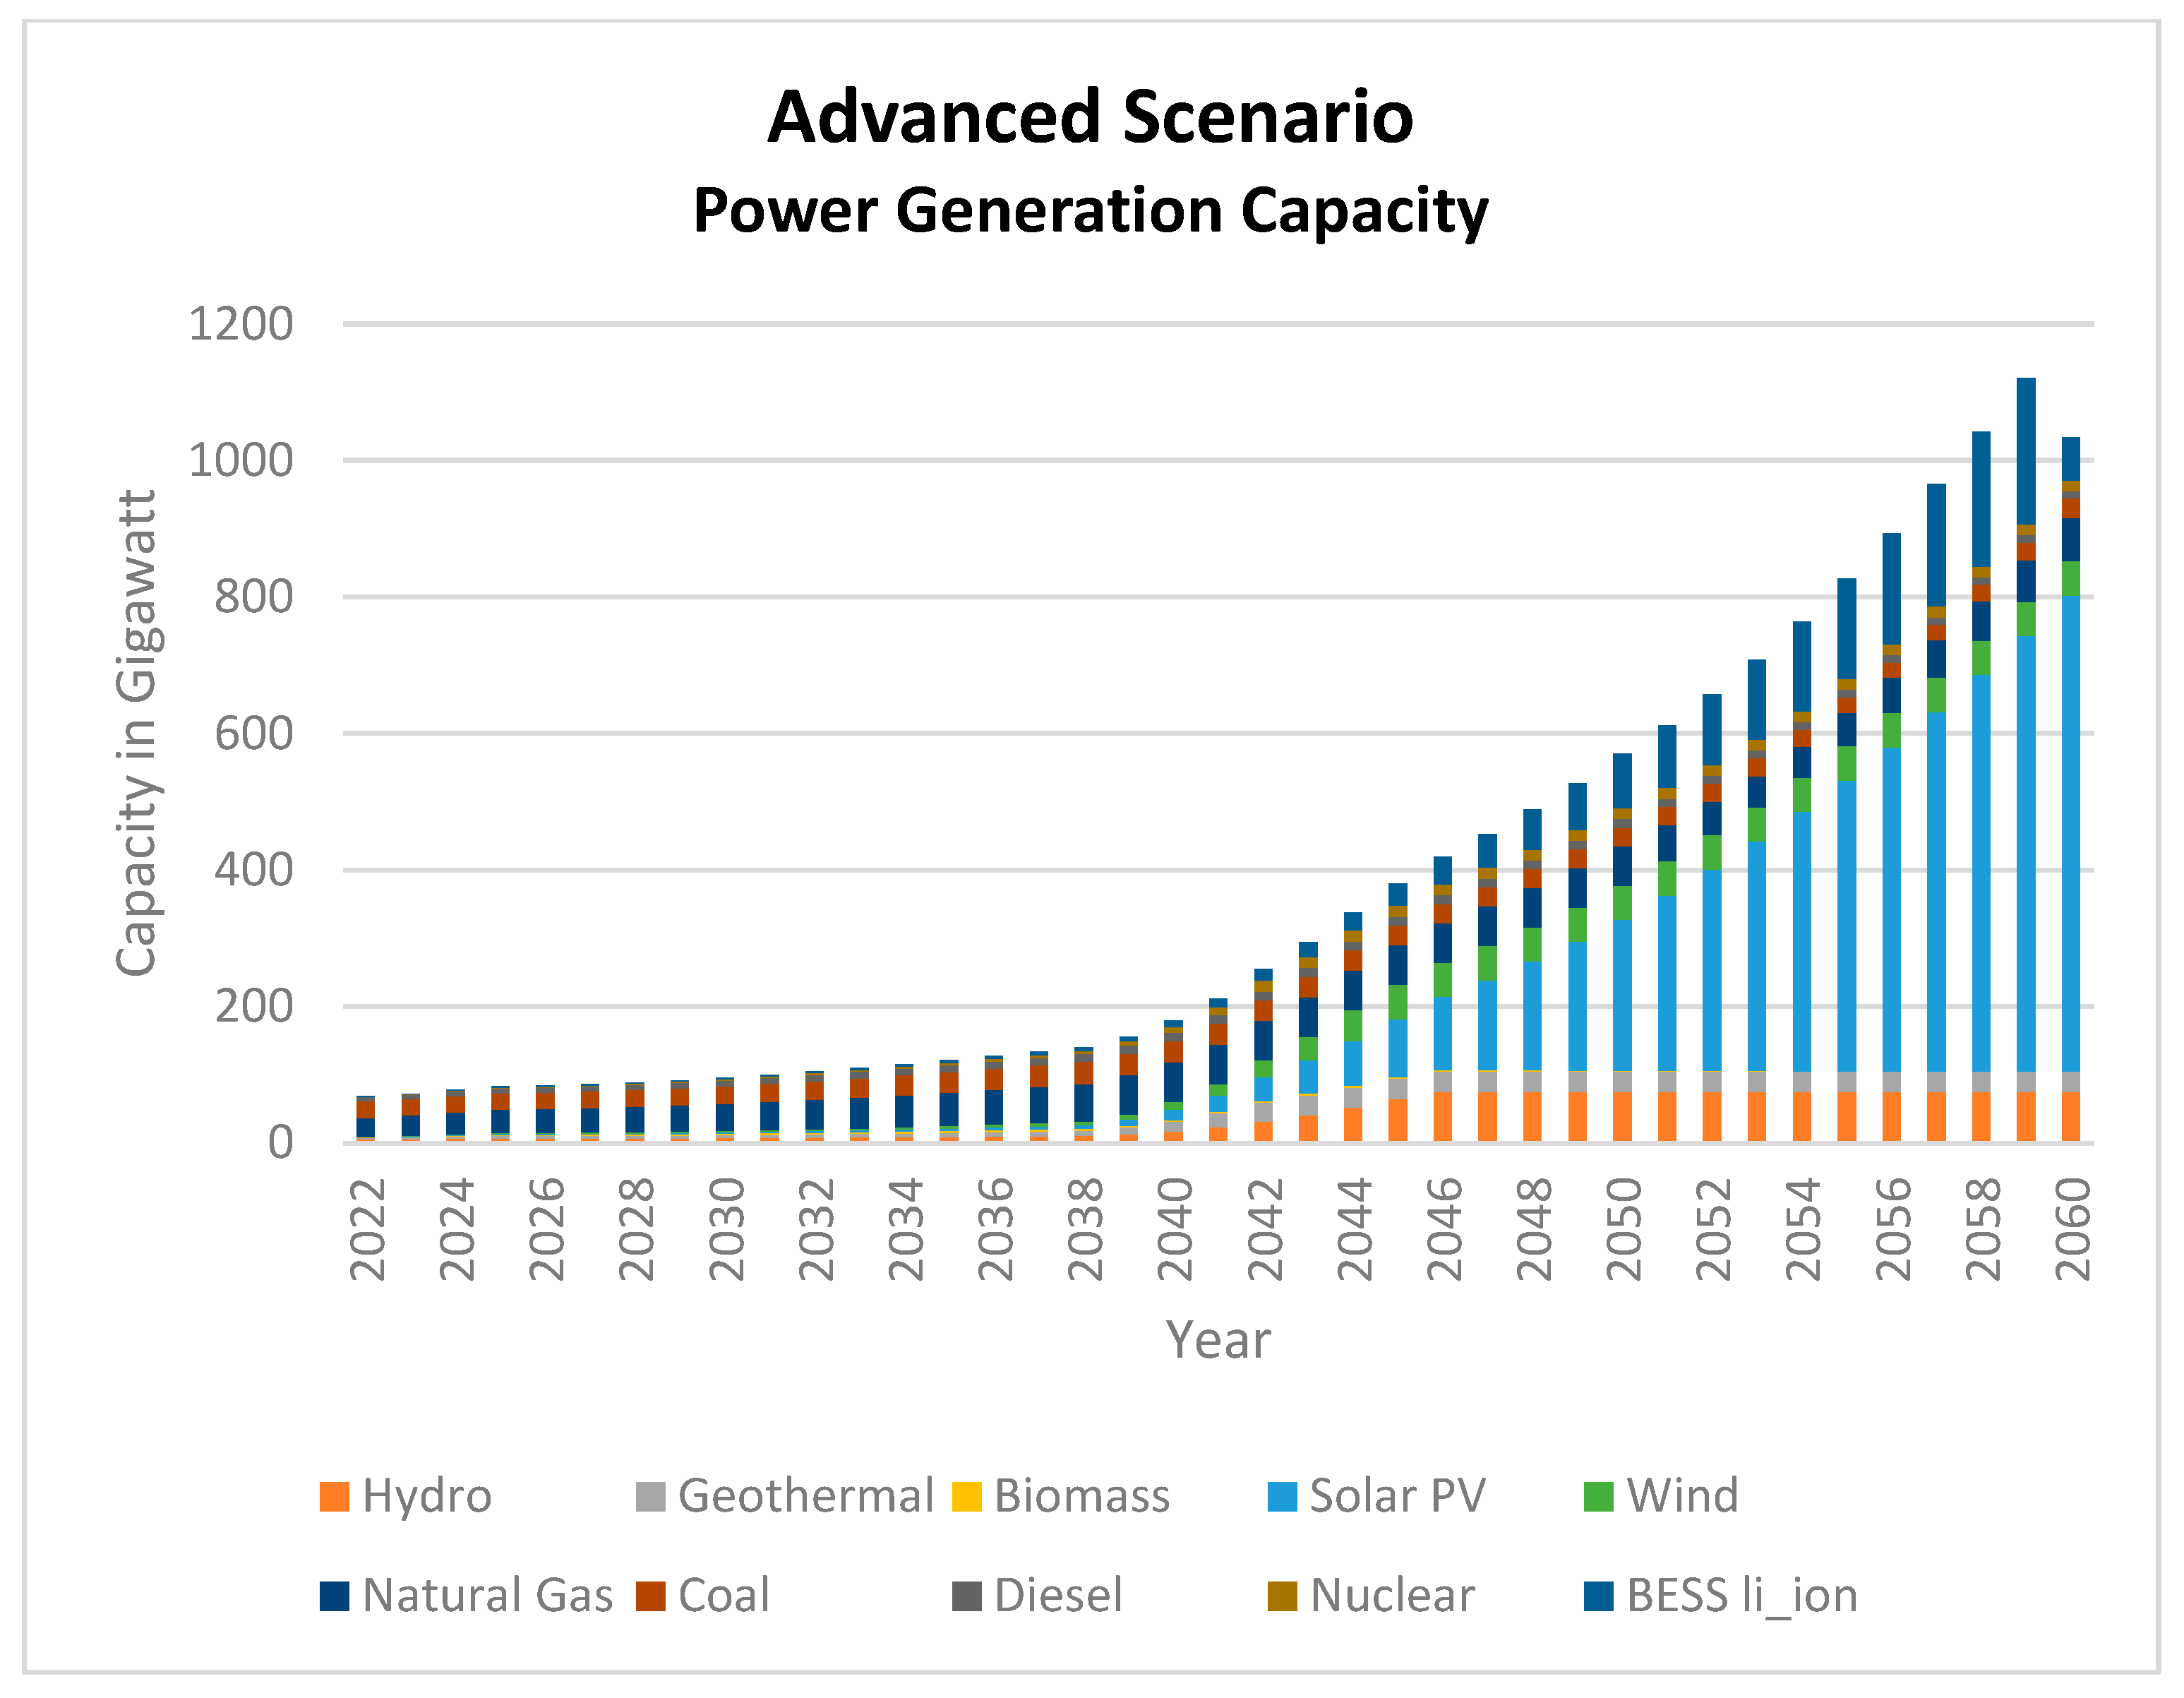
The total capacity required for electricity generation in the ADV scenario is 1034.25 GW, as depicted in Table 12 and Figure 14. Within this setup, solar power has a capacity of 697.88 GW, nuclear power has a capacity of 15.69 GW, and battery storage has a capacity of 63 GW. Compared to the PRO scenario, the ADV scenario exhibits a 30% higher total installed capacity. However, the nuclear power capacity is significantly lower at 15.69 GW compared to 112 GW in the PRO scenario. This smaller nuclear capacity in the ADV scenario makes it more manageable for construction purposes.
The ADV scenario’s electricity generation output in 2060 will be 1674.13 TWh. The energy mix in 2060 consists of hydro (19.24%), geothermal (12.57%), biomass (0.05%), solar (57.76%), wind (3.66%), natural gas (0.00%), coal (0.04%), diesel (0.05%), and nuclear (6.62%), as in Table 11 and Figure 13. Meanwhile, in 2060, the total capacity will be 1034.25 GW which consists of hydro (75.00 GW), geothermal (29.50 GW), biomass (0.12 GW), solar (697.88 GW), wind (50.00 GW), natural gas (63.85 GW), coal (28.46 GW), diesel (10.75 GW), nuclear (15.69 GW), and BESS (63.00 GW), as shown on Table 12 and Figure 14.

4.3. Investment Cost

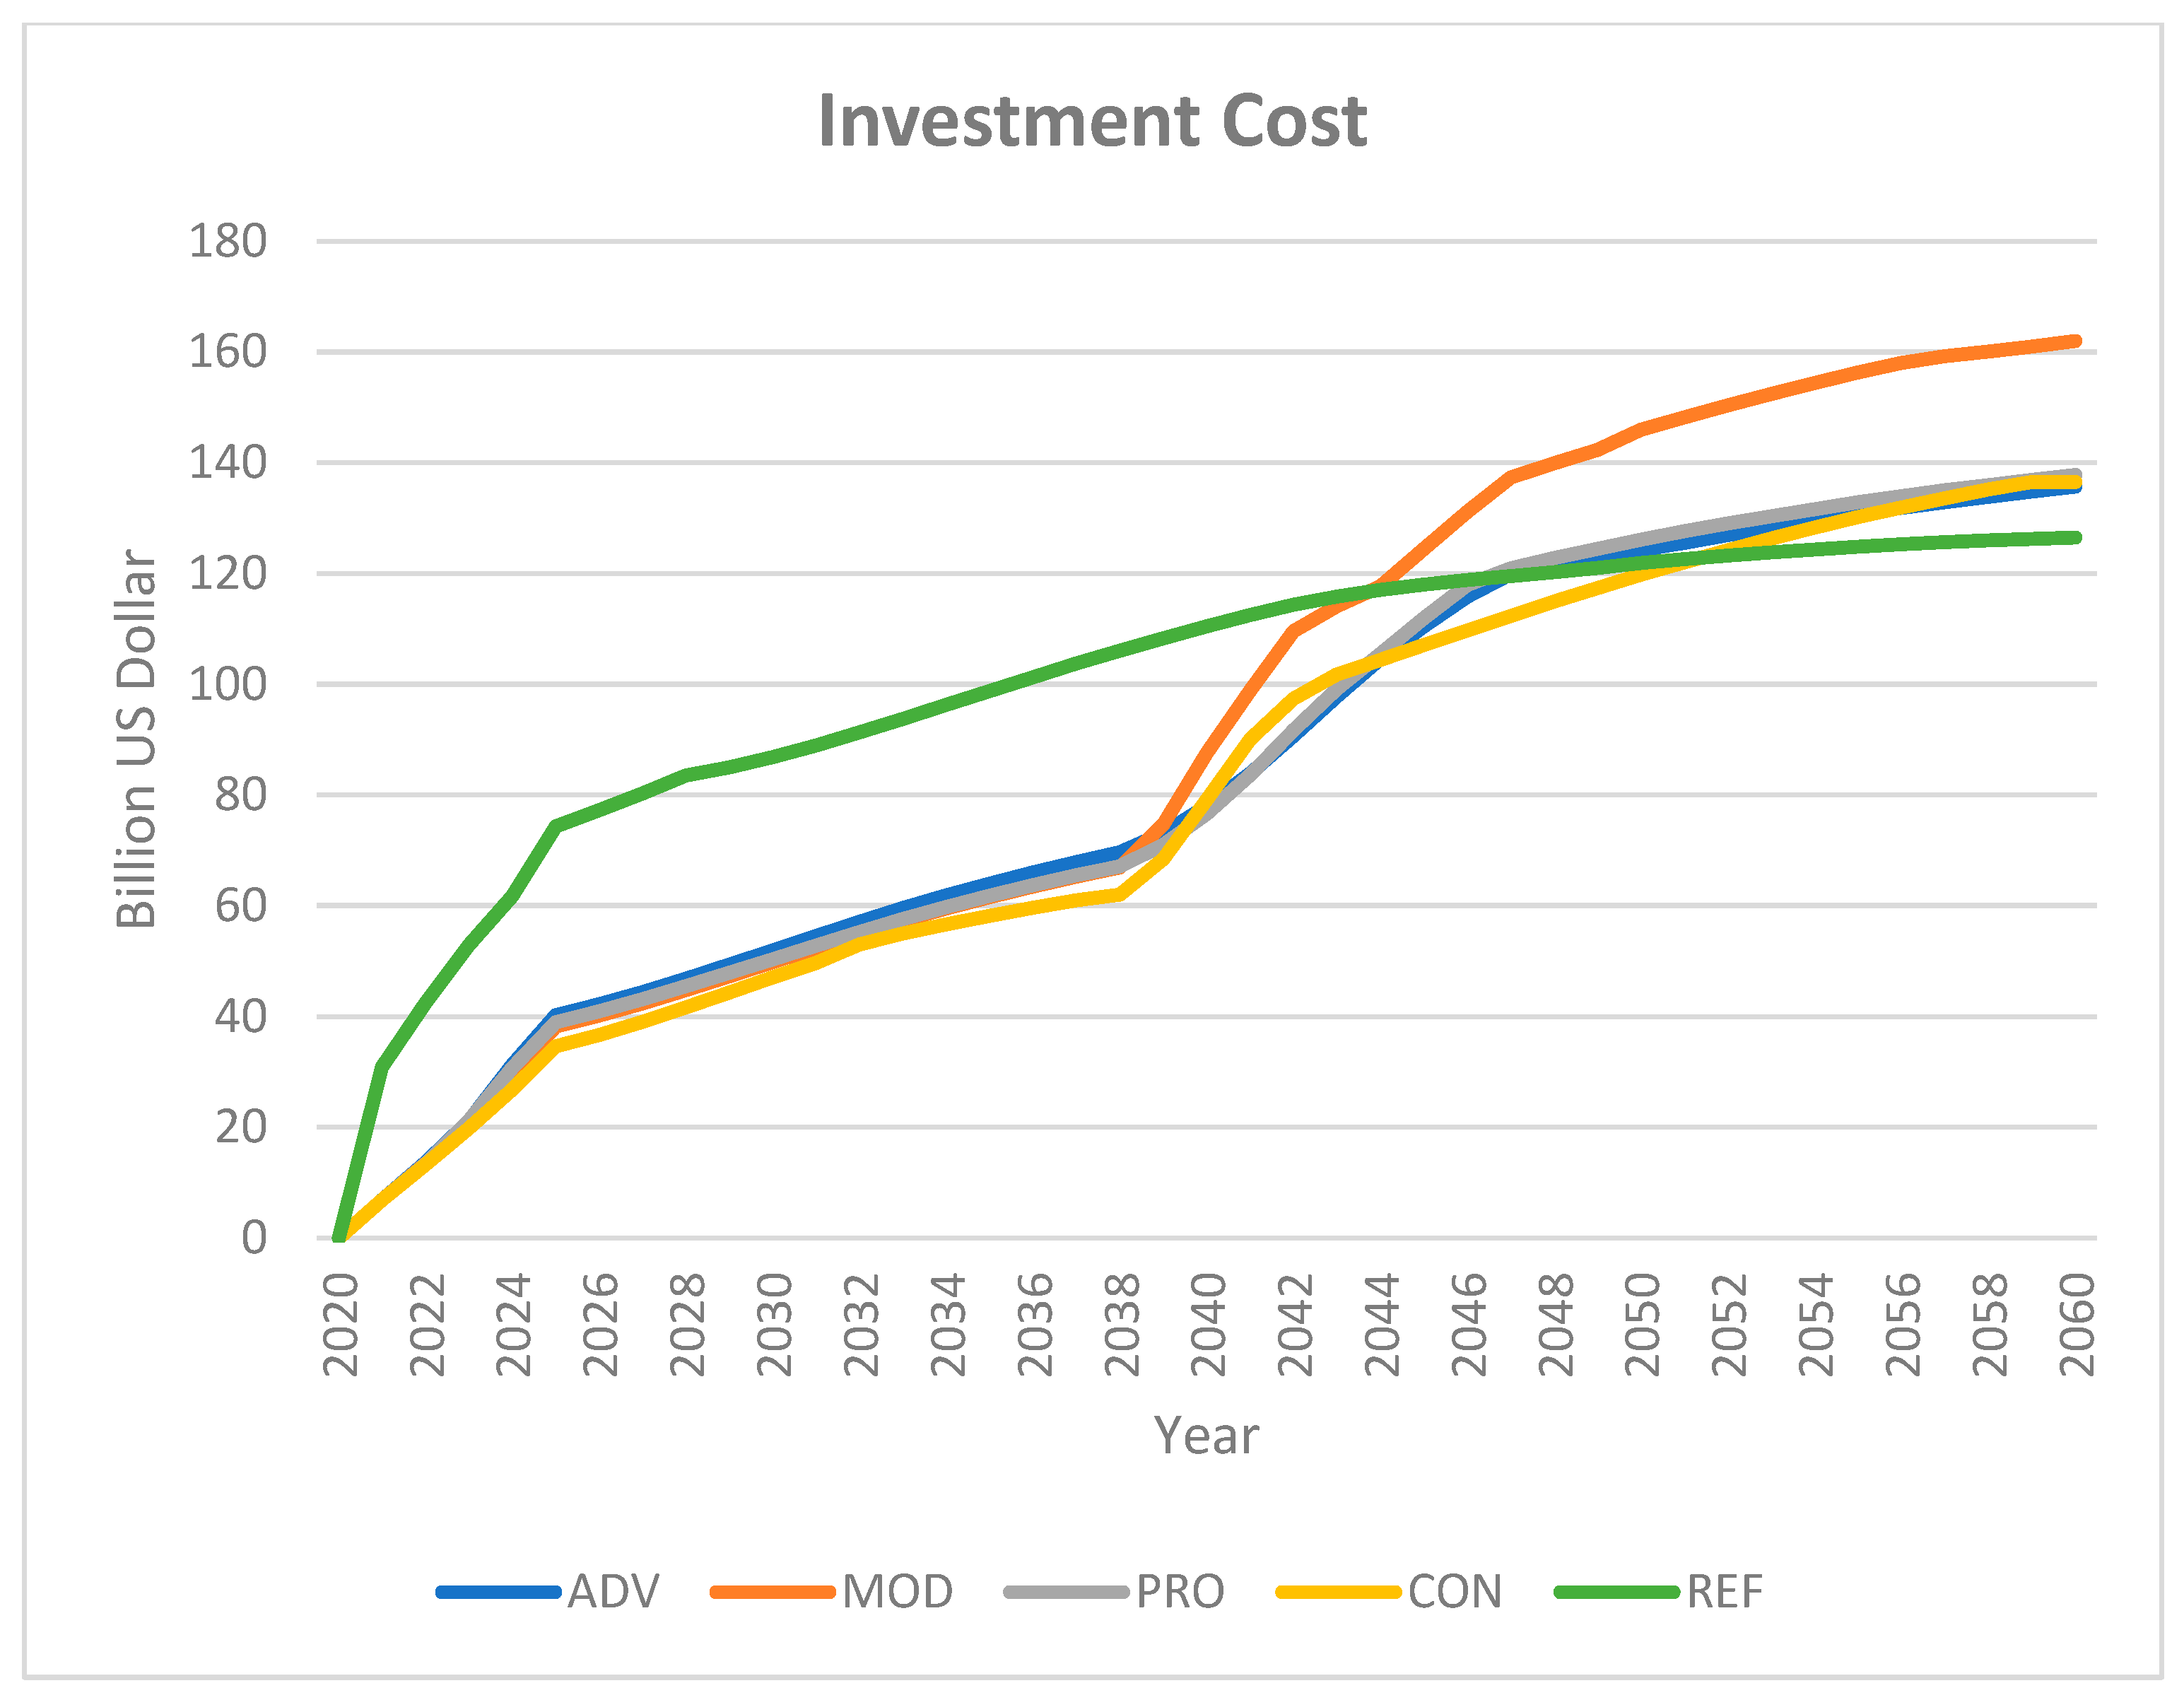
This research also analyzes the total investment cost that all scenarios need in order to fulfill the renewable energy target. The total investment cost in Figure 15 is defined as the sum of the investment costs needed. Without any renewable energy target (the REF scenario), Indonesia will need to invest $127 billion in power generation to fulfill the electricity demand. The data in Figure 15 show that the MOD scenario has the highest investment cost, accumulating a total investment of $162 billion up to 2060. The ADV scenario is the most affordable option for Indonesia in achieving the renewable target, with a total investment cost of $136 billion USD. Meanwhile, the CON and PRO scenarios total investment cost accounted for $137 billion and $138 billion, respectively.
Based on the simulation, battery technology becomes the most expensive investment for the power generation infrastructure. For example, in the MOD scenario, battery cost accounted for 33% of the total investment cost. Meanwhile in the ADV scenario, in total, battery cost contributed to 18% of the total investment cost. On the other hand, although nuclear technology is expensive, its high availability and high capacity prove to be a more affordable option, as the simulation showed in the ADV scenario.

4.4. Results Check with Previous Research

Table 13 compares the results of this research and two previous studies, Kamia Handayani [21] and IEA [7]. Kamia Handayani used the LEAP software to model ASEAN nations’ power systems in order to simulate the region’s renewable energy potential to achieve net-zero carbon emissions; however, her research did not specifically discuss Indonesia’s power generation and it maxes out at year 2050. Meanwhile, the IEA’s report discusses Indonesia’s plan to achieve the net-zero emissions target in 2060. The IEA’s report analyzed several energy sectors in Indonesia and used a different method than this research.
Table 13 shows that the results of this research are aligned with previous studies. In this research, Indonesia’s total electricity demand is predicted to surpass 1400 TWh in 2060, while the total power-generated output to fulfill the demand will be more than 1500 TWh. The same total output is also predicted in the IEA report. For power generation capacity, if Indonesia aims to achieve net-zero carbon in the power generation sector, then Indonesia will need between 800 GW and 1400 GW of power generation in 2060. The higher dependency on variable renewable energy, such as solar and wind, will result in a higher number of total power generation capacity.

5. Conclusions

This study utilized the LEAP model to forecast Indonesia’s power generation from 2022 to 2060. The simulation demonstrated the feasibility of achieving net-zero emissions by 2060 through the use of renewable energy sources. Among the scenarios considered, the ADV scenario, which incorporates nuclear power and energy storage, emerged as the most cost-effective approach to attain this objective. The findings indicate that Indonesia needs to phase out existing fossil fuel power plants and increase the construction of renewable power plants. Solar, hydro, geothermal, and wind energy were identified as the most promising renewable sources, while biomass energy was found to be less favorable. However, it became evident that without the inclusion of nuclear power or energy storage, Indonesia would be unable to achieve its target due to the insufficient potential of conventional renewable energy sources to meet the projected demand in 2060.
Further research is required to determine the most economically viable method for energy storage and its integration into the simulation model. The high costs associated with Li-ion battery energy storage present a significant challenge. It is crucial to identify the optimal energy storage approach to reduce the investment expenses associated with renewable energy. Furthermore, the current modeling framework lacks the capability of accounting for transmission and interconnection systems. As a result, the power system expansion simulation assumes the unrestricted transmission of electricity to any load station, without considering the limitations and constraints of the transmission and distribution network across different regions. To incorporate transmission capacity and conduct a spatial analysis of individual power plants and substations, additional modeling efforts will be necessary.

Author Contributions

Conceptualization, S.P.K. and D.F.H.; methodology, S.P.K.; validation, S.P.K. and D.F.H.; formal analysis, S.P.K.; data curation, S.P.K.; writing—original draft preparation, S.P.K.; writing—review and editing, S.P.K.; visualization, S.P.K.; supervision, D.F.H. All authors have read and agreed to the published version of the manuscript.

Funding

This research did not receive any specific grant from funding agencies in the public, commercial, or not-for-profit sector.

Data Availability Statement

The authors confirm that the data supporting the findings of this study are available within the article.

Conflicts of Interest

The authors declare no conflict of interest.

Appendix A. LEAP Model Parameter

Table A1. Base model parameter.
Input DataValueSource
Electricity demand growth 2022–20604.5%[6,7]
Transmission and distribution losses6–9.4%[6]
Reserve margin35%[6]
Discount Rate12%[29]
Inflation Rate6%[30]
Existing Capacity and Retirementvaries[5]
Load CurveFigure A1[31]
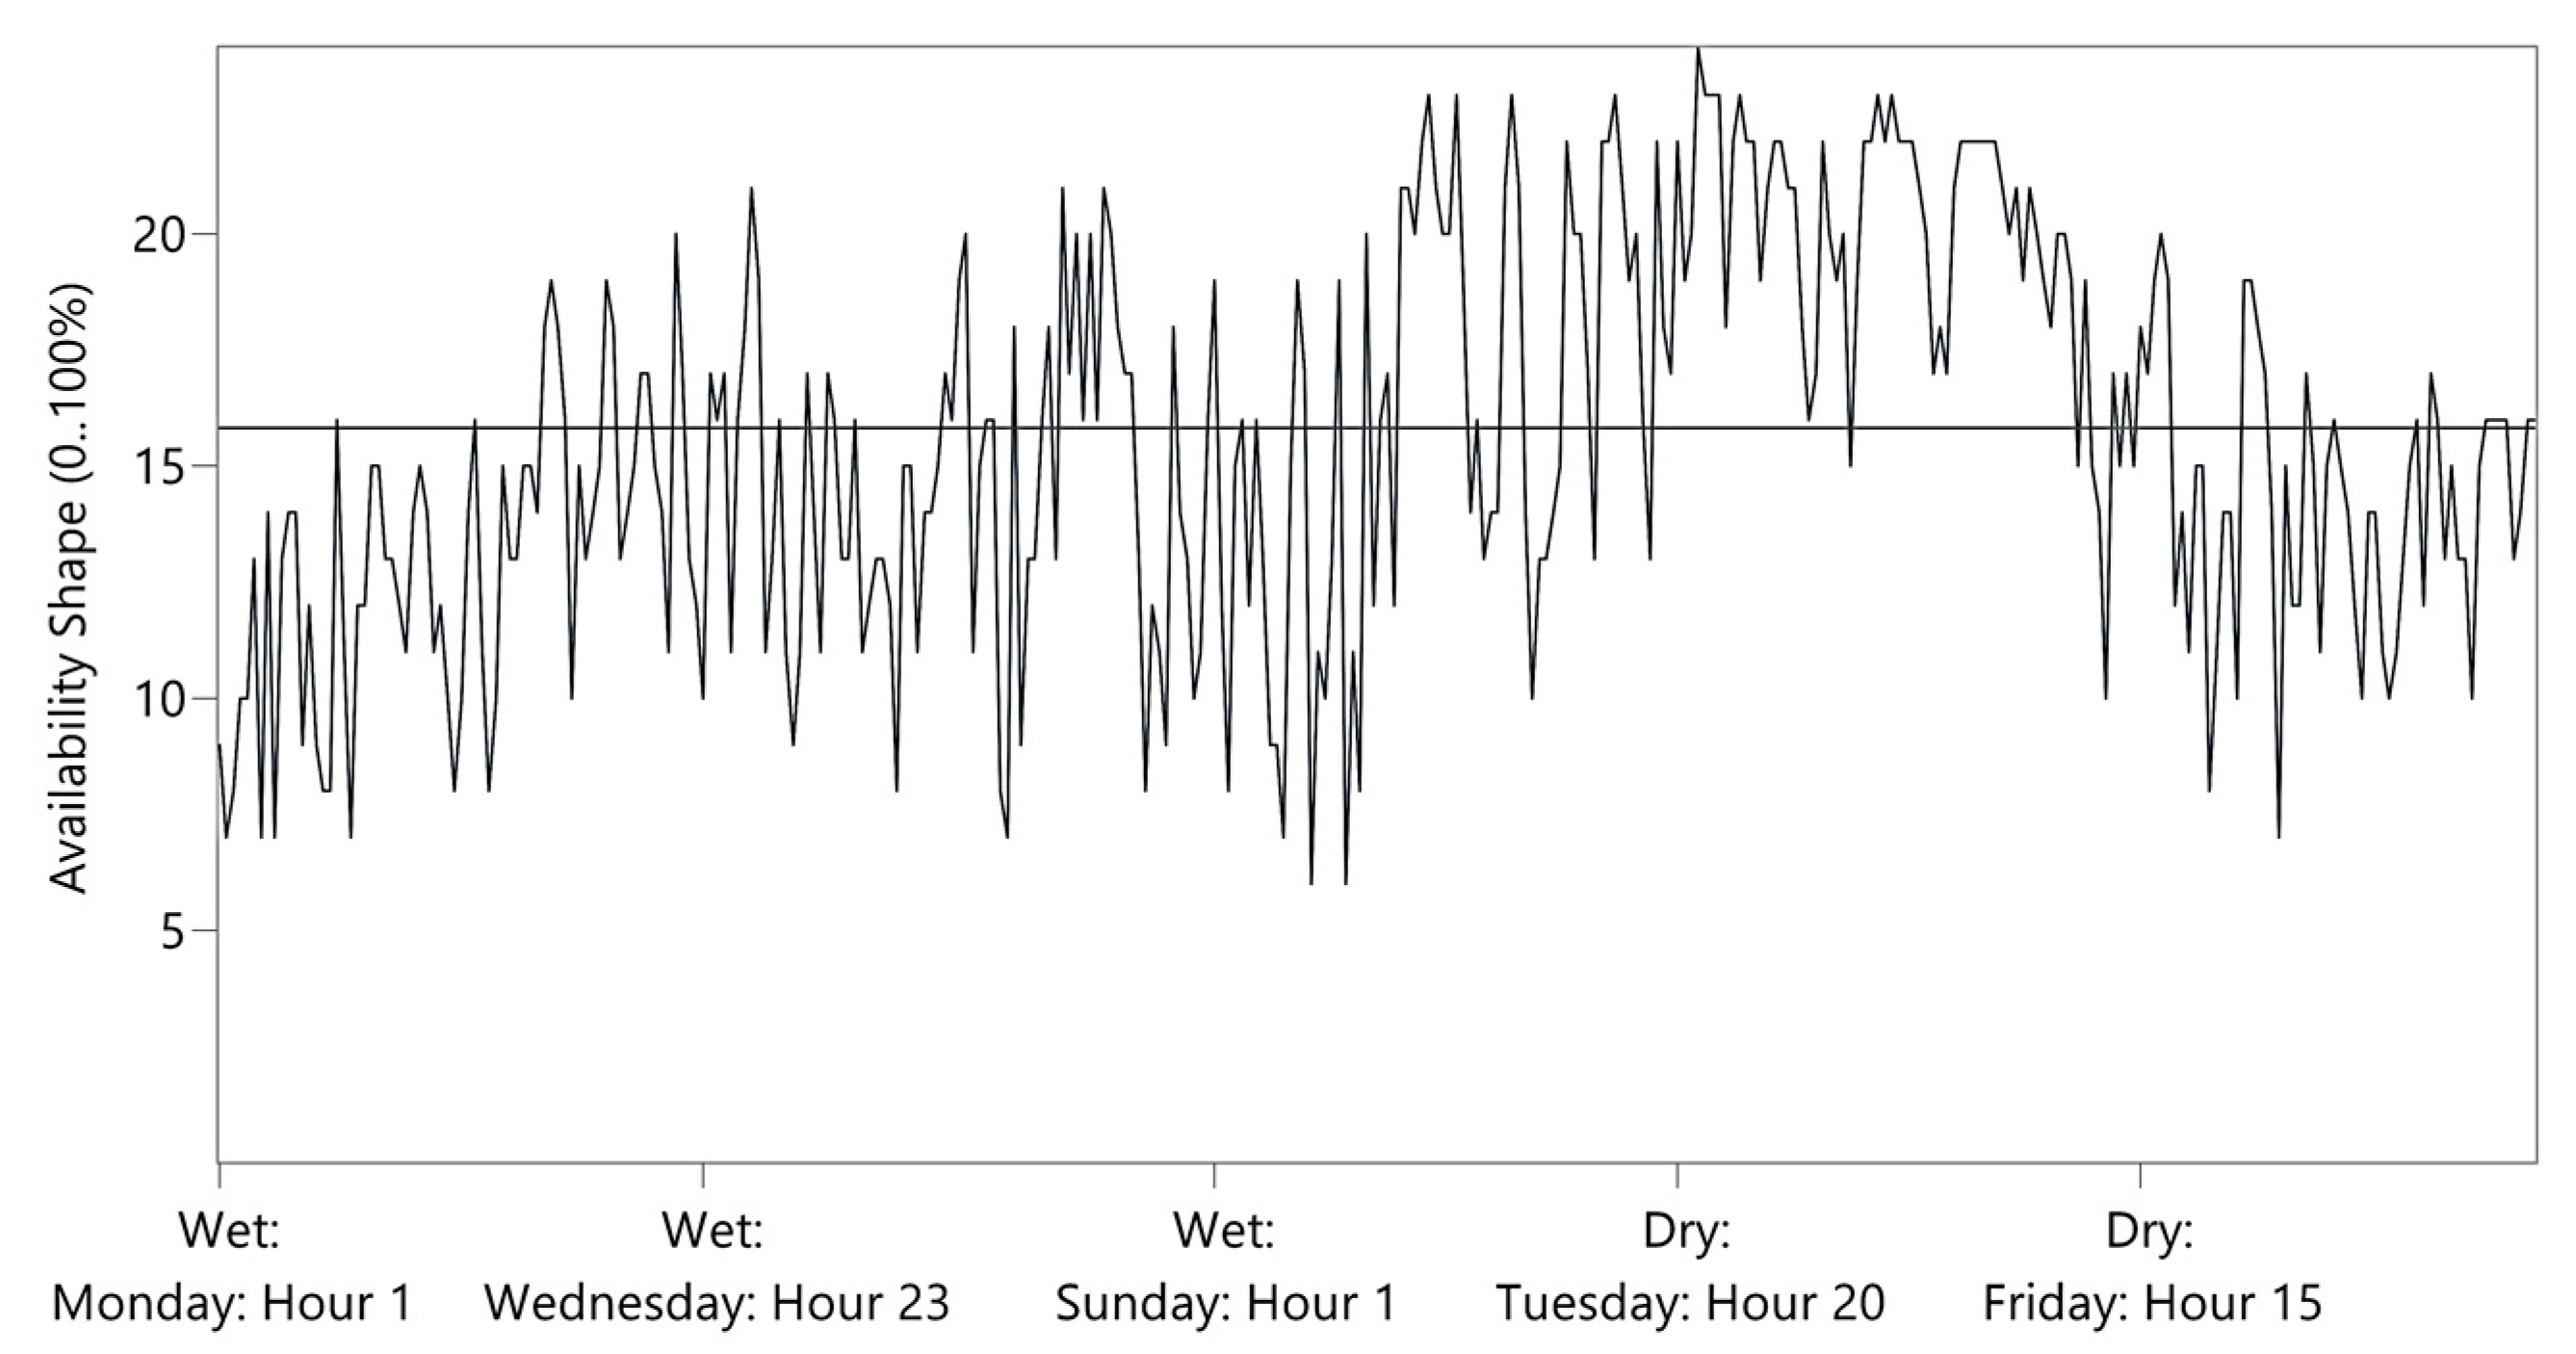
Solar availability curveFigure A2[32]
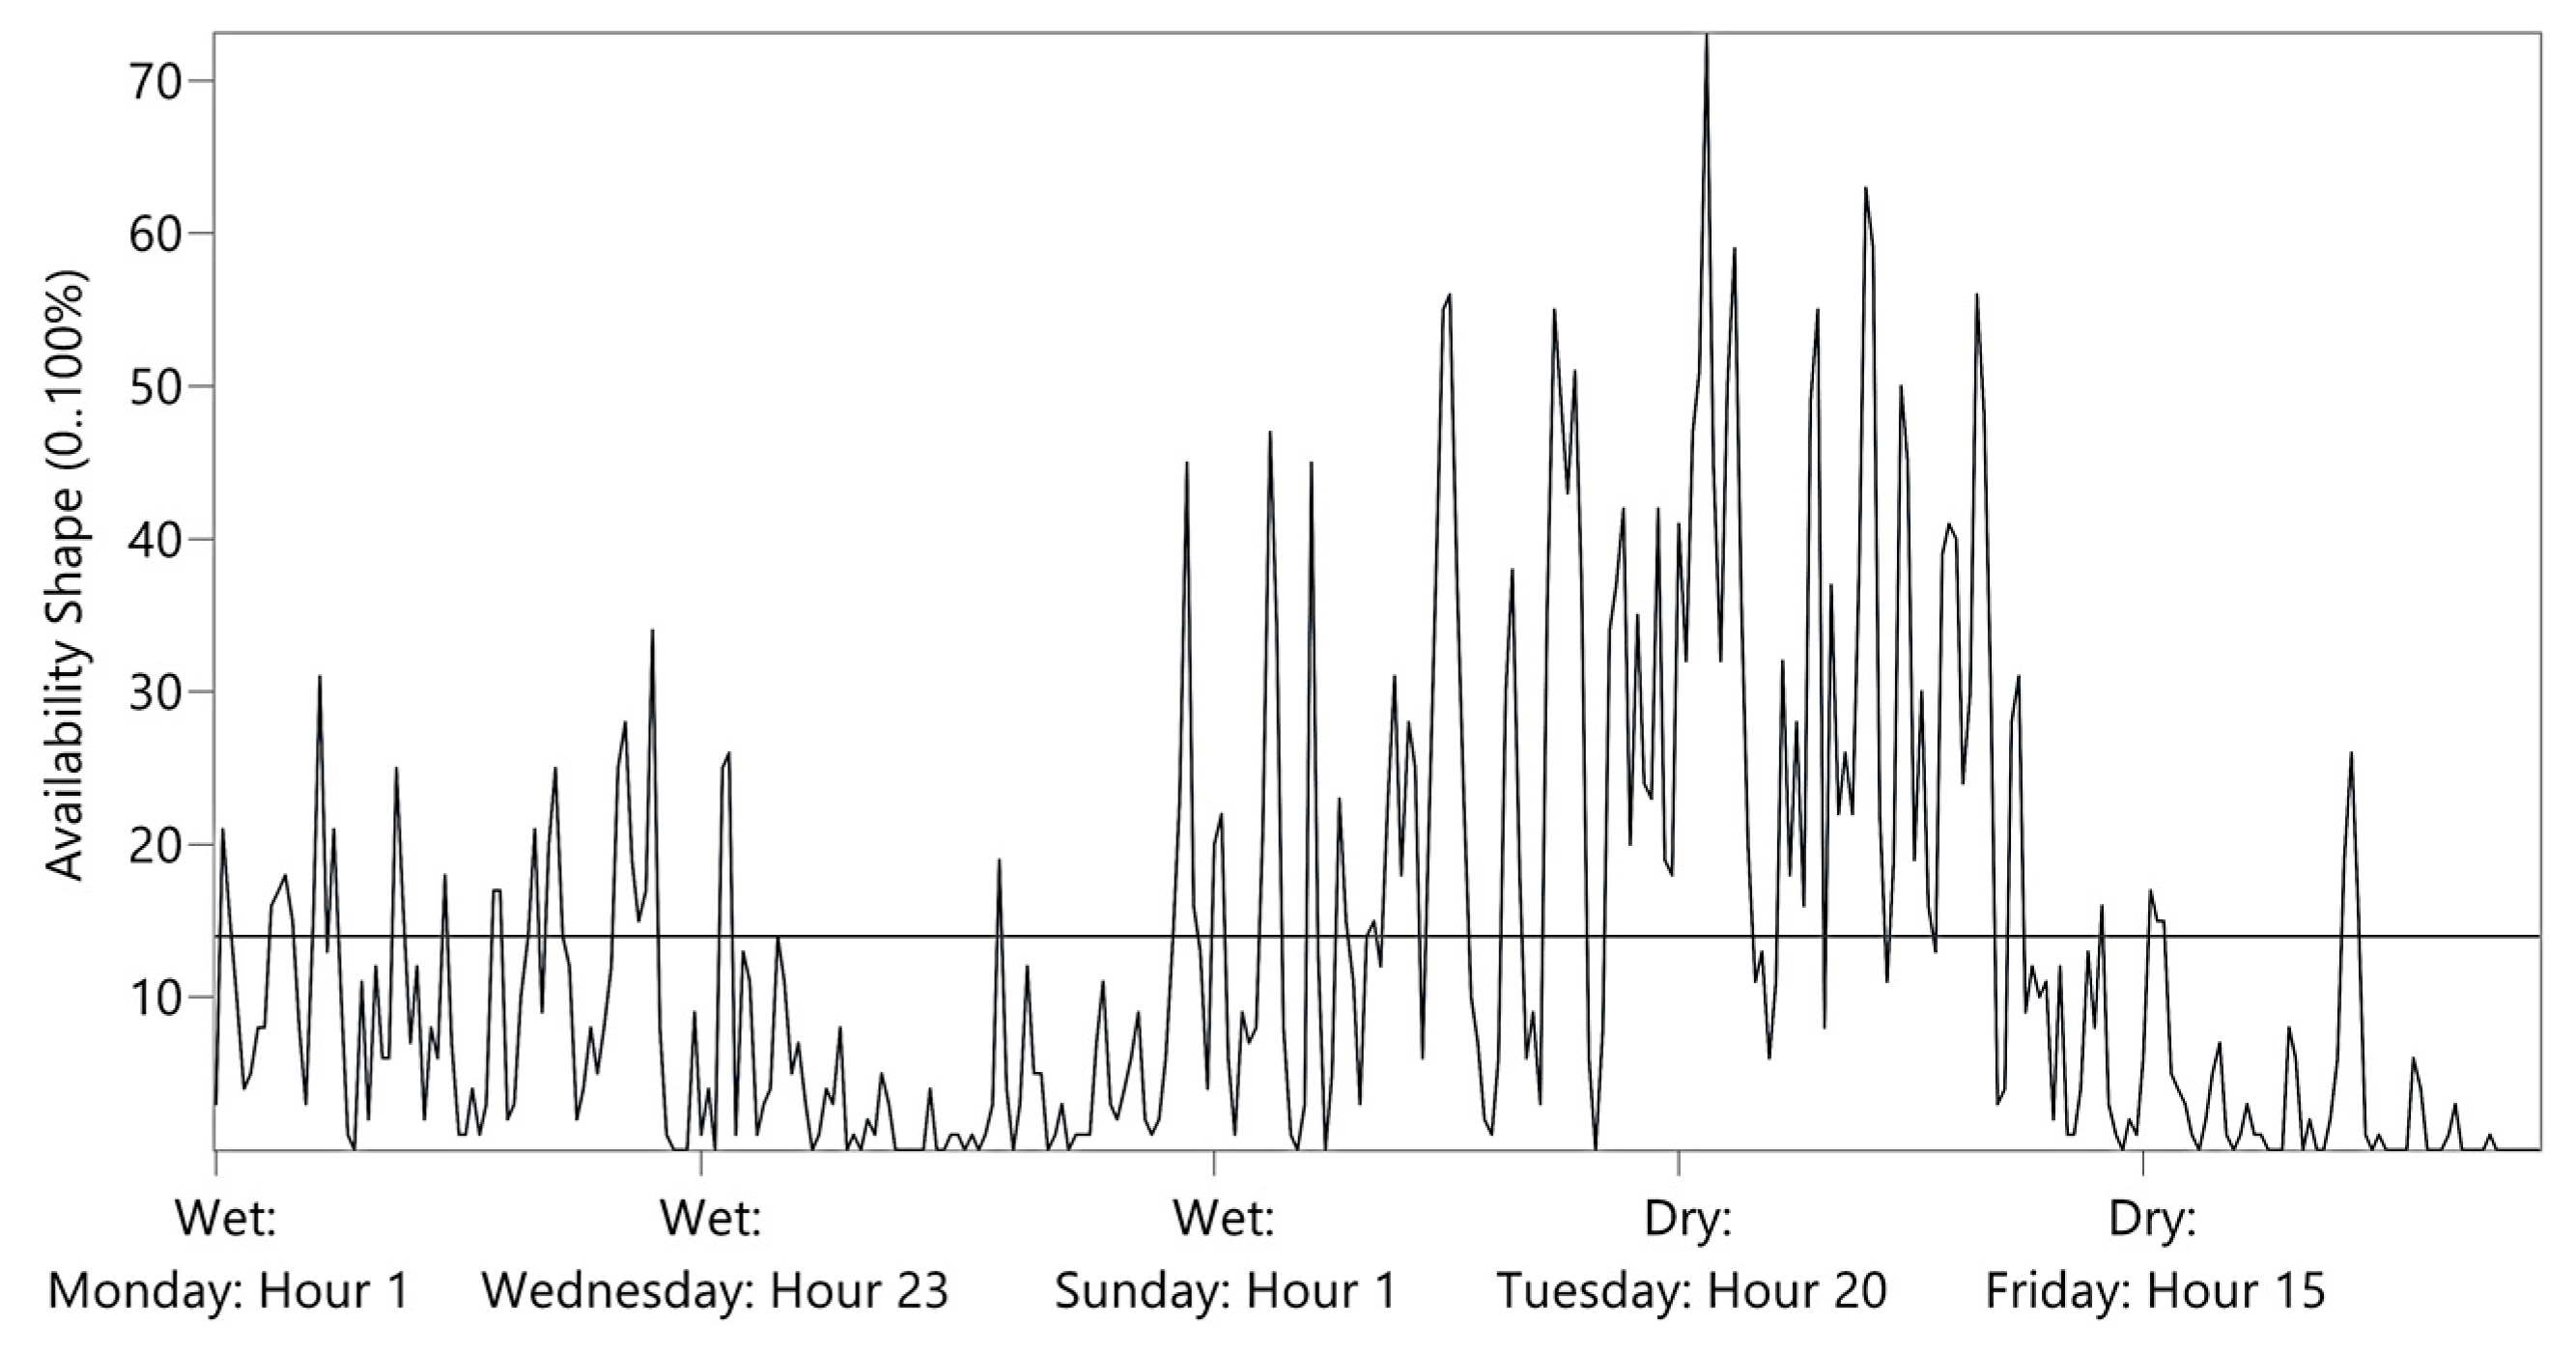
Wind availability curveFigure A3[33]
Time Slice336
Table A2. Summary of power generation model parameters.
BranchLifetime [34,35]Efficiency [35,36]Maximum Availability [37,38,39]Capacity Credit [35]Capital Cost [35,36,37,38] Fixed O/M Cost [35,36,37,38]Variable O/M Cost
[35,36,37,38]
(years)(%)(%)(%)(USD/MW)(USD/MW)(USD/MWh)
Hydro5010036511450–208037.70.65
Geothermal3015901002497–4000500.25
Biomass2531801002000–230047.63
Solar25100[7]221190–200014.40
Wind27100[7]351500–2550600
Natural Gas305685100690–120023.52.3
Coal3042801001520–190056.60.11
Diesel30459510080086.4
Li-ion BESS2094172220027.62.3
Nuclear40338510060001648.6
Figure A1. Load shape [31].
Energies 16 04719 g0a1
Figure A2. Solar availability curve [32].
Energies 16 04719 g0a2
Figure A3. Wind availability curve [33].
Energies 16 04719 g0a3

References

  1. Ministry of Environment and Forestry. Enhanced Nationally Determined Contribution Republic of Indonesia 2022; Ministry of Environment and Forestry: Jakarta, Indonesia, 2022. [Google Scholar]
  2. Ardiansyah, H.; Ekadewi, P.; Silalahi, D.F.; Gunawan, D.; Wahyuni, E.; Dipayana, G.F.; Hardhi, M.; Winofa, N.C.; Ramadhan, R.A.; Hidayat, T. Indonesia Post-Pandemic Outlook: Strategy towards Net-Zero Emissions by 2060 from the Renewables and Carbon-Neutral Energy Perspectives; Penerbit BRIN: Jakarta, Indonesia, 2022. [Google Scholar] [CrossRef]
  3. IEA Indonesia’s Push to Reach Net Zero Emissions Can Help Power a New Phase in Its Economic Development–News–IEA. Available online: https://www.iea.org/news/indonesia-s-push-to-reach-net-zero-emissions-can-help-power-a-new-phase-in-its-economic-development (accessed on 7 October 2022).
  4. Iqbal Ilham Indonesia’s Net Zero Emissions: A Roadmap for Clean, Affordable and Secure Energy—IESR. Available online: https://iesr.or.id/en/indonesias-net-zero-emissions-a-roadmap-for-clean-affordable-and-secure-energy (accessed on 9 September 2022).
  5. PT PLN (Persero). STATISTIK PLN 2021; PT PLN (Persero): Jakarta, Indonesia, 2022. [Google Scholar]
  6. PT PLN (Persero). Electricity Business Plan PT PLN (Persero) 2021–2030; PT PLN (Persero): Jakarta, Indonesia, 2022. [Google Scholar]
  7. IEA. An Energy Sector Roadmap to Net Zero Emissions in Indonesia; International Energy Agency: Paris, France, 2022. [Google Scholar]
  8. PT PLN (Persero) A 35,000 MW Power Plant Program for Indonesia; PT PLN (Persero): Jakarta, Indonesia, 2015.
  9. Deloitte. 35,000 MW: A Light for the Nation; Deloitte: Jakarta, Indonesia, 2016. [Google Scholar]
  10. Suharsono, A.; Lontoh, L. Indonesia’s Energy Policy Briefing: July 2020; International Institute for Sustainable Development: Winnipeg, MB, Canada, 2020. [Google Scholar]
  11. Hans Nicholas Jong Indonesia Says No New Coal Plants from 2023 (after the Next 100 or So). Available online: https://news.mongabay.com/2021/05/indonesia-says-no-new-coal-plants-from-2023-after-the-next-100-or-so/ (accessed on 14 September 2022).
  12. PwC Indonesia Biomass Co-Firing in Coal-Fired Power Plants: PLN’s Ambition to Drive Green Energy. Available online: https://www.pwc.com/id/en/media-centre/infrastructure-news/may-2021/biomass-co-firing-in-coal-fired-power-plants-pln-s-ambition-to-drive-green-energy.html (accessed on 11 September 2022).
  13. International Trade Administration Indonesia—Energy. Available online: https://www.trade.gov/country-commercial-guides/indonesia-energy (accessed on 18 September 2022).
  14. Nathan Lee, F.F.-E.; Ricardo Oliveira, B.R.; Thomas Bowen, J.K. Exploring Renewable Energy Opportunities in Select Southeast Asian Countries: A Geospatial Analysis of the Levelized Cost of Energy of Utility-Scale Wind and Solar Photovoltaics; National Renewable Energy Lab. (NREL): Golden, CO, USA, 2020. [Google Scholar]
  15. IEA. Enhancing Indonesia’s Power System Pathways to Meet the Renewables Targets in 2025 and Beyond; International Energy Agency: Paris, France, 2022. [Google Scholar]
  16. Sambodo, M.T.; Yuliana, C.I.; Hidayat, S.; Novandra, R.; Handoyo, F.W.; Farandy, A.R.; Inayah, I.; Yuniarti, P.I. Breaking Barriers to Low-Carbon Development in Indonesia: Deployment of Renewable Energy. Heliyon 2022, 8, e09304. [Google Scholar] [CrossRef] [PubMed]
  17. Zhong, S.; Su, B.; Lin, X.; Ng, T.S. Moving towards a Net-Zero Emissions Economy: The Case of Indonesia. Available online: https://ssrn.com/abstract=4295163 (accessed on 6 December 2022).
  18. Kanugrahan, S.P.; Hakam, D.F.; Nugraha, H. Techno-Economic Analysis of Indonesia Power Generation Expansion to Achieve Economic Sustainability and Net Zero Carbon 2050. Sustainability 2022, 14, 9038. [Google Scholar] [CrossRef]
  19. Kanugrahan, S.P.; Hakam, D.F. Technoeconomic Analysis of Indonesia Generation Expansion to Achieve Energy and Economic Sustainability. In Proceedings of the 1st IAEE Online Conference, Online, 7–9 June 2021. [Google Scholar]
  20. Kanugrahan, S.P.; Hakam, D.F. Unlocking Indonesia Potential Resources to Achieve Net Zero Emission 2060: Generation Expansion Planning Using LEAP. In Proceedings of the 17th IAEE European Energy Conference, Athens, Greece, 21–24 September 2022. [Google Scholar]
  21. Handayani, K.; Anugrah, P.; Goembira, F.; Overland, I.; Suryadi, B.; Swandaru, A. Moving beyond the NDCs: ASEAN Pathways to a Net-Zero Emissions Power Sector in 2050. Appl. Energy 2022, 311, 118580. [Google Scholar] [CrossRef]
  22. Handayani, K.; Krozer, Y.; Filatova, T. From Fossil Fuels to Renewables: An Analysis of Long-Term Scenarios Considering Technological Learning. Energy Policy 2019, 127, 134–146. [Google Scholar] [CrossRef]
  23. Handayani, K.; Filatova, T.; Krozer, Y.; Anugrah, P. Seeking for a Climate Change Mitigation and Adaptation Nexus: Analysis of a Long-Term Power System Expansion. Appl. Energy 2020, 262, 114485. [Google Scholar] [CrossRef]
  24. Sani, L.; Khatiwada, D.; Harahap, F.; Silveira, S. Decarbonization Pathways for the Power Sector in Sumatra, Indonesia. Renew. Sustain. Energy Rev. 2021, 150, 111507. [Google Scholar] [CrossRef]
  25. Heaps, C. LEAP: The Low Emissions Analysis Platform. 2022. Available online: https://www.sei.org/projects-and-tools/tools/leap-long-range-energy-alternatives-planning-system/ (accessed on 20 June 2022).
  26. Ayuketah, Y.; Gyamfi, S.; Diawuo, F.A.; Dagoumas, A.S. Assessment of Low-Carbon Energy Transitions Policies for the Energy Demand Sector of Cameroon. Energy Sustain. Dev. 2023, 72, 252–264. [Google Scholar] [CrossRef]
  27. Zhou, J.; He, Y.; Lyu, Y.; Wang, K.; Che, Y.; Wang, X. Long-Term Electricity Forecasting for the Industrial Sector in Western China under the Carbon Peaking and Carbon Neutral Targets. Energy Sustain. Dev. 2023, 73, 174–187. [Google Scholar] [CrossRef]
  28. United Nations; Department of Economic and Social Affairs; Population Division. World Population Prospects 2022, Online Edition; United Nations: New York, USA, 2022. [Google Scholar]
  29. IESR. Levelized Cost of Electricity in Indonesia; IESR: Jakarta, Indonesia, 2019. [Google Scholar]
  30. The World Bank Inflation, GDP Deflator (Annual %)—Indonesia|Data. Available online: https://data.worldbank.org/indicator/NY.GDP.DEFL.KD.ZG?locations=ID (accessed on 28 September 2022).
  31. PT PLN (Persero). Indonesia Load Curve; PT PLN (Persero): Jakarta, Indonesia, 2021. [Google Scholar]
  32. Pfenninger, S.; Staffell, I. Long-Term Patterns of European PV Output Using 30 Years of Validated Hourly Reanalysis and Satellite Data. Energy 2016, 114, 1251–1265. [Google Scholar] [CrossRef] [Green Version]
  33. Staffell, I.; Pfenninger, S. Using Bias-Corrected Reanalysis to Simulate Current and Future Wind Power Output. Energy 2016, 114, 1224–1239. [Google Scholar] [CrossRef] [Green Version]
  34. Rothwell, G.; Rust, J. On the Optimal Lifetime of Nuclear Powe Plants. J. Bus. Econ. Stat. 1997, 15, 195–208. [Google Scholar] [CrossRef]
  35. MEMR; Danish Energy Agency. Technology Data for the Indonesian Power Sector Catalogue for Generation and Storage of Electricity; Ministry of Energy and Mineral Resources: Jakarta, Indonesia, 2021; Available online: https://ens.dk/sites/ens.dk/files/Globalcooperation/technology_data_for_the_indonesian_power_sector_-_final.pdf (accessed on 10 October 2022).
  36. IEA. World Energy Outlook 2020; IEA: Paris, France, 2020. [Google Scholar]
  37. DEN. Indonesia Energy Outlook; Dewan Energi Nasional: Jakarta, Indonesia, 2019. [Google Scholar]
  38. IEA. Projected Costs of Generating Electricity 2015–Analysis–IEA; International Energy Agency: Paris, France, 2015. [Google Scholar]
  39. Mongird, K.; Viswanathan, V.V.; Balducci, P.J.; Alam, M.J.E.; Fotedar, V.; Koritarov, V.S.; Hadjerioua, B. Energy Storage Technology and Cost Characterization Report; Pacific Northwest National Lab. (PNNL): Richland, WA, USA, 2019. [Google Scholar]
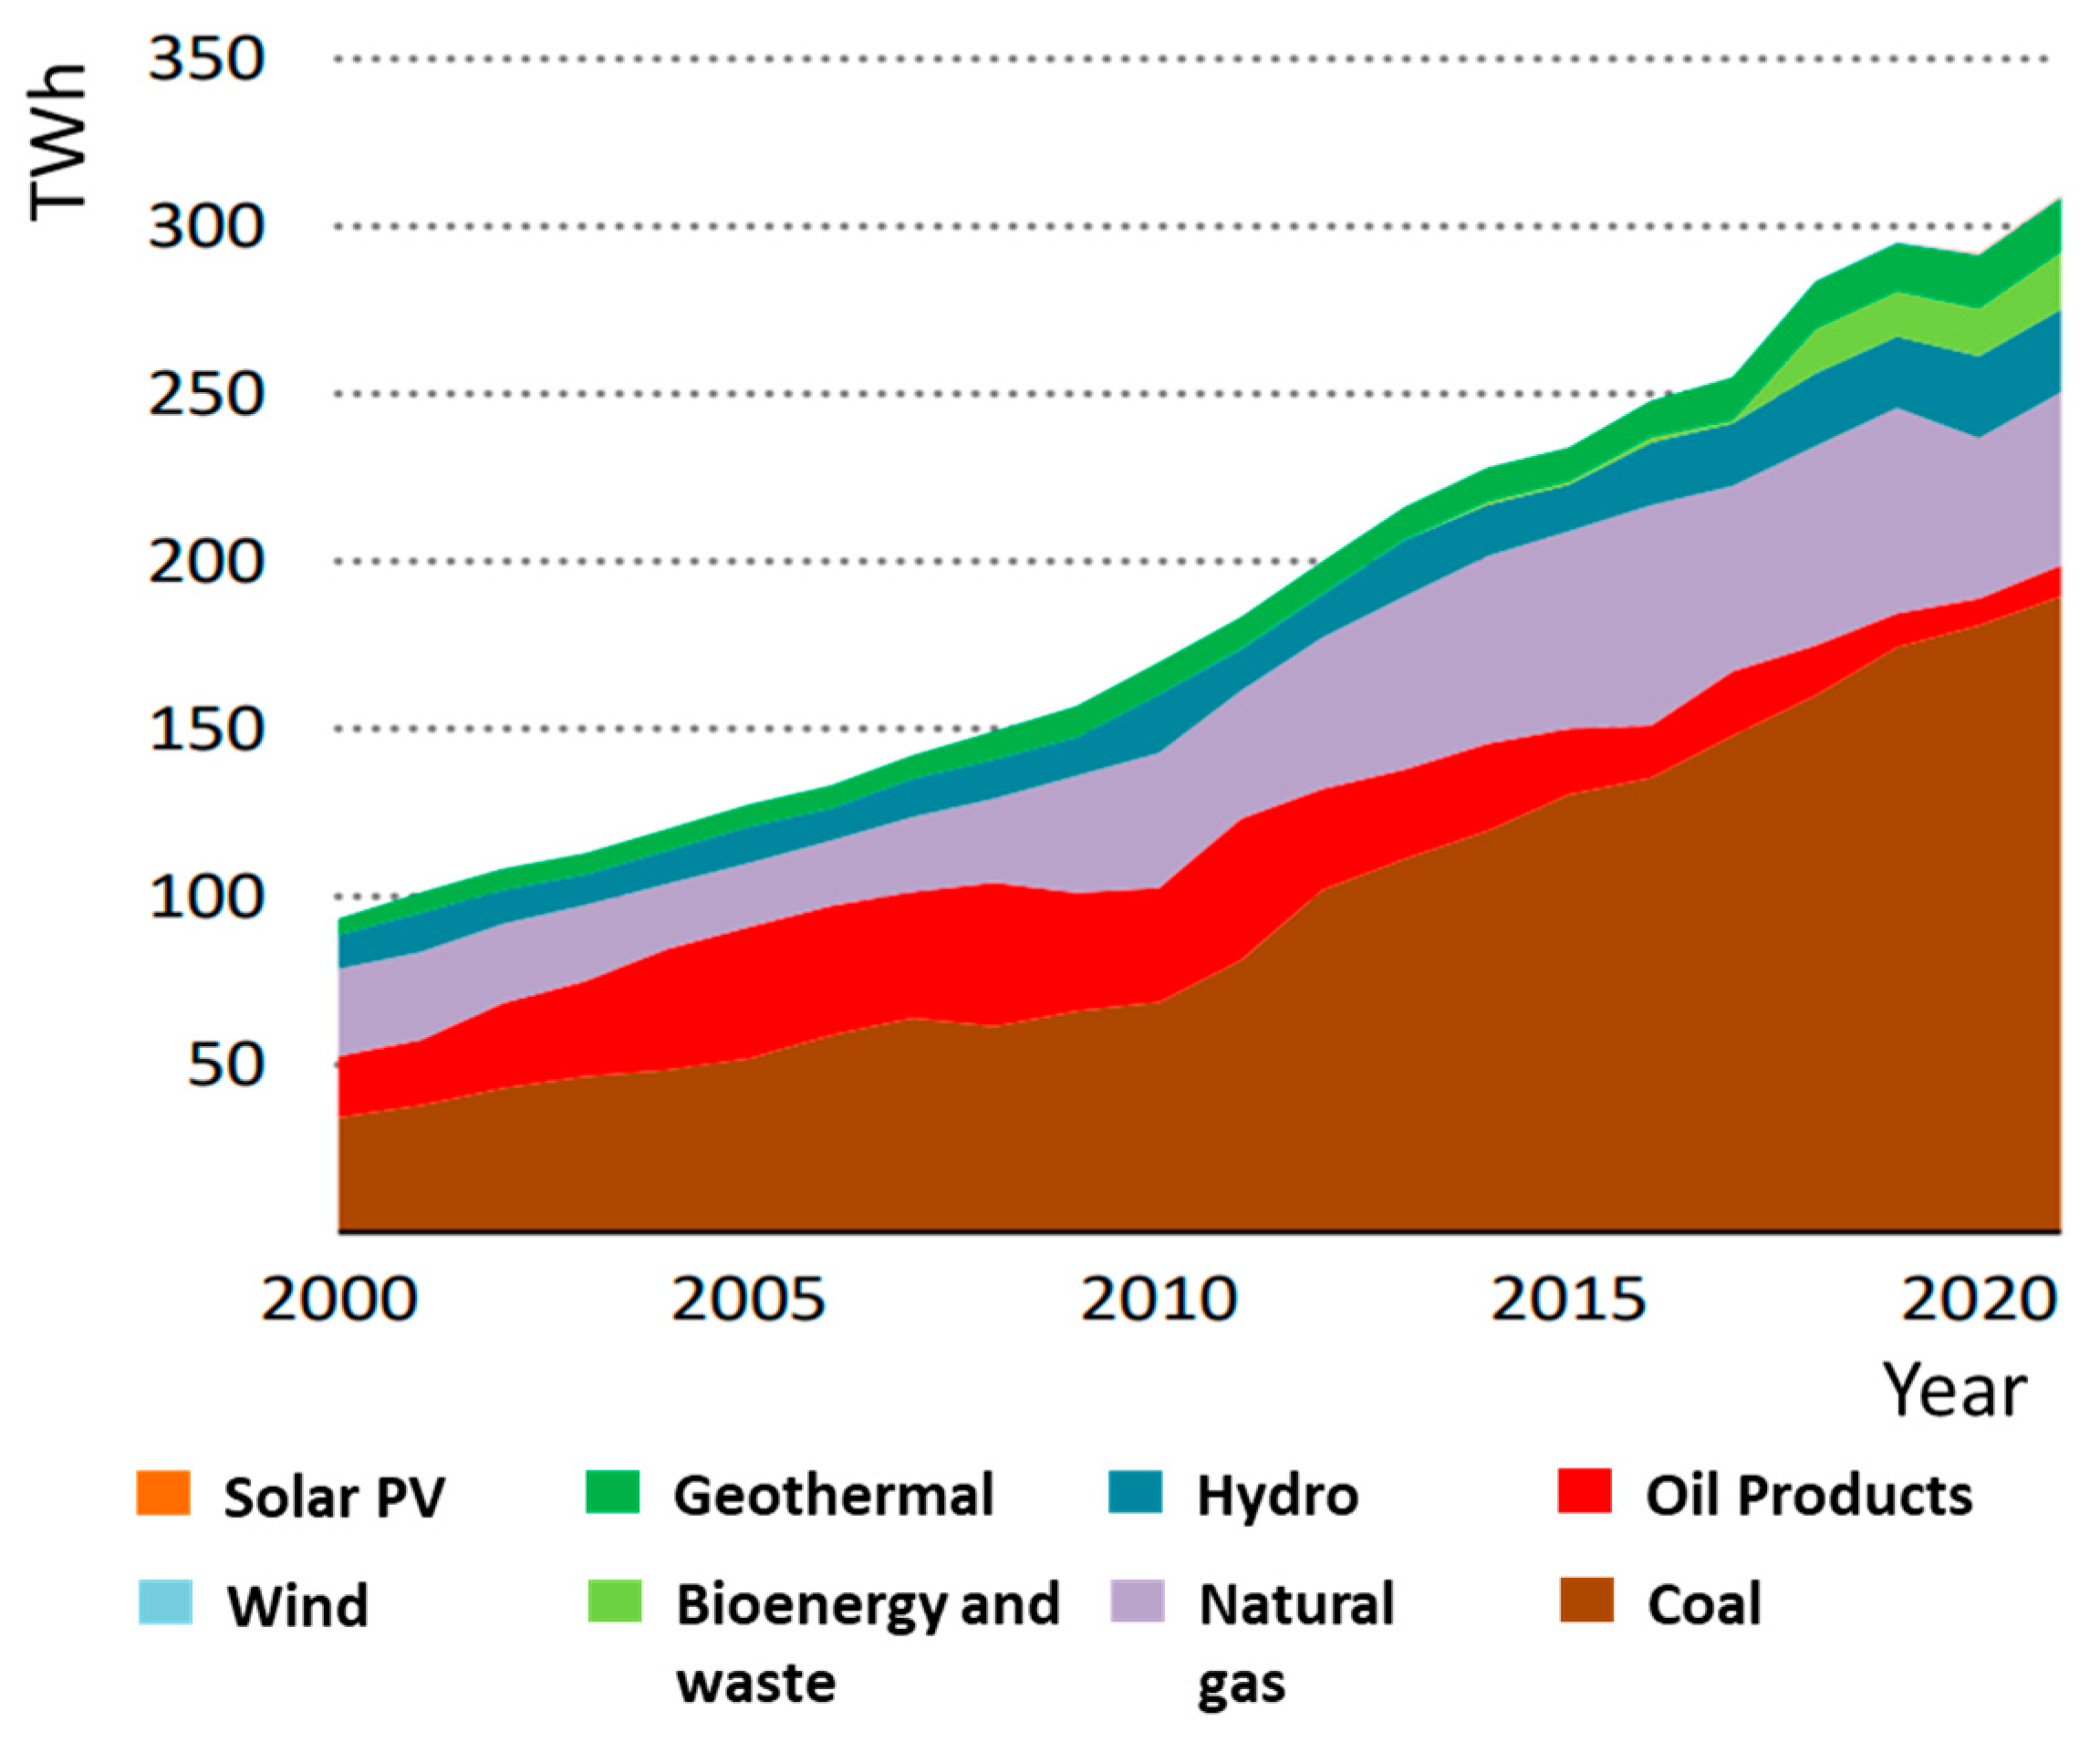
Figure 1. Indonesia’s electricity generation mix by source [7].
Energies 16 04719 g001
Figure 2. PT PLN (Persero) energy production in 2021 [5].
Energies 16 04719 g002
Figure 3. Research framework.
Energies 16 04719 g003
Figure 4. Projected total electricity demand of Indonesia.
Energies 16 04719 g004
Figure 5. REF scenario—Power generation output.
Energies 16 04719 g005
Figure 6. REF scenario—Power generation capacity.
Energies 16 04719 g006
Figure 7. CON scenario—Power generation output.
Energies 16 04719 g007
Figure 8. CON scenario—Power generation capacity.
Energies 16 04719 g008
Figure 9. MOD scenario—Power generation output.
Energies 16 04719 g009
Figure 10. MOD scenario—Power generation capacity.
Energies 16 04719 g010
Figure 11. PRO scenario—Power generation capacity.
Energies 16 04719 g011
Figure 12. PRO scenario—Power generation output.
Energies 16 04719 g012
Figure 13. ADV scenario—Power generation output.
Energies 16 04719 g013
Figure 14. ADV scenario—Power generation capacity.
Energies 16 04719 g014
Figure 15. Total investment cost comparison.
Energies 16 04719 g015
Table 1. Indonesia’s renewable energy potential [6,14].
Energy SourcePotential Capacity
(GW)
Installed Capacity
(GW)
Percentage
Hydro75.14.86.43%
Geothermal29.51.44.87%
Biomass32.71.75.12%
Solar Energy1052.00.10.01%
Wind50.00.0030.01%
Ocean18.00.0000.00%
Total1257.38.020.64%
Table 2. Previous energy modelling research on Indonesia.
ResearchTime PeriodSectorAreaResultScenario
Energy MixGHG
Zhong et al. [17]2020–2060PowerIndonesiaBusiness as Usual, National Plan, Renewable Enhancement, Zero Carbon
Kanugrahan et al. [18]2020–2050PowerIndonesia Business as Usual, Cost Optimization, National Plan, Zero Carbon
Handayani et al. [21]2020–2050PowerASEAN NationsBusiness as Usual, National Plan, Zero Carbon
Sani et al. [24]2019–2028PowerSumatra IslandBusiness as Usual, National Plan, Carbon Reduction 19%, Carbon Reduction 24%
IEA [7]2020–2060PowerIndonesiaNational Plan, Zero Carbon
This Research2022–2060PowerIndonesia Business as Usual, Zero Carbon with various tech
Table 3. REF scenario energy mix.
Total Energy Production (TWh)Year
2030204020502060
413.22655.801079.351661.67
Hydro14.08%14.19%11.57%18.34%
Geothermal11.74%8.71%10.37%6.93%
Biomass0.00%0.00%0.00%0.00%
Solar0.08%1.04%2.03%2.61%
Wind0.82%1.20%1.63%1.88%
Natural Gas26.54%29.14%30.12%28.67%
Coal46.67%45.41%44.14%40.95%
Diesel0.07%0.31%0.13%0.63%
Table 4. REF scenario generation capacity.
Total Capacity (GW)Year
2030204020502060
127.80179.53266.47382.55
Hydro14.4720.3222.0043.48
Geothermal7.0411.7321.5621.86
Biomass0.170.170.170.17
Solar0.254.9415.8831.31
Wind2.817.4916.4327.62
Natural Gas33.3144.9364.0685.63
Coal61.3076.80102.30131.40
Diesel8.4513.1424.0841.08
Table 5. CON scenario energy mix.
Total Energy Production (TWh)Year
2030204020502060
412.75635.091162.092280.51
Hydro6.08%15.04%21.76%14.13%
Geothermal9.51%29.09%18.21%9.10%
Biomass4.11%8.28%10.76%10.02%
Solar0.84%4.51%43.37%63.92%
Wind0.72%3.97%5.27%2.68%
Natural Gas35.70%19.25%0.15%0.11%
Coal28.40%11.01%0.26%0.02%
Diesel14.65%8.85%0.23%0.01%
Table 6. CON scenario generation capacity.
Total Capacity (GW)Year
2030204020502060
94.82197.04634.631442.24
Hydro7.7126.2075.0075.00
Geothermal4.9823.4329.5029.50
Biomass2.427.5017.8432.60
Solar2.5020.65363.721052.00
Wind2.4320.5950.0050.00
Natural Gas41.3872.3877.16197.79
Coal26.1419.4315.413.59
Diesel7.266.856.011.75
Table 7. MOD scenario energy mix.
Total Energy Production (TWh)Year
2030204020502060
412.95635.361033.431688.04
Hydro6.26%16.30%24.69%19.08%
Geothermal9.80%31.61%21.11%12.25%
Biomass4.55%2.95%0.54%0.05%
Solar0.92%4.92%47.79%65.25%
Wind0.76%4.31%5.86%3.36%
Natural Gas32.17%13.00%0.00%0.00%
Coal28.38%11.04%0.00%0.00%
Diesel17.16%15.85%0.00%0.00%
Table 8. MOD scenario generation capacity.
Total Capacity (GW)Year
2030204020502060
97.37224.45768.271339.16
Hydro7.9228.3475.0075.00
Geothermal5.1325.4729.5028.98
Biomass2.682.680.800.12
Solar2.7622.57356.45794.92
Wind2.5722.3849.4746.34
Natural Gas39.8857.8857.8858.88
Coal25.6730.3826.3625.00
Diesel8.5112.1011.7610.75
BESS Li-Ion2.2522.66161.05299.17
Table 9. PRO scenario generation capacity.
Total Capacity (GW)Year
2030204020502060
99.59172.54470.10798.91
Hydro9.1017.9875.0075.00
Geothermal6.3715.2529.5029.50
Biomass3.604.733.400.12
Solar3.4910.79146.56461.64
Wind3.4212.0950.0050.00
Natural Gas39.8858.3858.3836.88
Coal23.4032.2928.2719.19
Diesel8.5112.1016.2614.25
Nuclear1.838.9462.73112.32
Table 10. PRO scenario energy mix.
Total Energy Production (TWh)Year
2030204020502060
412.75635.09978.151520.33
Hydro7.24%10.16%30.19%21.03%
Geothermal12.16%18.93%23.52%15.08%
Biomass6.08%5.21%1.84%0.06%
Solar1.17%2.35%20.76%42.08%
Wind1.01%2.33%6.26%4.03%
Natural Gas23.99%30.34%0.03%0.00%
Coal28.40%11.05%0.76%0.02%
Diesel17.16%15.86%1.87%0.38%
Nuclear2.79%3.77%14.77%17.32%
Table 11. ADV scenario energy mix.
Total Energy Production (TWh)Year
2030204020502060
412.93635.14992.251674.14
Hydro5.63%9.67%27.18%19.24%
Geothermal8.24%17.74%22.56%12.57%
Biomass3.49%2.71%0.72%0.05%
Solar0.69%3.19%30.95%57.76%
Wind0.58%2.23%6.17%3.66%
Natural Gas32.56%27.65%0.00%0.00%
Coal28.38%11.05%0.55%0.04%
Diesel17.16%15.86%0.59%0.05%
Nuclear3.26%9.91%11.29%6.62%
Table 12. ADV scenario generation capacity.
Total Capacity (GW)Year
2030204020502060
95.60178.92569.991034.25
Hydro7.1717.1575.0075.00
Geothermal4.3214.2929.5029.50
Biomass2.062.451.020.12
Solar2.0614.61221.60697.88
Wind1.9711.5650.0050.00
Natural Gas39.8857.8857.8863.85
Coal25.8331.1827.1728.46
Diesel8.5112.1012.7610.75
Nuclear1.818.4515.6915.69
BESS Li-Ion2.009.2579.3863.00
Table 13. Results check with previous research.
AuthorThis ResearchKamia HandayaniIEA
Article TitleLong-Term Scenarios of Indonesia’s Power Sector to Achieve Nationally Determined Contribution (NDC) 2060Moving Beyond the NDCs: ASEAN Pathways to a Net-Zero Emissions Power Sector in 2050An Energy Sector Roadmap to Net-Zero Emissions in Indonesia
ScenariosREFCONMODPROADVREFRETNZEAPSNZE
Demand (TWh)
In 2050910.3983.8±12001500
In 20601413.7-±1400-
Output (TWh)
In 20501079.41162.11033.4978.2992.251083.5±1200±1600
In 20601661.72280.51688.01520.31674.1-±1500±1800
Total Capacity (GW)
In 2050266.5634.6768.4470.1570.0--±200±600±800
In 2060382.61442.21339.2798.91203.7243.6-±575±700±900
Total Investment Cost (Billion USD)
In 2050109.8121.9150.2117.5128.9±120±115±130±150±175
In 2060113.1143.0166.8133.4147.5-----
Disclaimer/Publisher’s Note: The statements, opinions and data contained in all publications are solely those of the individual author(s) and contributor(s) and not of MDPI and/or the editor(s). MDPI and/or the editor(s) disclaim responsibility for any injury to people or property resulting from any ideas, methods, instructions or products referred to in the content.