1. Introduction
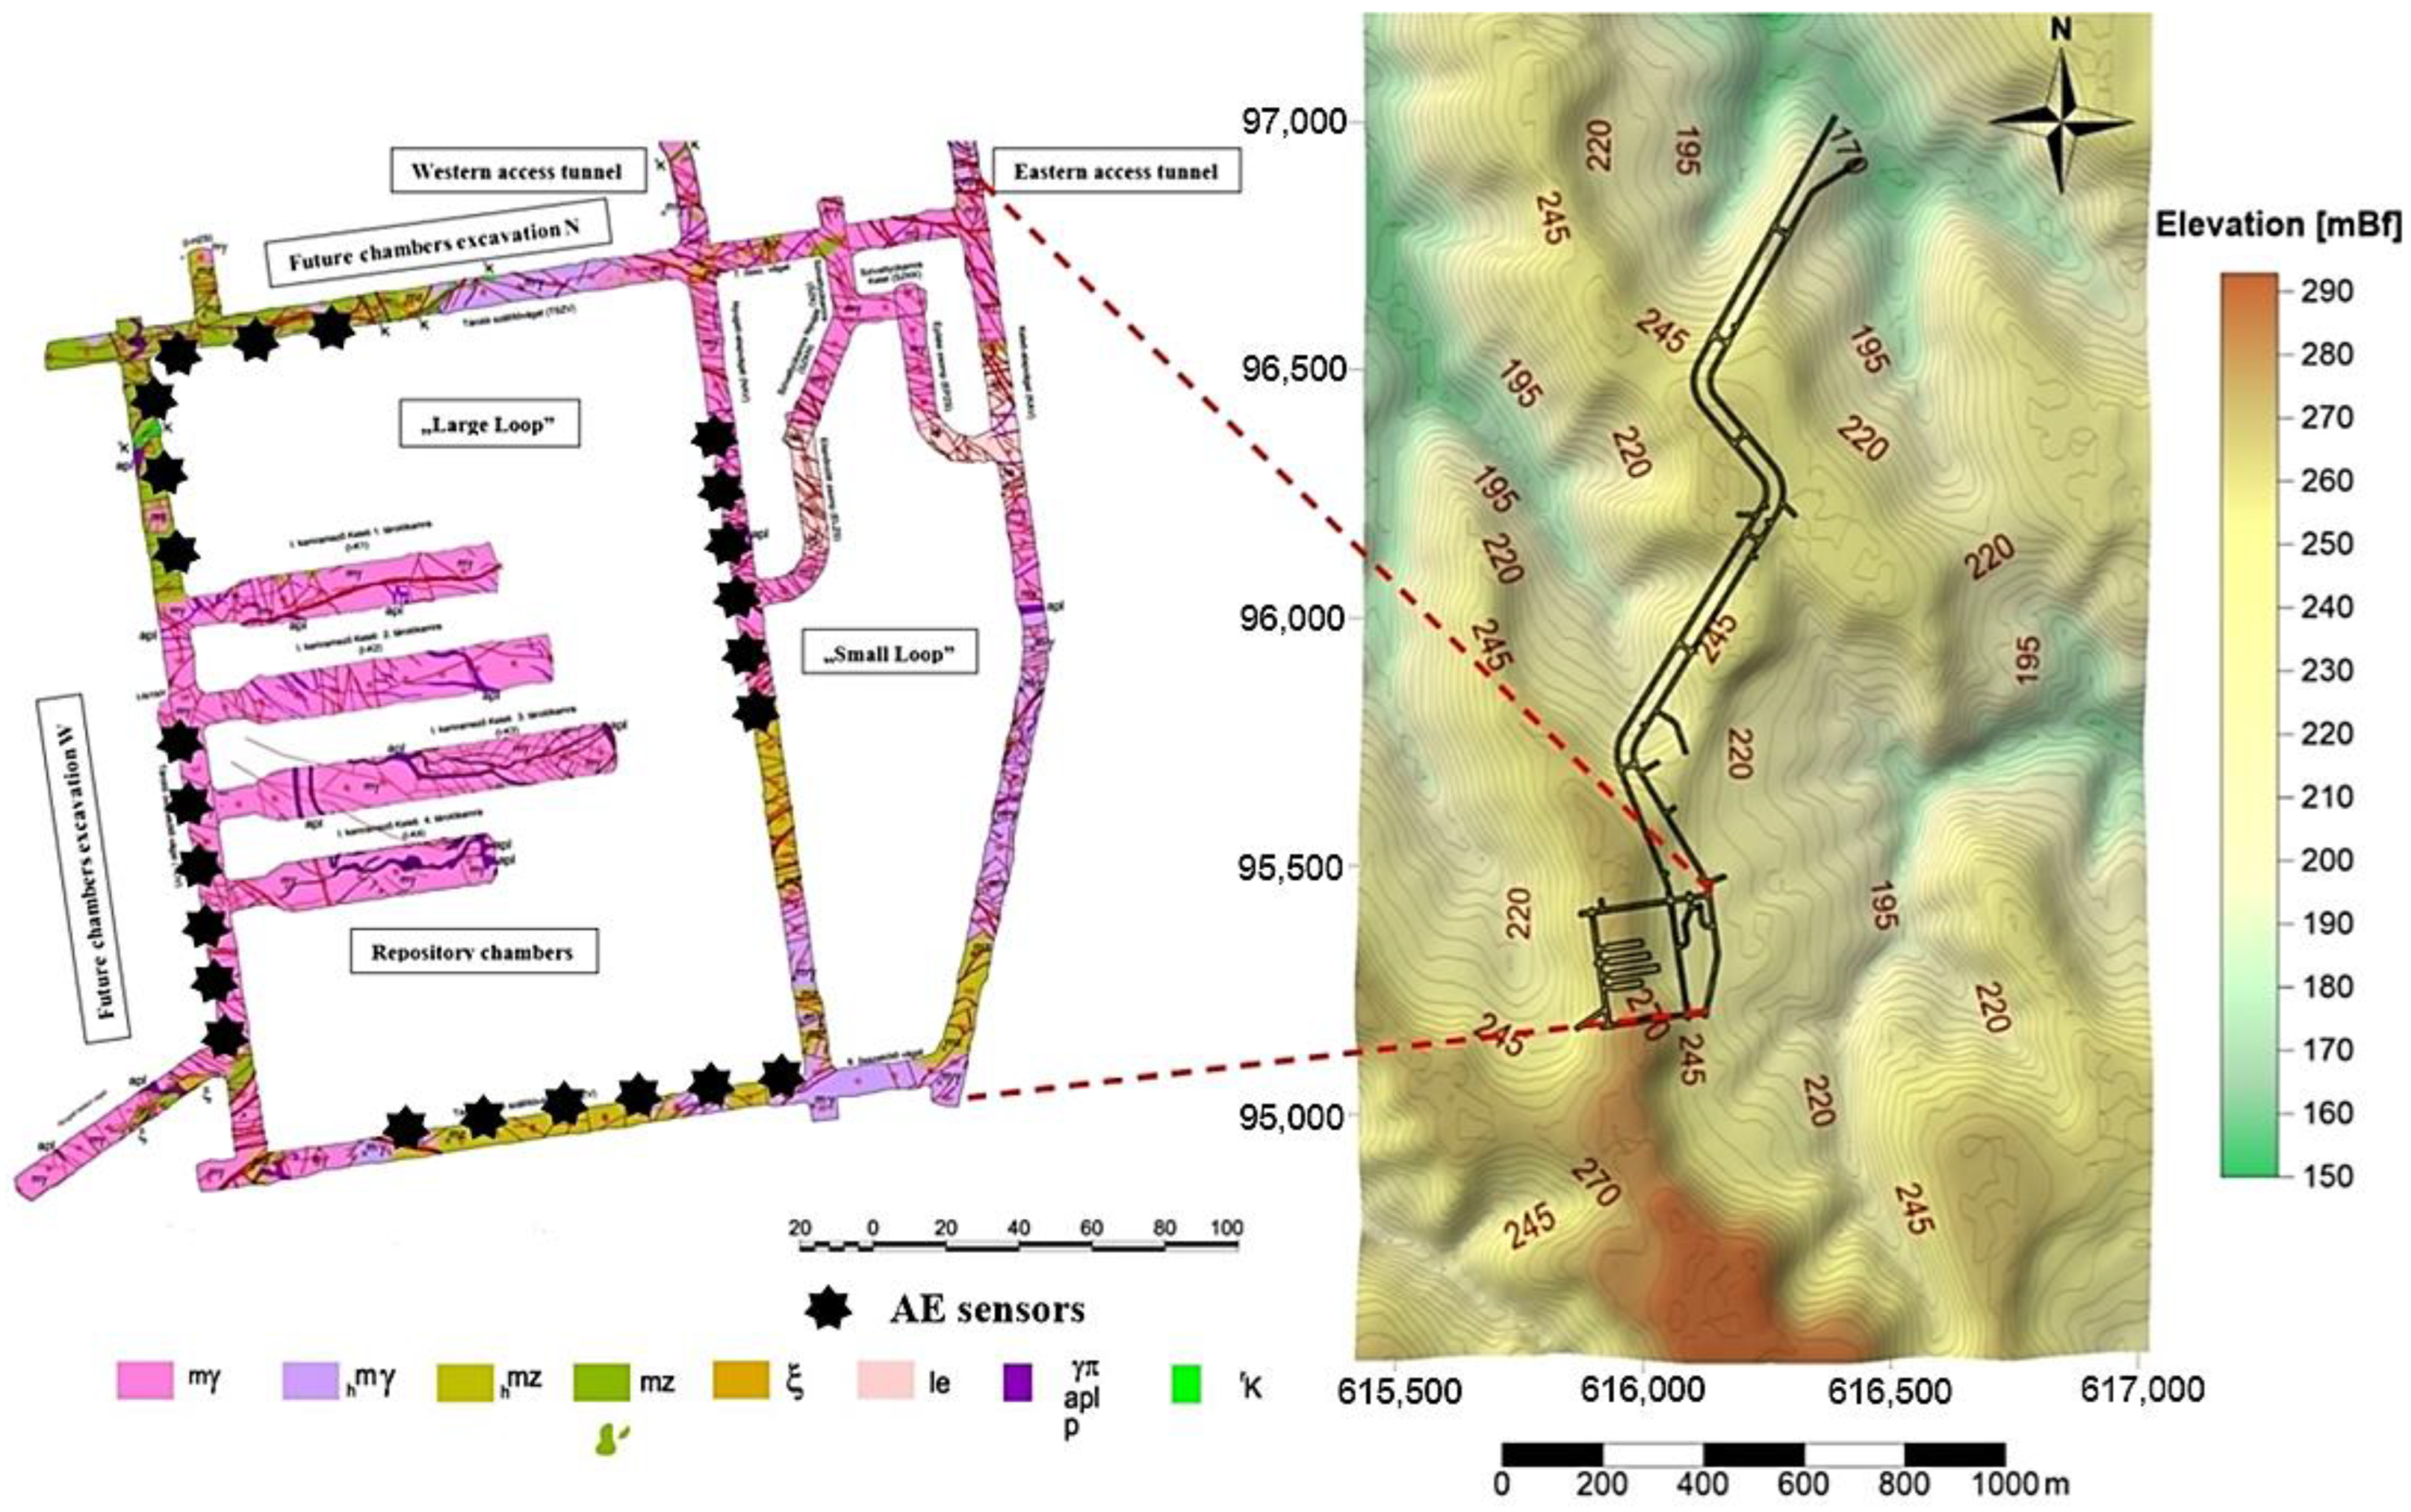
In a granitoid formation, near the Bátaapáti area of Hungary, the National Radioactive Waste Repository (NRWR) for low- and intermediate-level waste (LLW/ILW) has been under development. It was established mainly for the disposal of LLW/ILW from Hungarian nuclear power plants. A typical Deep Geological Repository (DGR) is typically designed at a depth of around 500 m or more, however, the NRWR site was developed at a location with an overburden thickness of 240–270 m in a granitic block (
Figure 1). The Public Limited Company for Radioactive Waste Management (PURAM) of Hungary, based on the authorization contained in the Hungarian Atomic Act, is tasked with the construction and operation of the NRWR.
Back-calculation is generally based on a small number of key measured parameters and the development of a relation with, for example, a least squares or error minimization approach [
1,
2]. This technique typically utilizes a numerical approach, which aims to match its measured values as closely as possible by adjusting the rock mass parameters and stresses to obtain the desired outcome. Back-analysis cannot always derive a unique solution, unlike forward analysis, which provides a unique solution and determines an output, such as displacement and stress from inputs such as geological structures [
3].
Numerous studies have used deformation measurements as back-analyses inputs [
4,
5,
6,
7,
8,
9,
10]. An important note is that large, abnormal deformation is generally associated with a rock mass’s failure above the post-peak threshold; deformation measurements are frequently inadequate at preventing anomalous deformations at the residual strength level. This means that, typically, with large deformations, the model is already being back-analyzed for the worst-case scenario. However, most DGRs that are developed in granitic rock masses tend to have small or localized deformations that are not typically best monitored by extensometers. Rather, the deformation is typical of a brittle nature, which means that AE monitoring techniques are well suited for determining when cracks first initiate prior to the localization and crack propagation, leading to large deformations and failure.
In order to monitor the pre-peak, peak, and post-peak crack behavior from changes in the stress within the rock mass, AE sensors can be installed underground. This makes it ideal to back-analyze the Excavation Damage Zones that develop around underground excavations. AE monitoring can provide cardinal information for characterizing this rock mass behavior at all deformation stages. In addition to typical monitoring techniques, such as extensometers, AE monitoring has been studied in several underground projects, e.g., [
1,
2,
3,
4]. In addition, the behavior and effectiveness of the rock support system can also be checked by using the same AE sensors and developing a correlation between the AE activity and the rock support [
1,
2,
10].
Besides the many laboratory studies on the AE activity in intact rock tests, there have been numerous in situ AE/MS (micro-seismic) studies [
1,
2]. A notable study was undertaken at the Underground Research Laboratory (URL) in Canada, where AE monitoring was undertaken during a mine using an experiment [
9]. The primary goal of the experiment was to investigate the mechanisms underlying the progressive failure of brittle rock and the development of excavation-induced damage around the underground openings [
5]. Based on an analysis of the AE data, a set of phenomenological criteria, or so-called thresholds for crack initiation (CI) or damage initiation, have been developed to predict the occurrence of rock and rock mass fracturing [
9,
10,
11]. This criterion has worked in laboratory tests and homogeneous, massive rock masses when induced fractures have initiated at approximately 30% of the intact compressive strength. This was true for the Canadian URL, where
σ1 −
σ3 ≈ 0.33
σc (
σ1 −
σ3 ≈ 64 MPa) or 33% of CI [
2]. The problem with these approaches is that they are based on assumptions that rock mass behaves similar to intact rock samples at the laboratory scale, and this is not the case for jointed rock masses, where a consistent relationship between the strength and stress does not agree with the intact lab-derived CI thresholds (30–50%), such as what was found in the ZEDEX tunnel at Aspo URL, where
σ1 −
σ3 ≈ 0.13
σc (
σ1 −
σ3 ≈ 25 MPa), for instance CI = 13% of the intact rock strength [
1].
The presented investigation is based on the experiences that changes in the stress field are linked to the AE activity in a rock mass. The uniaxial compressive strength of the rock mass is related to the stress level required for the AE initiation. The crack damage of the intact rock is reviewed and discussed shortly to form a basis for further studies.
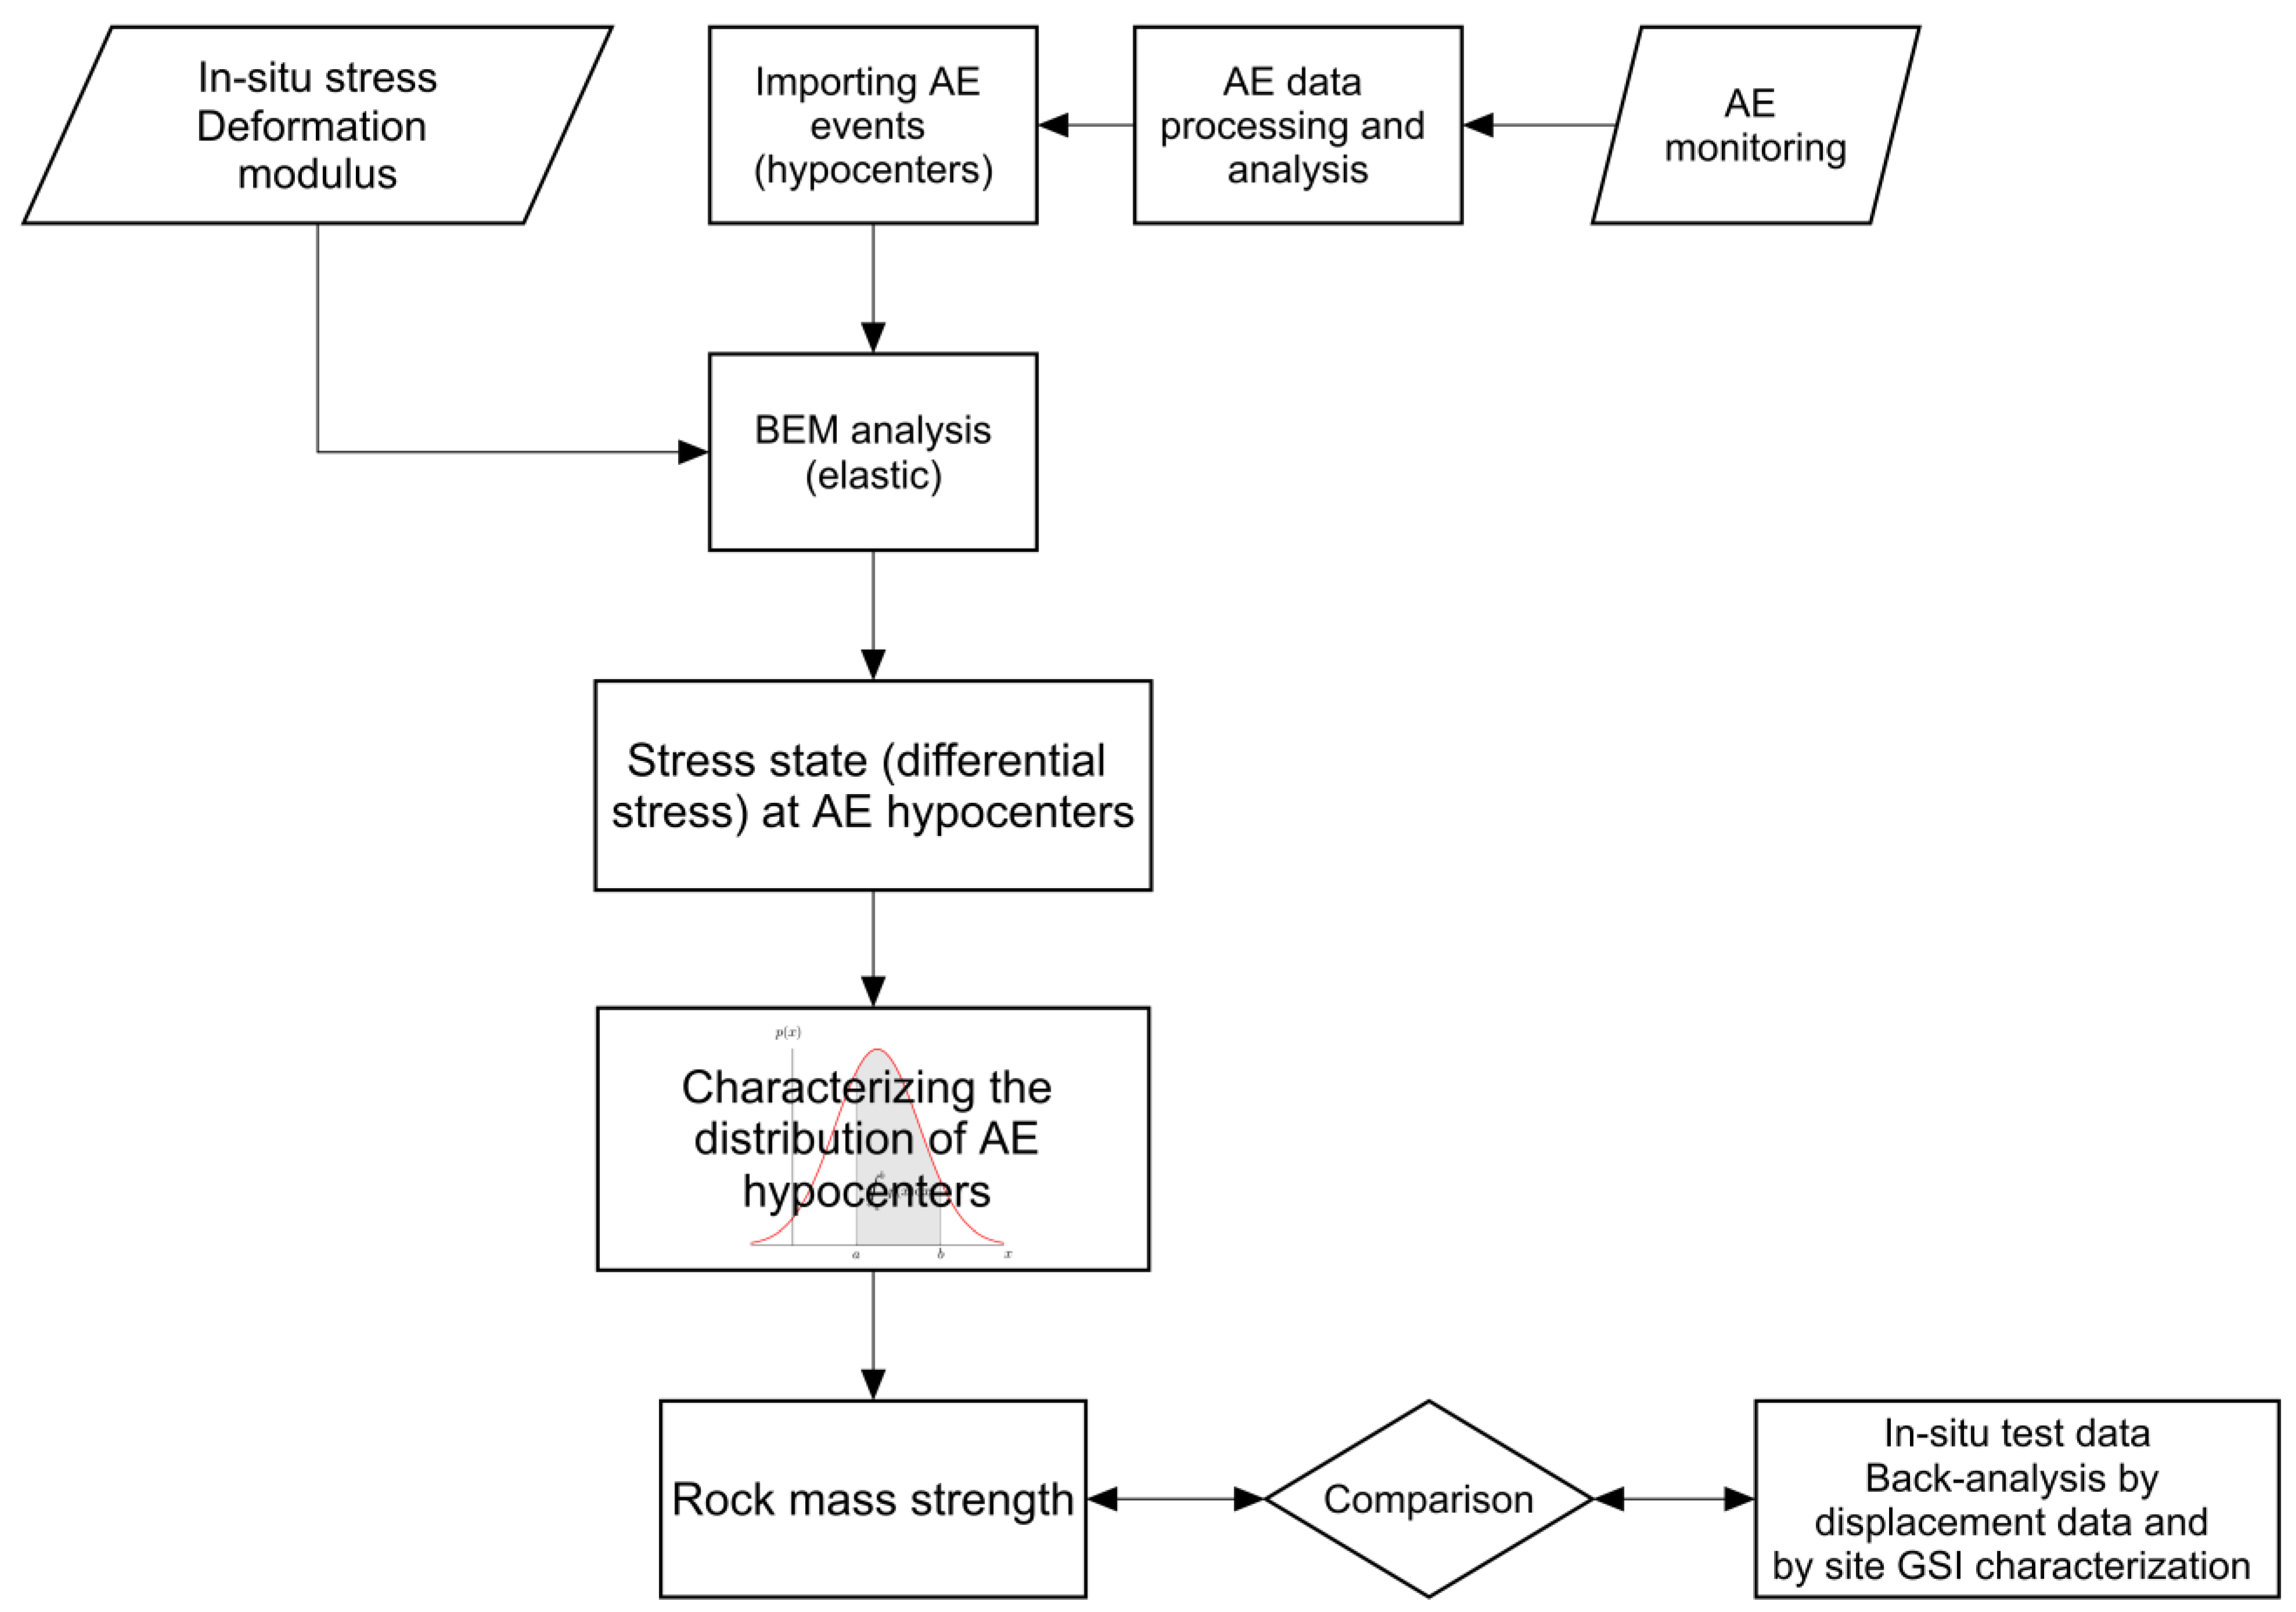
The CI and damage failure surfaces in a principal stress space can be described by a deviatoric stress criterion. The generalization used in this study is based on rock mass damage in situ, as determined from the AE/MS measurements in the NRWR underground facility, combined with detailed rock mass quality assessment techniques. CI and crack damage (CD) are used in this study, as they have also been used by others, as the onset of damage (initiation) and crack coalescence that lead to the formation of macroscopic cracks, corresponding to AE initiation and AE damage, respectively. The differential stress conditions around the underground excavations are investigated using 3D boundary element (BEM) numerical modelling. The AE/MS hypocenter distribution is then correlated with the differential stress concentrations of the BEM modelling results. Followed by a complex statistical process, the average and different percentiles of the differential stress values that correspond to the AE hypocenters are examined.
The approach used herein is based on the idea that the AE initiation threshold of rock masses can be generalized [
1,
2]. The observations come from a data analysis of laboratory measurements and hard rock excavation monitoring programs, using AE and MS techniques. Additionally, back-analysis has become an important procedure for the observational approach commonly employed in underground excavation construction [
5,
7].
Besides conventional monitoring techniques, such as extensometers or load cells, AE monitoring has been investigated at several underground construction sites [
8,
9,
10,
11].
The CI and CD thresholds suggested and used for intact rocks are then generalized for jointed rock masses based on the Cai et al. theory [
1,
2] and applied to the AE data from the Bátaapáti excavations to determine the rock mass parameters and stress conditions in the repository chamber area.
2. Geotechnical Background
According to the experience gained during the excavation of the existing tunnels in Bátaapáti, the rock mass quality in the Mórágy Granite—and thus its geotechnical condition—is primarily determined by the faults and joint networks formed during the tectonic evolution of the area. Based on a core scanner image examination and underground field mapping, a total of six major paleo-stress fields, including a large number of multidirectional fracture networks and generations, have been identified [
12,
13]. Due to the various stress fields, the previously incurred fracture systems underwent varying degrees of deformation. Consequently, a complex network of fracture zones and cracks with widely disparate widths, orientations, and infilled materials developed. Due to the other tectonic phenomena overlaid at earlier occurrences, the spatial history of individual cracks is typically uneven and challenging to follow. Most frequently, their exact positions are unpredictable. It was also discovered that it is impossible to identify the typical fracture-infilling materials that can be categorized into phases separated on the basis of unique stress field directions, as a consequence of the additional research for comprehending the rock mass in this study [
14]. Along with the site’s individual cracks, thicker fracture belts of up to 10 m wide, which are primarily filled with clay minerals, are also significant from a geotechnical and hydrogeological standpoint.
In the first phase of the NRWR research [
14,
15,
16], it already became clear that the rock mechanical–geotechnical characteristics exhibited a high inhomogeneity as a result of the geological and tectonic prehistory of the Mórgy Granite Formation, and, as a result, their spatial extensions at the site and in the neighborhood are fairly constrained.
In many cases, the inclined access tunnels and repository chambers cross large-scale alkali volcanic veins. These features indicate a marked change in the documented rock mass quality. The sever deterioration of the rock quality was caused by the fractured, crumbled, brecciated zone of this tectonic damage region in the case of the fracture zones. As expected in the case of the veins and brittle fractures, the intensity of the water inflows also increased.
In cases where the excavation crosses larger fault zones with core zones and boundaries consisting of decomposed clay, soil-like material should be characterized by a soil mechanics approach in the design.
During the excavation of the underground facility, the GSI, RMR89, and Q values were determined [
15,
16,
17]. The design of the rock support system of the NRWR was based on the Q method. The classifications of rock mass rating methods are highly dependent on the subjectivity of geologists [
18]. During the few years of experience in the NRWR project, an effort was made to minimize this subjectivity by automating the calculations and through collective field documentation, discussions, and the testing of photo-realistic 3D models by the site geologists.
The results have also become more consistent over the years for different geologists by implementing these collection strategies.
At the “Repository chambers” and “Future chambers excavation W” areas (
Figure 1), the rock mass has been integrated into a larger interval GSI = 30–60, with a mean GSI = 39–44 [
16].
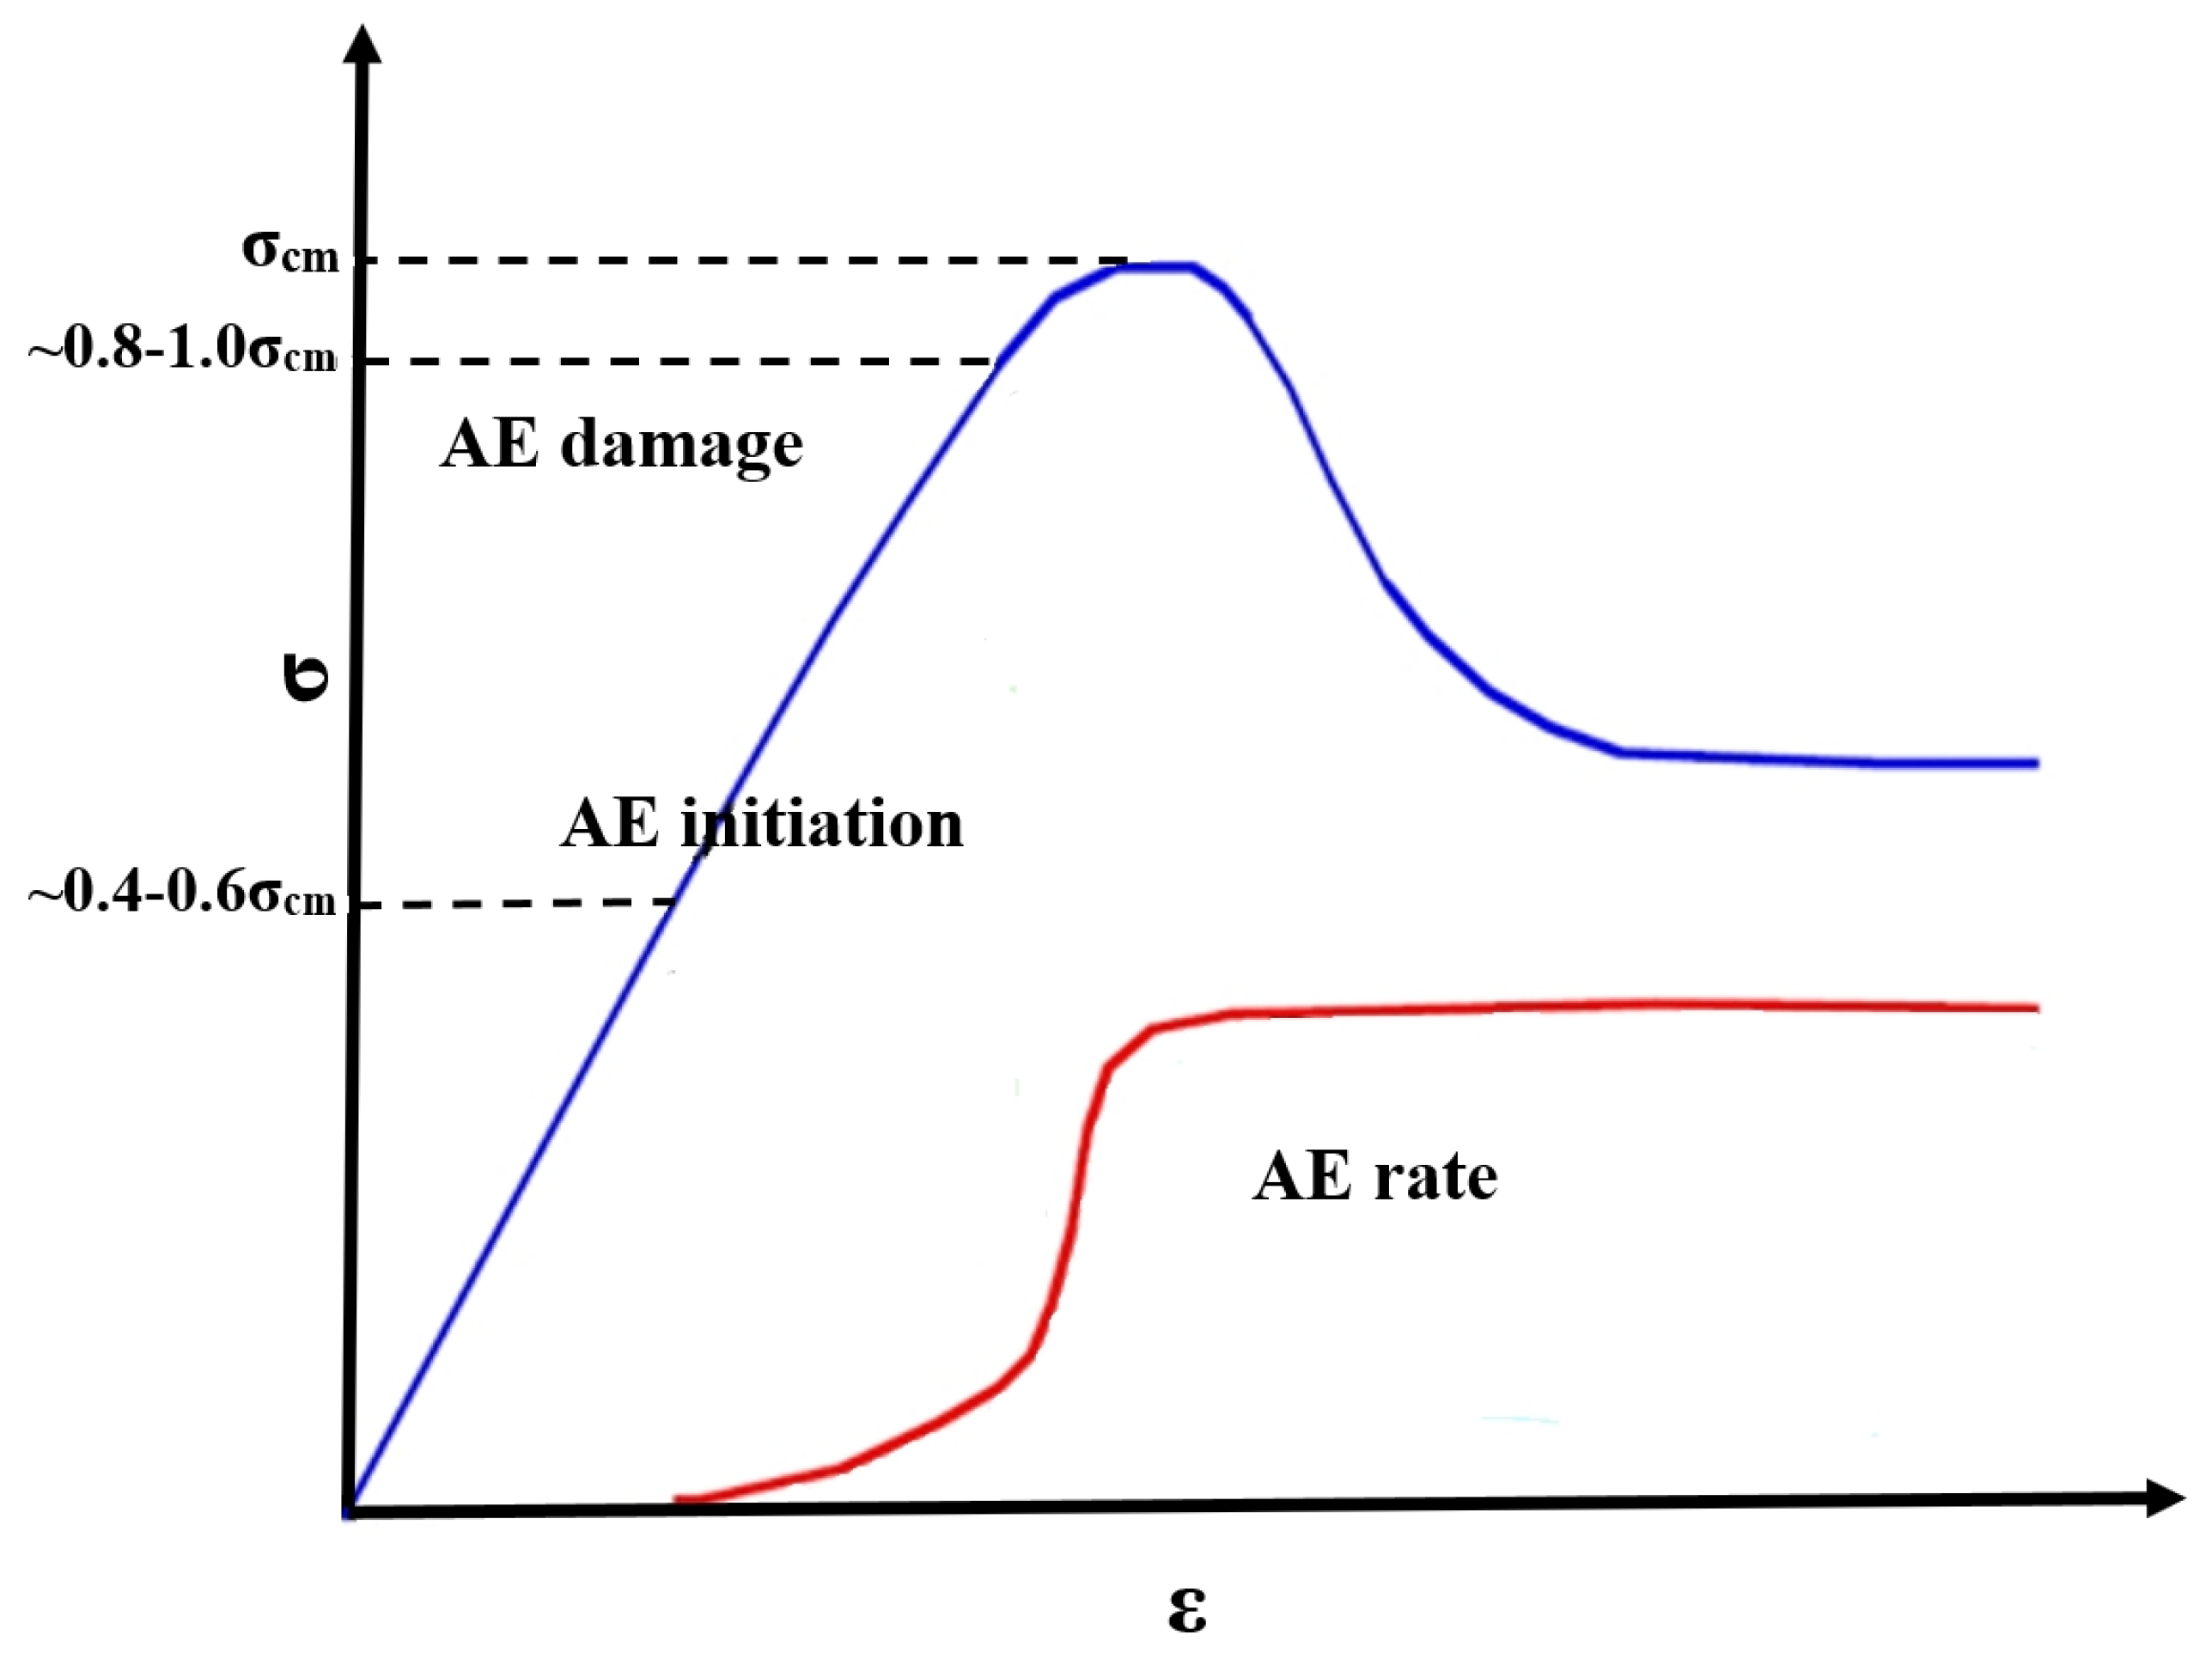
In nature, rocks contain pores, flaws, or microcracks. These microcracks are sources of stress concentrations that result in the propagation of cracks when the load on the rock exceeds a specific threshold and is connected with AE [
1]. In the stress–strain relationship,
σcc is the stress level of the crack closure,
σci is the stress level of the crack initiation, and
σcd is the stress level of the crack damage, which correspond to the long-term rock strength [
4,
10,
19]. AE rates start at
σci and increase dramatically when
σcd is reached. The maximum AE rate is usually reached near the peak strength
σc.
σc depends on the loading rate; the higher the loading rate, the higher
σc usually is. The stress levels
σci,
σcd, and
σcm constitute crucial junctures in the growth of the macroscopic failure processes of intact rocks.
The main findings based on past laboratory tests from the literature are as follows:
Crack (AE) initiation begins at stresses equivalent to 30–50% of the unconfined compressive strength [
4,
20,
21,
22].
Microcracks form or propagate primarily in a direction parallel to the maximum compressive stress. This is evident from the volumetric strain dilation [
23], a direct microscopic observation of test samples [
24,
25], and numerical modelling results [
26].
The start of fracture coalescence begins at stress levels of approximately 70–80% of the peak strength [
23].
Macrocracks or shear band formation typically follow after the peak strength is reached [
1,
2].
During the back-analysis, the research was based on the input parameters and modelling boundary conditions, and the results can correspond to the rock mass classification values (GSI = 42–50 interval) calculated from the CI thresholds and then from the rock mass strength. This is also reflected in the geological field documentation, so a significant under- or overestimation in the rock mass quality predictions could not be established in the present investigation.
3. Theoretical Background
In the case of intact rock laboratory tests, the CI stress level is characterized by the start of steady crack expansion. This can also be explained as the distance between zero and the crack volumetric strain [
10]. AE activity starts to occur in an increased manner when the stresses are above
σci. In some cases, when the samples have experienced damage during sampling, AE can be detected at the CC (crack closer) stage [
1] and can make this stage difficult to distinguish from CI. The conventional definition of the fracture damage stress is the point at which the volumetric strain reversal and unstable crack growth start. This crack growth is considered unstable since the crack density is such that the cracks begin to interact with each other and the sample will quickly fail, even if the load is removed.
Similar behavior has been hypothesized in situ [
10,
26]: when the stress limit is exceeded, new cracks develop in a steady manner and the old cracks begin to spread. Only when the fracture density is high enough for the cracks to start interacting and coalescing into shear bands or tensile spalls can critical rock mass damage occur. This is the “crack damage stress” state [
23] or “AE damage threshold”, since, generally speaking, cracking occurrences might be related to AE events. This also corresponds to the stress where a considerable increase in AE activity (the slope of the accumulated AE events increases sharply) is observed [
23].
The crack damage stress level
σcd becomes larger as the confining stresses increase; however, there is little confining stress at the wall of an excavation and the tangential is compressive. Hence, the unconfined
σcd should determine the onset of the failure propagation process in the field; however, empirical evidence suggests that the rock failure process actually begins when the tangential stress at the boundary exceeds 0.3 to 0.5 times the unconfined compressive strength (UCS) [
1].
In uniaxial compression, the CI stress level for most rocks falls in the range of 0.3–0.5. In triaxial tests, these stress levels are defined by the deviatoric stress (
σ1 −
σ3). It is seen that the
σci/
σc ratio varies between 0.36 and 0.60 and the
σcd/
σc ratio varies between 0.71 and 1.0 [
1]. Holcomb and Costin [
22] proposed a deviatoric relationship as
σ1 −
σ3 = 0.33
σc for massive, brittle materials. Martin [
4] reported for Lac du Bonnet granite that the CI level was:
and also described that brittle materials behave as frictionless materials at the damage initiation level.
Previous studies have indicated that the crack initiation stress level of intact rocks can be approximated by [
27,
28,
29]:
The main difference between Equations (1) and (2) is that the surface represented by the latter has a somewhat steeper slope in the principal stress space, indicating that some frictional force is mobilized at higher initial stress levels in brittle rock. The confining stresses are minimal towards the subsurface excavation surface, making the slope of the crack initiation surface of secondary concern. The confining tension in close proximity to an excavation wall ranges from 0 to a few MPa. In the low confinement area, the crack (AE)-starting threshold for undamaged rocks can be expressed as follows:
Equation (3) gives the crack initiation threshold by defining two material constants,
A and
σcd. The ratio of
σci = σcd is equivalent to the constant
A.
A is in the range of 0.4–0.6 [
1].
Failure of Rock Masses—Damage Initiation and Propagation
In case of jointed rock masses, analytical solutions have yet to be prepared to describe the damage thresholds typically observed in massive, brittle rocks. [
1]. The determination of these thresholds is mainly based on the measurement of the MS activity during construction. Another solution can be the definition of constitutive models obtained from a back-analysis of the displacement measurements.
AE/MS monitoring results in moderately fractured rock masses by shattering the rock bridges that connect the existing joints and crushing asperities; the degradation process is shown to have started inside the rock mass.
Cracking starts during underground excavations when the tangential stress concentration and confining stress stop loading the material. Cracks grow parallel to the cavity walls, which lead to the development of spalling.
This is why it is a high priority to characterize the UCS of a jointed rock mass for damage assessments.
For mechanics issues, the Hoek–Brown criterion is generally used to describe the peak strength of a jointed rock mass. The generalized Hoek–Brown criterion for jointed rock masses [
30,
31] is:
where
mb;
s; and
a are constants for the rock mass and
σc is the uniaxial compressive strength of the intact rock. For jointed rock masses, the constants can be determined from the classification of the rock masses according to the geological strength index (GSI) system, i.e., [
30],
where
D is a variable that depends on the amount of blast damage and stress relaxation that a rock mass has experienced (
D = 0 for a meticulous excavation with controlled blasting; in our investigation,
D was ignored by using the number 0). GSI values are suitable for characterizing a rock mass without direct access to the rock mass at the tunnel wall and can be approximated based on a geological description of the rock mass.
An analysis of the underground excavations in brittle rock eventually led to the development of the brittle Hoek–Brown parameters (
mb = 0,
s = 0.11) in [
32] for massive to moderately fractured rock masses with close interlocking, which fail due to spalling or spalling rather than shear failure [
1].
Only until a rock mass has been sufficiently damaged to become substantially cohesionless can the frictional strength be activated. Assuming
mb = 0;
s = 0.11 in Equation (4) and using
D = 0, the crack damage stress threshold can be obtained as [
1]:
Following this, the above equation can be rewritten as:
where
B is a constant and
σcm is the wall rock (rock mass) strength, which can be obtained using GSI [
1].
An important generalization of Equation (1) is that, by replacing CD with
σcm, the in- situ rock mass strength, Equation (1) becomes applicable to the damage initiation of jointed rock masses. The generalized crack (AE) initiation threshold is therefore defined as:
and the general crack threshold (AE) is defined in Equation (9). For intact rock without joints,
σcm is equal to the long-term UCS of the rock (
σcd).
A and
B are constants that depend on the rock properties and can be considered as material constants. In general,
A is in the range of 0.4–0.6 and
B is in the range of 0.8–1.0, for both intact and fractured rock masses [
1].
If the joints or foliation planes are unfavorably oriented, the crack (AE) initiation stress level gets closer to the crack (AE) damage stress level (
A > 0.6). Another general statement is that, in the case of granitic rocks with large grains, A is around 0.4–0.45, but for rocks with smaller grains,
A is around 0.5–0.6, such as for sandstone. For moderately or highly jointed rock masses,
A is in the range of 0.5–0.6 [
2].
4. AE Monitoring System
The seismoacoustic system in the Bátaapáti NRWR uses an acceleration sensor, type PI-A-3-1, which is self-developed equipment by Hungarian specialists [
33]. It enables highly sensitive acceleration measurements. High-bandwidth, high-sensitivity piezoelectric acceleration sensor signals are received by low-noise preamplifiers. After amplification and filtering, the X, Y, and Z direction acceleration signals are received by a three-channel analogue summing-converter. The summed signals are sent to the central unit via a shielded cable after the undercut filter. The functionality of the system can be checked with an electromechanical vibration test generator built into the sensor. The sensor is built into housing, which is resistant to environmental influences (water and steam) and electrical and magnetic interference, and integrated with an 11-core shielded cable [
34,
35].
The locations of the sensors inside the Bátaapáti NRWR repository chambers area of the underground facility is shown in
Figure 1. Using the regular installation of seismoacoustic monitoring systems, it was possible to establish the conditions of the host rock formation, initially in the access tunnels and cross tunnels approaching the repository chambers area and later inside of the repository chambers area. At first, the seismoacoustic monitoring devices were installed in the cross tunnels of the twin-inclined access tunnels due to the approach of the repository chambers area and the collected data were used to establish geotechnical and mining safety.
A declining trend in the energy content of the recorded AEs was typically used to illustrate how far away the tunnel face was from the monitoring stations as the tunnelling process progressed. The process of already-excavated mining areas aging is typically correlated with a decline in the frequency and intensity of the identified AE occurrences. Decision makers can benefit from extensive information (~Tbyte/month) provided by the monitoring results of continuous seismoacoustic imaging in time and space (hypocentre distribution and spectral content), which includes information on:
identifying the various phenomena associated with the interaction between the natural and built environment;
the trend analysis of the bedrock stress changes over time;
the empirical characterization and feedback of the engineering executions.
The monitoring results from the AEs were previously logged and visualized using self-programmed software, and after processing the raw data, a detailed examination was carried out to develop an AE back-analysis procedure, which is explained in more detail in the next section.
5. AE Back-Analysis from the Repository Chambers Area
In this study, a shorter period of AE monitoring was examined, which included the following events: after the installation of the monitoring elements and the test operation, the monitoring period followed by the excavation of the first two chambers, then a longer break in the tunnelling, then the excavation of the third and fourth chambers, and finally, a short period after the tunnelling activity ceased.
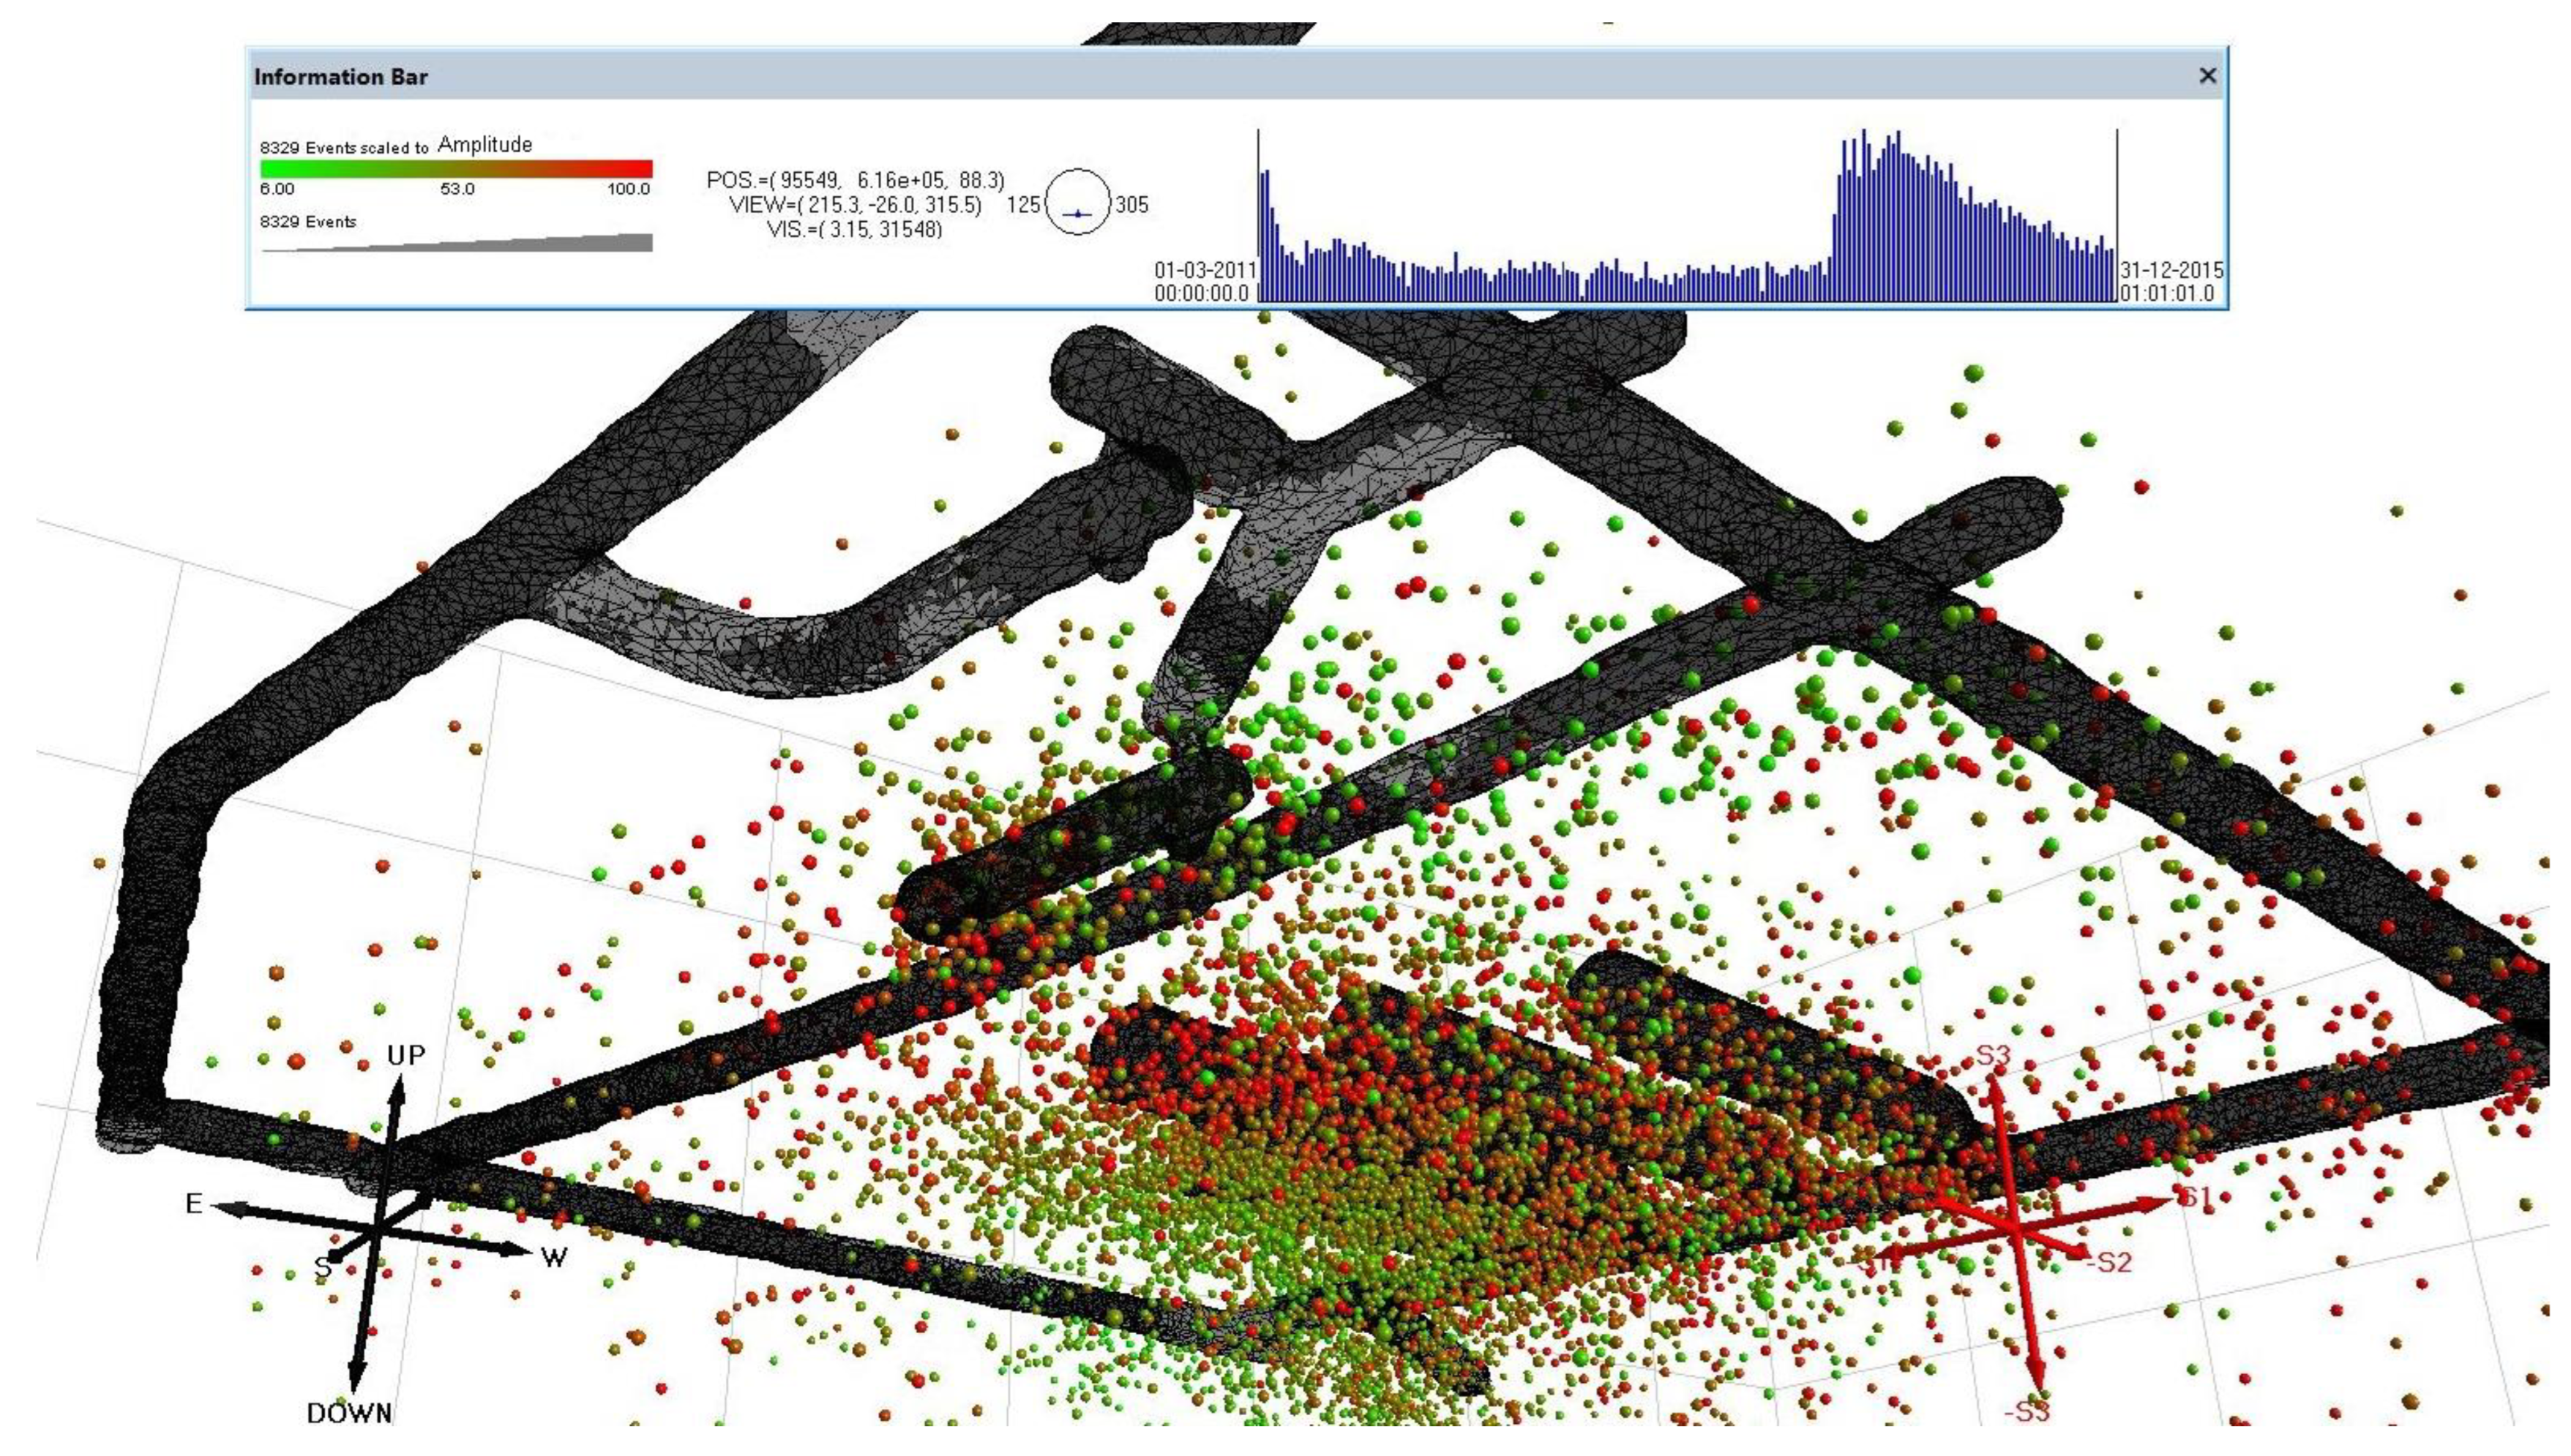
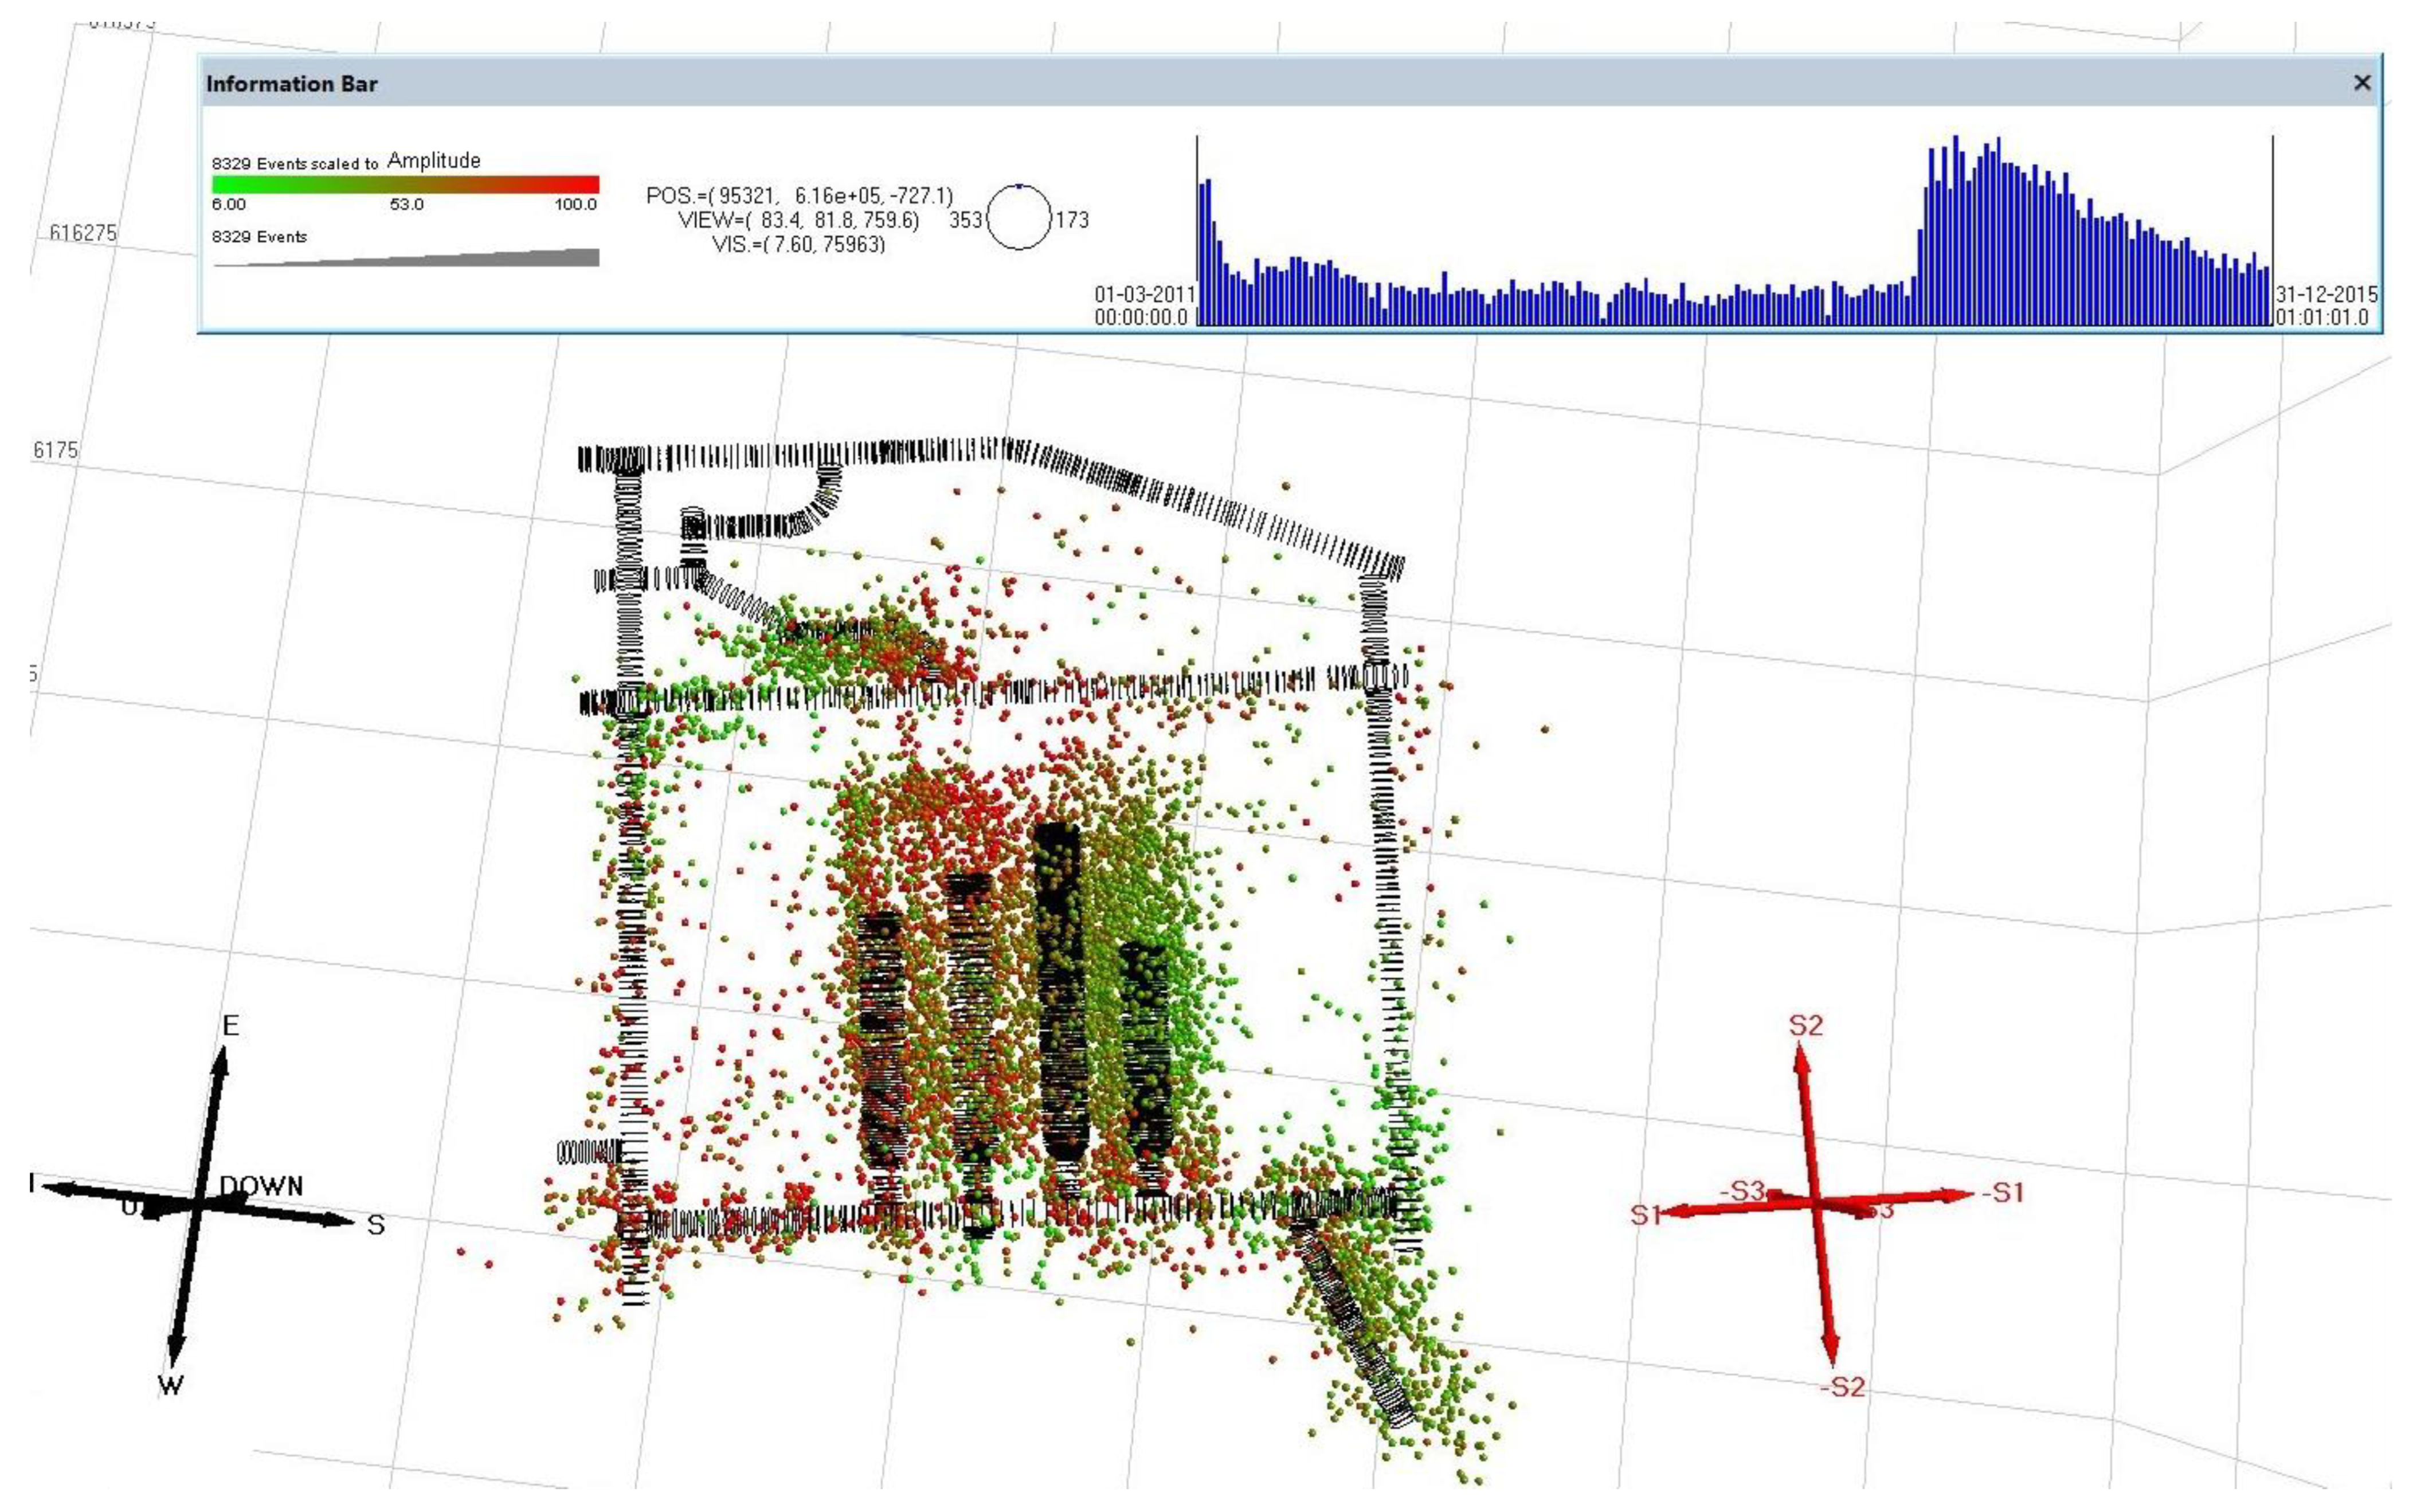
Between 1 March 2011 0:06 and 31 December 2015 21:54, a total of 19,141 AE events with measured magnitudes were recorded. Spatial determinations of hypocenters were obtained for 8329 of these cases (this was conditional on an adequate number of first arrivals). In the full study, the 8329 AE hypocenters for the intensity and time distribution analysis were used. Later, in the BEM studies, only 7402 hypocenters were used. The reason for this is that the geometry of the fully extended chamber area was examined without a time function, and due to a possible error in the inaccuracy of the spatial definition of the hypocenters, if a hypocenter fell into the excavated area of the underground cavity, it was deleted during the filtering (
Figure 2).
Firstly, several variations with temporal and intensity screenings were performed in the hypocenter study. Later, for time-dependent filters, the geometry of the repository chamber area with the geometry of the current time under study were displayed. For brevity, in this study, not all of the filtering steps (with the different excavation stages) are presented. Only the different spatial rotations of the whole measurement period are shown. A cluster analysis of the AE hypocenters was carried out using the InSite Lite software and EX3 (this is a BEM code from the Rocscience) (
Figure 3).
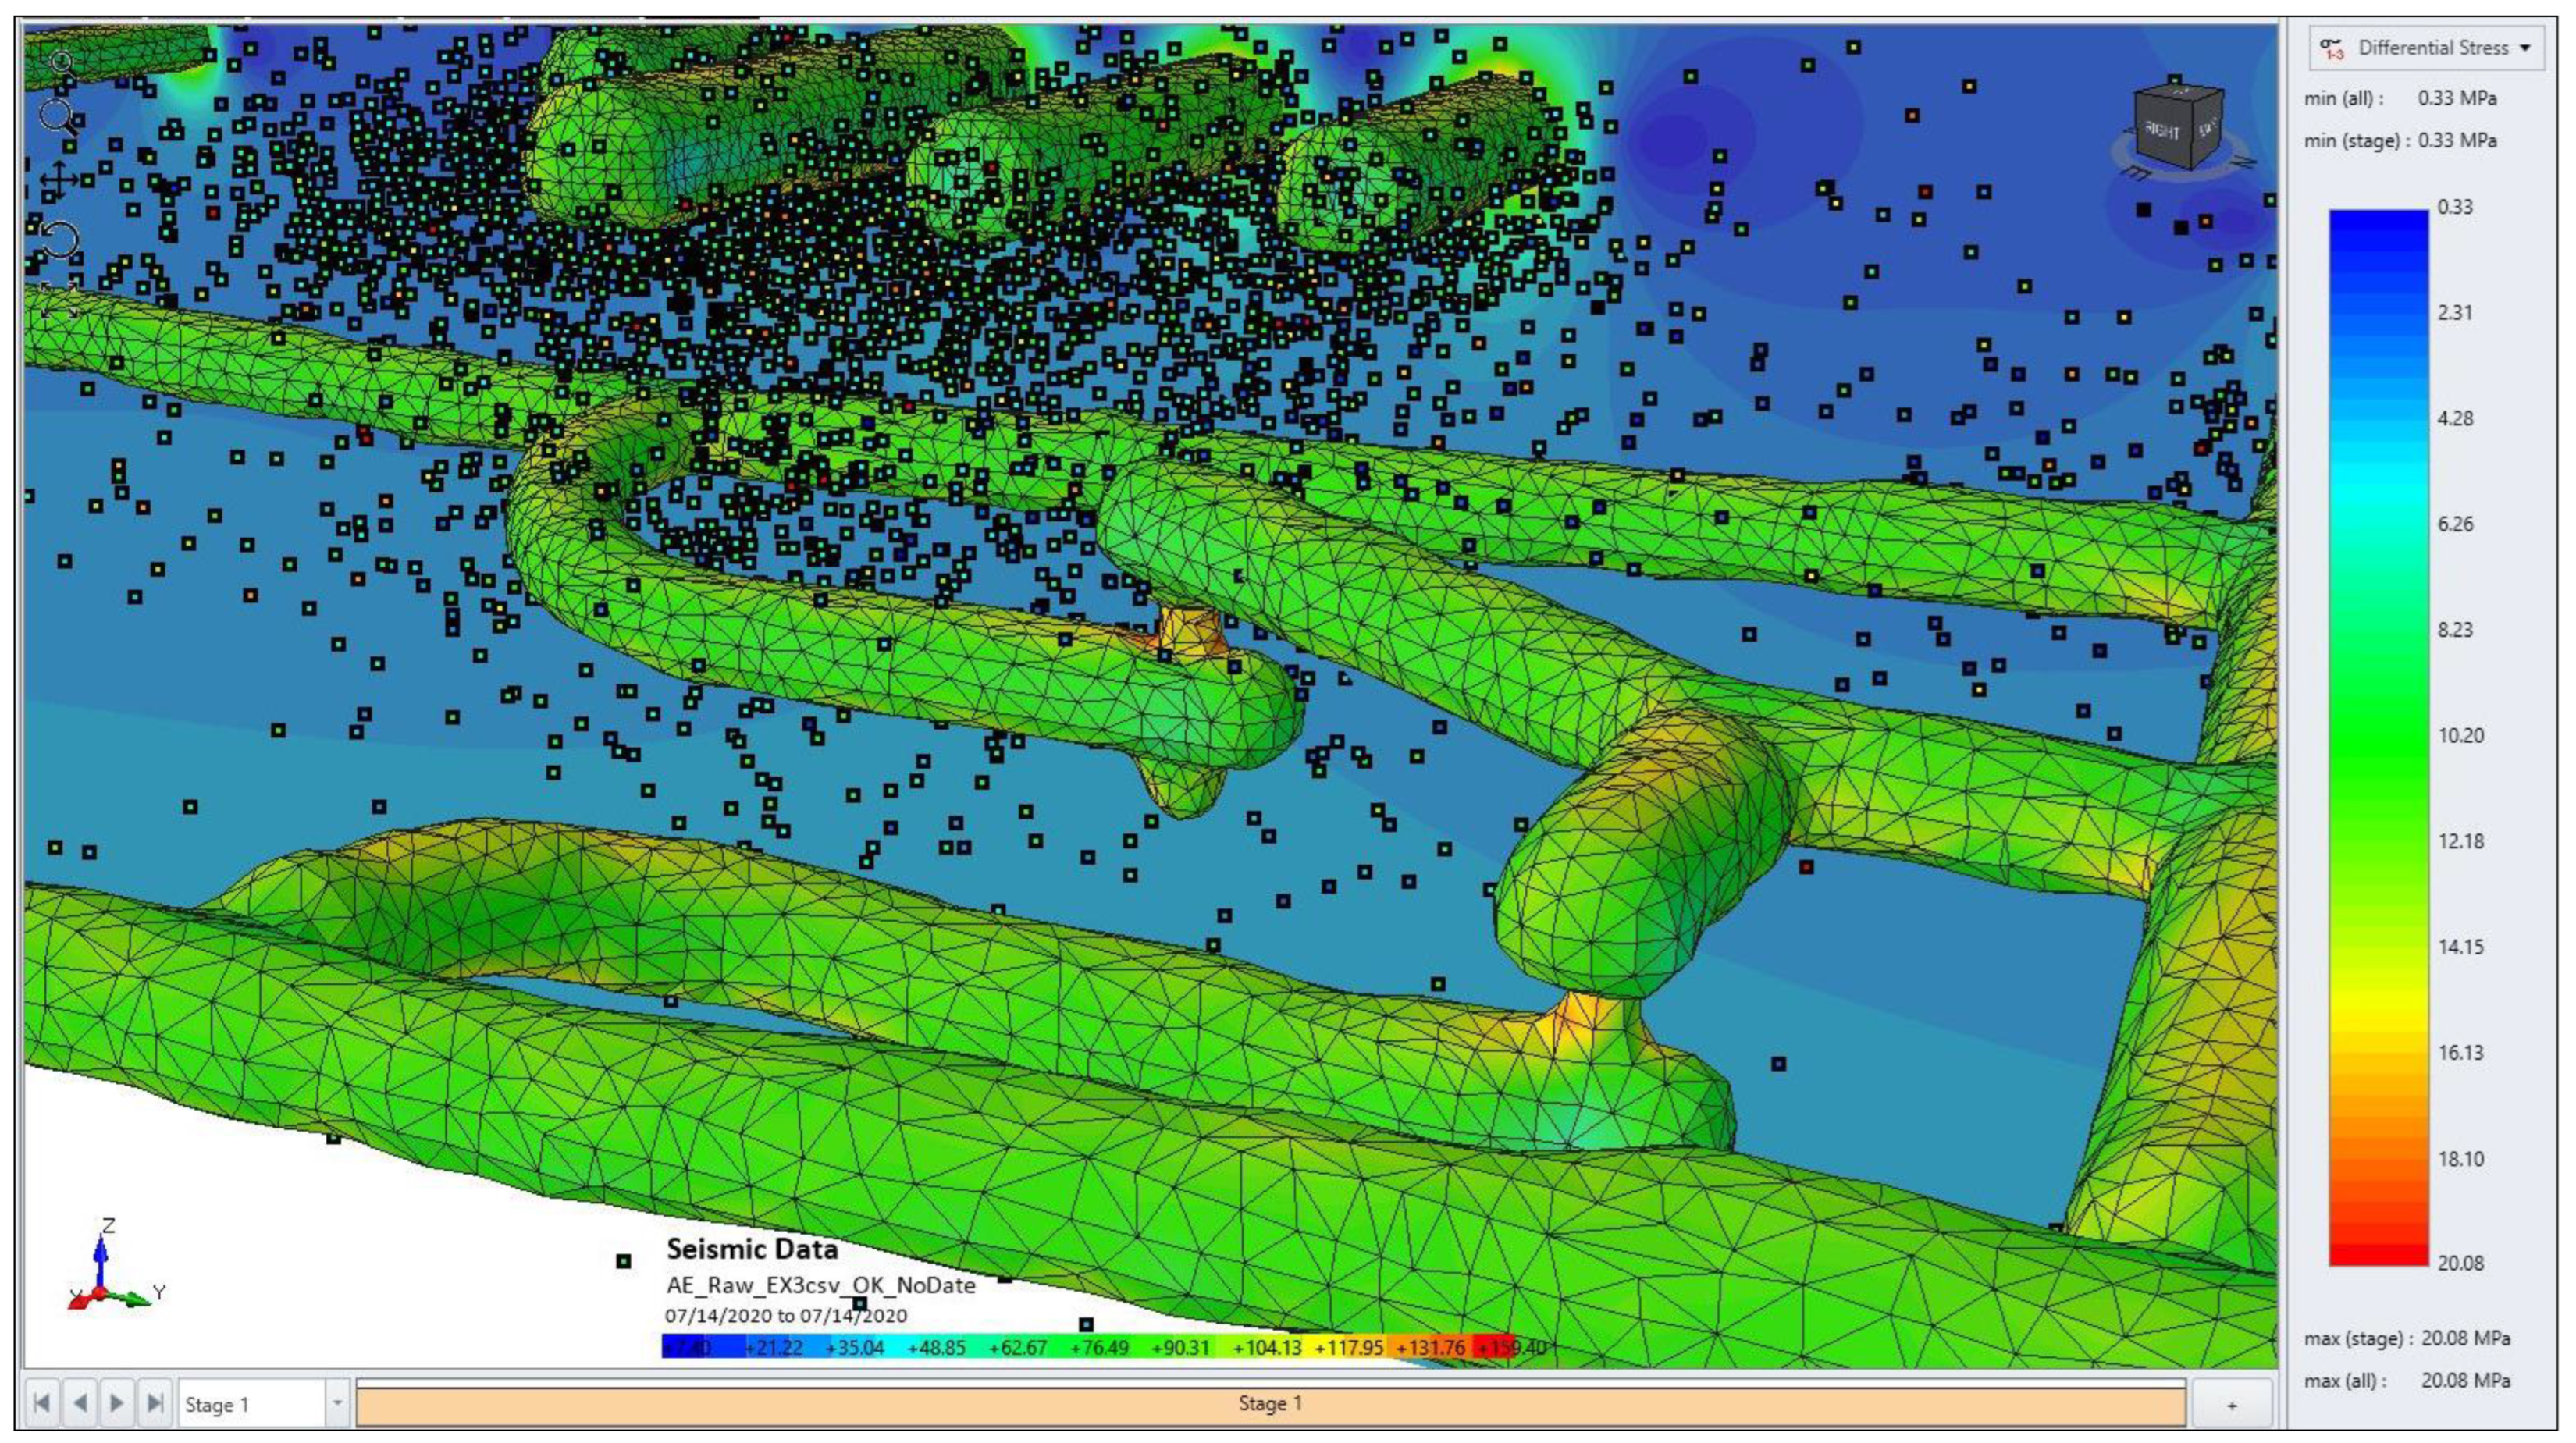
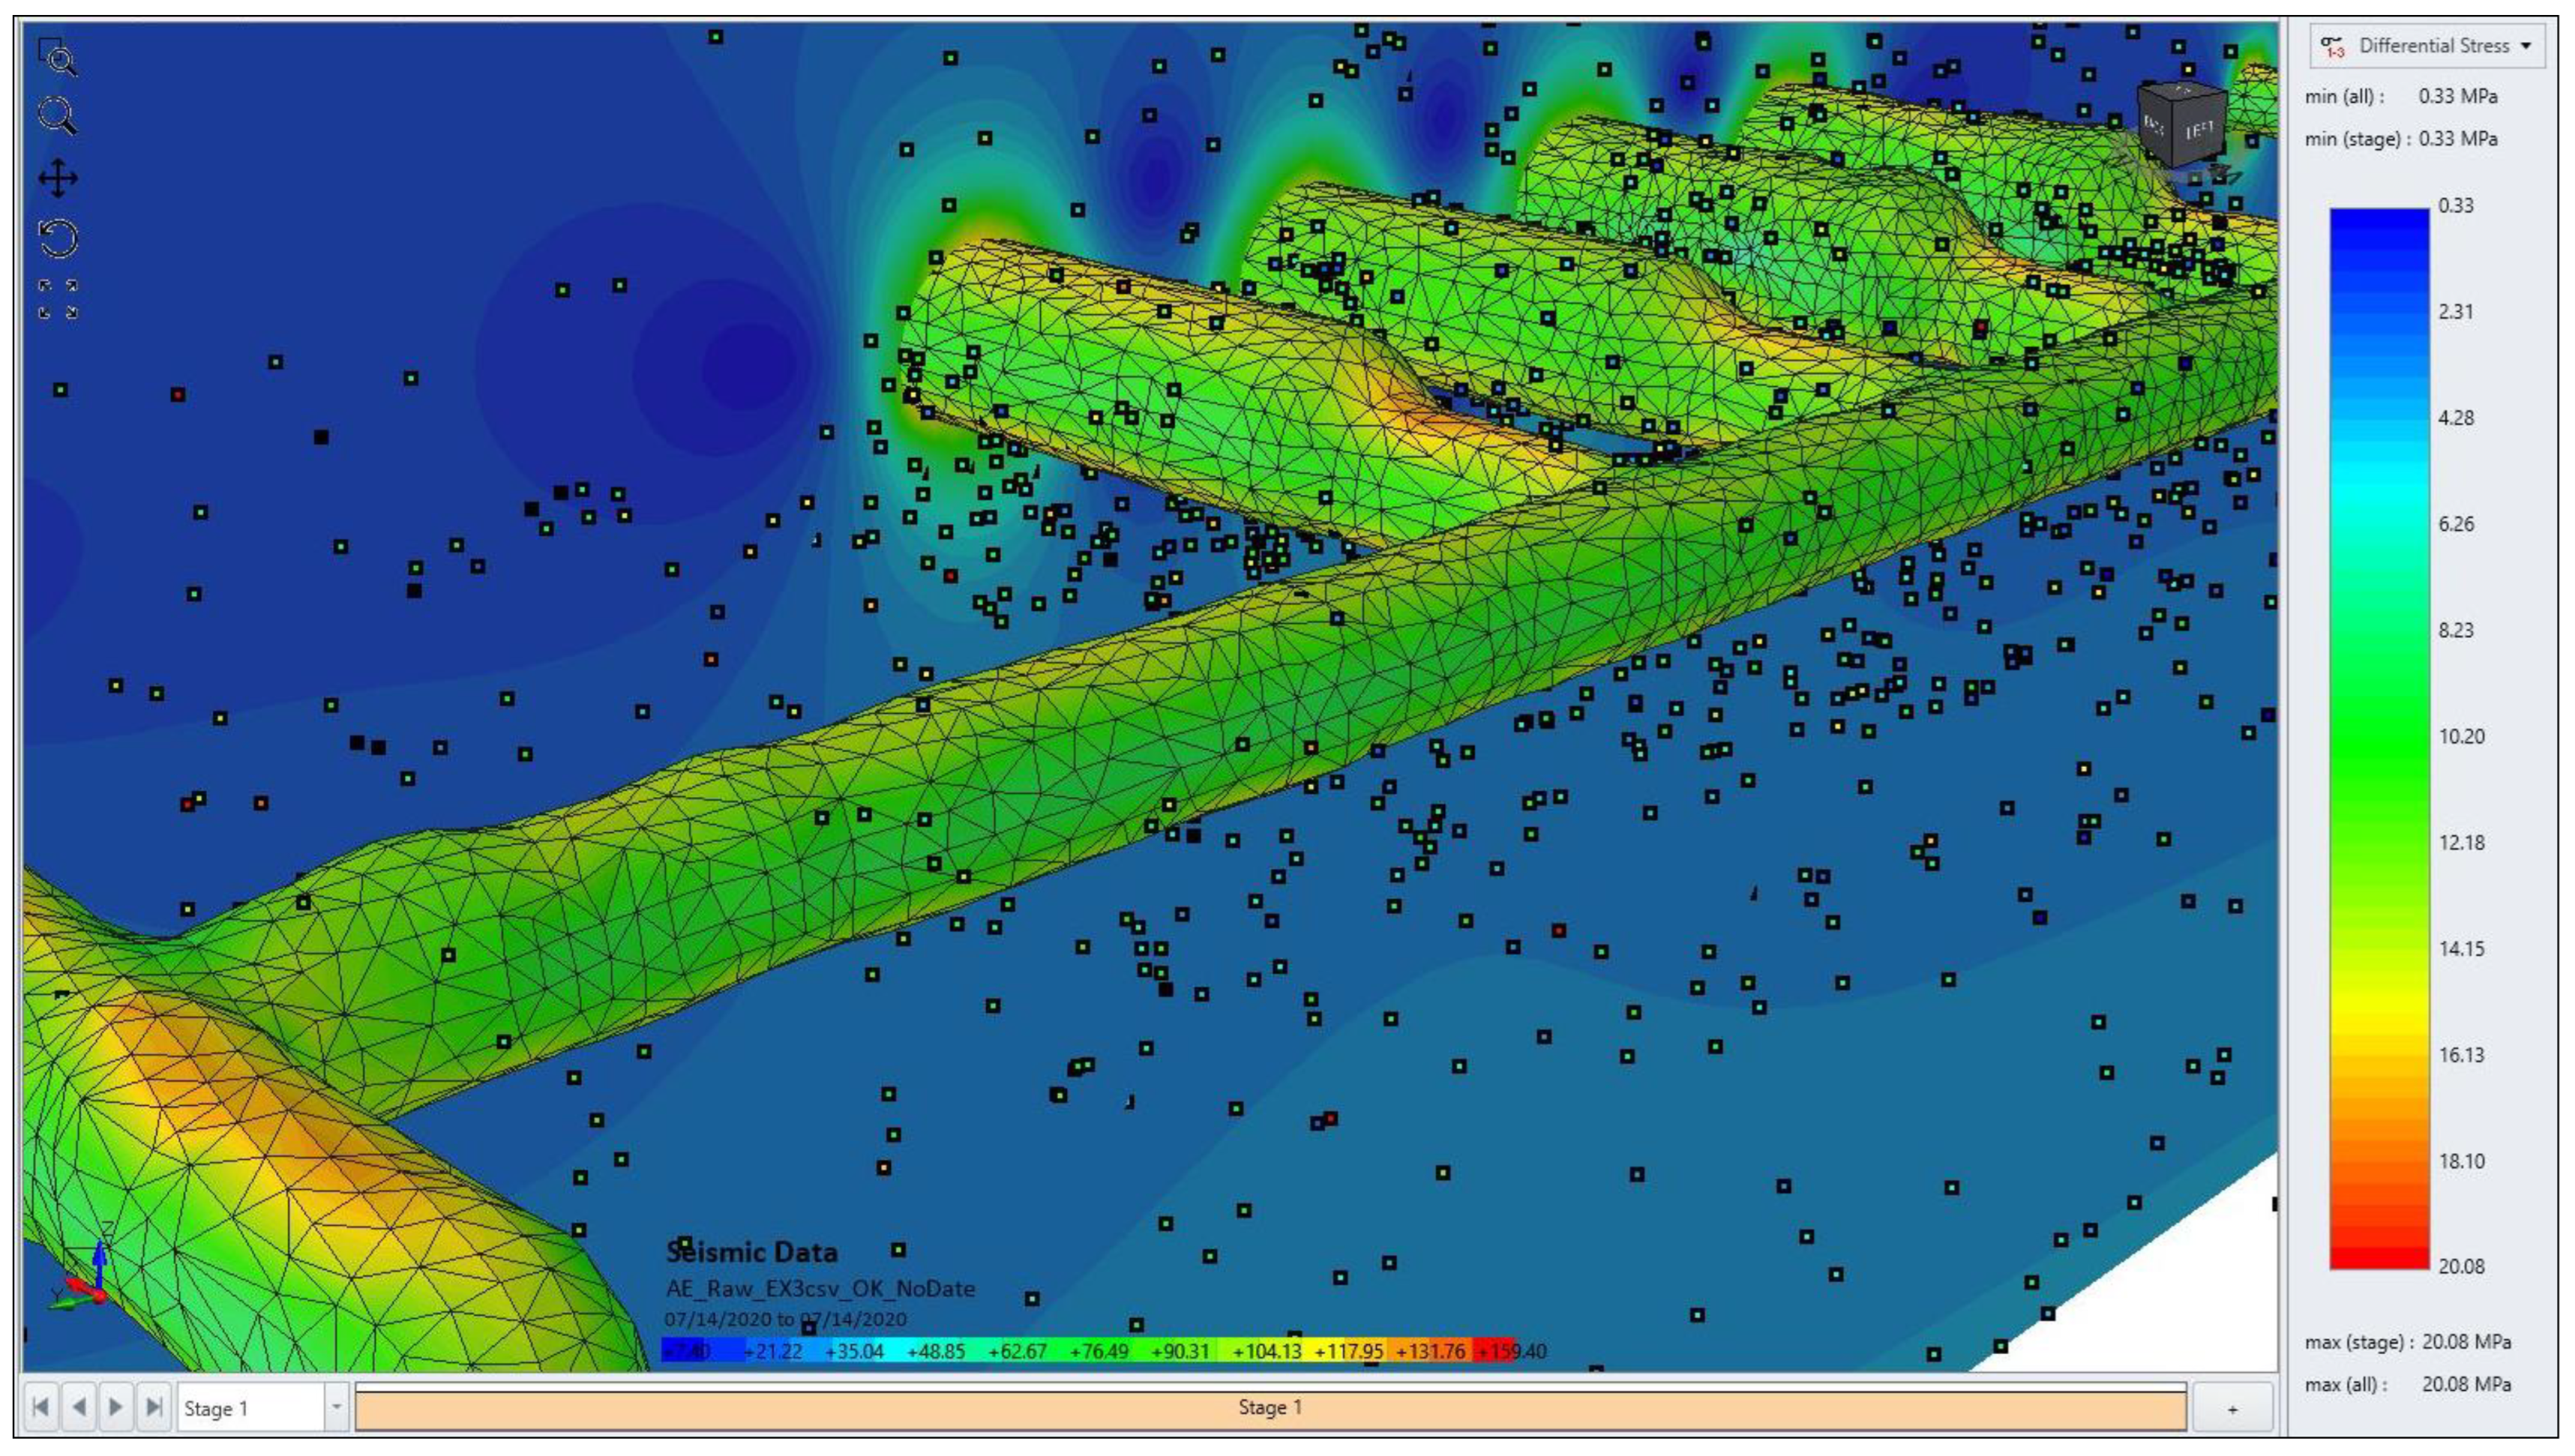
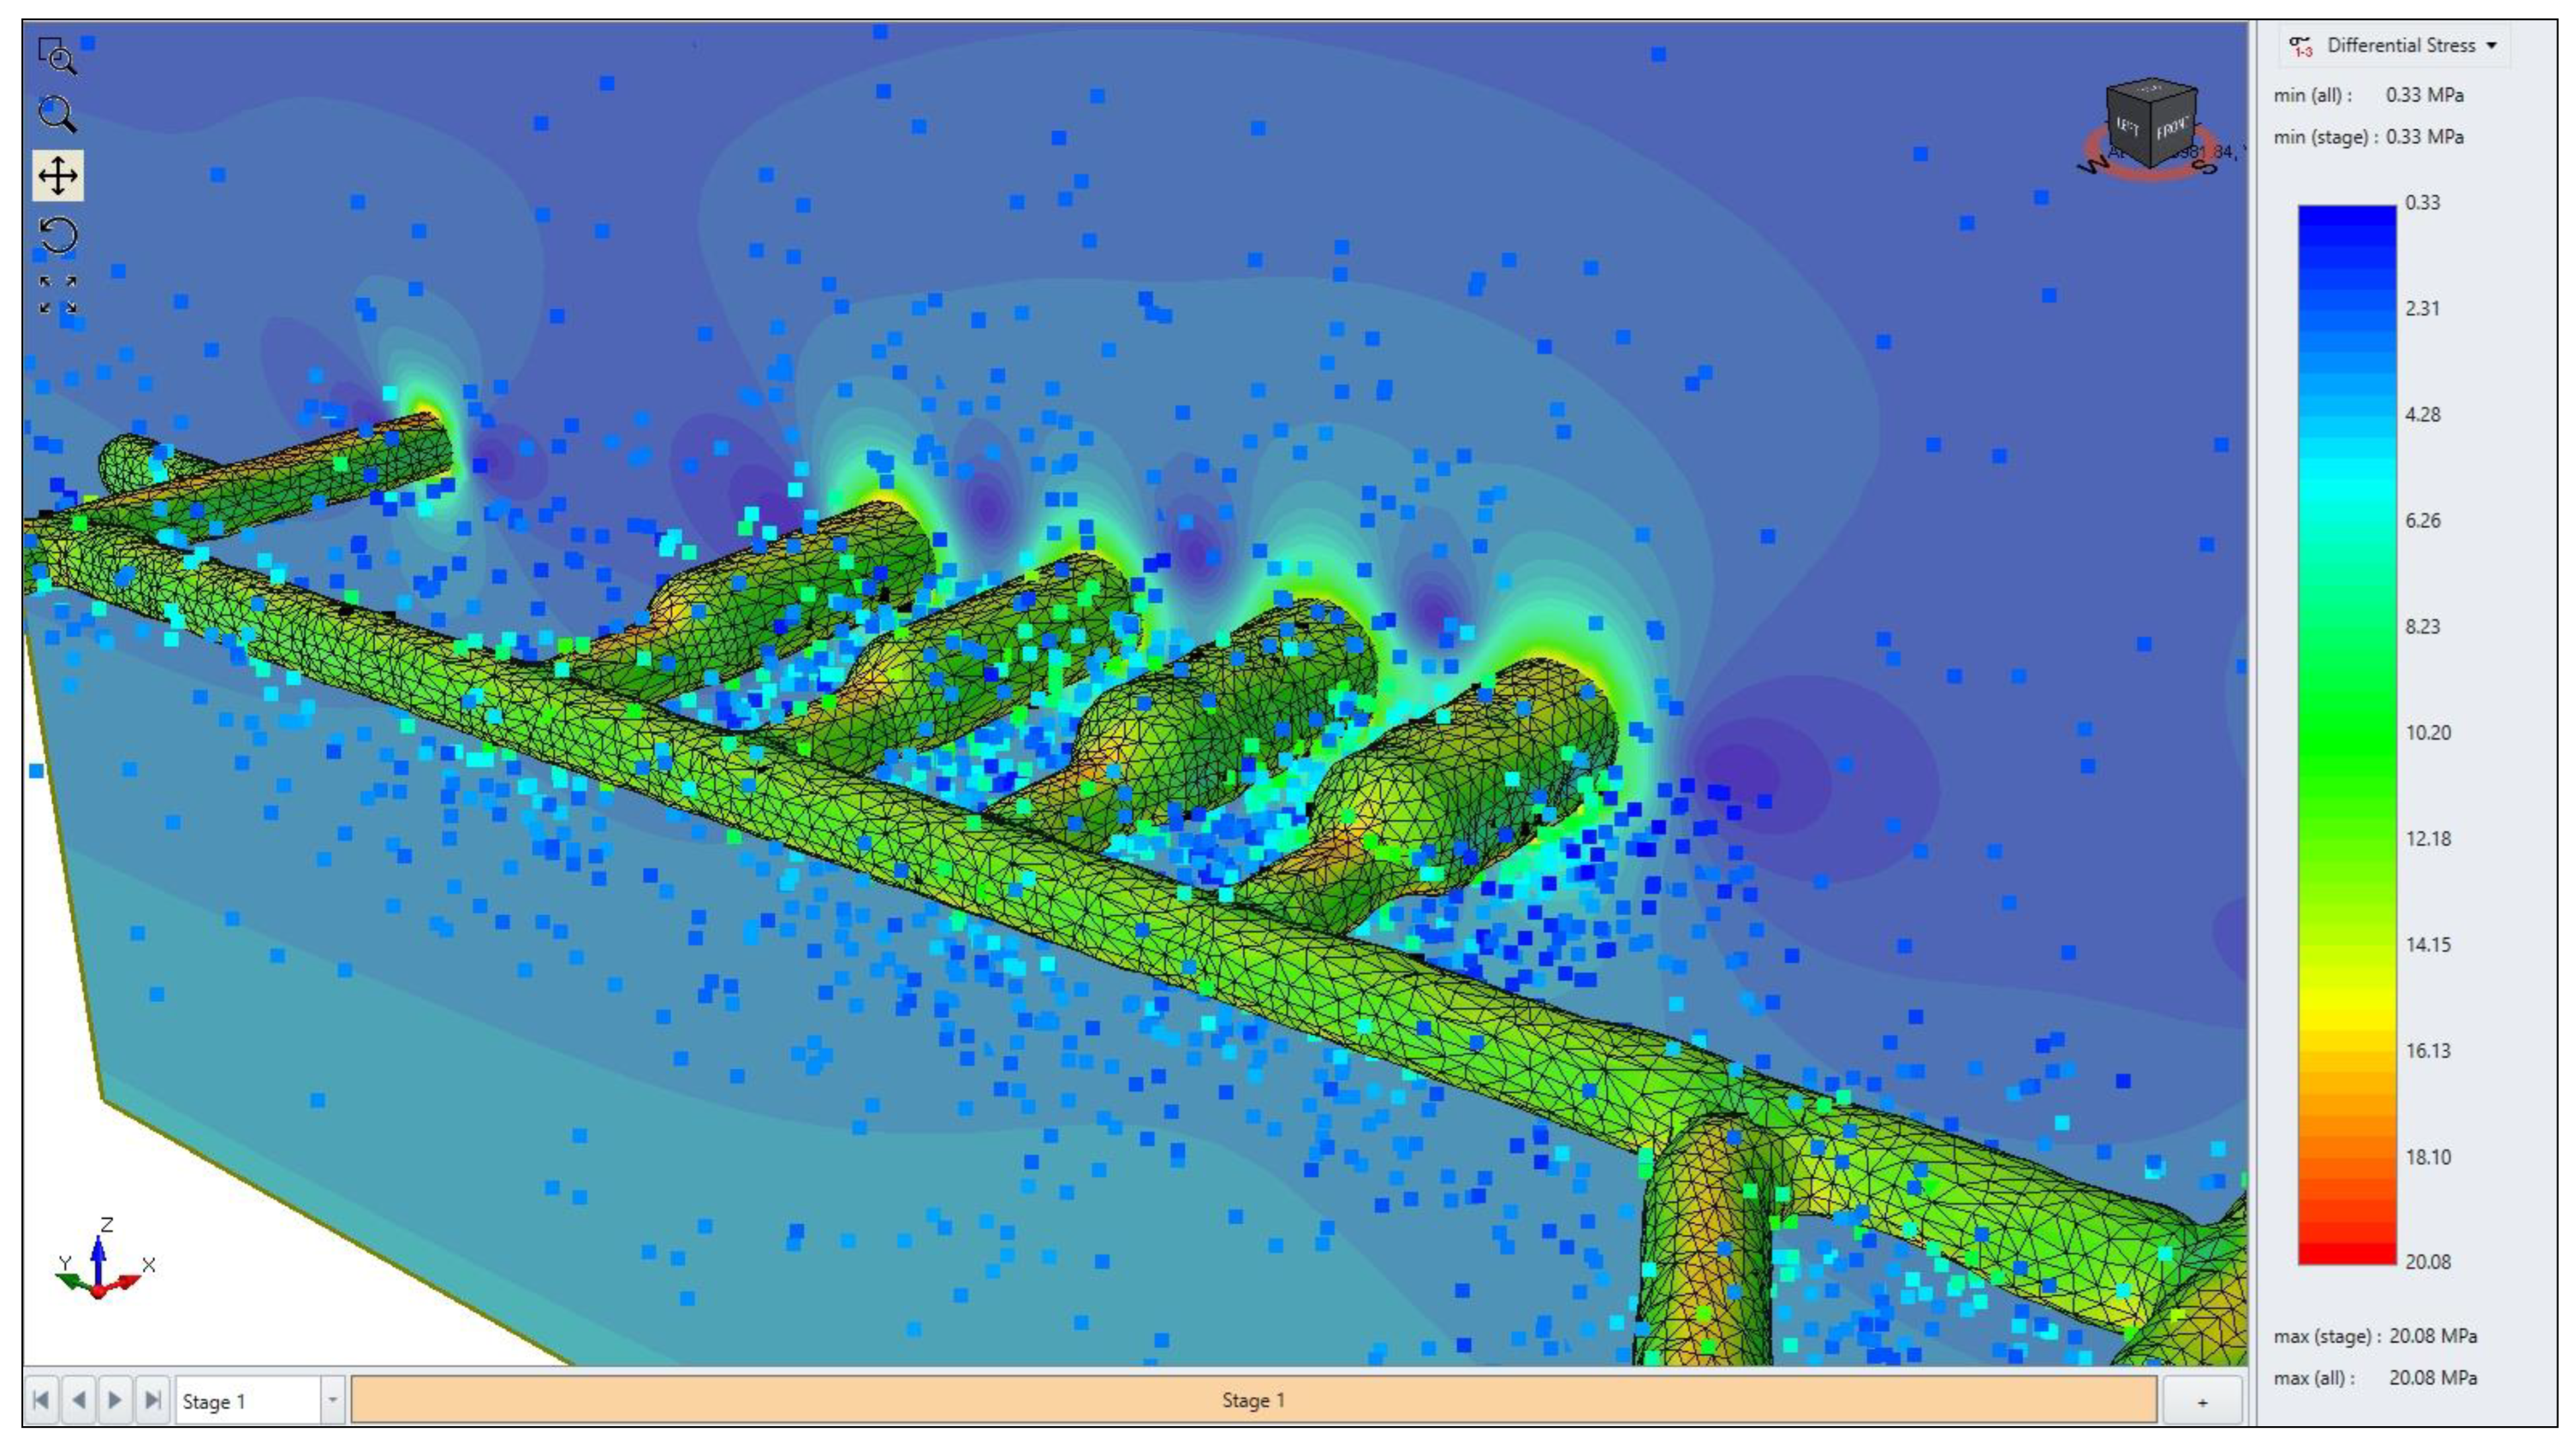
Numerous stress and deformation variations were run in EX3 and the differential stresses were exported for further investigations.
In the images below, the hypocenters are colored according to their intensity and the scale is at the top of Figures (acceleration—mm/s
2). The dates have not been entered, which is why the software marked the day the database was loaded (
Figure 4 and
Figure 5).
The numerical modelling was carried out using the boundary element method (BEM) and, for this purpose, the EX3 software from Rocscience was chosen.
The excavated profiles measured by the surveyors from the geodetic department were used as a starting point and, finally, a mesh model was created from this and then developed into a 3D body. In order to be able to handle the repository chambers area at the same time, several smoothing and mesh-reducing steps were taken to generate a closed geometry.
For the BEM (elastic) analyses, the following main input parameters were used: UCSi = 129 MPa; GSI = 50; KH = 1.42; and Kh = 1.2.
In the primary analysis, as mentioned earlier, the hypocenter distribution analysis was performed according to the time-distributed construction phases, then a cluster analysis was performed and, finally, the visualized hypocenters based on intensity, along with the main geological structures, were examined.
The stress states of the hypocenters exported from the BEM models have been visualized (
Figure 6).
Based on the AE activity and theoretical rock mechanics studies on AE development at both the lab and in situ scales introduced earlier, a simplified concept of rock mass behavior can be established. This has been illustrated in
Figure 7 by way of a stress–strain diagram that includes the accumulated AE activity. This forms the link between the rock mass properties and the AE activity. This approach can be used to describe the rock mechanical behavior in the immediate vicinity of the subsurface cavities (e.g., EDZs) and, at the same time, of the distant rock mass through this back-analysis process.
The back-analysis in this research was conducted in a different manner to that of [
1,
2]. The difference was that, instead of a finite element method (FEM) (elastic) analysis, a BEM (elastic) analysis was performed. The research did not identify the tunnelling stages, but gathered all the hypocenters of the examined period into one database, since, not only were the differential stress conditions in the environment of the AE sensors examined, but the entire model space was used.
Purely brittle failure is caused by very low or no confinement. In this instance, the total lack of strength caused the excavation walls to spall and slab. Dilatational extension fracturing—which is identical to axial splitting in laboratory UCS tests—dominates the mentioned failure mechanism, and in this instance, the AE events were primarily tensile in nature [
36]. According to the rock mechanical investigations, the beginning of microseismicity happens close to the CI equivalent laboratory point. [
10,
37,
38].
After a longer study, Cai et al. [
2] published similar results to those observed at the Bátaapáti NRWR. That is, the boundary conditions of the brittle–ductile transition [
39] created by [
4] for rock masses (especially with lower rock quality, GSI < 65) should be reconsidered and the values for intact rock should be reduced.
Another deviation from the function presented by [
2] was that, instead, an analysis was performed to examine the distribution of the differential stress at the exported hypocenter locations (
Figure 8). The ultimate goal was to predict the strength of the rock mass through this back-analysis process. With a better understanding of the rock mass properties, more reliable forward analyses can be conducted to predict the rock mass behavior around planned future excavations.
For the assessment of the rock mass AE initiation and AE damage stress in the context of the forward analysis, it is important to obtain a reliable assessment of the rock strength. This could be achieved using suitable field tests or, alternatively, by using the GSI system [
40,
41]. In either case, it is required to verify the field test data or the design values obtained from the GSI system through a back-analysis as well. Nevertheless, the AE monitoring approach is less invasive and less costly than other field tests that could be used. In addition, AE monitoring covers the entire rock mass, which allows for a better spatial understanding of the variation in its properties, without the need to drill boreholes.
Based on the generalized AE initiation threshold, it is understood that the AE initiation stress is related to the rock mass strength. If stresses are estimated around the underground excavations using an elastic model and the AE activity is monitored, then these data can be utilized to determine the rock mass strength through a back-analysis approach.
In the case of a massive rock mass without fracture systems, the strength of the rock mass is equal to the CD value of the intact rock (
σcm =
σCDi), which is the long-term uniaxial strength of the intact rock. After examining the data of the intact rocks and interconnected rock masses, it was found that the material constants A and B were in the range of 0.4–0.5 and 0.8–0.9 for massive or moderately fragmented rock masses, that A and B were both 0.5–0.6 for strongly and moderately fragmented rock masses, and that they ranged from 0.9 to 1.0. The general crack initiation and crack damage failure thresholds (CI and CD), combined with a simple linear elastic stress analysis, help to assess the integrity of a rock mass under low confinement conditions, which significantly reduces the effort in obtaining the required material constants for engineering designs [
1,
2].
6. Results
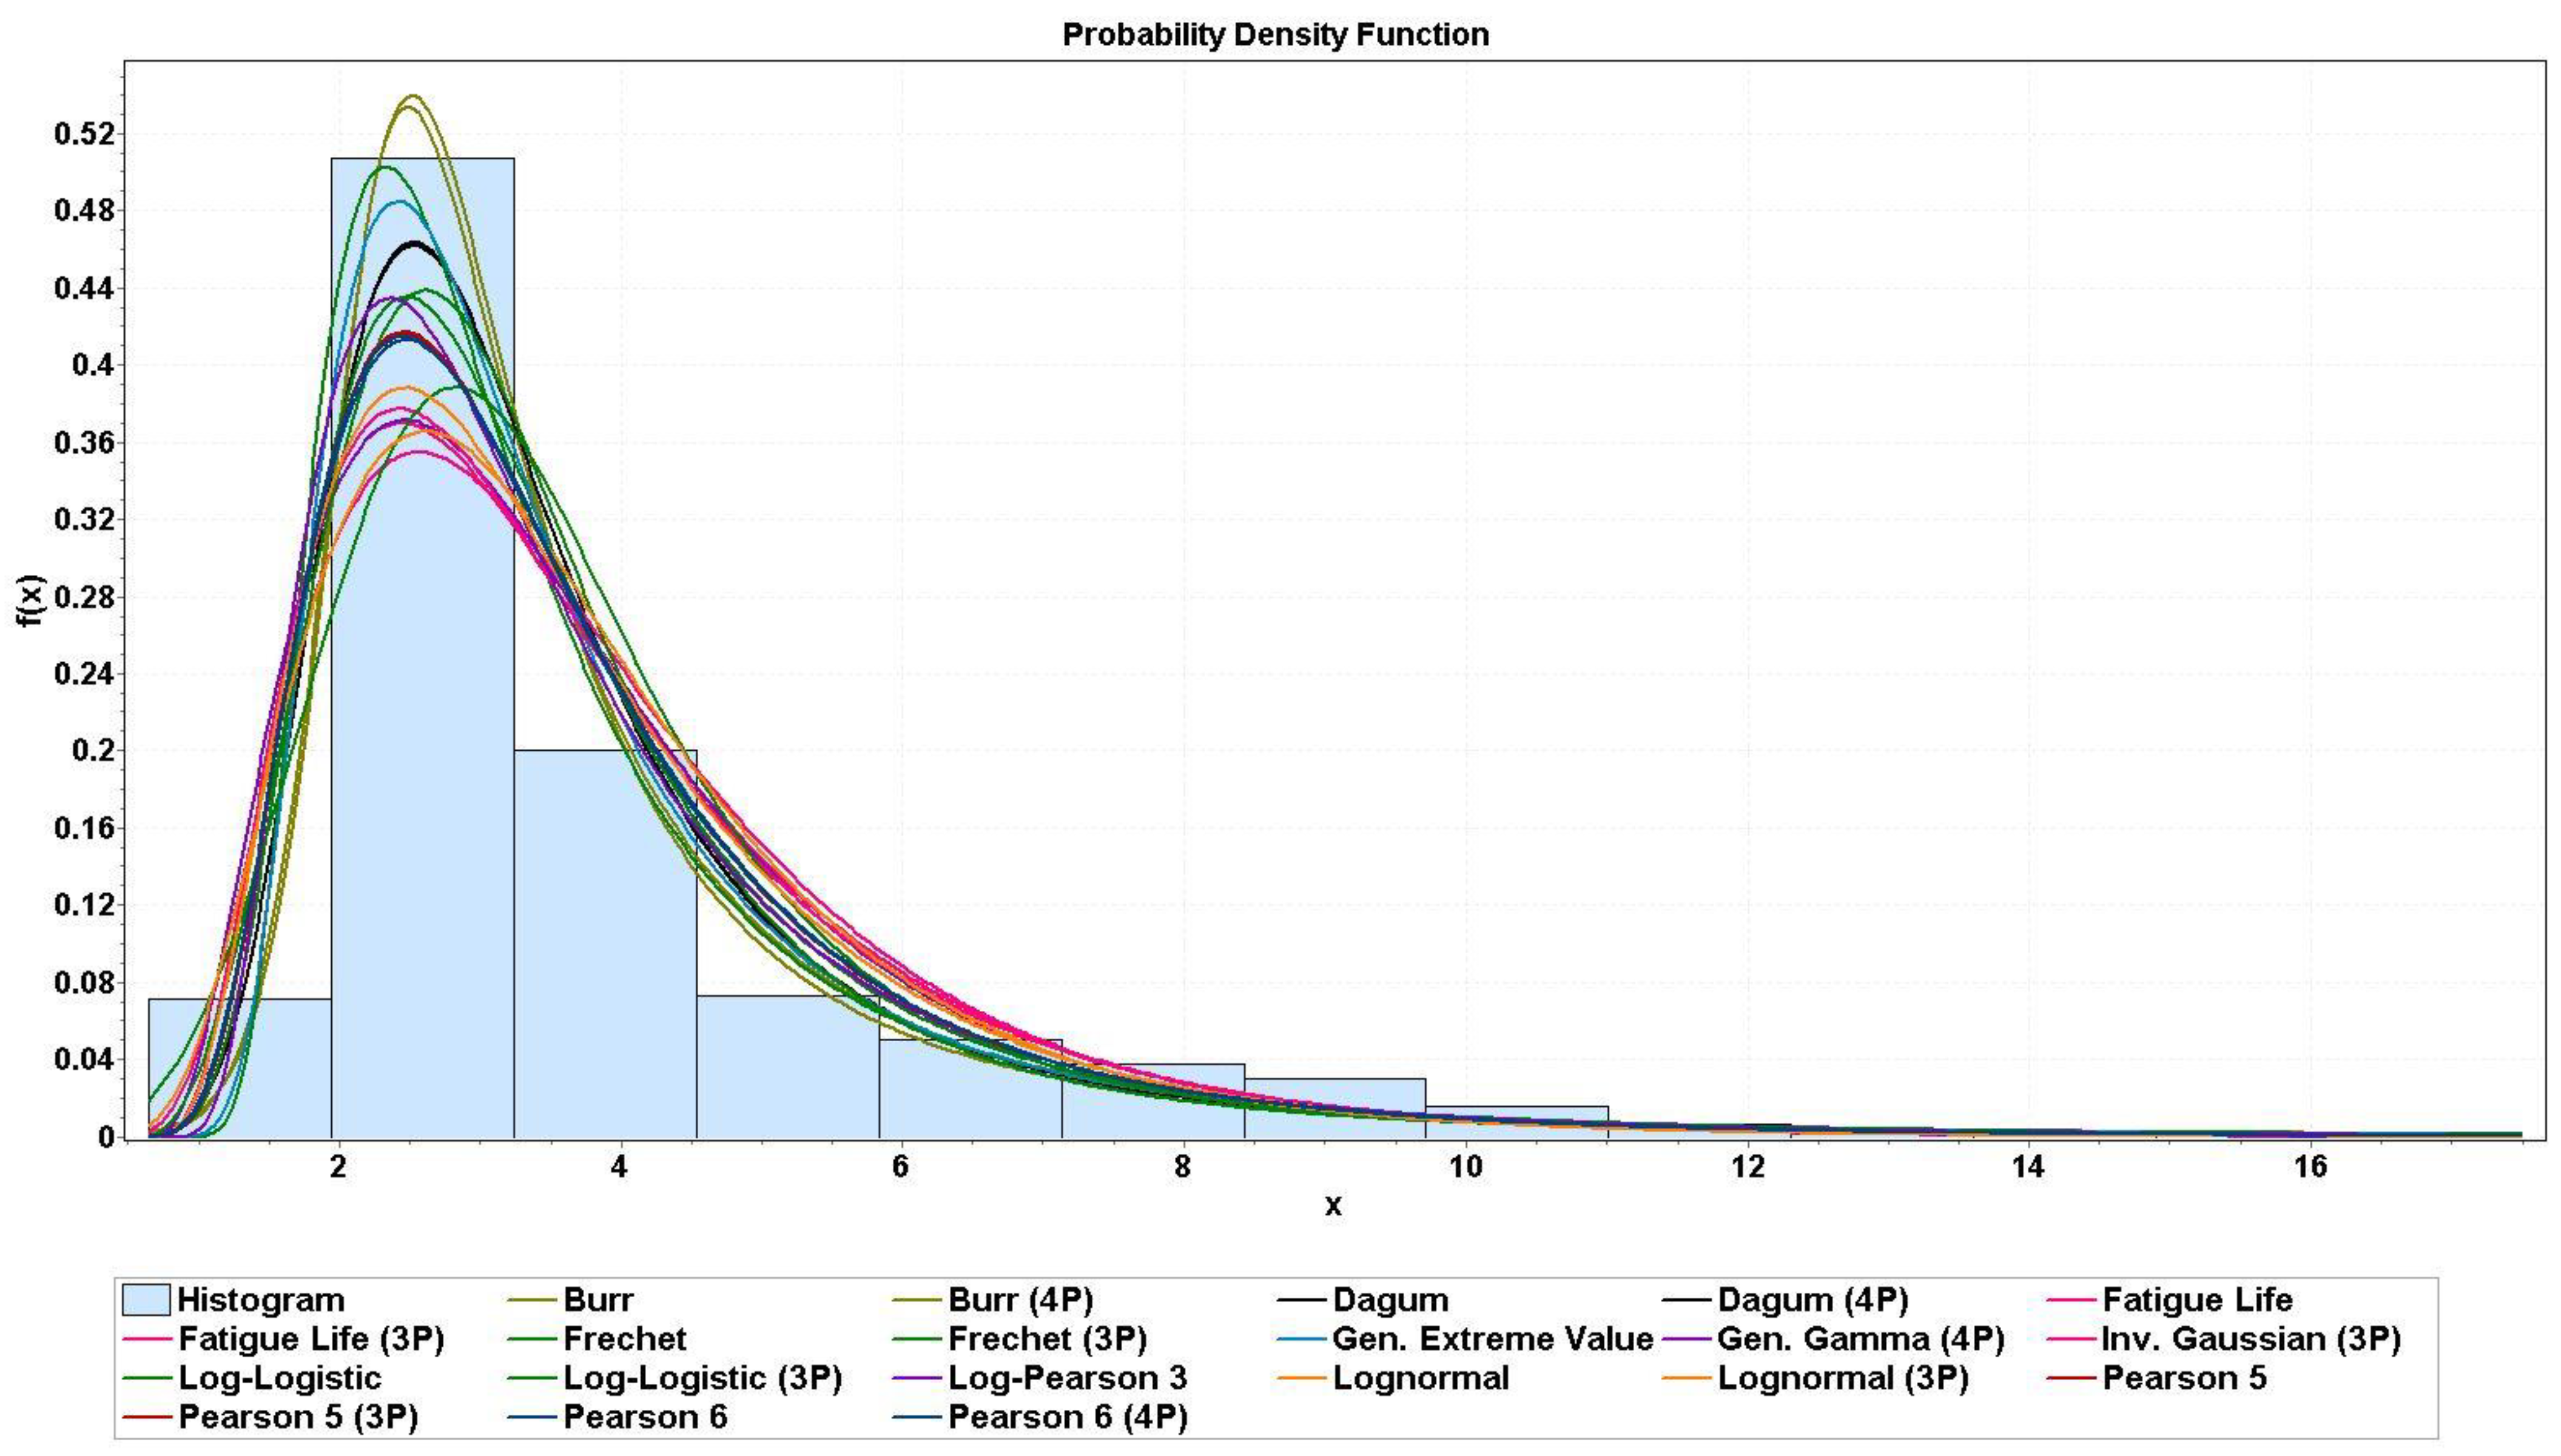
From the BEM models, it became possible to export the values of the differential stresses of each hypocenter point into a complex database (
Figure 9). The database was subjected to a complex statistical analysis, during which, the curves for the distribution of the AE events were fitted using several different approaches (
Figure 8 and
Table 1). Transformations were solved by using the above Equations (9) and (10), and for the
σcm, Hoek’s basic Equation (11) was used [
30].
Using Equation (11), the intact USC = 129 MPa was obtained and this would result in a UCSmass or σcm = 7.8 MPa (if GSI = 50). It follows that the generalized crack (AE) initiation threshold for the characterized moderately fractured rock mass would be σci ≈ 3.9 MPa (if A = 0.5).
The results (
Table 1) show that the peak of the distribution is at percentile 25% (Q1), which means that the CI
mass threshold might be in its immediate vicinity. The fact that there are values below this can be attributed to the fact that, in the model space, there are hypocenters far from the excavated cavities, where, based on the modelling, there is a relaxed stress field. However, this does not mean that there cannot be a fracture or a fracture system in their vicinity, which allows the stress state of the given hypocenters to exceed the CI
mass limit. Since, in the present study, it was not possible to define the well-documented main fracture systems in the BEM model, the examination of the AE events that might be related to them was omitted. Based on the distributions, the median value also includes a high number of hypocenters, which is why this study also mentions its value.
Based on the results of the statistical investigations shown above (
Figure 9 and
Table 1), the following statements can be made:
If GSI = 50: UCSmass ≈ 7.8 MPa and σci ≈ 3.9 MPa—this variation corresponds to the mean values obtained from the statistical analysis (this is the modelled solution).
If GSI = 42: UCSmass ≈ 4.8 MPa and σci ≈ 2.41 MPa—this variation corresponds to the percentile 25% (Q1) values obtained from the statistical analysis (in this case, one factor was changed in order to obtain the expected statistical data and it is none other than the GSI).
7. Discussion
AE monitoring captures pre-peak, peak, and post-peak stress changes in situ. By using the presented approach, it is possible to characterize the rock mass behavior at all stages of deformation. A detached function was derived from the criterion of stress in the rock mass and rock mass strength using the generalized AE initiation threshold. The findings of this research propose that most AE events can be related to the crack initiation (CI) threshold, and in space, most of them are located at points far from the excavated walls. In the vicinity of the excavated cavity EDZs (range of differential stresses of ~4.3–17.5 MPa), stress conditions beyond the CD boundary of the rock mass already appear in many cases, leading to significant, irreversible deformations. At the same time, in this zone, a large degree of the deformation process has already taken place due to the static and dynamic loads and the tunnelling.
The higher density of AE events is closely related to the drill and blast excavation period; this decreases during the shutdown of excavation works, but it does not go towards zero, and the activity of AE events can be continuously experienced at an average low level, so the activity of the time-dependent deformations at a certain level is continuously registered by the AE monitoring system.
In the current study, we could not check the AE activities associated with larger geological structures. A very important example here is the aqueous fault zones in the repository chambers area, which have very characteristic AE activity in terms of space, time, and intensity. This issue was examined with an old visualization, but in the present case, we focused on the hypocenters associated with the excavated cavities.
The back-analysis of this research was conducted in a different manner to that of [
2]. The difference was that, instead of an FEM (elastic) analysis, a BEM (elastic) analysis was performed here. The research did not identify the tunnelling stages, on the contrary gathered all the hypocenters of the examined period into one database and did only examine the differential stress conditions of each AE hypocenter.. These data were exported from the EX3 software and statistically analyzed. Finally, instead the function presented by [
2], a distribution analysis was performed on the exported hypocenter differential stress values (
Figure 8).
The presented procedure in this research allows for the unified examination of an entire monitored underground space, with which it is also possible to examine the rock mass strength and whether the input parameters used during the modelling correspond to the in-situ monitoring results.
Additionally, the study also answered the question of whether the geologists documenting in the field used over- or underestimation when determining the GSI values.
Further sensitivity studies are planned with full coherent back-analyses. It is also very important to be able to examine the most recent databases separately, with a special emphasis on the no-tunnelling (undisturbed) period. In planned future examinations, besides BEM, FEM numerical modelling will be used by integrating the spatial extension of the geologically documented rock types and fracture systems. In the case of AE events, the magnitudes and stress states will be correlated.
There is also a plan to increase the accuracy of the hypocenters’ locations in space by adding new receiver sensors in the Z direction and to perform focal mechanism solutions as much as possible.
In addition to continuous activity, in the coming decades (also during operation, but certainly after the closure of the underground facility), noticeable deformations will appear on the underground facility’s side and roof walls. Further analyses are needed to provide a more accurate forecast, and the installed AE monitoring system can provide this information.
8. Conclusions
It should be emphasized that observations based on AE measurements provide very useful information in time and space and that AE events themselves appear well before rock failure (in the initial stage of the fracture development from the CI threshold); their further development can be traced along the failure path until the point of failure. Later, the residual strength can be monitored as well.
The use of the back-analysis approach based on the measurements of conventional geotechnical monitoring systems (displacement and deformation measurements) is mainly based on displacement measurements. In this case, to identify the rock mass strength parameters, the rock mass must reach or exceed the failure value and enter the region after the peak value (post-peak region) to form large deformations or displacements.
Upon observing the time distribution of the AE/MS hypocenters, it can be seen that the number of events increased significantly in the excavation periods, while, at a certain level between the excavation periods, we continuously saw lower-intensity hypocenter appearances, which could be related to long-term rock mass deformation. A subsequent examination of these is of great importance, as time-dependent deformations can be examined on the bases of time, space, and intensity, and if, later, another tunnel drive takes place in these observed areas, it is possible to examine the time-dependent degradation of the rock mass strength.
Based on the results obtained during the back-analysis, it can be stated that, based on the input parameters, the boundary conditions used for modelling, and the results, the GSI = 42–50 interval corresponded to the rock mass classification values calculated from the CI thresholds and then its strength. This was also reflected in the geological field documentation, so their significant underestimation or overestimation could not be established in the present investigation.
It can also be stated that most of the emissions could be related to the CImass value, and in space, most of them were located at points farther from the excavated walls. In the vicinity of the EDZs of the cavities (a range of differential stresses of ~3–17.5 MPa), the stress conditions beyond the CD boundary of the rock mass already appeared in many cases, leading to significant, irreversible deformations. At the same time, in this zone, a large degree of the deformation process had already taken place due to the static and dynamic loads of the tunnelling.
The presented novel method has been created to back-calculate the rock mass strength parameters based on AE monitoring data, tied in with elastic stress analyses. This method does not need separated underground monitored areas before different excavation stages, but it provides the possibility of examining long monitoring periods by selecting, numerically modelling, and statistically evaluating AE hypocenters.
The presented method allows for evaluating the rock mass strength in the pre-peak region before considerable deformations happen. Conventional back-analysis methods that utilize deformation-monitoring data cannot provide this capability.
While the findings in previous studies and the present study indicate success in determining the rock mass strength parameters from AE monitoring data, they have great potential for rock engineering, but need continuous further investigations.


