Article

Modeling and Optimization of Natural Gas CCHP System in the Severe Cold Region

1
School of Energy Science and Engineering, Harbin Institute of Technology, Harbin 150001, China
2
School of Aerospace and Civil Engineering, Harbin Engineering University, Harbin 150001, China
3
China Special Equipment Inspection and Research Institute, Beijing 100029, China
*
Author to whom correspondence should be addressed.
Energies 2023, 16(12), 4582; https://doi.org/10.3390/en16124582
Submission received: 17 April 2023 / Revised: 10 May 2023 / Accepted: 11 May 2023 / Published: 8 June 2023
(This article belongs to the Section B3: Carbon Emission and Utilization)

Abstract

:
A natural gas combined cooling, heating, and power (CCHP) system is a typical integrated energy supply method that optimizes end−use energy. However, how to achieve economically feasible natural gas CCHP in severe cold regions with low−grade heat demand reaching 50% is still a pressing issue. This paper establishes a typical natural gas CCHP system model for severe cold regions and conducts the system. Based on the climate conditions of Harbin, the economic optimization of independent gas turbine systems, internal combustion engines, and gas turbine systems is still a pressing issue. Based on the climate conditions of Harbin, the economic optimization of independent gas turbine systems, internal combustion engine systems, and steam boiler systems under different cooling and heating load ratios was carried out. The combination of “internal combustion engine + steam boiler” has the most optimal cost of RMB 1.766 million (USD 0.255 million), saving 10.7%, 7.8%, and 18.3% compared to the three single equipment subsystems respectively. This provides good theoretical support for the construction of multi−energy heterogeneous energy systems.

1. Introduction

As the global economy grows, fossil energy consumption and greenhouse gas emissions are rising rapidly, and the problems posed by energy shortages and global warming are becoming increasingly severe [1,2,3,4]. Countries worldwide have formulated the Kyoto Protocol, the Paris Agreement, and the Glasgow Climate Convention to cope with climate change and achieve carbon reduction targets. China has also proposed to achieve “carbon peaking” by 2030 and “carbon neutrality” by 2060. China has also set the goals of achieving “carbon peaking” by 2030 and “carbon neutrality” by 2060. However, traditional energy sources still account for the highest share of all energy sources [5,6]. Therefore, the issue of how to reduce carbon emissions has attracted widespread attention from national and international scholars [7,8,9,10,11]. As a high−efficiency energy supply system close to the end−users, a combined cooling, heating, and power system can significantly improve the energy utilization efficiency, reduce energy loss, complete the energy utilization on a large scale, and finally deliver the three kinds of loads of cooling, heating, and power to the end−users with less pollution, high stability, safety, and reliability [12,13,14]. Although combined cooling, heating, and power systems have been demonstrated and applied in many places, how to realize a natural gas combined cooling, heating, and power supply to meet the financial requirements in cold regions where the heating demand of low−grade heat energy reaches 50% is still a hot research issue in the industry and an urgent problem to be solved.
To solve the problem of the economics of the natural gas combined cooling, heating, and power supply in cold regions, much research has been conducted by domestic and foreign scholars [15,16,17]. The research has been carried out both in China and abroad. In the existing studies [18,19,20,21,22,23,24,25,26], Barbieri [18], a researcher at the University of California, focused on the relationship between efficiency and load factor. However, efficiency is affected by many other factors, such as the unit’s running time and the equipment’s starting and stopping frequency, selecting different power units as research objects, and thoroughly describing the practicality for different building types under different design conditions. In addition, as concerns domestic and foreign scholars alike [27,28,29,30], relatively few studies have been conducted on combined cooling, heating, and power systems in harshly cold regions such as Harbin, and the construction of mathematical models corresponding to the design scenarios has been neglected. Murai [31] et al. conducted a corresponding model planning for an energy hub of a specific scenario while outlining a good optimization analysis idea for the energy use characteristics of the region, embodying a module with energy output matching characteristics based on dynamic characteristics, and the results showed a significant adjustment effect for the overall performance of the study region. The exploration of decoupling methods at home and abroad has been relatively shallow for the study of decoupling methods. The decoupling method has yet to be explored in depth. However, only a single approach is used to decouple the whole system into four parts: cooling load, thermal load, electrical load, and the energy flow relationship within the whole system for separate calculations. For example, Liux [32] et al. constructed and designed a steady−state model of the electric/thermal coupled system’s hybrid current and proposed a specific method to calculate the uniform solution by generalizing the research results.
In this paper, through the research on the primary equipment selection, modeling, system modeling, solution, and optimization analysis methods of the combined cooling, heating, and power system, we establish an optimization mechanism that can be applied to the planning and operation scheduling of a natural gas combined cooling, heating, and power system in the cold region, which is an excellent theoretical support for the construction of a multi−energy heterogeneous integrated energy system [33,34,35,36].

2. Model of Combined Cooling, Heating, and Power System

The entire flow of the optimization problem is mapped out through the corresponding analysis [37,38,39]. The conventional distributed energy optimization process and the structure of the evaluation indicators are shown schematically in Figure 1. The optimization objective of the model is to minimize the system’s operating costs, which are subject to constraints such as energy supply and demand balance. If it is optimal, the optimal capacity configuration and operation plan is output. If it is not optimal, the initial configuration plan changes, and the objective function recalculates until optimal. If the optimum is reached, the initial configuration changes, and the objective function recalculates until the optimum is reached.
The essence as well as the core of the optimization problem can be summarized in Equation (1), which is a mathematical expression consisting of three main parts as follows:
(1)
Optimization variables: Optimization variables refers to the relevant variables to be determined in the optimization problem to be studied, i.e., the optimization objects to be analyzed. Adjustments can be made later in the relevant commissioning to reduce the related operating costs for the design and construction of the combined cooling, heating, and power system;
(2)
Constraints: The functional equations and the corresponding constraints in the solution process, for example, the equation constraints of many energy balances listed in this paper and the inequality constraints established by the existence of upper and lower limits of the output force of different devices;
(3)
Objective function: The function to be sought, usually as the result of the entire optimization problem, to evaluate the criteria. Generally, there will be a single objective function of the economy: the evaluation index, economic indicators, environmental indicators, and other indicators of the composite multi−objective function. In this process, different indicators are given corresponding weights.
min / max f ( x ) s . t . h i ( x ) = 0 g i ( x ) = 0
To simplify the corresponding model and improve the efficiency of the calculation, the following assumptions are made in this paper for the whole design system:
(1)
To avoid inefficiency caused by the power unit operating at a low load rate for an extended period, the prime mover must be set at a minimum load rate (0.25 in this paper). Otherwise, it may stall and not work. At the same time, other equipment can be operated at each operating point between the upper and lower limits of the operating capacity, ignoring the influence of environmental factors;
(2)
When making equipment capacity selections, the capacity values of the different equipment are effectively discrete, and this paper assumes that the entire distribution is continuous;
(3)
The corresponding power consumption processes and losses are neglected for equipment other than electric chillers;
(4)
The output values can be switched at any time for different devices in the system regardless of the response time;
(5)
Energy losses due to transmission during the process are ignored.

2.1. Power Unit for Combined Cooling, Heating, and Power System Model

As the core part of the whole combined cooling, heating, and power system, the power plant is the most critical device in the whole system. The waste heat the power unit generates will pass through the heat recovery device. Due to the corresponding differences in the working principles of different devices, the corresponding forms of waste heat generation will also exist significantly differently.

2.1.1. Gas Turbine Model

Generally speaking, the first thing that happens in a gas turbine is the blending and the pressure increase. The corresponding amount of fuel vapors are mixed, and the resulting gas has a higher temperature and pressure performance than average. The heat in the flue gas can be recovered by a waste heat recovery unit for cooling water generation and high−temperature steam collection. The corresponding mathematical model of the gas turbine is shown in Equations (2)–(5), and the significance of the specific parameters is shown in Table 1.
E G T = a G T F G T + b G T
Q G T = p G T F G T + q G T
E max G T = E max G T 0 [ 1 c G T ( ( t t 0 ) + t t 0 / 2 ]
E min G T E min G T E max G T
A gas−turbine−based combined cooling, heating, and power system is constructed, and the corresponding supplementary combustion devices are added: electric chillers and electric boilers. The model construction method adopts the general modeling method of the combined cooling, heating, and power system by Professor Chengshan Wang of Tianjin University [40]. The physical model of the system is shown in Figure 2.

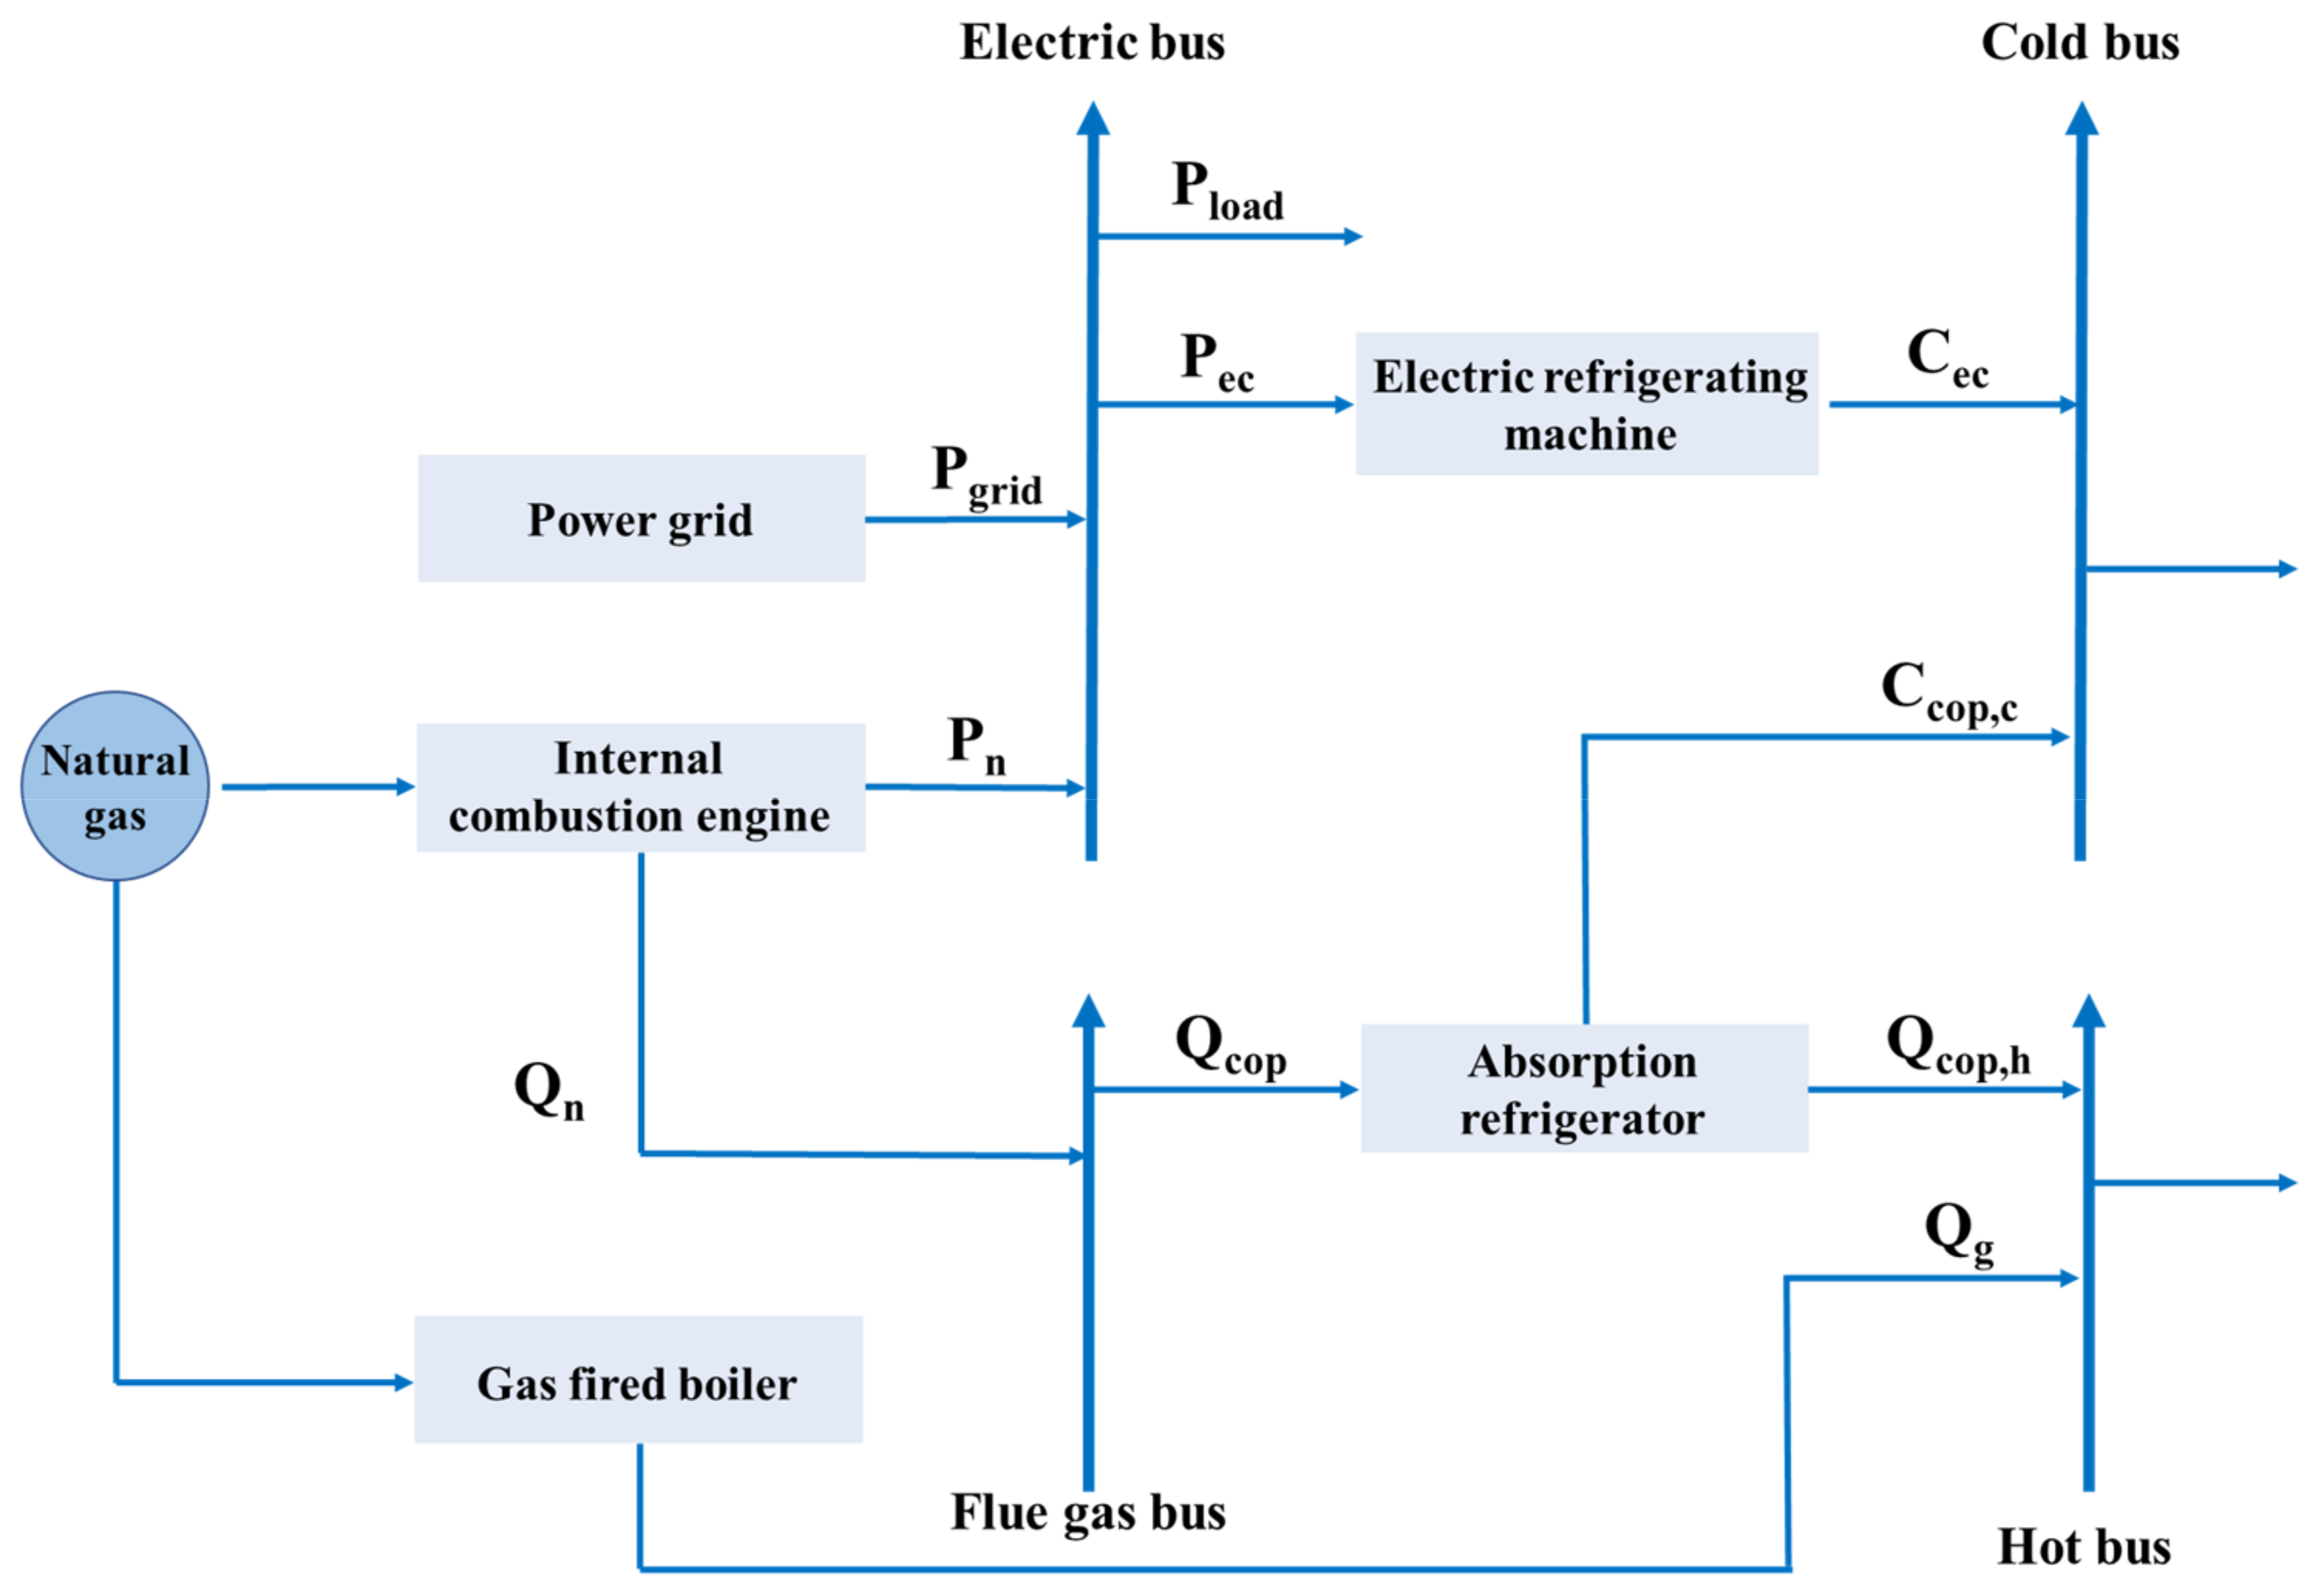
2.1.2. Gas Internal Combustion Engine Model

The internal combustion engine usually mixes air and fuel in the cylinder and then burns it. The corresponding process can be analogous to what was introduced before as a source of electricity. The waste heat generated during the whole process is recycled. Generally, internal gas combustion engines’ power generation efficiency is 30% to 37%. The whole combustion engine operation is not necessarily a constant operating condition process and will change with external conditions. Meanwhile, the mathematical model of the internal combustion engine can be fitted by combining the corresponding parameters as Equations (6)–(9) [41,42,43] as shown in:
η e 0 = 0.01 × ( 35.135 + 0.0115 × P n 0 5 × 10 6 × P n 0 2 + 8 × 10 10 × P n 0 3 )
η q 0 = 0.01 × ( 56.462 0.0227 × P n 0 + 1 × 10 5 × P n 0 2 2 × 10 9 × P n 0 3 )
η e = η e 0 × ( 0.0113 + 2.9801 × r 2.4726 × r 2 + 0.4812 × r 3 )
η q = η q 0 × ( 1.5853 2.1247 × r + 2.887 × r 2 1.3476 × r 3 )
A system model with an internal combustion engine as the power unit is established, and the waste heat recovery unit is an absorption chiller unit. Here, the absorption chiller can be used for cooling and heating, and the corresponding supplementary combustion devices are added, which are electric chillers and gas boilers. The role of these two is mainly reflected in the peaking influence on the overall customer load. Figure 3 shows the internal combustion engine’s combined cooling, heating, and power system.

2.1.3. Gas Steam Boiler Model

Gas steam boiler combustion expansion occurs in the part of the boiler where the device changes water into steam. Internal gas combustion increases the temperature and generates pressure steam. The pressure is positively associated with the boiling point of water. The interior of the boiler has no material exchange with the outside world. Hence, the pressure source is the expansion of water vapor, which finally determines the generation of thermodynamic force, and the corresponding mathematical model is shown in Equations (10) and (11).
P n = F n η n
Q n = ξ F n ( 1 η e )
A combined cooling, heating, and power system with a steam boiler as the core is established, as shown in Figure 4. The power unit of the whole system is a steam boiler, and the waste heat recovery unit is an absorption refrigeration unit with the corresponding refrigerant components for the whole refrigeration process. A heat exchanger is also added for heat recovery, and an electric chiller is used as an auxiliary fuel unit to supplement the cooling load.

2.2. Other Device Models for Combined Cooling, Heating, and Power Systems

2.2.1. Waste Heat Recovery Unit Model [44,45,46]

Absorption refrigeration model: An absorption refrigeration unit is a device that generates cold heat, and its refrigerant is usually water. Depending on the source of heat, they can be divided into direct−fired and hot−water models; depending on the mode of use, they can be divided into heat pumps, hot and cold water, and cold water models. Of these, the hot and cold water type can provide both hot and cold water and is usually used for seasonal cooling or heating regardless of the corresponding coefficient changes. The mathematical model of a refrigeration unit can be simplified as Equations (12) and (13):
C q e = Q q C O P q e c
C q e min ε q e C q e C q e max ε q e
Waste heat boiler model: Waste heat boilers can use the waste heat generated during industrial production. By recovering waste heat from exhaust gases, flue gas, and water vapor and converting it into heat energy for generating steam or heating water, etc., they can effectively improve energy efficiency and reduce production costs and environmental pollution. As standard waste heat recovery equipment, waste heat boilers can recover heat and thus complete subsequent production processes. By analyzing the corresponding operating characteristics, a performance model can be outlined as shown in Equations (14)–(16):
Q y r = Q G T η y r
η y r = η y r 0 ( 0.0951 + 1.525 β y r 0.6249 ( β y r ) 2 )
Q y r min ε y r Q y r Q y r max ε y r

2.2.2. Combustion Supplement Device Model [47,48,49,50]

The electric chiller model: An electric chiller is a device that uses electrical energy to drive a refrigerant for refrigeration and works based on a similar principle to a conventional compression chiller. In the electric chiller model, electrical energy is converted into mechanical energy, which drives a compressor to compress the refrigerant and raise its temperature. The refrigerant then passes through a heat exchanger to exchange heat with the evaporator, thus achieving refrigeration. The refrigeration coefficient of an electric refrigerator is assumed to be constant, and the corresponding mathematical model is shown in Equations (17) and (18):
C c e = E c e C O P c e
C c e min ε c e C c e C c e max ε c e
Gas boiler model: When the system’s heat supply is insufficient to meet the customer’s demand, supplementary combustion can be carried out by a gas boiler. The main factor affecting the operating efficiency of a gas boiler compared to a waste heat boiler is the load factor. The efficiency of a gas boiler is higher when the load factor is higher, while the efficiency of a gas boiler decreases significantly when the load factor is lower. The variable duty thermodynamic model of a gas boiler is shown in Equations (19)–(21):
Q g = F g η g
η g = η g 0 ( 0.0951 + 1.525 β y r 0.6249 ( β y r ) 2 )
Q g min ε g Q g Q g max ε g

2.3. Constraints

The customer’s overall cooling, heating, and electricity demand is supplied through the entire system. Regarding the operation of the whole system in addition to the constraints of the corresponding models for different equipment, there are also corresponding constraints for the operation of the whole system, as shown in Equations (22)–(24).
Power balance: The total power input to the system is equal to the power consumed by each power−using device plus the power demand on the customer side.
P n + P g r i d = P l o a d + P e q + P e c
Heat balance: The heat generated by the system (two heat sources) equals the heat demand on the user side.
Q g + Q c o p , h = Q l o a d
Cooling balance: The generation of the cooling load is equal to the user’s demand.
C e c + C c o p , c = C l o a d

3. System Operation Optimization Analysis

3.1. Load Analysis in the Harbin Area

To study the energy consumption in the Harbin area, the area was selected as the research object, and relevant data were reviewed [51,52,53]. The monthly average temperature distribution of the Harbin area in 2020 was drawn, as shown in Figure 5A. An ordinary residential building with an area of 10,000 square meters was selected. Considering the type of energy output, including cooling, heating, and electrical loads, the load index method was used to estimate the energy demand. The indoor temperature was uniformly set to 20 °C. At the same time, the corresponding estimation was carried out according to the previously listed formulas. The annual cooling and heating load distribution map shown in Figure 5B was drawn by combining the annual temperature change trend of the Harbin area.
Based on the relationship between the changes in hot and cold loads throughout the year, the system configuration method was determined based on the time−by−time changes of each load type on the three typical days. Since the Harbin area belongs to a severe cold region, the typical day should be selected with noticeable load changes on that day, so the corresponding time−by−time load distribution diagrams are shown in Figure 5C,D.
The dynamics of a typical daily load in the Harbin area are explained below, mainly from the perspective of electrical, cooling, and thermal loads one by one.
(1)
The use characteristics of the electrical load are relatively similar from season to season. However, a comprehensive analysis of the corresponding load characteristics shows that the daily peak of electricity consumption is concentrated around two o’clock in the afternoon, mainly after the lunch break when the equipment starts, as well as in the summer when the work intensity of air conditioning and other equipment is higher, especially in the afternoon;
(2)
The value of the cooling load in the residential category is much smaller than the demand for heat load, with a greater demand for cooling during the daytime concentrated around two o’clock in the afternoon and a corresponding load at night. The demand for cold load is mainly concentrated in summer, especially in August, when the demand is significant;
(3)
Regarding the demand for heat load, it is mainly concentrated from October to mid–late April of the following year, which is about six months of heating time. The climatic conditions of Harbin and the geographical division of the cold region determine a more extended period for the heat load demand each year. The comparative analysis of Figure 5A shows that the value of the heat load and the time of supply–demand occupy a key and essential part of the year, indirectly reflecting the characteristics of the load demand in the cold region;
(4)
The average daily value of the thermal load is 1100 kW, and the average daily value of the cold load is 210 kW, with a peak thermal load of 1200 kW on a typical day in winter and a peak cold load of 330 kW on a typical day in summer. As the Harbin area is a severe cold region, the proportion of thermal load is significantly different, with the maximum ratio of thermal load to electrical load for customers in winter being 12, while the maximum ratio of cold load to the electrical load in summer is 4.5, which indicates that high thermal load is a representative feature of the load in the severe cold region.

3.2. Operation of a Gas Turbine Core Combined Cooling, Heating, and Power System Analysis

During the gas turbine operation, the remaining heat is mainly concentrated in the exhaust flue gas, which has good waste heat utilization characteristics. The power unit with the gas turbine as the core can be used with the distribution chiller as additional combustion equipment.

3.2.1. Analysis of Typical Winter Day Systems

The load of a typical winter day is analyzed accordingly by combining the data from the load analysis of a 10,000 square meter residential building. The system’s operation is subject to the model constraints of the different devices and the corresponding constraints. The calculations are based on Figure 5B in Section 3.1, and the objective is to calculate the hour−by−hour natural gas costs. The equipment operating in winter includes gas turbines, gas boilers, and absorption chillers (heat production). Since no cold load supply is required in winter, only heat and electricity loads are supplied. Based on the energy−balance equation, the hour−by−hour natural gas cost distribution for a typical winter day can be calculated (Figure 5C).
Regarding the analysis of a typical winter day: an energy−balance relationship is established based on the customer demand to find the hour−by−hour power generation of the gas turbine, and then, the corresponding natural gas consumption is calculated. The natural gas price is set at 3.6 RMB/m³ (0.520 USD/m³, exchange rate according to USD 1 = RMB 6.91), and the hour−by−hour cost distribution of natural gas is plotted as shown in Figure 6A. Harbin is a cold region, and the demand for heat load is high in winter, and the hourly cost of natural gas is above RMB 475 (USD 68.667), as shown in Figure 6A. The cost distribution is more even throughout the day, with the lowest cost of RMB 470 (USD 67.945) at 0:00 and the highest cost of RMB 575 (USD 83.124) at 7:00. The total cost of the entire system is the cost of natural gas consumed.

3.2.2. Summer Typical Day System Analysis

In summer, there is no need to supply heat load, so the operation of the heat production equipment is stopped. An energy−balance relationship is established based on the customer demand to find the hour−by−hour power generation of the gas turbine. Then, the corresponding natural gas consumption is calculated. The natural gas price is set at 3.6 RMB/m³ (0.520 USD/m³), and the hour−by−hour cost distribution of natural gas is drawn as shown in Figure 6B. The area’s ambient temperature is higher in summer, and the demand for cooling load is higher. From the trend of load demand distribution in Figure 6B, it can be seen that the demand for cold load is greater, and the corresponding cost of electricity consumption increases. The period with the highest consumption is concentrated in the late afternoon from two to four o’clock and at night around eight to ten o’clock. The demand for cold load is higher during this time, which causes an increase in the related energy costs. Unlike the winter season, the electricity demand remains lower in the early morning hours. The total cost of natural gas for the entire process is the price of natural gas multiplied by the associated volume.

3.2.3. Month−by−Month Cost Analysis Based on a Full Year

Through the estimation of the annual temperature and load in the Harbin area in Section 3.1, the whole system is estimated by analogy with a typical day in summer and winter, and the month−by−month cost distribution of the combined cooling, heating, and power system with the gas turbine as the core is plotted as shown in Figure 6C. The demand for hot and cold loads throughout the year shows noticeable seasonal differences. Due to the proportion of heat loads in the Harbin area, the natural gas cost for heat loads in peak months is about seven times the operating cost in peak and valley months.

3.3. Typical Daily Cost Analysis Considering Power Purchase Scenario

After analysis, all the electricity on the customer side comes from the gas turbine, internal combustion engine, and steam boiler’s power generation for the whole combined cooling, heating, and power system. Through data analysis, the month−by−month distribution of the equivalent electricity prices for the three different power units can be converted, and the results are shown in Figure 7A.
According to the distribution of monthly converted tariffs for the four operating modes, the average monthly tariffs from January to April and October to December are higher than the price of grid electricity, with the highest value of 3.52 RMB/kWh (0.509 USD/kWh). From May to September, steam boilers have the economic advantage of generating electricity with a minimum value of 0.22 RMB/kWh (0.032 USD/kWh). Purchasing grid electricity has an economic advantage during the period with a high percentage of heat load. Choosing a specific system can perform better economically during a certain period with a high percentage of the cold load. The distribution of the relevant Harbin area electricity prices by period is shown in Figure 7B.
According to the time−of−day electricity prices in the Harbin area, it can be more clearly understood that the time−of−day unit prices are concentrated at 0.3 RMB/kWh (0.043 USD/kWh), 0.8 RMB/kWh (0.116 USD/kWh), and 1.2 RMB/kWh (0.174 USD/kWh) at the peak of electricity consumption. Through the above analysis, it can be found that the conclusion of the estimation of electricity price by month is different. Since the sources of electricity are generated from the power units mentioned earlier, the analysis conducted below is an hour−by−hour cost analysis of a typical summer day as well as a typical winter day in the Harbin area, using three different systems as examples and considering the purchase of electricity in the low valley.
On a typical summer day, the customer−side demand for electrical load is met entirely by purchased electricity from the grid, and the gas turbine is responsible for heat supply only. According to the time−by−time data analysis shown in Figure 7C, using purchased electricity is better at night when the electricity is low compared to direct supply by the gas turbine. The economics of using system generation is better during the day when the electricity price is higher.
On a typical winter day, based on the analysis of the corresponding load parameters in the Harbin area and considering the hour−by−hour price factor of electricity, the source of demand for the electrical load is met entirely by the purchase of electricity from the grid, and the gas turbine is only responsible for the supply of the cold load. As shown in Figure 7D, it can be concluded that the economics are better when purchasing grid electricity at night when the electricity price is low.
Due to the space limitation, only the relevant analysis of gas turbines is given in this paper.

3.4. Comparative Analysis of the Annual Operating Costs of the Three Systems

As shown in Figure 8A, the month−by−month distribution of operating costs for the three systems based on a full year when gas turbines, internal combustion engines, and steam boilers are used as power units, respectively, are shown and analyzed:
(1)
Load estimation using 2020 climate data shows that the CCHP subsystem with an internal combustion engine as the power unit has the lowest operating cost of RMB 1915.306 million (USD 276.882 million) from January to April; the gas turbine system is the second lowest at RMB 1978.663 million (USD 286.042 million); and the steam boiler CCHP system has the highest operating cost of RMB 2162.728 million (USD 312.650 million). The difference in operating costs between the internal combustion engine and gas−turbine−driven combined cooling, heating, and power subsystems is slight;
(2)
Customers only need to meet the electrical and cooling loads from June to September. The results show that during these four months, the system used as the power unit of the combined cooling, heating, and power system has the lowest operating cost, followed by the gas turbine system, while the combined cooling, heating, and power system with an internal combustion engine has the highest operating cost;
(3)
From October to December, Harbin enters the heating season. The results show that the system using an internal combustion engine as the power unit has the lowest total operating costs during these months, followed by a gas turbine, while the steam boiler system has the highest operating costs. The difference in operating costs between the combined cooling, heating, and power subsystems driven by internal combustion engines and gas turbines was minor.
Based on the above analysis results, the combination of “internal combustion engine combined cooling, heating, and power system + steam boiler combined cooling, heating and power system” can be used. The combustion engine system is used from January to April and October to December when the heat load is high, and the steam boiler system is used from June to September when the cold load is high. As shown in Figure 8B, this combination performs best regarding total annual cost.
The combined cooling, heating, and power system with an internal combustion engine as the power unit has the best economics under a single subsystem scenario. However, the combination approach with an internal combustion engine and a steam boiler performs best throughout the year. The combination approach using a gas turbine plus a steam boiler was the most economical, with cost savings of 10.7%, 7.8%, and 18.3%, respectively, over the other three approaches.

Analysis of the Impact of Natural Gas Prices

In addition, this paper analyzes the impact of natural gas prices on system costs. With the laying of Russian natural gas pipelines and the increasing abundance of natural gas resources in northeast China, the unit price of natural gas may drop to 1.8 RMB/m³ (0.260 USD/m³). Table 2 and Table 3 show the corresponding cost changes.
Steam boilers respond well to lower natural gas prices in winter and summer, especially with high cold loads. At the same time, the cost of internal combustion engine systems in summer and gas turbine systems in winter showed an increasing trend, with the increase in summer being significantly higher than the increase in winter.
The prediction of winter natural gas critical cost was carried out for three different systems. By using direct natural gas heating as the comparison method, the time−by−time distribution of winter natural gas critical price was obtained, as shown in Figure 8C; by using centralized heating as the comparison method, the heating rate in Harbin was 38.38 RMB/m3 (5.548 USD/m3), and the time−by−time distribution of winter natural gas critical price was obtained as shown in Figure 8D. Comparing and analyzing the two methods, the average values of natural gas critical prices for the centralized heating method (1.41 RMB/m3, 1.43 RMB/m3, and 1.20 RMB/m3)/(0.204 USD/m3, 0.207 USD/m3, and 0.174 USD/m3) are 38.9%, 38.8%, and 37.7% of the average values of critical prices for the direct natural gas heating method.
The summer natural gas critical cost predictions were performed for three different systems. The cooling method uses electric chillers, and a time−by−time distribution of the summer natural gas critical price was obtained, as shown in Figure 8E. The peak natural gas critical prices in summer (4.82 RMB/m3, 5.49 RMB/m3, and 4.86 RMB/m3)/(0.697 USD/m3, 0.7937 USD/m3, and 0.703 USD/m3) are all higher than the peak natural gas prices in winter (4.28 RMB/m3, 4.33 RMB/m3, and 3.40 RMB/m3)/(0.619 USD/m3, 0.626 USD/m3, and 0.492 USD/m3). In the summer, when the percentage of cold load is high, the internal combustion engine system can achieve the economic optimum of system power generation faster when the gas price decreases at the same rate; in the winter, when the percentage of the heat load is high, again, the internal combustion engine can achieve the economic optimum of system power generation faster. Selecting the right system while natural gas prices fluctuate can also guide energy allocation options during real−time changes in gas prices.

4. Conclusions

This paper establishes a mathematical model of a gas turbine, an internal combustion engine, a small steam boiler with high parameters, a waste heat recovery device, and a supplementary combustion device for three typical natural gas combined cooling, heating, and power supply systems. The thermodynamic characteristics analysis obtained the energy efficiency variation laws of thermoelectric conversion, waste heat utilization, and steam parameters on the system’s external cooling, heat, and power demand. Four system configuration schemes are proposed, namely “gas turbine—steam type”, “gas turbine—flue gas type”, “internal combustion engine—flue gas type”, and “steam boiler—steam type”. The conclusions are as follows:
(1)
Using the climatic conditions of the Harbin area as a background, the load index method was used to analyze the cooling, heating, and electricity demand of a residential house with a usable area of 10,000 square meters in different seasons, on typical days, and for typical users throughout the year, and it was concluded that the peak of heat load was 1200 kW on a typical day in winter. The peak of the cooling load was 300 kW on a typical day in summer, with significant differences in heat, cooling, and electricity demand;
(2)
According to the load demand of different energy, the operating economy of independent gas turbine system, internal combustion engine system, and steam boiler system was studied, and the optimized selection scheme of host equipment was given when the proportion of cold and hot load was different. In the steam boiler, at this time, the electric chiller and absorption refrigeration capacity accounted for 30% and 70%, respectively, only when there was a heat load using an internal combustion engine. The cost of this combination is RMB 1.766 million (USD 0.255 million), which is 10.7%, 7.8%, and 18.3% less than the cost of three single−equipment subsystems, respectively, and achieves the decoupling of cold, heat, and electrical loads. In summary, the “internal combustion engine + steam boiler” model achieves efficient energy use and energy conversion diversity at a lower cost, improves energy reliability and safety, and reduces energy consumption and environmental pollution. Therefore, the “internal combustion engine + steam boiler” model is essential in constructing multi−energy heterogeneous integrated energy systems;
(3)
The simulation and optimal operation method of the cooling, heating, and power system under multiple energy input conditions were studied. The critical curves of typical daily costs and gas price effects in winter and summer were obtained. At the same rate of gas price reduction, the internal combustion engine system can achieve the economic optimum of system power generation faster throughout the year. If the gas price is lower than the corresponding predicted value, purchasing natural gas for power generation is considered. It is vice versa for grid power, and the optimal deployment scheme is given.

Author Contributions

Conceptualization, Q.S.; Methodology, Y.Z.; Validation, Y.D.; Formal analysis, H.Z.; Investigation, H.D. and Q.D.; Resources, J.G.; Writing—original draft, Y.S.; Writing—review & editing, Y.S. All authors have read and agreed to the published version of the manuscript.

Funding

This research was funded by 2022 Heilongjiang Province’s “Emission and carbon neutrality” the open competition mechanism to select the best candidates project (Adsorption−type compression of carbon dioxide energy storage key technology research and demonstration grant number 2022ZXJ09C01, China’s National Key Research and Development Program (Research on Key Parametric Measurement and Metrology Technology for Energy Efficiency Emissions under Complex Conditions) grant number 2021YFF0600602, and the Special Funds for Basic Research Operations of Central Universities.

Data Availability Statement

Not applicable.

Acknowledgments

This research was funded by 2022 Heilongjiang Province’s “Emission and carbon neutrality” the open competition mechanism to select the best candidates project (Adsorption−type compression of carbon dioxide energy storage key technology research and demonstration grant number 2022ZXJ09C01, China’s National Key Research and Development Program (Research on Key Parametric Measurement and Metrology Technology for Energy Efficiency Emissions under Complex Conditions) grant number 2021YFF0600602, and the Special Funds for Basic Research Operations of Central Universities.

Conflicts of Interest

The authors declare that they have no known competing financial interests or personal relationships that could have appeared to influence the work reported in this paper.

References

  1. Wei, G.; Zhi, W.; Rui, B.; Wei, L.; Gan, Z.; Wu, C.; Wu, Z. Modeling, planning and optimal energy management of combined cooling, heating and power microgrid: A review. Int. J. Electr. Power Energy Syst. 2014, 54, 26–37. [Google Scholar]
  2. Wang, C.; Hong, B.; Guo, L.; Zhang, D.; Liu, W. A General Modeling Method for Optimal Dispatch of Combined Cooling, Heating and Power Microgrid. Proc. Csee 2013, 33, 26–33. [Google Scholar]
  3. Gu, W.; Wang, Z.; Wu, Z.; Luo, Z.; Tang, Y.; Wang, J. An Online Optimal Dispatch Schedule for CCHP Microgrids Based on Model Predictive Control. IEEE Trans. Smart Grid 2017, 8, 2332–2342. [Google Scholar] [CrossRef]
  4. Wang, R.; Wei, G.U.; Zhi, W.U. Economic and Optimal Operation of a Combined Heat and Power Microgrid with Renewable Energy Resources. Autom. Electr. Power Syst. 2011, 35, 22–27. [Google Scholar]
  5. Matthias, M.; Daniel, S.; Georg, L.; Christoph, L.; Carlo, C.; Hans, A. Beyond Traditional Energy Sector Coupling: Conserving and Efficient Use of Local Resources. Sustainability 2022, 14, 7445. [Google Scholar]
  6. Liu, Y.; Yang, X.; Wang, M. Global Transmission of Returns among Financial, Traditional Energy, Renewable Energy and Carbon Markets: New Evidence. Energies 2021, 14, 7286. [Google Scholar] [CrossRef]
  7. Feng, D.; Shang, Q.; Dong, H.; Zhang, Y.; Wang, Z.; Li, D.; Xie, M.; Wei, Q.; Zhao, Y.; Sun, S. Catalytic mechanism of Na on coal pyrolysis-derived carbon black formation: Experiment and DFT simulation. Fuel Process. Technol. 2021, 224, 107011. [Google Scholar] [CrossRef]
  8. Zhang, Y.; Shang, Q.; Feng, D.; Sun, H.; Wang, F.; Hu, Z.; Cheng, Z.; Zhou, Z.; Zhao, Y.; Sun, S. Interaction mechanism of in-situ catalytic coal H2O-gasification over biochar catalysts for H2O-H-2-tar reforming and active sites conversion. Fuel Process. Technol. 2022, 233, 107307. [Google Scholar] [CrossRef]
  9. Feng, D.; Guo, D.; Shang, Q.; Zhao, Y.; Zhang, L.; Guo, X.; Cheng, J.; Chang, G.; Guo, Q.; Sun, S. Mechanism of biochar-gas-tar-soot formation during pyrolysis of different biomass feedstocks: Effect of inherent metal species. Fuel 2021, 293, 120409. [Google Scholar] [CrossRef]
  10. Zhang, Y.; Wang, S.; Feng, D.; Gao, J.; Dong, L.; Zhao, Y.; Sun, S.; Huang, Y.; Qin, Y. Functional Biochar Synergistic Solid/Liquid-Phase CO2 Capture: A Review. Energy Fuels 2022, 36, 2945–2970. [Google Scholar] [CrossRef]
  11. Feng, D.; Guo, D.; Zhang, Y.; Sun, S.; Zhao, Y.; Chang, G.; Guo, Q.; Qin, Y. Adsorption-enrichment characterization of CO2 and dynamic retention of free NH3 in functionalized biochar with H2O/NH3·H2O activation for promotion of new ammonia-based carbon capture. Chem. Eng. J. 2021, 409, 128193. [Google Scholar] [CrossRef]
  12. Alireza, D.; Alireza, Z.; Sajjad, M.S. Conceptual design and technical analysis of a hybrid natural gas/molten carbonate fuel cell system for combined cooling, heating, and power applications. Energy Build. 2022, 273, 112402. [Google Scholar]
  13. He, X.; Li, C.; Wang, H. Thermodynamics analysis of a combined cooling, heating and power system integrating compressed air energy storage and gas-steam combined cycle. Energy 2022, 260, 125105. [Google Scholar] [CrossRef]
  14. Wang, Z.; Cai, W.; Tao, H.; Wu, D.; Meng, J. Research on capacity and strategy optimization of combined cooling, heating and power systems with solar photovoltaic and multiple energy storage. Energy Convers. Manag. 2022, 268, 115965. [Google Scholar] [CrossRef]
  15. Guo, L.; Liu, W.; Cai, J.; Hong, B.; Wang, C. A two-stage optimal planning and design method for combined cooling, heat and power microgrid system. Energy Convers. Manag. 2013, 74, 433–445. [Google Scholar] [CrossRef]
  16. Rezvan, A.T.; Gharneh, N.S.; Gharehpetian, G.B. Optimization of distributed generation capacities in buildings under uncertainty in load demand. Energy Build. 2013, 57, 58–64. [Google Scholar] [CrossRef]
  17. Feng, D.; Zhang, Y.; Zhao, Y.; Sun, S.; Wu, J.; Tan, H. Mechanism of in-situ dynamic catalysis and selective deactivation of H 2 O-activated biochar for biomass tar reforming. Fuel 2020, 279, 118450. [Google Scholar] [CrossRef]
  18. Barbieri, E.S.; Spina, P.R.; Venturini, M. Analysis of innovative micro-CHP systems to meet household energy demands. Appl. Energy 2012, 97, 723–733. [Google Scholar] [CrossRef]
  19. Dincer, I. On thermal energy storage systems and applications in buildings. Energy Build. 2002, 34, 377–388. [Google Scholar] [CrossRef]
  20. Pagliarini, G.; Rainieri, S. Modeling of a thermal energy storage system coupled with combined heat and power generation for the heating requirements of a University Campus. Appl. Therm. Eng. 2010, 30, 1255–1261. [Google Scholar] [CrossRef]
  21. Huicochea, A.; Rivera, W.; Gutiérrez-Urueta, G.; Bruno, J.C.; Coronas, A. Thermodynamic analysis of a trigeneration system consisting of a micro gas turbine and a double effect absorption chiller. Appl. Therm. Eng. 2011, 31, 3347–3353. [Google Scholar] [CrossRef]
  22. Feng, D.; Zhao, Y.; Zhang, Y.; Xu, H.; Zhang, L.; Sun, S. Catalytic mechanism of ion-exchanging alkali and alkaline earth metallic species on biochar reactivity during CO2/H2O gasification. Fuel 2018, 212, 523–532. [Google Scholar] [CrossRef]
  23. Bassols, J.; Kuckelkorn, B.; Langreck, J.; Schneider, R.; Veelken, H. Trigeneration in the food industry. Appl. Therm. Eng. 2002, 22, 595–602. [Google Scholar] [CrossRef]
  24. Khatri, K.K.; Sharma, D.; Soni, S.; Tanwar, D. Experimental investigation of CI engine operated Micro-Trigeneration system. Appl. Therm. Eng. 2010, 30, 1505–1509. [Google Scholar] [CrossRef]
  25. Kong, X.Q.; Wang, R.Z.; Huang, X.H. Energy optimization model for a CCHP system with available gas turbines. Appl. Therm. Eng. 2004, 25, 377–391. [Google Scholar] [CrossRef]
  26. Feng, D.; Guo, D.; Zhang, Y.; Sun, S.; Zhao, Y.; Shang, Q.; Sun, H.; Wu, J.; Tan, H. Functionalized construction of biochar with hierarchical pore structures and surface O-/N-containing groups for phenol adsorption. Chem. Eng. J. 2020, 410, 127707. [Google Scholar] [CrossRef]
  27. Zhang, D.; Zhang, B.; Zheng, Y.; Zhang, R.; Liu, P.; An, Z. Economic assessment and regional adaptability analysis of CCHP system coupled with biomass-gas based on year-round performance—ScienceDirect. Sustain. Energy Technol. Assess. 2021, 45, 101141. [Google Scholar]
  28. Mago, P.J.; Chamra, L.M. Analysis and optimization of CCHP systems based on energy, economical, and environmental considerations. Energy Build. 2009, 41, 1099–1106. [Google Scholar] [CrossRef]
  29. Chicco, G.; Mancarella, P. Matrix modelling of small-scale trigeneration systems and application to operational optimization. Energy 2009, 34, 261–273. [Google Scholar] [CrossRef]
  30. Yosten, A.J.; Henze, G.P. Modeling and Optimal Control of Distributed Generation Systems for Demand and Energy Management. In Proceedings of the ASME 2009 3rd International Conference on Energy Sustainability collocated with the Heat Transfer and InterPACK09 Conferences, San Francisco, CA, USA, 19–23 July 2009; pp. 109–119. [Google Scholar]
  31. Murai, M.; Sakamoto, Y.; Shinozaki, T. An optimizing control for district heating and cooling plant. In Proceedings of IEEE International Conference on Control Applications, Kohala Coast, HI, USA, 22–27 August 1999; pp. 600–604. [Google Scholar]
  32. Liu, X.; Wu, J.; Jenkins, N.; Bagdanavicius, A. Combined analysis of electricity and heat networks. Appl. Energy 2016, 162, 1238–1250. [Google Scholar] [CrossRef] [Green Version]
  33. Ruotong, W. Optimal Operation Strategies for Multi-Energy Systems in Industrial Parks. Bachelor’s Thesis, North China University of Electric Power, Beijing, China, 2021. [Google Scholar]
  34. Li, N.; Gu, J.; Liu, B.; Lu, H. Optimal configuration and operation strategy of multi-energy complementary microgrid system based on improved particle swarm algorithm. Electr. Energy Effic. Manag. Technol. 2017, 19, 53–64. [Google Scholar]
  35. Cao, C.; Liu, L.; Quan, C.; Zhang, R. Study on the application of multi-energy complementary heating system for civil buildings in severe cold regions. Qinghai Technol. 2022, 29, 111–119. [Google Scholar]
  36. Xu, L. Multi-Energy Complementary Distributed Energy Systems for Renewable Energy in Harsh Cold Regions. Master’s Thesis, North China Electric Power University, Beijing, China, 2022. [Google Scholar]
  37. Wang, X.; Xu, Y.; Fu, Z.; Guo, J.; Bao, Z.; Li, W.; Zhu, Y. A dynamic interactive optimization model of CCHP system involving demand-side and supply-side impacts of climate change. Part II: Application to a hospital in Shanghai, China. Energy Convers. Manag. 2022, 252, 115112. [Google Scholar] [CrossRef]
  38. Tan, Q.; Chen, L.; Wu, P.; Xu, H.; Tang, W.; Yin, J. Robust Scheduling Optimization Model for Combined Cooling, Heating and Power System in Industrial Parks. J. Phys. Conf. Ser. 2022, 2160, 012048. [Google Scholar] [CrossRef]
  39. Liu, Y. Research on Optimization of Building Type Natural Gas Cooling, Heating and Power Trigeneration System in Severe Cold Areas. Master’s Thesis, Harbin Institute of Technology, Harbin, China, 2019. [Google Scholar]
  40. Wang, C.; Hong, B.; Guo, L.; Zhang, D.; Liu, W. General modeling method for optimal scheduling of microgrid with combined power supply. Proc. CSEE 2013, 33, 26–33+23. [Google Scholar] [CrossRef]
  41. Gao, L.; Hwang, Y.; Cao, T. An overview of optimization technologies applied in combined cooling, heating and power systems. Renew. Sustain. Energy Rev. 2019, 114, 109344. [Google Scholar] [CrossRef]
  42. Jiang, Y.; Xu, J.; Sun, Y.; Wei, C.; Wang, J.; Liao, S.; Ke, D.; Li, X.; Yang, J.; Peng, X. Coordinated operation of gas-electricity integrated distribution system with multi-CCHP and distributed renewable energy sources. Appl. Energy 2018, 211, 237–248. [Google Scholar] [CrossRef]
  43. Wang, J.; Xie, X.; Lu, Y.; Liu, B.; Li, X. Thermodynamic performance analysis and comparison of a combined cooling heating and power system integrated with two types of thermal energy storage. Appl. Energy 2018, 219, 114–122. [Google Scholar] [CrossRef]
  44. Ahn, H.; Freihaut, J.D.; Rim, D. Economic feasibility of combined cooling, heating, and power (CCHP) systems considering electricity standby tariffs. Energy 2019, 169, 420–432. [Google Scholar] [CrossRef]
  45. Zhang, J.; Cao, S.; Yu, L.; Zhou, Y. Comparison of combined cooling, heating and power (CCHP) systems with different cooling modes based on energetic, environmental and economic criteria. Energy Convers. Manag. 2018, 160, 60–73. [Google Scholar] [CrossRef]
  46. Fan, J.; Hong, H.; Zhu, L.; Jiang, Q.; Jin, H. Thermodynamic and environmental evaluation of biomass and coal co-fuelled gasification chemical looping combustion with CO2 capture for combined cooling, heating and power production. Appl. Energy 2017, 195, 861–876. [Google Scholar] [CrossRef]
  47. Gao, Y.; Deng, Y.; Yao, W.; Hang, Y. Optimization of combined cooling, heating, and power systems for rural scenario based on a two-layer optimization model. J. Build. Eng. 2022, 60, 105217. [Google Scholar] [CrossRef]
  48. Kuang, J.; Zhang, C.; Sun, B.; Hang, Y. Stochastic Dynamic Solution for Off-design Operation Optimization of Combined Cooling, Heating, and Power Systems With Energy Storage. Appl. Therm. Eng. 2019, 163, 114356. Available online: https://www.sciencedirect.com/science/article/abs/pii/S1359431119336294?via%3Dihub (accessed on 15 April 2023).
  49. Rajabi, M.; Mehrpooya, M.; Haibo, Z.; Huang, Z. Chemical looping technology in CHP (combined heat and power) and CCHP (combined cooling heating and power) systems: A critical review. Energy Ecol. 2019, 253, 113544. [Google Scholar] [CrossRef]
  50. Wu, H.; Liu, Q.; Xie, G.; Guo, S.; Zheng, J.; Su, B. Performance investigation of a novel hybrid combined cooling, heating and power system with solar thermochemistry in different climate zones. Energy 2020, 190, 116281. [Google Scholar] [CrossRef]
  51. Cui, Y.; Ao, X.; Cao, J.; Zhou, X.; Li, M.; Zhao, C.; Liu, M.; Lin, R. Effects of climate change on energy consumption of office buildings in typical cities of Northeast China. J. Meteorol. Environ. 2021, 37, 91–99. [Google Scholar]
  52. Pan, T.; Du, G.; Zhang, C.; Dong, J.; Li, Q.; Shi, F. Landsat TM analysis of surface temperature variation characteristics in Harbin City from 2001 to 2015. Geogr. Sci. 2016, 36, 1759–1766. [Google Scholar] [CrossRef]
  53. Song, L.; Han, J.; Liu, Y.; Zhou, C. Variation characteristics and forecast model of winter surface temperature in Harbin City. Meteorol. Heilongjiang 2014, 31, 28–30+38. [Google Scholar] [CrossRef]
Figure 1. Schematic diagram of distributed energy optimization and evaluation indicators.
Energies 16 04582 g001
Figure 2. Gas turbine CCHP subsystem.
Energies 16 04582 g002
Figure 3. CCHP system of internal combustion engine.
Energies 16 04582 g003
Figure 4. Steam boiler CCHP system.
Energies 16 04582 g004
Figure 5. (A) Average monthly dry bulb temperature in typical years in Harbin; (B) annual cooling and heating load distribution in Harbin; (C) hourly distribution of typical daily load in winter; (D) hourly distribution of typical daily load in summer.
Energies 16 04582 g005
Figure 6. (A) Hourly cost distribution of natural gas; (B) hourly cost distribution of natural gas; (C) monthly operating cost distribution of gas turbine system.
Energies 16 04582 g006
Figure 7. (A) Converted electricity price distribution map; (B) distribution of electricity prices in Harbin area by period; (C) comparative analysis of typical daily system costs for a gas turbine considering purchased electricity in winter; (D) comparative analysis of typical daily system costs for a gas turbine considering purchased electricity in summer.
Energies 16 04582 g007
Figure 8. (A) Comparison chart of annual operating costs of three systems; (B) comparison chart of total costs of different operation modes in the year; (C) hourly distribution of critical price of natural gas in winter (natural gas); (D) hourly distribution of critical price of natural gas in winter (central heating); (E) hourly distribution of critical price of natural gas in summer.
Energies 16 04582 g008
Table 1. Physical significance of model parameters.
SymbolsMeaningSymbolsMeaning
E G T Gas turbine power generation efficiency, kW ξ Heat recovery coefficient
E max G T Rated power generation of gas turbine, kW R Low−level calorific constant, usually taken as 9.7
E min G T Minimum power generated by gas turbine, kW Q y r Heat generation, kW
E max G T 0 Rated power generation of the gas turbine under design conditions, kW C O P q e c Cooling factor of the unit
t t 0 Temperature correction ε q e Status parameters of the unit
F G T Fuel calorific value, kW Q y r Heat generation, kW
Q G T Exhaust smoke recoverable heat value, kW η y r , η y r 0 Operating efficiency vs. rated efficiency
t 0 Design temperature, ℃ β y r Load factor
t Actual working temperature of equipment, ℃ ε y r Status parameters of the boiler
a G T , b G T , c G T , p G T , q G T Coefficient, related to equipment capacity C c e Refrigeration capacity of the chiller, kW
P n 0 Rated capacity of the gas−fired internal combustion engine, kW C O P c e Refrigeration coefficient of the refrigeration machine refrigeration unit
η q 0 Rated thermal efficiency of internal combustion engines ε c e Status parameters of the unit
η e Electrical efficiency of internal combustion engines at partial load rates C c e min , C c e max The minimum and maximum cooling capacity of the refrigerator, kW
η q Thermal efficiency of internal combustion engines at partial load rates Q g Heat supplied by boiler, kW
r Load factor of internal combustion engine η g , η g 0 Operating efficiency vs. rated efficiency
P n Power plant power generation, kW β g Load factor
Q n Power unit recovery waste heat, kW ε c e Status parameters of the boiler
F n Amount of natural gas consumed, m³
Table 2. Comparison of typical daily expenses in summer.
Gas Turbine SubsystemInternal Combustion Engine SubsystemSteam Boiler Subsystem
Purchase of gas + purchase of electricity (RMB)6791.265778.454970.76
Low−cost natural gas (RMB)5016.1413,056.151837.73
Cost savings rate26.1% 63.0%
Table 3. Comparison of typical daily expenses in winter.
Gas Turbine SubsystemInternal Combustion Engine SubsystemSteam Boiler Subsystem
Purchase of gas + purchase of electricity (RMB)15,023.7114,156.8514,352.15
Low−cost natural gas (RMB)22,252.745746.396405.22
Cost savings rate 59.4%55.4%
Disclaimer/Publisher’s Note: The statements, opinions and data contained in all publications are solely those of the individual author(s) and contributor(s) and not of MDPI and/or the editor(s). MDPI and/or the editor(s) disclaim responsibility for any injury to people or property resulting from any ideas, methods, instructions or products referred to in the content.

