Article

Structure and Operation Optimization of a Form-Stable Carbonate/Ceramic-Based Electric Thermal Storage Device for Space Heating

1
Key Laboratory of Power Station Energy Transfer Conversion and System of MOE, North China Electric Power University, Beijing 102206, China
2
State Key Laboratory of Advanced Power Transmission Technology, Global Energy Interconnection Research, Institute Co., Ltd., Changping District, Beijing 102211, China
*
Author to whom correspondence should be addressed.
Energies 2023, 16(11), 4506; https://doi.org/10.3390/en16114506
Submission received: 15 May 2023 / Revised: 29 May 2023 / Accepted: 2 June 2023 / Published: 3 June 2023

Abstract

:
The escalating demand for heating and the widespread use of CO2-emitting fossil fuels during cold seasons have imposed significant pressure on our natural resources. As a promising alternative to coal-fired boilers, electrical thermal storage devices (ETSDs) for space heating are gaining popularity. However, designing ETSDs for space heating involves significant challenges, which involve their storage rate and operational stability. In contrast to the research of directly developing mid-temperature ETSDs to manage heat release during long heating hours, this study proposed a new ETSD that uses K2CO3–Na2CO3 for high-temperature storage to match the off-peak hours and thereby gain potential economic benefits. This study used experimental and simulation methods to investigate the ETSD’s temperature distribution. An operational strategy was also proposed to achieve more efficient temperature distribution and higher economic benefits. The ETSD with two steel plates and two insulation layers with a power rating of 1.6 kW was found to be the optimum structure, due to its improved heat storage rate (2.1 °C/min), uniform temperature, and material heat resistance (<750 °C). An energy analysis, economic analysis, and a 7-day cycling operation performance of the device were then conducted by comparing the proposed ETSD with a traditional electric heater. The results revealed that the proposed ETSD released 53.4% of the stored energy in the room, and stored 48.6% of it during valley electric time. The total cost of the proposed ETSD was consistently lower than the traditional electric heater in the second heating season (by the 213th day). The efficiency of its valley heat storage for users was 37.2%. Overall, this study provides valuable insights into the development and practical applications of ETSD systems for space heating.

1. Introduction

Interest in using electricity as the power for space heating in China has been promoted since the government determined that coal consumption causing severe hazy weather be reduced [1]. Unlike other sources, electricity offers high efficiency, and does not produce scattered air pollution [2]. However, despite these benefits, the traditional electric space heater still faces relatively low social acceptance, particularly among rural end users who prioritize economic benefits over environmental concerns [3]. In such a scenario, the electric thermal storage device (ETSD) is emerging as a promising technology to compete with traditional coal-fired boilers for space heating in commercial applications [4].
The ETSD can utilize electricity at a low price at night, and can store extra heat during the daytime [5]. In addition to enabling a more cost-effective use of electricity, this approach can improve grid stability by increasing night-time demand and decreasing daytime peak loads, reducing the curtailments of wind and solar energy [6]. Researchers have explored various designs and storage mediums for electric thermal storage with diurnal cycling. One technology involves large-volume phase-change material (PCM) with low-temperature collection. For instance, Tian et al. [7] used water as the storage medium for space heating, which has been widely used in heating and air-conditioning applications due to its low price. To improve the heat storage density, He et al. [8] experimentally investigated the performance of a thermal energy storage (TES) tank with an encapsulated paraffin wax-packed bed. The advantages of conventional water TES tanks and the larger heat storage density of latent heat storage that uses phase-change material (PCM) were combined. However, water–PCM tanks require significant space, making them difficult to implement in apartment buildings. Lin et al. [9] and Li et al. [10] proposed an under-floor electric heating system with paraffin-based form-stable PCM plates with a phase transition temperature of 52 °C. The storage medium was embedded in a floor layer for purpose of space-saving. Thermal conductivity enhancement is necessary for PCM utilization due to its low heat transfer ability. Yuan et al. [11] and Ren et al. [12] designed new composite form-stable PCMs with higher melting temperatures of 116 °C and 220 °C, respectively. They used expanded graphite (EG) to improve thermal conductivity and stability. Musial et al. [13] combined pure organic PCM or composite materials with PCM and high conductive material to achieve more uniform temperature distribution. Zhou et al. [14] analyzed the thermal performance of the composite phase-change material embedded in a porous ceramic skeleton, based on the lattice Boltzmann method. Furthermore, a nanoparticle-based PCM was found to effectively improve the thermal performance [15,16].
Other investigations have focused on ETSDs using air–fluid as the heat transfer medium. Air is heated by electrical heat modules with PCM [17], allowing for higher storage temperatures. Kuznik et al. [18] analyzed the performance of a PCM-to-air heat exchanger with a melting temperature of 30–45 °C, using a dimensionless study to select the best PCM and design optimal storage units for different scenarios. Ceramic bricks were newly selected for the storage medium for an air-change ETSD, which can be heated up to more than 800 °C [5]. Xu et al. [4] proposed an ETSD to simulate natural convection to drive flowing air through the flow channel. They used a carbonate /MgO–SiC form-stable high-PCM brick as the TES medium. The simulated results showed that the temperature distribution of the bricks was non-uniform during the charging and discharging processes. The applications of practical testing and operation strategies cannot be conducted using simulation methods.
Considering the literature review, using ETSDs for space heating poses three significant challenges. Firstly, the storage medium can reach high and non-uniform temperatures, which poses a safety hazard to users. Hence, effective measures must be implemented to ensure proper insulation and temperature control, particularly in high-temperature air–fluid systems, where ceramic bricks can reach temperatures as high as 700–800 °C. Secondly, the cycling stability of ETSDs should be further tested to ensure the material’s thermal resistance. Thirdly, the application and operation strategy of high-temperature ETSDs must be emphasized.
This research addressed knowledge gaps in the field of high-temperature ETSDs by investigating novel aspects related to high- and non-uniform-temperature challenges, as well as operation stability and economic issues. This study employed experimental and simulation methods to investigate the temperature distribution of a new type of ETSD, in both 2D and 3D dimensions. Monitoring the temperature distribution of the storage medium is a direct way to investigate parts that overheat. Additionally, an improved storage medium was proposed to achieve a higher energy density and more efficient temperature distribution. Cycle tests, an energy analysis, and an economic analysis were conducted. Based on these analyses, a strategy of integrating ETSD systems with existing heating systems to increase their overall efficiency and reduce energy wastage was proposed. The findings of this study will provide valuable insights into the development of ETSD systems and their practical applications in the field of space heating.

2. Materials and Methods

2.1. Preparation of the Form–Stable Phase–Change Bricks

K2CO3 (99% purity) and Na2CO3 (99% purity) were selected as high-temperature PCMs because of their high viscosity. MgO (99% purity) and SiC (99% purity) were used as the skeleton and the thermal conductive enhancer, respectively. These materials were all purchased from Sigma-Aldrich in St. Louis, MO, USA.
The Na2CO3 and K2CO3 salts were firstly mixed at a mass ratio of 52.2% to 47.8%, in order to achieve a eutectic mixture, which was then mixed with MgO and SiC in selected proportions as 54.5 wt.%, 36.4 wt.%, and 9.1 wt.%, respectively. This selected ratio was reported by Jiang et al. [19]. All of the ingredients were mixed in a ball mill for 10 min at a rotating speed of 100 rpm. Then, the mixed powders were prepared for the composite PCM to obtain the form-stable heat storage brick with the pressing-sinter method. The mixed powders were first compressed at 40 MPa to yield tablets with dimensions of 230 × 115 × 53 mm. The tablets were heated to 750 °C at a heating rate of 5 °C/min, and maintained at 750 °C for 30 min. Then, the composite PCM bricks were allowed to cool to room temperature naturally.

2.2. Characterization of the Form–Stable Phase–Change Bricks

The TG–DSC (thermogravimetric-differential scanning calorimetry, STA–449 F3) method was used to determine the thermophysical properties of the form-stable PCM (FS–PCM) bricks. The device typically has a precision of less than 1 mW. The results from DSC testing can provide information about the melting and solidification behavior, as well as the heat capacity and enthalpy of the phase-change material.
The temperature distributions for the form-stable PCM monitor in ETSD operation were performed using K-type thermocouples and a Fluke data logger (Fluke 2638 A HYDRA Series III Data Acquisition Unit, Fluke Corp., Everett, Washington, DC, USA). The temperature tests aimed to measure the temperature changes of the PCM as it transitioned from solid to liquid, and vice versa, during the charging and discharging cycles of the ETSD. The data logger was programmed to measure the temperature at set intervals of 1 min.

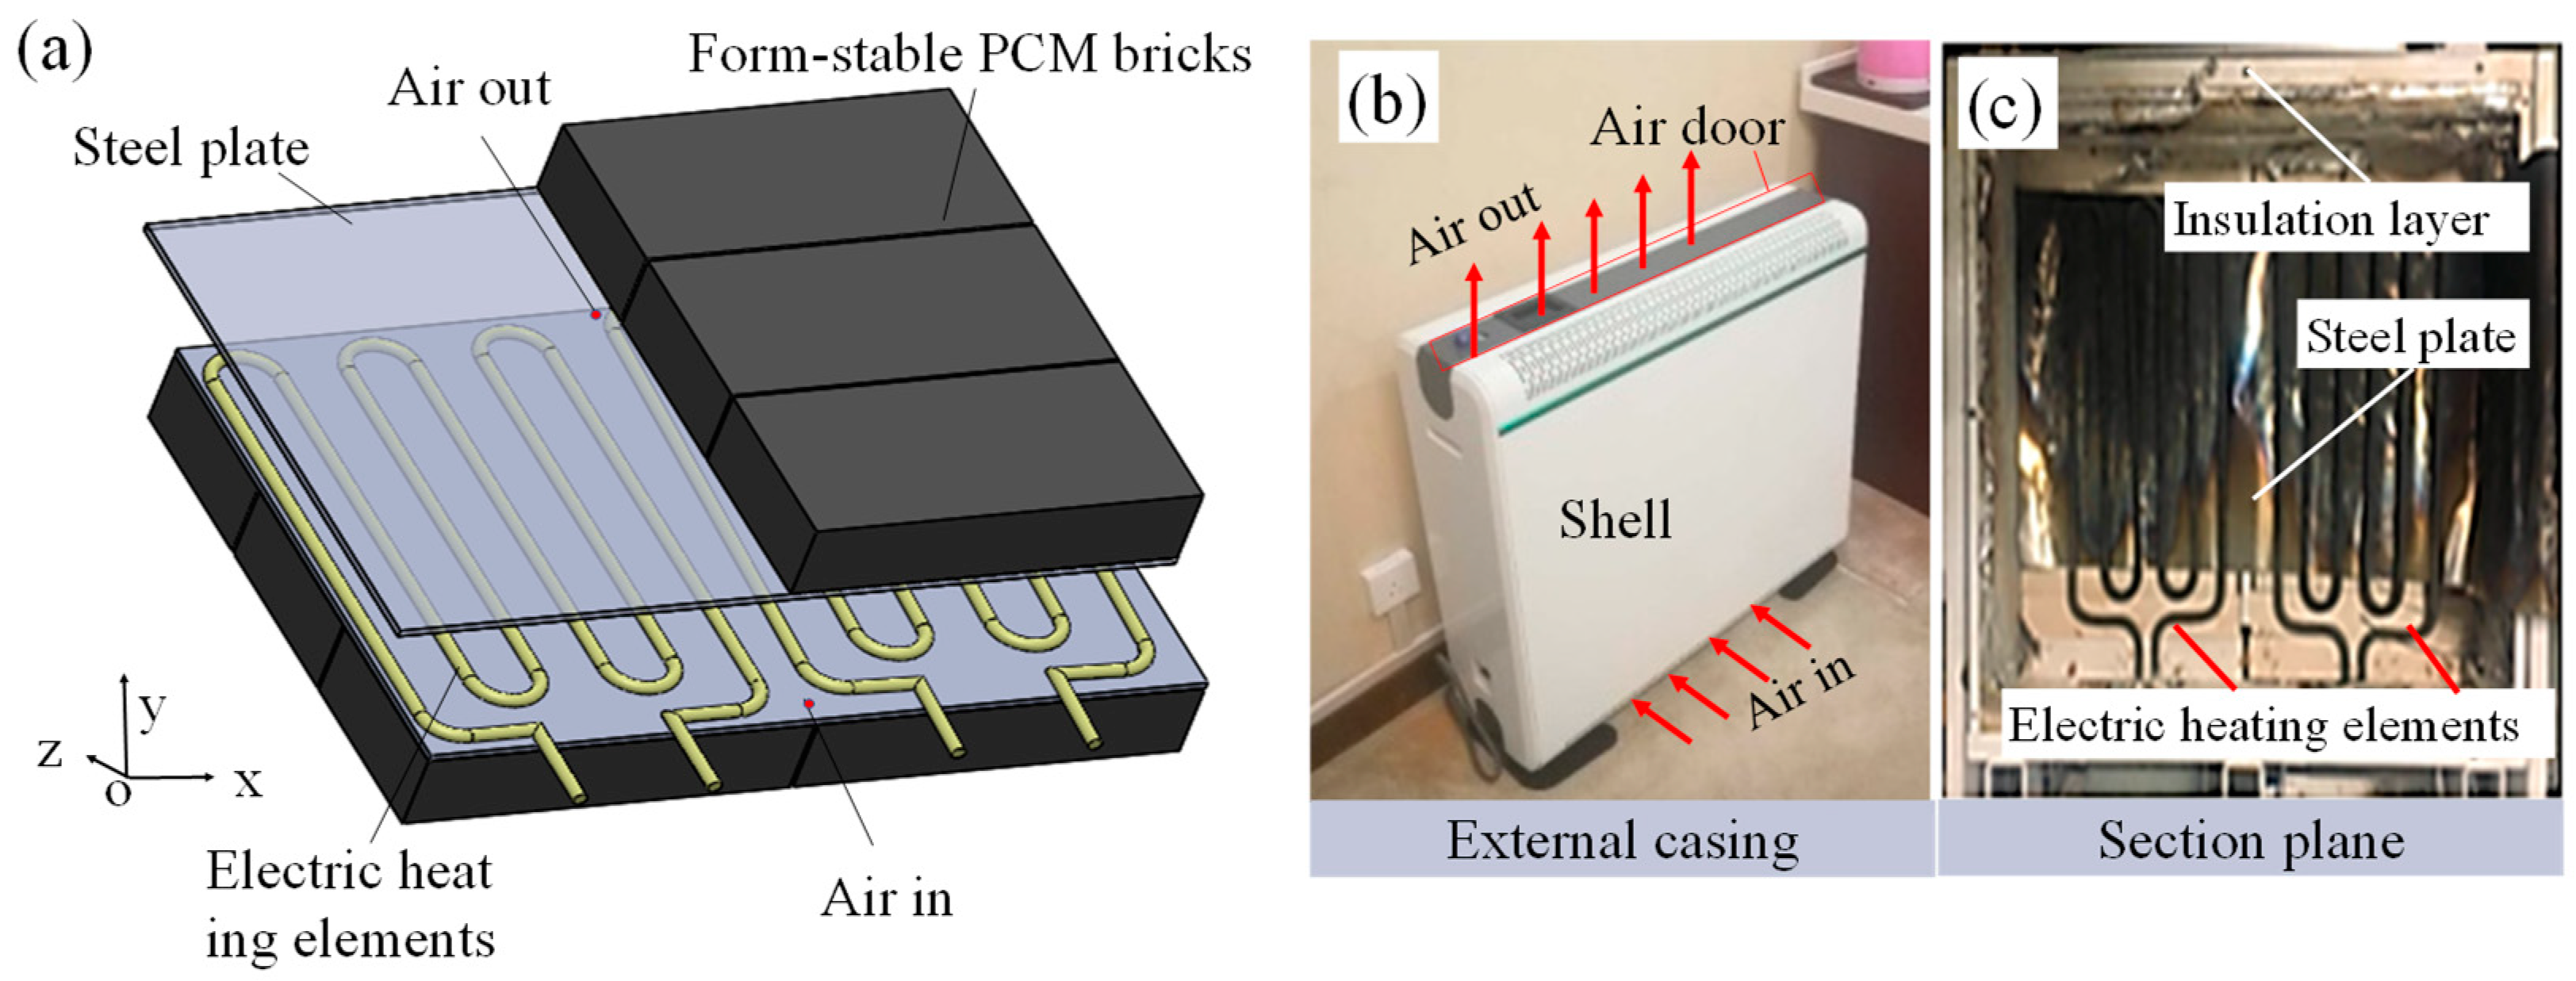
2.3. The Structure of the ETSD

The ETSD consisted primarily of two electric heating elements, twelve pieces of FS–PCM bricks, insulation layers, two steel plates, and a metal shell. The bricks were stacked in two parallel columns, with three bricks placed vertically in each column, as shown in Figure 1a. The mass of the bricks was 20 kg. In order to test the operating temperature, 16 temperature measurement points were arranged in the X and Y directions of the phase-change bricks. U–shaped tube heating elements were inserted between the two rows of bricks, with a diameter of 5 mm and a bottom heating gap of 150 mm.
The size of the stacked FS–PCM bricks was 460 × 106 × 345 mm, and two air channels the size of 190 × 15 × 345 mm were formed in the center opening. The top of the air channel was equipped with an adjustable air damper, with an opening angle that could change from 0° to 90°. The internal and external shell of the device and the control module and wire trough were built based on this foundation, giving the ETSD an overall size of 660 × 190 × 615 mm, as shown in Figure 1b. The air damper was kept closed during the heat charging process, and with a 30% opening during the heat release process. The section plane is shown in Figure 1c. The insulation layer was warped on the surface of the stacked FS–PCM bricks.

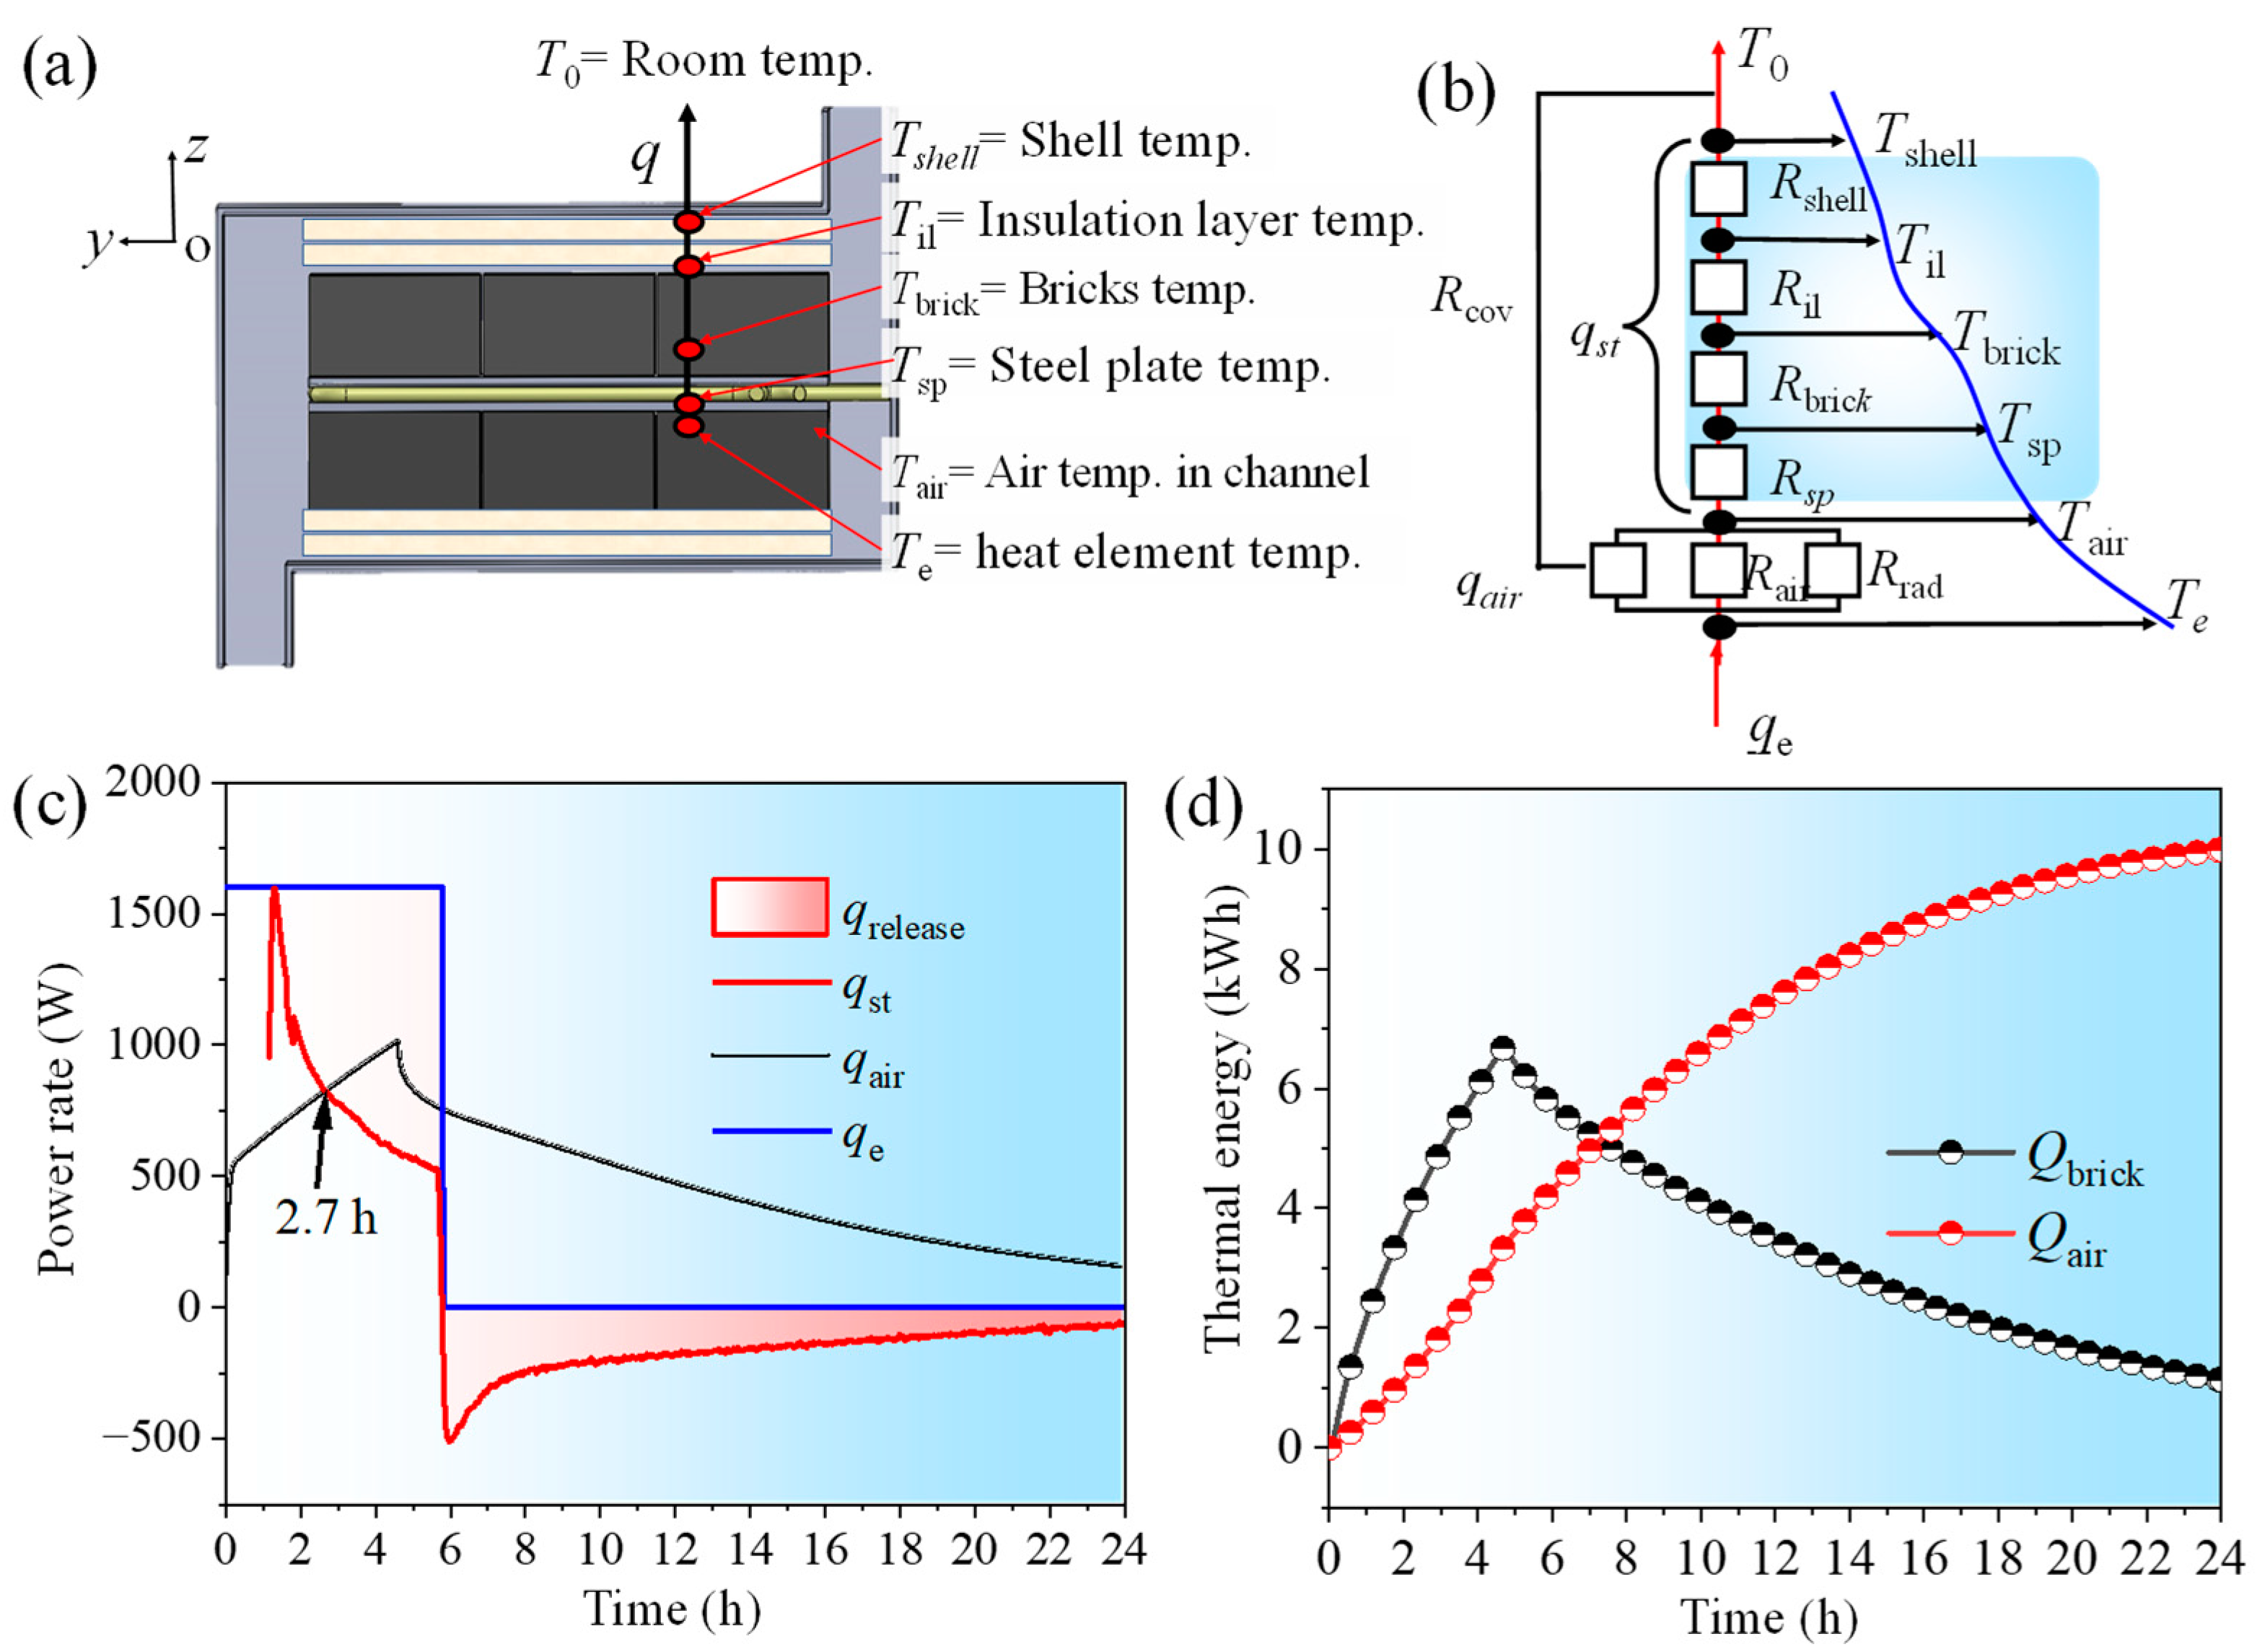
2.4. Calculation Methods

For a given ETSD, the heat is first stored in the FS–PCM, and then released. An energy analysis can determine the heat storage ratio (ηst) and the amount of heat released (q). The lumped capacitance method was utilized to analyze the heat transfer in the PCM due to the low value of the Biot number (Bi < 0.1) [20]. The Biot number was defined as the ratio of the internal thermal resistance of the PCM to the external thermal resistance of the PCM, including that of the container, insulation lays, and the heater surface.

2.4.1. Calculation of Heat Storage Ratio

It was assumed that the heat transfer in all surfaces was one-dimensional, in order to simplify the calculation. The heat is discharged to a room by convection and radiation. The heat discharge rate can be obtained by the following:
q = i = 1 6 A i h i ( T w i T )
where i refers to one of the six outside surfaces of the heater. The integrated heat transfer coefficient h for the different surfaces is defined as follows:
h = h c + h r
For the different outer surfaces, the convective coefficient hc is given by [21] as follows:
h c = n × ( Δ t l ) 1 / 4
where n = 1.42 for the front surface, both side surfaces, and the back surface of the heater; n = 0.66 for the bottom surface of the heater; and n = 1.32 for the top surface of the heater [21].
h r = ε c 0 T w 100 4 T 100 4 T w T
where ε = 0.92 for paint and ε = 0.3 for galvanized iron sheet. The heat storage ratio of the heater is defined as the ratio of the stored heat during the heat charge process to the total input electrical energy. The following equation can define it:
η st = Q pcm + Q sp + Q il + Q shell P τ × 100 % = 1 0 τ q d τ P τ
Q pcm = c pcm m bricks Δ T
where cpcm refers to the specific heat capacity of the heat storage brick; mbricks refers to the total mass of the heat storage brick; ΔT is the relative temperature difference. Similarly, the accumulated heat power of the steel plate, Qsp, accumulated heat power Qil of the insulation layer, and the accumulated heat power of the shell Qshell can also be calculated using Equation (6). The thermal physical properties of the material used in the ETSD are listed in Table 1.

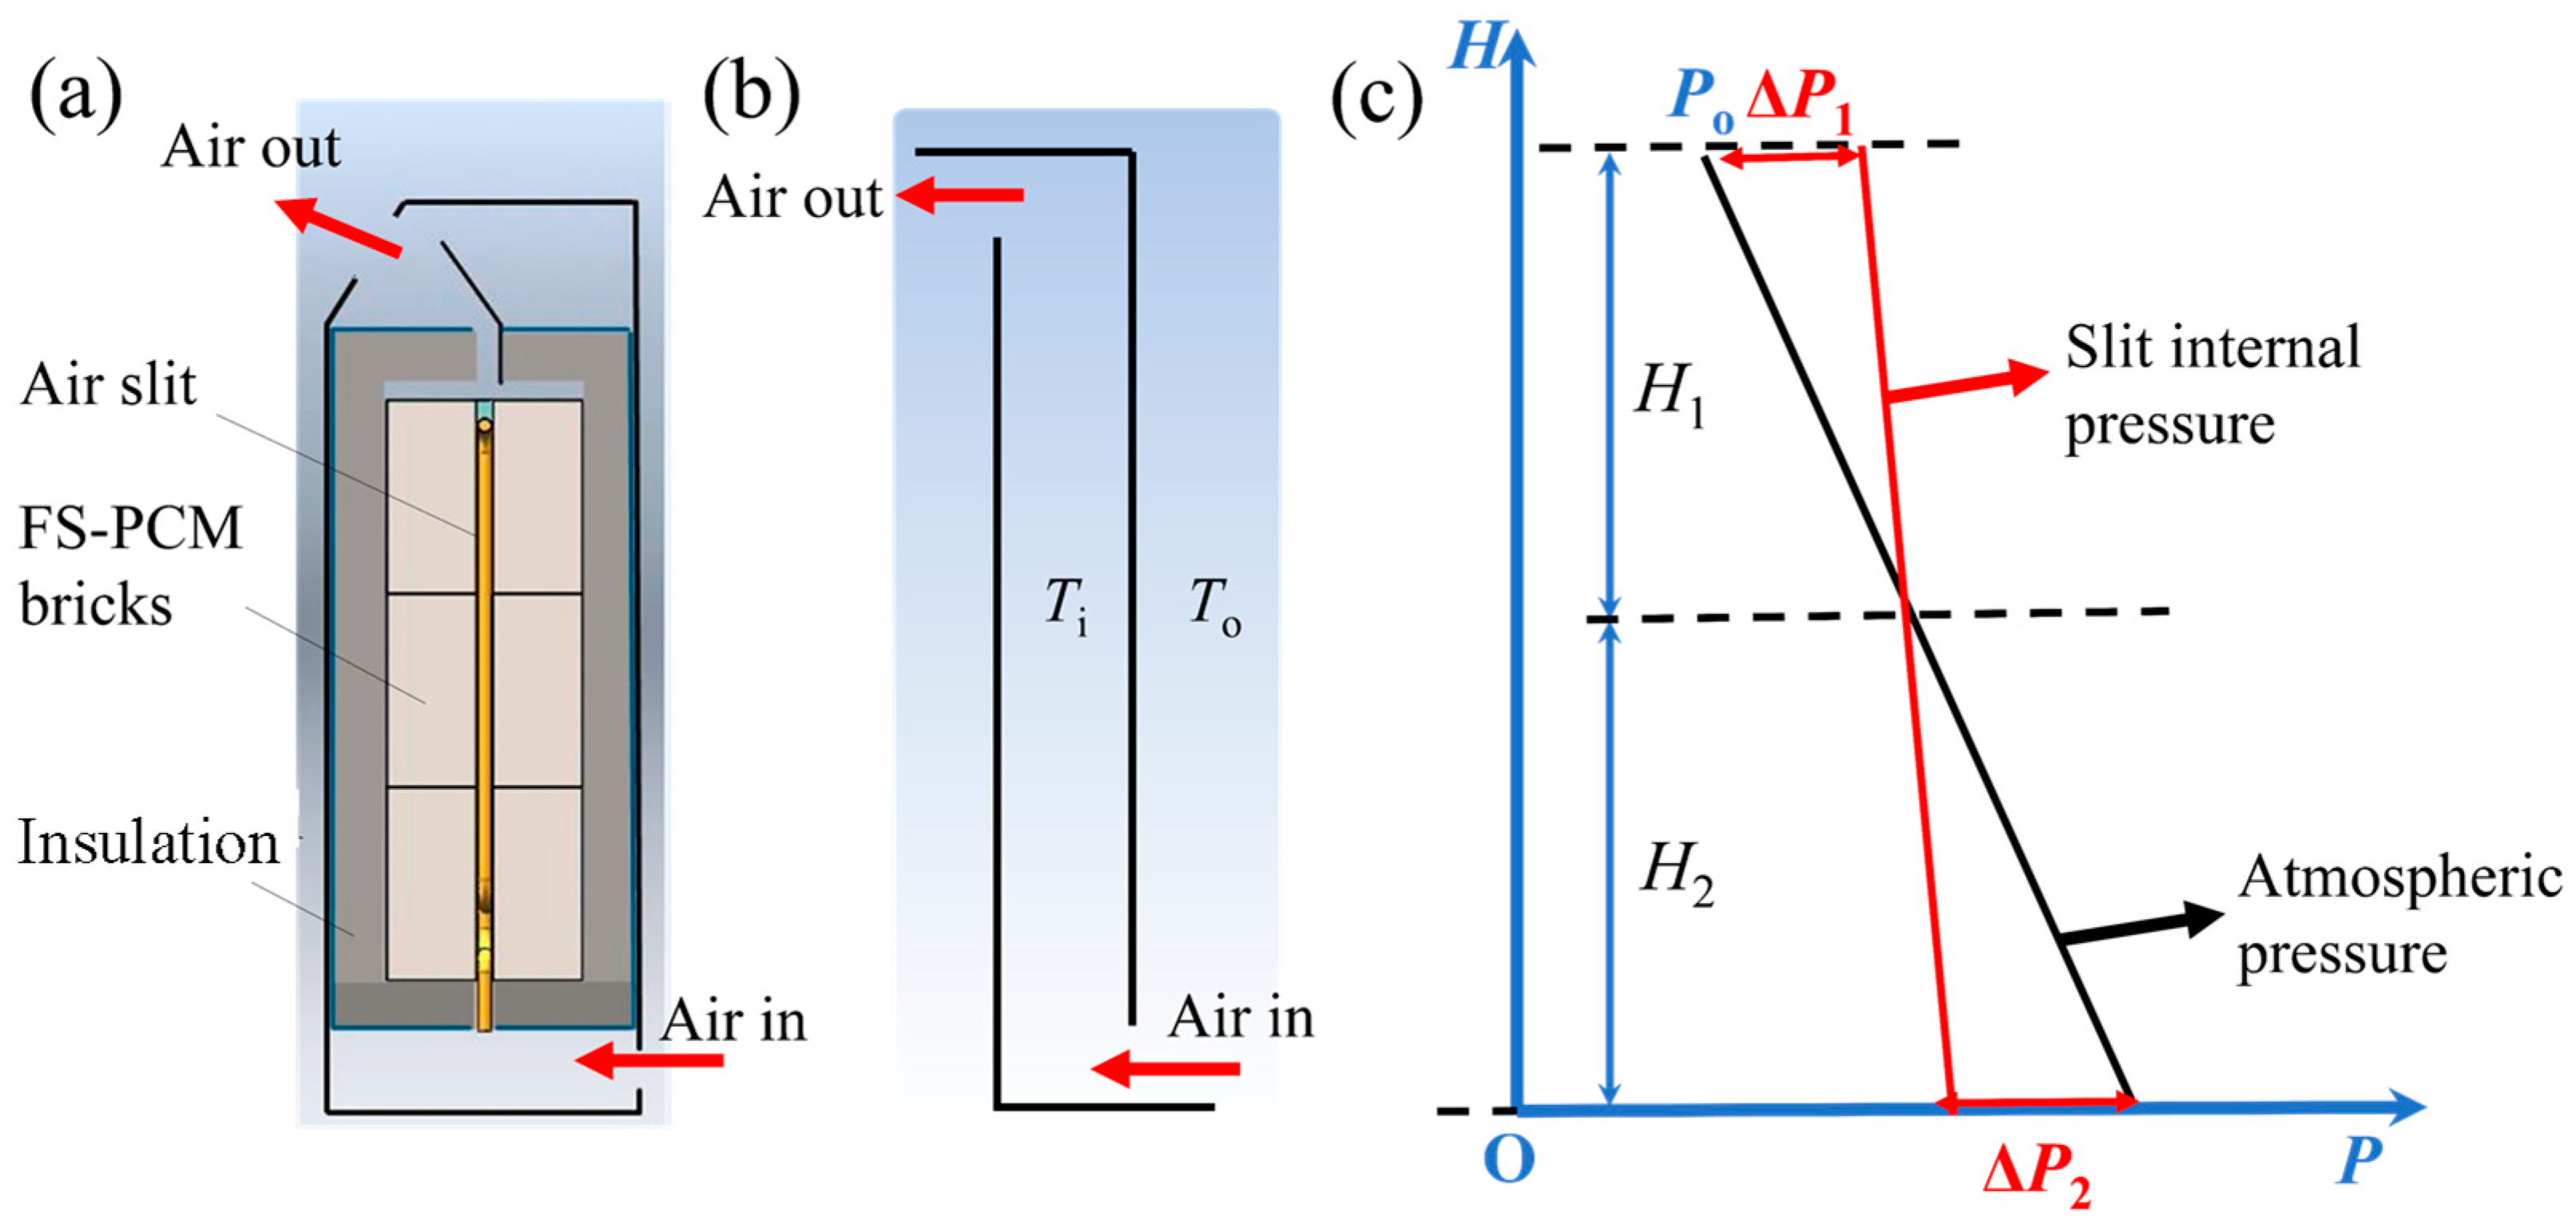
2.4.2. Calculation of the Air Mass Flow

When the air damper is open, the accumulated heat power of air Qair in the ETSD can be determined by calculating the mass flow of the air through the air door. The actual airflow path of the ETSD is shown in Figure 2a. The air flows from the bottom of the ETSD to the neutral surface in the air channel, and then from the top outlet to the external environment. The pressure loss in this entire process primarily occurs within the air channel.
When the specific gravity of the atmosphere is denoted as γ, the atmospheric pressure at the bottom can be expressed as P0 + Hγ, where P0 is the pressure, and H is the height change, as shown in Figure 2c. The natural convection of the air in the slit is considered to be quasi-steady-state flow, and the Bernoulli equation is established at the bottom of the slit as follows:
p o + γ v o 2 2 g = p i + γ v i 2 2 g
Given that the atmospheric velocity was assumed to be zero (v0 = 0), and the airflow produces a contraction flow, the mass flow rate of air can be represented by the variable f.
v 2 = f γ α A
The air inlet flow rate of the slit f2 is obtained as follows:
f 2 = α 2 A 2 2 g γ 2 Δ p 2
Similarly, the outlet flow at the top f1 can be obtained as follows:
f 1 = α 1 A 1 2 g γ 1 Δ p 1
Considering the conservation of mass, there are the following relationships:
f 1 = α 1 A 1 2 g γ 1 Δ p 1 = α 2 A 2 2 g γ 2 Δ p 2
Δ P 1 = H 1 γ 1 γ 2
Δ P 2 = H 2 γ 1 γ 2
H 2 H 1 = α 1 A 1 2 γ 1 α 2 A 2 2 γ 2
Under the condition of one atmospheric pressure, the expression of the specific gravity of air with temperature is as follows:
H 2 H 1 = α 1 A 1 2 α 2 A 2 2 273 + T 2 273 + T 1
where T1 is the air temperature in the room, and T2 is the characteristic temperature of the air in the slit. Once T1 and T2 were tested, H2 and H1 could be obtained, and ΔP1 could be calculated according to Equation (8), and then substituted into Equation (6) to obtain the mass flow rate. T2 was simplified to be the average value of the inlet and outlet temperature.
Q air = f q a i r

2.5. Simulation Method

Monitoring the temperature distribution throughout the phase-change bricks helps us understand the heat distribution of synthesized phase-change materials in practical applications, and allows us to take corresponding measures to alleviate thermal stress, enhance heat transfer, and extend a material’s stability. In experiments, the temperature distribution is often limited to the surface temperature, due to the constraints of thermocouple placement, thus making it challenging to obtain internal temperatures of heating elements or corners of the bricks.
The internal temperature distribution of the ETSD was simulated using a melting-solidification model using simulation software (ANSYS Fluent). The physical model, control equations, boundary conditions, and model verification were established in our previous research [4]. Based on our previous model, the power of the heating element was increased from 8 kW to 16 kW in this study, and the internal temperature distributions of the phase-change brick and heating element were simulated and calculated. The equivalent heat capacity method was used to treat the latent heat during the phase change of the brick. The heat capacity of the brick can be expressed as follows:
c p ( T ) = c ps T m Δ T h l 2 Δ T + c ps T m Δ T < T m < T m + Δ T c ps T > T m + Δ T
where ∆T is 3 K in the present study.

3. Results and Discussion

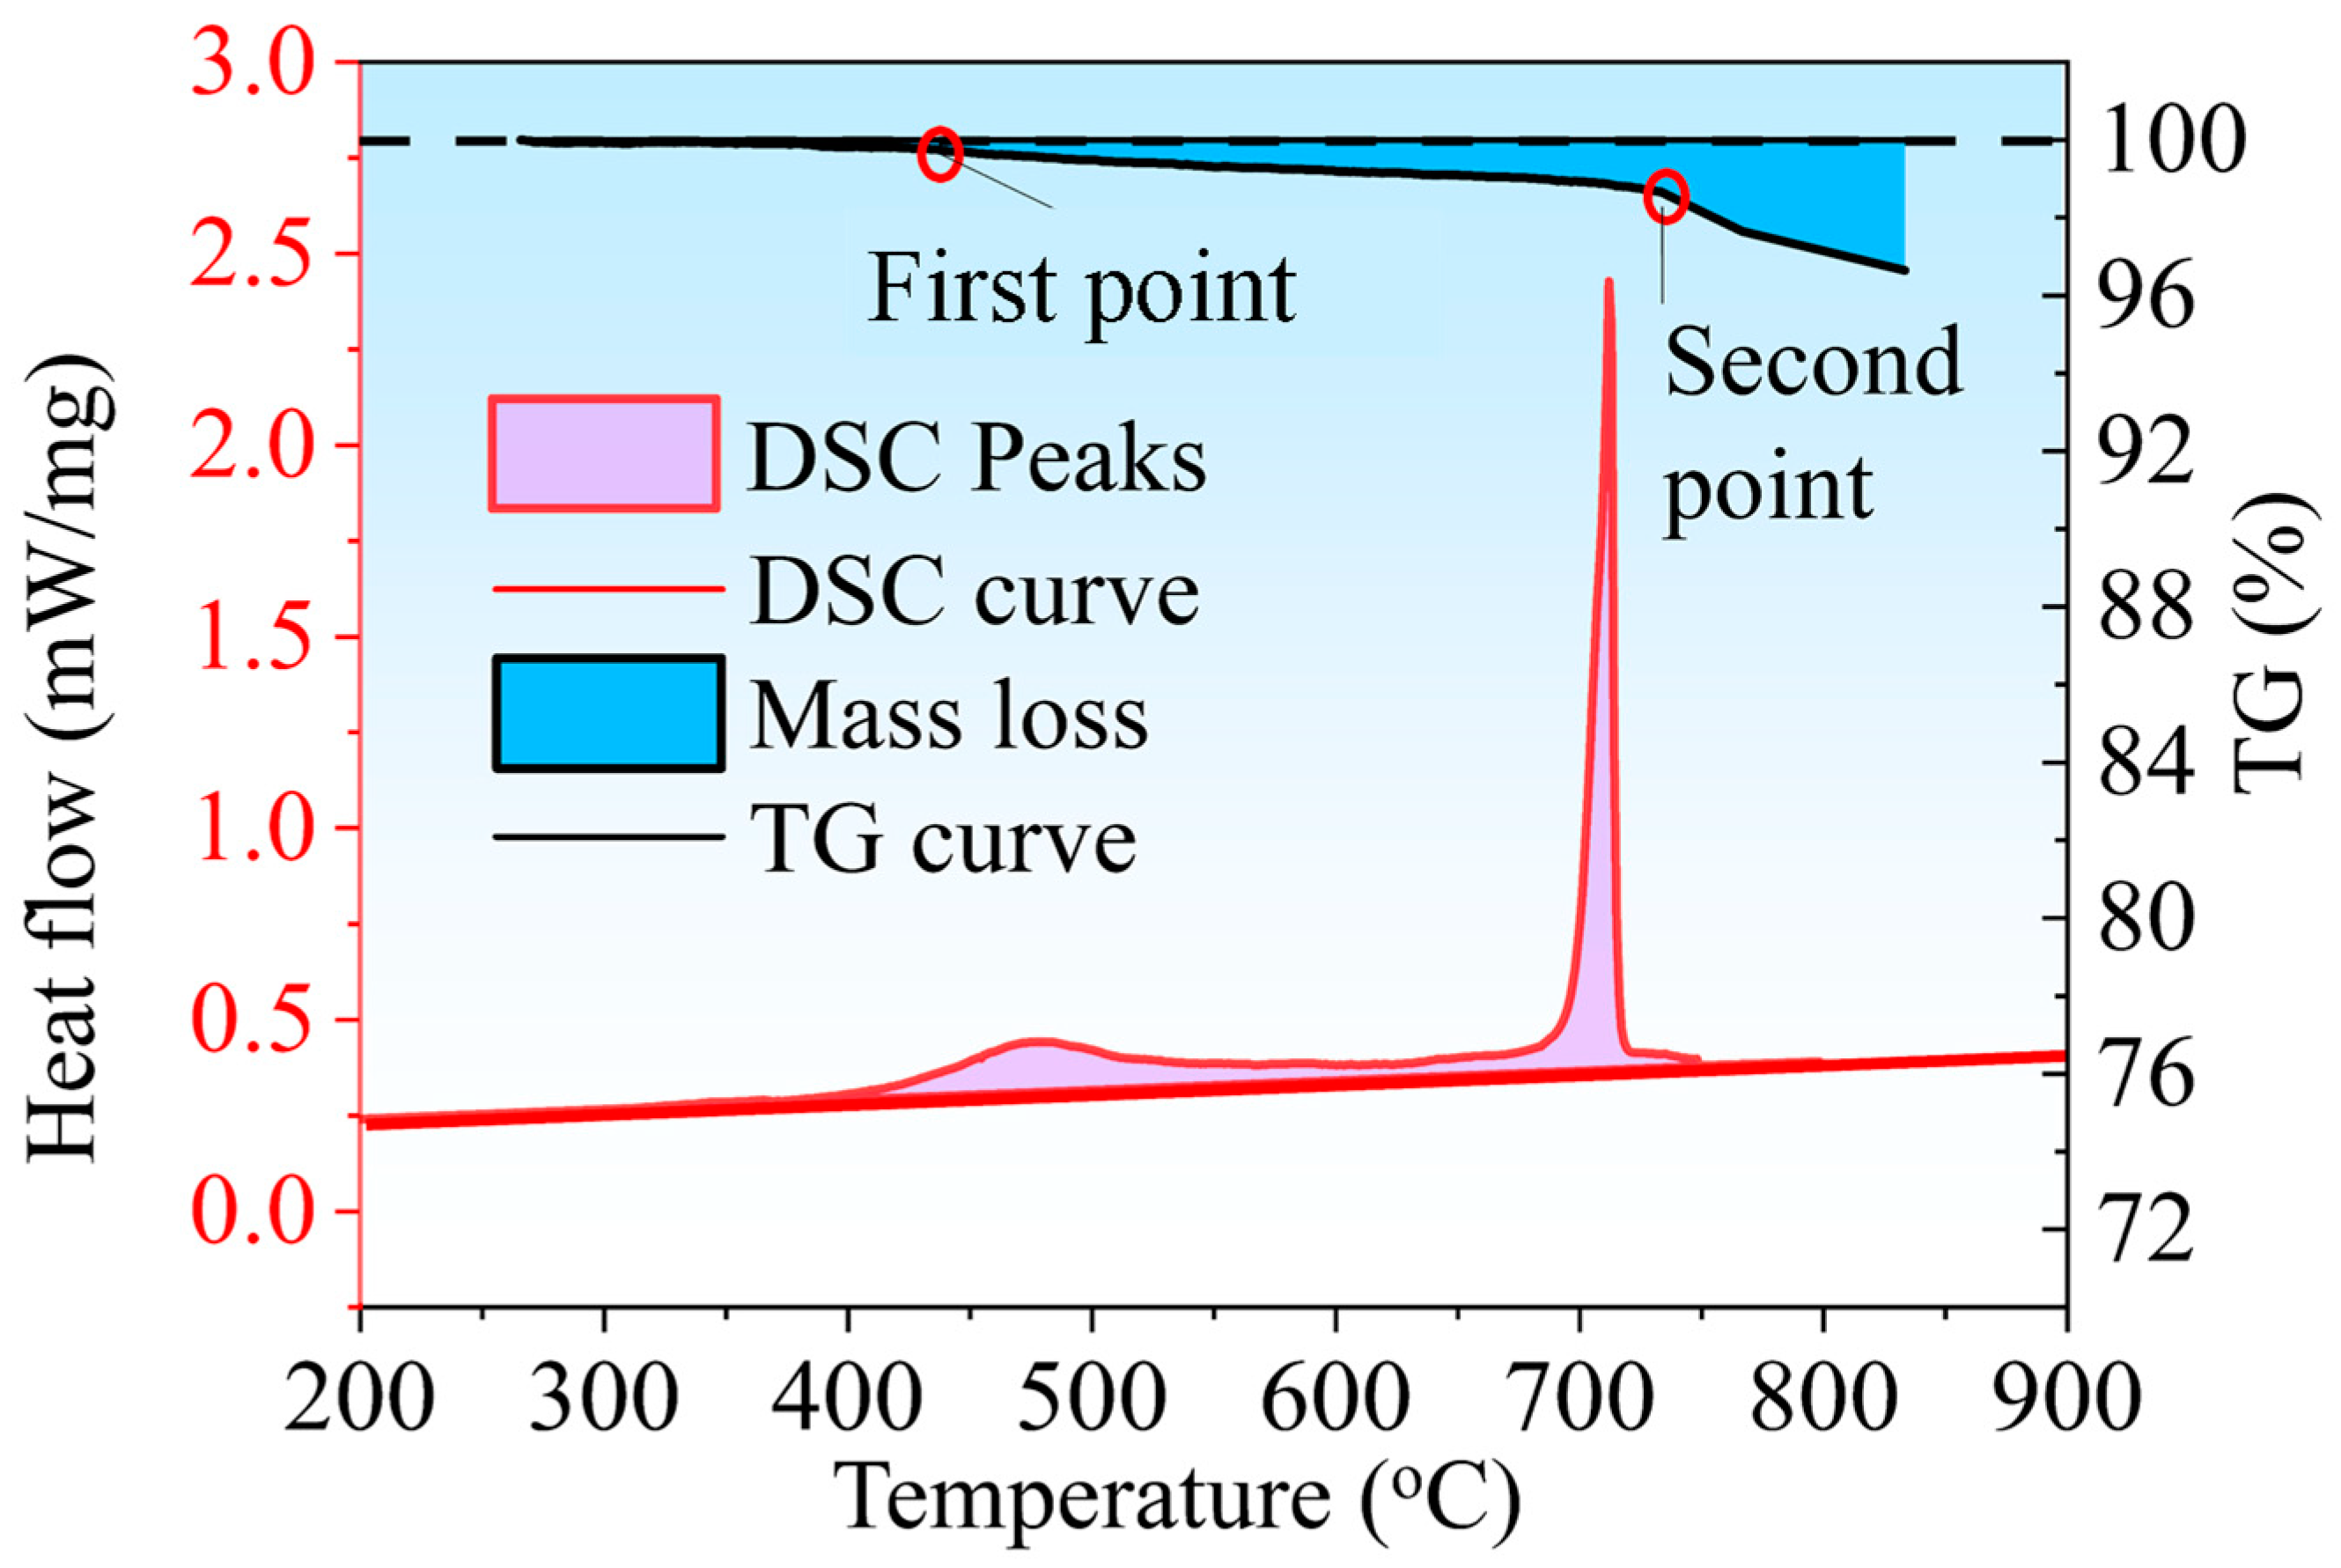
3.1. Thermal Properties of the Form–Stable Phase–Change Bricks

The FS–PCM brick was cut with minimal debris, and placed into a DSC crucible. As shown in Figure 3, the DSC curve revealed that the phase-change temperature was 710 °C, and the latent heat of the composite PCM material was 105.5 kJ/kg, which is consistent with the reported value [19]. There was a small peak at 450–520 °C before the main peak, which is a characteristic of divalent carbonates. During the heating process, the TG curve had two turning points. The first one decreased from 100% to around 98.5%. This indicated that there was a slight loss in weight of the material, likely due to the release of absorbed water or residual organic components in the carbonate/ceramic PCM. The second turning point of the FS–PCM bricks occurred at 750 °C, with a notable decrease from 98.5% to approximately 96.6%. This decrease is attributed to the onset of overheating conditions, which were not conducive to the maintenance of the desired properties of the samples.
The other thermal properties of the FS–PCM brick are listed in Table 2. The density of the brick was calculated by measuring the mass and the volume of the stacked brick body. The testing solid-state heat capacity was determined to be 1.24 kJ/(kg·K), and the liquid-state heat capacity was 1.62 kJ/(kg·K). These results suggest that this composite PCM had a relatively high heat capacity in its solid state, meaning that it could store more heat energy as it transitioned from solid to liquid during the phase change process.

3.2. Temperature Distributions of the FS–PCM Bricks in 2D and 3D

The heat storage rates were mainly influenced by the maximum temperature and the charge time of the FS–PCM in the ETSD, as Equation (5) shows. Studying the temperature uniformity of the FS–PCM helped to determine the areas that experienced strong thermal stress. To strengthen and improve the material and structural design, 2D temperature distribution testing and 3D simulations were conducted.
To obtain a temperature map, 16 temperature measuring points were established by inserting heat storage bricks to a depth of 57.5 mm. The distribution of the 12 temperature measurement points along the height direction (y) is shown in Figure 4. Four temperature measuring points in the x direction were set according to the research group’s previous simulations, and the heat concentration point was located at 273 mm in the y direction. These temperature measurement points were carefully chosen to cover the overheating areas, as this helped to monitor the temperature changes.

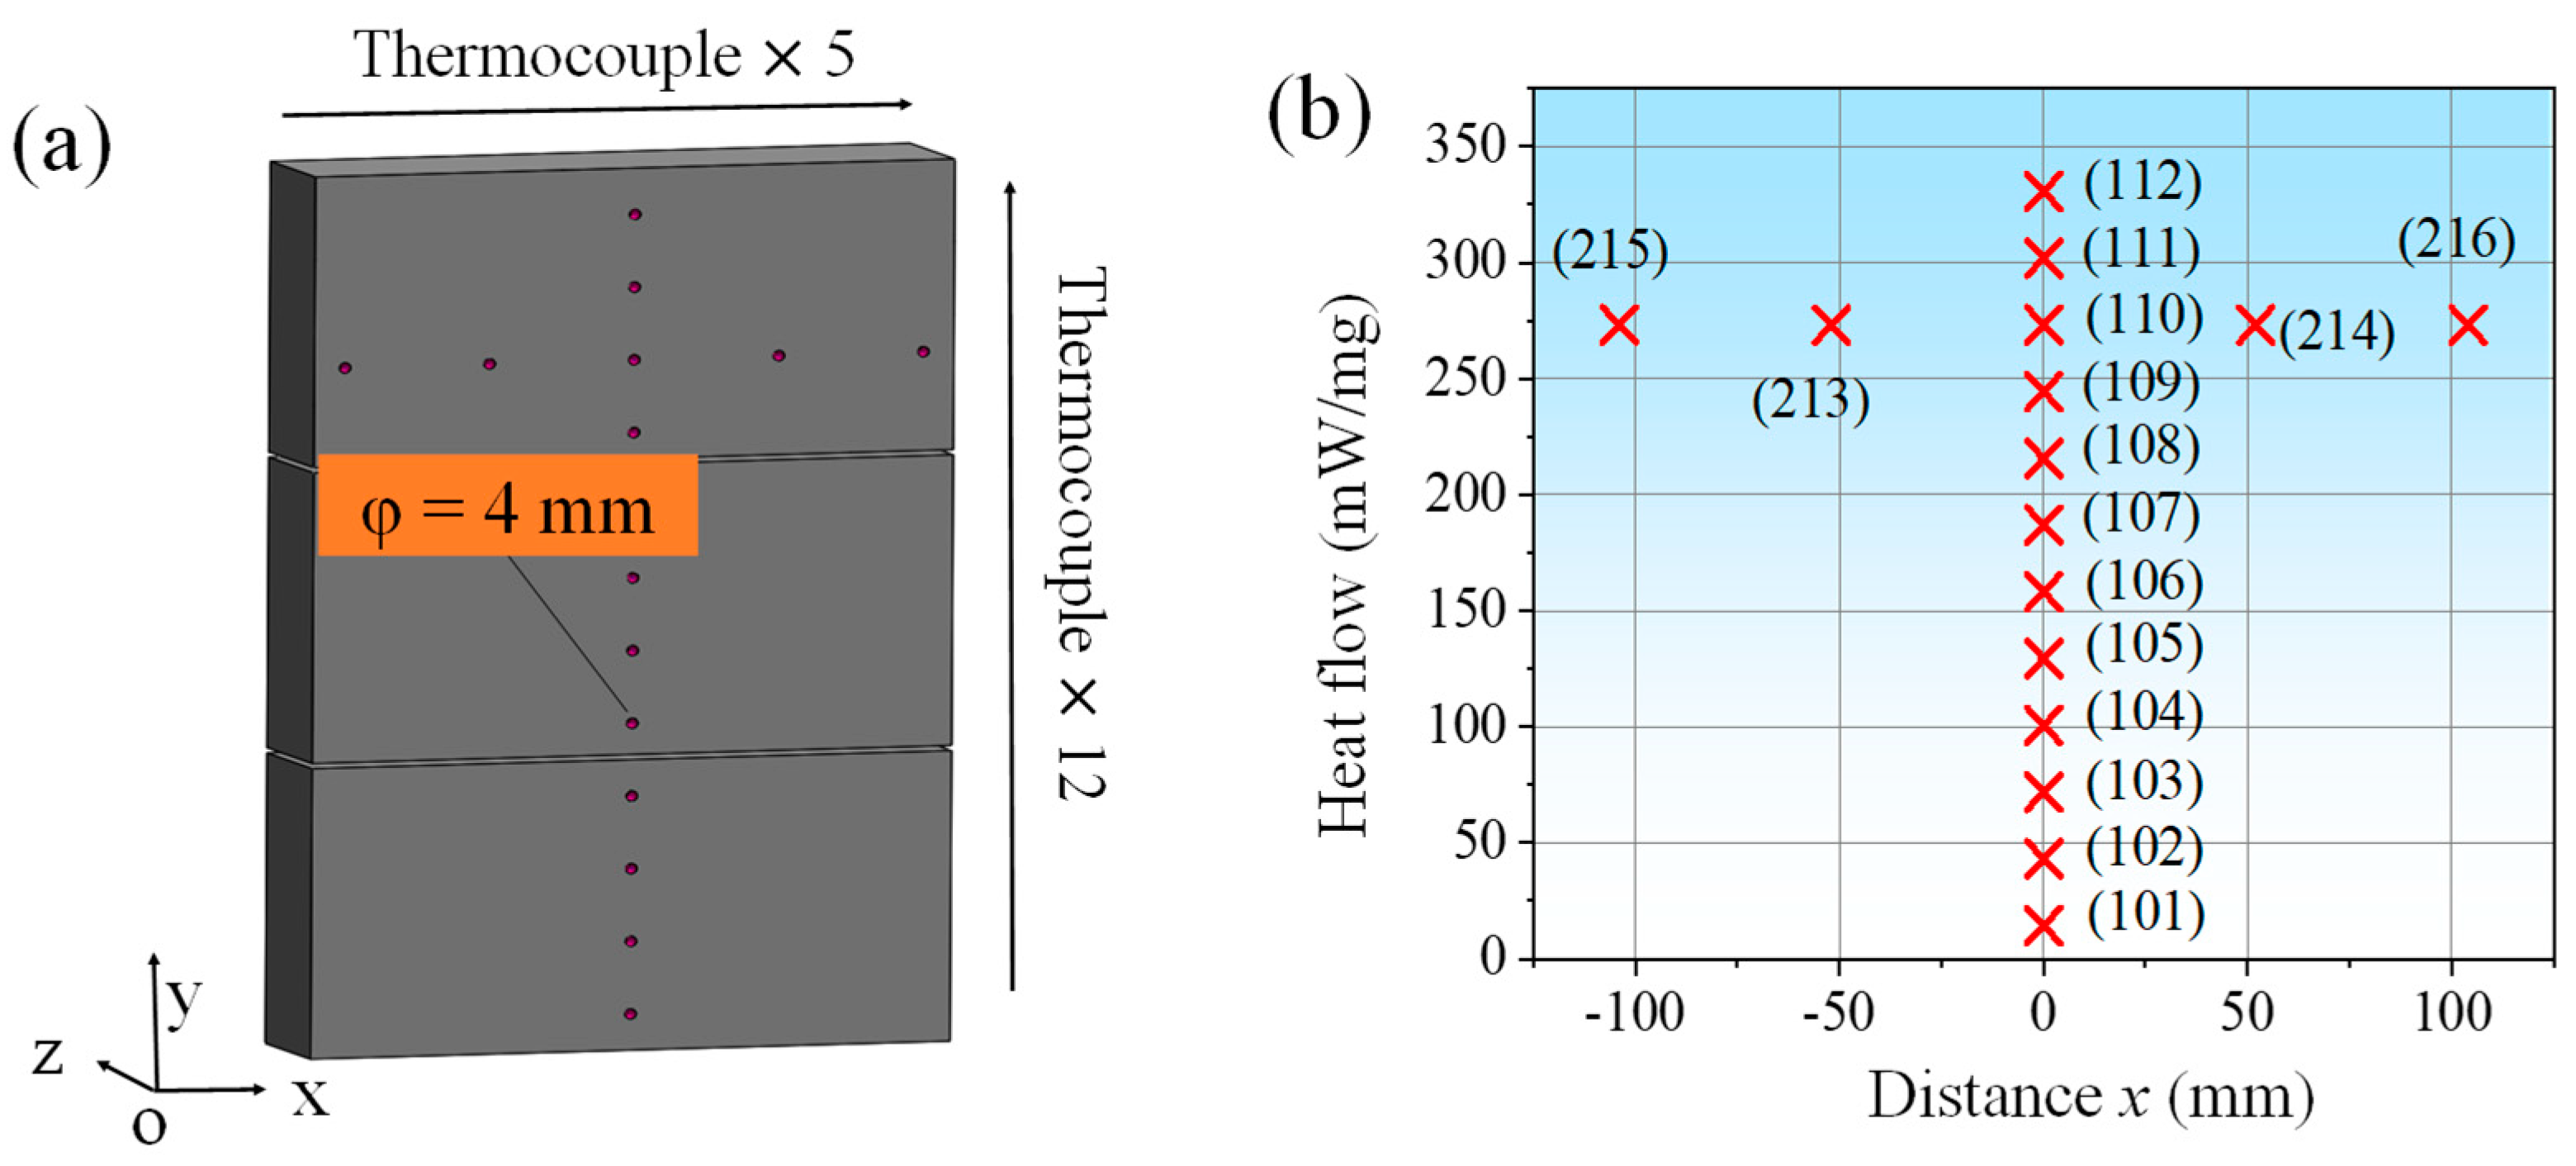
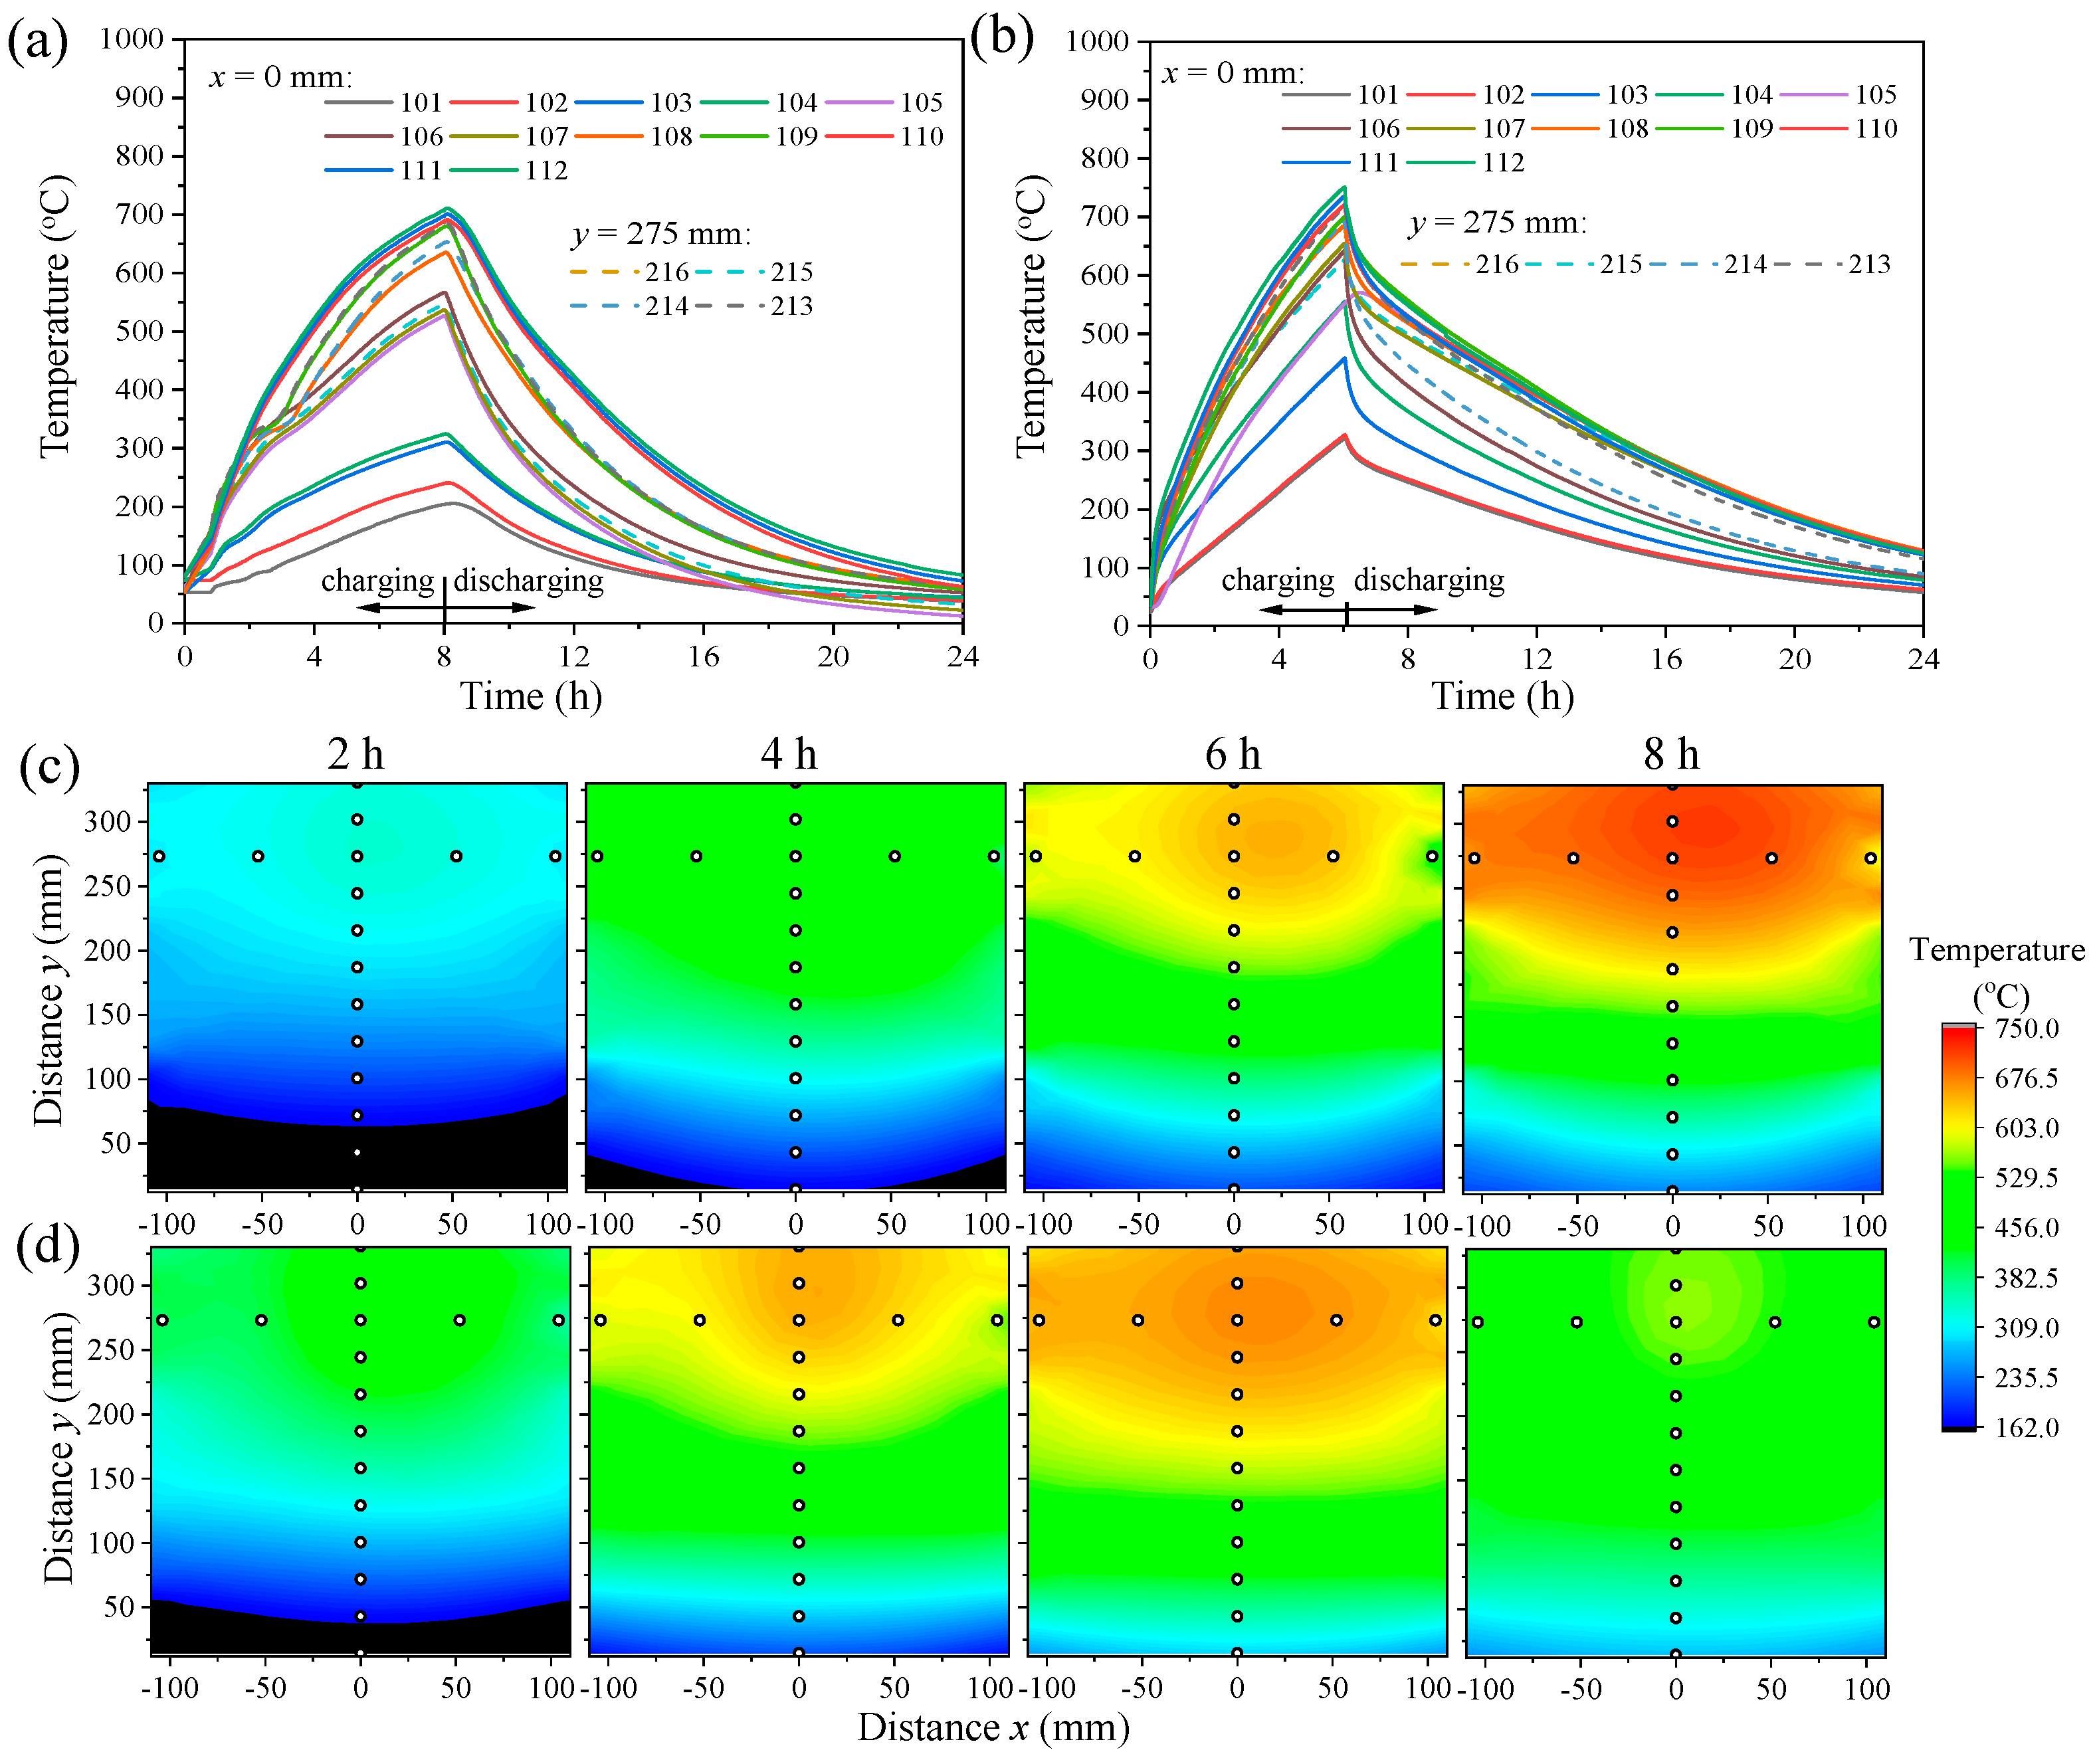
3.2.1. Experiments of Temperature Distribution in FS–PCM Bricks in Two Dimensions, with and without Steel Plates

Figure 5a shows the temperature curve of the original electric heater during operation, and it was observed that the temperature reached its peak after 8 h. The difference between the lowest and highest temperatures was 560 °C. Figure 5b shows the electric heater’s operating temperature curve after adding two steel plates. It was found that the heating process was completed in 6.1 h, which resulted in an acceleration of the heating rate by 23.75%. Moreover, the maximum temperature difference between the highest and lowest temperatures after adding the steel plates was 430 °C, which was 23.2% lower than the design without steel plates.
To further illustrate the impact of steel plates, cloud images of the charging points (2, 4, 6, and 8 h) were generated and presented in Figure 5c, d. It was observed that the heat was mainly concentrated in the upper-middle part of the phase-change brick, where natural convection within the ETSD channel caused the air to heat up to the highest temperature. Since the upper part of the air is in contact with the environment, heat exchange occurs between the atmosphere and the surroundings.
The addition of steel plates promoted a more even temperature distribution, as is intuitively evident. Overall, the temperature of the phase-change brick was elevated, particularly in the upper part, as evidenced by comparing the temperature cloud images in the y direction. In the x direction, the temperature was observed to be completely uniform after adding the steel plates. In contrast, the phase-change brick without steel plates exhibited heat accumulation in its middle section.
These findings suggest that adding steel sheets can effectively enhance the temperature uniformity of heat storage bricks in electric heaters, reducing the maximum temperature difference and ensuring a more even temperature distribution.

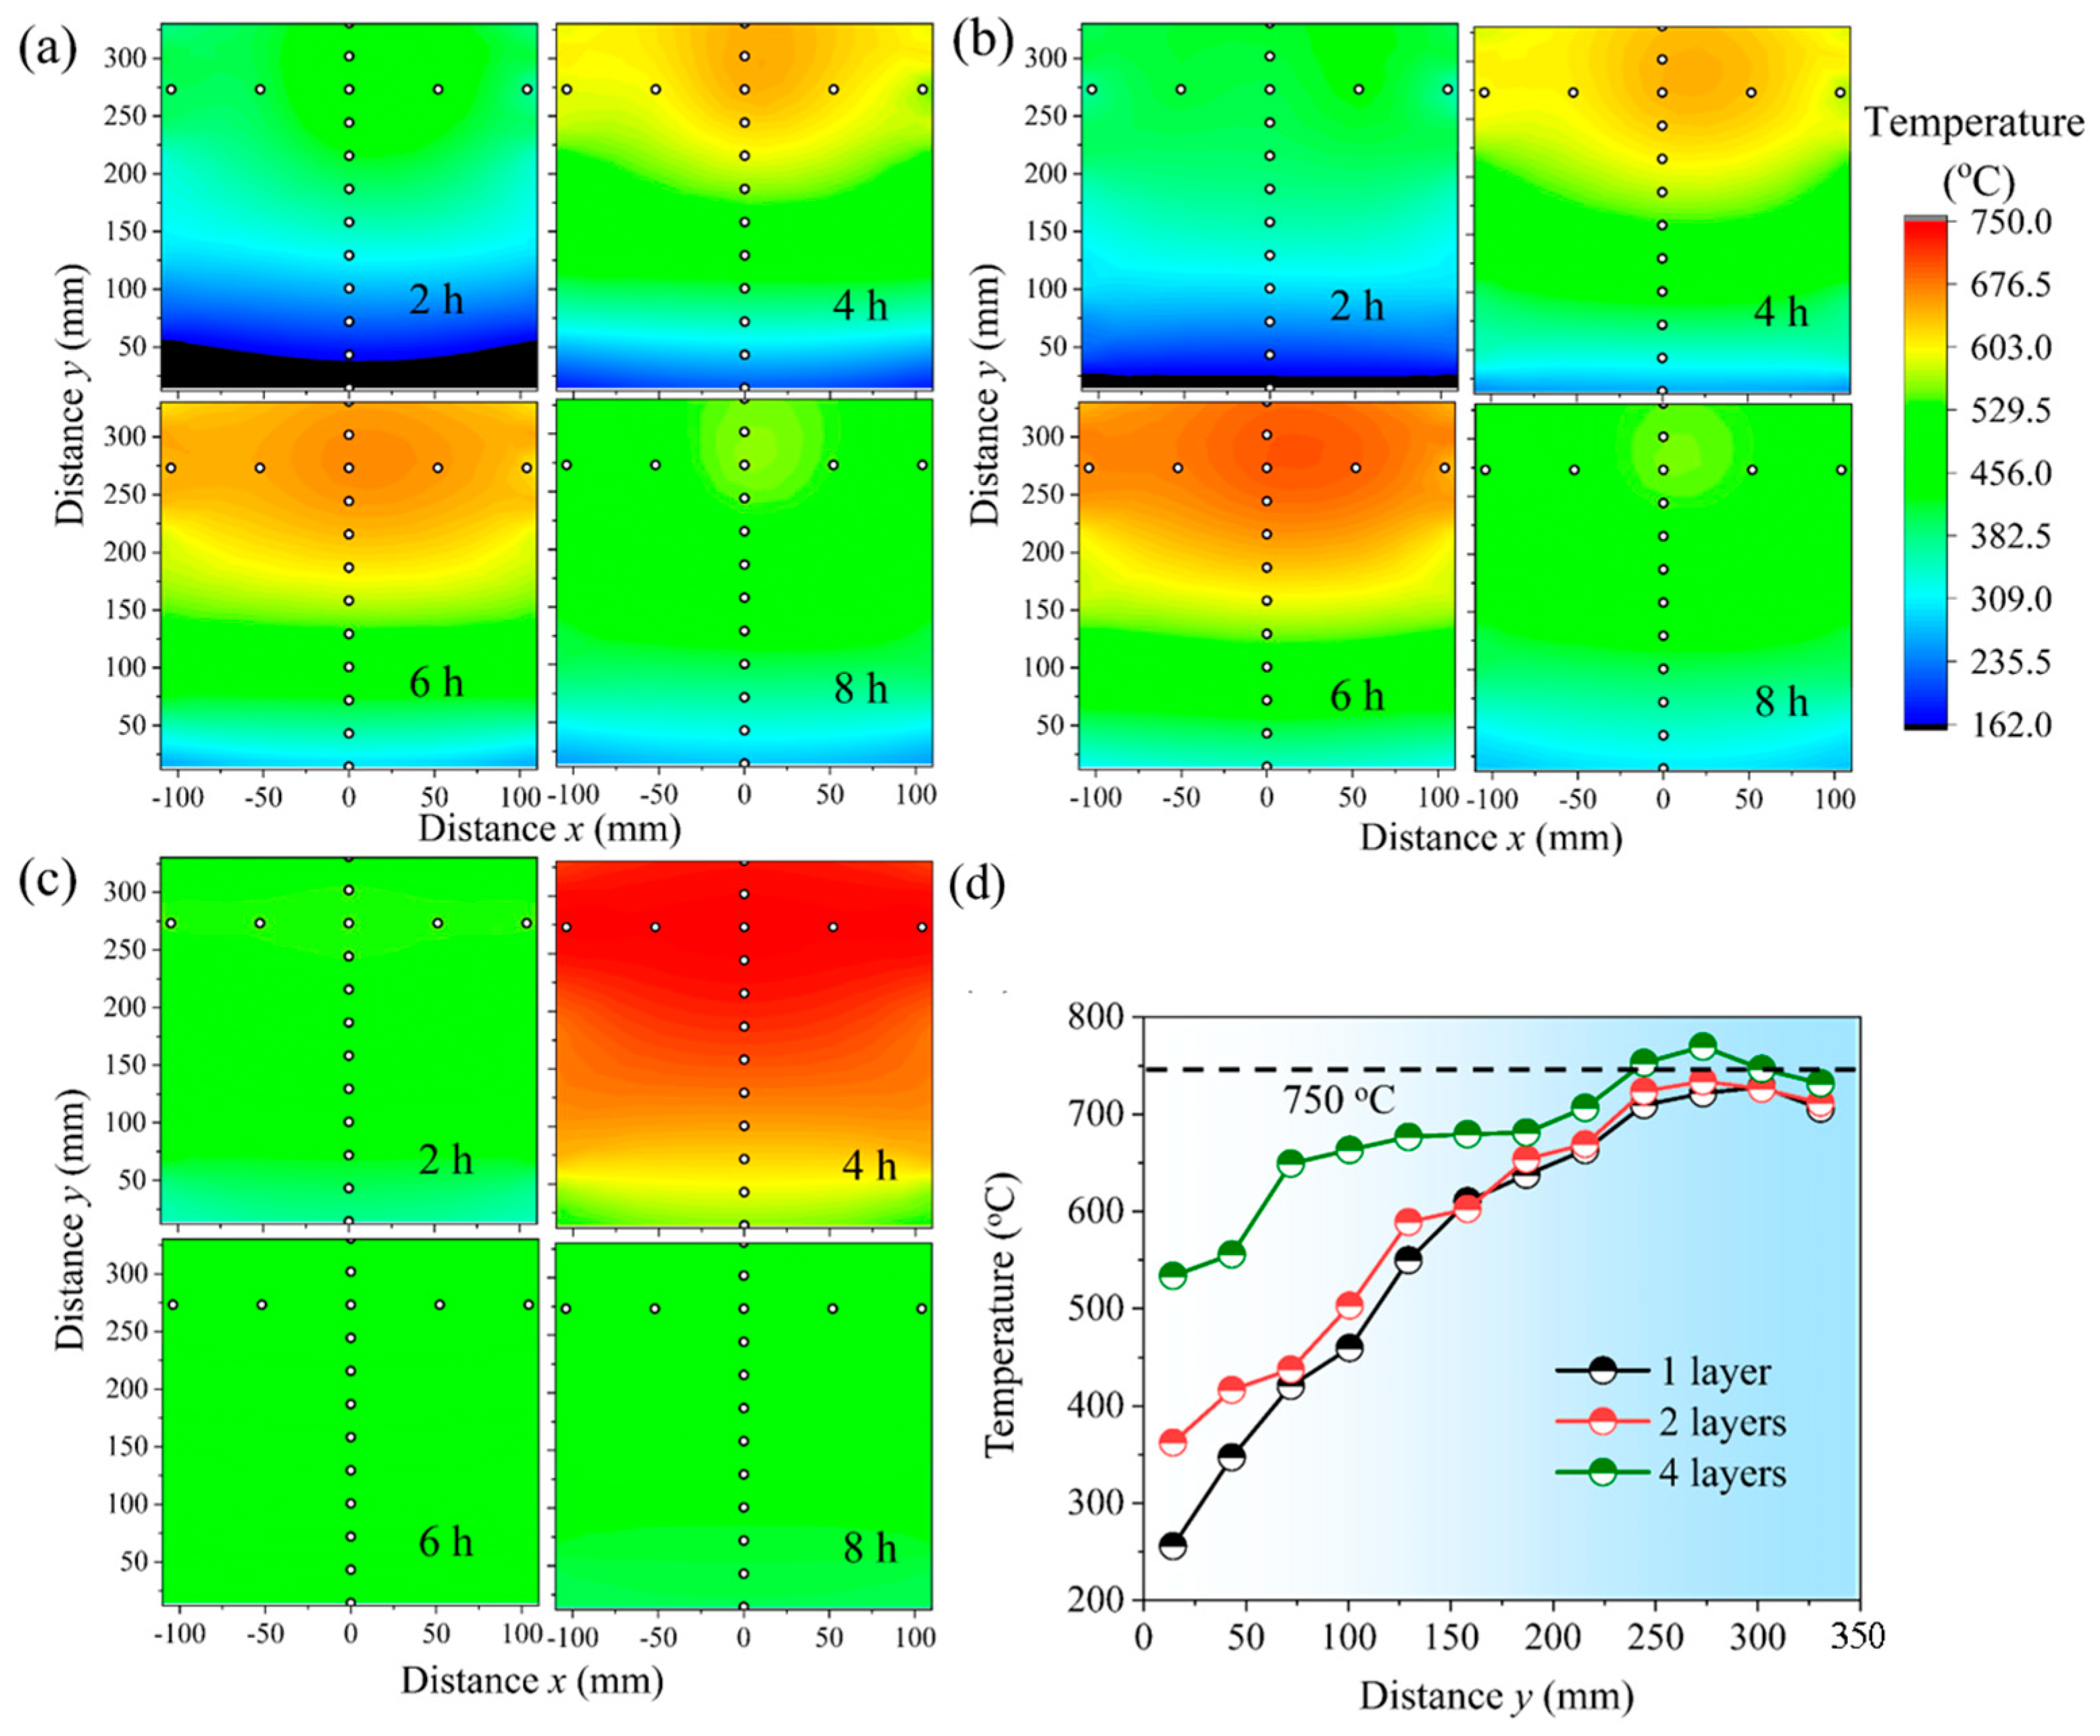
3.2.2. Experiments of Temperature Distribution with Different Insulation Layers

Based on the results in Figure 5, two steel plates were inserted at each outer side of the FS–PCM brick to increase the heat transfer rate. The thickness of the insulation layer can also affect the charging rate of the electric heater. From a heat transfer perspective, the insulation material can be selected based on the critical thermal insulation diameter dcr. Therefore, the following equation was used for a rough estimate:
d cr = 2 λ h 0
where λ is the thermal conductivity of the phase-change brick (as shown in Table 2), which was 1.3 W/m·K, h0 is the composite heat transfer coefficient outside of the phase-change brick, estimated to be 46 W/m2·K by Equation (3). The calculated critical thermal insulation diameter dcr was 56 mm. As the equivalent diameter of the stacked phase-change bricks was much larger than this value, increasing the thickness of the insulation layer can further reduce heat loss.
From the cloud images in Figure 6a–c, it can be visually observed that adding 4 layers of insulation can complete the charging process in about 4 h, while 1 and 2 layers take about 6 h. Comparing the highest temperature points at the end of charging, as shown in Figure 6d, it was found that although 4 layers of insulation significantly reduced the surface temperature difference of the heat storage bricks, the highest temperature point in the 230–300 mm height range was still higher than 750 °C. Therefore, in the subsequent research, the ETSD with 2-layer insulation was selected.

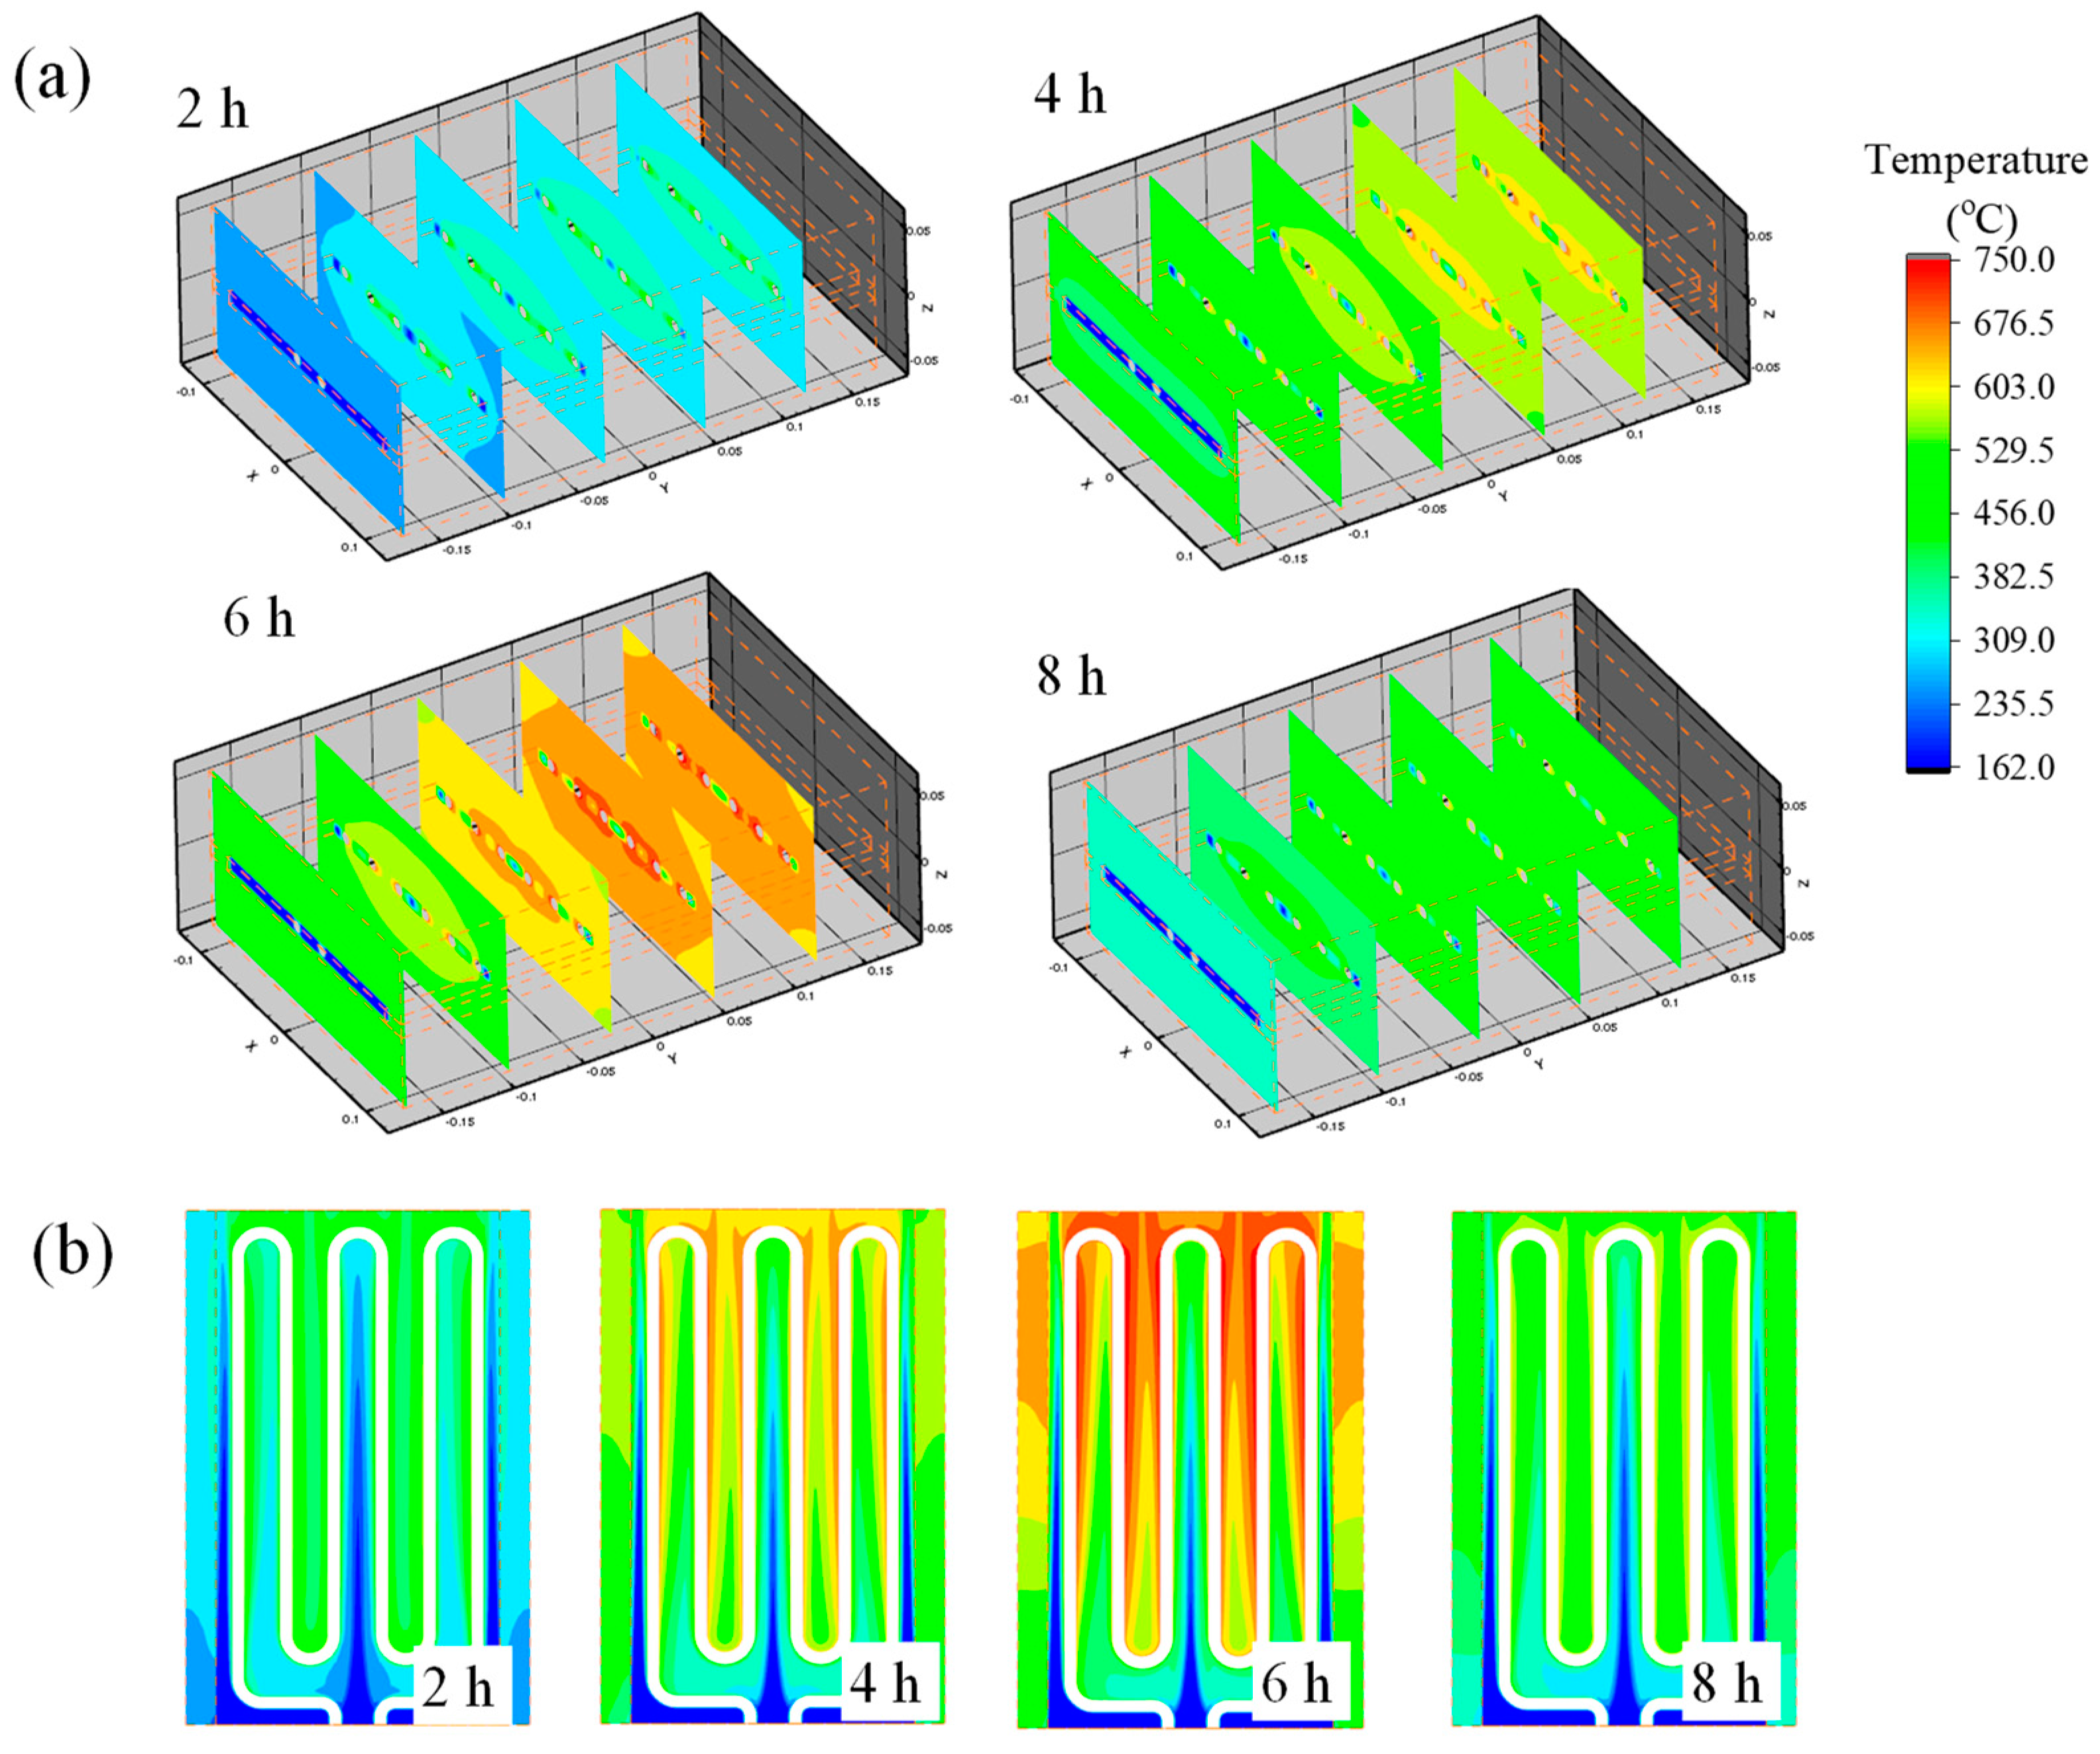
3.2.3. Simulated Temperature Distribution of FS–PCM Bricks with Steel Plates in Three Dimensions

Figure 7a illustrates the simulated 3D temperature contours of brick cross-sections with varying heights at 2, 4, 6, and 8 h. In Figure 7b, the middle cross-section of the flow channel is depicted at the same intervals. The results reveal that the electrical heating element exhibited the highest temperature, with the upper part of the device recording higher temperatures than the lower part during the charging process. As it was similarly shown in Figure 6, the highest temperature of the bricks was not at the outlet, owing to the limited irradiation of the heating element on the brick surface adjacent to the outlet. At t = 2 h, the mean temperatures of the heating element surface and the bricks were 295 °C and 201 °C, respectively. These temperatures escalated to 683 °C and 590 °C, respectively, at t = 8 h. Consequently, the temperature difference among the bricks became as large as 389 °C.

3.3. Energy Analysis

Figure 8a depicts the 1D energy transfer direction resulting from the temperature difference between the electric element (Te) and the room (T0). Correspondingly, Figure 8b shows the thermal resistance in the direction of temperature transfer, where the convective and radiative heat transfer behaviors of air in the channel to the steel plate are denoted as Rcov and Rrad, respectively. The other thermal resistances (Rsp, Rbrick, Ril, Rshell, Rair) are represented as conductive thermal resistance. The heat stored in the steel plate, phase-change brick, insulation layer, and shell were summed to qst. Figure 8c displays the variations in the electrical power (qe), heat flow transferred to air (qair), and stored heat rate (qst). During the charging process, qe remained constant at 1600 W. Due to enhanced natural convection, qair increased to 1010.2 W, while qst decreased to 528 W. This decrease is due to the reduced temperature difference between the heating element and bricks, leading to a reduction in the total radiation from the electrical heating element. During the initial 2.7 h of charging, qair was less than 800 W, indicating that radiation dominated the heat transfer from the heating element. After four hours, natural convection transferred more heat.
Figure 8d shows the accumulated energy transferred to the air, Qair, and stored by the bricks, Qbricks. Throughout the charging process, Qst, and Qair increased to 6.6 and 4.3 kWh, respectively. During the discharging process, Qst decreased from 6.6 to 1.1 kWh, indicating that 5.5 kWh of thermal energy was stored in the ETSD following this cycle. Moreover, the study determined that 40.4% of the total heating energy was transferred to space through natural convection in the flow channel during charging. The heat storage ratio was computed for 6 h, and Table 3 presents the typical results. For the presented ETSD, 53.4% of the overall heating energy was released into the surroundings, whereas 48.6% was stored in the medium during the six-hour charging process. The reported ETS device in reference [26] stored only 24.7% of the energy, while 75.3% was released into the environment.

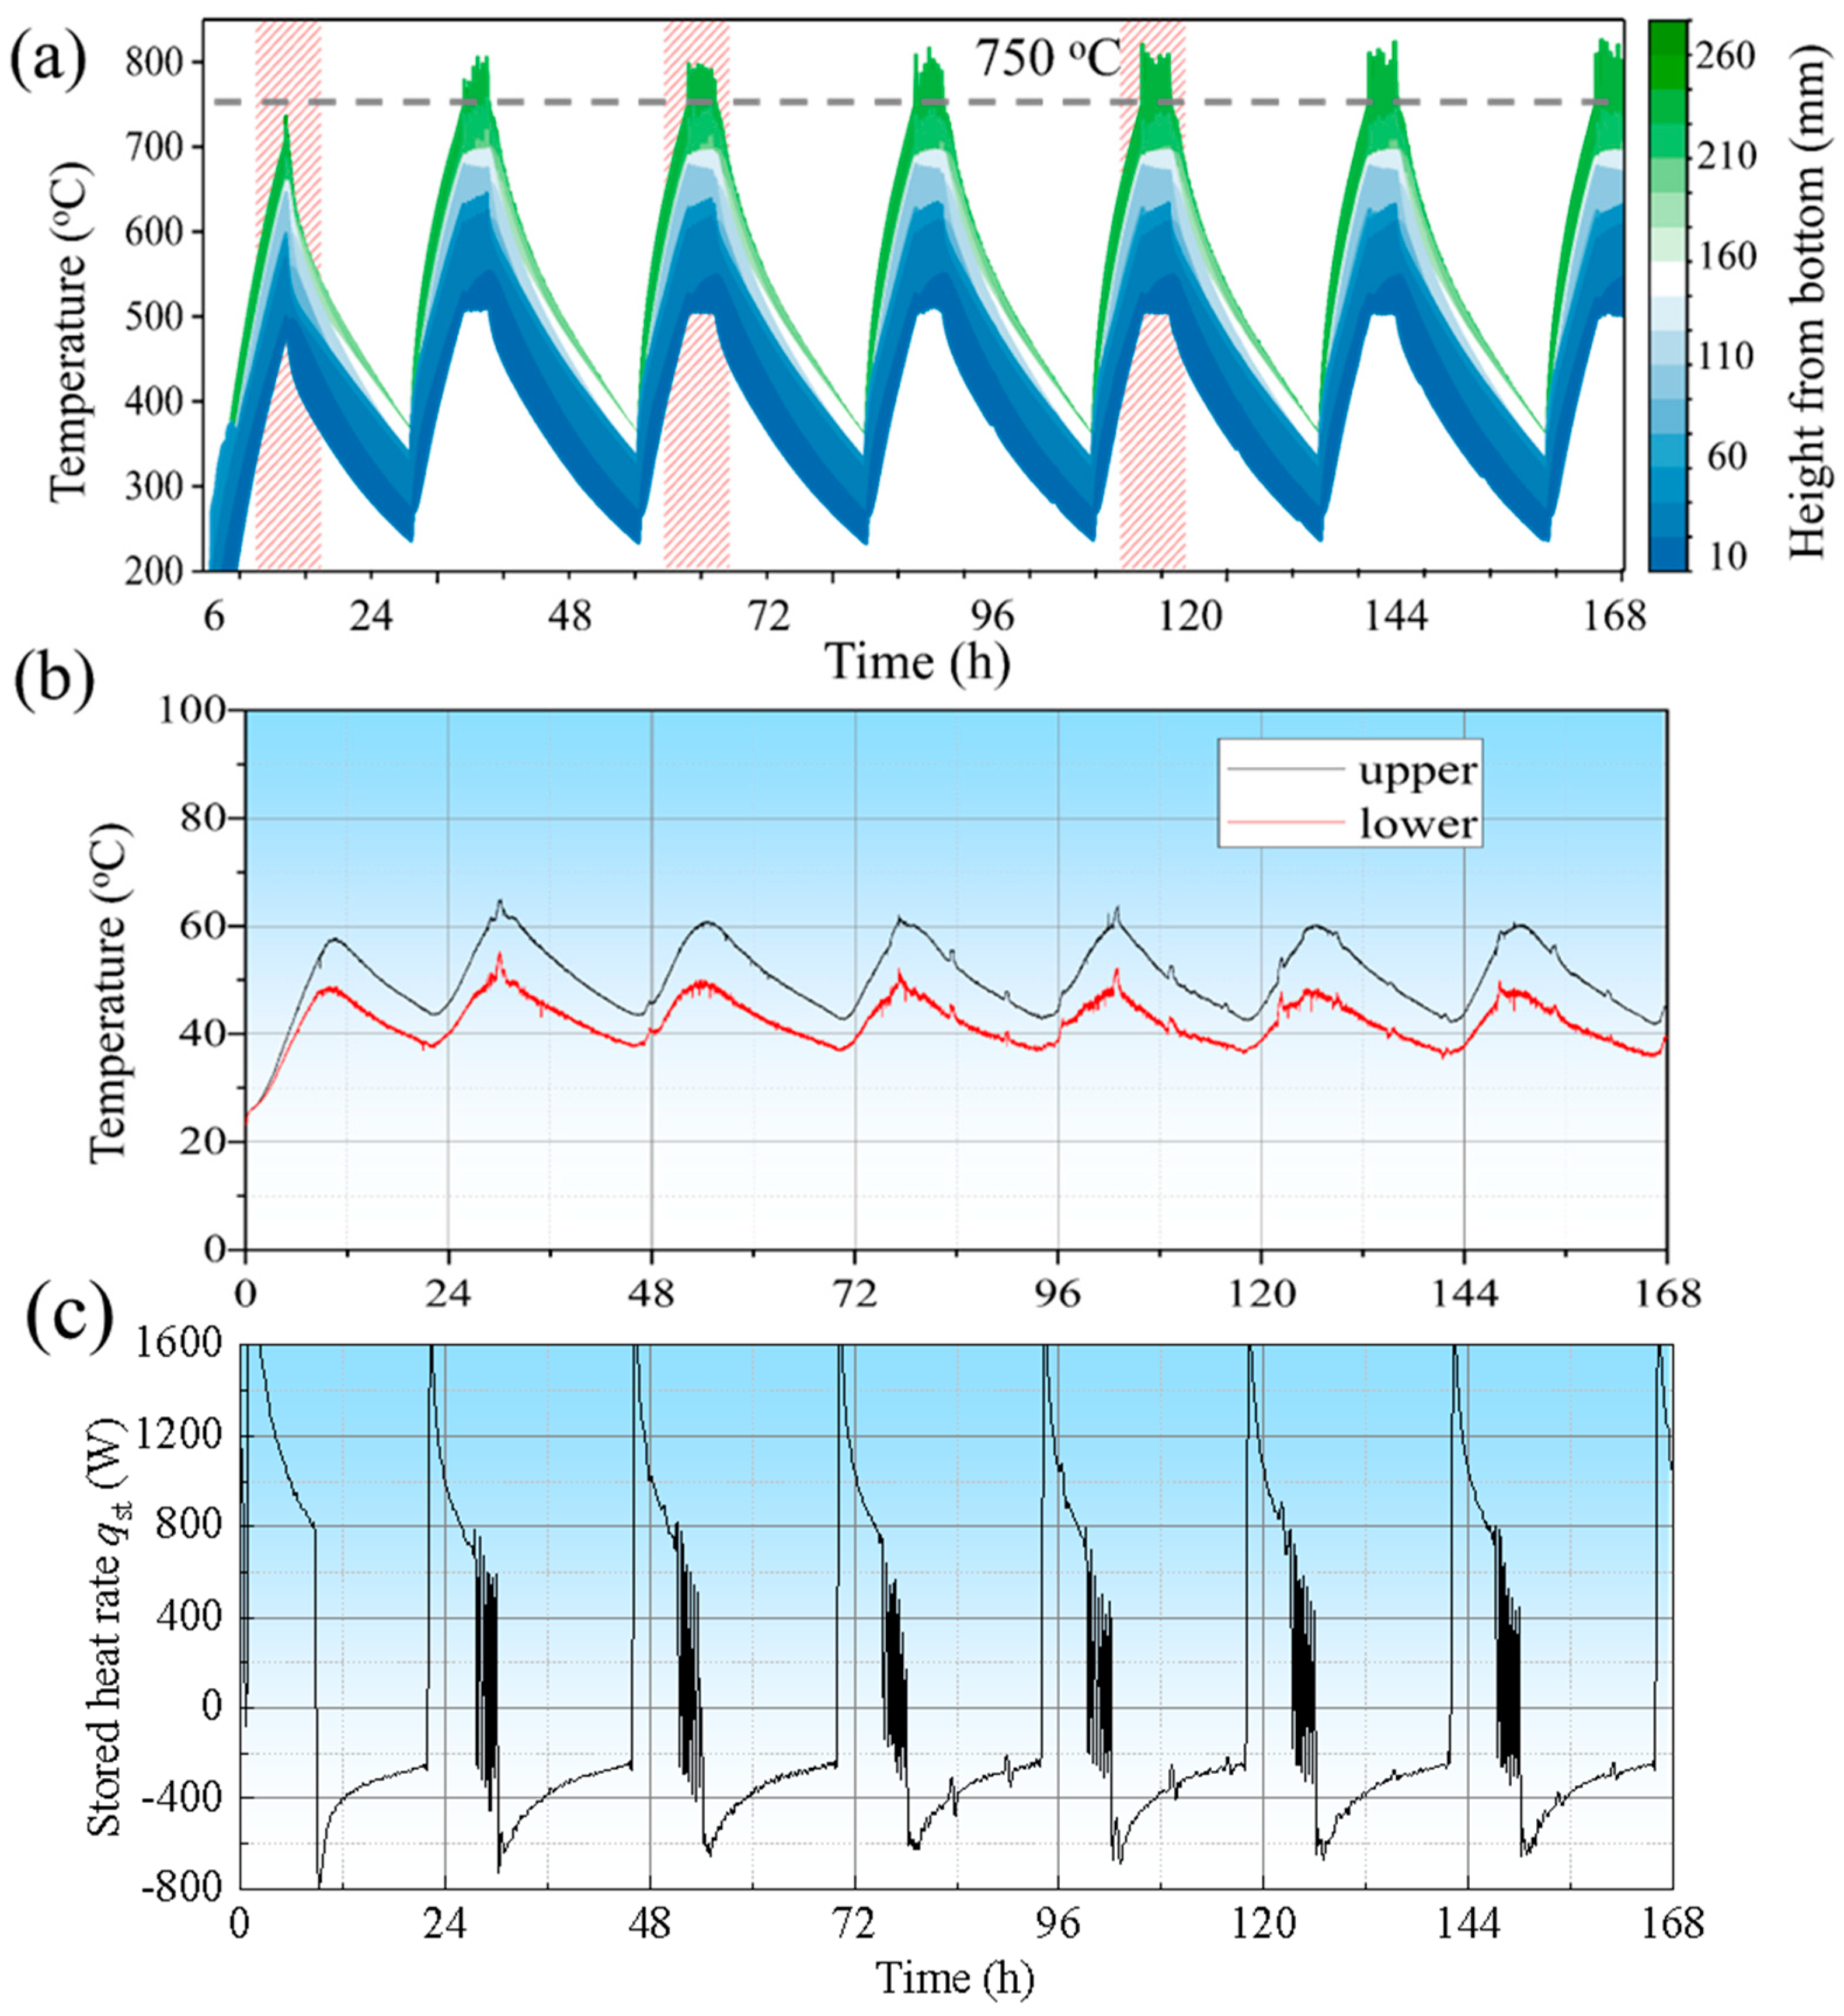
3.4. Cycle Testing of the Optimum Structured ETSD

During the actual operation of the electric heater, it is vital to maintain good cycle ability and stability. Figure 9 shows the temperature changes of the bricks and the upper and lower parts of the outer temperature of the shell, and the calculated qst during 7 cycles of one week. As shown in Figure 9b, the initial temperatures of the outer surfaces of the heat accumulator, except for the first cycle, were 19.5 and 25.2 °C. From the second cycle, the heat storage electric heater was in a repeatable cycle state. Each charging and discharging cycle time was 24 h, and the temperature difference between the upper and lower surfaces of each repeatable cycle was 10–15 °C, which did not cause much thermal stress to the shell. The thermal insulation material in the heat storage electric heater conveyed a significant heat insulation effect. It can be seen from Figure 9a that the middle part of the electric heater had the highest temperature (the highest plateau temperature reached 780 °C), followed by the upper part temperature (the highest plateau value reached 650 °C), while the lowest temperature observed at the bottom was lower than 300 °C.
The highest temperature of the heat storage bricks did not appear in the upper part of the electric heater, which is consistent with the results in Figure 6. Moreover, during the 7 cycles, the phase-change material in the middle had a constant temperature stage for a certain period, which showed the characteristic of latent heat storage. The lower and upper heat storage bricks were in the stage of sensible heat storage. Therefore, maximizing the use of the latent heat of the phase-change brick without overheating the central heat storage brick is still an urgent problem to be solved.
As shown in Figure 9c, the exothermic power qst remained consistent after the second cycle. qst did not fluctuate in the heating stage, but fluctuated strongly in the exothermic stage, which also explained the highest temperature seen in Figure 9a that caused the temperature fluctuation to exceed 750 °C. Therefore, maintaining the heat dissipation power’s stability can maintain the temperature’s stability. This could furthermore explain how the heating time could not exceed 6 h in the developed ETSD.

3.5. Application and Economic Analysis

The above-mentioned ETSD with two steel plates and two insulation layers was applied in a room of 15 m2, and an economic comparison between the developed ETSD and the traditional electric heater was carried out.

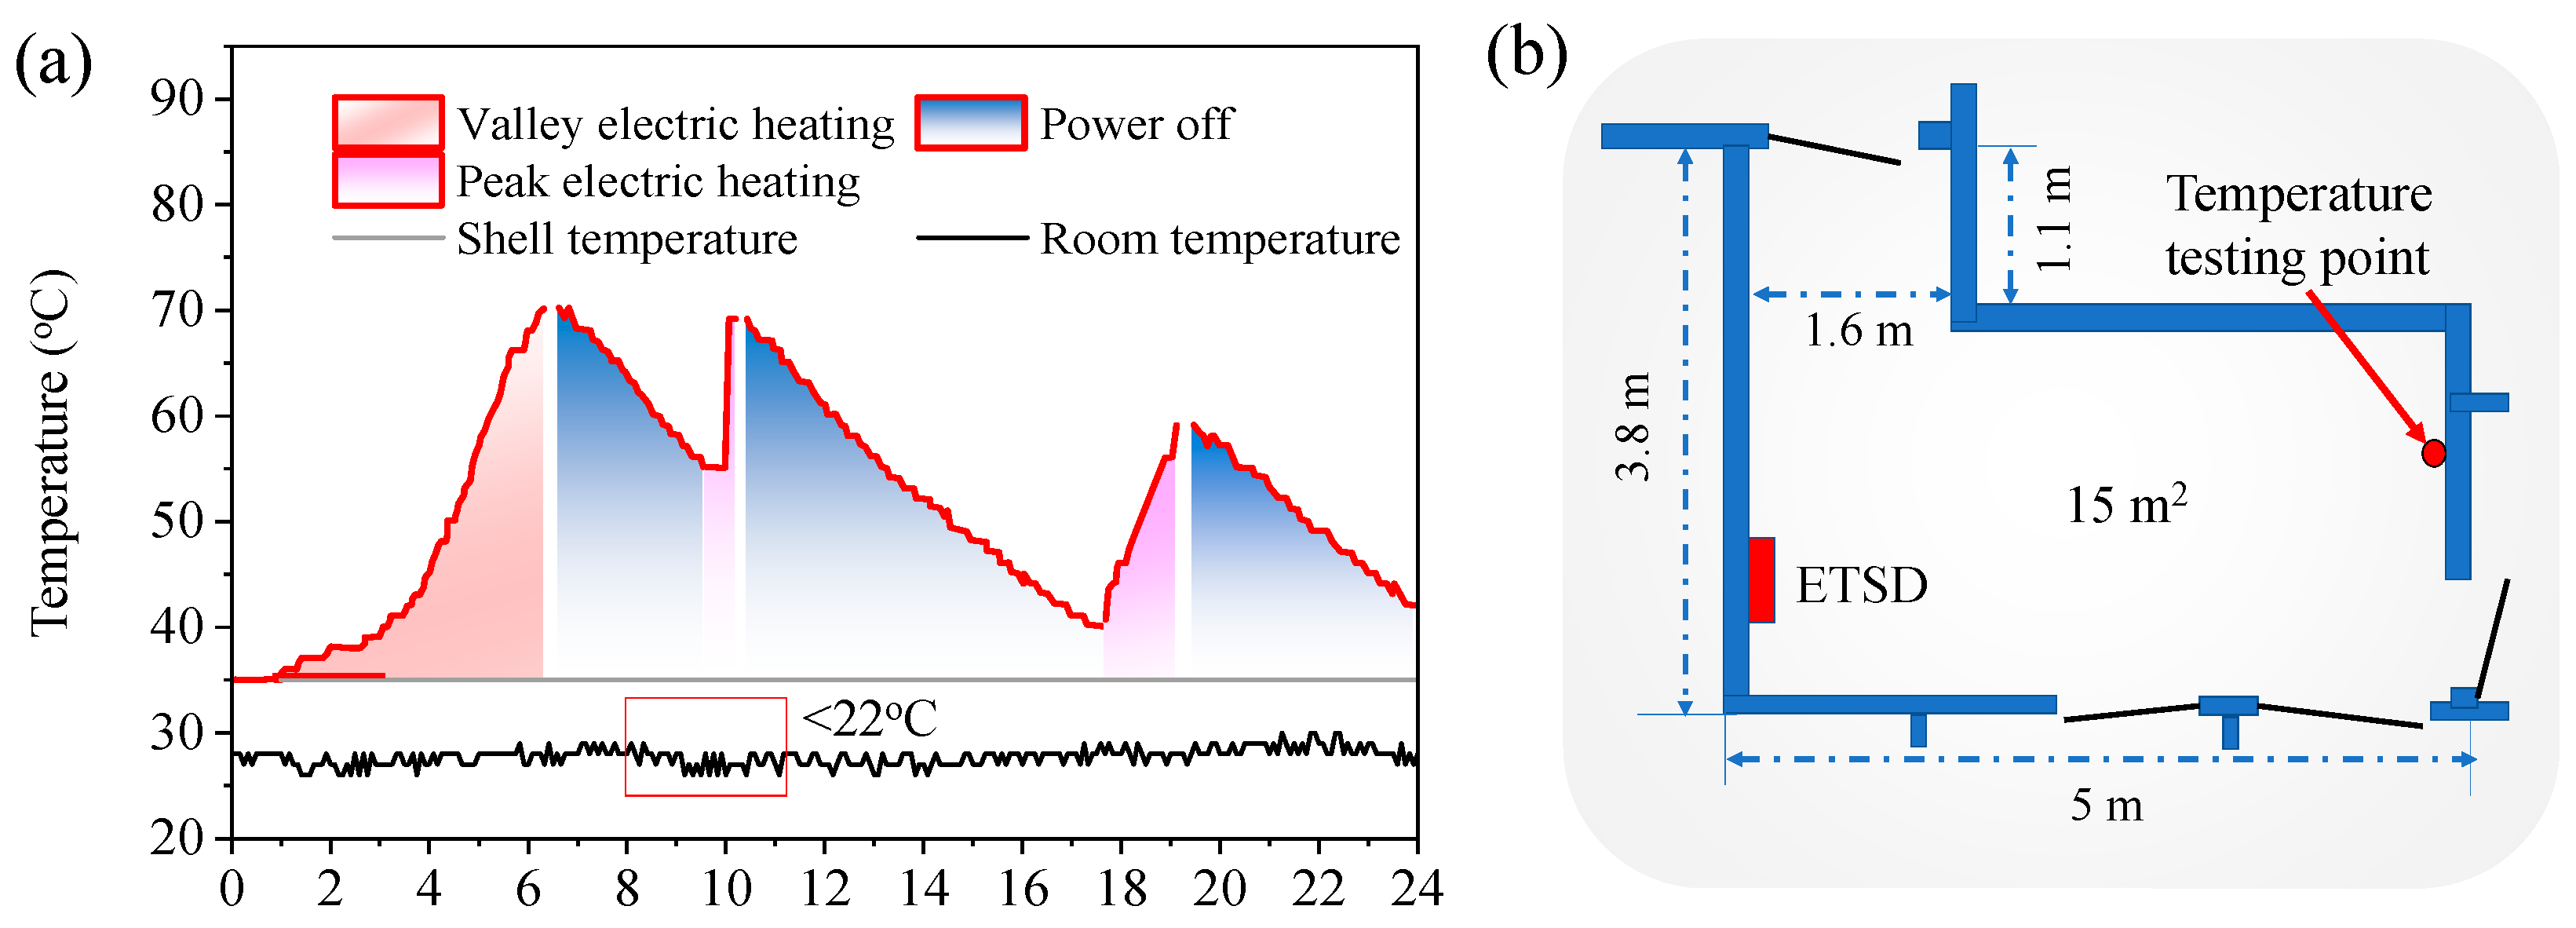
3.5.1. Applying the Optimized ETSD in a Room

Based on a room size of 15 m2, a thermal storage electric heater with a power output of 1.6 kW was estimated to be suitable. During the winter heating season, which runs from January to April, the average outdoor temperature is approximately 2.9 °C. Typically, the indoor air temperature should not fall below 22 °C. Figure 10a displays the average temperature inside the shell, and temperature points indicate the temperature within the room.
The operation strategy of the ETSD was as follows. The device reached its maximum temperature limit during the initial charging period from 0–6 o’clock. The device entered heat release mode, once the temperature protection mechanism was activated. It was observed that the initial 6 h charging time was insufficient to maintain the desired room temperature, and prolonged heating could cause the phase-change brick to surpass its maximum temperature limit. To address this issue, a temperature testing operation was established.
The temperature measuring points were strategically placed within the room, as shown in Figure 10b. Whenever the temperature fell below 22 °C, additional heating was applied for another 30 min during the off-peak electricity phase from 10–10.5 am. Finally, during the peak electricity phase from 5–7 pm, the device provided 2.5 h of reheating, ensuring that the indoor temperature remained above 22 °C.

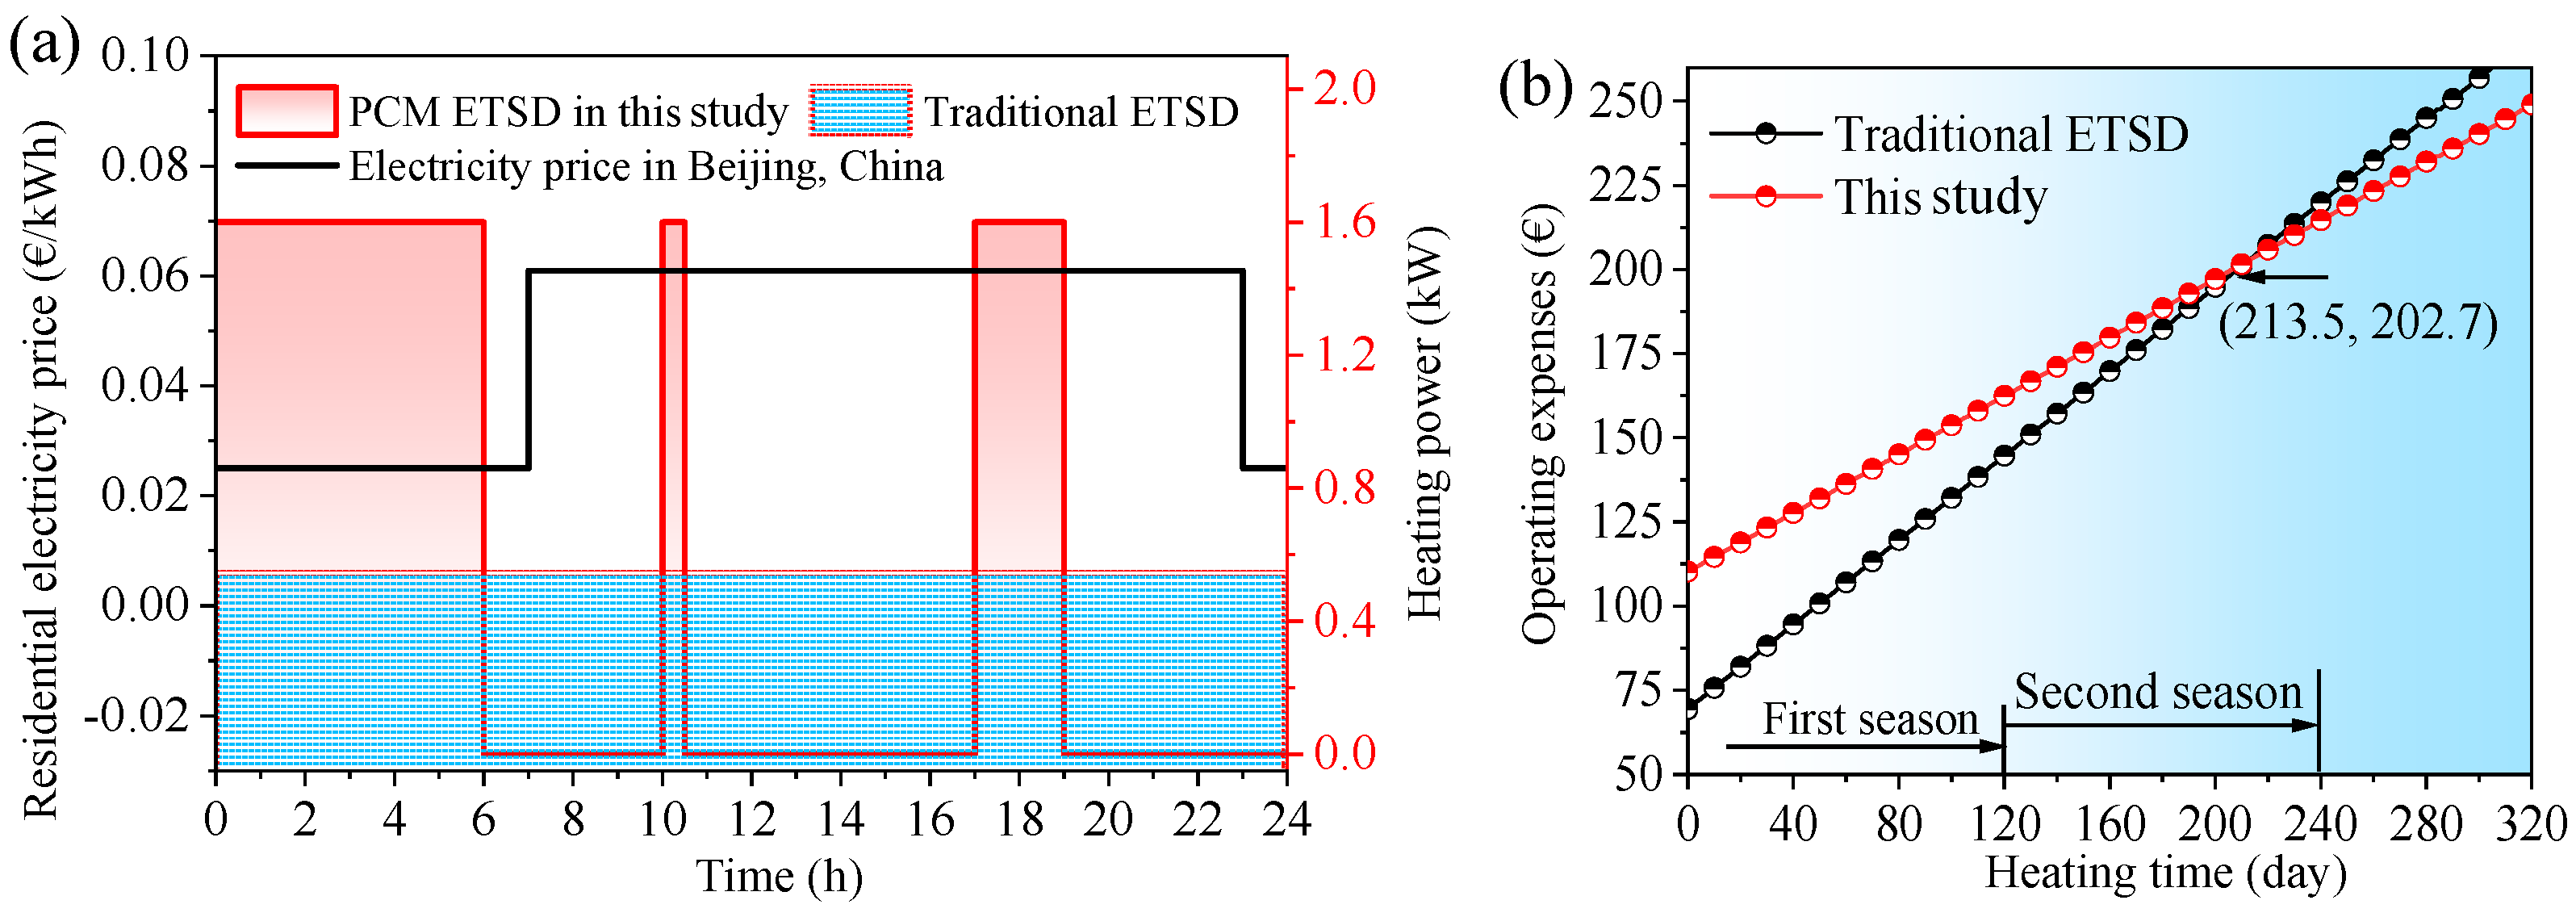
3.5.2. Economic Analysis

Figure 11a compares the running time between the proposed FS-PCM ETSD and a traditional electric heater. In Beijing, the price for off-peak electricity is 0.025 €/kWh, while the price for peak electricity is 0.061 €/kWh, resulting in a 2.44-fold price difference. According to the typical reheating strategy in Figure 10, the ETSD had to be operated for 8.5 h per day.
Figure 11b presents a chart comparing the total operating expenses of the two electric heaters as the running time increased. The specific investment calculations are listed in Table 4. The heating season in Beijing lasts from 15 November to 15 March, with a corresponding annual number of heating days being 120. The total operating cost of the proposed FS–PCM ETSD was observed to be higher than that of the traditional electric heater in the first heating season. However, in the second heating season, the total operating cost of the PCM ETSD was equivalent to that of the traditional electric heater by the 213th day of the heating season. Afterward, the total operating cost of the PCM ETSD lowered significantly with usage time. The operating cost per unit area of the PCM ETSD was 0.435 €/m2/day, while that of the traditional electric heater was 0.627 €/m2/day. The longer the operation time, the more cost-effective the FSPCM ETSD system became.
Based on the relationship between the heating time with off-peak electricity, the interruption time of off-peak electricity, and the compensation heating time with peak electricity, the data in Table 4 were used to derive an equation from the user’s perspective. The equation is as follows:
η valley = t valley + t peak t valley × 100 % × η st
where tvalley represents the heating time with off-peak electricity, and tpeak represents the compensation heating time with peak electricity. The efficiency of off-peak electricity storage on the user side was obtained as 37.2%. These results indicate that this type of electric heater can reduce heating costs, increase heating efficiency, and help the power grid to achieve its goal of peak shaving and valley filling.

4. Conclusions

This study successfully composed form-stable phase-change bricks by combining K2CO3, Na2CO3, MgO, and SiC. Based on this combination of materials, an electric thermal storage device (ETSD) was designed, optimized in structure, and applied practically. Analyses of its heat transfer, energy usage, and economics were conducted throughout the study. The main conclusions are as follows.
(1) It was found that the majority of heat was concentrated in the upper and middle parts of the bricks. The natural convection of air within the slit of the ETSD resulted in the upper portion being heated to its highest temperatures. The structure of the ETSD was optimized by adding two steel plates and two layers of insulation, in order to enhance heat transfer and avoid overheating.
(2) During the 6-hour charging process, 53.4% of the total heating energy was released to the space, while 48.6% was stored in the storage medium of the presented ETSD.
(3) The proposed ETSD underwent seven cycle tests over a week, which demonstrated its good cycle stability. Additionally, the study found that the longest possible continuous heating time was 6 h, in which overheating was avoided.
(4) The ETSD was operated and economically analyzed in a 15 m2 room using the optimized structure and continuous heating time. The proposed operation strategy successfully maintained the room temperature above 22 °C. It was also found that during the second heating season, the total cost of the proposed ETSD became much lower than that of a traditional electric heater by the 213th day of the second heating season.
Further studies can focus on utilizing the latent heat of the phase-change bricks to a greater extent. The present study used most of the phase-change brick’s volume for sensible heat storage; however, using the latent heat of the high-temperature PCM bricks without overheating the middle parts remains an urgent problem. Simultaneously, the ETSD’s temperature affected users’ sensation. The thermal comfort, including ambient temperature distribution and humidity, will be considered in future studies.

Author Contributions

Conceptualization, X.P., G.X. and X.H.; methodology, M.Y.; software, Z.L.; validation, X.H.; investigation, X.P., X.H. and Z.L.; writing—original draft preparation, X.P.; writing—review and editing, M.Y., G.X., Z.L. and C.X.; supervision, C.X.; project administration, G.X. and C.X. All authors have read and agreed to the published version of the manuscript.

Funding

The National Natural Science Foundation of China (51821004).

Data Availability Statement

The data presented in this study are available on request from the corresponding author. The data are not publicly available due to confidentiality agreements.

Conflicts of Interest

The authors declare no conflict of interest.

Nomenclature

Symbols
AArea, [m2]γSpecific gravity of the atmosphere
cStefan–Boltzmann constant, [W/K4]αThermal diffusion coefficient, [m2/s]
dThermal insulation diameter, [m]λThermal conductivity, [W/m·K]
fMass flow, [m/s]Abbreviation
gGravity, [m/s2]BiBiot
HHeight change, [m]ETSDElectric thermal storage device
hHeat transfer coefficient, [W/(m2·K)]FS–PCMForm stable PCM
lLength, [m]PCMPhase-change material
mMass, [g]TESThermal energy storage
nCoefficient, [-]Subscripts
PPower, [kW]0Ambient
pPressure, [Pa]1Part 1
qHeating power, [kW]2Part 2
QHeating energy, [KJ]cConvective
RThermal resistance, [K/W]crCritical
TTemperature, [°C]covConvective heat transfer
tTime, [s]eElectricity
yHeight direction, [m]iInternal
Greek SymbolsilInsulation
ηEfficiency, [%]rRadiative
εEmittance, [-]sp Steel plate
τTime, [s]stStorage
νAtmospheric velocity, [m/s]wWall

References

  1. Niu, D.X.; Song, Z.Y.; Xiao, X.L. Electric power substitution for coal in China: Status quo and SWOT analysis. Renew. Sustain. Energy Rev. 2017, 70, 610–622. [Google Scholar] [CrossRef]
  2. Wei, X.; Zhou, H. Evaluating the environmental value schedule of pollutants mitigated in China thermal power industry. Res. Environ. Sci. 2003, 16, 53–56. [Google Scholar]
  3. Lin, L.; Cao, R.; Feng, L. Investigation of boilers energy alternative outside the region of Nanjing heating supply. Power Demand Side Manag. 2010, 12, 47–49. [Google Scholar]
  4. Xu, G.; Hu, X.; Liao, Z.; Xu, C.; Yang, C.; Deng, Z. Experimental and Numerical Study of an Electrical Thermal Storage Device for Space Heating. Energies 2018, 11, 2180. [Google Scholar] [CrossRef] [Green Version]
  5. Arteconi, A.; Hewitt, N.J.; Polonara, F. State of the art of thermal storage for demand-side management. Appl. Energy 2012, 93, 371–389. [Google Scholar] [CrossRef]
  6. Zhang, N.; Lu, X.; McElroy, M.B.; Nielsen, C.P.; Chen, X.; Deng, Y.; Kang, C. Reducing curtailment of wind electricity in China by employing electric boilers for heat and pumped hydro for energy storage. Appl. Energy 2016, 184, 987–994. [Google Scholar] [CrossRef] [Green Version]
  7. Tian, Z.Y.; Perers, B.; Furbo, S.; Fan, J.H. Thermo-economic optimization of a hybrid solar district heating plant with flat plate collectors and parabolic trough collectors in series. Energy Convers. Manag. 2018, 165, 92–101. [Google Scholar] [CrossRef] [Green Version]
  8. He, Z.Y.; Wang, X.H.; Du, X.Z.; Amjad, M.; Yang, L.J.; Xu, C. Experiments on comparative performance of water thermocline storage tank with and without encapsulated paraffin wax packed bed. Appl. Therm. Eng. 2019, 147, 188–197. [Google Scholar] [CrossRef]
  9. Lin, K.; Zhang, Y.; Xu, X.; Di, H.; Yang, R.; Qin, P. Experimental study of under-floor electric heating system with shape-stabilized PCM plates. Energy Build. 2005, 37, 215–220. [Google Scholar] [CrossRef]
  10. Li, J.; Xue, P.; He, H.; Ding, W.; Han, J. Preparation and application effects of a novel form-stable phase change material as the thermal storage layer of an electric floor heating system. Energy Build. 2009, 41, 871–880. [Google Scholar] [CrossRef]
  11. Yuan, M.D.; Ren, Y.X.; Xu, C.; Ye, F.; Du, X.Z. Characterization and stability study of a form-stable erythritol/expanded graphite composite phase change material for thermal energy storage. Renew. Energy 2019, 136, 211–222. [Google Scholar] [CrossRef]
  12. Ren, Y.X.; Xu, C.; Yuan, M.D.; Ye, F.; Ju, X.; Du, X.Z. Ca(NO3)(2)-NaNO3/expanded graphite composite as a novel shape-stable phase change material for mid- to high-temperature thermal energy storage. Energy Convers. Manag. 2018, 163, 50–58. [Google Scholar] [CrossRef]
  13. Musiał, M.; Lichołai, L.; Pękala, A. Analysis of the Thermal Performance of Isothermal Composite Heat Accumulators Containing Organic Phase-Change Material. Energies 2023, 16, 1409. [Google Scholar] [CrossRef]
  14. Zhou, W.; Li, S.; Feng, Y.; Lin, L. Evaluation and optimization on heat transfer performance of a composite phase change material embedded in porous ceramic skeleton: A lattice Boltzmann study. Int. J. Therm. Sci. 2023, 188, 108214. [Google Scholar] [CrossRef]
  15. Tariq, S.L.; Ali, H.M.; Akram, M.A.; Janjua, M.M.; Ahmadlouydarab, M. Nanoparticles enhanced phase change materials (NePCMs)-A recent review. Appl. Therm. Eng. 2020, 176, 115305. [Google Scholar] [CrossRef]
  16. Li, W.Q.; Guo, S.J.; Tan, L.; Liu, L.L.; Ao, W. Heat transfer enhancement of nano-encapsulated phase change material (NEPCM) using metal foam for thermal energy storage. Int. J. Heat Mass Transf. 2021, 166, 120737. [Google Scholar] [CrossRef]
  17. Halawa, E.; Saman, W. Thermal performance analysis of a phase change thermal storage unit for space heating. Renew. Energy 2011, 36, 259–264. [Google Scholar] [CrossRef]
  18. Kuznik, F.; Arzamendia Lopez, J.P.; Baillis, D.; Johannes, K. Design of a PCM to air heat exchanger using dimensionless analysis: Application to electricity peak shaving in buildings. Energy Build. 2015, 106, 65–73. [Google Scholar] [CrossRef]
  19. Jiang, Z.; Jiang, F.; Li, C.; Leng, G.; Zhao, X.; Li, Y.; Zhang, T.; Xu, G.; Jin, Y.; Yang, C.; et al. A Form Stable Composite Phase Change Material for Thermal Energy Storage Applications over 700 °C. Appl. Sci. 2019, 9, 814. [Google Scholar] [CrossRef] [Green Version]
  20. Gaffar, S.A.; Prasad, V.R.; Bég, O.A. Numerical study of flow and heat transfer of non-Newtonian Tangent Hyperbolic fluid from a sphere with Biot number effects. Alex. Eng. J. 2015, 54, 829–841. [Google Scholar] [CrossRef] [Green Version]
  21. Loveday, D.L.; Taki, A.H. Convective heat transfer coefficients at a plane surface on a full-scale building facade. Int. J. Heat Mass Transf. 1996, 39, 1729–1742. [Google Scholar] [CrossRef]
  22. Zhang, H.; Jiang, C.; Zhang, Z.; Liu, Z.; Luo, X.; Liu, W. A study on thermal performance of a pump-assisted loop heat pipe with ammonia as working fluid. Appl. Therm. Eng. 2020, 175, 115342. [Google Scholar] [CrossRef]
  23. Brigaud, F.; Vasseur, G. Mineralogy, porosity and fluid control on thermal conductivity of sedimentary rocks. Geophys. J. Int. 1989, 98, 525–542. [Google Scholar] [CrossRef] [Green Version]
  24. Lu, Y.; Zhang, G.; Hao, J.; Ren, Z.; Deng, Z.; Xu, G.; Yang, C.; Chang, L.; Tan, H. Study on the effect of glass on the properties of Na2CO3-K2CO3 eutectic salt/MgO composite as phase change thermal storage materials. Energy Sources Part A Recovery Util. Environ. Eff. 2020, 1–12. [Google Scholar] [CrossRef]
  25. Li, B.-R.; Tan, H.; Liu, Y.; Liu, Q.; Zhang, G.-Q.; Deng, Z.-F.; Xu, G.-Z.; Guo, Y.-Q.; Du, X.-Z. Experimental investigations on the thermal stability of Na2CO3–K2CO3 eutectic salt/ceramic composites for high temperature energy storage. Renew. Energy 2020, 146, 2556–2565. [Google Scholar] [CrossRef]
  26. Li, C.; Si, Y.; Leng, G.; Xu, Y.; Ding, Y.; Weng, L.; Ding, Y. Charging behavior of an electrical storage heater using a high temperature composite phase change material. Energy Storage Sci. Technol. 2017, 6, 739. [Google Scholar]
Figure 1. The schematic diagram (a), the exterior with metal shell (b), and the inner section plane (c) of the proposed ETSD.
Energies 16 04506 g001
Figure 2. The actual (a) and simplified (b) airflow slit of the ETSD; (c) the schematic diagram of the pressure drop of the air passage inside the electric heater.
Energies 16 04506 g002
Figure 3. TG and heat flow DSC curves of the FS–PCM brick.
Energies 16 04506 g003
Figure 4. (a) One parallel stacked FS–PCM brick in the ETSD. (b) Temperature measurement point distribution map on the surface of the stacked FS–PCM bricks. The 16 temperature measuring points were marked as “1”, which stands for the y direction, and “2”, which stands for the x direction.
Energies 16 04506 g004
Figure 5. Temperature distributions of the form–stable PCM bricks. Charging and discharging temperature curves of the bricks without steel plates (a) and with steel plates (b) during 24 h. The cloud maps of the charging points of the bricks without steel plates (c) and with steel plates (d) at 2, 4, 6, and 8 h.
Energies 16 04506 g005
Figure 6. Surface temperature distributions of FS–PCM bricks with 1 insulation layer (a), 2 insulation layers (b), and 4 insulation layers (c) at 2 h, 4 h, 6 h, and 8 h. (d) Temperature comparisons for maximum temperature with 1 insulation layer at 6.2 h, 2 insulation layers at 6.05 h, and 4 insulation layers at 4.1 h.
Energies 16 04506 g006
Figure 7. Simulated temperature contours of the cross–sections of the bricks with different heights (a) and the middle cross–section of the flow channel (b) at 2 h, 4 h, 6 h, and 8 h.
Energies 16 04506 g007
Figure 8. The energy analysis. (a) The 1D transfer direction of energy q due to the temperature difference from electric element Te to room T0. (b) Diagram of the thermal resistance network. (c) The heat discharge rate changes in the electrical power qe, the heat flow transferred to air qair, and the stored heat qst during the charging and discharging processes. (d) The total energy transferred to the air Qair and the stored heat in the bricks Qst.
Energies 16 04506 g008
Figure 9. Seven cycle tests over a one–week period. (a) The temperature cycling of FS–PCM bricks at different heights from 10 to 260 mm. (b) Temperature cycling of the ETSD’s exterior at the upper and lower parts. (c) The stored heat rate.
Energies 16 04506 g009
Figure 10. The operation strategy of ETSD control (a) and the temperature point placed in the 15 m2 room (b).
Energies 16 04506 g010
Figure 11. The economic analysis. (a) Running time comparison of the proposed PCM ETSD and traditional ETSD in one cycle. (b) Comparison of the operating expenses during the running time.
Energies 16 04506 g011
Table 1. The thermal conductivity and the specific heat value were tested and calculated for the raw material.
NameMaterialThermal Conductivity, W/(m·K)Specific Heat, kJ/(kg·K)
Steel plateSteel 565635.8 ± 0.25 0.47 ± 0.05
Insulation layer [22]Nano-adiabatic material0.012 ± 0.0000241.12 ± 0.08
ShellAluminum alloy121.5 ± 0.250.88 ± 0.03
Air [23]Air0.031.005
Table 2. Thermal and physical properties of the K2CO3–Na2CO3 FS–PCM brick [4,24,25].
PropertiesTestReference
Specific heat for the solid state, kJ/(kg·K)1.24[4]
Specific heat for the liquid state, kJ/(kg·K)1.62[4]
Phase change temperature, °C710[24,25]
Heat of fusion, kJ/kg105.5-
Density, kg/m32020-
Thermal conductivity, W/(m·K)1.3[4]
Table 3. Typical calculations of heat storage ratios at 6 h.
NameSymbolUnitValue
Heating power qkW1.6
Heating energyQkJ9.6
Heat storage by the bricksQbrickkJ6.09
Heat storage by the steel plateQspkJ0.2
Heat storage by the insulation layerQilkJ0.1
Heat storage by the aluminum alloy casingQackJ0.21
Transfer to the airQairkJ4.3
Heat storage ratioηst%48.6
Table 4. Comparison of typical initial investments between traditional electric heaters and ETSDs in this study.
Traditional Electric Heater aETSD in This Study
Heating area (m2)15
Price of valley time electricity in Beijing (€/kWh)0.025
Price of peak-time electricity in Beijing (€/kWh)0.061
Price of steel (€/kg)1.64
Price of heating cable (€/W)0.05
Size (mm)700 × 225 × 535660 × 190 × 615
Price of electrical control (€)29.630.5
Price of the fan (€)6.7-
Price of insulation Materials (€)-8.99
Price of PCM (€)-31.65
Initial investment (€)69.4110.2
Valley heating time (h/day)86.5
Peak heating time (h/day)162
a. The traditional electric heater was purchased from Midea Group Co., Ltd., Zhuhai, Guangdong province, China (Midea HDY22TH).
Disclaimer/Publisher’s Note: The statements, opinions and data contained in all publications are solely those of the individual author(s) and contributor(s) and not of MDPI and/or the editor(s). MDPI and/or the editor(s) disclaim responsibility for any injury to people or property resulting from any ideas, methods, instructions or products referred to in the content.

