Article

Carbon-Neutral Steel Production and Its Impact on the Economies of China, Japan, and Korea: A Simulation with E3ME-FTT:Steel

1
Cambridge Econometrics, Covent Garden, Cambridge CB1 2HT, UK
2
Global Systems Institute, Department of Geography, University of Exeter, Exeter EX4 4QE, UK
3
Faculty of Economics, Meijo University, Nagoya 468-0073, Japan
4
Graduate School of Economics, Kyoto University, Kyoto 606-8501, Japan
5
School of Environment and Natural Resources, Renmin University of China, Beijing 100872, China
6
Department of Food and Resource Economics, Korea University, Anam-dong, Seongbuk-gu, Seoul 02841, Republic of Korea
*
Author to whom correspondence should be addressed.
Energies 2023, 16(11), 4498; https://doi.org/10.3390/en16114498
Submission received: 6 May 2023 / Revised: 26 May 2023 / Accepted: 31 May 2023 / Published: 2 June 2023
(This article belongs to the Section C: Energy Economics and Policy)

Abstract

:
The iron and steel industry is a large emitter of CO2 globally. This is especially true for the iron and steel industries in China, Japan, and Korea due to their production volumes and the prevalence of carbon-based steel production. With few low-carbon and commercially available alternatives, the iron and steel industry is truly a hard-to-abate sector. Each of the countries of interest have committed to a net-zero future involving the mitigation of emissions from steel production. However, few studies have investigated the means by which to achieve decarbonization beyond the inclusion of price signalling policies (e.g., carbon tax or emission trading schemes). Here, we use E3ME-FTT:Steel to simulate technology diffusion in the ISI under several policy environments and we investigate the likely impacts on the wider economy. The results show that penalizing carbon intensive processes can incentivize a transition towards scrap recycling, but it is relatively unsuccessful in aiding the uptake of low carbon primary steelmaking. A combination of support and penalizing policies can achieve deep decarbonisation (>80% emission reduction compared with the baseline). Mitigating the emissions in the iron and steel industry can lead to economic benefits in terms of GDP (China: +0.8%; Japan: +1.3%; Korea: +0.1%), and employment (Japan: +0.7%; Korea: +0.3%) with China, where job losses in the coal sector would negate job gains elsewhere, as the exception.

1. Introduction

In October 2020, China, Japan, and Korea declared that they plan to achieve net zero carbon dioxide emissions, in other words, carbon neutrality, by the mid-2000s. Carbon neutrality means transitioning from a dependency on fossil energy to a situation where renewable energy is the main source of energy. To achieve this target, it is necessary to break away from fossil energy dependence, not only in the power sector, but also across all sectors, including industry, transport, commerce, and consumer use. The iron and steel industry (ISI) is the main provider of materials for other sectors and makes the largest contribution to CO2 emissions. In Japan, China, and Korea, the ISI accounts for 14% [1], 15% [2], and 13.1% [3] of total emissions, respectively. To achieve carbon neutrality, decreasing emissions in the ISI is inevitable.
To achieve carbon neutrality in the ISI, transitioning from conventional methods of producing steel, which rely on blast furnaces (BFs) that require coke as an input to reduce iron ore to metallic iron, is of paramount importance [4]. Steel recycling is often proposed as an alternative, currently available process that relies on electricity rather than coal, but there is a limited amount of scrap metal, and it is not expected to meet demand in the foreseeable future [5], unless steel demand growth is curbed [6].
Another proposal is to reduce the emissions of existing processes through carbon capture utilization and storage (CCUS); however, the technology has so far underperformed [7] and technology learning has hit a barrier due to a lack of global coordination [8]. Yet, valuable research is ongoing that might relieve CCUS’s underperformance (e.g., [9]) and it is often regarded as an essential technology to achieve decarbonization (e.g., [10,11]). Low-carbon steelmaking is also possible by using hydrogen as the reducing agent instead of a source of carbon [12,13,14]. A pilot project in Sweden is currently being expanded to full-scale commercialization [15], and various other hydrogen-focused projects are ongoing [14]. Hydrogen-based steelmaking will only be low-carbon when the hydrogen is produced using low-carbon processes, which are currently more expensive than conventional hydrogen production processes based on natural gas. At the moment, low-carbon hydrogen production capacity is limited, but many regions around the world are seeking to increase capacity [16].
While several alternative low-carbon options for steel production have been identified, steel decarbonization faces several barriers. Kim et al. [17] mention financial (high upfront costs and long life cycles) and economic (e.g., volatility of input prices), organizational and managerial, and behavioural (ever-increasing steel demand) barriers. The authors compiled a number of policy options by which to decarbonize the ISI, ranging from penalizing CO2 emissions to incentivizing low-carbon steel production.
Few studies have quantitatively considered policy methods to decarbonize the ISI. Studies that have investigated ISI decarbonization through technology diffusion focused mainly on price signalling policies, such as a carbon tax, using optimization models (e.g., see [6,18,19,20,21]). Here, we investigate technology diffusion under a combination of policies (beyond price signalling), using the simulation tool E3ME-FTT:Steel [22,23]. Our focus lies on technology diffusion, environmental performance, and economic impacts.
This study proposes three different hypothetical policy scenarios consisting of various mixes of policy levers that include a carbon tax, subsidies, mandates, and phase-out regulations. E3ME-FTT:Steel is used to simulate the decarbonization technological innovation process that takes hydrogen reduction ironmaking as the focus point until 2050. This study also estimates the impact on the general economy. FTT:Steel is an advanced technology diffusion model and is connected with the macro-econometric E3ME model. The FTT:Steel model is a bottom-up evolutionary model that simulates the market share of 26 steelmaking technologies, such as ferro-coke, direct reduction (including gas-, coal-, and hydrogen-based options), and steel recycling in the ISI up to 2050.

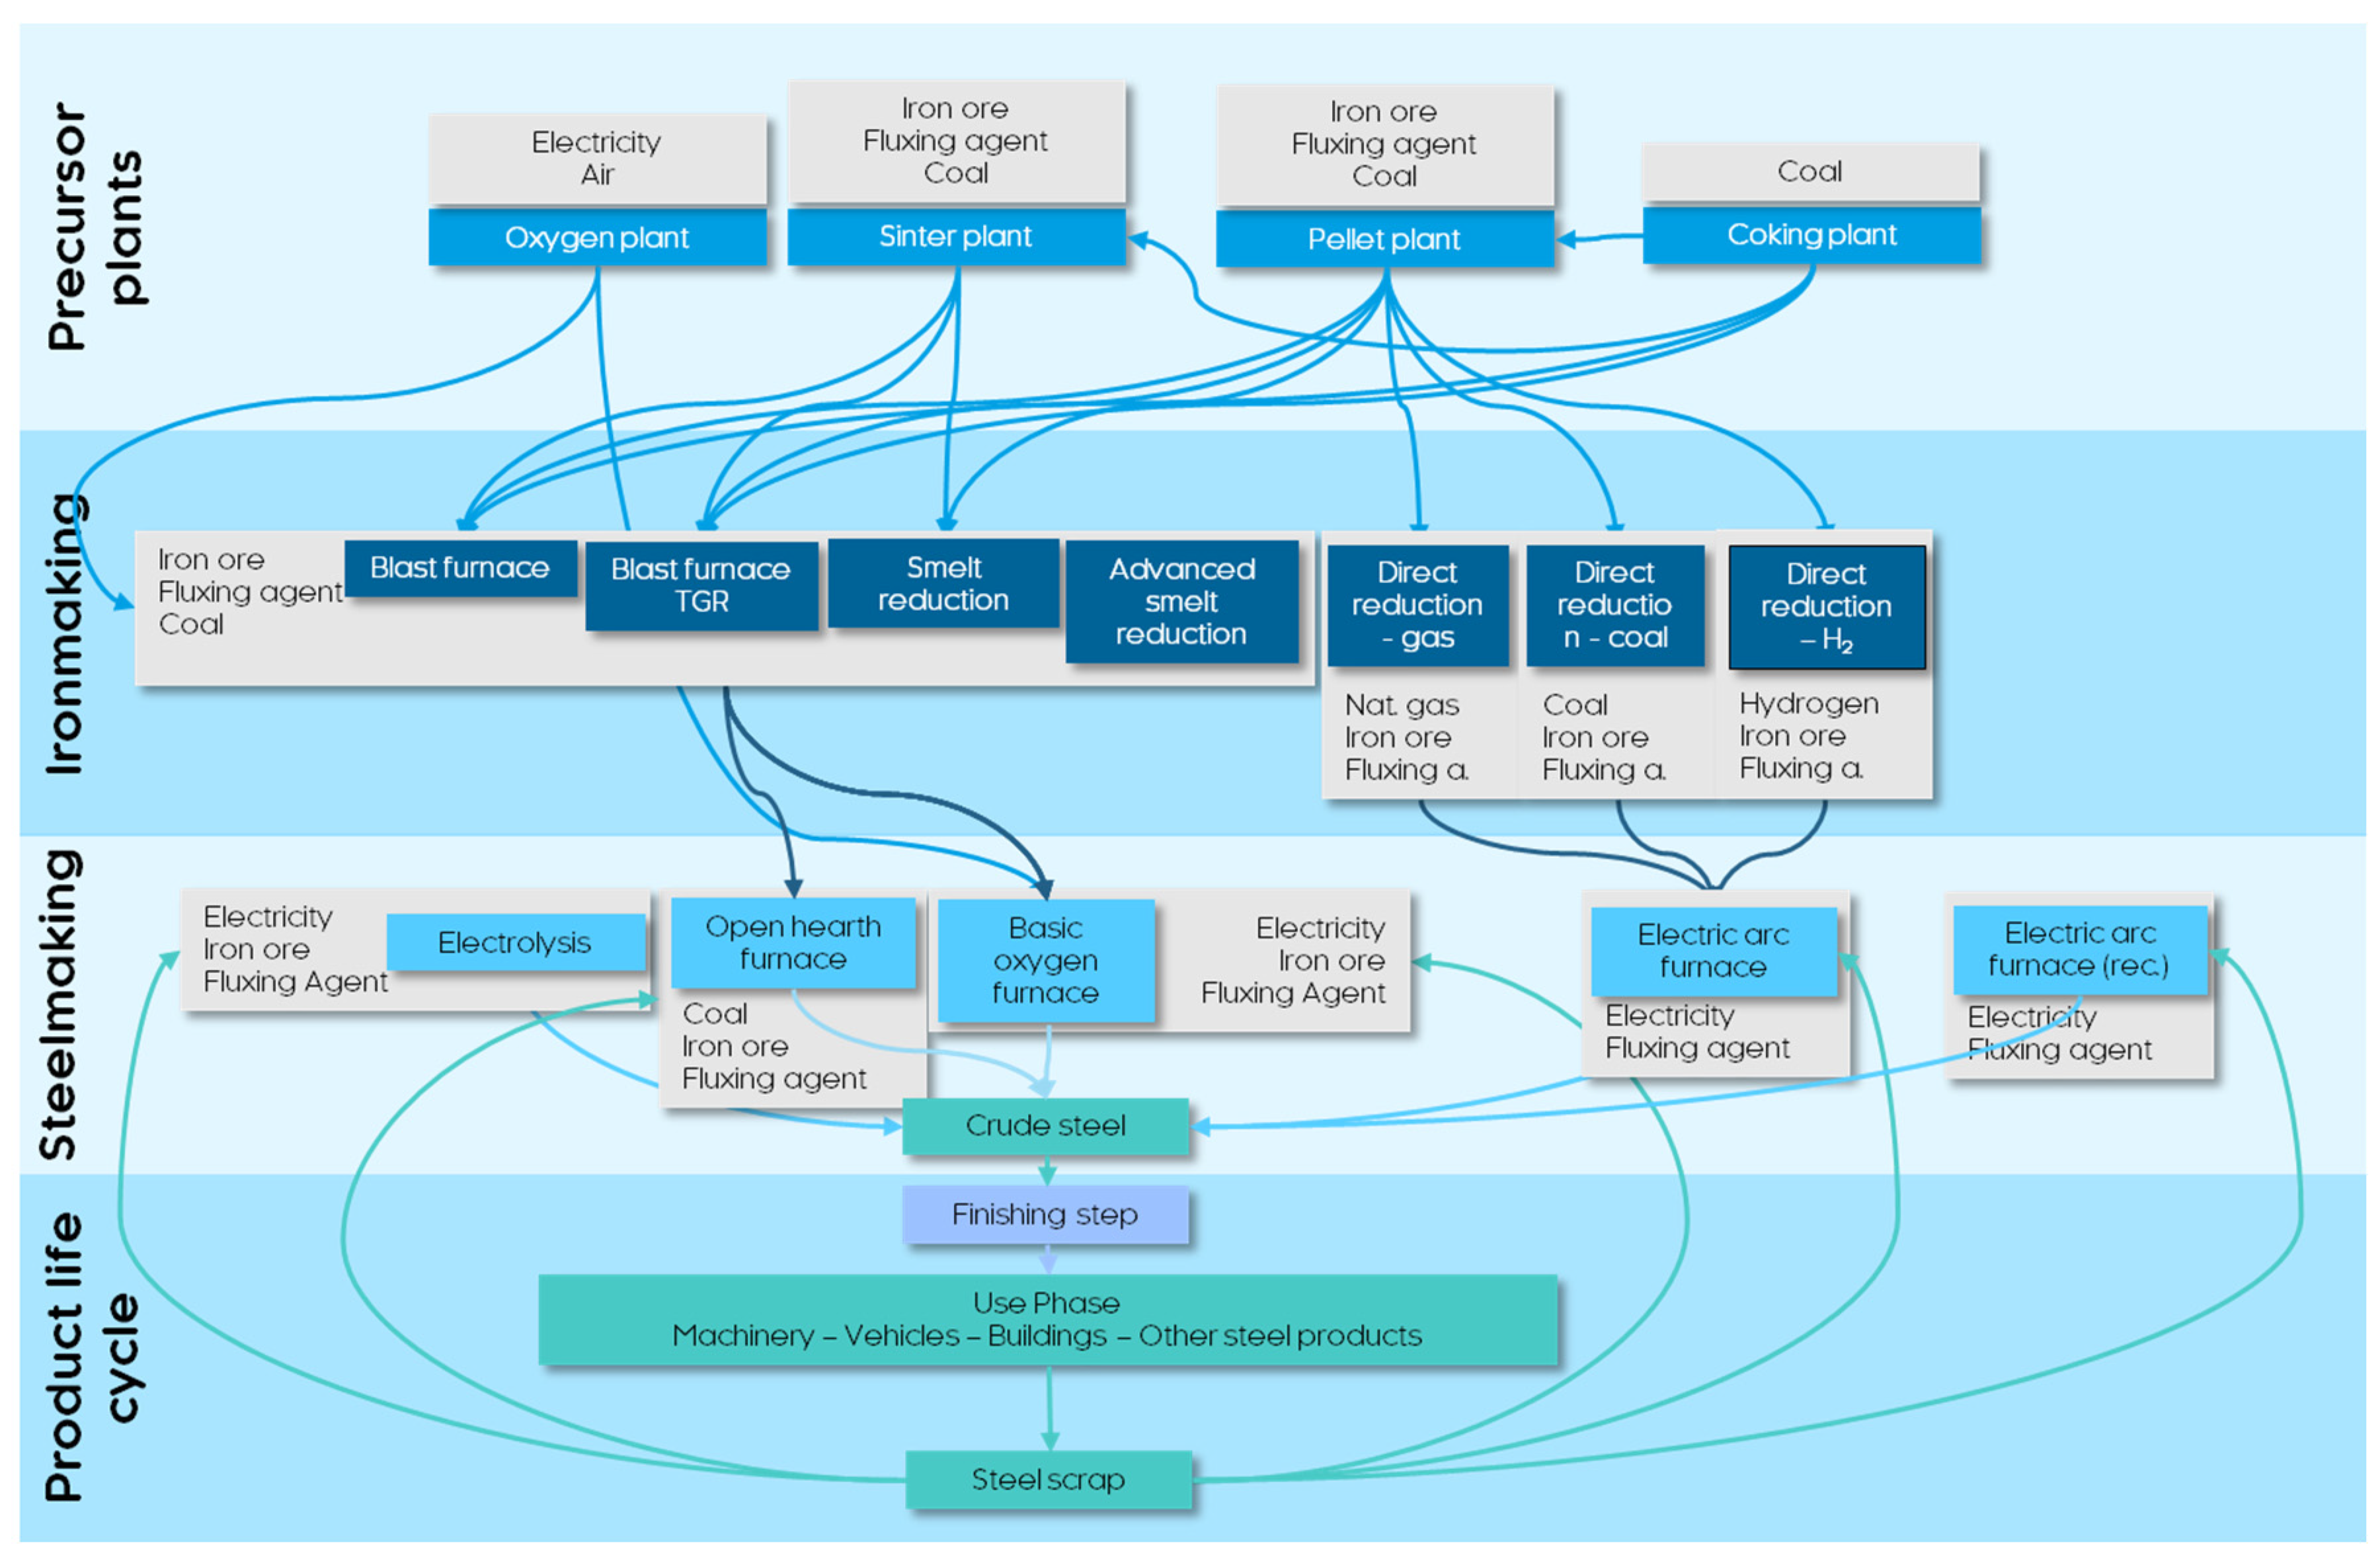
1.1. Iron and Steelmaking Processes

Iron is generally produced by reducing and smelting iron ore and coke in a BF, followed by a refining step in a basic oxygen furnace (BOF), or by smelting steel scrap in an electric arc furnace (EAF). In regions with abundant gas resources, a process based on steam reforming of methane is used, whereas other regions with low-quality coal adopt coal gasification. Owing to the abundant use of fossil fuels, producing 1 ton of steel generates, on average, about 1.5–2.0 tons of CO2, most of which is generated in the iron ore reduction process [4]. Steel production is a major contributor to global CO2 emissions, with global production levels estimated at 1.95 billion tons in 2021 (2.3 times the 2000 level).
The International Energy Agency [4] estimates that the market size of green steel could reach almost 500 million tons by 2050, and forecasts that zero-emission production will be adopted for almost all pig iron production by 2070. Decarbonization technology has not yet been established for the ISI. Currently, the major premise is to advance decarbonization along with CCUS and the use of decarbonized power sources. In addition, technological innovation has led to the adoption of hydrogen reduction ironmaking that does not generate CO2.

1.2. Country Profile: China

In 2021, global crude steel production was 1.95 billion tons. China produced 1.03 billion tons and accounted for 53% of the total crude steel production globally [24]. The main downstream industries that use normal steel are construction (54%), machinery (21%), and power (10.9%). The main downstream industries that use special steel are automobiles (40%), industrial manufacturing (20%), and metal products (17%).
Among the heavy industries, the ISI emits the most CO2. China’s ISI accounts for about 5% of the country’s GDP and was responsible for 15% of its CO2 emissions in 2020 [2]. This makes the ISI the second-largest source of carbon in the country after thermal power plants, and the largest source of industrial carbon emissions [25]
In 2020, about 91% of China’s crude steel output came from BF–BOF processes, and 9% from EAFs [26]. China is focusing on low-carbon technology, including electricity innovation (renewable power generation technology), hydrogen development, and CCUS. Electric furnace steel production is expected to increase to over 15% of China’s total crude steel output. Furthermore, the Global Times [27] writes, “China has recently completed a test of a new hydrogen-enriched smelting technology using a blast furnace with pure hydrogen as blowing gas source, in an attempt to reduce carbon emissions produced from steel production”. Further, China is expected to invest additional R&D on CCUS.
The following energy-saving techniques are currently being pursued: high-temperature and high-pressure dry coke quenching, coke oven rising tube waste heat recovery, coal wetting, sintering waste gas–waste heat recycling, sour water waste heat recovery, pure dry dedusting of converter flue gas for waste heat recovery, dry (semi-dry) dedusting of converters, high parameter gas generator sets, blast furnace slag, and steel slag sensible heat recovery [28].
In addition, oxygen BF technology that reduces coal consumption by injecting pure oxygen instead of hot air is being developed. The goal is to establish a technology that reduces CO2 emissions by 50% or more compared with a conventional BF. By 2060, China plans to use the scrap–EAF route to produce most of its steel [26].
China is increasingly working on lower-emission hydrogen to decarbonize. In the 14th Five-Year Plan (2021–2025), hydrogen is identified as a “frontier” area and one of the six industries for focused advancement. The Center for Strategic and International Studies [29] notes the release of China’s first-ever long-term plan for hydrogen, covering the period of 2021–2035. The plan laid out a phased approach to developing a domestic hydrogen industry and mastering technologies and manufacturing capabilities. These are the major goals set in China’s development guidelines [30]. The goals rely on advanced technology and equipment to realize high-quality growth, ensure a stable supply of resources, and reduce emissions by 2025.

1.3. Country Profile: Japan

In 2019, Japan’s ISI industry accounted for 8.5% of the industrial GDP. Japan produced 95.6 million tons of crude steel in 2021, which was 15.5% more than in 2020; about 26.5% came from electric furnaces. Based on this trend in Japanese crude steel production, the demand for crude steel will continue to increase toward 2050. This is because the amount of scrap generated is estimated to increase [1]. Initially, steel production rose in line with Japan’s economic expansion in the period 1955 to 1972, followed by a slower but still steady increase in the period leading up to the early 2000s. Growth has stagnated since the early 2000s [31].
The ISI emits large amounts of CO2 worldwide and is the largest CO2 emitting industry in Japan. In Japan, the ISI accounts for 40% of CO2 emissions in the industrial sector and 14% of total CO2 emissions. CO2 emissions from the industrial sector accounted for 35% of total CO2 emissions in 2019 [1].
In 2008, Japan launched the COURSE50 strategy to reduce ISI emissions. COURSE50 also seeks to commercialize and generalize hydrogen-based steelmaking. However, METI [1] notes that “decarbonization technology has not yet been established for the iron and steel industry”. METI [1] also states that “the blast furnace method (blast furnace and BOF process) is excellent in energy efficiency because reduction and melting are carried out consistently”. As the technology for iron ore utilization and removing impurities improves, producing high-grade steel becomes possible. Furthermore, CO2 emission generation decreases when natural gas is used. However, producing high-grade steel is still difficult when using the direct reduction method, because of EAFs’ low energy efficiency and difficulties in removing impurities. Nonetheless, if hydrogen is used instead of natural gas in an EAF, decarbonization can be realized without carbon capture utilization. Several major Japanese steel companies (e.g., Nippon Steel, JFE Steel, and KOBELCO) have set carbon neutrality targets for 2050 and anticipate using a broad set of decarbonization measures [1].
METI [1] states that the Japan Iron and Steel Federation supports Japan’s policy of achieving carbon neutrality by 2050, and that the Japanese ISI will “aggressively take on the challenges to realize zero-carbon steel” and “would try to develop super-innovative technologies, including hydrogen reduction ironmaking.” Further, the Japan Iron and Steel Federation [31] notes that policies such as COURSE50 “offer a direction towards achieving the Paris Agreement’s long-term goal and is to be consistent with the national project being executed”. The Japanese government has also provided 193.5 billion yen to support net-zero steel technology R&D from the 2 trillion yen allocated to the Green Innovation Fund managed by the New Energy and Industrial Development Organization. In addition, steel companies organize the consortium for the joint development on zero-carbon steel production.

1.4. Country Profile: Korea

Korea’s crude steel production was estimated at 70.4 million tons in 2021, an increase of 4.9% compared with 2020. Vercoulen et al. [32] observe that “the Korean government initiated the exponential growth of its steel industry in the 1960s and the country has been ranked 6th in terms of total crude steel production since 1995”. This growth has kept pace with Korea’s overall economic growth. However, the Korean economy is currently not experiencing rapid growth, and there has been a decline in steel demand [32].
The main steel-consuming industries in Korea are construction, automobile, shipbuilding, and machinery. Steel consumption has decreased owing to lower demand from the construction and shipbuilding industries. Additionally, Korean steel exports to major steel markets has decreased owing to capacity expansion in their export markets and/or trade protectionism. Imports to the Korean market have also decreased in recent years owing to a slump in the shipbuilding industry [33].
The Korean economy emitted 701.2 Mt of CO2 eq. in 2019, of which 166.3 Mt of CO2 eq. (direct emissions, 82.1%; indirect emissions, 13%; and process emissions, 4.9%) originated from the ISI [3]. The South Korean Ministry of Trade, Industry, and Energy states that South Korea “plans to reduce CO2 emissions by 20% by 2030 and 50% with gradual shift to direct reduction from blast furnaces, thereby aiming to achieve carbon neutrality by 2050” [1]. In 2020, the Pohang Iron and Steel Co. (POSCO), the largest Korean steel company, declared that it aims to achieve a 10% reduction in emissions by 2030, 50% by 2040, and net zero carbon emissions by 2050 [34].
Korea ranks third in the world in terms of hydrogen investment. The Korean government believes hydrogen can expand the Korean economy by 43 billion USD and simultaneously create 420,000 jobs. Thus, Korea is trying to achieve a hydrogen economy for economic growth and to increase its competitiveness. One of Korea’s targets is to increase annual hydrogen utilization from 130,000 tons in 2021 to 5.26 million tons in 2040 [35]
POSCO’s average carbon emissions from 2017 to 2019 totalled 78.8 million tons [34]. POSCO is currently developing and researching new low-carbon technologies, including hydrogen-based steelmaking. A publication by the Australian Trade and Investment Commission [36] states that POSCO “has committed to become carbon neutral by 2050 and hydrogen is a major component of the strategy … [The company] has developed its own hydrogen reduction steelmaking method, HyREX (Hydrogen Reduction), which uses only hydrogen as a reducing agent”.
Korea enacted the Hydrogen Economy Promotion and Hydrogen Safety Management Law in 2021. In addition, the Korean government has recently announced a steel industry development strategy and plans to create a 150 billion South Korean won (115.9 million USD) fund to support low-carbon steel production. The strategy aims to replace 11 blast furnaces with 14 hydrogen direct reduction reactors by 2050, with hydrogen used instead of coal to reduce iron ore [37].

2. Materials and Methods

2.1. E3ME

In this study, we focus on E3ME-FTT:Steel to investigate how policy packages can influence decarbonization in the ISI and their economic impact in China, Japan, and Korea. E3ME is a global macro-econometric model that divides the world into 71 countries/regions and 43 sectors. All three countries of interest are represented. E3ME simulates economic responses by establishing econometric parameters for key variables [23]. Unlike many other macro-economic models, this system does not, per se, operate in equilibrium. In fact, underutilized capacity can be activated through policy. Further, money plays a different role. Money creation is possible through lending and does not, per se, lead to a full crowding-out effect; however, E3ME remains agnostic on the availability of finance. Pollitt and Mercure [38] explain the role of money in greater detail.

2.2. FTT:Steel

The drawback of using time series econometrics to determine energy demand is that it fails to track systematic change as the occurrences of systematic change are limited. Future Technology Transformations (FTT) was developed to address this shortcoming, first in the power sector [39] and then in the passenger road transport [40], residential heating [41], and the iron and steel sectors [32]. FTT builds on evolutionary economics and seeks to mimic the diffusion dynamics of technologies within a sector by considering economic performance, technology lock-ins, substitution frequencies, and sectoral limitations. The general mathematical framework of FTT is described in Mercure [39,42]. The full set of equations is reproduced in Appendix A.
A technology diffusion model such as the FTT allows for the inclusion of various technology-specific policies beyond price signals by implementing a carbon tax. With FTT, technology-specific policies, such as subsidies on upfront costs, energy tax and rebates, capacity caps, and phase-out regulations can be implemented.
Recycling is limited by the availability of scrap. Here, we examine scrap availability in each country by building on the methodology provided by Pauliuk et al. [43].
Shifts in technologies used to produce steel can have consequences for other parts of the model. Additional demand for electricity leads to a response in FTT:Power. FTT:Power determines electricity prices. Further, investment needs and steel prices have consequences for various economic indicators within the E3ME. However, modelling tools do not cover all interactions. Most importantly, the hydrogen supply sector is not represented; therefore, the simulations lack important feedback. We assume that some of the hydrogen supply is domestic green hydrogen, while the remainder is imported. We recognize that this is a significant gap in the methodology and future work will focus on incorporating an endogenous representation for the hydrogen supply sector.
FTT:Steel describes 26 technology pathways for producing crude steel, including primary steel production pathways from iron ore and steel recycling from steel scrap. The BF–BOF combination is currently the dominant steel production route. The model also includes other forms of smelt reduction coupled with BOFs (SR–BOFs) and various forms of direct reduction coupled with EAFs (DR–EAFs) with various feedstock inputs such as natural gas, coal, and hydrogen. It also includes EAFs for re-smelting steel scrap. Figure 1 provides an overview of the steelmaking routes for FTT:Steel. Where applicable, carbon capture and storage (CCS) and bio-based variants are included in the analysis.

2.3. Learning by Doing

A key characteristic of the FTT model is the inclusion of a positive feedback loop between technology uptake and costs following Wright’s law. Equation (1) shows the equation for “learning by doing” as a function of global capacity addition.
I i , t = b i C i , t C i , t I i , t ,
where ∆I represents the change in upfront costs, C represents the total global cumulative capacity for each technology, and b represents the technology specific learning rate.
Learning rates for the incumbent steelmaking paths are either small or do not matter at all owing to their maturity. Karali et al. [44] estimate learning rates of around 2–4% at high maturity for BOFs and EAFs. Given that all steelmaking routes include either BOFs or EAFs, the overall learning rates are expected to be relatively small across all pathways. For novel low-carbon steelmaking technologies, a clear record of uptake and costs, and most importantly, their relationship, has not yet been established. Some estimates exist, but the confidence intervals are large and exhibit a poor data fit [45]. For example, Schoots et al. [46] find learning rates of 18% ± 13% for water electrolysis and 11% ± 6% for steam methane reforming. Electrolysis is a subprocess of hydrogen-based direct reduction, while steam methane reforming is a subprocess of gas-based direct reduction. Based on the above, we apply the learning rates as presented in Table 1.

2.4. Baseline Scenario

The E3ME model is calibrated to determine a “current policies” trajectory for numerous economic indicators, population, labour supply, and energy demand. Energy demand is calibrated to the IEA’s World Energy Outlook. Demographic forecasts are obtained from the United Nations’ Population Prospects. GDP projections are obtained from the World Bank. Labour-related statistics are obtained from the International Labour Organization. More details on the sources of external projections can be found in the technical manual [23]. The projections show annual average GDP growth over the period of 2023 to 2050 for China (3.5%), Japan (0.9%), and Korea (1.6%). The baseline represents a “current policies” scenario and therefore includes representations of the emission trading schemes (ETS) of Korea (K-ETS), China (C-ETS), and Japan (J-ETS). The J-ETS is currently voluntary, but that will likely change after 2026 and is therefore incorporated in the baseline.
FTT is also calibrated but not to an external projection. Instead, it is calibrated to the technology diffusion trajectory of the last few years to meet the diffusion trajectory of the first few years of the simulation. FTT also simulates technology diffusion in the baseline in the absence of additional policies as a continuation of trends found in recent history. FTT:Steel and FTT:Power are of particular interest. Technology diffusion trends in the ISI are fairly static and homogeneous [24], so without incentives, a status quo can be expected. However, the scenario in the power sector differs; renewable energy sources have become cost competitive with conventional fossil fuel power generation. Especially in China, recent year-on-year growth in renewables has been remarkable. FTT:Power simulates a continuation of these trends, which will lead to high levels of renewables.

2.5. Policy Scenarios

In this study, we attempt to achieve large-scale decarbonization of the ISI in China, Korea, and Japan by exposing the simulation model to three policy scenarios. The first scenario (S1) seeks to support low-carbon steelmaking technologies through subsidies and energy rebates. It includes a carbon tax on the industry, where carbon tax revenues from the ISI are used to finance the policies. In the second scenario (S2), we impose phase-out regulations on carbon-intensive processes and the same subsidies as in S1, but this time they are financed by raising other non-environmental fiscal rates, such as VAT, income tax, and employers’ social security contributions. In the third scenario (S3), we combine the phase-out regulations and subsidies. Like S1, the policy costs are financed through a tax on carbon-intensive steelmaking processes. The policy levers are summarized in Table 2 and the scenarios in Table 3.
The subsidy rates applied to the upfront capital cost of hydrogen-based steelmaking and hydrogen consumption are high. Subsidy rates on upfront investments can be interpreted as public investment in low-carbon steelmaking capacity. This (partially) shifts the risk from the ISI to the government. Subsidies, or public investments, for low-carbon steelmaking are not unheard of. The Swedish Energy Agency has invested in the HYBRIT project to support the development of a large-scale hydrogen-based demonstration plant [15].
Policy scenarios seek to promote the use of hydrogen, electricity, or abated fossil-fuel processes to replace incumbent emission-intensive processes. Here, we assume that all hydrogen production involves low-carbon hydrogen originating from electrolysis. Therefore, both hydrogen production and direct electricity use within the ISI will have consequences for the power sector, and this can potentially lead to an increase in indirect emissions due to a transition in the ISI. To mitigate this, the power sector is exposed to policies to facilitate a transition to low-carbon electricity production that is applied in tandem to all policy scenarios. These policy packages are based on those of Lee et al. [47], who apply policy packages to simulate the decarbonization of the power sector in Japan. Here, we extend their policies to China and Korea (Table 4).
Figure 2 illustrates the projections for carbon prices and taxes. Country-specific ETS prices apply to all scenarios, including the reference (S0), while the carbon tax applies to S1 and S3 only and is the same for each country.

2.6. Scenario Assumptions

Many of the low-carbon steelmaking alternatives are still in the development phase, meaning that there is a need for assumptions on when such technologies will become commercially available. We follow the assumption of the IEA’s Stated Policies Scenario that the commercial availability of hydrogen-based steelmaking will be achieved by 2026 [4]. CCUS is also assumed to be available from 2026. Further, CO2 capture rates are assumed to be 90%. Electrolysis is expected to be further away from commercialization and is only added as an option from 2035 onwards. In FTT:Steel, once technology pathways are deemed to have reached the commercialization phase, exogenous market share additions are mixed in the simulation results. See Appendix A.4.
Steel production is not merely about quantity, but also about quality. One of the advantages of the BF–BOF process is its versatility and ability to control quality. As of now, directly reduced iron cannot be used for high quality purposes. We assume that this will change in the future, which means that all technologies can compete freely with each other rather than merely in a couple of segments.

3. Results

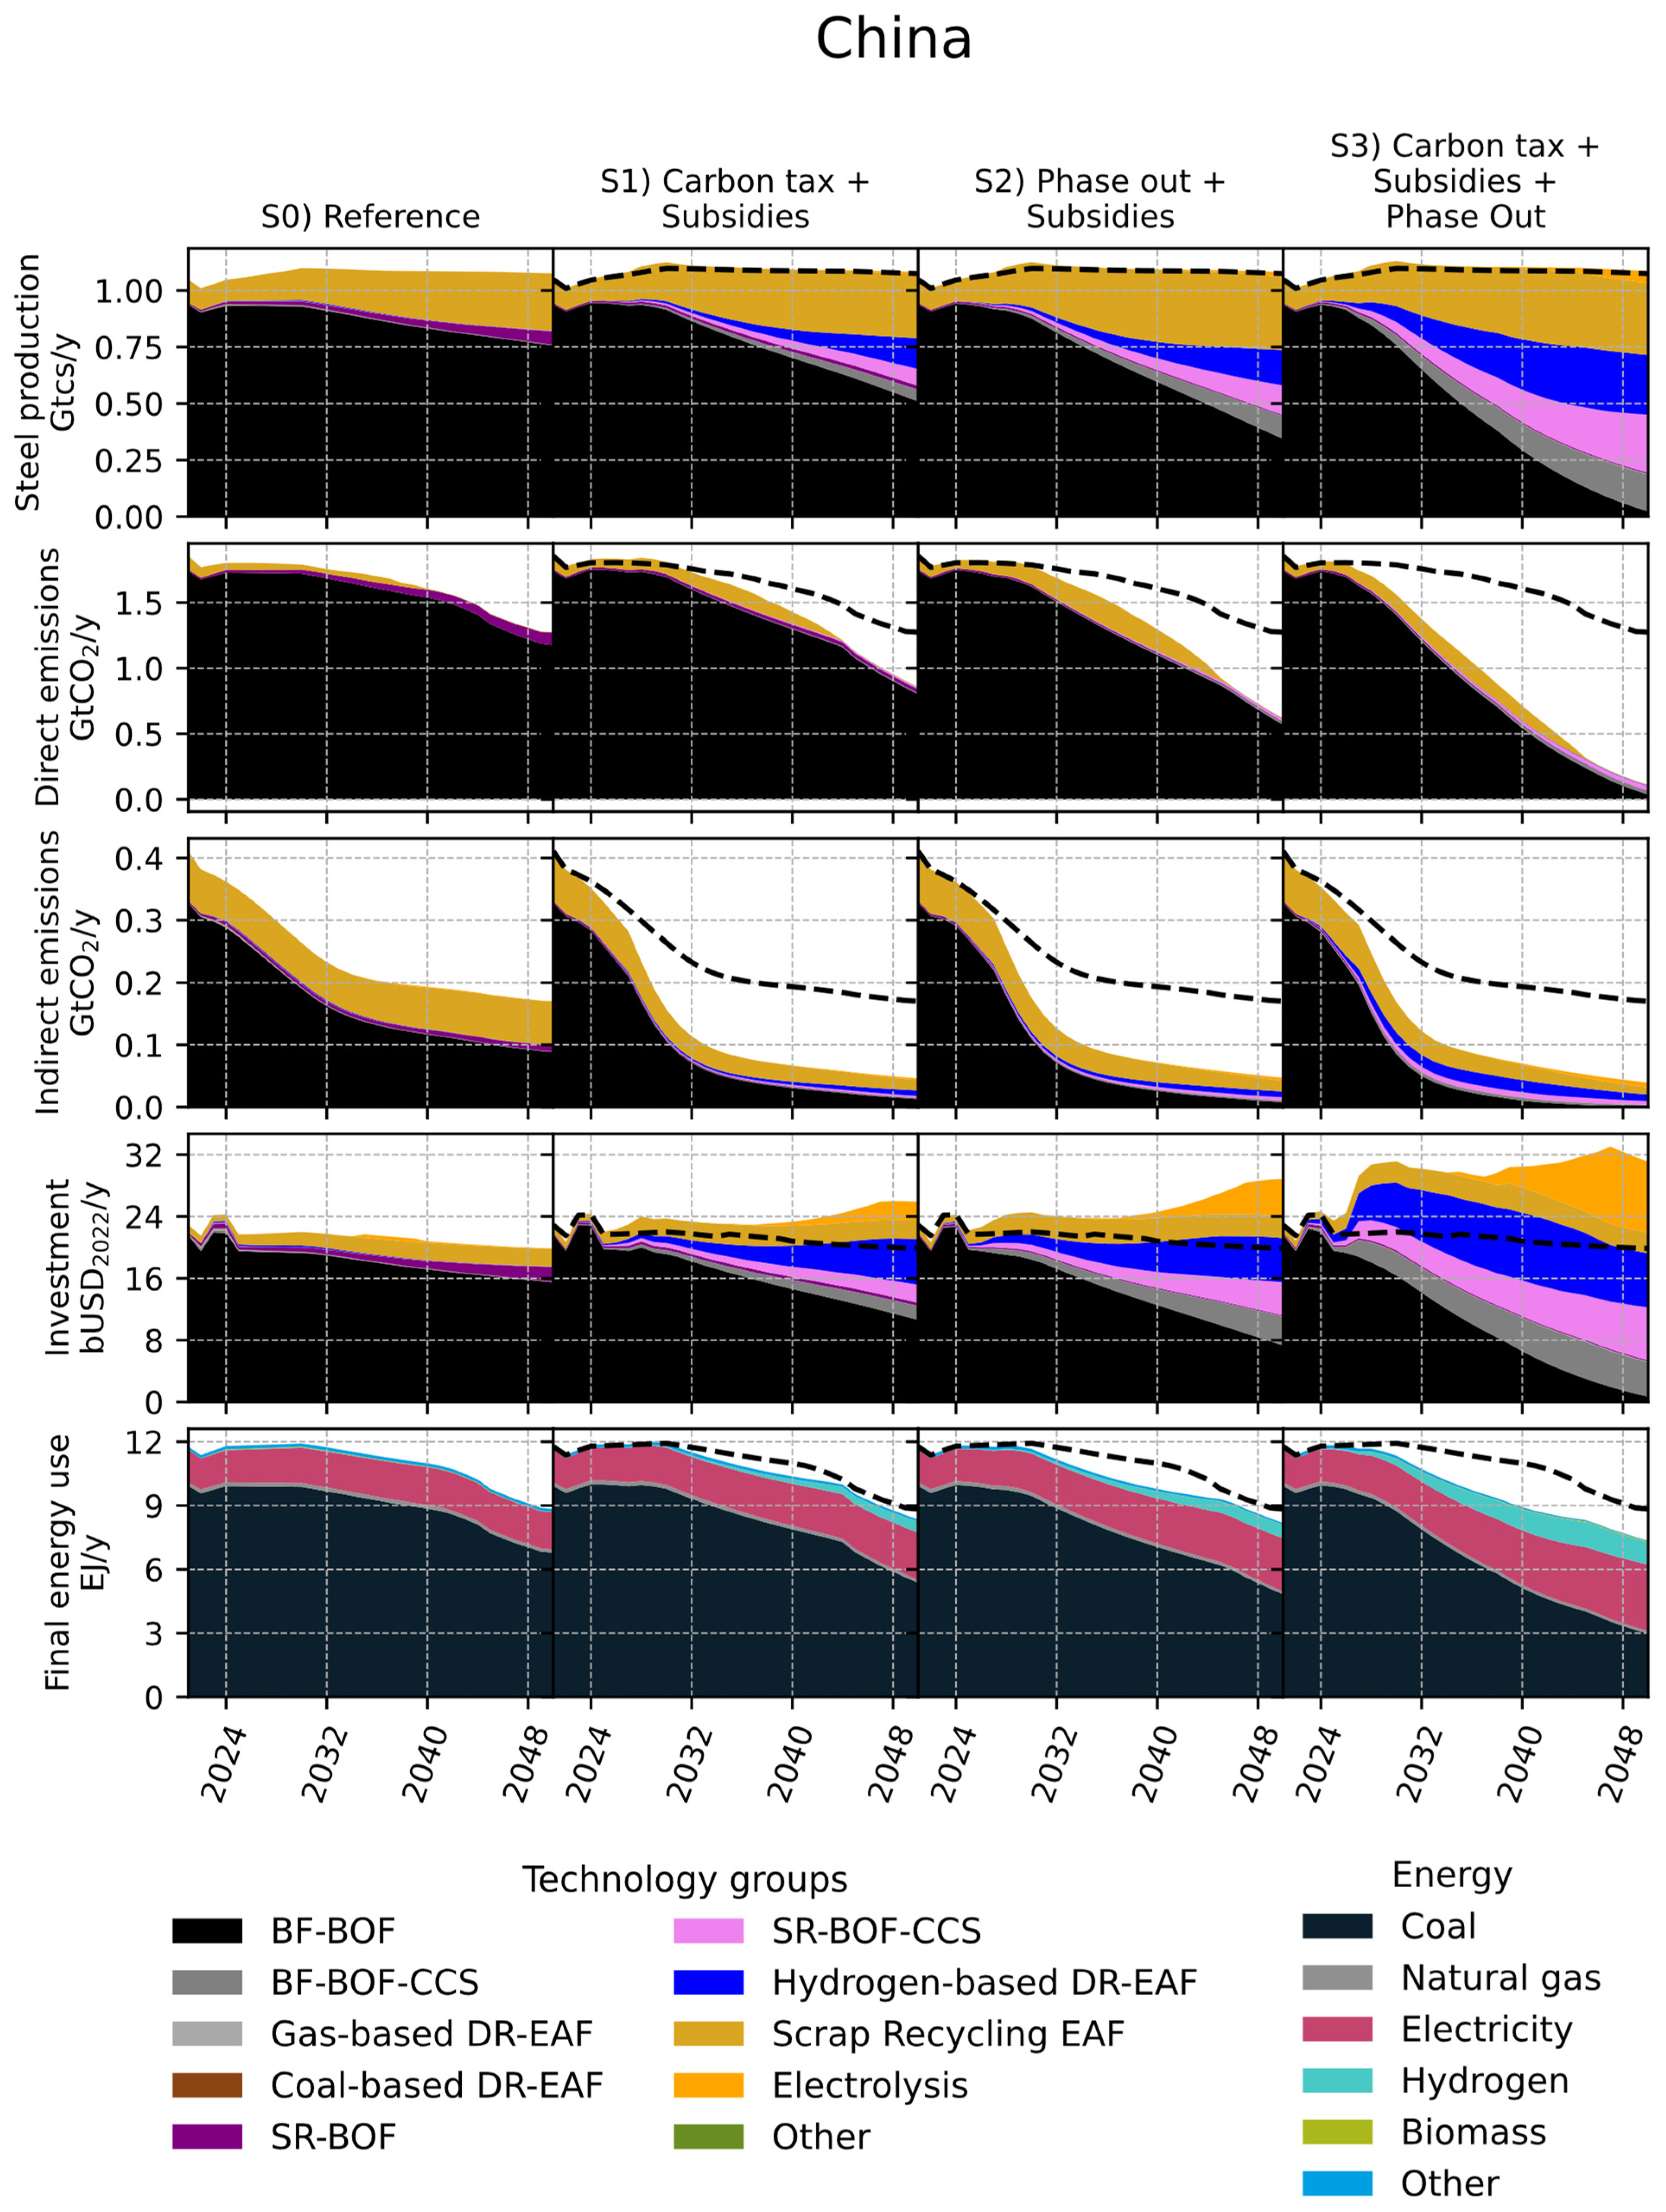
3.1. Technology Diffusion

Figure 3, Figure 4 and Figure 5 demonstrate the outcomes of the scenarios on the variables related to steel technology for China, Japan, and Korea. At the baseline, BF–BOF will likely remain the dominant steelmaking route. Steel recycling has also increased in many countries, particularly Korea. However, the simulations show some meaningful diffusion of alternative low-carbon steelmaking processes due to a lack of incentives. This is reflected in direct emissions profiles that decrease somewhat in each country between 2022 and 2015—by 28% in China, 36% in Japan, and 11% in Korea—owing to natural diffusion. Indirect emissions also decrease despite the increase in scrap recycling, which is driven by natural diffusion in the power sector (see Figure S1 for the technology configuration in the power sector and Figure S2 for the grid emission factors).
This changes somewhat once low-carbon alternatives are supported and a carbon tax is implemented (second column of Figure 3, Figure 4 and Figure 5). These subsidies promote the diffusion of low-carbon steelmaking alternatives, particularly in Korea. The effects are less pronounced in China and Japan because both countries are more reliant on the BF–BOF route for steel production and therefore struggle to escape technology lock-in, despite the additional tax on BF–BOF and other carbon-intensive technologies. The effect of LCOS policies is illustrated in Figure S3. However, the small effect does help to further decrease direct emissions. Indirect emissions drop to near-zero as the power sectors in each country are decarbonized. Supporting a small transition to low-carbon steelmaking does invoke additional investments compared with the reference scenario. Ultimately, subsidies alone do not force a transition. Hence, phase-out regulations are more powerful in China and Japan as they force a shift away from BF–BOF, whereas in Korea, the rate of decline is marginally higher (see the third column of Figure 3, Figure 4 and Figure 5). Together with the subsidies, the transition is directed toward low-carbon alternatives, which are mainly the hydrogen-based direct reduction, steel recycling, and CCS that are applied to alternative smelt reduction technologies.
Adding a carbon tax in addition to the phase-out regulations and subsidies will increase the rate of decline in the incumbent carbon-intensive processes (see the fourth column of Figure 3, Figure 4 and Figure 5). As in the previous scenario, this forces a transition from the BF–BOF route through phase-out regulations and directs it toward low-carbon alternatives. The combined effect of subsidies on low-carbon alternatives and the carbon tax on carbon-intensive incumbent technologies accelerates the rate of decline of BF–BOF due to premature replacements, and therefore outpaces the natural rate of decline. By 2050, the model simulates that 26%, 20%, and 10% of steel production in China, Japan, and Korea, respectively, will be hydrogen-based. The remainder will involve CCS applications or steel recycling. Only a minute number of residual carbon-intensive processes will remain. This large-scale transition achieves near-zero decarbonization in terms of both direct and indirect emissions. However, more investment is required to construct low-carbon steelmaking capacity, which has further implications for the rest of the economy.

3.2. Environmental Impact

The effects of policies on technological diffusion have implications for both direct and indirect emissions. As hydrogen-based steelmaking, steel recycling, and CCS applications are incorporated into the system, a decline in direct emissions can be observed in all three countries. However, these technologies require more electricity and therefore indirect emissions occur at the point of power generation (see the second and third rows of Figure 3, Figure 4 and Figure 5 and Table 5).
Indirect emissions decline owing to the implementation of decarbonization policies in the power sector. In China and Korea, under S3 conditions, power sector emissions are net-negative owing to the uptake of BECCS and the removal of most carbon-intensive electricity generation technologies Overall, emissions from both direct and indirect sources are reduced by 90%, 86%, and 91% in China, Japan, and Korea, respectively (Table 5).

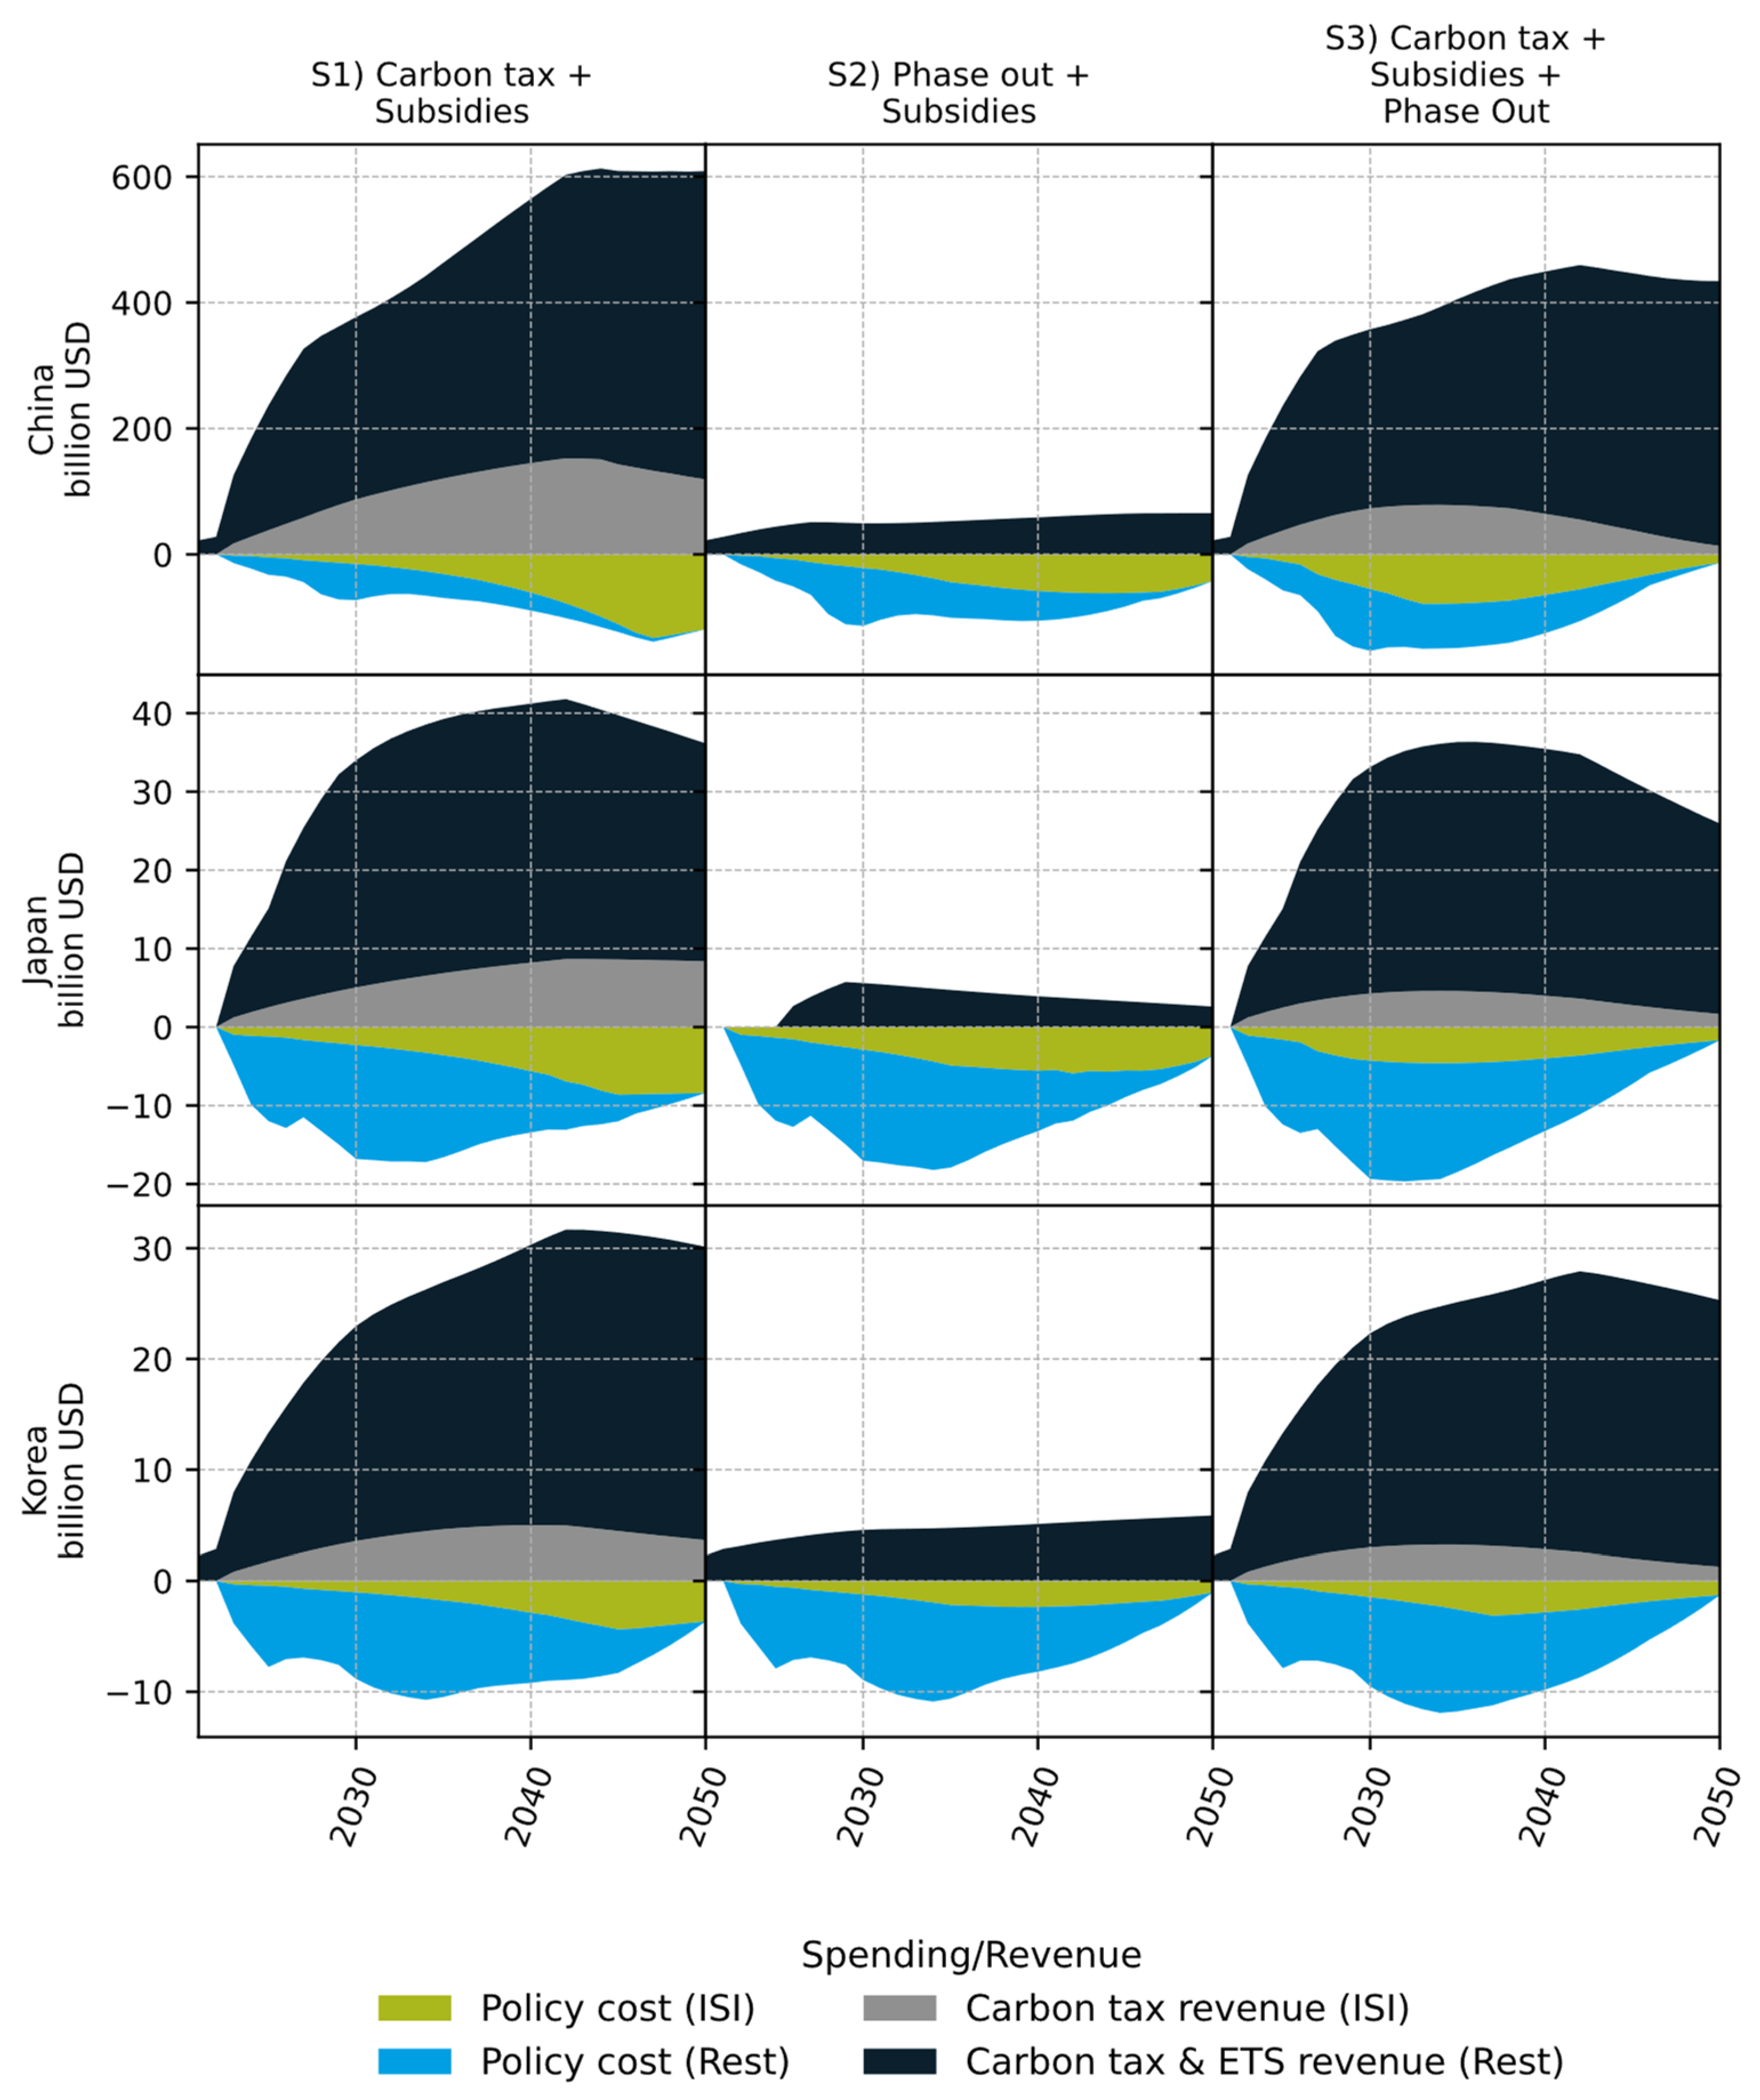
3.3. Economic Impact

Policy packages are ambitious and therefore have various economic consequences. First and foremost, the simulated policies are associated with both costs and revenues for the governments of the countries of interest (Figure 6). The policy costs due to technology transition in the ISI peak when the subsidy rates of and capacity additions to low-carbon steelmaking industries are the highest. Other policy costs are due to policies applied to the power sector. However, owing to the implementation of ETS and the carbon tax (only in S1 and S3), revenues are generated. Carbon tax revenues from the ISI are exclusively used to finance the costs of the policies applied to the ISI. If these revenues are lacking, then subsidies are scaled down. Therefore, policy costs are also less or equal to the carbon tax revenues generated in the ISI. In S2, the ISI is not exposed to a carbon tax and therefore the revenues are solely due to ETS. They are often not enough to cover total policy costs, and the net spending will lead to a response in fiscal tax rates.
Owing to a lack of phase-out regulations, S1 maintains more carbon-intensive processes in the mix, which leads to higher carbon tax revenues from the ISI. Simultaneously, the diffusion rate of subsidized technologies is lower, which leads to lower policy costs in S1 compared with S3 in the short term. This is reversed in the long term as there are still carbon tax revenues to draw on. In S3, large-scale decarbonization leads to lower carbon tax revenues, meaning that higher subsidy rates can be maintained at higher levels in S1 compared to S3.
Second, net policy costs impact non-environmental tax rates such as VAT, income tax, and employers’ social security contributions. All S2 scenarios show elevated tax rates to cover policy costs. Note that, while China and Korea show net policy revenues (Figure 6) due to ETS revenues, tax rates are still increasing (see the fourth row of Figure 7). ETS revenues are also embedded in the baseline scenario. Thus, tax rates are higher when comparing S2 with the baseline scenario.
Third, technological change induced by the policies in the ISI and power sector invoke price changes in electricity and crude steel, which include price feedback between steel and electricity (see the first and second rows of Figure 7). Together with changing tax rates, price levels are also impacted (see the third row of Figure 7). All the scenarios in all three countries show elevated price levels that are mainly driven by higher electricity prices.
The impact on GDP is mostly positive across all scenarios and countries, except for Korea in S2. Higher price levels lead to lower consumer spending, which in turn has a negative impact on GDP (Figure 8). This effect is especially notable in Korea in S2. Simultaneously, some consumer spending is saved owing to higher employment (Figure 9). In addition, all three countries are net importers of coal, and the transitions in the ISI and power sector lower their reliance on coal imports and thereby improve their energy trade balance. The carbon tax also facilitates some energy switching in other sectors. Finally, the transition itself requires extensive investment in new steelmaking and power generation capacity, leading to additional economic activity. In the E3ME model, investments do not per se lead to a full crowding-out effect. However, a caveat here is that the model is agnostic about the availability of finance or the willingness of banks to extend loans [38]. The impact on GDP is mainly driven by investments in new low-carbon technologies, both in the ISI and power sector.
Employment gains are observed across all scenarios for Japan, while Korea only shows net gains in S1 and S3 by 2050. Meanwhile, China does not show net employment gains in any scenario by 2050. Job creation in other sectors is negated by job losses in the coal supply sector (including the “mining and utilities” sector). Employment increases because of the technology transitions in the ISI and power sector, which require more demand from the construction sector. Renewable power generation is also associated with higher employment rates, while low-carbon steelmaking is associated with slightly lower employment due to fewer precursor processes in general [48]. Despite the lower employment factors of low-carbon steelmaking, production levels are slightly elevated, which negates job losses due to technology switching. Further, employment declines in the fossil fuel industries, especially in the coal supply industry. Jobs in the services sector change in line with consumer expenditure, as spending on services often has an onshoring effect on demand and therefore employment.

4. Discussion

As a result of the transition in technology, total emissions from the ISI in China, Japan, and Korea decline between 86% and 91% by 2050 compared with the baseline. We assumed that hydrogen supply is a combination of green hydrogen and imported hydrogen, and consequently does not contribute to the indirect emission profile. This is an important limitation of the study, which requires a follow-up study that uses a realistic hydrogen supply module that can evolve in tandem with hydrogen demand. Future work will focus on including an endogenous representation of the hydrogen supply sector. The scalability of green hydrogen is another limitation that is not considered in this study. Odenweller et al. [49] have found that an expansion in electrolysis capacity will likely undershoot global policy targets until at least 2030.
This study did not consider demand-side policies, as proposed by several studies [50,51], to (e.g.,) reduce the steel content in steel containing products, nor was material substitution included. Such measures could also facilitate decarbonization. According to IEA estimates, demand-side policies could contribute ~40% of the cumulative emission reductions [52].
Financing the policy costs has different repercussions on the outcomes. Financing the policy costs by adjusting non-environmental tax rates (S2) leads to higher price levels, which could affect lower income households disproportionally. Despite this, the impact of S2 is positive in China and Japan. Financing the policy costs through carbon tax revenues from the ISI leads to positive macro-economic results.
The FTT:Steel simulations show similar technology diffusion trajectories under the most stringent policy scenario as the other studies, albeit in slightly different compositions. Compared with a report by the Korea Advanced Institute of Science and Technology, our results for Korea show greater uptake of scrap recycling and less hydrogen-based DR-EAF [21]. For China, our simulations show lower uptake of scrap recycling via the EAF compared with several other studies (e.g., [19,20]). The trade-off between hydrogen-based steelmaking and recycling is likely caused by the different methodology and the policy formulation.

5. Conclusions

Based on the policy simulations shown in this paper, it can be concluded that a combination of support for policies that favour low-carbon technologies and penalizing policies that favour carbon-intensive technologies is a necessity to achieve large-scale decarbonization of the ISI. Supporting the relevant policies will help low-carbon technologies to diffuse into the system; however, they will not crowd-out carbon-intensive processes. Penalizing policies will make carbon-intensive processes less attractive and incentivize a transition to low-carbon alternatives, but they do not create a critical mass for low-carbon capacity on their own.
Simultaneously, decarbonization of the ISI does not, per se, have to lead to negative economic impacts. The scenario with the greatest level of decarbonization shows positive macro-economic results in all three countries. This is driven by the investments required to achieve the transition, and through the implicit multiplier effect. Both lead to job creation. Of course, there are clear winners and losers in a transition as depicted in this study. The coal mining industry in China employs many people and, owing to lower domestic demand for coal, these jobs will likely disappear. Meanwhile, electrification creates jobs in the power sector and the additional power capacity together with new low-carbon steelmaking capacity will lead to job creation in the construction and manufacturing sectors.

Supplementary Materials

The following supporting information can be downloaded at: https://www.mdpi.com/article/10.3390/en16114498/s1, Table S1: Steel production by each pathway included in FTT:Steel. In Mtcs/y; Table S2: Employment by technology in thousand FTE; Figure S1: Technology diffusion in the power sector in each country and scenario; Figure S2: Power grid emission factors for each country and scenario; Figure S3: Levelized cost of crude steel (LCOS) for selected technologies in each country and scenario.

Author Contributions

Conceptualization, P.V., X.H., W.Z., Y.C., J.P. and S.L.; methodology, P.V., J.P., Y.C. and S.L.; software, P.V.; formal analysis, P.V.; investigation, X.H., W.Z., Y.C. and S.L.; resources, S.L.; data curation, P.V., X.H., W.Z. and Y.C.; writing—original draft preparation, P.V., X.H., W.Z., Y.C. and J.P.; writing—review and editing, W.Z., Y.C., J.P. and S.L.; visualization, P.V.; supervision, Y.C., J.P. and S.L.; funding acquisition, S.L. All authors have read and agreed to the published version of the manuscript.

Funding

This research was funded by the Asia Research Project of Meijo University.

Data Availability Statement

Historical macro-economic data and exogenous projections used to develop econometric relationships in E3ME originate from various sources. See the Technical Manual for an overview [23]. The datasets behind FTT:Steel were compiled from various sources. Historical production mostly relies on the Steel Statistical Yearbooks published by the World Steel Association, available at https://worldsteel.org/steel-topics/statistics/steel-statistical-yearbook/, accessed on 2 February 2023. The technology cost dataset was compiled from various sources and the compiled dataset can be made available upon reasonable request. An overview is provided at https://www.researchgate.net/publication/348845183_Decarbonising_The_East_Asian_Iron_and_Steel_Sector_In_2050_An_Analysis_Performed_By_E3ME-FTTSteel, accessed on 23 August 2022. The models (E3ME and FTT:Steel) used in this study are operated and owned by Cambridge Econometrics and therefore not publicly available. However, the code base of FTT:Steel will be made available as a stand-alone model in the near future.

Conflicts of Interest

The authors declare no conflict of interest.

Appendix A. Mathematical Framework of E3ME-FTT:Steel

Appendix A.1. Investor Preferences

Investor preferences for iron- and steel-making pathways are based on levelized cost of steel (LCOS) estimates. The LCOS includes all cost components over a project’s lead- and lifetime. Building on a dataset of cost components, the LCOS is estimated using Equation (A1).
L C O S = 0 τ I C t C F + O M t + F C t + C O 2 T t 1 + r t 0 τ 1 1 + r t
where IC is the upfront investment cost, CF is the capacity factor, OM is the operation and maintenance costs, FC is the fuel costs, CO2T is the CO2 costs (due to policies), r is the discount rate, τ is the total project lifetime plus the lead time, and t is the time iterator.
Most of the variables in the cost category are distributions, so the LCOS is also distributed. This highlights the way in which, as local conditions vary, the exact LCOS cannot be known. Furthermore, future developments cannot be known precisely, such as fuel or policy costs. Building on these distributed LCOS estimates, we compare all technologies on a pair-wise basis to establish a binary logit. The binary logit represents investor preferences for one technology over another. Investor preference is expressed in Equation (A2).
F i j = 1 1 + e C i j / s d F i j 2 ,
where Fij represents investor preference, C i j represents the difference of the means of the LCOS of technology i and technology j, and s d F i j 2 represents the standard deviation of investor preferences and is established via the error propogation of the standard deviations of the LCOS of both technologies. Fij is a value between 0 and 1, and describes the likelihood of a heterogeneous group of investors favouring technology i over technology j. The reverse (Fji) is then equal to 1 − Fij.

Appendix A.2. End-of-Lifetime Technology Substitution

Investor preferences, together with substitution frequencies and lagged market shares, determine the new market share through competition. The substitution of market share from technology j to technology i is proportional to the lagged market share of i divided by the lead time of i, which represents how quickly technology i can be expanded; the lagged market share of j divided by the lifetime of j, which represents how fast technology j depreciates; and investor preference in favour of i. This is presented in Equation (A3), and the reverse path is expressed by Equation (A4).
S j i S i B T i · S j L T j · F i j · t ,
S i j S j B T j · S i L T i · F j i · t ,
where S i j represents the change in market share from i to j, S represents the respective market shares of the previous time iteration, F represents investor preferences, BT represents build time, LT represents the lifetime, and ∆t is the time step. The change in the total market share can be established by combing Equations (A3) and (A4) and summing all possible alternative technologies; see Equation (A5).
j S j i = S i = j S i S j · F i j A i j F j i A j i · t ,
where matrix A represents the substitution frequencies as a function of lifetimes and lead time.

Appendix A.3. Premature Technology Substitution

The Equations shown so far depict end-of-lifetime replacements. Premature replacements are also possible and are included in the simulations. The treatment of premature scrappage is based on Knobloch et al. (2021) [41]. We take the differentials of the marginal (or running) costs (MC) of an incumbent technology j and an alternative technology i.
M C i = O M i t + F C i t + C O 2 T i t ,
where MC is the marginal costs.
If the investment cost of the alternative technology divided by the marginal cost differential is less than the pay-back threshold (assumed to be 5 years), then premature scrappage is possible. Premature replacement can occur if the difference in MC over the payback threshold period between incumbent technology j and alternative technology i is greater than or equal to the investment costs of alternative technology i. This relationship is expressed by Equation (A7).
t = 0 P B 0 M C j M C i I C i C F i ,
where PB0 is the threshold of the payback period.
Using this relationship, we estimate the payback costs (PBC) of alternative technology i as the marginal and investment costs. See Equation (A8).
P B C i = I C i C F i · P B 0 + M C i ,
where PBC is the estimated total payback costs.
The likelihood of investors scrapping incumbent technology prematurely can be expressed as a binary logit, as shown in Equation (A9), by evaluating the difference between PBCi (of the alternative technology) and MCj (of the incumbent technology).
F E i j = 1 1 + e C E i j / s d F E i j 2 ,
where FEij represents investor preference to prematurely scrap technology j for technology i; ∆CEij represents the difference between the PBC of alternative technology i and the MC of incumbent technology j; and sdFEij represents the uncertainty parameter based on the standard deviations of PBCi and MCj, each formed through the propagation of error of the respective input parameters.
In the case of premature scrappage, investors are not forced to pick one over the other, so the relationship FEji = 1 − FEij is not required owing to the asymmetry of ∆CEij ≠ ∆CEjj. Investors can decide not to scrap technology prematurely, which is the likely outcome in the ISI due to the high upfront costs.
Finally, the scrappage rate is determined. This is the frequency at which steelmakers make decisions regarding premature scrappage. This is assumed to be once every six years, as it is unlikely that steel firms will swap their existing capacities with a new capacity before at least some investments are recovered. The capacities that are replaced after reaching their end-of-life status are subtracted from the scrappage decision frequency. See Equation (A10).
1 δ i = 1 β i 1 L T i ,
where 1 / δ i is the scrappage rate, 1 / β i is the scrappage decision frequency, and 1 / L T i is the end-of-life replacement frequency.
Next, we set up another Lotka–Volterra Equation (A11) to describe premature substitutions.
j S E j i = S E i = j S i S j · F E i j A i j δ j 1 F E j i A j i δ i 1 · t .

Appendix A.4. Innovator Effect

Many novel low-carbon steelmaking technologies have been proposed to aid decarbonization of the ISI. Only a small number are currently commercially available. The design of Equations (A5) and (A11) only allows technology substitution between technologies with non-zero market shares. Exogenous market share additions of novel technologies are included at the chosen year of commercialization, and this follows a similar logic as the “innovator effect” found in Bass diffusion models [53]. The innovator effect is slowly phased out once a 25% market share is achieved. See Equation (A12).
S i E X = R · 0.25 S i i f S i < 0.25 0 i f S i 0.25
where S i E X represents the exogenous market share addition and R is the chosen market share growth rate.
If exogenous market shares are included, then other technologies are removed proportionally to their pre-existing market shares so that the sum equals to zero.

Appendix A.5. Market Share Dynamics

Finally, we can combine Equations (A5), (A11), and (A12) to determine the new market share levels. See Equation (A13).
S i = S i t 1 + S i + S E i + S i E X

References

  1. Ministry of Economy Trade and Industry Technology Roadmap for “Transition Finance” in Iron and Steel Sector. Available online: https://www.meti.go.jp/policy/energy_environment/global_warming/transition/transition_finance_technology_roadmap_iron_and_steel_eng.pdf (accessed on 16 September 2022).
  2. Yin, R.; Liu, Z.; Shangguan, F. Thoughts on the Implementation Path to a Carbon Peak and Carbon Neutrality in China’s Steel Industry. Engineering 2021, 7, 1680–1683. [Google Scholar] [CrossRef]
  3. Korea Institute for Industrial Economics & Trade. Strategies and Policy Tasks for Carbon Neutralization in the Steel Industry. 2022. Available online: https://www.kiet.re.kr/research/paperView?paper_no=774&skey=&sval= (accessed on 16 September 2022).
  4. Zhu, Z. Iron and Steel Technology Roadmap; International Energy Agency: Paris, France, 2022. [Google Scholar]
  5. Xylia, M.; Silveira, S.; Duerinck, J.; Meinke-Hubeny, F. Weighing Regional Scrap Availability in Global Pathways for Steel Production Processes. Energy Effic. 2018, 11, 1135–1159. [Google Scholar] [CrossRef] [Green Version]
  6. Morfeldt, J.; Nijs, W.; Silveira, S. The Impact of Climate Targets on Future Steel Production—An Analysis Based on a Global Energy System Model. J. Clean. Prod. 2015, 103, 469–482. [Google Scholar] [CrossRef]
  7. Vaughan, A. Most Major Carbon Capture and Storage Projects Haven’t Met Targets. Available online: https://www.newscientist.com/article/2336018-most-major-carbon-capture-and-storage-projects-havent-met-targets/ (accessed on 23 May 2023).
  8. Reiner, D.M. Learning through a Portfolio of Carbon Capture and Storage Demonstration Projects. Nat. Energy 2016, 1, 15011. [Google Scholar] [CrossRef] [Green Version]
  9. Hauser, A.; Wolf-Zoellner, P.; Haag, S.; Dettori, S.; Tang, X.; Mighani, M.; Matino, I.; Mocci, C.; Colla, V.; Kolb, S.; et al. Valorizing Steelworks Gases by Coupling Novel Methane and Methanol Synthesis Reactors with an Economic Hybrid Model Predictive Controller. Metals 2022, 12, 1023. [Google Scholar] [CrossRef]
  10. International Energy Agency. Energy Technology Perspectives 2023; International Energy Agency: Paris, France, 2023. [Google Scholar]
  11. Intergovernmental Panel on Climate Change. Mitigation of Climate Change Climate Change 2022 Working Group III Contribution to the Sixth Assessment Report of the Intergovernmental Panel on Climate Change; Intergovernmental Panel on Climate Change: Geneva, Switzerland, 2022; ISBN 9789291691609. [Google Scholar]
  12. Gielen, D.; Saygin, D.; Taibi, E.; Birat, J.-P. Renewables-Based Decarbonization and Relocation of Iron and Steel Making: A Case Study. J. Ind. Ecol. 2020, 24, 1113–1125. [Google Scholar] [CrossRef]
  13. Ren, L.; Zhou, S.; Peng, T.; Ou, X. A Review of CO2 Emissions Reduction Technologies and Low-Carbon Development in the Iron and Steel Industry Focusing on China. Renew. Sustain. Energy Rev. 2021, 143, 110846. [Google Scholar] [CrossRef]
  14. Muslemani, H.; Liang, X.; Kaesehage, K.; Ascui, F.; Wilson, J. Opportunities and Challenges for Decarbonizing Steel Production by Creating Markets for ‘Green Steel’ Products. J. Clean. Prod. 2021, 315, 128127. [Google Scholar] [CrossRef]
  15. Kushnir, D.; Hansen, T.; Vogl, V.; Åhman, M. Adopting Hydrogen Direct Reduction for the Swedish Steel Industry: A Technological Innovation System (TIS) Study. J. Clean. Prod. 2020, 242, 118185. [Google Scholar] [CrossRef]
  16. International Energy Agency. Hydrogen Projects Database. Available online: https://www.iea.org/data-and-statistics/data-product/hydrogen-projects-database#license (accessed on 27 January 2023).
  17. Kim, J.; Sovacool, B.K.; Bazilian, M.; Griffiths, S.; Lee, J.; Yang, M.; Lee, J. Decarbonizing the Iron and Steel Industry: A Systematic Review of Sociotechnical Systems, Technological Innovations, and Policy Options. Energy Res. Soc. Sci. 2022, 89, 102565. [Google Scholar] [CrossRef]
  18. Li, Z.; Dai, H.; Song, J.; Sun, L.; Geng, Y.; Lu, K.; Hanaoka, T. Assessment of the Carbon Emissions Reduction Potential of China’s Iron and Steel Industry Based on a Simulation Analysis. Energy 2019, 183, 279–290. [Google Scholar] [CrossRef]
  19. Ji Chen, A.; Li, S.; Li, X.; Li, Y.; Chen, J. Pursuing Zero-Carbon Steel in China A Critical Pillar to Reach Carbon Neutrality; RMI: Beijing, China, 2021. [Google Scholar]
  20. Van Ruijven, B.J.; Van Vuuren, D.P.; Boskaljon, W.; Neelis, M.L.; Saygin, D.; Patel, M.K. Long-Term Model-Based Projections of Energy Use and CO2 Emissions from the Global Steel and Cement Industries. Resour. Conserv. Recycl. 2016, 112, 15–36. [Google Scholar] [CrossRef] [Green Version]
  21. Korea Advanced Institute of Science and Technology. Steel Sector Pathways for Korea’s 2050 Carbon Neutrality. 2022. Available online: https://forourclimate.org/en/sub/data/view.htmlidx40 (accessed on 10 April 2023).
  22. Mercure, J.-F.; Pollitt, H.; Edwards, N.R.; Holden, P.B.; Chewpreecha, U.; Salas, P.; Lam, A.; Knobloch, F.; Vinuales, J.E. Environmental Impact Assessment for Climate Change Policy with the Simulation-Based Integrated Assessment Model E3ME-FTT-GENIE. Energy Strategy Rev. 2018, 20, 195–208. [Google Scholar] [CrossRef]
  23. Dwesar, I.; Kőműves, Z.; McGovern, M.; Vu, A.; Arsenio, F.; Heald, S.; Chewpreecha, U.; Pollitt, H. E3ME Model Manual; Cambridge Econometrics: Cambridge, UK, 2022. [Google Scholar]
  24. World Steel Association World Steel in Figures 2022. Available online: https://worldsteel.org/steel-topics/statistics/world-steel-in-figures-2022/#world-crude-steel-production-1950-to-2021 (accessed on 2 February 2023).
  25. Nikkei Asia China’s Steelmakers Get 5 More Years to Reach Peak Carbon Output. Available online: https://asia.nikkei.com/Spotlight/Caixin/China-s-steelmakers-get-5-more-years-to-reach-peak-carbon-output (accessed on 30 September 2022).
  26. Institute for Energy Economics and Financial Analysis China’s Peak Steel Emissions Shift Unlikely to Delay Carbon Reductions. Available online: https://ieefa.org/resources/ieefa-chinas-peak-steel-emissions-shift-unlikely-delay-carbon-reductions (accessed on 20 September 2022).
  27. Global Times China Counts on New Technology to Decarbonize Steel Production. Available online: https://www.globaltimes.cn/page/202203/1257298.shtml (accessed on 20 September 2022).
  28. China Iron and Steel Association Industry Yearbook. Available online: http://english.chinaisa.org.cn/do/cn.org.chinaisa.view.Column.d?column=3 (accessed on 12 November 2022).
  29. Nakano, J. China Unveils Its First Long-Term Hydrogen Plan. Available online: https://www.csis.org/analysis/china-unveils-its-first-long-term-hydrogen-plan (accessed on 27 September 2022).
  30. State Council The People’s Republic of China China’s Steel Sector Aims for High-Quality Growth. Available online: https://english.www.gov.cn/statecouncil/ministries/202202/07/content_WS620112a6c6d09c94e48a4cd4.html (accessed on 20 September 2022).
  31. The Japan Iron & Steel Federation. JISF Long-Term Vision for Climate Change Mitigation: A Challenge towards Zero-Carbon Steel; The Japan Iron & Steel Federation: Tokyo, Japan, 2019. [Google Scholar]
  32. Vercoulen, P.; Lee, S.; Suk, S.; He, Y.; Fujikawa, K.; Mercure, J.-F. Policies to Decarbonize the Steel Industry in East Asia. In Energy, Environmental and Economic Sustainability in East Asia: Policies and Institutional Reforms; Lee, S., Pollitt, H., Fujikawa, K., Eds.; Routledge: London, UK, 2019; ISBN 9781351013468. [Google Scholar]
  33. Korea Iron and Steel Association Korean Steel Market. Proceedings of the 86th Session of the Steel Committee, 25–26 March 2019; Available online: https://www.oecd.org/sti/ind/86th%20Steel%20Committee%20meeting%20%20Presentation%20by%20KISA,%20Korean%20Steel%20Market.pdf (accessed on 6 November 2022).
  34. POSCO GROUP 2050 Carbon Neutrality Declaration. Available online: https://www.posco.co.kr/brochure/en/02_Vision_05.html (accessed on 20 February 2023).
  35. Stangarone, T. South Korea’s Hydrogen Industrial Strategy. Clean Technol Env. Policy 2021, 23, 509–516. [Google Scholar] [CrossRef] [PubMed]
  36. Cha, B.; Green, R. Korean Hydrogen Market Update; Australian Trade and Investment Commission: Sydney, Australia, 2022. [Google Scholar]
  37. Li, T.Y. Korea Unveils Steel Plan, Eyes Low-Carbon Project Fund|Argus Media. Available online: https://www.argusmedia.com/en/news/2421608-korea-unveils-steel-plan-eyes-lowcarbon-project-fund (accessed on 23 April 2023).
  38. Pollitt, H.; Mercure, J.-F. The Role of Money and the Financial Sector in Energy-Economy Models Used for Assessing Climate and Energy Policy. Clim. Policy 2018, 18, 184–197. [Google Scholar] [CrossRef] [Green Version]
  39. Mercure, J.-F. FTT:Power: A Global Model of the Power Sector with Induced Technological Change and Natural Resource Depletion. Energy Policy 2012, 48, 799–811. [Google Scholar] [CrossRef] [Green Version]
  40. Mercure, J.-F.; Lam, A. The Effectiveness of Policy on Consumer Choices for Private Road Passenger Transport Emissions Reductions in Six Major Economies. Environ. Res. Lett. 2015, 10, 064008. [Google Scholar] [CrossRef]
  41. Knobloch, F.; Pollitt, H.; Chewpreecha, U.; Lewney, R.; Huijbregts, M.A.J.; Mercure, J.F. FTT:Heat—A Simulation Model for Technological Change in the European Residential Heating Sector. Energy Policy 2021, 153, 112249. [Google Scholar] [CrossRef]
  42. Mercure, J.-F. An Age Structured Demographic Theory of Technological Change. J. Evol. Econ. 2015, 25, 787–820. [Google Scholar] [CrossRef] [Green Version]
  43. Pauliuk, S.; Milford, R.L.; Müller, D.B.; Allwood, J.M. The Steel Scrap Age. Environ. Sci. Technol. 2013, 47, 3448–3454. [Google Scholar] [CrossRef] [Green Version]
  44. Karali, N.; Park, Y.; Mcneil, M.A. Using Learning Curves on Energy-Efficient Technologies to Estimate Future Energy Savings and Emission Reduction Potentials in the U.S. Iron and Steel Industry; International Energy Studies Group, Energy Analysis and Environmental Impacts Division, Berkeley National Laboratory: Berkeley, CA, USA, 2015. [Google Scholar]
  45. Saba, S.M.; Müller, M.; Robinius, M.; Stolten, D. The Investment Costs of Electrolysis—A Comparison of Cost Studies from the Past 30 Years. Int. J. Hydrog. Energy 2018, 43, 1209–1223. [Google Scholar] [CrossRef]
  46. Schoots, K.; Ferioli, F.; Kramer, G.J.; van der Zwaan, B.C.C. Learning Curves for Hydrogen Production Technology: An Assessment of Observed Cost Reductions. Int. J. Hydrog. Energy 2008, 33, 2630–2645. [Google Scholar] [CrossRef]
  47. Lee, S.; He, Y.; Suk, S.; Morotomi, T.; Chewpreecha, U. Impact on the Power Mix and Economy of Japan under a 2050 Carbon-Neutral Scenario: Analysis Using the E3ME Macro-Econometric Model. Clim. Policy 2022, 22, 823–833. [Google Scholar] [CrossRef]
  48. Vercoulen, P.; Markkanen, S. Technology, Employment, and Climate Change Mitigation: Modelling the Iron and Steel Industry. Technical Report; The University of Cambridge Institute for Sustainability Leadership (CISL): Cambridge, UK, 2020. [Google Scholar]
  49. Odenweller, A.; Ueckerdt, F.; Nemet, G.F.; Jensterle, M.; Luderer, G. Probabilistic Feasibility Space of Scaling up Green Hydrogen Supply. Nat. Energy 2022, 7, 854–865. [Google Scholar] [CrossRef]
  50. Wang, P.; Ryberg, M.; Yang, Y.; Feng, K.; Kara, S.; Hauschild, M.; Chen, W.-Q. Efficiency Stagnation in Global Steel Production Urges Joint Supply- and Demand-Side Mitigation Efforts. Nat. Commun. 2021, 12, 2066. [Google Scholar] [CrossRef]
  51. Allwood, J.M.; Ashby, M.F.; Gutowski, T.G.; Worrell, E. Material Efficiency: A White Paper. Resour. Conserv. Recycl. 2011, 55, 362–381. [Google Scholar] [CrossRef]
  52. International Energy Agency. Iron and Steel Technology: Roadmap Towards More Sustainable Steelmaking; International Energy Agency: Paris, France, 2020. [Google Scholar]
  53. Bass, F.M. A New Product Growth for Model Consumer Durables. Manag. Sci. 1969, 15, 215–227. [Google Scholar] [CrossRef]
Figure 1. Overview of the energy/material flow and interconnections between processes. Carbon capture and storage and bio-based options are not shown.
Energies 16 04498 g001
Figure 2. Projection of carbon penalties (emission trading schemes’ prices and carbon tax) used in the scenarios. Chinese ETS (C-ETS), Japanese ETS (J-ETS), and Korean ETS (K-ETS).
Energies 16 04498 g002
Figure 3. Overview of technology deployment (first row), direct emissions (second row), indirect emissions (third row), upfront investment in new capacity and depreciation (fourth row), and final energy use (fifth row) in China for each scenario (by columns).
Energies 16 04498 g003
Figure 4. Overview of technology deployment (first row), direct emissions (second row), indirect emissions (third row), upfront investment in new capacity and depreciation (fourth row), and final energy use (fifth row) in Japan for each scenario (by columns).
Energies 16 04498 g004
Figure 5. Overview of technology deployment (first row), direct emissions (second row), indirect emissions (third row), upfront investment in new capacity and depreciation (fourth row), and final energy use (fifth row) in Korea for each scenario (by columns).
Energies 16 04498 g005
Figure 6. Policy costs (negative values) and revenues (positive values).
Energies 16 04498 g006
Figure 7. The development of electricity prices, steel prices, overall price levels, and subsidy rates on hydrogen-based steelmaking in China, Japan, and Korea. All the panels show changes (%) from the baseline.
Energies 16 04498 g007
Figure 8. GDP and its components by scenario for China, Japan, and Korea compared with the baseline.
Energies 16 04498 g008
Figure 9. Absolute employment differences for each scenario by country compared to the baseline.
Energies 16 04498 g009
Table 1. Technology learning rates of important steel making technologies.
Steelmaking PathwayAssumed Learning RateComment
BF–BOF3%Mature
CCS applications6–8%Configuration is not very different from BF–BOF.
DR–gas/coal3%In the commercialization phase (mainly in regions other than China, Korea, and Japan).
SR–BOF4%In the commercialization phase. Configuration is somewhat similar to BF–BOF.
Advanced SR–BOF6%Early phase of commercialization. Configuration is somewhat similar to BF–BOF. Increased learning rate due to the early phase of commercialization.
DR–H2–EAF12%Novel; being developed in Sweden. Similar to DR–gas–EAF, but higher learning rate due to electrolysis.
Electrolysis15%In the research phase; a higher learning rate is assumed.
Scrap–EAF3%Mature.
Note: blast furnace (BF), carbon capture and storage (CCS), smelt reduction (SR), direct reduction (DR), basic oxygen furnace (BOF), and electric arc furnace (EAF) Sources: Karali et al. [44] and Schoots et al. [46].
Table 2. Description of policy levers.
PolicyDescription
SubsidiesOn upfront investment: 35% on all CCS applications, 30% on all bio-based applications, 80% on hydrogen-based direct reduction, 50% on electrolysis, and 35% on scrap recycling.
Energy rebates: 50% on hydrogen and 10% on electricity.
All subsidies are implemented from 2023. Where applicable, subsidies are adjusted so that the total subsidy costs do not exceed the carbon tax revenues generated by the ISI. If no carbon tax regime is implemented, the subsidies are linearly phased out between 2035 and 2050.
Phase-out regulationsNo additional capacity can be added to carbon-intensive processes from 2025 onwards. Capacity declines in line with the natural depreciation rate proportional to the inverse of the lifetime. For BF–BOF, that would be 1/35.
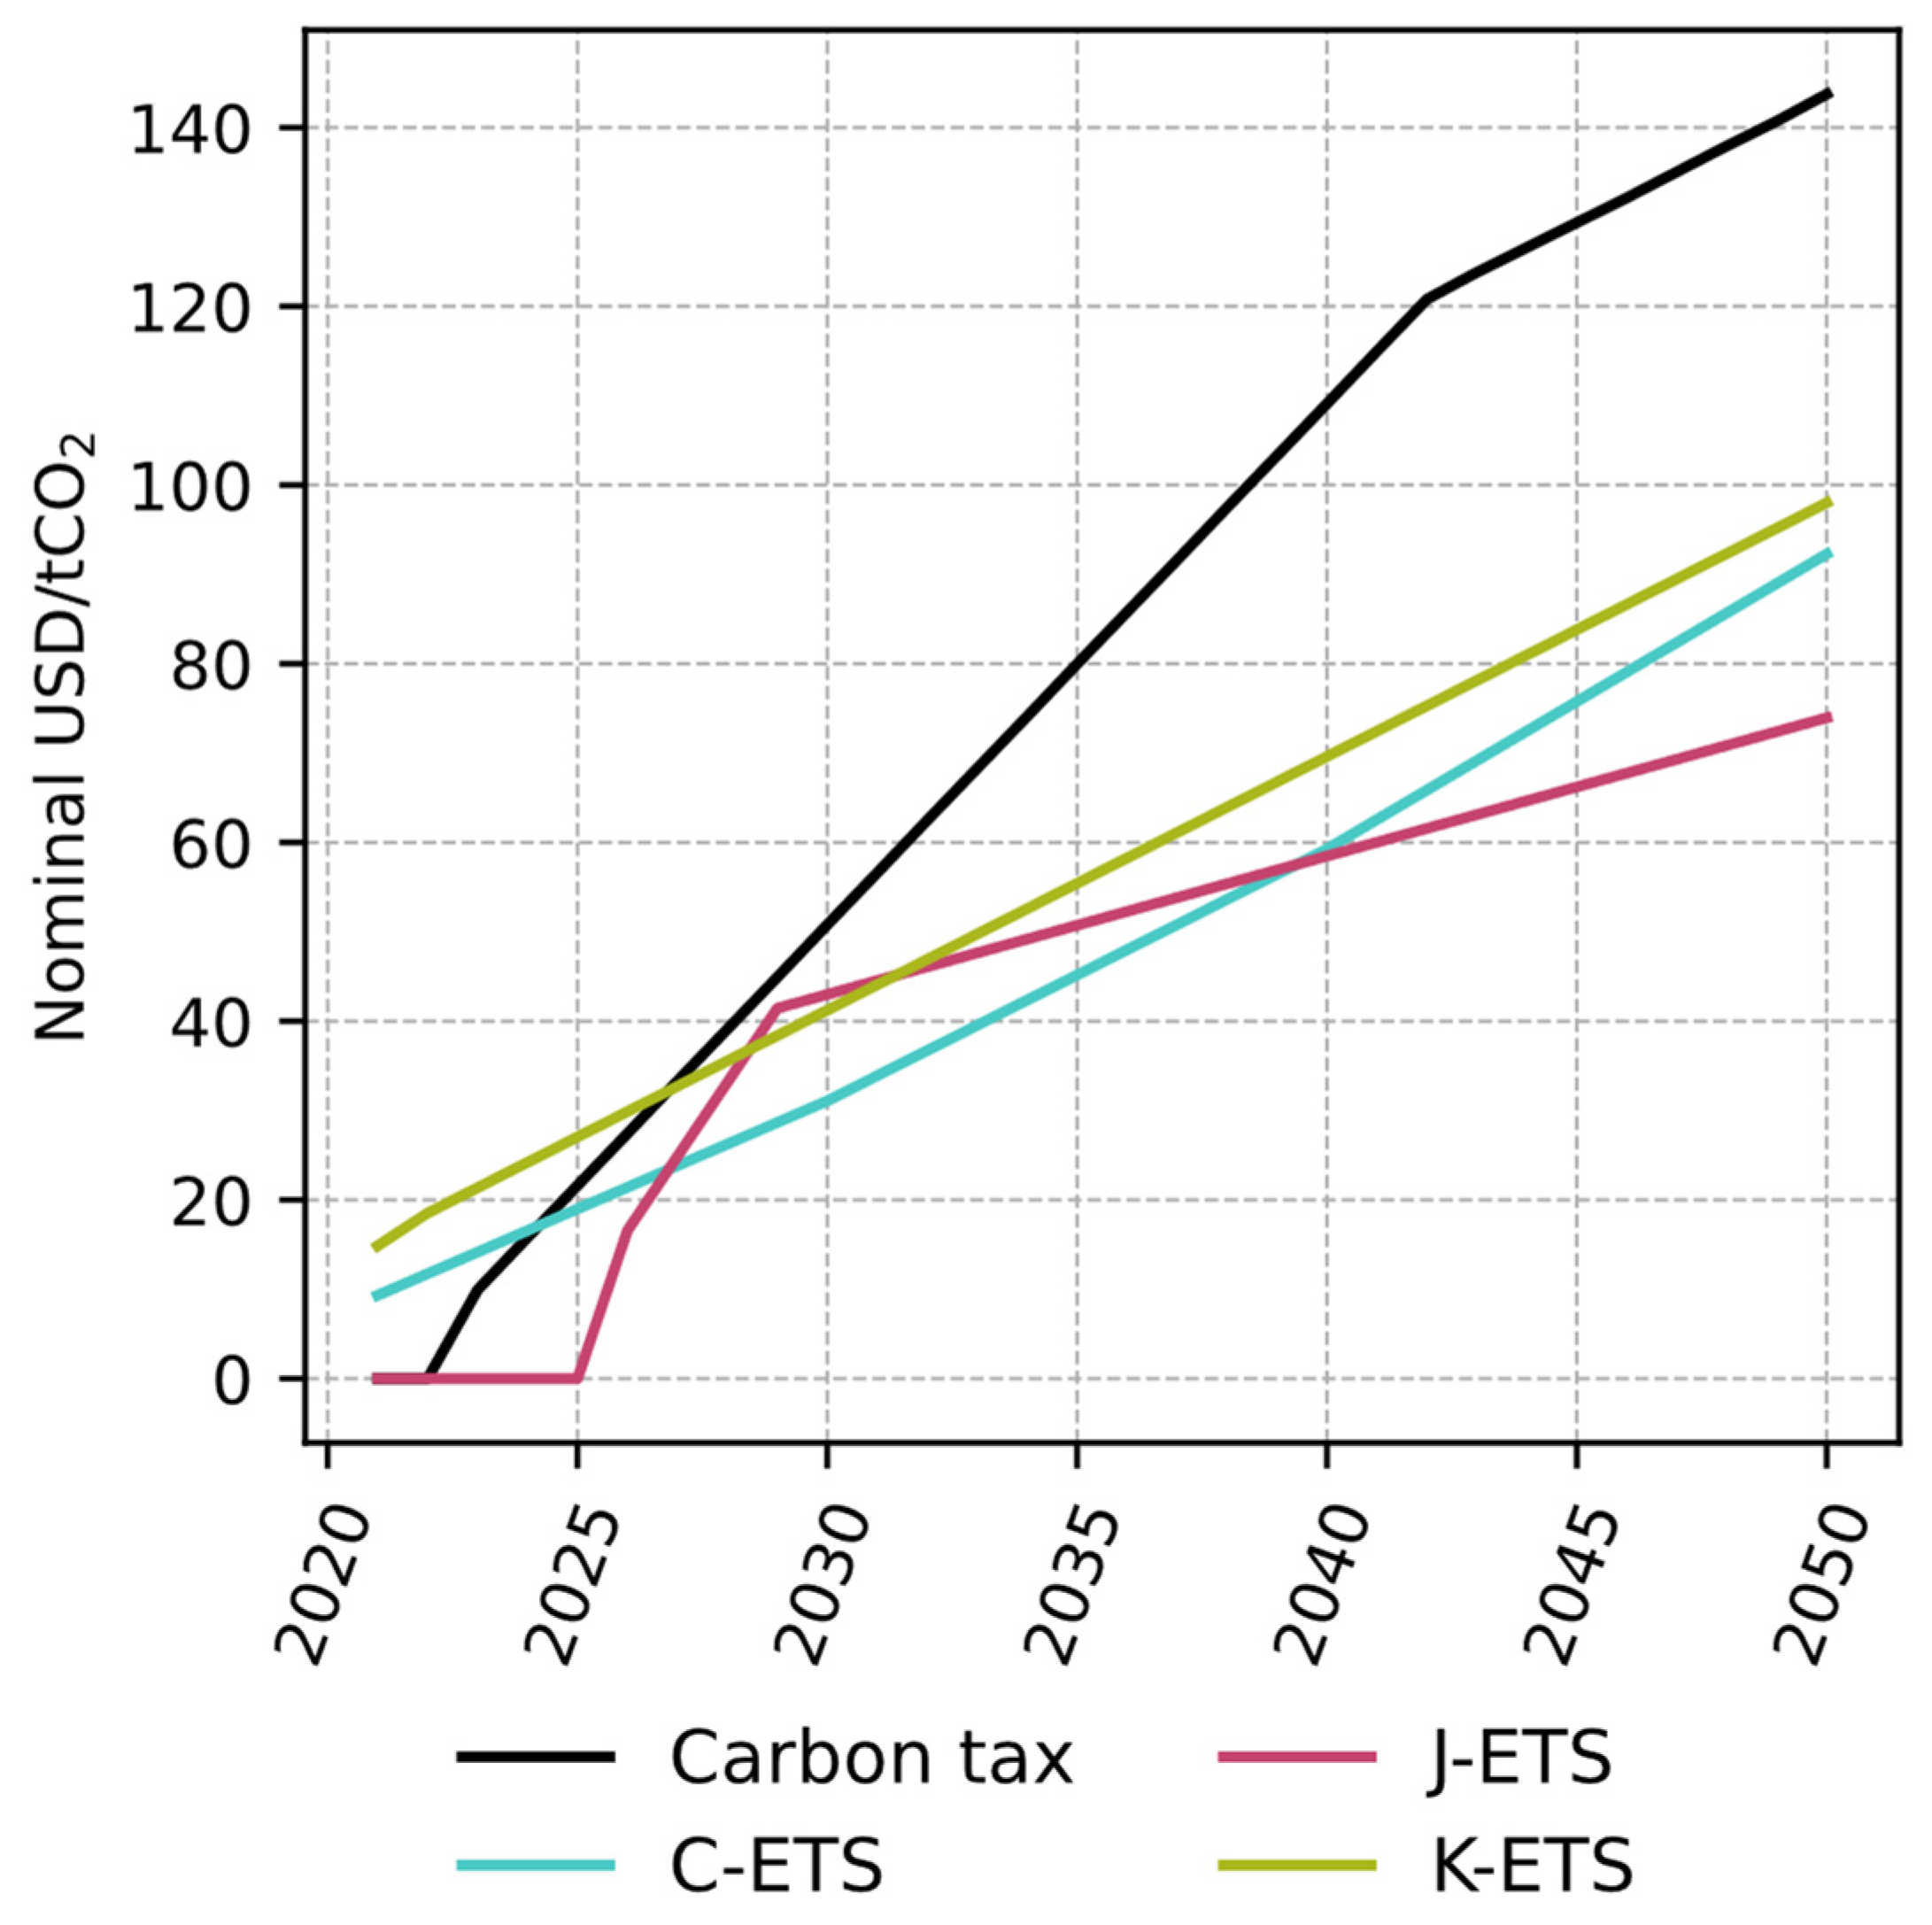
Carbon taxStarting at 10 USD/tCO2 in 2023 and increasing to 140 USD2020/tCO2 in 2050. The carbon tax is targeted at all industries.
Emission trading schemeIn Korea, an emission trading scheme has been in place since 2015. The rate is an exogenous input and increases from 21 USD/tCO2 in 2023 to 98 USD/tCO2 in 2050.
China implemented an ETS in 2021 and the rate grows from 14 USD/tCO2 in 2023 to 92 USD/tCO2 in 2050.
Japan has a voluntary ETS since 2006. This will likely change in 2026. The ETS price is set at 16 USD/tCO2 in 2026, increasing to 75 USD/tCO2 in 2050.
Financialization of policy costs via carbon tax revenuesThe policy costs due to the subsidies applied to the ISI are financed through carbon tax revenues generated by a tax on the ISI. Therefore, the transition to low-carbon alternatives is financed through carbon-intensive processes. If carbon tax revenues are not sufficient to fully cover the maximum subsidy rates, then the subsidies rates are lowered. Alternatively, if the carbon tax revenues are greater than the policy costs, then the overshoot is used to lower other fiscal rates, which follows the same mechanism as below.
Note: ETS revenues are not used to finance policy costs.
Financialization of policy costs via other fiscal ratesThe policy costs are financed by raising other non-environmental fiscal rates, such as the VAT rate, income tax, and employers’ social security contributions. VAT rates increase the end-use prices of goods and services and thereby decrease disposable income in real terms. Higher income tax makes employment more costly and therefore lowers employment. However, this may lead to higher capital investment as employers’ focus shifts from employees to capital. Raising employers’ social security contributions increases the cost of employment, but also leads to additional benefits.
Table 3. Overview of the policy levers for each scenario.
ScenariosSubsidiesPhase-Out RegulationsCarbon Tax on All IndustriesFinancialization of Policy Costs via Carbon Tax Revenues from the ISIDecarbonization Policies for the Power Sector
S1Carbon tax + subsidiesYNYYN
S2Subsidies + phase-out regulations YYNNY
S3Carbon tax + subsidies + phase-out regulations YYYYN
Table 4. Overview of decarbonization policies in the power generation sector.
PolicyDetails
Subsidies on upfront investmentA 20% rate of upfront investment applied to nuclear power from 2023 and 2030, and a 50% rate of upfront investment applied to all CCS applications from 2023 to 2035.
Feed-in tariffsApplied to onshore and offshore wind power and bio-based electricity generation from 2023 to 2035.
Kick-start programGovernment programs to kick-start bioenergy with CCS (BECCS) between 2023 and 2026.
Phase-out regulationsAll carbon-intensive power generation technologies from 2025 and onwards.
Table 5. Summary of emission reductions in the iron and steel industry in each country and scenario by 2050 compared with the baseline.
S1S2S3
DirectIndirectTotalDirectIndirectTotalDirectIndirectTotal
China−33%−73%−38%−52%−72%−54%−91%−77%−90%
Japan−21%−83%−35%−56%−81%−61%−85%−89%−86%
Korea−65%−87%−72%−82%−89%−84%−88%−101%−91%
Disclaimer/Publisher’s Note: The statements, opinions and data contained in all publications are solely those of the individual author(s) and contributor(s) and not of MDPI and/or the editor(s). MDPI and/or the editor(s) disclaim responsibility for any injury to people or property resulting from any ideas, methods, instructions or products referred to in the content.

