Abstract
A new cathode material, FeS2-decorated carbon nanofiber (CNF), is proposed for Li-S batteries. The structure and physicochemical properties of the material have been engineered to enhance the poor cycling stability typically displayed by sulfur composites. The composite material shows a complex architecture with a matrix of CNF hosting the sulfur and core-shell FeS2 nanoparticles acting as a catalyst for a solid phase conversion-type reaction. This cathode delivers high discharge capacities of 864, 798, 689, 595 and 455 mAhg−1 at C/10, C/5, C/2, 1C and 2C, respectively, with a stable capacity retention of 87% at 2C after 300 cycles. FeS2-decorated CNF has been characterised using several techniques, including in-situ battery measurements at the ALBA synchrotron facility and high-throughput microscopy, giving valuable insights into its charge/discharge reaction mechanism. The excellent performance obtained is combined with the use of just low-cost and abundant elements such as iron, sulfur and carbon, which makes this battery highly promising for the next generation of electrochemical energy storage devices.
1. Introduction
Nowadays, a greener and more efficient energy storage system (ESS) is an essential and urgent necessity for our society. The lithium-sulfur battery (LSB) is a promising ESS to power up electric vehicles of the future due to its high theoretical specific energy and its forecast cost lower than 90 euro/kWh for the battery packs. The Li-S technology has many limitations [1,2], including short cycle life, which currently hampers the commercial viability of the system [3,4]. In the cathode, lithium reacts with the sulfur to form Li2S via intermediate polysulfide species [5,6]. These species dissolve in organic electrolytes and must remain confined at the cathode to ensure stable battery cycle life and safety. New materials have been used to enhance the performance of Li-S battery cathodes, from (doped) carbon composites [7] with catalytic particles [8,9,10,11,12,13,14], to metallic materials with highly efficient structures to trap polysulfide species and high reaction kinetics [15,16]. A more recent approach is fabricating materials and cells that deliver energy via a solid phase reaction, suppressing the shuttle effect. This is the case of specific carbon structures containing sulfur in their micropores [17], sulfur/PAN nanocomposites entrapping small sulfur molecules (S3/S2) during all stages of the redox process [18], sulfur electrodes coated with a layer of polyvinylidene fluoride [19] and composite materials [20,21] cycled using carbonate-containing electrolytes [22] that completely suppress the formation of lithium polysulfide species.
A common trend in battery research is to use conversion-type materials. Using these materials improves electrode kinetics and diminishes crystal volume changes during cycling. Among candidates [23,24], FeS2 is a promising and more sustainable material with complex electrochemistry versus Li. Previous studies using ex situ X-ray powder diffraction and ex situ scanning electron microscopy provided experimental evidence for the formation of intermediate phases and insights into lithium reaction mechanisms of pyrite at ambient temperature. Depending on the lithium reaction conditions, the reaction proceeds differently [25]. For most reported cases, lithium intercalates first, forming intermediate phases, and then the reaction drives to phase conversion, forming metallic Fe and a lithium-sulfur phase [26]. It was also found that one-voltage-step lithium reduction of FeS2 pyrite at 1.5 V or lower led to the formation of a plate-like Li2S phase [25].
In this study, we have prepared FeS2-decorated CNFs as a solid phase conversion cathode for Li-S batteries. The material delivers high discharge capacity of 448 mAhg−1 at 2C with a capacity retention of 87% after 300 cycles, which is comparable to best-performant cathodes for liquid-based Li-S batteries [27]. A large spectrum of techniques have been deployed to characterize the complex cathode structure, using fresh and cycled samples, including in-situ battery cell measurements using synchrotron radiation. The improved performance of FeS2-decorated CNFs during cycling is correlated to the lithiation reaction, a single-step solid-solid conversion mechanism, suppressing polysulfide dissolution in the liquid electrolyte.
2. Results and Discussion
The CNFs were prepared using electrospinning and thermal carbonization in an inert atmosphere. The samples showed an oriented network of layer-by-layer fibres (Figure 1a), resembling a 3D macro-porous electrode (Figure 1b). The carbon nanofiber that was prepared exclusively from polyacrylonitrile (PAN) and the hybrid ones containing 1, 3 and 4.7 wt.% of the catalyst precursor, iron(III) acetylacetonate, showed an average thickness and areal loading of 200 µm and 3.5 mg cm−2. X-ray diffraction (XRD) analyses identified two crystalline Fe2O3 phases (hematite and maghemite) in addition to carbon for the 1 wt.% Fe sample (Figure 1c). 4-point conductivity measurements showed a systematic decrease in conductivity as a function of catalytic precursor wt.%, from ˃10,000 S m−1 to <100 S m−1 for CNF and 4.7 wt.% Fe samples, respectively. Among the four samples prepared and characterized, CNF and the 1 wt.% catalyst precursor were selected for sulfurization. Samples with higher loading of Fe precursor i.e., 3 and 4.7 wt.%, were discarded due to their lower conductivity.
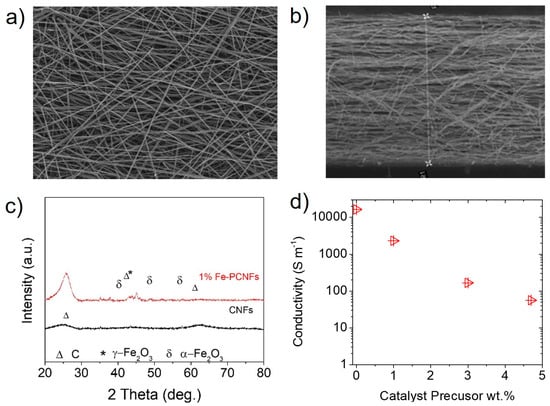
Figure 1.
Morphology, structure, and conductivity of CNF and Fe wt.% samples. (a) SEM images of the 1 wt.% Fe sample showing random and interconnected CNFs conforming, (b) microporous electrodes with an average thickness of ˃200 µm, (c) XRD patterns of CNF and the 1 wt. % Fe samples showing iron crystalline phases including carbon, hematite and maghemite marked as Δ*, α, γ, respectively, (d) conductivity results for the samples as a function of Fe wt.%.
Sulfur was introduced within CNFs by a melt-diffusion process at 200 °C. The products, Figure 2a,b, resemble the original fibers with crystals and sulfur on the carbon matrix. The chemical interaction between the sulfur and iron nanoparticles resulted in changes in the size and morphology of the crystals. The amount of sulfur for the samples after sulfurization was evaluated by thermogravimetry (TG) in an inert atmosphere. Sulfurized CNFs contained 29 wt.% of sulfur whereas the sample with 1 wt.% Fe delivered a weight loss of 51%, so it contained a larger amount of sulfur per mg of electrode (Figure 2c). Synchrotron XRD data as collected at the MSPD beamline in ALBA is shown in Figure 2d, together with the simulated diffraction pattern of FeS2. Experimental peaks match with the simulated ones and no impurity reflections are observed. The diffraction pattern can be indexed to the cubic pyrite phase.
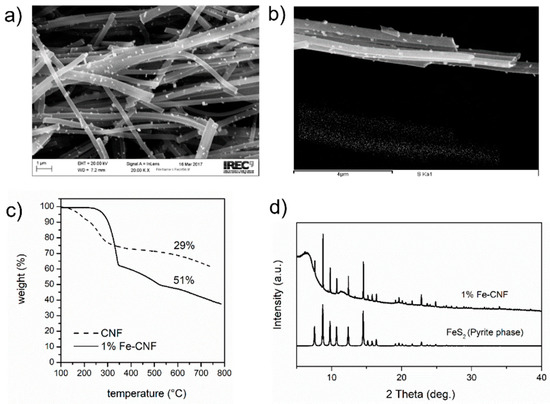
Figure 2.
Characterization of sulfurized samples. (a,b) SEM images of 1 wt.% Fe sample showing large crystallites and sulfur deposition over the CNF, (c) TG profile for CNF and 1 wt.% Fe sample measured in inert conditions, (d) Synchrotron XRD data for the sulfurized 1 wt.% Fe sample and the simulated pattern for FeS2. The CIF file was downloaded from the materials project.
High-angle annular dark field (HAADF) and scanning transmission electron microscopy (STEM) were used to investigate the nanostructure of sulfurized samples. Low-magnification HAADF STEM pictures showing the overview of nanoparticles with chemical analysis are presented in Figure 3a, and their structure in Figure 3b. The nanoparticles can be seen to be distributed onto the carbon matrix and have a cubic shape, with a core-shell structure of iron and sulfur in the core and oxide shell. High resolution transmission electron microscopy (HRTEM) images show that the shell was formed by Fe2O3 and sulfur (S20). The first crystallized with space group R-3c (N°167) and lattice parameters a = b = 5.035 and c = 13.748 Å as visualized along the [010] direction in Figure 3b. The sulfur crystallized with unit cell a = 18.58, b = 13.181 and c = 8.6 Å as visualized along the [114] direction in Figure 3b with space group Pbcn (N°60). The IFFT RGB diagram shows the distribution of these phases at the nanoparticle surface as green and red phase domains (Figure 3b). The core of the nanoparticles was FeS2, which crystallized in the cubic pyrite structure, space group Pa-3 (N°205) and unit cell parameters of a = b = c = 5.416 Å as visualized along the [100] direction in Figure 3c. Overall, the material obtained after sulfurization was complex both from the structural and morphological points of view. It was a composite material with a matrix of CNF hosting the sulfur and ~50 nm core-shell nanoparticles composed of a cubic FeS2 phase in the core and S20 and Fe2O3 at the shell.
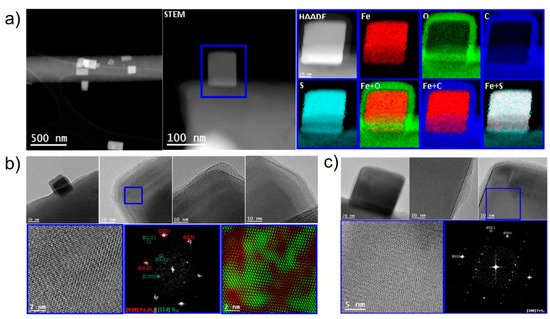
Figure 3.
Morphology and chemical analysis of sulfurized 1 wt.% Fe CNF. (a) EELS chemical composition maps obtained from the blue rectangle area of the HAADF-STEM micrograph and the individual Fe (red), O (green), C (blue), S (indigo) maps and their composites, (b) low-magnification TEM image showing the nanoparticles supported on the carbon matrix, and details for the blue-squared regions corresponding to reduced FFT spectrum and HRTEM images. The crystal phases Fe2O3 (hematite) and S20 are also shown. (c) TEM images of the inner particle and its crystal structure corresponding to the FeS2 cubic phase.
Initial electrochemical tests were dedicated to optimizing the electrolyte volume to sulfur mass ratio (μLmg−1 S) and the operational voltage window for the new electrode material i.e., the FeS2-decorated CNF obtained from the 1 wt.% Fe sample sulfurization (Figure 4). Half-cell results for the voltage ranges 0.1–3, 1–3 and 1.75–3 V vs. Li/Li+ are presented as blue, red, and green traces in Figure 4a,b, respectively. Galvanostatic charge/discharge cycling using the voltage window 0.1–3 V delivered a high discharge capacity of 1400 mAhg−1 but it rapidly fell to 60% capacity retention after 47 cycles. The voltage window 1.75–3 vs. Li/Li+ delivered the lowest discharge capacity of 400 mAhg−1. The best compromise between discharge capacity and cycling stability (~800 mAhg−1 after 25 cycles) was obtained for the voltage window 1–3 V vs. Li/Li+, see Figure 4b. Therefore, this was the range considered for the electrochemical characterization of the sample which mainly consists of a pair of reversible redox peaks, an anodic peak at 2.1 V and a cathodic one at 1.8 V vs. Li/Li+ (Figure 4a). These peak maxima do not match the peaks commonly observed in sulfur composites [1] so this suggests that the main electrochemical contribution corresponds to FeS2 [25,26]. Galvanostatic charge/discharge and electrochemical impedance spectroscopy results for coin cells containing different electrolyte volume to sulfur mass ratio are presented in Figure 4c,d. Results show that the electrolyte to sulfur ratio 50 μLmg−1 S delivered relatively high discharge capacities at low current rates, ˃1000 mAhg−1 at C/10 and C/5, but failed to deliver a high capacity at 2C. This was not the case for the electrolytes to mass ratios 75–100 μLmg−1 S, delivering an improved performance of 600 mAhg−1 at 2C. Impedance plots measured as a function of electrolyte volume to sulfur mass ratio show a similar shape with a small semicircle at high frequencies and a mid-frequency contribution with a low-frequency tail. The plots show differences in the total (dc) resistance: coin cells containing 50 and 75 μLmg−1 S had lower resistance than the ones with 100 μLmg−1 S, from 200 to 500 Ω respectively, as extrapolated from the mid-frequency semicircle using equivalent circuit inset.
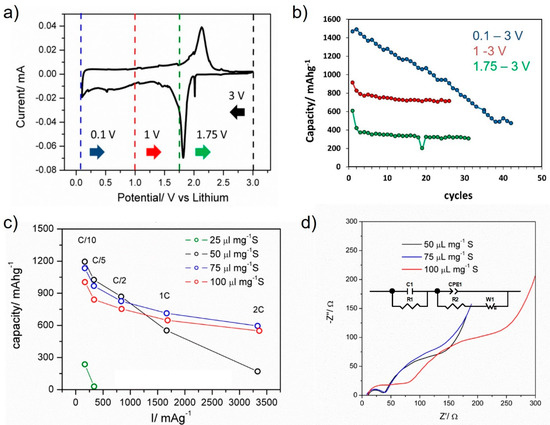
Figure 4.
Initial characterization of the FeS2-decorated CNF cathode electrode in the half-cell. (a) Cyclic Voltammetry measured at scan rate 0.1 mV/s with the specific voltage ranges shown as for the black, green, red and blue arrows, (b) the corresponding discharge capacity retention for the specific voltage ranges, (c) studies to determine the best electrolyte volume to sulfur mass ratio (μLmg−1 S) for the coin cell assembly using galvanostatic charge/discharge measurements and (d) corresponding electrochemical impedance spectroscopy plots measured for the fresh half-cells and the equivalent circuit used to estimate resistance values.
Galvanostatic tests for FeS2-decorated CNF are presented in Figure 5. The results are presented in the form of charge/discharge profiles (Figure 5a), capacity retention as a function of C-rate (Figure 5b), and electrode cycle life (Figure 5d,e). The cathode voltage profile is flat, and it does not show the characteristic peaks associated with the sulfur reaction [5,15] at 2.4 V, or 2.1 V associated with the intermediate polysulfide phase formation [15]. Instead, the material shows a unique discharge plateau similar to the reported cathode materials with superior cycling stability [17,18] and FeS2-based electrodes cycled versus lithium [25]. The material was cycled at different C-rates for 50 cycles (Figure 5b), and at selected currents (Figure 5d,e), before conducting in-situ battery measurements for understanding the reaction mechanism.
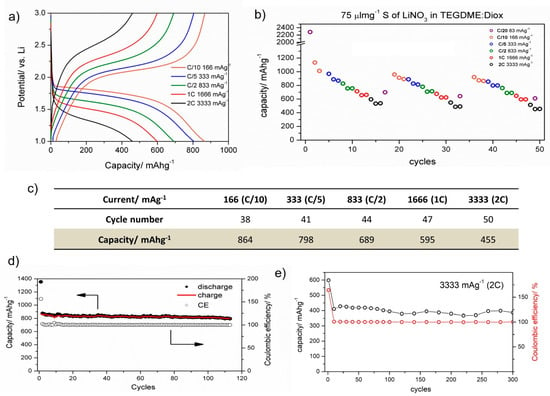
Figure 5.
Electrochemical results for FeS2-decorated CNF cycled using the optimized voltage window of 1–3 V and an electrolyte volume to sulfur mass ratio 75 μLmg−1. (a) galvanostatic charge/discharge profiles as a function of current rate, (b) cycling stability for the initial 50 cycles as a function of current rate, (c) table showing discharge capacities as obtained from cycles 38/50, (d) cycle life performance at C/10, (e) cycle life performance at 2C.
The FeS2-decorated CNF cathode material delivered 864, 798, 689, 595 and 455 mAhg−1 at C/10, C/5, C/2, 1C and 2C, respectively, and these are high discharge capacities for a more sustainable and cheaper material than Ni, Co and Se based cathodes [10,15]. The use of cheap and abundant elements such as iron is appealing to the battery industry. Table S1 in Supporting Information compares the discharge capacities of two selected references and the FeS2-decorated CNF cathode material, as well as their cost estimations in a red-orange-green scale for which green is the cheapest material.
Two current rates were selected for the long-cycling tests, and the results are presented in Figure 5d,e. At C/10, FeS2-decorated CNF delivered a stable discharge capacity of 864 ± 20 mAhg−1 with a capacity retention of 97% after 110 cycles. At 2C, the electrode delivered 455 ± 50 mAhg−1 with a capacity retention of 87% after 300 cycles. These results represent a significant improvement with respect to the performance of conventional cathode composites based on commercial carbon [2]. The stable capacity retention of FeS2-decorated CNF can also be expressed in terms of the excellent Coulombic efficiency obtained, which was ~99% for both tests conducted at C/10 and 2C (Figure 5d,e).
In-situ battery measurements were performed at ALBA to give a more comprehensive insight into the chemical and structural changes occurring at the electrode during cycling, aiming to correlate performance and the battery charge/discharge mechanism. The type of electrochemical cell, its design and components used for cell assembly determine the quality and resolution of the in-situ data, together with the type of radiation used [28,29,30,31,32]. In this case, conventional coin cells with Kapton windows were selected for the measurements, and these were assembled and pre-cycled in-house before transferring to the MSPD line for characterization. Figure 6 shows in-situ battery results for FeS2-decorated CNF. Blanks for the cell and components were also measured to ensure the correct assignment of the diffraction peaks to components contributing to electrochemical changes. In this sense, the diffraction peaks corresponding to the cell blank (fcc metallic phase) and separator (marked as ? in diffraction patterns) were identified and discarded from the analysis. Figure 6 shows the voltage profile for the material recorded during the in-situ battery test at C/10 for the voltage range 1–3 V, as well as diffraction results for the different state-of-discharge (SOD) evaluated (lithiation process). Diffraction patterns were measured for 5 min continuously during discharge. The peaks corresponding to FeS2 cubic pyrite were low in intensity but clearly identified over the pattern background resulting from the carbon matrix CNF. Upon Li reaction, the pyrite peaks rapidly vanished, and the intensity of other peaks increased (Figure 6b). This increase in intensity for certain peaks as a function of SOD is also shown in Figure 6c in the form of a cumulative contour map. At least 5 reflections were identified and correlated to the lithiation of FeS2-decorated CNF: the peaks were broad, and it was not possible to index all of them to any of the reported lithium-sulfur phases. As discussed by others [5], the broadness of the peaks of the lithiated phase and the high background of the spectrum can mask other reflections associated with the discharged phase. Among the lithium-sulfur phases considered, the cubic Li2S phase showed the closest match to the lithiated product LixSy. Even though it was not possible to fully characterize its crystal phase, relevant information was extracted from the in-situ measurements as follows: (1) there was no evidence of the formation of any intermediate phase e.g., Li3Fe2S4 and Li2Fe2S2 [25], during lithiation, so cathode discharge proceeded as a single-step reaction to LixSy and (2) the peak intensities for the phase gradually increased as a function of SOD, indicating a conversion-type reaction rather than an intercalation process.
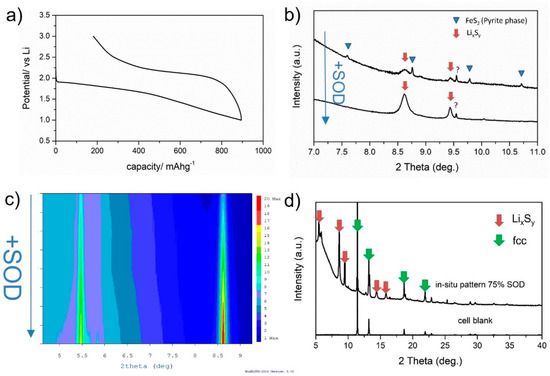
Figure 6.
In-situ battery measurements for FeS2-decorated CNF conducted at the MSPD line in Alba. (a) galvanostatic charge/discharge profile measured while performing in-situ diffraction, (b) in-situ XRD patterns measured for the charged (de-lithiated) and 75% SOD (lithiated) material, (c) contour map showing peak intensity variation as a function of SOD, (d) main diffraction peaks identified for the lithiated LixSy phase marked as red arrows.
Post-mortem studies were also performed to complement in-situ battery results. Coin cells were cycled at C/10 in the voltage window 1–3 V for 50 cycles, and subsequently dismantled for microscopy analysis. Cell dismantling was conducted inside the glove box for a delithiated (charged) sample at 3 V vs. Li/Li+. Figure 7 shows the structural and chemical details of the sample. Low-magnification TEM images show an amorphous-like matrix surrounding the CNFs composed of sulfur, iron, oxygen, and carbon (Figure 7b). Fluorine was also detected from the electrolyte salt and electrode binder. Further magnification and focusing on certain spots showed the presence of iron oxide nanoparticles (Figure 7c) with a hematite Fe2O3 crystal structure (Figure 7d).
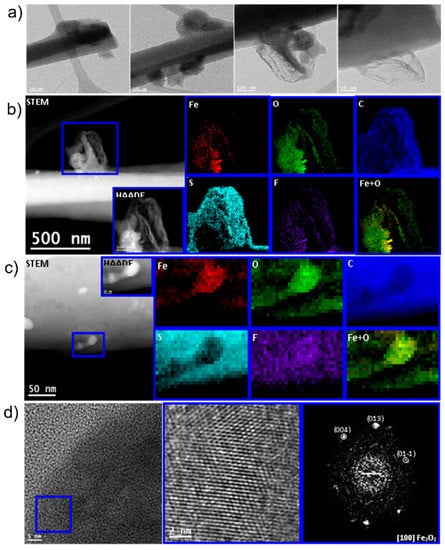
Figure 7.
Post-mortem studies of FeS2-decorated CNF sample after 50 cycles at C/10 in the voltage range 1–3 V. (a) low magnification TEM images showing the nanoparticles and carbon nanofibers surrounded by some amorphous species, (b,c) EELS chemical composition maps obtained from the blue rectangles area of the HAADF-STEM micrograph. Individuals of Fe (red), O (green), C (blue), S (indigo), F (purple) maps and their composites, (d) HRTEM image showing the edge of a nanoparticle supported onto a carbon nanofiber, the magnified detail and the corresponding FFT spectrum indexed to a-Fe2O3 hematite.
Combining results from in-situ battery measurements and post-mortem analysis, we propose Equation (1) as the lithiation mechanism for the FeS2-decorated CNF. The reaction involves direct conversion of FeS2-decorated CNF to a lithium-sulfur phase with no (soluble) intermediate phase formation in accordance with the charge/discharge profile shown in Figure 6. Metallic iron* was assumed as the product of Equation (1).
FeS2 + S + 3Li+ + Fe2O3 → 3LixSy + Fe* + Fe2O3
3. Conclusions
In this manuscript, we have synthesized and characterized a new cathode material for Li-S batteries based on low-cost and more sustainable Fe, S and C cathode components. From initial Fe-CNFs prepared using electrospinning and thermal carbonization in inert atmosphere, we selected the best sample to engineer FeS2-decorated CNF based on conductivity and sulfur loading characteristics. The FeS2-decorated CNF had a complex structure of a supported matrix of CNF with sulfur and core-shell nanoparticles composed of S20 and Fe2O3 at the edges and cubic FeS2 at the core. The fabricated composite electrodes delivered high discharge performances of 864, 798, 689, 595 and 455 mAhg−1 at C/10, C/5, C/2, 1C and 2C, respectively, with a stable capacity retention of 87% at 2C after 300 cycles. The origin of this improved performance relies on the material reaction mechanism, which involved a conversion-type lithiation to a LixSy phase, without formation of intermediate phases. The diffraction peak positions of the final reaction product measured in-situ look like the ones of Li2S. The use of in-situ battery cells, and high-throughput microscopy, provided essential information for the characterization of the material, highlighting how important these two techniques are to the understanding of electrochemical reactions.
4. Experimental Section
Preparation of fibers: Blend solutions were formed by dissolving iron(III) acetylacetonate (99%, Fe(acac)3) and polyacrylonitrile (99%, PAN) in N, N-dimethylformamide (99%, DMF) for 1 h at 80 °C. The quantities used for PAN and DMF were 2 and 20 g, respectively, and the weight % of iron precursor were varied between 1 wt.%, 3 wt.% and 4.7 wt.%. These wt. percentages are the weight contents of Fe in Fe(acac)3 with respect to PAN. These polymer blends were loaded into 20 mL plastic syringes attached to a single stainless-steel spinneret (Ø int: 0.6 mm; Ø ext: 0.9 mm) and electrospun on a rotating current collector (Nanotechnology Solutions, Yflow®, Adelaide, Australia) to fabricate a polymer mat. These polymer mats were stabilized at 270 °C (7 h; 1 °C/min) in air and carbonized at 500 °C and 800 °C (1 h at each step; 5 °C/min) in Ar/H2 (5%) to obtain self-supporting flexible films.
Sulfurization of CNFs: Sulfur was introduced within CNFs by a melt-diffusion process at 200 °C. The samples were sealed in quartz ampoules while preserving mid-vacuum 10−3 mbar conditions in the system, and then transferred to a muffle furnace for sulfur CNF impregnation and reaction with the Fe nanoparticles. A weight ratio of 3-1 was used between sulfur powder (Sigma-Aldrich, St. Louis, MO, USA) and Fe CNF samples. The as-prepared sample from 1 wt.% Fe CNF was FeS2-decorated CNF.
Material Characterization: Field emission scanning electron microscopy images were obtained by using Zeiss Serie Auriga at 5 kV. XRD measurements were obtained by operating a Bruker D8 advance diffractometer with CuKα1 radiation (λ = 1.5405 Å). Samples for transmission electron microscopy were prepared by dispersing samples in hexane and collecting them on TEM copper grids. High-angle annular dark field scanning transmission electron microscopy and high-resolution transmission electron microscopy analysis were conducted by using an FEI Tecnai F20 field emission gun microscope operated at 200 kV with a point-to-point resolution of 0.19 nm, which was equipped with a GATAN Quantum electron energy loss spectroscopy detector. Thermogravimetric analysis was obtained by using PerkinElmer (TGA 4000) analyzer in nitrogen with a ramp rate of 5 °C/min. Raman spectra were used to detect the structural fingerprints of carbon and were recorded by using a Horiba Spectrometer HR800 (LabRAM Series, Horiba Jobin Yvon, Kyoto, Japan). The electrical conductivity measurements were carried out by using 4-probe test equipment (EverBeing SP4) using the Van der Pauw method.
Electrochemical Characterization: Half-cell measurements in 2032 coin cells were conducted using VMP2 potentiostat (Bio-Logic, Seyssinet-Pariset, France). The self-standing and flexible electrodes were punched with a circular-area disk with an average sulfur loading of 1 ± 0.1 mg cm−2. These electrodes were dried in a vacuum oven at 60 °C overnight. The FeS2-decorated CNF electrodes were used to construct coin cells using Li metal as counter/reference electrodes, Celgard 2400 membranes and 0.2 M LiNO3 in TEGDME:Diox as liquid electrolytes obtained from Solvionic. After assembly, the cells were cycled for formation for 1 cycle at C/20. Different currents were used for the test. Impedance spectroscopy (PEIS) was carried out at rest potential with an amplitude of 5 mV s−1 from 200 kHz to 10 mHz, and cyclic voltammetries at a slow scan rate of 0.1 mV/s. The capacity and applied currents were calculated assuming a theoretical capacity of 1675 mAh/g for S.
In-situ battery measurements: The beamline BL04-MSPD [33] at ALBA was used for in situ-battery measurements. The Materials Science and Powder Diffraction beamline BL04-MSPD is devoted to high angular resolution powder diffraction, high-pressure powder diffraction using diamond anvil cells and micro powder diffraction at high energy. The coin cells were loaded to a sample changer connected to a Bio-logic potentiostat. The synchrotron light with wavelength 0.4117 was used to obtain diffraction patterns in the 2theta range 0–40. The electrochemistry was coordinated with data collection in-situ.
Supplementary Materials
The following supporting information can be downloaded at: https://www.mdpi.com/article/10.3390/en16114496/s1, Table S1: Performance and cost estimation comparison of two selected references and FeS2-decorated CNF.
Author Contributions
Conceptualization, J.J.B.; Formal analysis, J.J.B., P.M. and P.T.; Investigation, J.J.B., H.A. and C.Z.; Resources, A.M.; Writing—original draft, J.J.B.; Writing—review & editing, L.T., J.A., J.R.M. and A.C.; Project administration, J.J.B. All authors have read and agreed to the published version of the manuscript.
Funding
The authors acknowledge funding from Generalitat de Catalunya 2021 SGR 01581 and 2021 SGR 00457 the Spanish MINECO project ENE2017-85087-C3. IREC and ICN2 are funded by the CERCA Programme/Generalitat de Catalunya. The authors thank support from the project NANOGEN (PID2020-116093RB-C43), funded by MCIN/AEI/10.13039/501100011033/ and by “ERDF A way of making Europe”, by the “European Union”. This study was supported by MCIN with funding from European Union NextGenerationEU (PRTR-C17.I1) and Generalitat de Catalunya. ICN2 is supported by the Severo Ochoa program from Spanish MCIN/AEIN (Grant No.: CEX2021-001214-S). IREC acknowledges additional support from the European Regional Development Funds (ERDF, FEDER). Jordi Jacas Biendicho acknowledges the fellowship RYC2021-034994-I, funded by MCIN/AEI/10.13039/501100011033 and the European Union «NextGenerationEU»/PRTR». In-situ diffraction measurements experiments were performed at BL04-MSPD beamline at ALBA Synchrotron with the collaboration of ALBA staff under proposal number 2016091931.
Data Availability Statement
The data presented in this study are available on request from the corresponding author. The data are not publicly available due to scientific interest of the research group in these materials, aiming to improve their performance further.
Conflicts of Interest
The authors declare no conflict of interest.
References
- Rosenman, A.; Markevich, E.; Salitra, G.; Aurbach, D.; Garsuch, A.; Chesneau, F.F. Review on Li-Sulfur Battery Systems: An Integral Perspective. Adv. Energy Mater. 2015, 5, 1500212. [Google Scholar] [CrossRef]
- Ji, X.; Lee, K.T.; Nazar, L.F. A highly ordered nanostructured carbon-sulphur cathode for lithium-sulphur batteries. Nat. Mater. 2009, 8, 500–506. [Google Scholar] [CrossRef]
- Zhu, K.; Wang, C.; Chi, Z.; Ke, F.; Yang, Y.; Wang, A.; Wang, W.; Miao, L. How Far Away Are Lithium-Sulfur Batteries From Commercialization? Front. Energy Res. 2019, 7, 1–12. [Google Scholar] [CrossRef]
- Tidblad, A.A.; Edström, K.; Hernández, G.; de Meatza, I.; Landa-Medrano, I.; Biendicho, J.J.; Trilla, L.; Buysse, M.; Ierides, M.; Horno, B.P.; et al. Future Material Developments for Electric Vehicle Battery Cells Answering Growing Demands from an End-User Perspective. Energies 2021, 14, 4223. [Google Scholar] [CrossRef]
- Cañas, N.A.; Wolf, S.; Wagner, N.; Friedrich, K.A. In-situ X-ray diffraction studies of lithium-sulfur batteries. J. Power Sources 2013, 226, 313–319. [Google Scholar] [CrossRef]
- Conder, J.; Bouchet, R.; Trabesinger, S.; Marino, C.; Gubler, L.; Villevieille, C. Direct observation of lithium polysulfides in lithium-sulfur batteries using operando X-ray diffraction. Nat. Energy 2017, 2, 17069. [Google Scholar] [CrossRef]
- Wang, Z.; Zhang, X.; Liu, X.; Zhang, Y.; Zhao, W.; Li, Y.; Qin, C.; Bakenov, Z. High specific surface area bimodal porous carbon derived from biomass reed flowers for high performance lithium-sulfur batteries. J. Colloid Interface Sci. 2020, 569, 22–33. [Google Scholar] [CrossRef]
- Zhang, C.; Du, R.; Biendicho, J.J.; Yi, M.; Xiao, K.; Yang, D.; Zhang, T.; Wang, X.; Arbiol, J.; Llorca, J.; et al. Tubular CoFeP@CN as a Mott–Schottky Catalyst with Multiple Adsorption Sites for Robust Lithium−Sulfur Batteries. Adv. Energy Mater. 2021, 11, 2100432. [Google Scholar] [CrossRef]
- Liang, Z.; Yang, D.; Tang, P.; Zhang, C.; Biendicho, J.J.; Zhang, Y.; Llorca, J.; Wang, X.; Li, J.; Heggen, M.; et al. Atomically dispersed Fe in a C2N Based Catalyst as a Sulfur Host for Efficient Lithium–Sulfur Batteries. Adv. Energy Mater. 2021, 11, 2003507. [Google Scholar] [CrossRef]
- Yang, D.; Zhang, C.; Biendicho, J.J.; Han, X.; Liang, Z.; Du, R.; Li, M.; Li, J.; Arbiol, J.; Llorca, J.; et al. ZnSe/N-doped carbon nanoreactor with multiple adsorption sites for stable lithium-sulfur batteries. ACS Nano 2020, 14, 15492–15504. [Google Scholar] [CrossRef]
- Yang, D.; Liang, Z.; Zhang, C.; Biendicho, J.J.; Botifoll, M.; Spadaro, M.C.; Chen, Q.; Li, M.; Ramon, A.; Moghaddam, A.O.; et al. NbSe2 Meets C2N: A 2D-2D Heterostructure Catalysts as Multifunctional Polysulfide Mediator in Ultra-Long-Life Lithium–Sulfur Batteries. Adv. Energy Mater. 2021, 11, 2101250. [Google Scholar] [CrossRef]
- Yang, D.; Liang, Z.; Zhang, C.; Biendicho, J.J.; Botifoll, M.; Spadaro, M.C.; Chen, Q.; Li, M.; Ramon, A.; Moghaddam, A.O.; et al. Phase Engineering of Defective Copper Selenide toward Robust Lithium-Sulfur Batteries. ACS Nano 2022, 16, 11102–11114. [Google Scholar] [CrossRef] [PubMed]
- Cai, D.; Zhuang, Y.; Fei, B.; Zhang, C.; Wang, Y.; Chen, Q.; Zhan, H. Self-supported VN arrays coupled with N-doped carbon nanotubes embedded with Co nanoparticles as a multifunctional sulfur host for lithium-sulfur batteries. Chem. Eng. J. 2022, 430, 132931. [Google Scholar] [CrossRef]
- Yang, D.; Liang, Z.; Tang, P.; Zhang, C.; Tang, M.; Li, Q.; Biendicho, J.J.; Li, J.; Heggen, M.; Dunin-Borkowski, R.E.; et al. A High Conductivity 1D π–d Conjugated Metal–Organic Framework with Efficient Polysulfide Trapping-Diffusion-Catalysis in Lithium–Sulfur Batteries. Adv. Mater. 2022, 34, 2108835. [Google Scholar] [CrossRef]
- Zhang, C.; Biendicho, J.J.; Zhang, T.; Du, R.; Li, J.; Yang, X.; Arbiol, J.; Zhou, Y.; Morante, J.R.; Cabot, A. Combined High Catalytic Activity and Efficient Polar Tubular Nanostructure in Urchin-Like Metallic NiCo2Se4 for High-Performance Lithium–Sulfur Batteries. Adv. Funct. Mater. 2019, 29, 1903842. [Google Scholar] [CrossRef]
- Zhang, C.Y.; Zhang, C.; Pan, J.L.; Sun, G.W.; Shi, Z.; Li, C.; Chang, X.; Sun, G.Z.; Zhou, J.Y.; Cabot, A. Surface strain-enhanced MoS2 as a high-performance cathode catalyst for lithium–sulfur batteries. eScience 2022, 2, 405–415. [Google Scholar] [CrossRef]
- Xu, Y.; Wen, Y.; Zhu, Y.; Gaskell, K.; Cychosz, K.A.; Eichhorn, B.; Xu, K.; Wang, C. Confined Sulfur in Microporous Carbon Renders Superior Cycling Stability in Li/S Batteries. Adv. Funct. Mater. 2015, 25, 4312–4320. [Google Scholar] [CrossRef]
- Wei, S.; Ma, L.; Hendrickson, K.E.; Tu, Z.; Archer, L.A. Metal-Sulfur Battery Cathodes Based on PAN-Sulfur Composites. J. Am. Chem. Soc. 2015, 137, 12143–12152. [Google Scholar] [CrossRef]
- Fang, R.; Xu, H.; Xu, B.; Li, X.; Li, Y.; Goodenough, J.B. Reaction Mechanism Optimization of Solid-State Li–S Batteries with a PEO-Based Electrolyte. Adv. Funct. Mater. 2021, 31, 2001812. [Google Scholar] [CrossRef]
- Rafie, A.; Kim, J.W.; Sarode, K.K.; Kalra, V. A review on the use of carbonate-based electrolytes in Li-S batteries: A comprehensive approach enabling solid-solid direct conversion reaction. Energy Storage Mater. 2022, 50, 197–224. [Google Scholar] [CrossRef]
- Zheng, S.; Han, P.; Han, Z.; Zhang, H.; Tang, Z. High performance C/S composite cathodes with conventional carbonate-based electrolytes in Li-S battery. Sci. Rep. 2014, 4, 4842. [Google Scholar] [CrossRef]
- He, M.; Li, X.; Yang, X.; Wang, C.; Zheng, M.L.; Li, R.; Zuo, P.; Yin, G.; Sun, X. Realizing Solid-Phase Reaction in Li–S Batteries via Localized High-Concentration Carbonate Electrolyte. Adv. Energy Mater. 2021, 11, 2101004. [Google Scholar] [CrossRef]
- Zhu, T.; Wu, Q.; Cao, Y.; Wang, W.; Li, Y.; Meng, S.; Liu, L. Study on the effect of carbon nanotubes loaded with cobalt disulfide modified multifunctional separator on Li-S battery. Electrochim. Acta 2023, 447, 142145. [Google Scholar] [CrossRef]
- Dirlam, P.T.; Park, J.; Simmonds, A.G.; Domanik, K.; Arrington, C.B.; Schaefer, J.L.; Oleshko, V.P.; Kleine, T.S.; Char, K.; Glass, R.S.; et al. Elemental Sulfur and Molybdenum Disulfide Composites for Li-S Batteries with Long Cycle Life and High-Rate Capability. ACS Appl. Mater. Interfaces 2016, 8, 13437–13448. [Google Scholar] [CrossRef]
- Shao-Horn, Y.; Osmialowski, S.; Horn, Q.C. Reinvestigation of Lithium Reaction Mechanisms in FeS2 Pyrite at Ambient Temperature. J. Electrochem. Soc. 2002, 149, A1547. [Google Scholar] [CrossRef]
- Butala, M.M.; Mayo, M.; Doan-Nguyen, V.V.T.; Lumley, M.A.; Göbel, C.; Wiaderek, K.M.; Borkiewicz, O.J.; Chapman, K.W.; Chupas, P.J.; Balasubramanian, M.; et al. Local Structure Evolution and Modes of Charge Storage in Secondary Li-FeS2 Cells. Chem. Mater. 2017, 29, 3070–3082. [Google Scholar] [CrossRef]
- Kumar, R.; Liu, J.; Hwang, J.Y.; Sun, Y.K. Recent research trends in Li-S batteries. J. Mater. Chem. 2018, A6, 11582–11605. [Google Scholar] [CrossRef]
- Brant, W.R.; Roberts, M.; Gustafsson, T.; Biendicho, J.J.; Hull, S.; Ehrenberg, H.; Edström, K.; Schmid, S. A large format in operando wound cell for analysing the structural dynamics of lithium insertion materials. J. Power Sources 2016, 336, 279–285. [Google Scholar] [CrossRef]
- Dong, B.; Biendicho, J.J.; Hull, S.; Smith, R.I.; West, A.R. In-Situ Neutron Studies of Electrodes for Li-Ion Batteries Using a Deuterated Electrolyte: LiCoO 2 as a Case Study. J. Electrochem. Soc. 2018, 165, A793–A801. [Google Scholar] [CrossRef]
- Biendicho, J.J.; Roberts, M.; Noréus, D.; Lagerqvist, U.; Smith, R.I.; Svensson, G.; Norberg, S.T.; Eriksson, S.G.; Hull, S. In situ investigation of commercial Ni(OH)2 and LaNi5-based electrodes by neutron powder diffraction. J. Mater. Res. 2015, 30, 407–416. [Google Scholar] [CrossRef]
- Roberts, M.; Biendicho, J.J.; Hull, S.; Beran, P.; Gustafsson, T.; Svensson, G.; Edström, K. Design of a new lithium ion battery test cell for in-situ neutron diffraction measurements. J. Power Sources 2013, 226, 249–255. [Google Scholar] [CrossRef]
- Biendicho, J.J.; Roberts, M.; Offer, C.; Noréus, D.; Widenkvist, E.; Smith, R.I.; Svensson, G.; Edström, K.; Norberg, S.T.; Eriksson, S.G.; et al. New in-situ neutron diffraction cell for electrode materials. J. Power Sources 2014, 248, 900–904. [Google Scholar] [CrossRef]
- Fauth, F.; Boer, R.; Gil-Ortiz, F.; Popescu, C.; Vallcorba, O.; Peral, I.; Fullà, D.; Benach, J.; Juanhuix, J. The crystallography stations at the Alba synchrotron. Eur. Phys. J. Plus 2015, 130, 160. [Google Scholar] [CrossRef]
Disclaimer/Publisher’s Note: The statements, opinions and data contained in all publications are solely those of the individual author(s) and contributor(s) and not of MDPI and/or the editor(s). MDPI and/or the editor(s) disclaim responsibility for any injury to people or property resulting from any ideas, methods, instructions or products referred to in the content. |
© 2023 by the authors. Licensee MDPI, Basel, Switzerland. This article is an open access article distributed under the terms and conditions of the Creative Commons Attribution (CC BY) license (https://creativecommons.org/licenses/by/4.0/).