Article

Evaluation of the Impact of Window Parameters on Energy Demand and CO2 Emission Reduction for a Single-Family House

by
Walery Jezierski
1 and
Miroslaw Zukowski
2,*
1
Department of Sustainable Construction and Building Systems, Faculty of Civil Engineering and Environmental Sciences, Bialystok University of Technology, Wiejska 45E Street, 15-351 Bialystok, Poland
2
Department of HVAC Engineering, Faculty of Civil Engineering and Environmental Sciences, Bialystok University of Technology, Wiejska 45E Street, 15-351 Bialystok, Poland
*
Author to whom correspondence should be addressed.
Energies 2023, 16(11), 4429; https://doi.org/10.3390/en16114429
Submission received: 11 May 2023 / Revised: 23 May 2023 / Accepted: 27 May 2023 / Published: 30 May 2023
(This article belongs to the Special Issue Research on Low-Carbon Energy Buildings)

Abstract

:
This article deals with the determination of the impact of selected parameters on energy consumption for heating and cooling purposes and CO2 emissions. Mathematical modelling combined with planning a computational experiment was adopted as the research method. The database for creating the models was developed using building energy simulations performed with DesignBuilder software. A single-family house with an area of 101 m2 was the subject of this study. Four deterministic mathematical models for the estimation of annual energy demand for heating, cooling, total final energy demand, and CO2 emissions were developed. Four parameters affecting the energy balance of the house: the area of the glazing system (three levels), U-value of windows (two-, three- and four-pane), U-value of external walls (0.1, 0.15, 0.2 W/m2K) and location (Warsaw, Berlin, Paris) were considered. The article discusses in detail the influence of individual factors on the energy demand and their common interactions. It was found that the level of thermal insulation of the glazing system plays the most important role in saving energy. This factor was the only one to show a stable and significant reduction in house energy demand, and thus a reduction in CO2 emissions for all four objective functions.

1. Introduction

Reducing the energy consumption of buildings is becoming one of the most significant challenges of our time. Glazing systems are still the weakest component in terms of heat loss through the house envelope. The simplest solution would be to limit the area of windows. However, such an undertaking would worsen the comfort of the occupant, who needs natural light for well-being and productivity in work and in living spaces. On the other hand, it is known that the increase in the area of windows will result in the possibility of overheating of living spaces in the summer. This article attempts to determine the impact of different types of glazing on the energy demand for heating and cooling. Many scientific works have been dedicated to this complex issue.
The literature review concerning the problems analysed here has been divided into two parts. In the first one, articles related to the comparison of thermal and optical characteristics of glazing systems are studied. Scientific works on the impact of window types on the building’s energy consumption are discussed in the second part.

1.1. Review of Scientific Works on Determining the Characteristics of Windows with a Different Number of Panes

Nia et al. [1] developed a mathematical description of heat transport through double- and triple-glazed windows with layers of radiating gas between them. The numerical model was built using the finite-difference method. The effect of the thickness of the gas-filled layer on the thermal performance of windows in static and transient conditions was analysed. The authors of this numerical analysis proved that the volumetric radiation of the gas between the panes has a significant impact on the accuracy of heat-transfer calculations. The results of this study showed that a periodic heat flux was formed on the surface of the window, which was caused by the multicellular flow inside the gas layers.
A new methodology for determining the thermal performance of a multiple glazing system was developed by Sadooghi et al. [2]. The novelty was the use of partitioning radiant energy veils™, which were characterized by an effective radiative property. Those elements were placed between the inner and outer panes and could be taken as layers of glazing, blinds, or other shading layers. The result of the numerical analysis was the U-value of the window, which depended on the type of gas in the inter-pane layer, the thickness of the glass, and the distance between the panes. As it turned out, the new method allowed for effective calculations of heat transfer inside a triple or quadruple pane window, considering layers covered with materials with high reflectivity in the mid-infrared.
Mathematical calculations of heat transfer in windows consisting of two, three, and four panes were carried out by Arıcı et al. [3]. The numerical analysis covered four outside air temperatures characteristic of different regions of Turkey, and six different thicknesses of air gaps. The results of the calculations showed that the replacement of standard double-glazed windows with triple- and quadruple-glazed windows could reduce heat losses in the winter by about 50% and 67%, respectively. In addition, it was estimated that the share of radiation in the heat exchange ranged from 45% to 75%, depending on the temperature difference on both sides of the window and the width of the gap.
The issue of heat transfer through multi-pane windows that are inclined was considered by Arıcı et al. [4]. The numerical analysis included double, triple and quadruple-glazed windows, the angle of inclination was changed from 0 to 90 degrees, and the distance between the panes filled with air was in the range of 6 mm to 18 mm. The authors of this article suggested that in order to avoid an increase in the heat-transfer coefficient of a window that is inclined, more panes should be used. In addition, the change in the inclination of the double-glazed window had a greater impact on the intensity of heat transfer than in the case of triple- and quadruple-pane windows. That an increase in the thickness of the air layer can cause an up to 10 percent increase in heat loss through the glazing was another conclusion from the numerical analysis.
The thermal characteristics of a six-pane window were tested by Kralj et al. [5]. In this study, it was estimated that this type of glazing with a heat-transfer coefficient of less than 0.3 W/(m2·K) can contribute to 60% energy savings after the renovation of the studied building. The example of six-pane glazing system was given in the article. The window on the upper floors, measuring 1166 mm × 1436 mm, had a thermal transmittance for the glass of 0.24 W/(m2·K) and for the frame of 0.8; the average U-value for the entire window was 0.36 W/(m2·K).
Sadooghi et al. [6] developed a new calculation procedure that was used to estimate the U-value of triple- and quadruple-pane windows with internal shading elements. The authors of these studies determined the thermal characteristics of the glazing system depending on the thickness of the gas layer and its kind. The influence of the degree of opening of the blinds was also investigated. It turned out that krypton was characterized by the best insulation parameters compared to air and argon. The authors of the study suggested that the best solution to reduce the U-value is the use of metal-dielectric coatings that are characterized by low emissivity.
Numerical analysis of the characteristics of multi-pane windows was carried out by Arıcı and Kan [7] using the Ansys/Fluent 12.1 software. The parametric studies covered the determination of the influence of the thickness of the air and argon layers, as well as the emissivity of filters in double, triple, and quadruple pane windows. The distance between the panes of 12 mm turned out to be the optimal solution, regardless of the glazing system. In addition, it was estimated that a quadruple-pane window with layers of low-emission coating and filled with argon had a thermal conductivity coefficient of 0.4 W/(m2·K).
Chmúrny [8] compared the thermal properties and weight of glass in triple- and quadruple-pane windows. The tests were carried out in the laboratory of the Slovak University of Technology in Bratislava (Czech Republic) [9]. It turned out that the weight criterion was not met for quadruple-pane windows with 4 mm thick glass and the use of this type of glazing system may be ambiguous [10]. The article proposes to reduce the weight of this type of windows using a new frameless IGUnit [11] glazing structure. The use of a thin glass material with a thickness of 1.8 mm reduced the weight of the entire window by 50% and allowed a reduction in the U-value to 0.3 W/(m2·K).

1.2. Literature Review on Estimating the Impact of Glazing on Energy Demand

Tettey et al. [12] analysed various strategies for designing a multi-family house in terms of minimizing energy consumption for heating and cooling purposes. The object of this case study was a building consisting of 24 apartments with a total living area of 1686 m2. It was made in accordance with Swedish standards from 2014, and its annual final energy consumption index was 71.6 kWh/m2. The parametric analysis covered, among others, the use of different types of glazing system, for which the number of panes, the type of low-emission filters on the glass, the types of gas, and the distance between the panes were changed. The results of the calculations showed that it was possible to reduce energy consumption of this study building from 19% to even 34%, depending on the modernization scenario used.
Several improvements to the Korean building energy code, that could contribute to reducing energy demand, were proposed by Ihm et al. [13]. Various types of glazing were subjected to a multi-variant economic and environmental analysis, which considered their thermal characteristics and the ratio of window to wall area. The building (typical housing unit) being the object of the research was placed in two different climatic zones of South Korea, in Inchon and Ulsan. It turned out that in mild climate conditions, the best solution were windows characterized by a low value of the coefficient of solar heat gains, in particular, it concerned large glazed areas. In addition, clear double glazing, which is currently recommended in the Korean building standard, was found to be less energy efficient than windows with low-e coatings.
Determination of the optimal solution of the building facade in terms of energy efficiency and economic indicators was made by Thalfeld et al. [14]. The authors of this study applied a method based on energy simulations using the IDA ICE 4.5Energy software. The object of the research was one storey office building divided into 5 zones with dimensions of 33.6 m × 16.8 m, which was located in Estonia. The thermal characteristics of the windows, the level of insulation of the external wall and the different types of shading were the main parameters considered in the analysis. It turned out that the optimal solution for the cold climatic conditions of Estonia were low-emission triple-glazed windows with a high value of the solar heat gain coefficient. In addition, the thickness of the external wall insulation should be 200 mm, and the ratio of the glazing area to the wall area should be about 25%. The quadruple and five-glazed windows, analysed in this study, were similar to the external wall in terms of heat loss. The use of this type of windows, even with the minimum required ratio of their area to the wall area, did not turn out to be optimal.
The influence of the way of building renovation on the reduction in energy demand for cooling in the climatic conditions of Egypt was studied by Edeisy et al. [15]. The object of the research was a block of flats located in Cairo, consisting of 12 apartments. Energy simulations with the EnergyPlus software was chosen as the research method for this analysis. In the initial variant, the building had single-pane glazing and consumed 67,320 kWh of energy for cooling per year. This was associated with the emission of 31,115 kg of CO2. As a result of the analysis, it was found that the use of double-glazed windows with argon filling would save energy in the amount of 5443 kWh/year, and the quadruple-pane window will reduce the energy demand for cooling in the amount of 6650 kWh. However, the most effective solution turned out a triple-glazed window with low-emission coating, which allows to reduce the cooling load by about 31%.
Fekri et al. [16] developed a new window construction. The innovative element of which was the use of so-called smart mid-shade to regulate solar heat gains. The shading level is controlled by an IoT system that monitors the presence of people in the room. A number of energy simulations were performed using EnergyPlus and Window software to compare windows with intelligent shading control to conventional solutions. The computational analysis was carried out for seven locations in the United States. The simulation results revealed that energy savings through the use of an IoT system can range from 8.9% in Honolulu (Hawaii) to 27% in Los Angeles (California).
The issue of limiting the impact of various types of glazing on solar heat gains was studied by Gorantla et al. [17]. The authors of this investigation used multi-variant energy simulations, which were performed using the DesignBuilder software. The object of the research were multi-pane windows consisting of one to four panes made of different types of glass. Sixty-four models of houses were made, and their energy characteristics covered the four climatic zones of India. Analysis of the simulation results showed that the most effective glass material in terms of reducing the energy demand for cooling turned out to be a bronze-reflective glass. As could be expected, the increase in the number of spaces between the panes contributed to the reduction in solar heat gains.
Banihashemi et al. [18] determined the energy performance of an example house in four different climatic zones of Iran. The object of the research was a residential building with an area of 527 m2. It was designed in Revit Architecture and then exported to energy simulation software EnergyPlus. The variables subjected to this analysis were, among others: heat-transfer coefficient, and solar heat gains of 25 windows types. Analysis of the results showed that the use of double-glazed windows in temperate and hot-dry climates was energy efficient throughout the year. However, in cold and hot-humid climates, the use of these windows turned out to be beneficial only in selected months with the highest demand for heat and energy for cooling.
The influence of various aspects related to glazing in a residential building was studied by Kim et al. [19]. Sixty-five building information models (BIM) were developed using Autodesk Revit software, that contained design scenarios considering different orientations, positions and dimensions of windows. Autodesk Green Building Studio was used to perform energy simulations. Unfortunately, the article does not provide the U-value for the analysed windows and external walls of a single-family two-storied house considered as a case study. Based on the results of energy simulations performed with Autodesk Green Building Studio, it was determined that the studied house requires the least energy demand when the windows are placed halfway up the room. This conclusion was identical for all cardinal orientations. In addition, it was found that windows facing east had the greatest impact on the house’s energy load.
Thalfeld et al. [20] determined the difference between the building’s energy demand resulting from the degree of detailing of the window models. Energy simulations were performed using the IDA ICE 4.6 software, and the test object was one floor of an office building with dimensions of 33.6 m × 16.8 m. These tests covered three, four and five-pane windows, and the climatic conditions were adopted for Estonia. The simulation results showed that the differences in the building’s heat demand were 1.9 kWh/m2 depending on whether the model is simplified or detailed. In the case of energy demand for cooling, this difference was much higher and amounted to 6.4 kWh/m2. The lowest differences in the calculation results occurred in the models of four-pane windows, while the highest errors were obtained with the use of three-pane window models.

1.3. Aim and Scope of the Analysis

The literature review presented above proves the continued popularity of the subject of window characteristics impact on the building’s energy consumption. There are a lot of partial issues related to this topic and it is difficult to fully characterize them all. Our search and evaluation of the available literature did not lead to finding a universal mathematical relationship, thanks to which it would be possible to assess the impact of the assumed glazing system on the energy demand of the building. Most design offices do not perform accurate energy simulations of designed houses. This is why there is a need to provide a tool that would enable the assessment of the energy performance of a building at an early design stage.
The following study resulted from the current needs of a local team of constructors and designers of wooden houses looking for a simple tool to choose the right glazing system depending on climatic conditions. The main objective of this study was to determine the effect of the type of multi-pane windows on the energy demand for heating and cooling of one typical and currently often designed single-family building. In addition, carbon dioxide emissions resulting from the operation of systems to maintain the set indoor temperature in winter and summer were also determined. As we know, the ratio of energy demand to heating and cooling varies depending on the climatic zone. Therefore, the analysis included three locations in Europe with different average outdoor air temperatures, but with similar solar radiation intensity. Changing the size of the windows obviously affects the surface area of the external walls. Therefore, we had to use an additional factor, which is U-value of the house envelope.
Based on the results of the computational experiment, obtained through energy simulations using the DesignBuilder software, four deterministic mathematical models were developed. We can use them to determine the effect of the type of glazing, window area, heat-transfer coefficient of external walls and climatic conditions on the annual energy demand for heating, cooling and CO2 emissions. The degree and nature of the impact of the factors included in the analysis on selected functions were also estimated. Optimization of these parameters was carried out according to the energy criterion and the contribution of each of them to the level of energy consumption was determined. This simple math tool is a noticeable element of novelty in the field of energy efficiency of housing construction and its sustainable development. To the best of the authors’ knowledge, no one has so far presented a similar approach to the mathematical description of the discussed issue.
Three main stages can be distinguished in the study described below. In the first step, the levels of variability of the selected 4 factors affecting the building’s demand for energy for heating and cooling, as well as CO2 emissions, were determined. The next step was to develop deterministic mathematical models based on a four-factor three-level plan, which was based on the results of energy simulations of a selected single-family building. The final stage was the analysis of the impact of selected factors on the energy demand for heating and cooling of the study house and the CO2 emissions correlated with this issue.
According to the authors, the research results obtained and presented in this article, may be useful for scientists, designers of residential buildings as well as local government employees dealing with energy management.

2. Materials and Methods

The impact of window parameters on energy demand and reduction in CO2 emissions was determined using mathematical modelling with the planning of a computational experiment. First, the output and input variables were selected. Calculations were performed only at selected points of the factor space based on the previously developed experiment plan. The database used to create the mathematical model was built on the basis of the energy simulation method. DesignBuilder v.6.1 software was used to achieve this goal. A typical single-family house currently often built in various locations in Europe was chosen for this case study. The successive stages of this analysis, obviously in a simplified form, are presented in Figure 1.

2.1. Characteristics of the House Subjected to Analysis

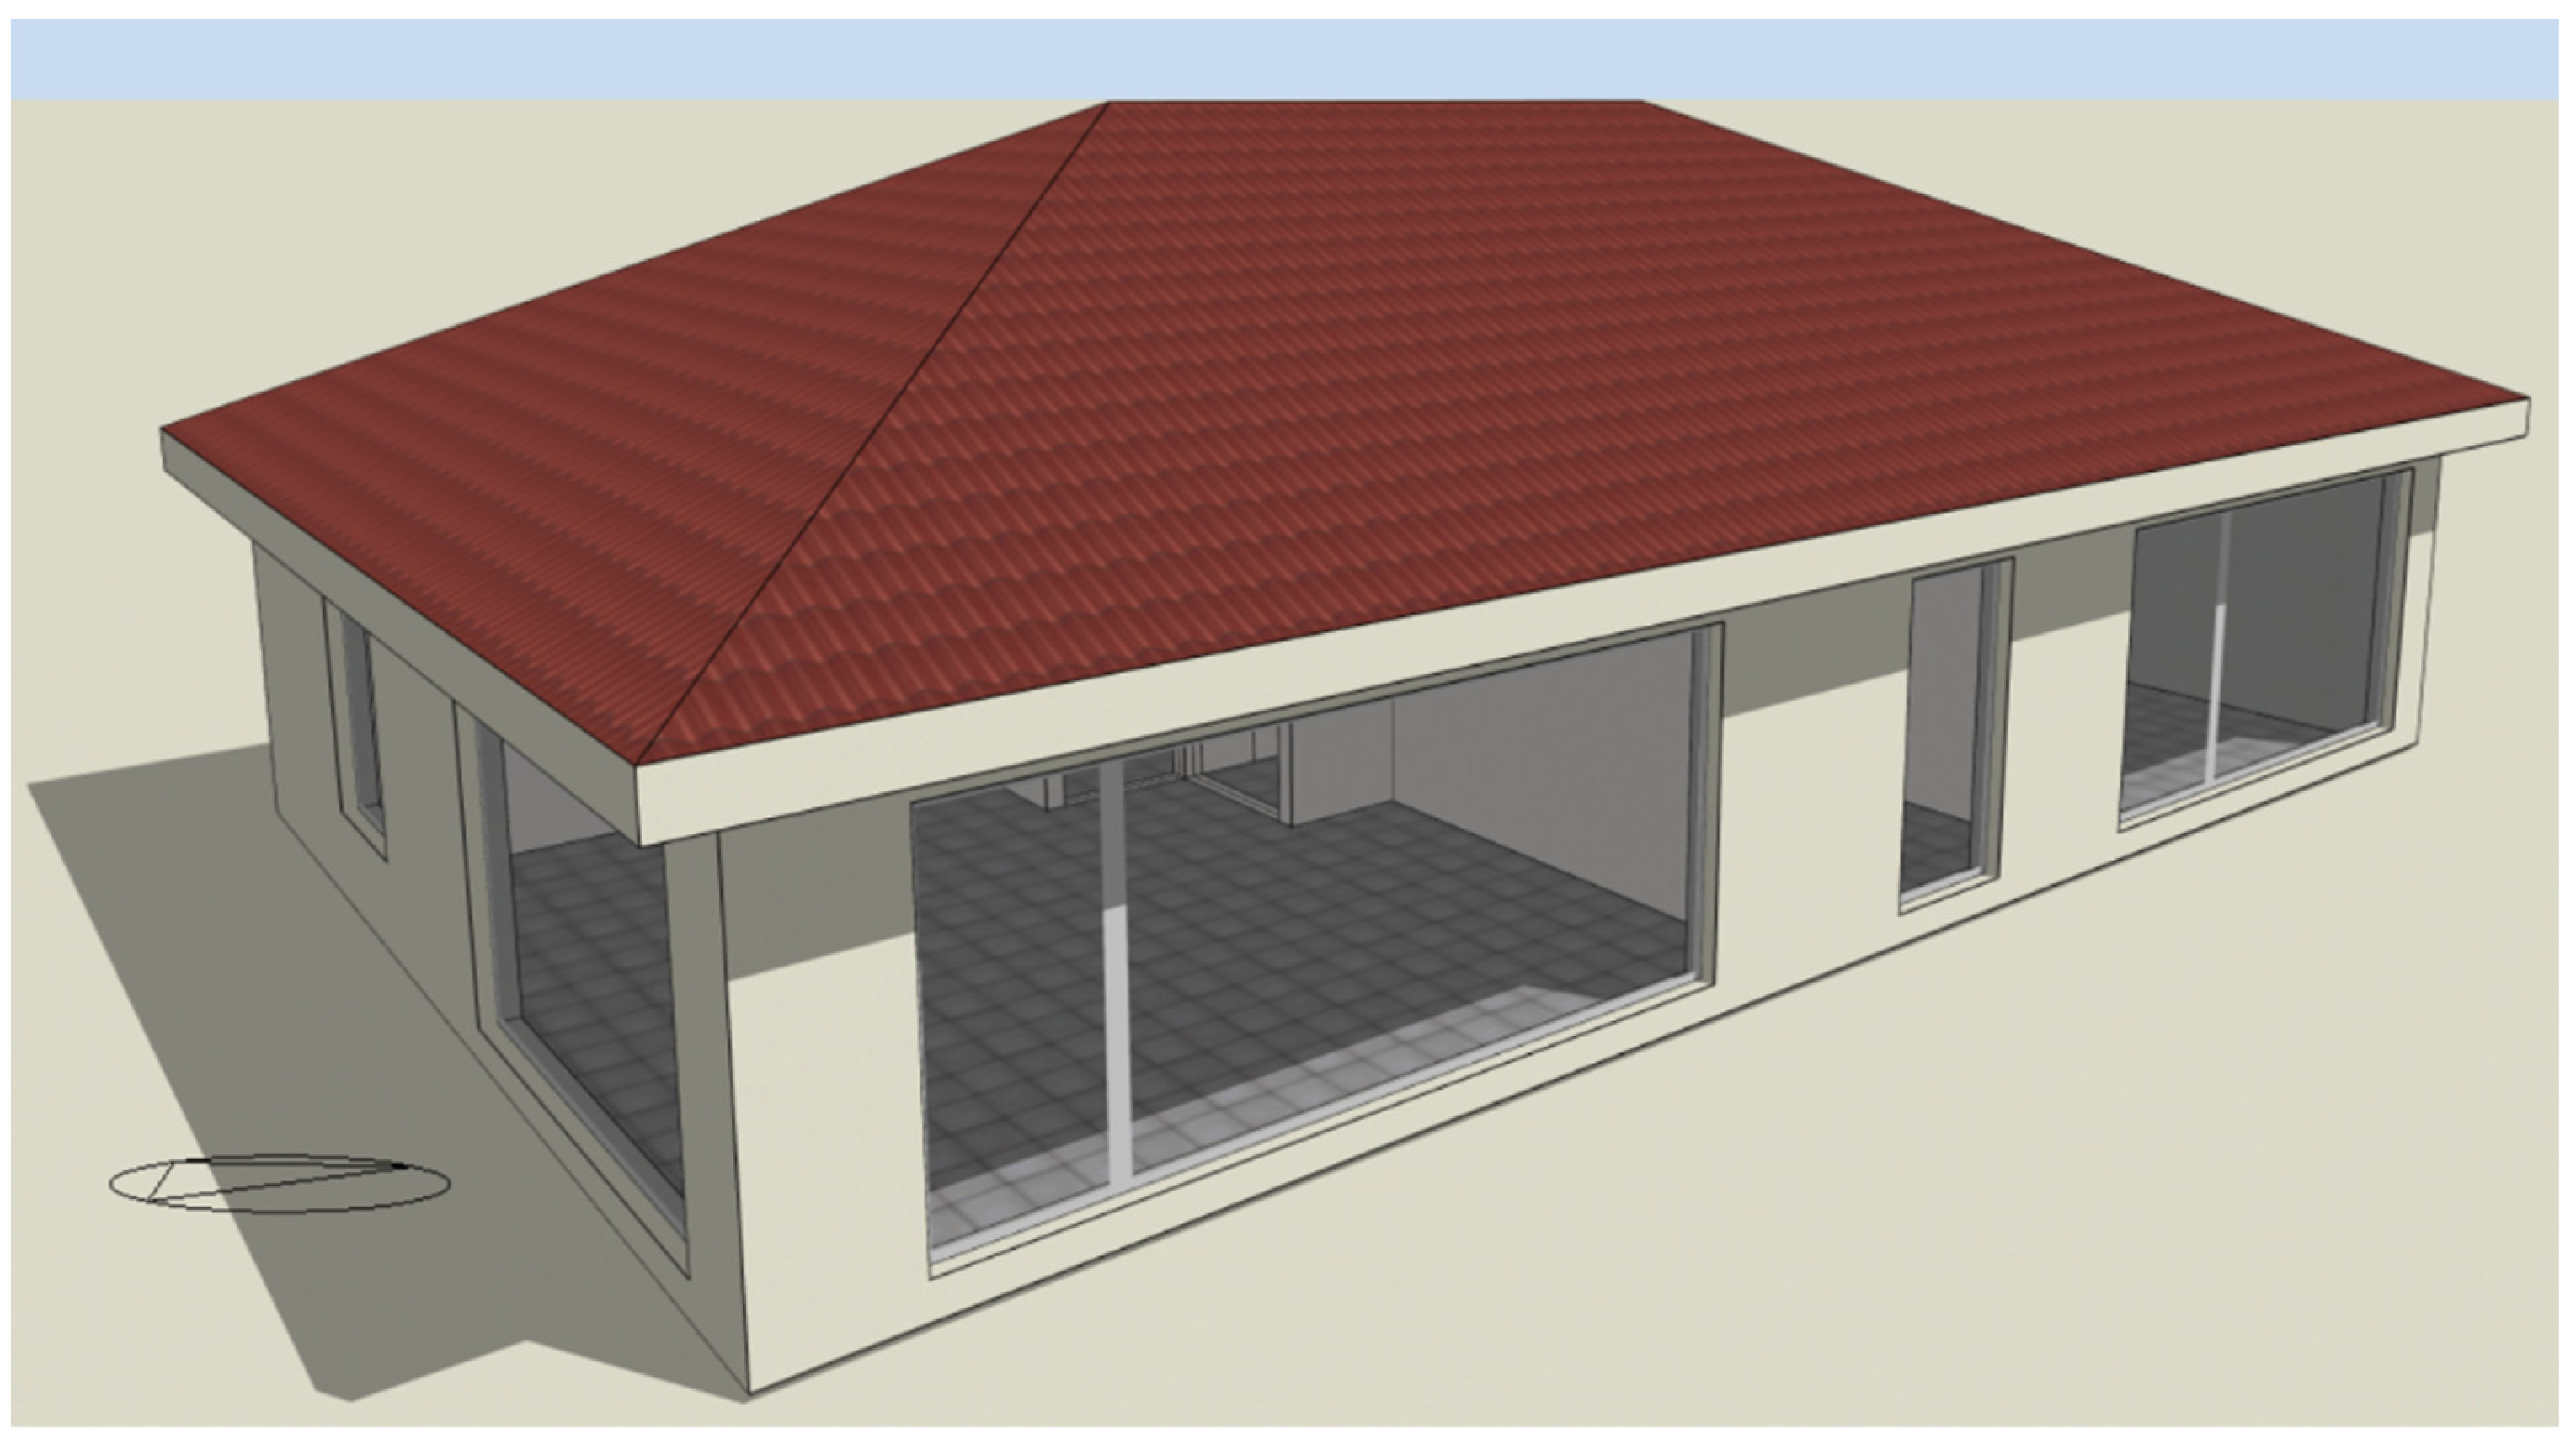
The object of this analysis was a typical single-family house (Perfect 101). A rendered view of this house is shown in Figure 2. Its construction was developed by one of the largest producers of wooden houses in north-eastern Poland. These types of buildings are currently being erected in many locations across Europe. Its timber-frame construction can be classified as a fully ecological solution. A single-storey house with a total area of 101 m2 consists of the following conditioned rooms: vestibule (7.61 m2), corridor (6.14 m2), bathroom (6.29 m2), living room (36.98 m2), bedroom1 (10.53 m2), bedroom2 (14.92 m2), bedroom3 (12.21 m2), toilet (2.94 m2), and an unheated boiler room (3.39 m2).
The building envelope, in the manufacturer’s standard, consists of the following partitions: external wall (UEW = 0.12 W/m2K), roof (UR = 0.15 W/m2K), floor on the ground (UGR = 0.22 W/m2K). Three different values of the heat-transfer coefficient of the external walls, 0.1, 0.15, and 0.2 W/m2K, were assumed for the purposes of the calculation experiment. These values reflect the different currently used standards of thermal protection of energy-efficient buildings. A U-value of 0.1 W/m2K is usually assumed for near-zero-energy houses. Subsequent values were obtained by adding 0.05 W/m2K. This was justified in order to obtain symmetrical intervals, and consequently simplify mathematical calculations.
The glazing system also included three standards: double-pane (single-chamber), triple-pane (two-chamber) and four-pane (three-chamber) windows. The thermal and optical characteristics of the glazing are one of the most important factors examined in this article. Therefore, Table 1 presents their detailed description, which was selected from the database included with the DesignBuilder software.
Another parameter characterizing the building in terms of glazing is the window-to-wall ratio (WWR). It is presented in Table 2, taking into account the increase and decrease in the window area by 30%.
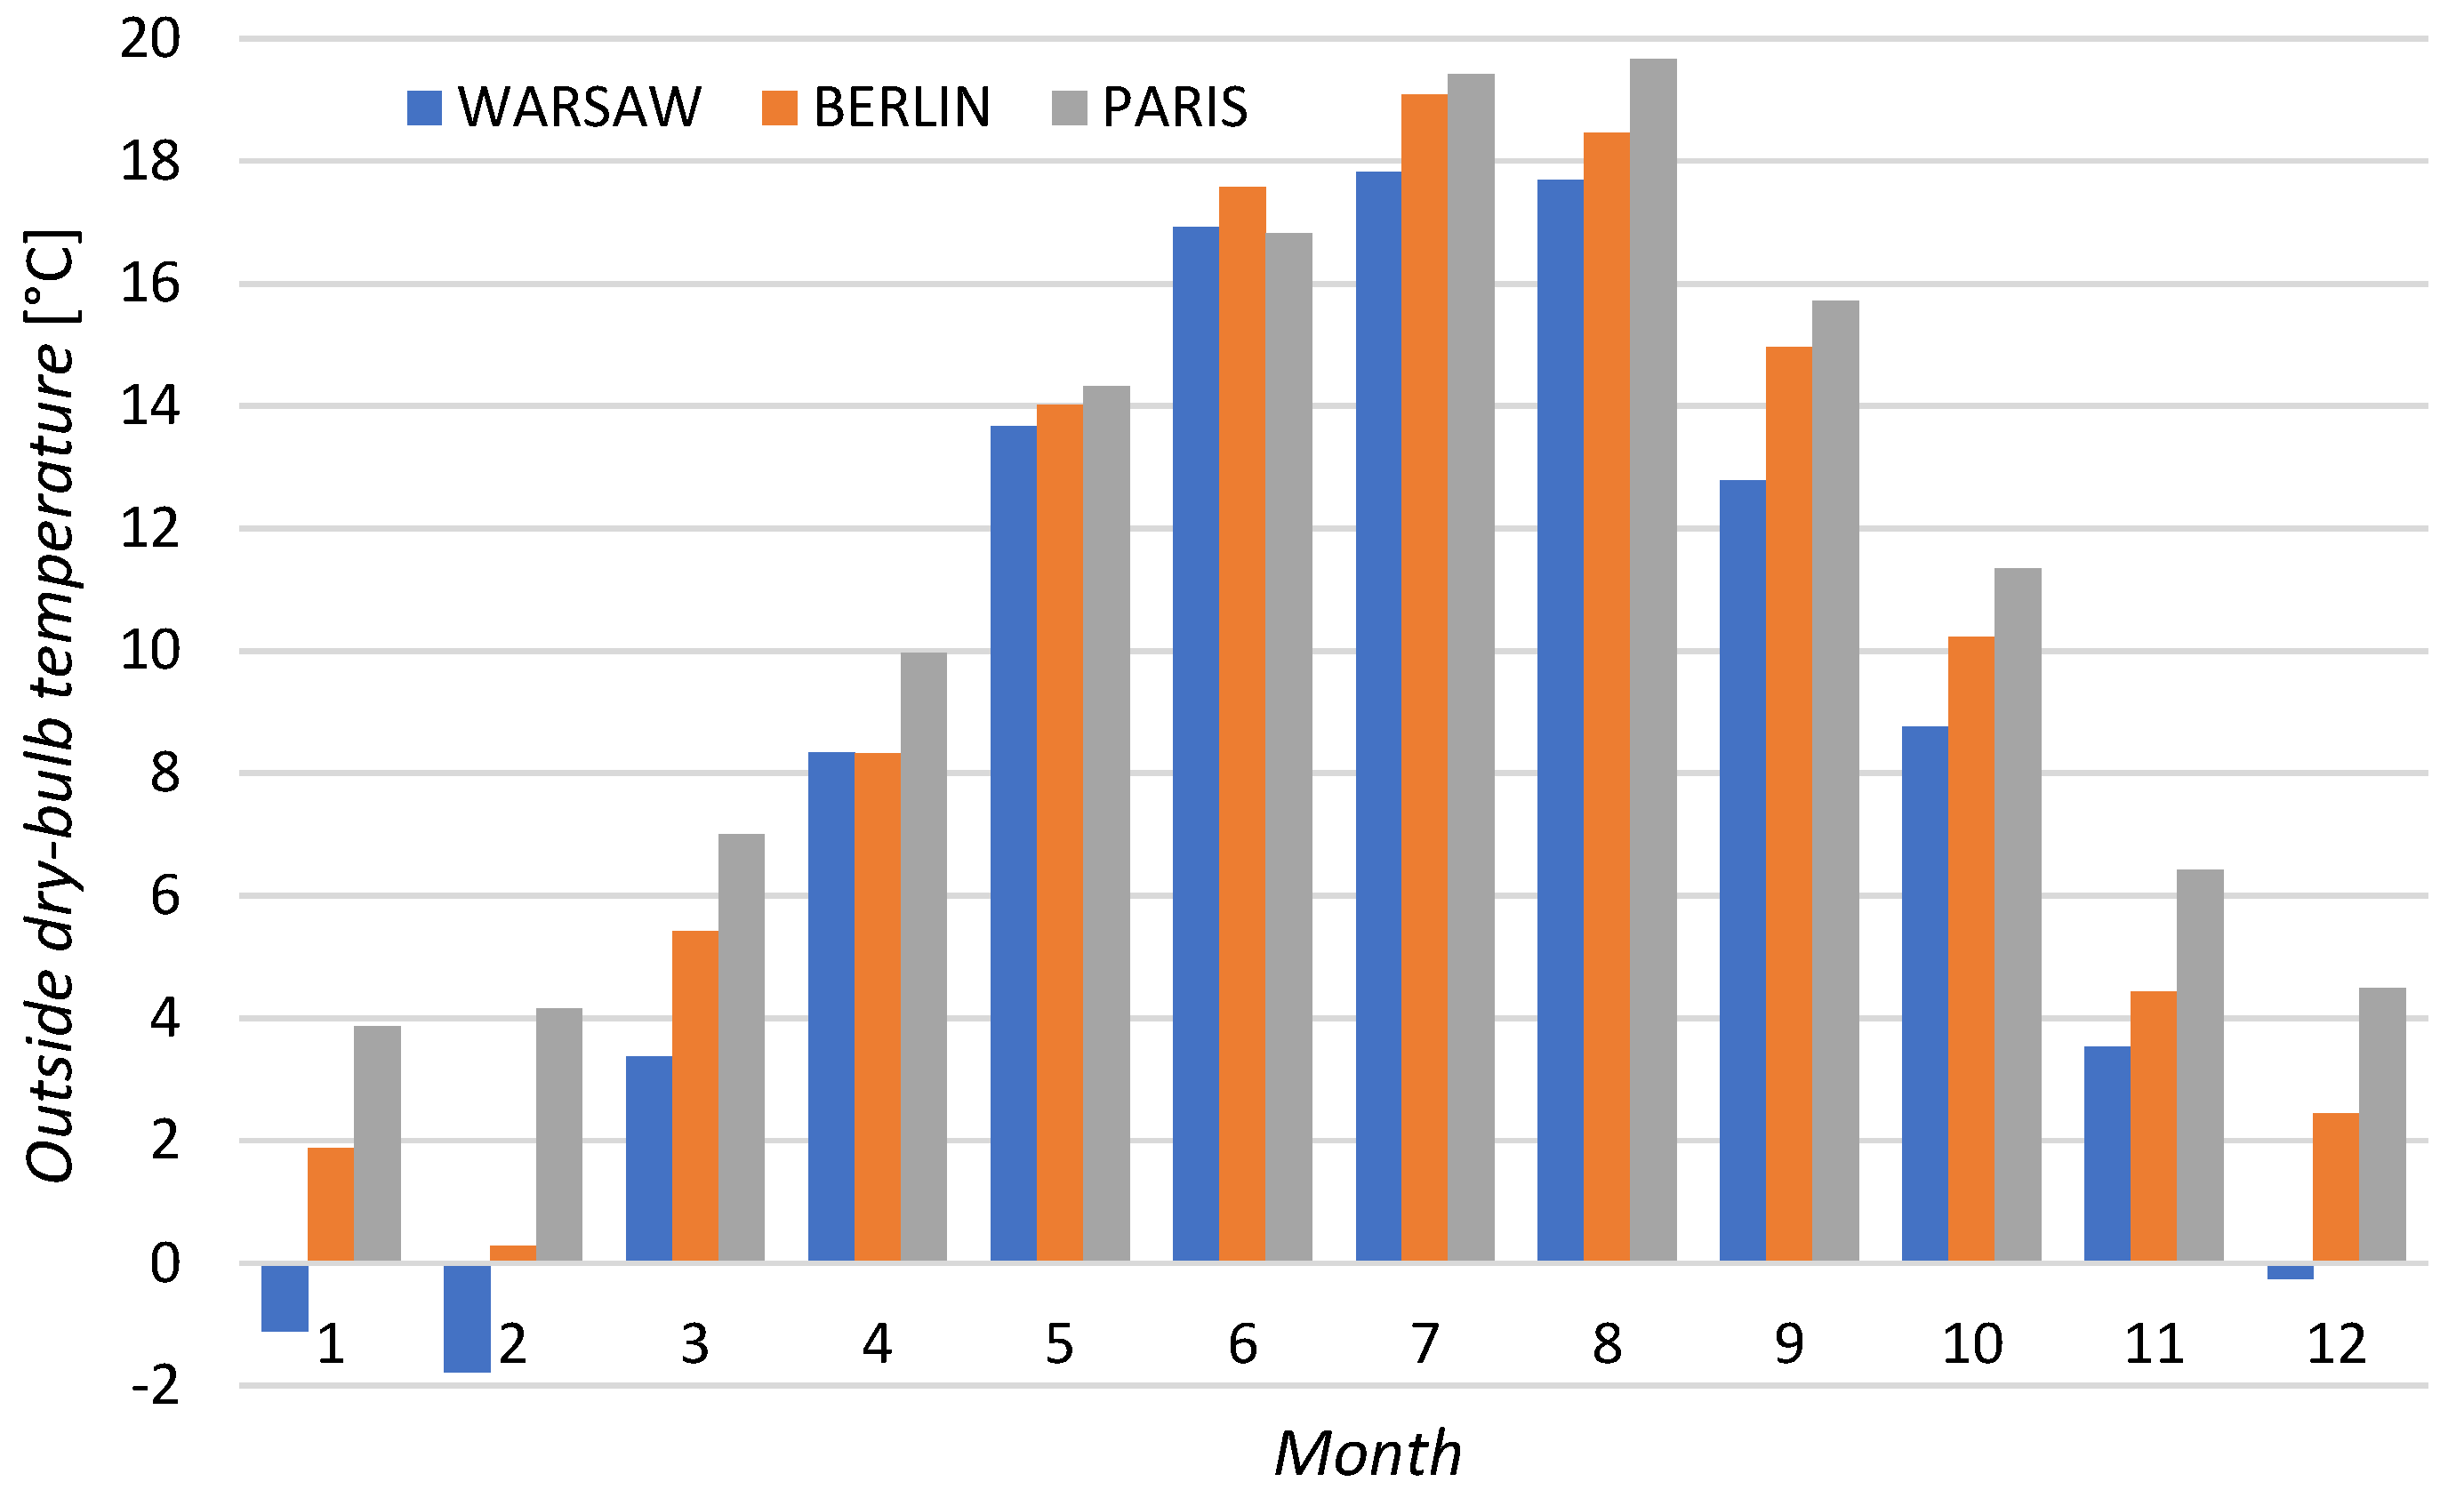
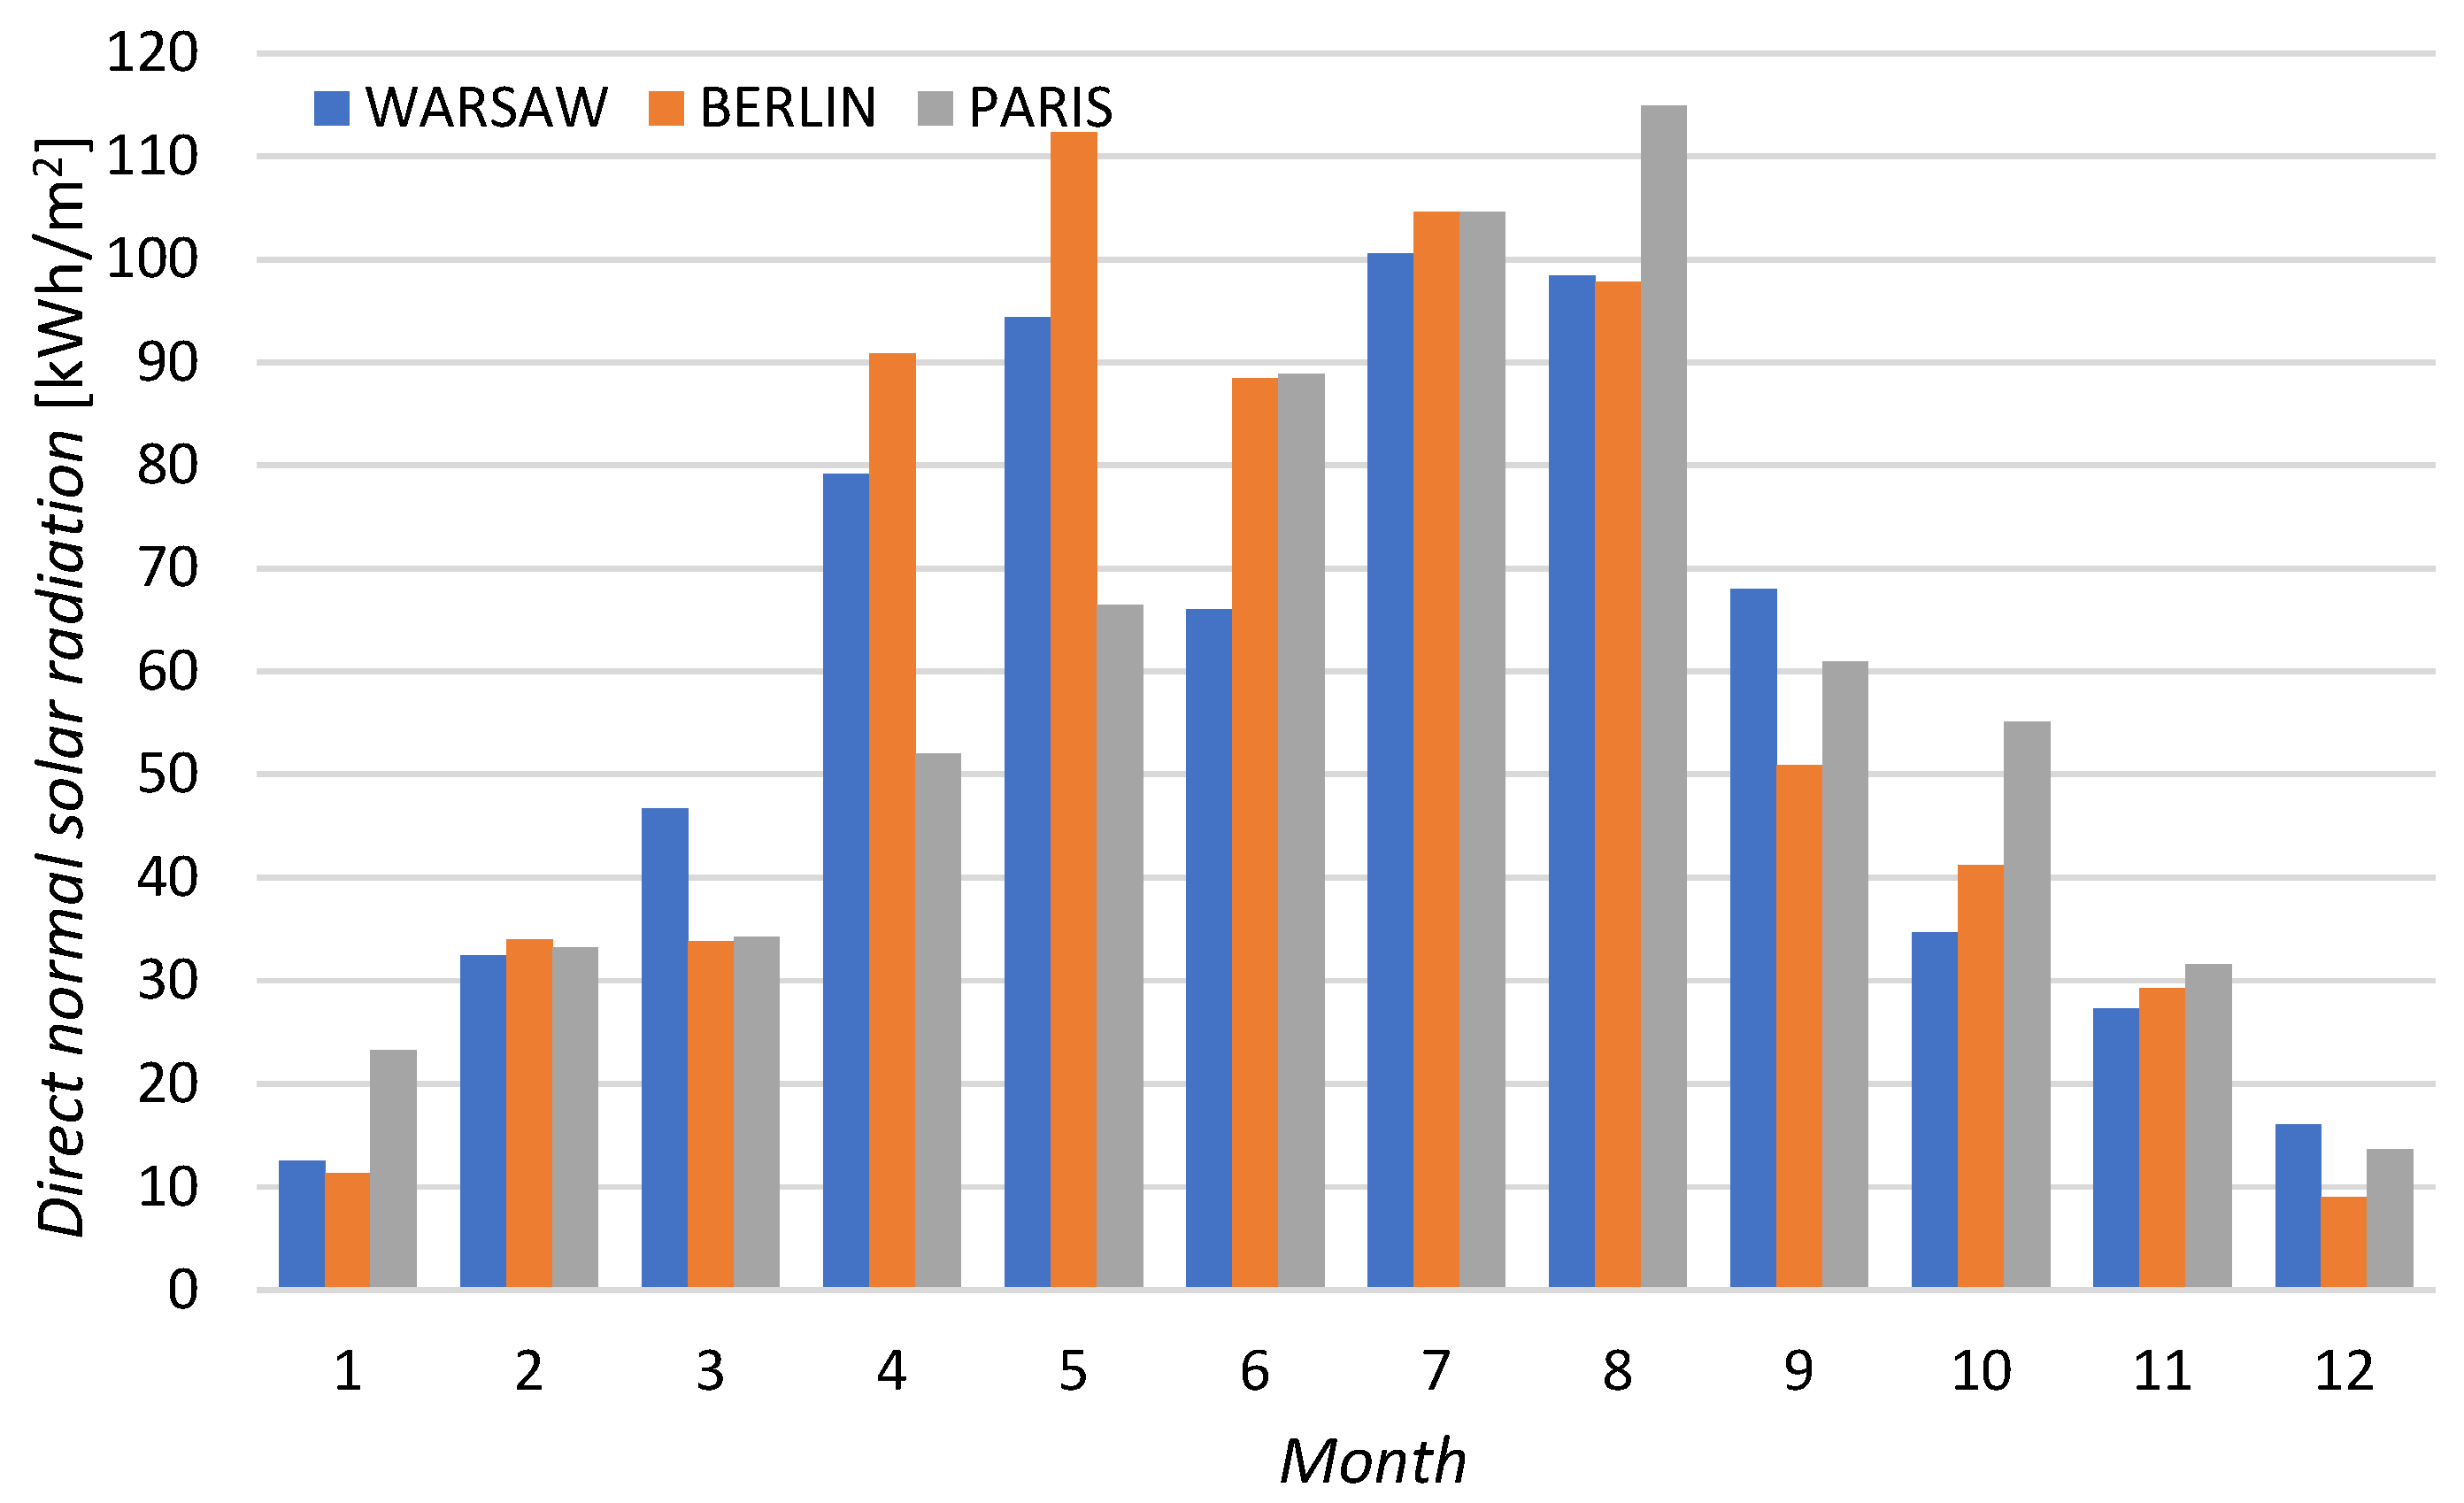
In order to ensure the universality of the analysis, the authors decided to choose three locations for the exemplary house in Europe: Warsaw (Koppen classification—Dfb), Berlin (Koppen classification—Cfb), and Paris (Koppen classification—Cfb). A comparison of the climate parameters for a typical meteorological year (TMY) is shown in Figure 3 and Figure 4.
The annual average outside air temperature is 8.31 °C for Warsaw, 9.76 °C for Berlin, and 11.10 °C for Paris. The choice of these locations was not accidental, because the city with the lowest temperature and the highest temperature differ by about −14% and +14% for the average temperature for the selected cities. This allows for symmetry in terms of factor variability in mathematical modelling.
The average monthly direct solar irradiation is similar and amounts to: 676.49 kWh/m2 for Warsaw, 703.71 kWh/m2 for Berlin, and 678.88 kWh/m2 for Paris. However, after considering the diffuse fraction of solar radiation, the difference in total solar irradiation is only about 4%.
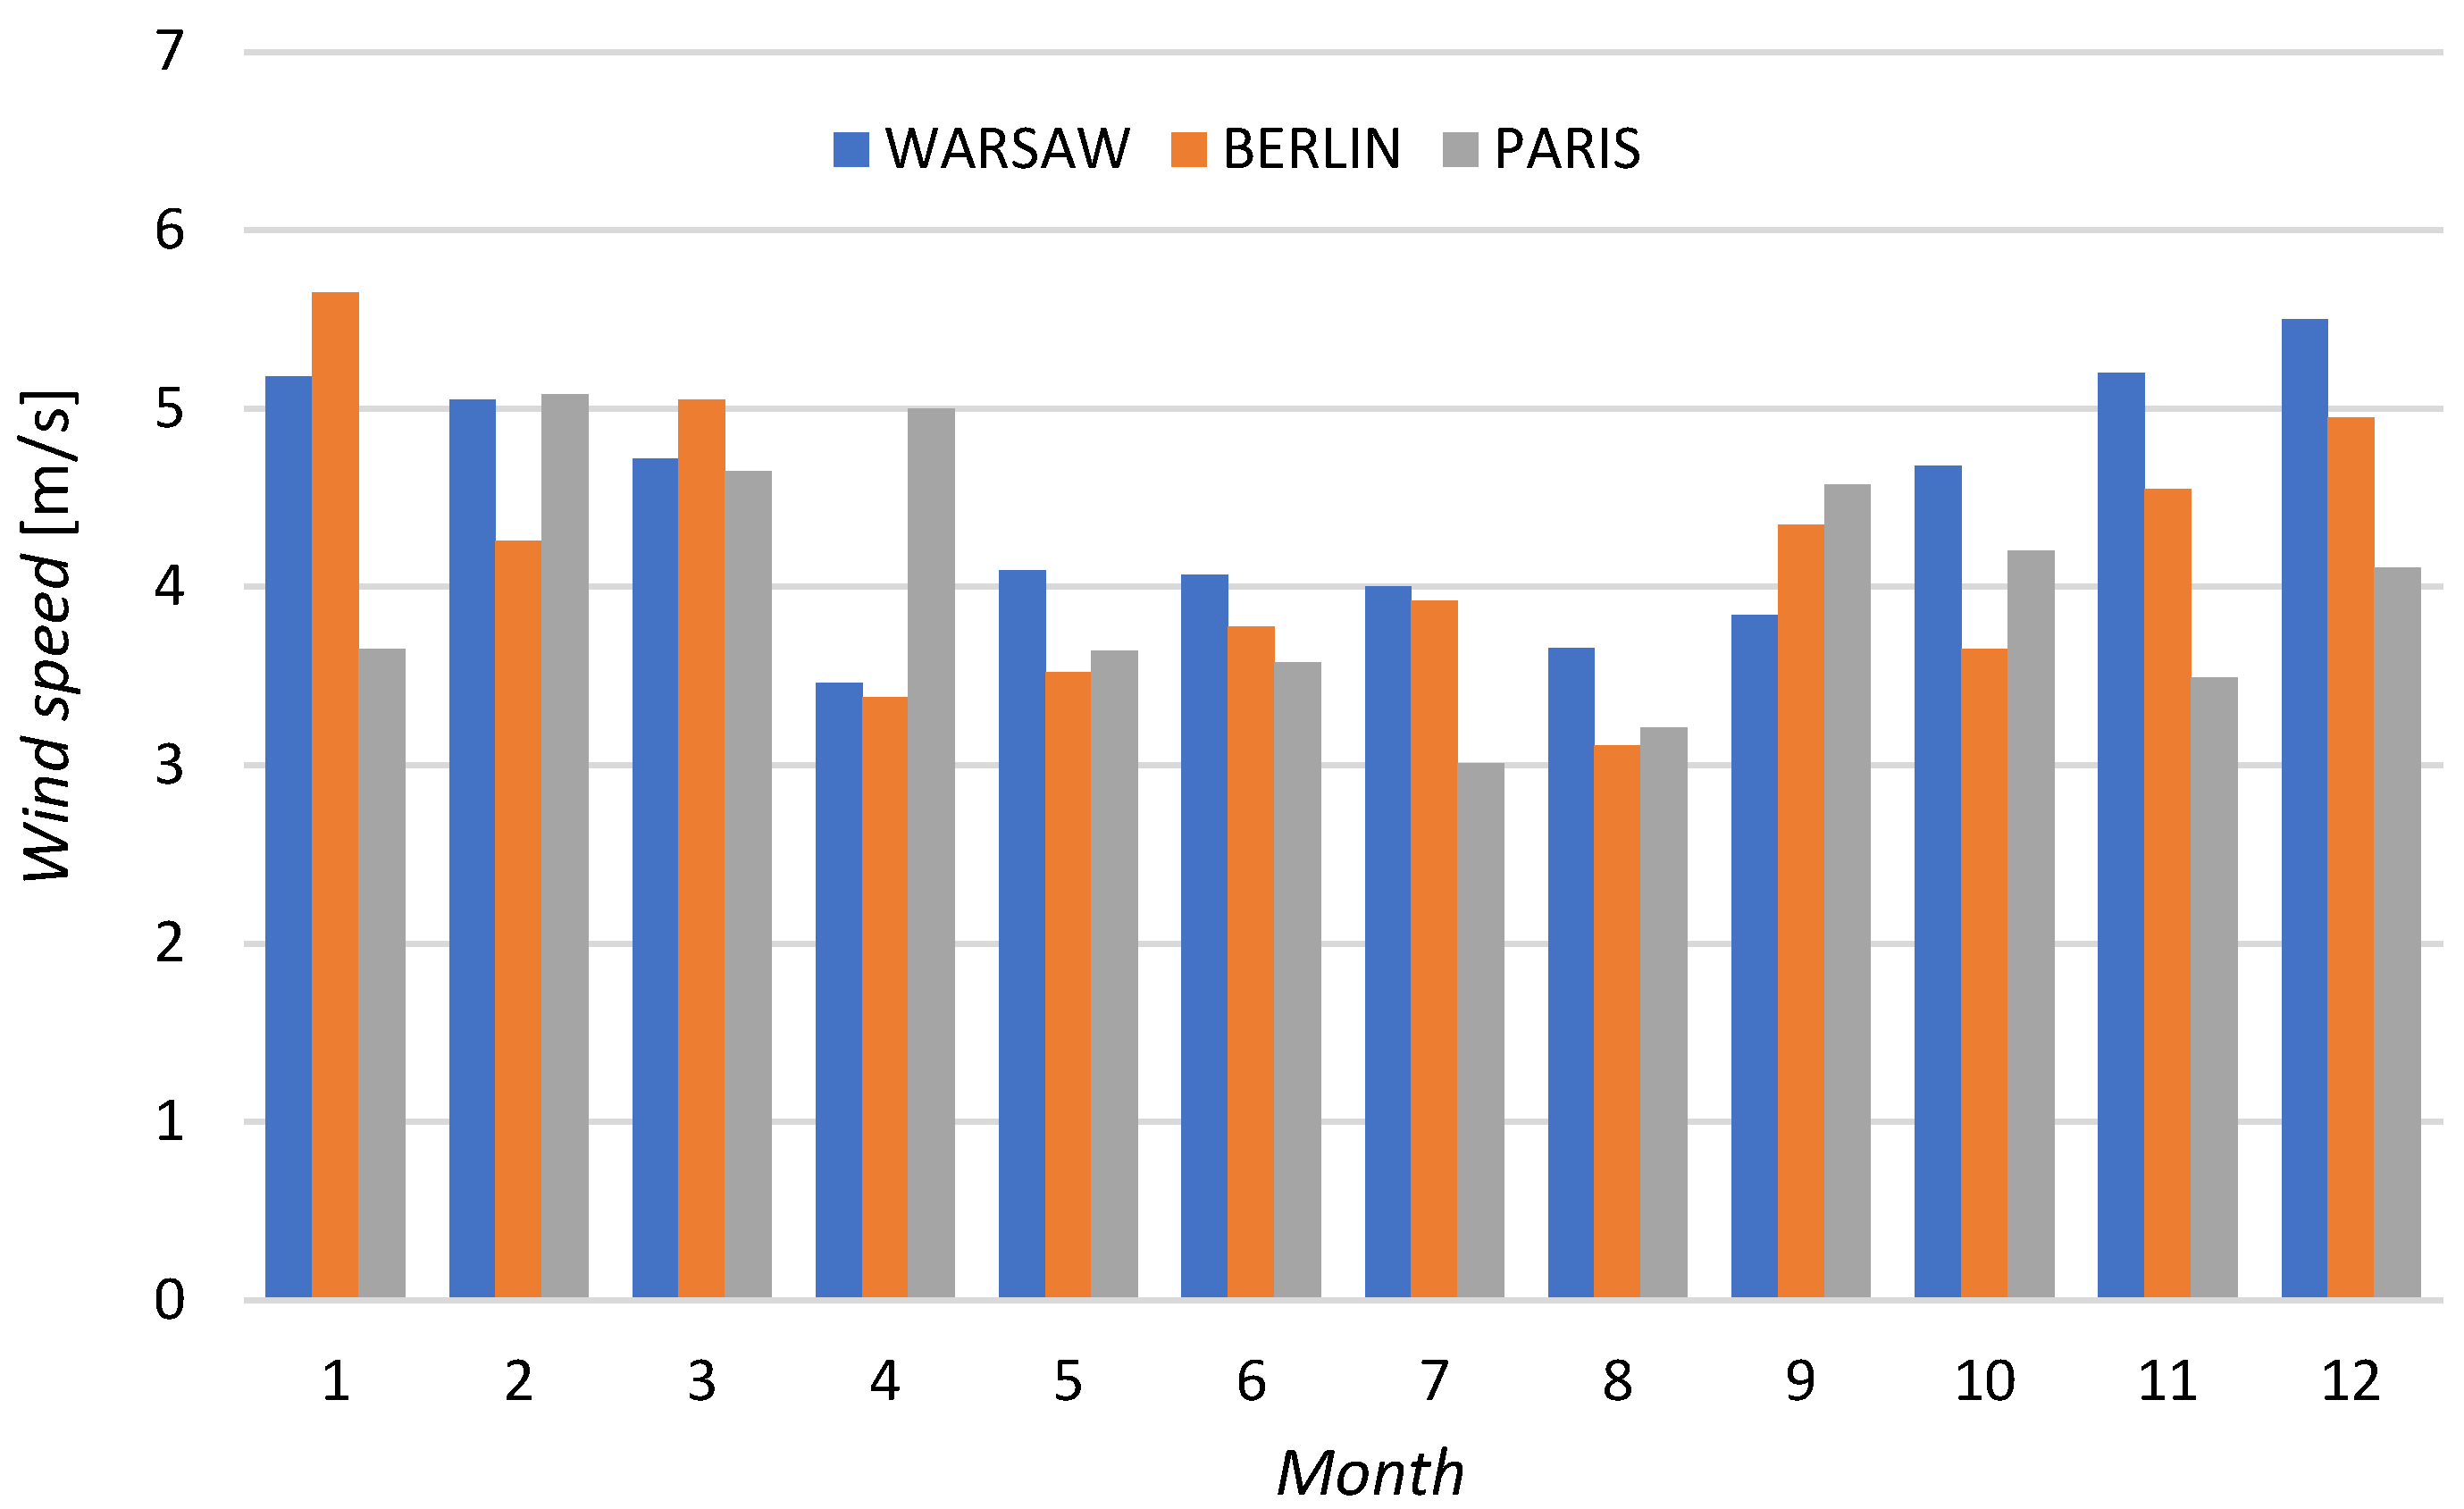
Figure 5 presents another parameter affecting energy consumption, i.e., wind speed in the three cities considered in this analysis. Despite some slight differences in monthly values, the average annual velocity differs little and amounts to 4.45 m/s for Warsaw, 4.18 m/s for Berlin, and 4.02 m/s for Paris. The house was assumed to be airtight; therefore, wind speed has little effect on energy consumption and was not analysed. However, in the software this is taken into account when calculating the heat-transfer coefficient from the outside of the building partitions.

2.2. Main Assumptions for Performing Energy Simulations

The main assumptions assumed in the development of the house model and the energy simulation of the building with the HVAC system are listed below.
  • Calculations were made with an hourly time step over the whole year (8760 h).
  • Three meteorological databases for a typical meteorological year (TMY) for Warsaw (WARSZAWA-OKECIE, WMO-123750), Berlin (BERLIN/TEMPELHOF, WNO-103840) and Paris (PARIS-AEROPORT CHAR, WMO-71570) were implemented for the energy simulations.
  • Heat gains from the occupants were calculated assuming that there are 4 people living in the house.
  • The mechanical ventilation was equipped with a heat-recovery system operating with an average efficiency of 0.7.
  • The energy source for the heating system was natural gas, while the cooling system was powered by electricity.
  • The schedules of the residents’ stay, and the operation of the heating and ventilation systems, were assumed from the database called Schedules/Residential spaces attached to the DesignBuilder software.
  • Window shading was performed with blinds with medium reflectivity slats.
  • Due to the mechanical ventilation, the house was assumed to be airtight.
  • The heating setpoint of the indoor air temperature was 24 °C in the bathroom and 20 °C in the other rooms, and the cooling setpoint temperature from which the cooling period was started was 25 °C.
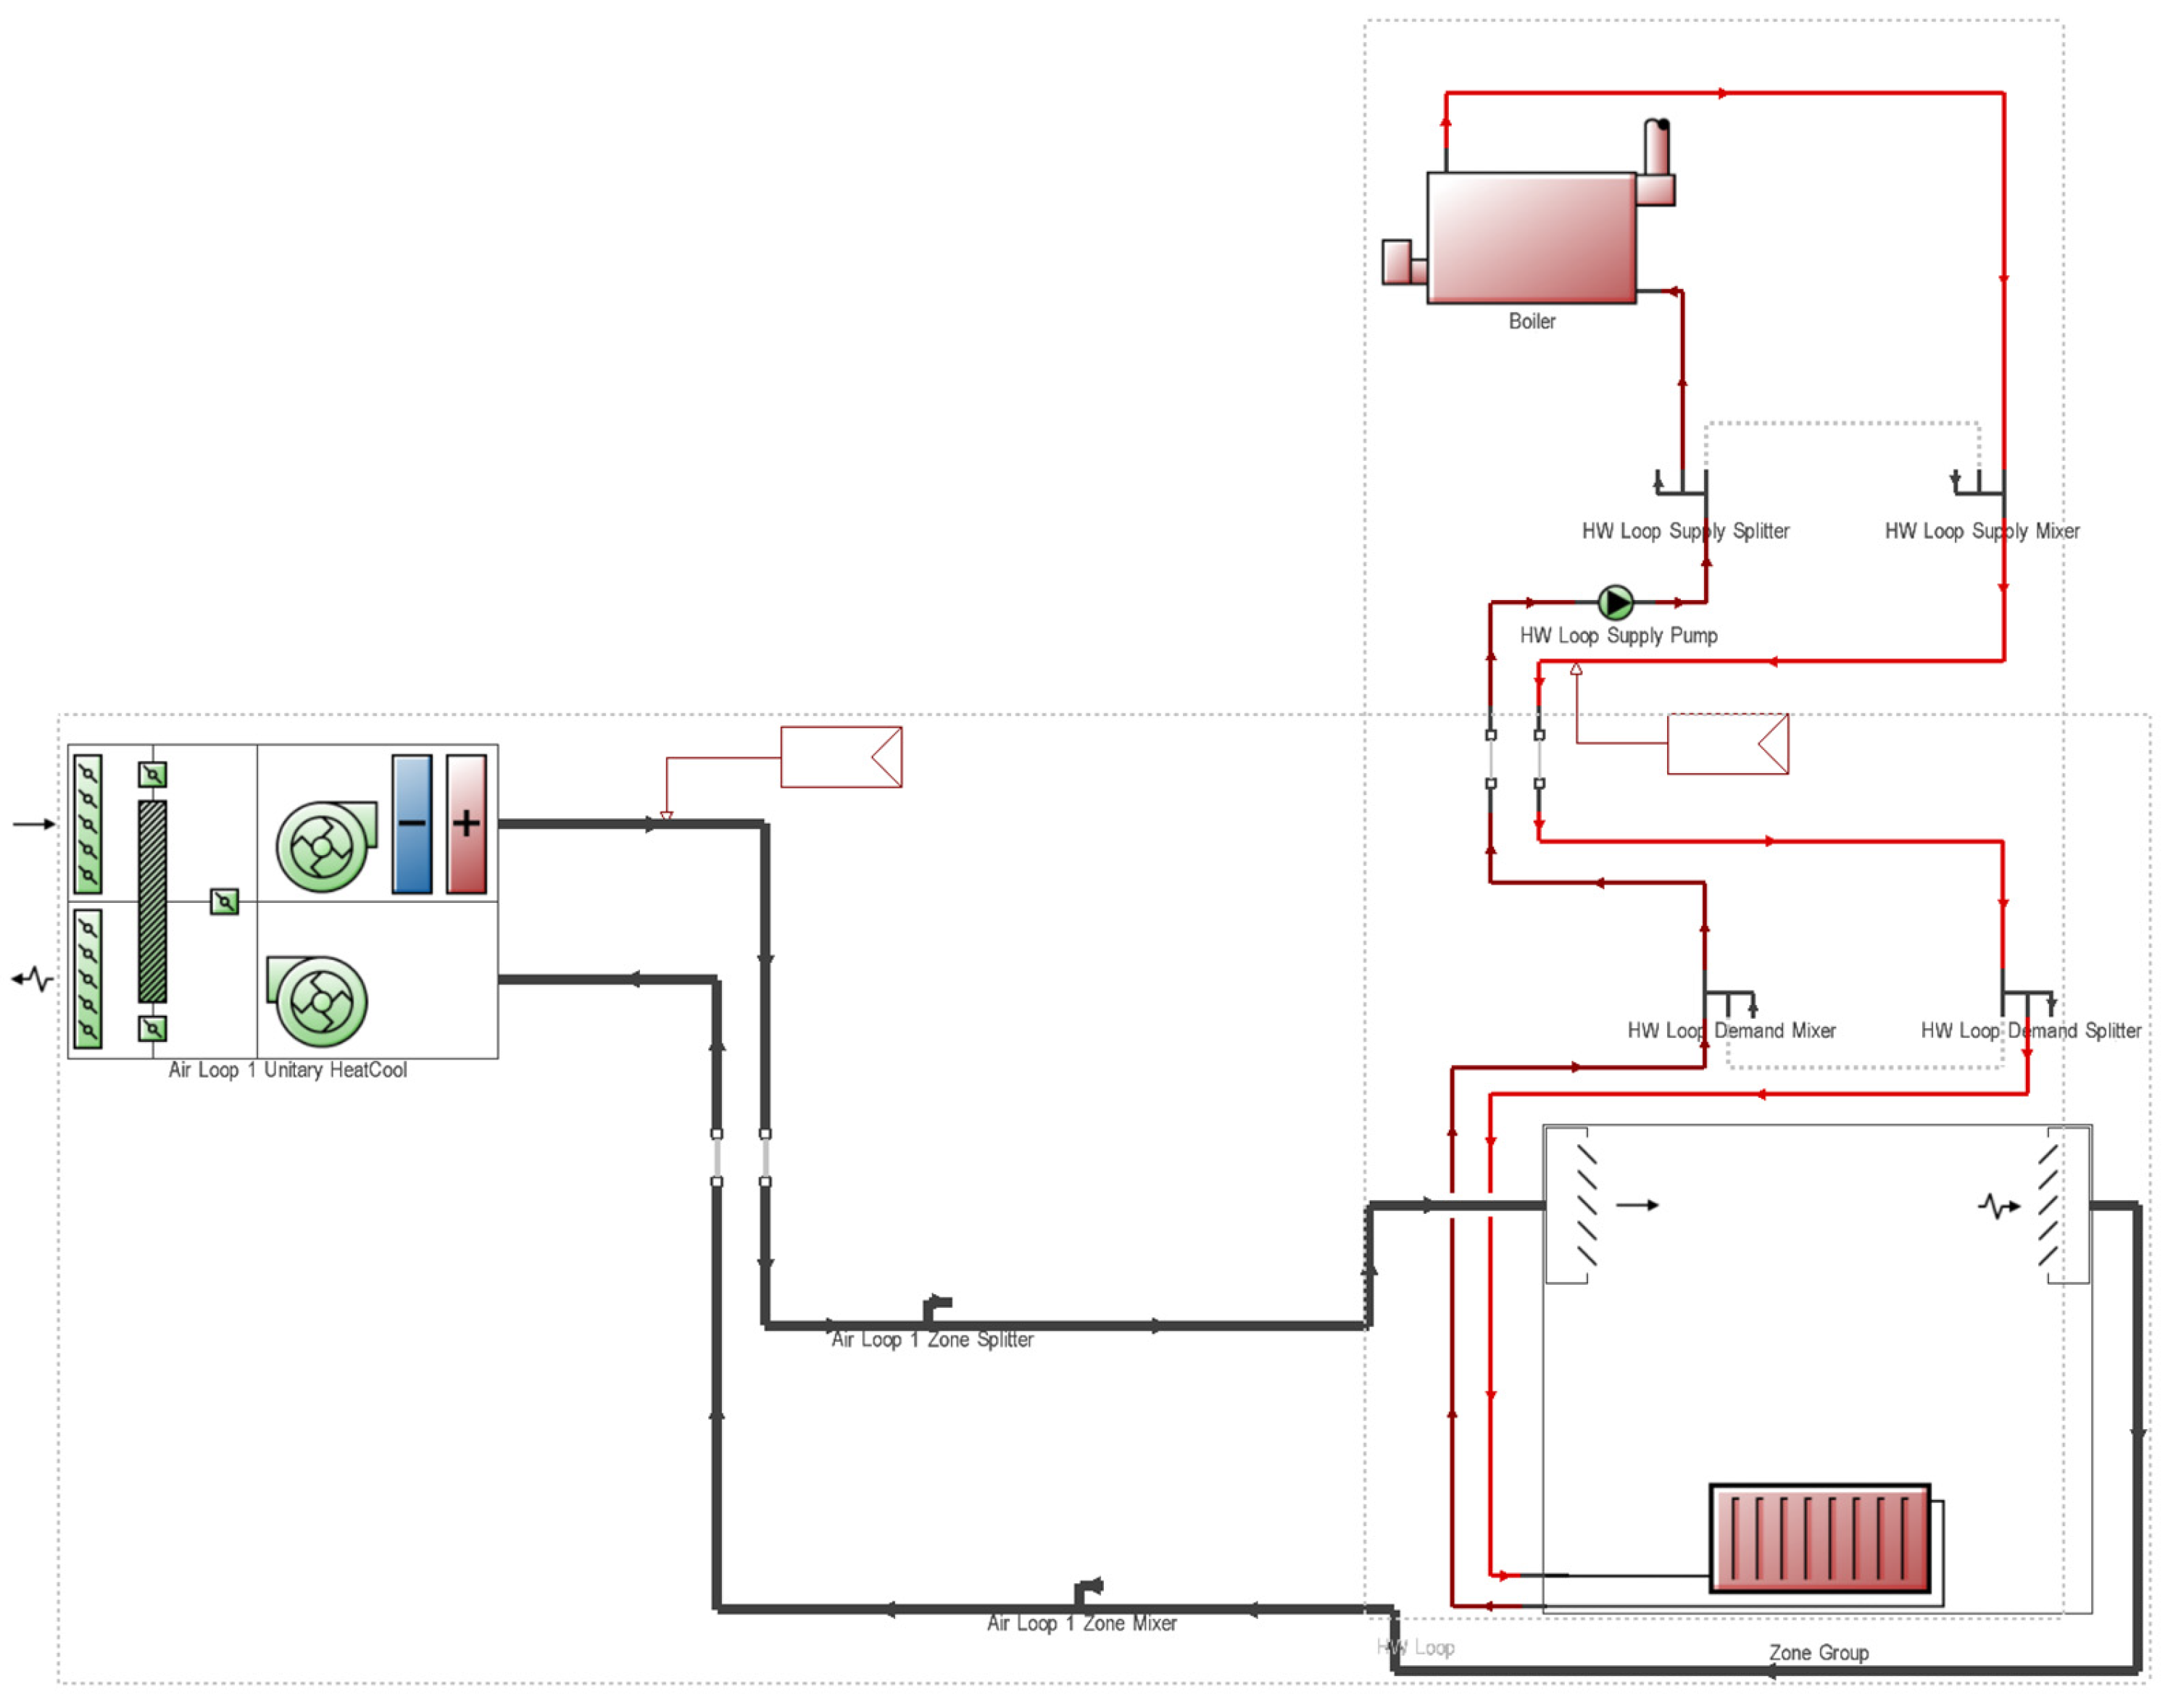
It was assumed that the building was equipped with a heating system consisting of a gas boiler and traditional panel radiators, as well as a mechanical ventilation system with heat recovery from the exhaust air and single-speed DX cooling coil (Figure 6).

2.3. Mathematical Modelling of an Annual Energy Demand for Heating/Cooling and CO2 Emissions

Mathematical modelling in the study of the properties of technical systems is aimed at ensuring the practical usefulness of the developed models as well as their utilitarianism and effectiveness. For this purpose, short models should be formulated, using the most important factors, describing the tested parameter and interesting for the researcher [21].
In accordance with the purpose of this study, four objective functions were defined:
Y1—annual demand for final energy for heating QH [kWh].
Y2—annual energy demand for cooling QC [kWh].
Y3—annual CO2 emissions from building heating and cooling ECO2 [kg].
Y4—annual demand for final energy (sum of energy for heating and cooling) QH+C [kWh].
The selected dependent variables characterize the effects of the functioning of the research object in a convincing manner and meet the generally applicable requirements of the mathematical modelling method. These parameters have a clear physical meaning and unambiguously characterize the functioning of the object, and are measurable, consistent, mutually independent, informative, and statistically effective [21].
In this study, four parameters that affect the building’s heat balance and CO2 emissions were selected:
  • The area of windows AW, which was within the variability range of ±30% from the values proposed in the original design of the building (factor X1).
  • The number of chambers/gas layers N (N = 1—double glazed, 2—triple glazed, 3—quadruple glazed) in the windows, defining a number of physical parameters of the windows and their individual elements (factor X2).
  • Heat-transfer coefficient of UEW external walls (UEW = 0.1, 0.15, 0.2 W/m2K) (factor X3).
  • Locations of building L, defining sets of climatic parameters in three regions in Europe: 1—Warsaw, 2—Berlin, 3—Paris (factor X4).
The choice of factors was related to the goal set by the authors to detect the possible effects of their impact on the reduction in annual energy demand.
It was assumed that the searched functions Y1,2,3,4 = f(X1, X2, X3, X4) can be approximated by polynomials of the second degree (Equation (1)).
Y i = a 0 + a 1 X 1 + a 2 X 2 + a 3 X 3 + a 4 X 4 + a 12 X 1 X 2 + a 13 X 1 X 3 + a 14 X 1 X 4 + + a 23 X 2 X 3 + a 24 X 2 X 4 + a 34 X 3 X 4 + a 11 X 1 2 + a 22 X 2 2 + a 33 X 3 2 + a 44 X 4 2
A four-factor active computational experiment based on a second-order plan was performed to obtain computational results for the description of the three searched functions. In this active experiment, the factors had specific values that were constant in each trial. These experiments were carried out according to optimal plans, the quality of which was confirmed by appropriate criteria. As a result, a limited amount of data was needed to obtain sufficient information about the research object. In this case, 9 second-stage plans for 4 factors were analysed. A three-level plan for 18 trials/cases was selected with high efficiency according to the D-criterion − e(D) = 0.960 [22]. The final results of this experimental analysis are listed in Table 3.
The value of function Y4i was calculated as the sum of Y1i and Y2i functions taken from the plan presented in Table 3.
For the factor X1 (i.e., window areas A0), the average level (0) was the window sizes used in the design of the selected building, i.e., 27.39 m2. At the lower level (−1), the window dimensions were reduced, the area of which in the entire building for all orientations was evenly reduced by 30%. On the upper level (+1), the dimensions of the windows were increased, the area of which in the entire building was increased evenly by 30%.
For Factor X4 (location of the building—L, determining the climatic parameters in Europe), it was taken into account that the climatic conditions are characterized by a whole set of different parameters, regarding the temperature of the outside air, the duration of the seasons, the characteristics of solar radiation, etc. It is difficult to combine all these parameters into one comprehensive indicator. In order to ensure the possibility of general consideration of these parameters and to detect their interaction with other factors, a decision was made to assign the X4 factor three levels, corresponding to three European cities: at the medium level (0) the location of Berlin was assumed, on the lower level (−1)—Warsaw, and upper level (+1)—Paris. Moreover, it was assumed that value of this factor changes numerically and can be analysed in models only for three variants L = 1—Warsaw, L = 2—Berlin, or L = 3—Paris.
The normalized values of factors Xi can be obtained after converting natural values (expressed by integers) i by applying the following formula [22]:
X i = 2 X ˙ i X ˙ i m a x + X ˙ i m i n / X ˙ i m a x X ˙ i m i n
where X ˙ i ,   X ˙ i m i n , X ˙ i m a x —current, minimum, and maximum values of the Xi factor.

3. Results and Discussion

3.1. Development of Mathematical Models of the Tested Parameters

Based on 18 selected cases (Table 3), the least squares method [23] was used to develop four models in the form of Yi regression equations.
The annual energy demand for heating the building QH:
Y ^ 1 = 2974.37 73.33 X 1 258.81 X 2 263.98 X 3 665.18 X 4 113.97 X 1 X 2 45.19 X 1 X 3 22.15 X 1 X 4 + 7.54 X 2 X 3 + 75.28 X 2 X 4 82.72 X 3 X 4 + 66.62 X 1 2 + 200.81 X 2 2 + 60.77 X 3 2 198.80 X 4 2
The annual energy demand for cooling the building QC:
Y ^ 2 = 492.20 + 215.42 X 1 100.10 X 2 4.20 X 3 + 75.03 X 4 45.79 X 1 X 2 8.02 X 1 X 3 + 40.50 X 1 X 4 + 12.65 X 2 X 3 17.38 X 2 X 4 + 4.72 X 3 X 4 + 11.85 X 1 2 14.22 X 2 2 + 5.64 X 3 2 95.23 X 4 2
The annual CO2 emissions resulting from heating and cooling the building ECO2:
Y ^ 3 = 1124.84 + 220.98 X 1 160.47 X 2 + 47.49 X 3 143.31 X 4 72.54 X 1 X 2 17.68 X 1 X 3 + 39.90 X 1 X 4 + 15.31 X 2 X 3 4.15 X 2 X 4 11.16 X 3 X 4 + 26.10 X 1 2 + 24.08 X 2 2 5.82 X 3 2 49.23 X 4 2
The annual demand for final energy (sum of energy for heating and cooling) QH+C:
Y ^ 4 = 3466.57 + 142.09 X 1 358.91 X 2 + 259.78 X 3 590.15 X 4 159.76 X 1 X 2 53.21 X 1 X 3 + 18.35 X 1 X 4 + 20.19 X 2 X 3 + 57.90 X 2 X 4 78.00 X 3 X 4 + 78.47 X 1 2 + 186.59 X 2 2 55.13 X 3 2 294.03 X 4 2
An essential element of validation was testing the adequacy of the developed models using the Fiszer criterion F [23]. The basic assumption adopted in this procedure was the external impact, and the response to this impact is clearly compatible,
F = S y 2 f 1 S r 2 f 2
where:
S y 2 —mean variance;
S r 2 —residual variance (also called unexplained variance);
f1 and f2degrees of freedom (f1 = (N − 1) = 18 − 1 = 17; f2 = (NNb) = 18 − 15 = 3);
N—number of calculation series;
Nb—number of coefficients in the regression equation.
It is important to verify whether the models can be subjected to further analysis, i.e., whether the regression equation describes the calculation results adequately. The models are made correctly if the value of F is greater than the value of Ft, which we read from the appropriate table for the significance level p and the degrees of freedom f1 and f2.
Criterion F for the objective function is equal to:
F1 = 499,645.1629/4235.7465 = 117.9592
F2 = 55,821.9802/340.8518 = 163.7720
F3 = 78,327.9235/1026.0898 = 76.3363
F4 = 519,609.5167/6362.2322 = 81.6709
The value of the criterion read from the table in [23] is definitely lower and amounts to Ft = F(0.05;17;3) = 8.68; that is, the models are adequate and can be further investigated. The coefficients of determination, R 1 2 = 0.9985, R 2 2 = 0.9989, R 3 2 = 0.9977, R 4 2 = 0.9978, confirm their high quality.

3.2. Analysis of the Developed Relationships and Interpretation of the Results

The impact of the above-mentioned factors on the annual demand for energy for heating and cooling and the level of CO2 emissions was analysed on the basis of mathematical models described in Equations (3)–(6). The discussion of the results was made on natural variables for better clarity. The terms “favourable/positive effect” or “favourable/positive factor” used in this chapter, will mean that if the factor changes from the lower to the upper level, the value of Ŷ1,2,3,4 functions decrease.
In order to compare individual cases, the centre GP of the multi-factor space was determined. It is characterized by coordinates corresponding to the average level of factors, i.e.,: window area AW(X1) = 27.39 m2; the number of chambers in the windows N(X2) = 2; heat-transfer coefficient of external walls UE(X3) = 0.15 W/(m2K) and location of the tested building L(X4) = 2 (Berlin).
Using GP as a reference point, the impact of individual factors on the annual heating energy consumption QH was first estimated using the model (Equation (3)). It was revealed that the factors AW(X1), N(X2) and L(X4) have positive effects on Y1 function by lowering the value of QH. The effects of their influence when changing from the lower (−1) to the upper (+1) level are −4.7%, −15.1%, and −38.7%, respectively. As expected, the factor UE(X3) under these conditions has an unfavourable effect on the function Ŷ1 and increased the value of QH by 19.9%. As can be seen from the comparison of these values, the location of the building has the most positive effect. We are able to reduce the energy for heating by 38.7% (1330.36 kWh per year) as a result of a change in location from Warsaw to Paris. Besides this, when the heat-transfer coefficient of external walls changes from 0.10 to 0.20 W/(m2K), the value of QH increases by about 20%, i.e., by 527.96 kWh per year.
Following this, using the model described by Equation (4) we assessed the effect of four factors on the annual energy demand for cooling QC(Ŷ2) when there is a change from the lower (−1) to the upper (+1) level. In this case, the positive effects on the Ŷ2 function are shown by factors N(X2) and UE(X3), which reduce the QC by −34.6% and −1.7%, respectively. On the other hand, the factors AW(X1) and L(X4) have an unfavourable effect on the Ŷ2 function because there is a QC increase of 149.3% and 46.6%. In this analysis, it was found that the number of panes in the window showed the strongest positive effect. We obtain a reduction in the energy for cooling of 34.6%, i.e., 200.2 kWh per year, by increasing the number of chambers from one to three. The influence of the heat-transfer coefficient of external walls turns out to be insignificant. However, when changing the window area from 19.16 m2 to 34.67 m2, QC increases strongly by 149.3%, i.e., by 430.84 kWh per year. The location of the building also has a significant negative effect. Changing the house location from Warsaw to Paris increases the energy for cooling by about 47%, i.e., by 150.06 kWh per year.
Another model (Equation (5)) was used to assess the impact of separate factors on the annual carbon dioxide emissions ECO2(Ŷ3). In this case, the positive effects on the Ŷ3 function, by reducing ECO2 value, show the factors N(X2) and L(X4). We can get ECO2 reduction by −24.5% and −9.6% when changing their values from the lower (−1) to the upper (+1) level. Factors AW(X1) and UE(X3) have an unfavourable effect on the Ŷ3 function and increase the value of ECO2 by 47.5% and 8.9%, respectively. Thus, this means that increasing the number of panes from two to four reduces ECO2 by 24.5%, or 320.94 kg/a. Under these conditions, moving a building from Warsaw to Paris can reduce ECO2 by 9.6% or 98.46 kg/a. However, when the window area increases from the minimum to the maximum, carbon dioxide emissions increase by 47.5%, i.e., by 441.96 kg/a. The heat-transfer coefficient of external walls increases ECO2 slightly by 8.9%, i.e., by 94.98 kg/a with a change from 0.10 to 0.20 W/(m2K).
Interesting results were obtained from the analysis of the last model, described by Equation (6), which can be used to estimate the annual total demand for final energy QH+C(Ŷ4). It turned out that the factors change their tendencies of influencing the energy balance on an annual basis. Such positive effects are shown by the factors N(X2) and L(X4), which reduce QH+C by 17.9 and 31.4%, when there is a change from the lower (−1) to the upper (+1) level. On the other hand, the factors AW(X1) and UE(X3) show an unfavourable effect on the Ŷ4 function and increase the value of QH+C by 8.4% and 16.5%, respectively. This means that increasing the number of panes from two to four reduces the total energy consumption by 17.9%, i.e., by 717.82 kWh per year. A change in the location of the building also has a positive effect. Change in climatic conditions from colder to warmer reduces the annual energy demand by almost a third, i.e., by 1180.3 kWh per year. Moreover, an unfavourable effect is shown by an increase in the area of windows, which increases the value of QH+C by 8.4%, i.e., by 284.18 kWh per year. The influence of the heat-transfer coefficient of external walls, when it changes from 0.10 to 0.20 W/(m2K), also turns out to be unfavourable and increases QH+C by 16.5%, i.e., by 519.56 kWh per year.
The contributions or effects of the factors were assessed as a percentage in relation to the value of the relevant function, which are characterized by high differentiation. Table 4 shows shares in the fluctuations Δ of the tested functions to clearly explain these relationships.
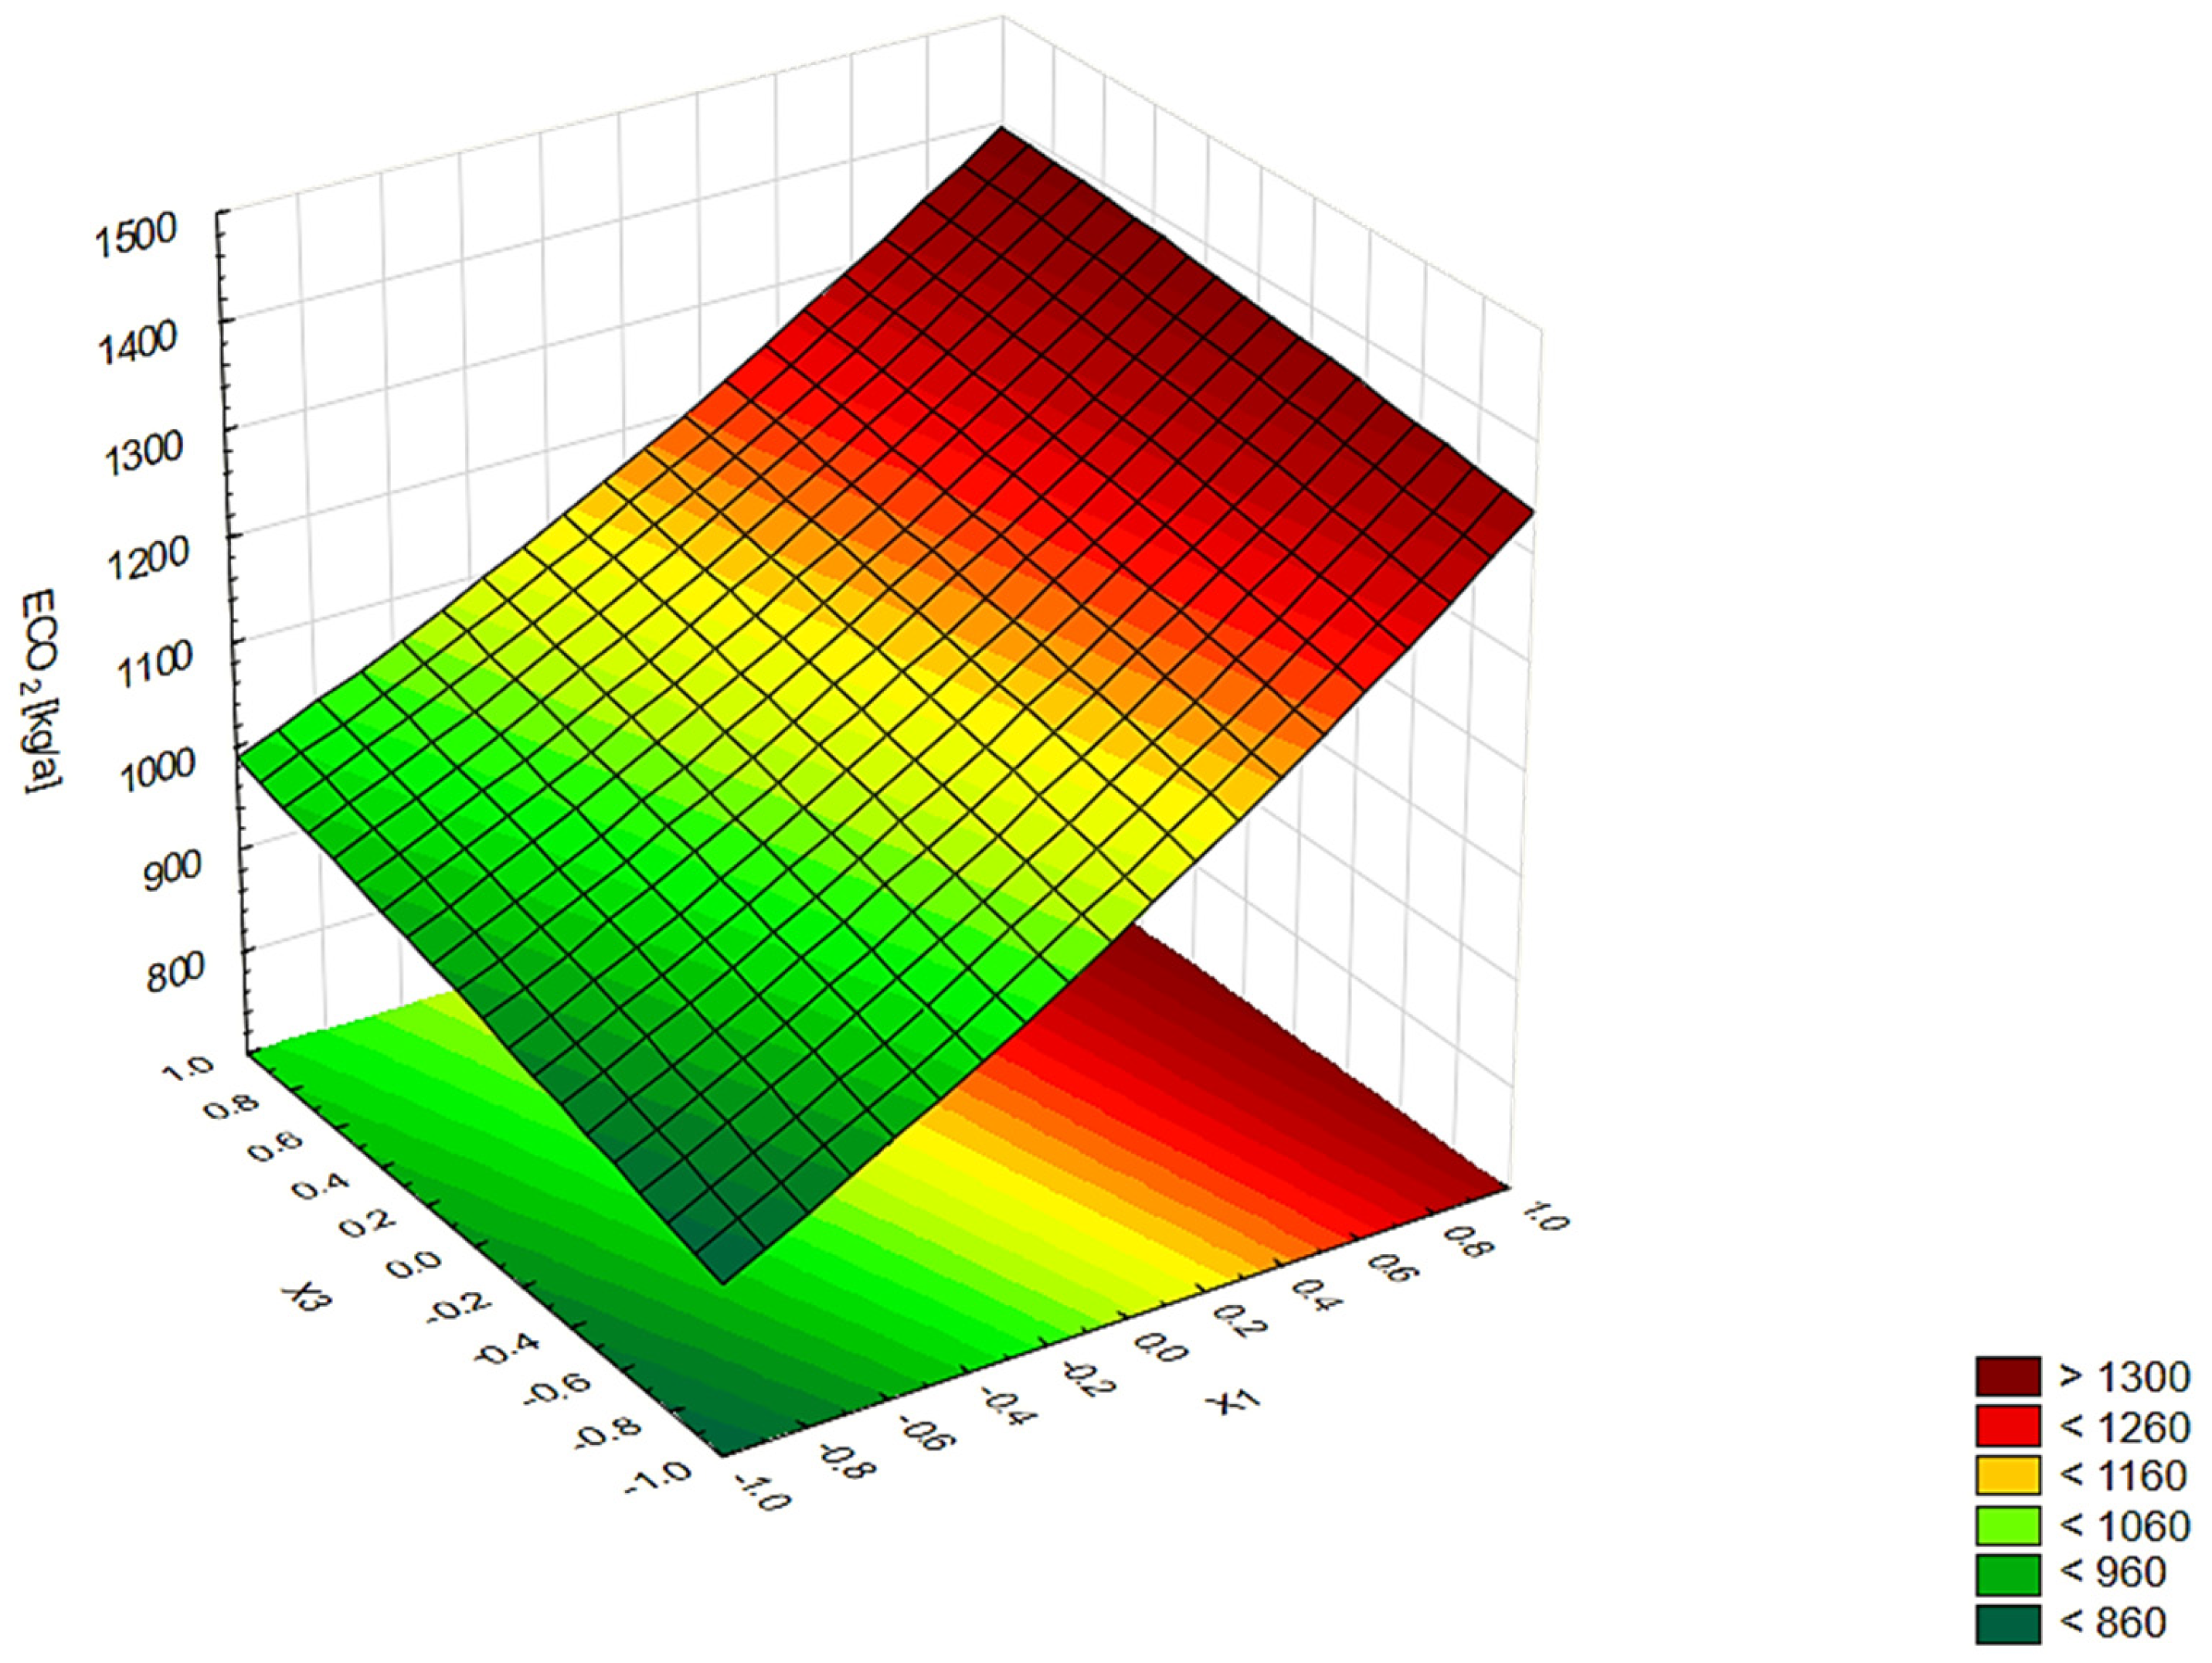
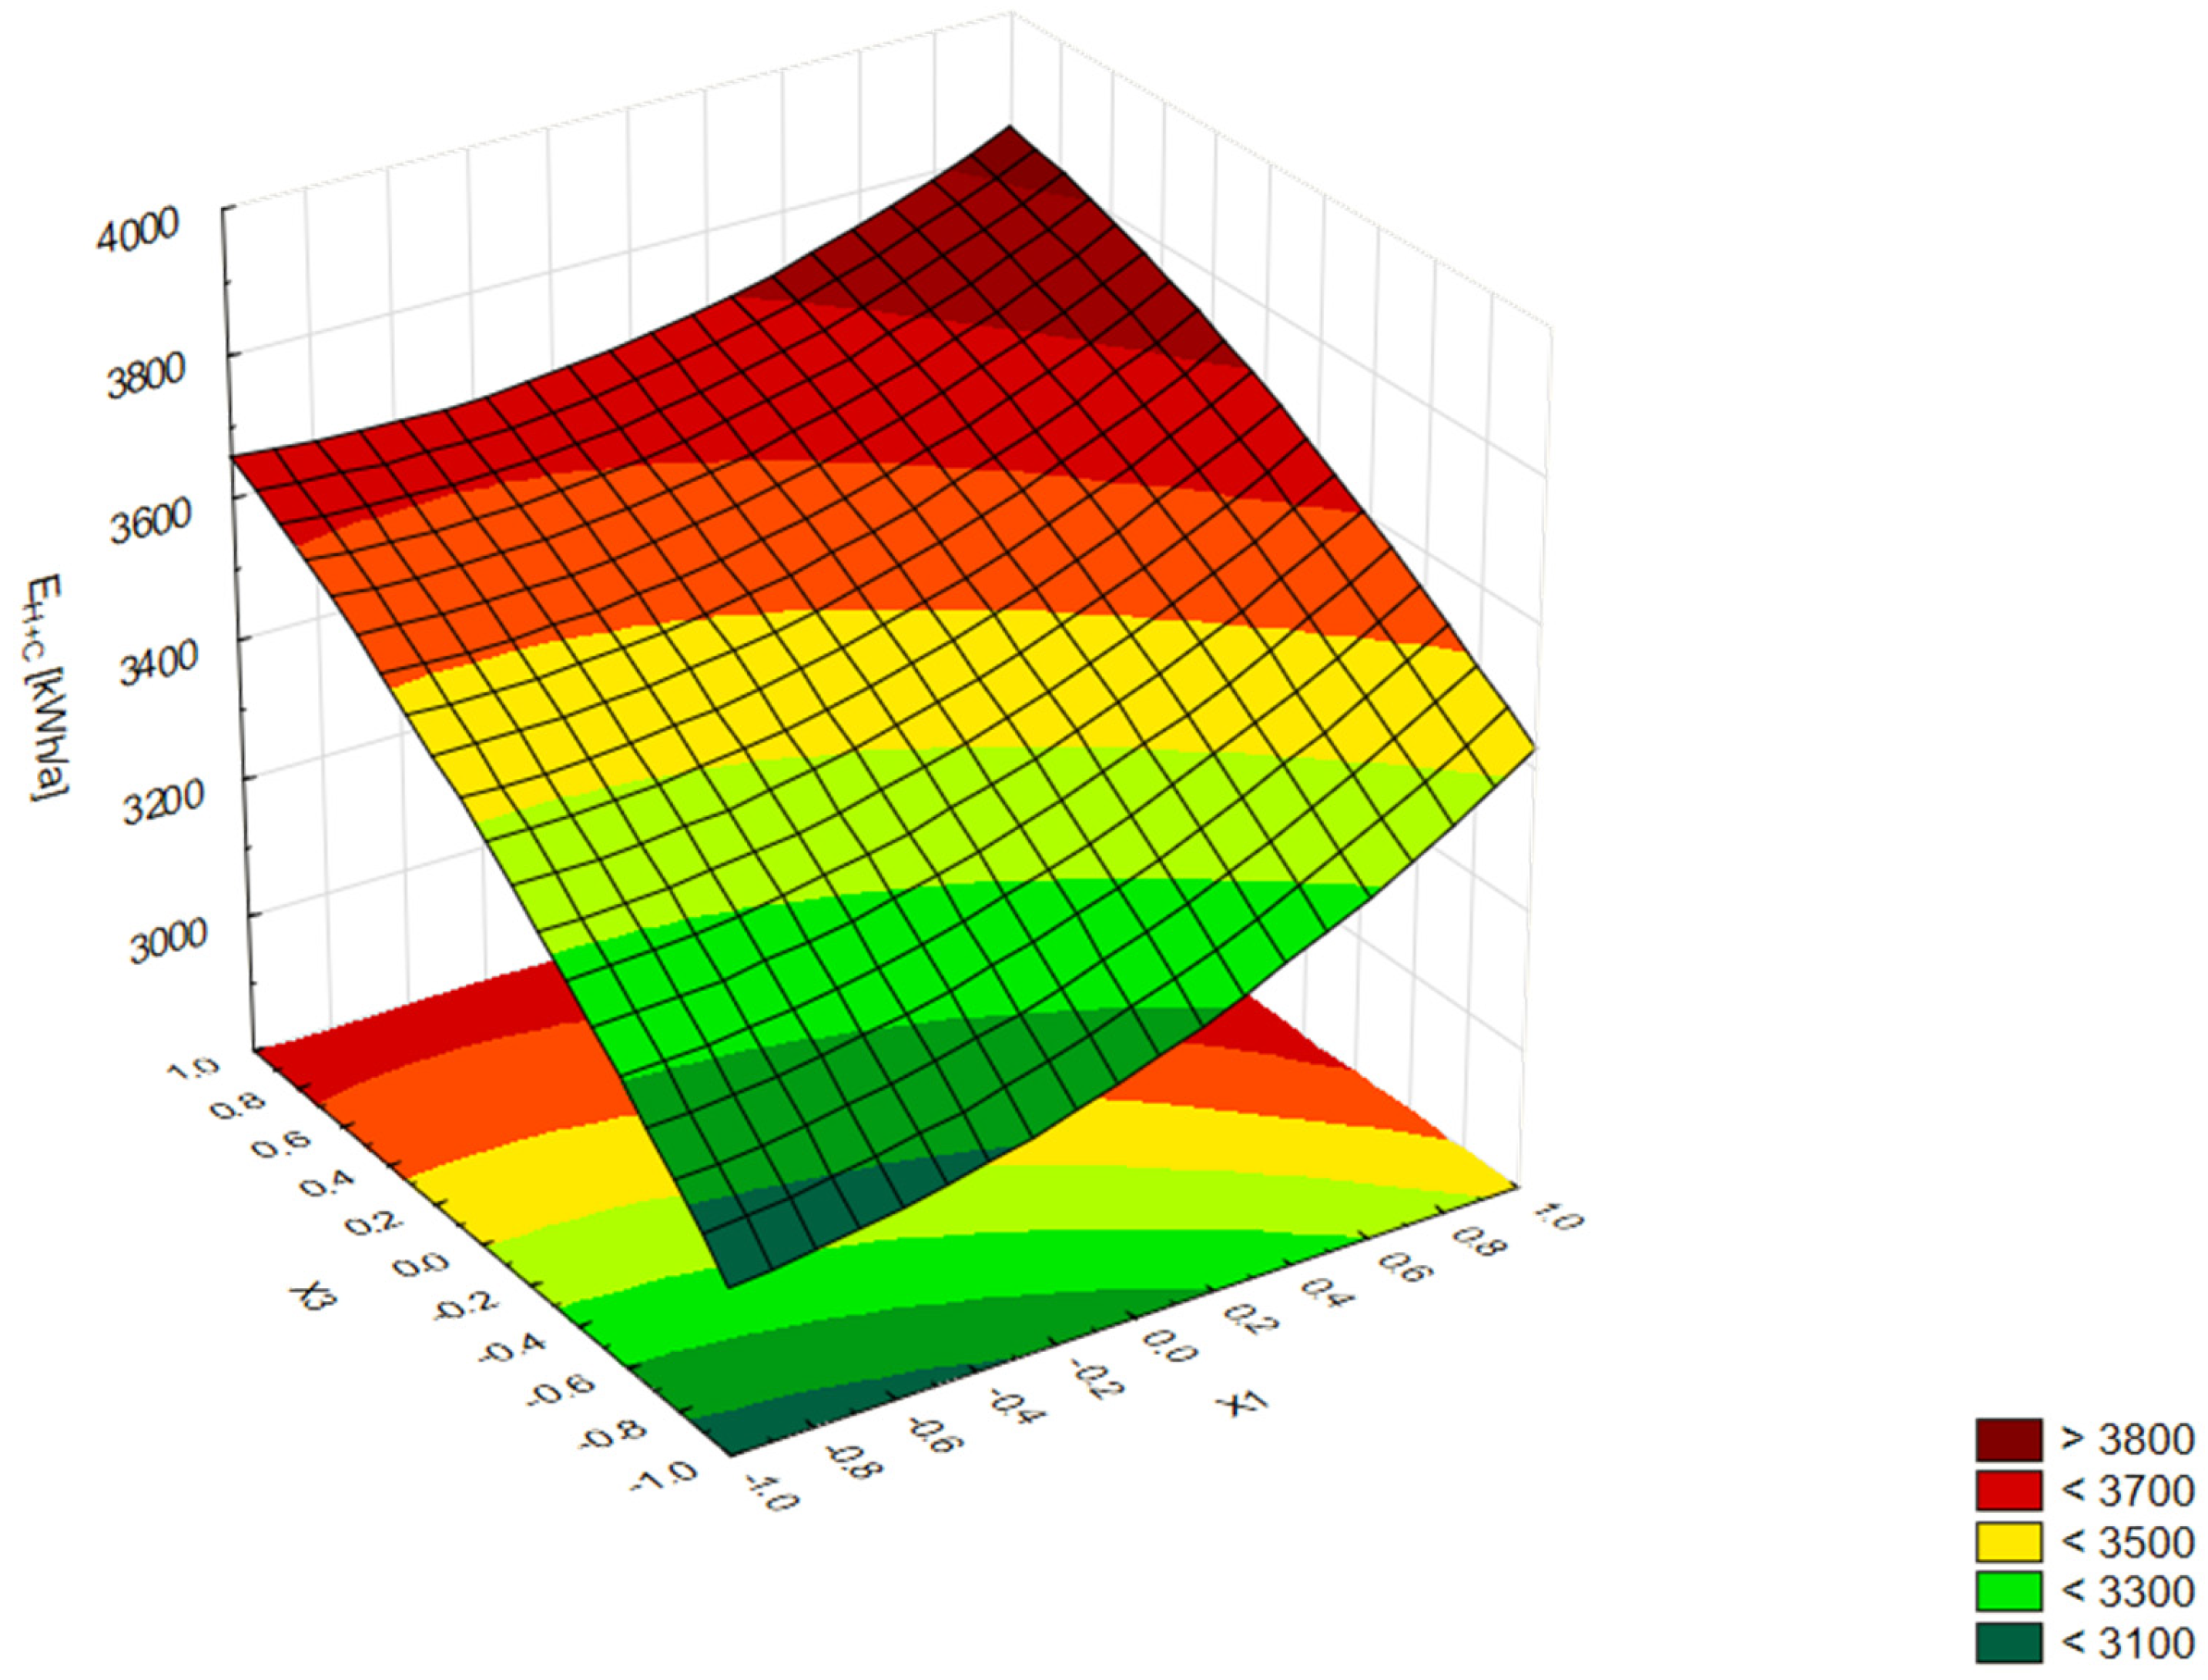
Contributions to the fluctuations of functions Δ were calculated in such a way that each of the factors varied from the lower (−1) to the upper (+1) level and the other factors were stabilized at the average level (0). As a result of analysing the data from Table 4, it can be concluded that all factors show a variable nature of the impact on the examined functions. For example, changing the area of windows (X1) reduces the demand for energy for heating, but leads to an increase in the value of other functions. The similarly variable nature of the influence characterizes factors X3 and X4. Only the number of panes in the windows (X2) has a positive impact on a stable and significant reduction in energy demand, and thus a reduction in CO2 emissions. This confirms the advantage of using multi-glazed windows in various climatic conditions. The nature of the impact of the studied factors is quite complex. Therefore, it was decided to illustrate this variability in the form of sample 3D charts. Figure 7 shows the dependence of the annual carbon dioxide emissions ECO2, and Figure 8 shows the total demand for final energy QH+C. The calculations assumed the variability of factors X1 and X3, but the number of chambers N = 0 (triple glazed) and location L = 0 (Berlin) were unchangeable.
The key element in this article are multi-pane windows, so the interaction of other factors on the glazing parameters, i.e., its area and number of panes, was also examined based on the mathematical models described by Equations (5) and (6). For ECO2 (Ŷ3), it was found (Equation (5)) that the number of panes in the windows had a stronger effect on reducing carbon dioxide emissions when the glazing area is higher, and the climatic conditions are milder. Conversely, the effect of the number of window panes on ECO2 reduction has a lower impact as the heat-transfer coefficient of the external walls increases. It was also noted that the glazing area has a stronger impact on increasing ECO2 when climatic conditions are less severe. However, the impact of the window area on increasing carbon dioxide emissions will decrease with a higher number of panes and lower thermal resistance of external walls.
In the case of the total energy consumption QH+C(Ŷ4) (Equation (6)), slightly different interaction effects of the factors were detected. The area of windows has a stronger impact on increasing the QH+C value when the location of the building is characterized by milder climate conditions. However, the effect of the glazing area on increasing QH+C decreases with a higher number of panes in the windows and a higher heat-transfer coefficient of external walls. On the other hand, the UW-value has the stronger effect on the reduction in the energy demand when the window area is higher. The influence of the number of panes in the windows on the reduction in the QH+C value is inverse, i.e., it decreases with less severe climatic conditions and with an increase in the heat-transfer coefficient of external walls.
The analysis of the effects of interactions of factors was performed in a very detailed way to capture all the nuances of this issue. The authors are aware that the results of this analysis are presented in a somewhat unusual way and may seem difficult to understand for some readers. However, looking at the purely mathematical side of complex physical phenomena sometimes reveals unusual relationships.

3.3. Analysis of the Impact of Glazing on Thermal Comfort

In the Energy Performance Building Directive [24], there is a statement that the demand for energy for space heating and cooling should be determined taking into account indoor air quality and thermal comfort level. On the other hand, the European Standard 16798 [25] defines the parameters that the indoor air quality and thermal environment should meet. It contains a set of settings for residential buildings as a function of comfort category. Most of them were used in the analysis presented in this article. The thermal criteria analysis was based on the Predicted Mean Vote (PMV) index, which is a good indicator of the quality of thermal comfort. One of the more important criteria for calculating the PMV value is the temperature of the surfaces surrounding the human body. The influence of methods of determining the average radiation temperature in DesignBuilder was discussed by d’Ambrosio Alfano et al. [26]. Based on the analysis of simulation results made for a cubic room with dimensions of 5 m, it was found that the way of calculating this parameter significantly affects the classification of the thermal environment specified in the EN 16798 standard [25]. The mean radiant temperature in this analysis was calculated using the zone-averaged method.
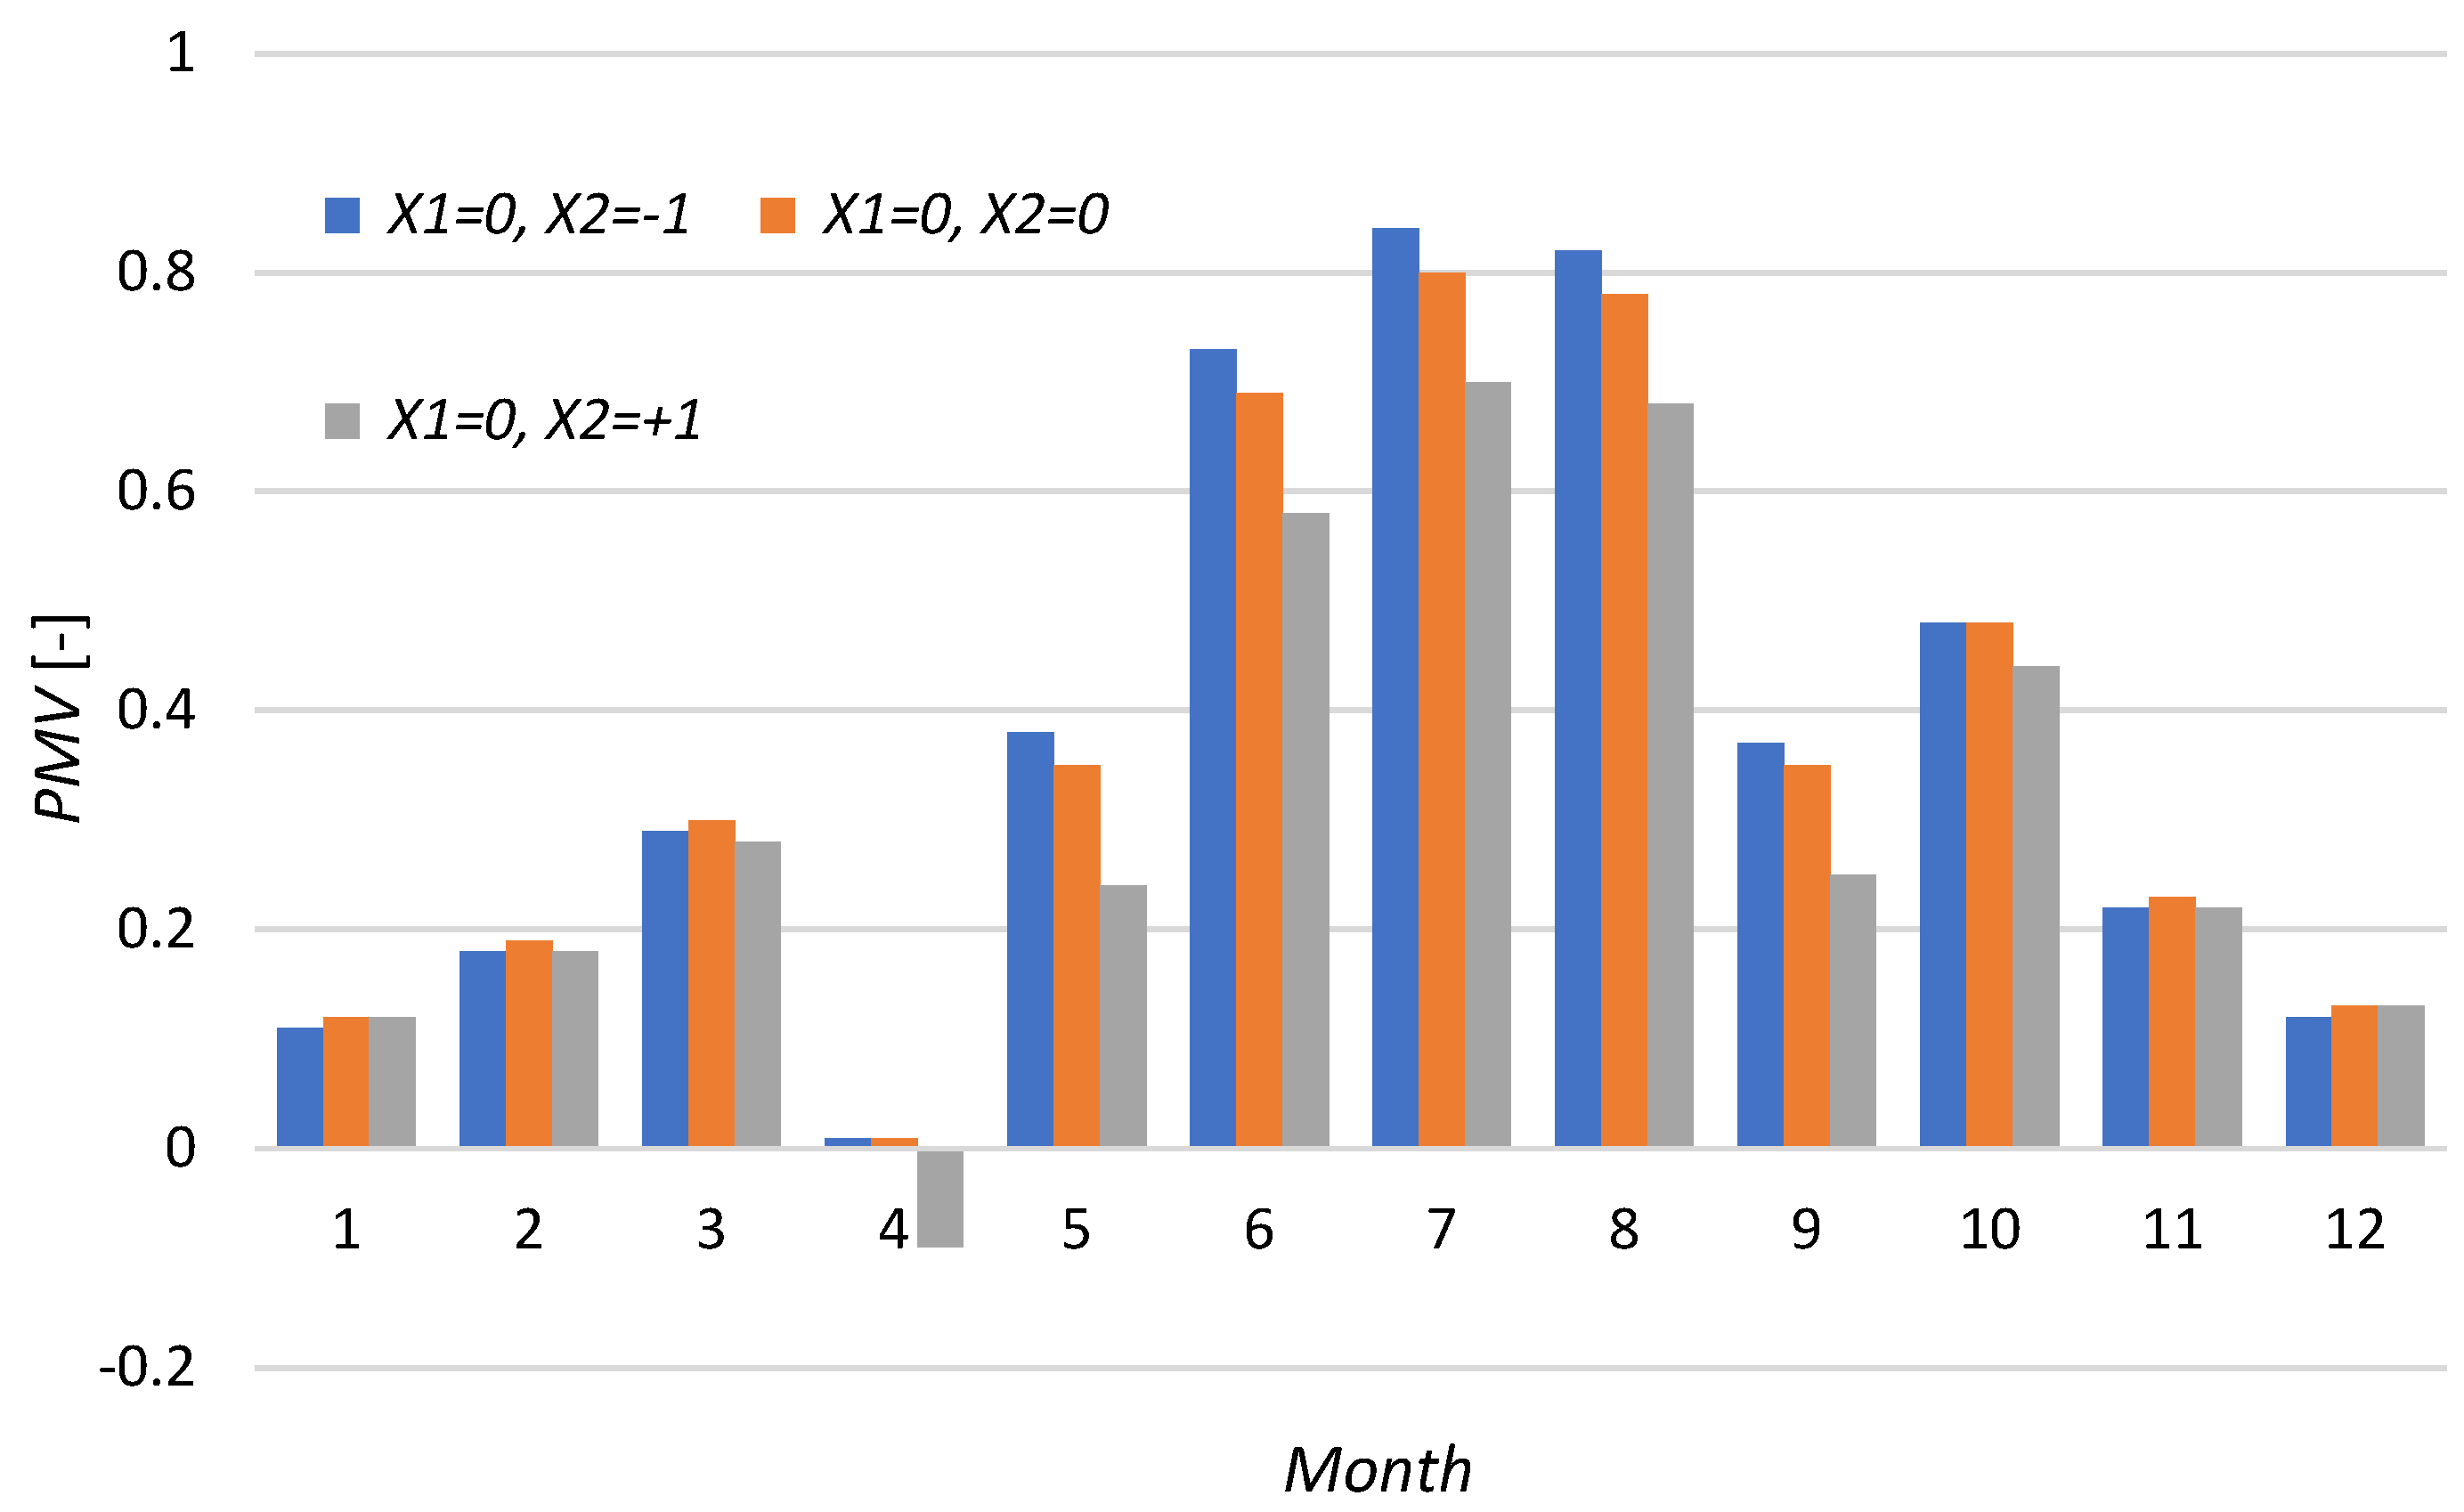
The PMV index was selected to compare the level of thermal comfort depending on the thermal insulation of windows and the glazing area. The metabolic factor was assumed to be 0.9 and the activity was defined as “light manual work”. The thermal insulation of the summer and winter clothing was 0.5 and 1.0 clo, respectively.
Due to the multitude of variants of the analysis, it was limited to the centre GP of multi-factor space, i.e.: UEW = 0.15 W/m2K (factor X3 = 0), and location in L = 2-Berlin (factor X4 = 0). Other parameters related to the glazing system (X1, X2) changed over the full range, i.e., from +1 to −1.
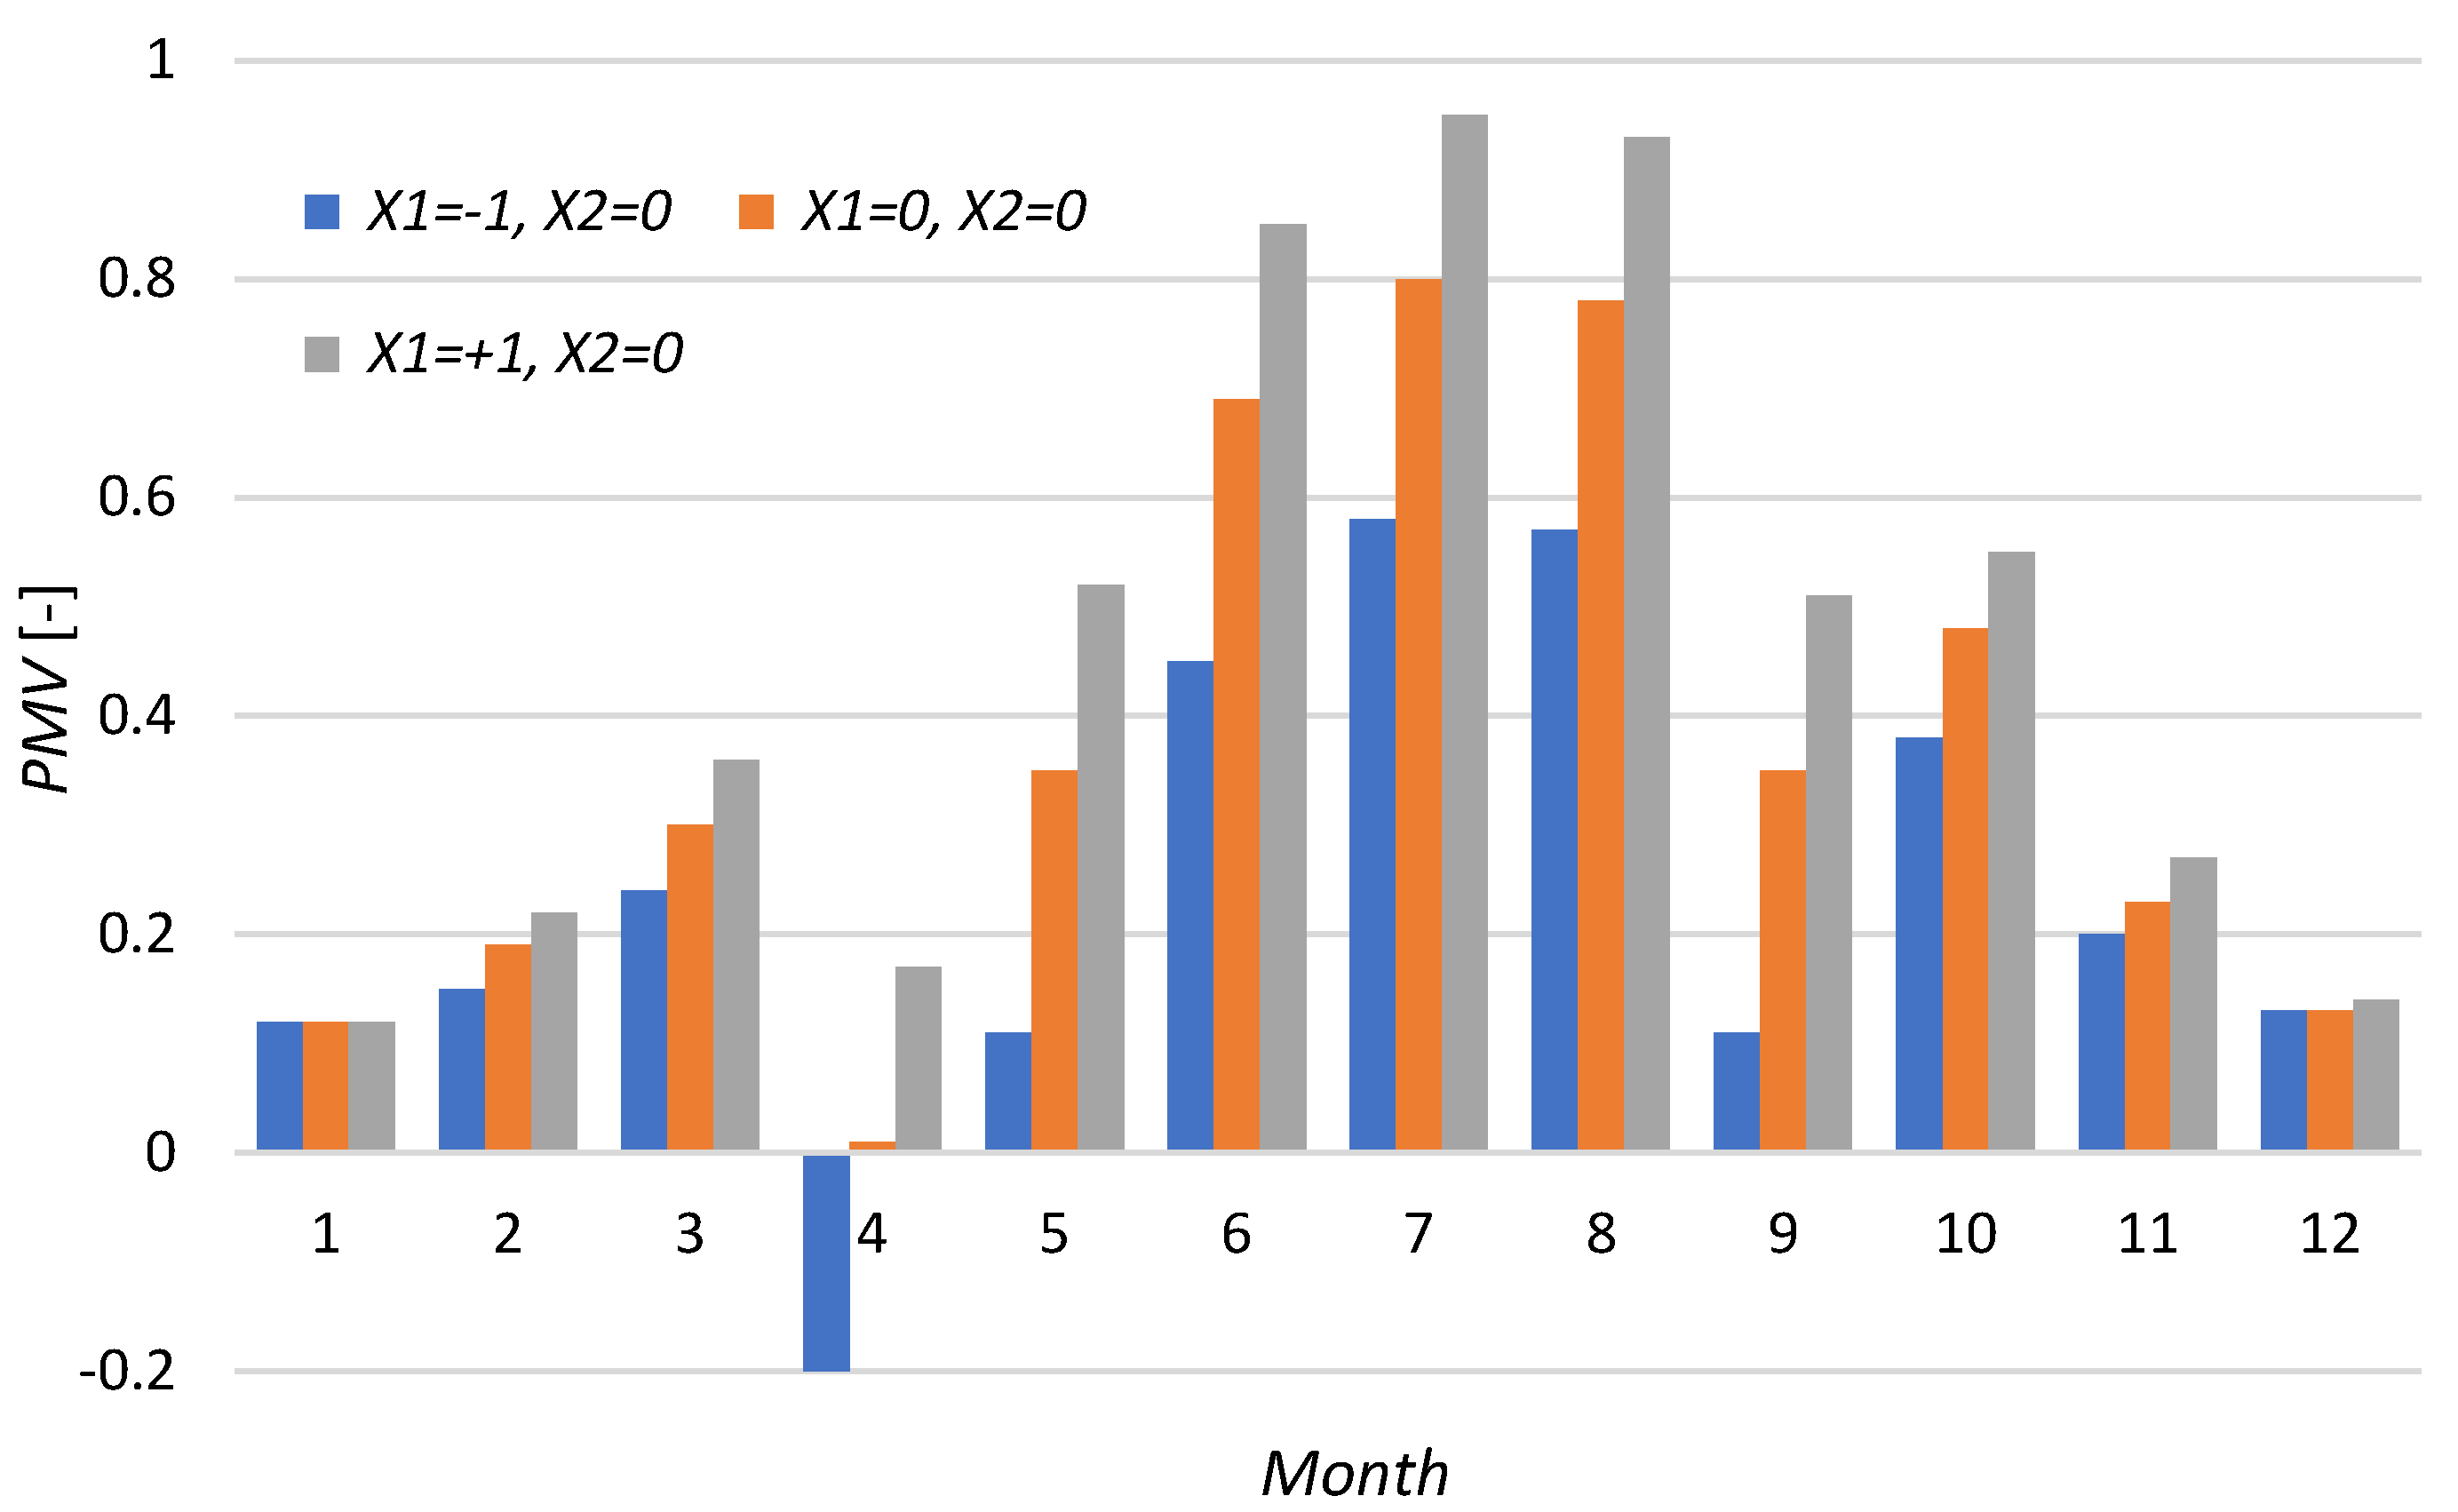
The results of the calculations are presented in the form of the dependence of the glazing area (Figure 9) and the number of panes in the window (Figure 10) on the level of thermal comfort expressed by the PMV index. As can be seen in Figure 9, the increase in the glazing area has a significant impact on the decrease in the quality of the thermal environment inside the occupied zone, manifested by slight overheating in the summer. Interestingly, in the winter we have a slight influence of the glazing area and the number of panes in the window, because the PMV index is less than 0.5 and is within the comfort limits. In summer (Figure 9), the average value of the PMV index is 0.55, 0.66, and 0.69 for a four-pane, three-pane and double-glazed window, respectively.
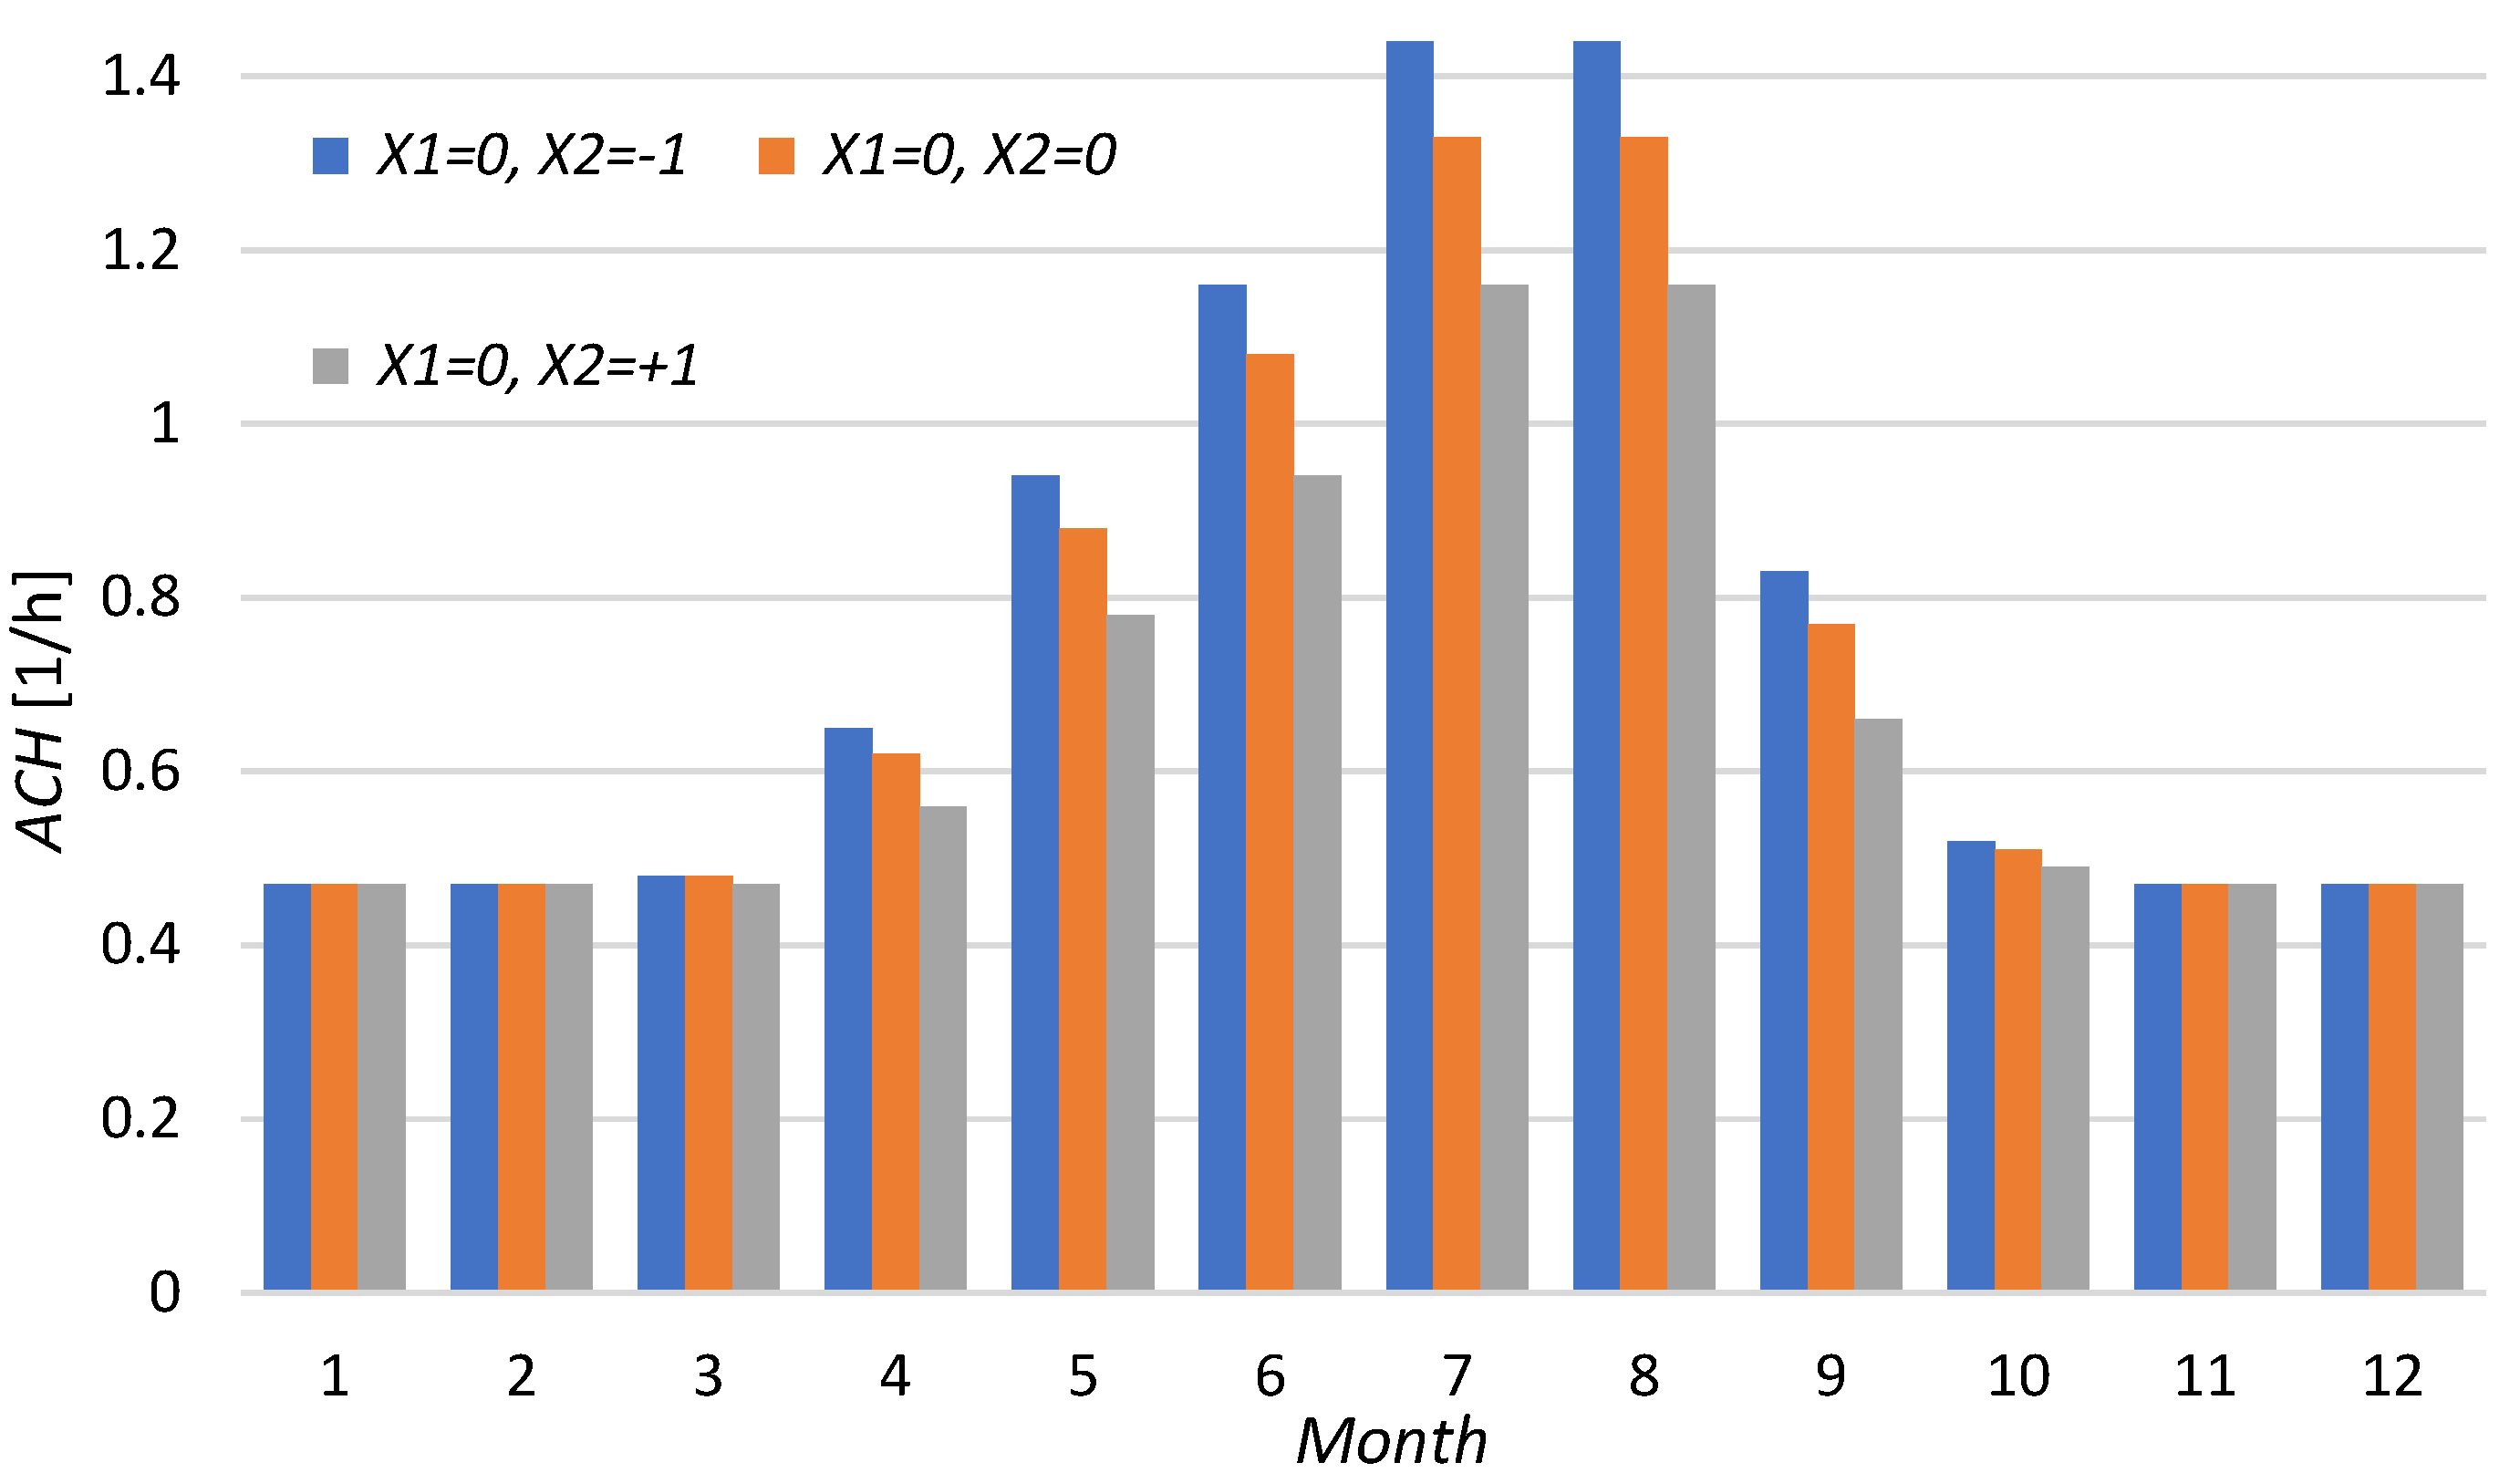
The air quality in the house depends to a large extent on the intensity of ventilation and the proportion of fresh air supplied from the outside. The value of the ventilation rate for occupancy was assumed to be at level II of the Comfort category given in the EN 16798-1 standard. Figure 11 shows the average monthly air changes per hour (ACH) depending on the type of windows. About half of the air exchange per hour takes place in winter, regardless of the type of glazing. In the summer, the intensity of the ventilation system is lower when the window structure has more panes. In this case, the average monthly ACH value is 1.25, 1.16, and 1.01 for double-pane, triple-pane and quadruple-pane windows.

4. Summary and Conclusions

This article presents a slightly different approach to the analysis of issues related to building energy consumption, i.e., this problem was considered mostly from a mathematical point of view.
Based on the results of the computational experiment, four deterministic mathematical models were developed. We can use them to determine the annual demand for energy for heating QH (function Ŷ1), the demand for energy for cooling QC (function Ŷ2), the annual carbon dioxide emissions ECO2 (function Ŷ3) and the annual total demand for final energy QH+C (function Ŷ4). The research object was a traditional one-story single-family building with an area of 101 m2. The parameters of the objective functions were four factors: the glazing area of the house AW (factor X1), the number of panes in the windows N (factor X2), heat-transfer coefficient of external walls UEW (factor X3), and three locations in Europe L (factor X4). The level and nature of their impact on energy saving were studied based on the developed models.
The factors AW(X1), N(X2), and L(X4) showed positive effects when changing from the lower to the upper level in case of the annual energy demand for heating QH(Ŷ1). In this case QH can be reduced by 4.7%, 15.1%, and 38.7%, respectively. The strongest effect was shown by the location factor L(X4) associated with meteorological conditions. The relocation of the building from Warsaw to Paris reduced the energy for heating by almost 40% (1330.36 kWh per year). The factor UEW (X3) showed a negative effect and increased the value of QH by almost 20% (527.96 kWh per year)).
The factors N(X2) and UEW (X3) showed positive effects in the case of the annual demand for energy for cooling QC(Ŷ2). The change from lower to upper level reduced QC by 34.6% and only 1.7%, respectively. Factor N(X2) showed the highest positive effect. Increasing the number of panes from two to four helped reduce the energy for cooling by 200.2 kWh per year. Factors AW(X1) and L(X4) increased the value of QC by as much as 149.3% (430.84 kWh per year) and 46.6% (150.06 kWh per year), respectively.
The analysis of the annual carbon dioxide emissions based on the ECO2(Ŷ3) model proved that the factors N(X2) and L(X4) showed positive effects with the change in their values from the lower to the upper level. There was a decrease in ECO2 by 24.5% (320.94 kg/a) and 9.6% (98.46 kg/a), respectively. Factors AW(X1) and UEW(X3) adversely increased ECO2 by 47.5% (441.96 kg/a) and 8.9% (94.98 kg/a), respectively.
In the last model, used to estimate the annual demand for final energy QH+C(Ŷ4), positive effects were shown by factors N(X2) and L(X4). Changing their values from the lower to the upper level resulted in a decrease in QH+C by 17.9% (717.82 kWh per year) and 31.4% (1180.3 kWh per year), respectively. The other two factors, AW(X1) and UEW(X3), showed a negative effect and increased the total energy consumption by 8.4% (284.18 kWh per year) and 16.5% (519.56 kWh per year), respectively.
As revealed by the analysis presented above, the most important role in reducing the energy consumed by the examined house was played by the number of panes in the window. This factor was the only one that showed a stable and significant reduction in energy demand, and thus also a reduction in carbon dioxide emissions for all four examined functions.
It should be noted that the above analysis was performed using mathematical modelling based on the results of the house energy simulation obtained from the DesignBuilder software. d’Ambrosio Alfano et al. [27] compared the results of calculations of energy consumption and thermal comfort conditions obtained using DesignBuilder and IDA ICE software, also popular among scientists. It turned out that the difference in the results of estimating the energy consumption by both simulation tools was not greater than 4%. However, significant differences were observed when calculating the operative temperature. It should be emphasized that even the best building energy performance simulation tools will not replace measurements made in real conditions. However, in the case of the issue discussed in this article, numerical simulation was the only reasonable solution due to the cost and extensive scope of experimental research.
It should also be emphasized that the calculation results presented in this article apply to a specific HVAC system. This solution was adopted because it is currently the most widespread in Poland. We are aware that heat pumps will soon become the dominant source of energy in new single-family buildings. A similar analysis performed for this energy source would result in models slightly different to those presented here. However, the research methodology may remain the same.
The authors hope that the information contained in this article will be useful to scientists, designers, and manufacturers of glazing systems.
The analysis presented here is the first stage of a complex research project. In further studies, it is planned to confirm the detected regularities and trends for office and service buildings, and in other structural and material solutions for windows. After developing a universal base of Ŷ functions, the authors intend to conduct an additional economic analysis that would allow the selection of the optimal glazing system.

Author Contributions

Conceptualization, W.J. and M.Z.; methodology, W.J. and M.Z.; software, M.Z.; validation, W.J.; formal analysis, W.J. and M.Z.; investigation, W.J. and M.Z.; writing—original draft preparation, W.J. and M.Z.; writing—review and editing, W.J. and M.Z.; funding acquisition, W.J. and M.Z. All authors have read and agreed to the published version of the manuscript.

Funding

This work was supported by the Bialystok University of Technology and financed by the Ministry of Science and Higher Education of the Republic of Poland [grants number WZ/WB-IIS/8/2023 and WZ/WB-IIL/2/2023].

Data Availability Statement

The study did not report any data.

Conflicts of Interest

The authors declare no conflict of interest.

References

  1. Nia, M.N.; Nassab, S.A.G.; Ansari, A.B. Transient numerical simulation of multiple pane windows filling with radiating gas. Int. Commun. Heat Mass Transf. 2019, 108, 104291. [Google Scholar]
  2. Sadooghi, P.; Kherani, N.P. Thermal analysis of triple and quadruple windows using partitioning radiant energy veils™ with different physical and optical properties. Sol. Energy 2018, 174, 1163–1168. [Google Scholar] [CrossRef]
  3. Arıcı, M.; Karabay, H.; Kan, M. Flow and heat transfer in double, triple and quadruple pane windows. Energy Build. 2015, 86, 394–402. [Google Scholar] [CrossRef]
  4. Arıcı, M.; Tükel, M.; Yıldız, Ç.; Li, D.; Karabay, H. Is the thermal transmittance of air-filled inclined multi-glazing windows similar to that of vertical ones? Energy Build. 2020, 1229, 10515. [Google Scholar] [CrossRef]
  5. Kralj, A.; Drev, M.; Žnidaršič, M.; Černe, B.; Hafner, J.; Jelle, B.P. Investigations of 6-pane glazing: Properties and possibilities. Energy Build. 2019, 190, 61–68. [Google Scholar] [CrossRef]
  6. Sadooghi, P.; Kherani, N.P. Influence of slat angle and low-emissive partitioning radiant energy veils on the thermal performance of multilayered windows for dynamic facades. Renew. Energy 2019, 143, 142–148. [Google Scholar] [CrossRef]
  7. Arıcı, M.; Kan, M. An investigation of flow and conjugate heat transfer in multiple pane windows with respect to gap width, emissivity and gas filling. Renew. Energy 2015, 75, 249–256. [Google Scholar] [CrossRef]
  8. Chmúrny, I. Triple or Quadruple Glazing? Appl. Mech. Mater. 2016, 820, 242–247. [Google Scholar] [CrossRef]
  9. Michálek, V.; Puškár, A.; Szabó, D.; Chmúrny, I. Laboratory Measuring of Triple and Quadruple Glazing. In Proceedings of the 3rd Conference on Building Physics and Applied Technology (ATF 2014), Vienna, Austria, 6–7 May 2014; pp. 175–182. [Google Scholar]
  10. Chmurny, I. Ultra thin glass membranes for advanced glazing of nZEB. Adv. Mater. Res. 2014, 899, 470–473. [Google Scholar] [CrossRef]
  11. Ultra Thin Glass Membranes for Advanced, Adjustable and Affordable Quadruple Glazing Windows for Zero-Energy Buildings—MEM4WIN; FP7-NMP. EU Research Project; Brussels, Belgium, 2012–2016. Available online: https://cordis.europa.eu/project/id/314578 (accessed on 10 May 2023).
  12. Tettey, U.Y.A.; Dodoo, A.; Gustavsson, L. Primary energy implications of different design strategies for an apartment building. Energy 2016, 104, 132–148. [Google Scholar] [CrossRef]
  13. Ihm, P.; Park, L.; Krarti, M.; Seo, D. Impact of window selection on the energy performance of residential buildings in South Korea. Energy Policy 2012, 44, 1–9. [Google Scholar] [CrossRef]
  14. Thalfeldt, M.; Pikas, E.; Kurnitski, J.; Voll, H. Facade design principles for nearly zero energy buildings in a cold climate. Energy Build. 2013, 67, 309–321. [Google Scholar] [CrossRef]
  15. Edeisy, M.; Cecere, C. Envelope retrofit in hot arid climates. Procedia Environ. Sci. 2017, 38, 264–273. [Google Scholar] [CrossRef]
  16. Fekri, H.; Soltani, M.; Hosseinpour, M.; Alharbi, W.; Raahemifar, K. Energy simulation of residential house integrated with novel IoT windows and occupant behaviour. Sustain. Cities Soc. 2022, 78, 103594. [Google Scholar] [CrossRef]
  17. Kirankumar, G.; Saboor, S.; Ashok, S. Effects of Single, Double, Triple and Quadruple Window Glazing of Various Glass Materials on Heat Gain in Green Energy Buildings. In Materials, Energy and Environment Engineering; Mohan, R.B., Srinikethan, G., Meikap, B.C., Eds.; Springer Nature Singapore Pte Ltd.: Singapore, 2017; Chapter 5; pp. 1–6. [Google Scholar]
  18. Banihashemi, S.; Golizadeh, H.; Hosseini, M.R.; Shakouri, M. Climatic, parametric and non-parametric analysis of energy performance of double-glazed windows in different climates. Int. J. Sustain. Built Environ. 2015, 4, 307–322. [Google Scholar] [CrossRef] [Green Version]
  19. Kim, S.; Zadeh, P.A.; Staub-French, S.; Froese, T.; Cavka, B.T. Assessment of the Impact of Window Size, Position and Orientation on Building Energy Load Using BIM. Procedia Eng. 2016, 145, 1424–1431. [Google Scholar] [CrossRef] [Green Version]
  20. Thalfeldt, M.; Kurnitski, J.; Voll, H. Comparison of Simplified and Detailed Window Models in Office Building Energy Simulations. Energy Procedia 2015, 78, 2076–2081. [Google Scholar] [CrossRef]
  21. Gutenbaum, J. Mathematical Systems’ Modelling; EXIT: Warsaw, Poland, 2003. [Google Scholar]
  22. Korzynski, M. Methodology of the Experiment. Planning Implementation and Statistical Analysis of the Results of Technological Experiments; WNT: Warsaw, Poland, 2006. [Google Scholar]
  23. Durakovic, B. Design of Experiments Application. Concepts. Examples: State of the Art. Period. Eng. Nat. Sci. 2017, 5, 421–439. [Google Scholar] [CrossRef]
  24. Directive (EU) 2018/844 of the European Parliament and of the Council of 30 May 2018. Available online: https://www.google.com/url?sa=t&rct=j&q=&esrc=s&source=web&cd=&cad=rja&uact=8&ved=2ahUKEwjNmYT9zpz_AhXNFXcKHc0kDkQQFnoECBwQAQ&url=https%3A%2F%2Feur-lex.europa.eu%2Flegal-content%2FEN%2FTXT%2FPDF%2F%3Furi%3DCELEX%3A32018L0844%26from%3DIT&usg=AOvVaw2hFEIE-BLeZogNDe4WI6zy (accessed on 10 May 2023).
  25. EN 16798-1:2019; Energy Performance of Buildings—Ventilation for Buildings—Part 1: Indoor Environmental Input Parameters for Design and Assessment of Energy Performance of Buildings Addressing Indoor Air Quality, Thermal Environment, Lighting and Acoustics—Module M1-6. Available online: https://standards.iteh.ai/catalog/standards/cen/b4f68755-2204-4796-854a-56643dfcfe89/en-16798-1-2019 (accessed on 10 May 2023).
  26. d’Ambrosio Alfano, F.R.; Pepe, D.; Riccio, G.; Vio, M.; Palella, B.I. On the effects of the mean radiant temperature evaluation in the assessment of thermal comfort by dynamic energy simulation tools. Build. Environ. 2023, 236, 110254. [Google Scholar] [CrossRef]
  27. d’Ambrosio Alfano, F.R.; Olesen, B.W.; Pepe, D.; Palella, B.I. Working with Different Building Energy Performance Tools: From Input Data to Energy and Indoor Temperature Predictions. Energies 2023, 16, 743. [Google Scholar] [CrossRef]

Figure 1. Flowchart of the implementation of this study.
Energies 16 04429 g001
Figure 2. View of the 3D model of the Perfect 101 building.
Energies 16 04429 g002
Figure 3. Comparison of the monthly outside air temperature in Warsaw, Berlin, and Paris.
Energies 16 04429 g003
Figure 4. Comparison of the monthly average normal direct solar irradiation for Warsaw, Berlin, and Paris.
Energies 16 04429 g004
Figure 5. Comparison of the monthly average wind speed for Warsaw, Berlin, and Paris.
Energies 16 04429 g005
Figure 6. Diagram of the heating and ventilation system with heat recovery used in energy simulations.
Energies 16 04429 g006
Figure 7. Dependence of ECO2 on the factors X1 and X3 at X2 = 0 (three-pane window) and X4 = 0 (Berlin).
Energies 16 04429 g007
Figure 8. Dependence of QH+C on the factors X1 and X3 at X2 = 0 (three-pane window) and X4 = 0 (Berlin).
Energies 16 04429 g008
Figure 9. Influence of the glazing area on the PMV index at X2 = 0 (three-pane window).
Energies 16 04429 g009
Figure 10. Influence of glazing type on PMV index at X1 = 0 (base glazing area).
Energies 16 04429 g010
Figure 11. Influence of glazing type on ventilation intensity at X1 = 0 (base glazing area).
Energies 16 04429 g011
Table 1. The main parameters of the glazing systems.
Description of the Window LayersTotal Solar
Transmission [-]
Direct Solar
Transmission [-]
Light
Transmission [-]
Ug-Value [W/m2K]
(Glazing)
Uf-Value [W/m2K]
(Frame)
Double-glazed window
1. Outermost pane—Generic PYR-B Clear 3 mm0.6910.6240.7441.6341.145
2. Argon 13 mm
3. Innermost pane—Clear 3 mm
Triple-glazed window
1. Outermost pane—Generic Clear 3 mm0.5790.4580.6981.0720.953
2. Argon 13 mm
3. Generic Clear 3 mm
4. Argon 13 mm
5. Innermost pane—Generic LoE Clear 3 mm Rev
Quadruple-glazed window
1. Outermost pane—Generic Clear 3 mm0.4660.3380.6240.8060.816
2. Krypton 8 mm
3. Generic Coated Poly-88
4. Krypton 3 mm
5. Generic Coated Poly-88
6. Krypton 8 mm
7. Innermost pane—Generic Clear 3 mm
Table 2. Gross Window–Wall Ratio [%].
Total North
(315 to 45 deg)
East
(45 to 135 deg)
South
(135 to 225 deg)
West
(225 to 315 deg)
Basic glazing
25.5217.810.0045.6929.26
Glazing increased by 30%
32.3121.790.0057.7938.04
Glazing reduced by 30%
17.8512.470.0031.9520.48
Table 3. Plan of the computational experiment and results of energy simulations.
CaseX1
A0
[m2]
X2
N
[-]
X3
UEW
[W/m2]
X4
L
[-]
Y1i
QH
[kWh]
Y2i
QC
[kWh]
Y3i
ECO2
[kg]
1.0
A0
0
2
0
0.15
0
Berlin
2974.37492.21124.84
2.−1
0.7A0
−1
1
−1
0.10
−1
Warsaw
3534.36200.77916.80
3.−1
0.7A0
+1
3
+1
0.20
+1
Paris
2576.97168.85693.01
4.+1
1.3A0
−1
1
+1
0.20
+1
Paris
2647.59874.331478.03
5.+1
1.3A0
+1
3
−1
0.10
+1
Paris
1780.44562.78966.41
6.+1
1.3A0
+1
3
+1
0.20
−1
Wars
3457.22367.341083.64
7.0
A0
+1
3
−1
0.10
−1
Wars
2934.53234.14834.92
8.0
A0
−1
1
+1
0.20
−1
Wars
4251.91381.631256.05
9.0
A0
−1
1
−1
0.10
+1
Paris
2220.28578.701070.60
10.+1
1.3A0
0
2
−1
0.10
−1
Warsaw
3051.83524.071174.96
11.−1
0.7A0
0
2
+1
0.20
−1
Warsaw
3879.52157.88938.02
12.−1
0.7A0
0
2
−1
0.10
+1
Paris
2037.50238.00662.15
13.+1
1.3A0
−1
1
0
0.15
−1
Warsaw
4107.18615.881483.53
14.−1
0.7A0
+1
3
0
0.15
−1
Warsaw
3549.41113.46824.34
15.−1
0.7A0
−1
1
0
0.15
+1
Paris
2530.57286.79812.76
16.+1
1.3A0
−1
1
−1
0.10
0
Berlin
3309.18895.991632.24
17.−1
0.7A0
+1
3
−1
0.10
0
Berlin
2740.57196.33755.32
18.−1
0.7A0
−1
1
+1
0.20
0
Berlin
3713.09324.151086.92
Table 4. The contribution of X1, X2, X3, X4 factors to the fluctuations Δ of the tested functions Ŷ1, Ŷ2, Ŷ3, Ŷ4 when changing their values from the lower to the upper level.
Function Fluctuation   Values   Δ = a i X i + a i i X i 2   [ kWh   or   kg   per   Year ]
AW (X1)N (X2)UE (X3)L (X4)
QH(Ŷ1) [kWh]−146.66−517.62+527.96−1330.36
QC(Ŷ2) [kWh]+430.84−200.20−8.40+150.06
ECO2(Ŷ3) [kg]+441.96−320.94+94.98−98.46
QH+C(Ŷ4) [kWh]+284.18−717.82+519.56−1180.30
Disclaimer/Publisher’s Note: The statements, opinions and data contained in all publications are solely those of the individual author(s) and contributor(s) and not of MDPI and/or the editor(s). MDPI and/or the editor(s) disclaim responsibility for any injury to people or property resulting from any ideas, methods, instructions or products referred to in the content.