Article

Single- and Double-Sided Coated Gas Diffusion Layers Used in Polymer Electrolyte Fuel Cells: A Numerical Study

1
Energy Institute, The University of Sheffield, Sheffield S3 7RD, UK
2
Department of Mechanical Engineering, Faculty of Engineering, Akwa Ibom State University, Mkpat Enin 524106, Akwa Ibom State, Nigeria
3
School of Engineering, University of Hull, Hull HU6 7RX, UK
4
Translational Energy Research Centre, The University of Sheffield, Sheffield S3 7RD, UK
*
Author to whom correspondence should be addressed.
Energies 2023, 16(11), 4363; https://doi.org/10.3390/en16114363
Submission received: 29 April 2023 / Revised: 17 May 2023 / Accepted: 22 May 2023 / Published: 27 May 2023
(This article belongs to the Section D2: Electrochem: Batteries, Fuel Cells, Capacitors)

Abstract

:
A new three-dimensional numerical model of a polymer electrolyte fuel cell (PEFC) with a single straight channel was developed to primarily investigate the important impact of the double-sided microporous layer (MPL) coating on the overall performance of the fuel cell and the distribution of the current and the oxygen concentration within the cathode gas diffusion layers (GDLs). Realistic experimentally estimated interfacial contact resistance values between the gas diffusion layer and each of the bipolar plates and the catalyst layer values were incorporated into the model, and parametric studies were performed. The results showed that the double-sided MPL coating could significantly improve the fuel cell performance by up to 30%. Additionally, it was shown that the neglect of the contact resistance between the MPL and the catalyst layer could overestimate the fuel cell performance by up to 6%. In addition, the results showed that the fuel cell performance and the distribution of the current and oxygen are more sensitive to the porosity of the MPL facing the bipolar plate than the porosity of the MPL facing the catalyst layer. All the above results are presented and critically discussed in detail.

1. Introduction

Polymer electrolyte fuel cells (PEFCs) have great potential to become a major alternative to fossil fuel combustion technology and especially in the transport sector. They have higher efficiency as compared to internal combustion engines as they convert the chemical energy directly into electrical energy. In addition, they are light in weight, with noiseless operation, and emit low to zero pollutant emissions. However, the ohmic and concentration losses associated with the polymer electrolyte fuel cells evidently lower the efficiency and performance of the cell. A way to mitigate these losses is to minimise the electrical resistance of the fuel cell and increase the pore volume available for the gas transport to the reactive sites. This can be achieved by minimising the contact resistances between the solid components of the fuel cell and designing gas diffusion media with better water management and higher gas reactant transport. Most PEFC models in the literature neglect the interfacial contact resistance between the GDL and bipolar plate (BPP). However, researchers have been able to characterise the GDL interfacial contact resistance and have reported its influence on the performance of the PEFC. For example, Zhou et al. [1,2] developed a micro-scale numerical model to estimate the contact resistance between the BPP and the GDL using FU436a graphite plates and Toray TGP-H-030 carbon paper. They reported that the contact resistance decreased when increasing the bipolar plate asperity peak density by about 14%. Qiu et al. [3] showed that the interfacial contact resistance between the GDL and bipolar plates contributes about 80% of the ohmic losses in the PEFC by experimentally measuring the bulk resistance and investigating the microstructure for Toray carbon papers (TGP-H-060 and TGP-H-090), Tenax carbon cloths (TCC2660 and TCC3250), and Freudenberg carbon felts (H2315 and H14) under cyclic and steady loads. Lai et al. [4] developed a two-dimensional mechanical–electrical finite element method (FEM) model and an experimental technique to estimate the contact resistance between the bipolar plate and the GDL and reported that the contact resistance decreases rapidly as the clamping pressure is increased. For example, they found that the contact resistance decreased by 20 mΩ·cm2 when the clamping pressure increased from 0.5 MPa to 3.0 MPa. Zhang et al. [5] experimentally estimated the contact resistance between the GDL and bipolar plates using experimental and numerical approaches. They reported that the contact resistance between GDLs and the bipolar plates is influenced by the clamping pressure in the PEFC stack, and it dropped from 9.85 mΩ·cm2 to 3.91 mΩ·cm2 as the cell clamping pressure increased from 0.5 MPa to 3.0 MPa. Vikram et al. [6] reported that there exists a non-linear distribution of the contact resistance along the GDL–BPP interface and that it contributes to about two thirds of the overall ohmic losses in the PEFC. Sow et al. [7] developed a novel numerical and experimental technique to characterise the through-plane interfacial contact resistance and the through-plane bulk resistance for various SGL carbon paper GDLs. They reported that both the bulk and interfacial contact resistances of the GDL increase with polytetrafluoroethylene (PTFE) treatment and that the bulk resistance of the GDL forms only 10% of the total ohmic losses in the PEFC. Ismail et al. [8] experimentally measured the interfacial contact resistance between graphite bipolar plates and uncoated and MPL-coated SGL GDLs using a four-probe ohmmeter. They reported that the contact resistance is significantly reduced with a MPL coating. For example, the measured contact resistance of the SGL 10BA carbon fibre paper decreased from 17.5 mΩ·cm2 to 6.5 mΩ·cm2 when coated with the MPL. Ye et al. [9] developed a multi-electrode probe technique to measure the contact resistance for Toray TGP-H-120 carbon paper and carbon cloth GDLs. They reported that the addition of an MPL coating has no effect on the bulk resistivity of either material but that the interfacial contact resistance of both GDL materials reduces with MPL coating but increases with hydrophobic treatment. Atyabi et al. [10] developed a three-dimensional, multiphase PEFC model to study the effect of assembly pressure on the contact resistance between the gas diffusion layer (GDL) and bipolar plate (BPP) interface. Their result showed that an increase in the compression pressure decreases the interfacial contact resistance between the GDL and the BPP, resulting in an improved fuel cell performance. They also reported that the intrusion of GDL into the flow channel increases with increasing assembly pressure. Bouziane et al. [11] measured the contact resistance for different GDLs with BPPs under cyclic compression ranging from 0 to 8 MPa according to the transmission line method (TLM). They reported that the contact resistance reduced by about 75% at a cyclic compression of 2.5 MPa. Chen et al. [12] developed a three-dimensional, multiphase, and non-isothermal PEFC model to study the effect of the contact resistance between the GDL and the BPP on the dimension of the flow field. They reported that the contact resistance has little effect on channel pressure.
It has been reported in the literature [13,14,15,16] that the MPL improves the water management in the cathode side of the PEFC due to its relatively small pore size and increased hydrophobicity. In addition, it provides mechanical strength, against the clamping force, to the catalyst layer by increasing the surface contact between the catalyst layer and the GDL [10,13]. In addition, it improves the electrical conductivity of the GDL by reducing the interfacial contact resistance between the GDL and the catalyst layer [9] as well as that between the GDL and bipolar plate by its penetration into the GDL [8,17,18]. Ismail et al. [8] reported that MPL coating reduces the interfacial contact resistance between the GDL and the bipolar plate. They attributed this to the compressibility of the MPL, which allows it to penetrate the pores in the GDL and thereby establish good contact at the GDL–bipolar plate interface. There have been various studies in the open literature on novel designs of the GDL–MPL structure to improve its pore structure. For example, Kitahara et al. [17] developed a water vapour exchange system of the PEFC comprising two distinct GDL architectures: one coated with a hydrophobic MPL and the other coated with a hydrophilic MPL loaded with polyvinyl alcohol (PVA) and carbon black. They reported that GDL coated with hydrophilic MPL improves the water transport and enhances the overall PEFC performance more successfully than that coated with hydrophobic MPL. Kitahara et al. [18] also developed a GDL with multi-layered hydrophobic and hydrophilic MPL. The hydrophilic carbon black MPL was deposited on the carbon substrate while the hydrophilic MPL, with carbon black and PVA, was deposited on the hydrophobic MPL so that it faced the catalyst layer. On the other hand, Chun et al. [19] developed a double MPL-coated GDL with a hydrophilic MPL sandwiched between the carbon substrate and the hydrophobic MPL that was in contact with the catalyst layer. They reported better fuel cell performance with the latter GDL than with the conventional hydrophobic MPL-coated GDL under low humidification conditions. Park and Popov [20] studied the effect of PTFE treatment of the GDL on the transport of mass within the PEFC. They reported that an optimal PTFE loading in the GDL reduces the mass transport limitation and increases the oxygen diffusion kinetics. Additionally, very high PTFE loading in the GDL was found to result in lower absolute permeability and material’s bulk porosity while low PTFE loading results in low hydrophobicity and water flooding in the cathode side. Qi and Kaufman [21] investigated MPLs with a carbon loading of 2.0 mg/cm2 and 24, 35, and 45% PTFE loadings. They reported that the MPL with 35% PTFE loading performed best while the one with 45% PTFE loading produced the poorest performance. Nam et al. [22] investigated the vapour condensation and liquid water morphology and breakthrough in the porous layers of the PEFC. They showed that there are large water droplets and liquid water saturation at the interface of the catalyst layer and the GDL due to a jump in pore size. As a result, they suggested inserting a microporous layer between the catalyst layer and the GDL so as to reduce both the water droplet size and liquid saturation. Wang et al. [23] fabricated a bi-functional pore structure MPL using a carbon black composite of acetylene black and BLACK PEARLS 2000 carbon and reported an improved power density of 0.91 W/cm2 for the MPL containing 10 wt.% BLACK PEARLS 2000. Additionally, Wang et al. [24] developed a composite carbon MPL consisting of acetylene carbon black and BLACK PEARLS 2000 carbon which had a bi-functional pore structure for effective mass transport management in the fuel cell. An important finding in their study is that the presence of an MPL at the GDL–bipolar plate interface reduces the electrical contact resistance between the GDL and the bipolar plate. They proposed a double-sided MPL GDL for enhanced electrical conductivity/charge transport as well as gas/water transport. The outcome of their study, as well as that of [8], formed the motivation of the investigation carried out in this work.
In this work, a three-dimensional, multiphase model of the PEFC was developed to mainly investigate, for the first time, the impact of a double-sided MPL coating on the global fuel cell performance and the distribution of the current and oxygen concentration within the cathode GDL. After validating the model, parametric studies were performed by realistically changing the base experimentally estimated value of each of the interfacial contact resistances between the GDL and its adjoining components (i.e., the bipolar plate and the catalyst layer). In addition, the study was extended to investigate the sensitivity of the fuel cell performance to the porosity of the MPLs facing both the bipolar plate and the catalyst layer. The outcomes of this study provide insights on the significance and feasibility of double-sided MPL coatings in PEFCs.

2. Model Description and Transport Equations

The multiphase, non-isothermal, three-dimensional PEFC model includes the transport of gas species, energy, charge, liquid, and dissolved water. The model was made three-dimensional, not two-dimensional, in order to capture the impact of the contact resistance between the GDL and the bipolar plate and to facilitate visualisation of the distribution of the key variables under both the flow channel and the rib of the flow field plate. This section details the conservation equations that govern the transport of these physical quantities as well as their source terms. The PEFC model developed in this study was based on earlier models presented in [25,26]. Detailed descriptions of the conservation equations are given in the following subsections.

2.1. Model Assumptions

To simplify the PEFC model, the following assumptions were made:
  • The fuel cell operates in a steady state;
  • The flow in the flow channels is laminar as the Reynolds numbers are low;
  • The membrane is impermeable to gases;
  • There is uniform compression on all components of the fuel cell;
  • The catalyst layer is coated on the gas diffusion media instead of the membrane.
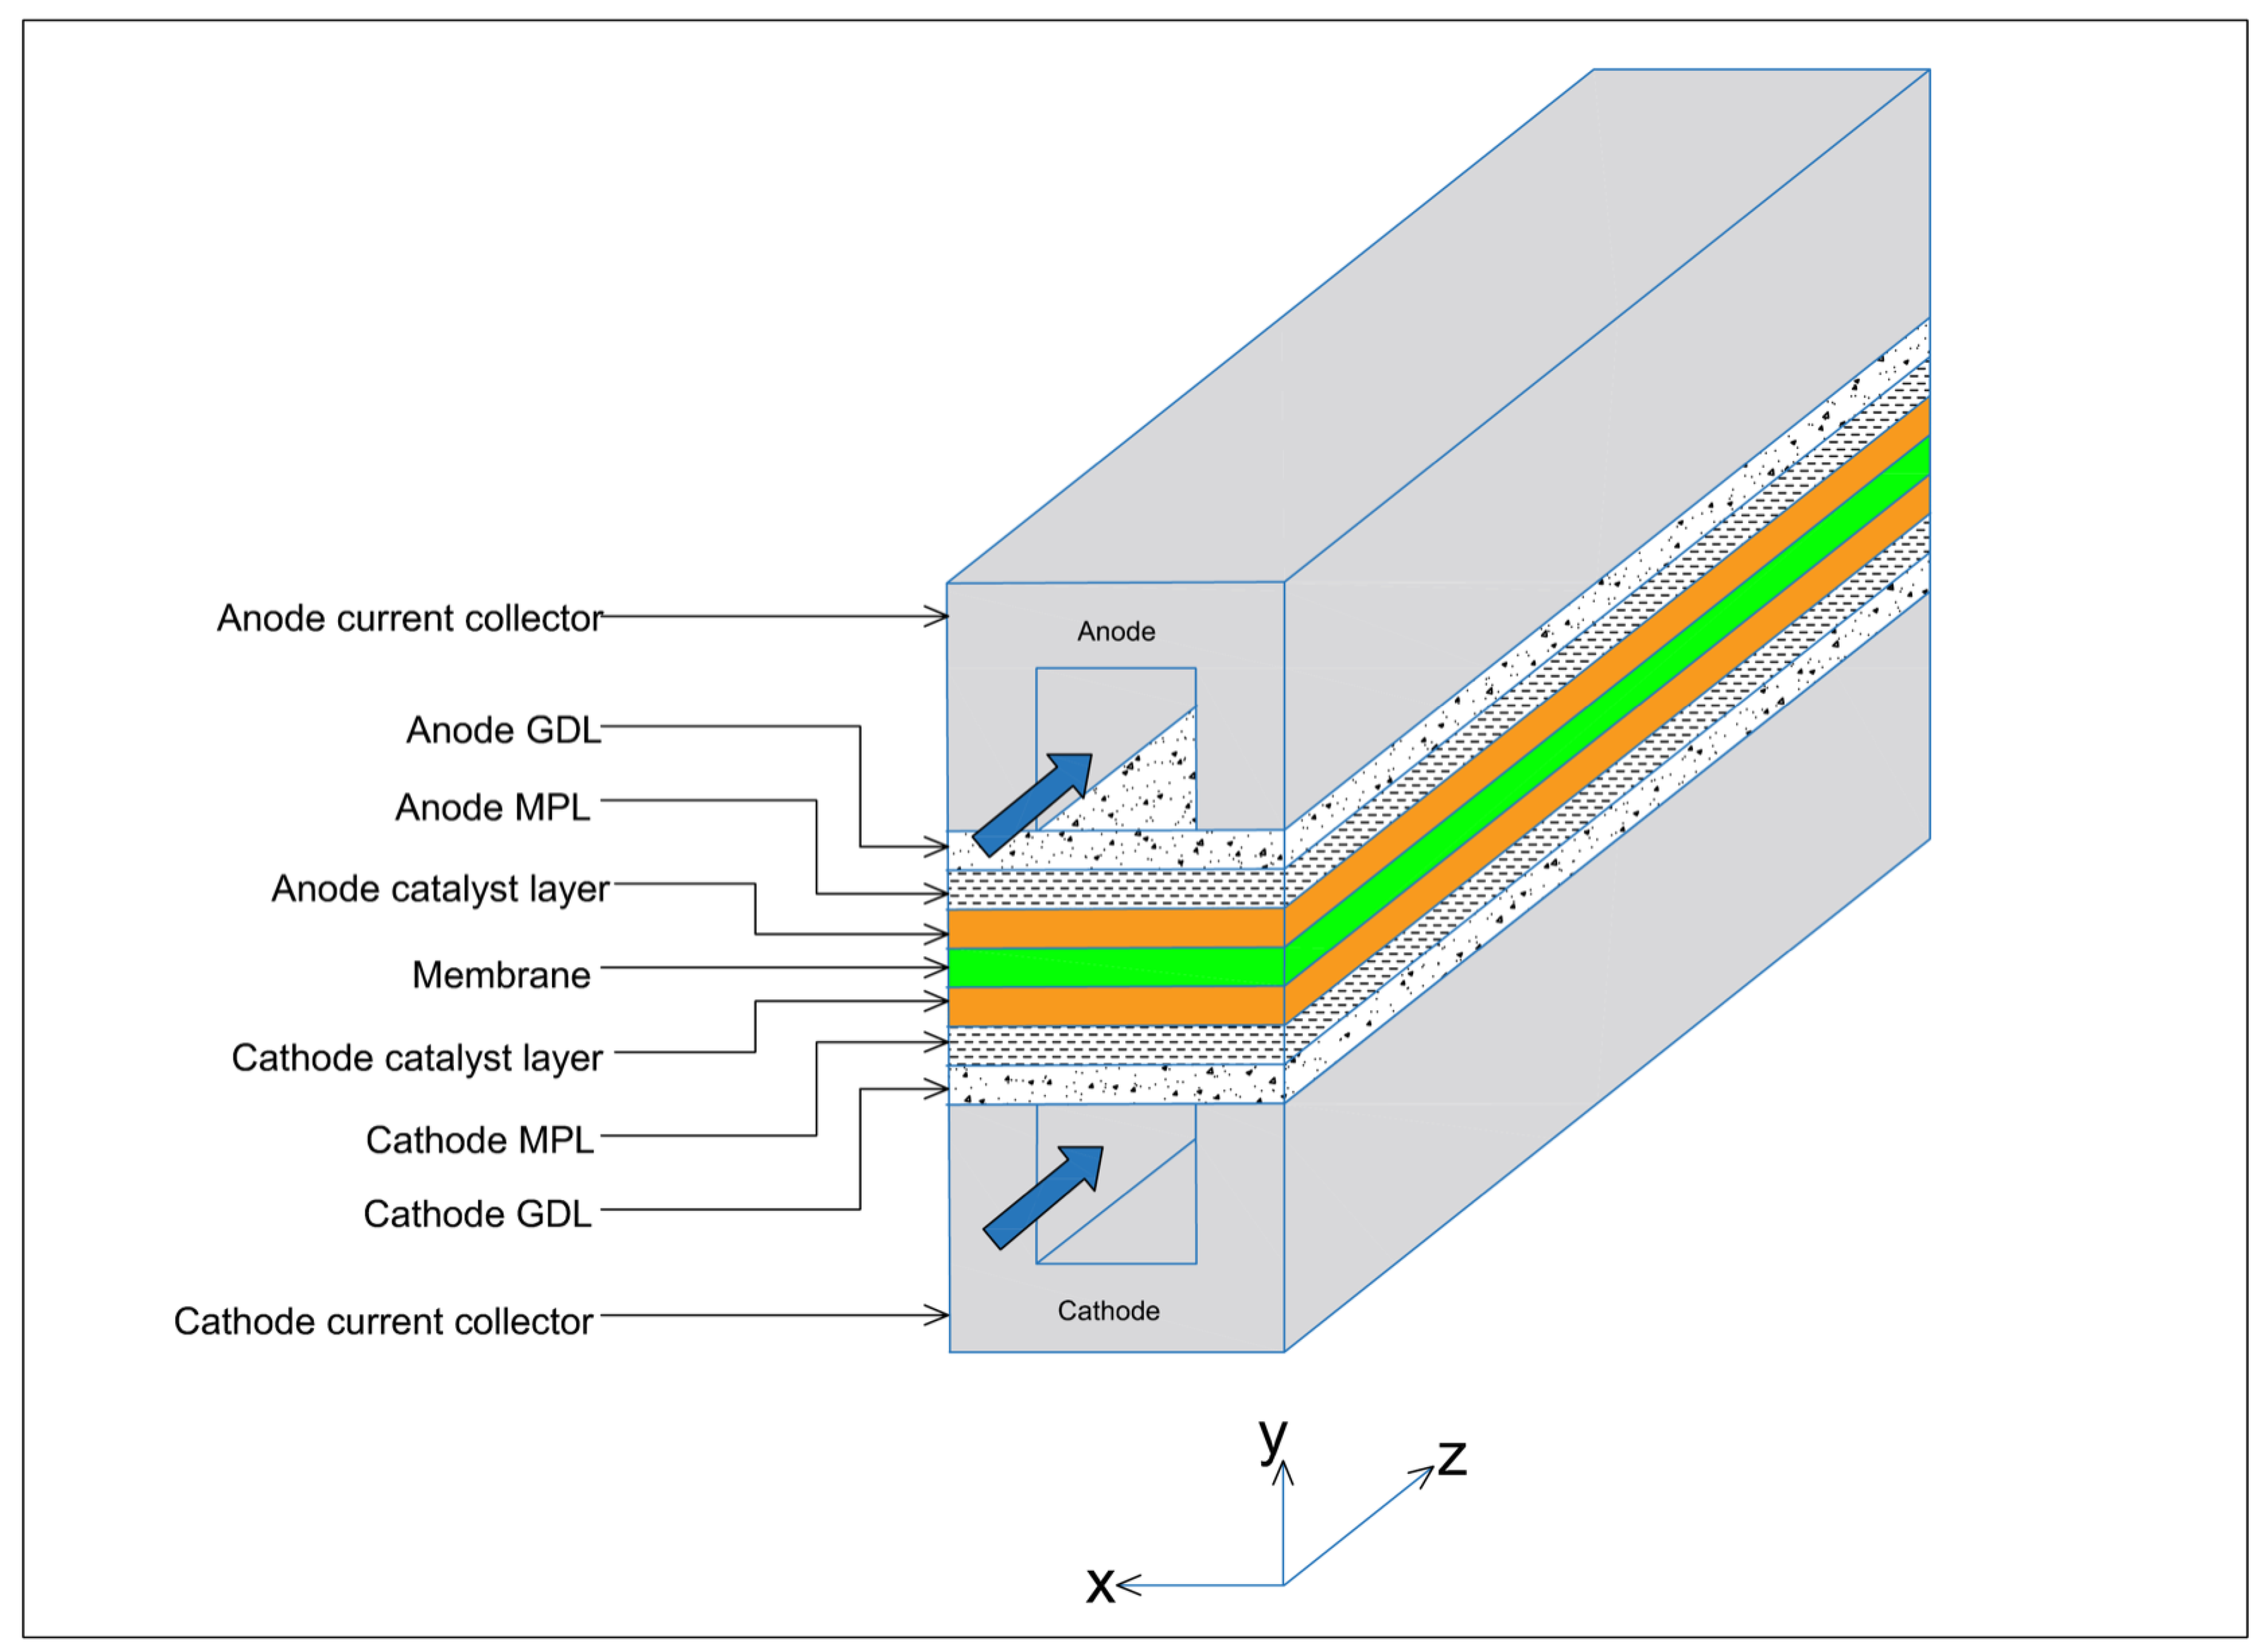
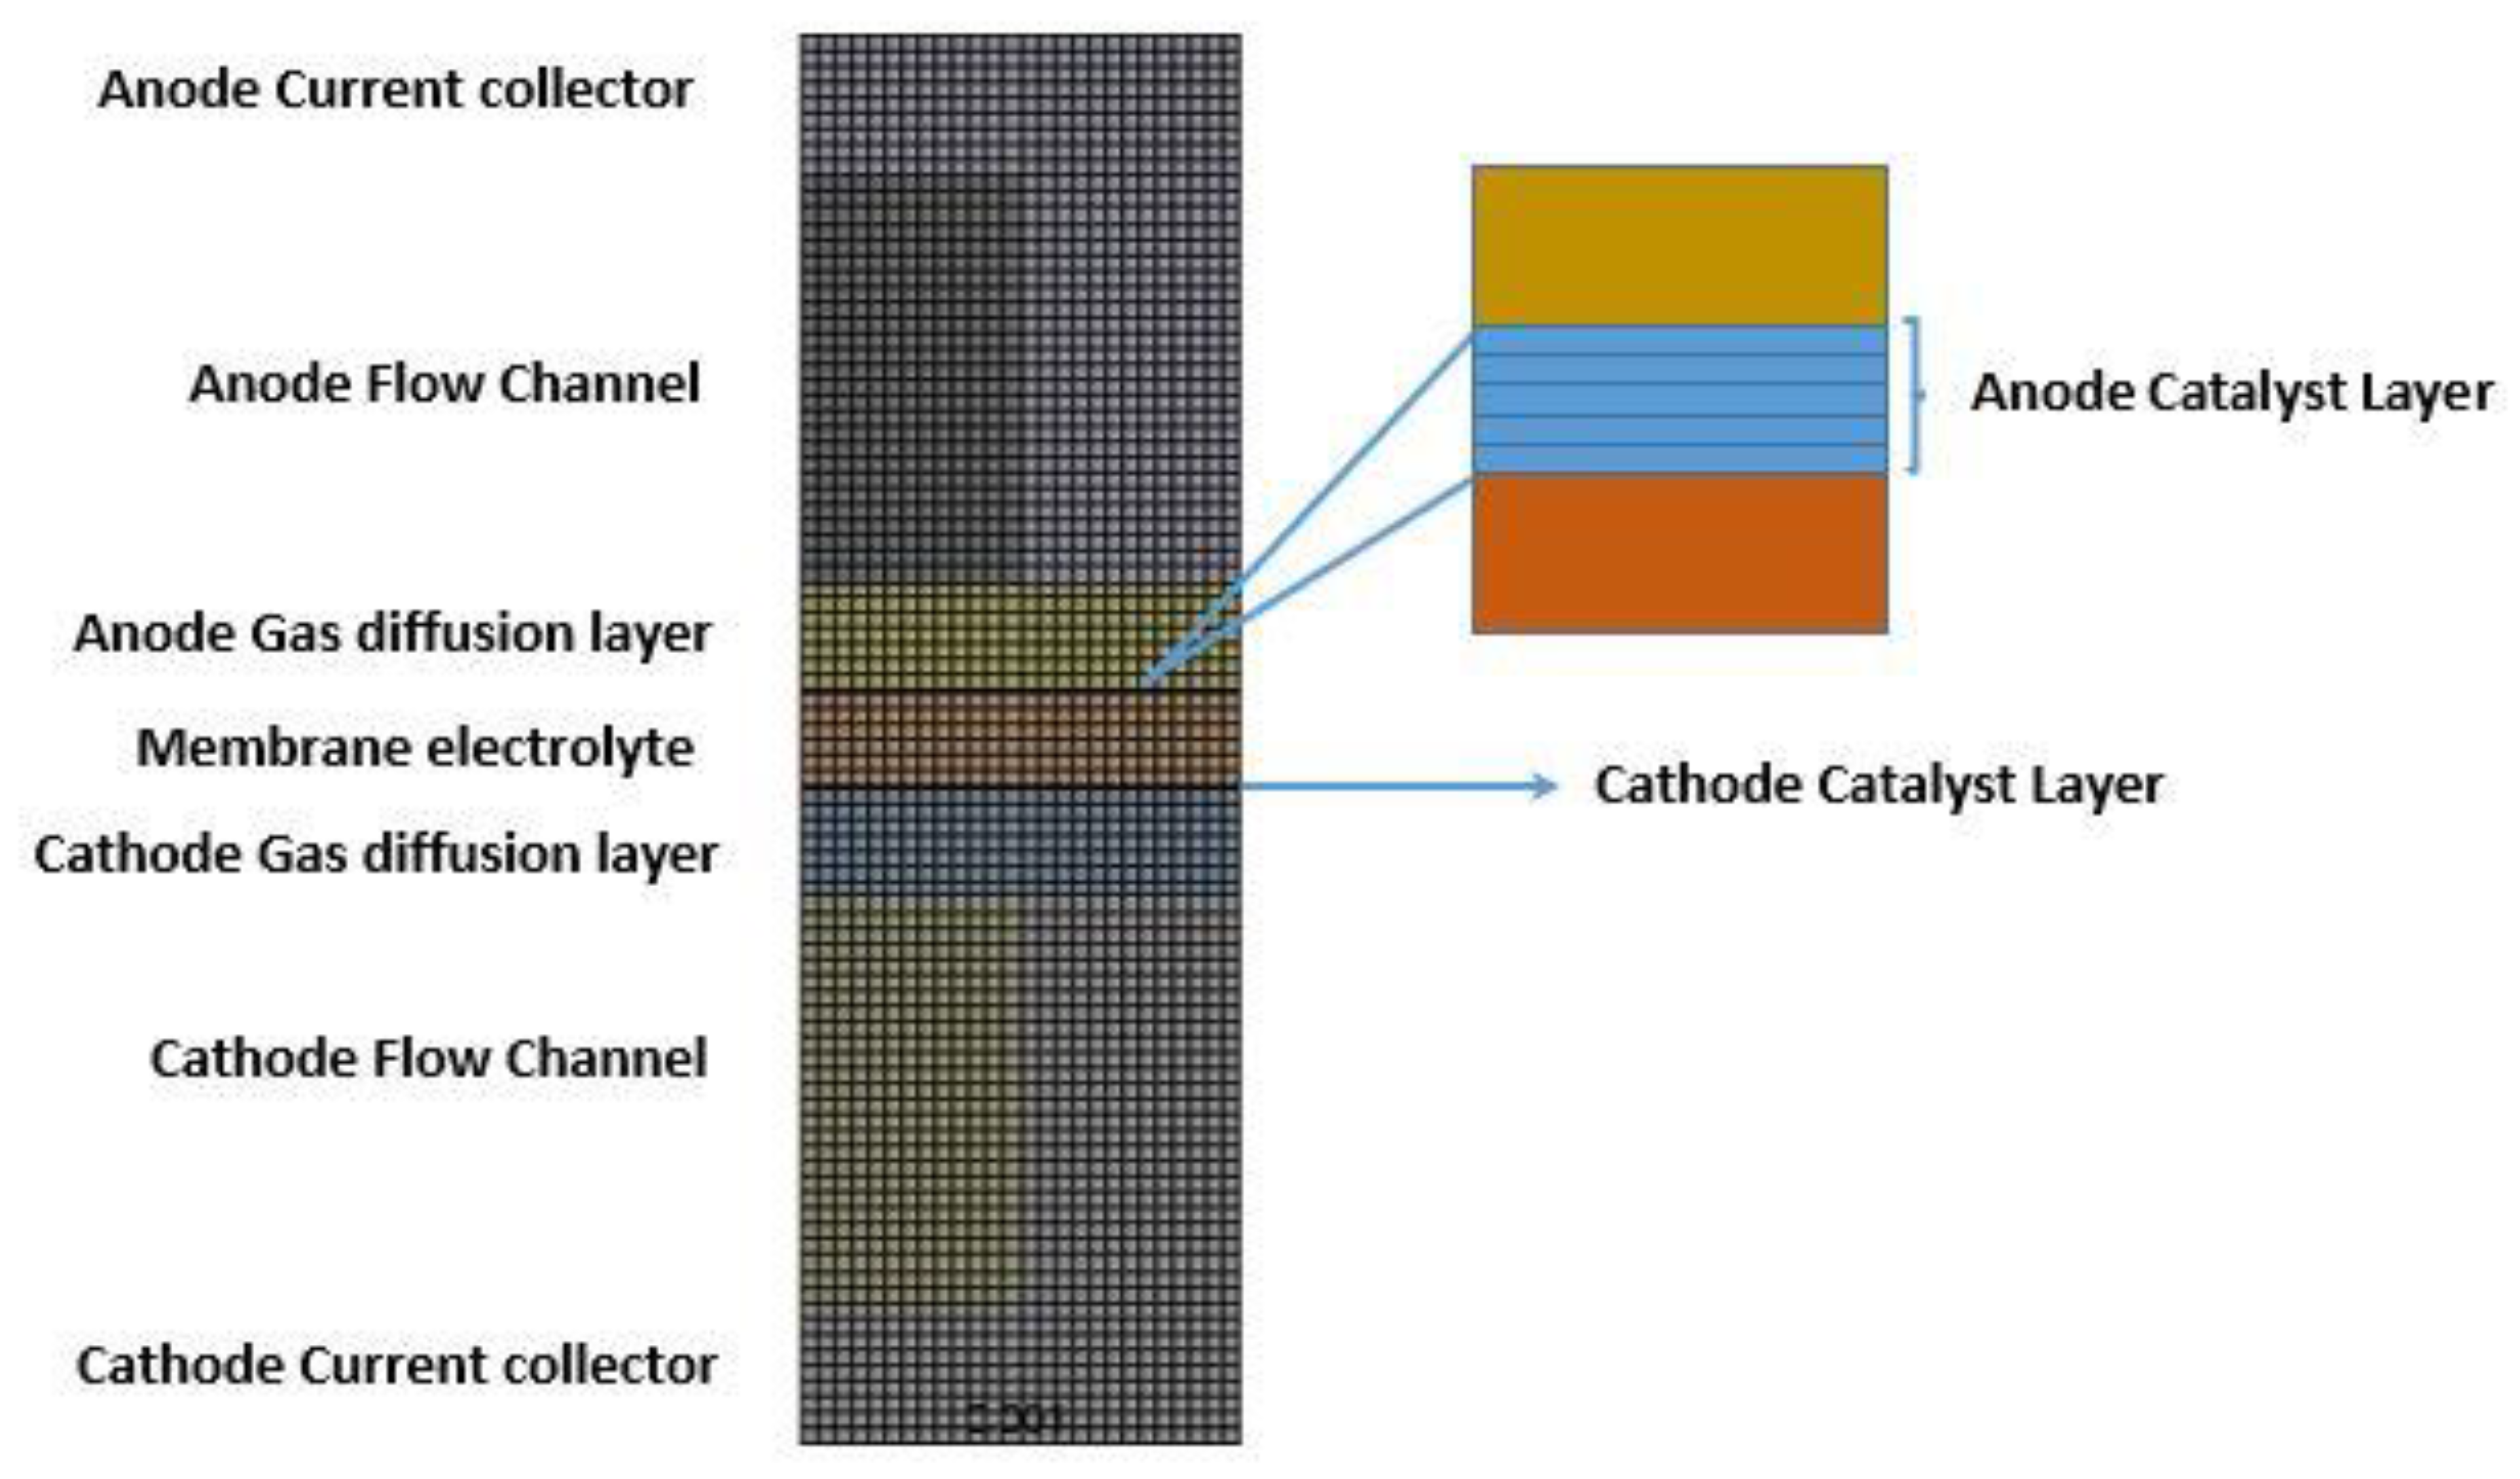
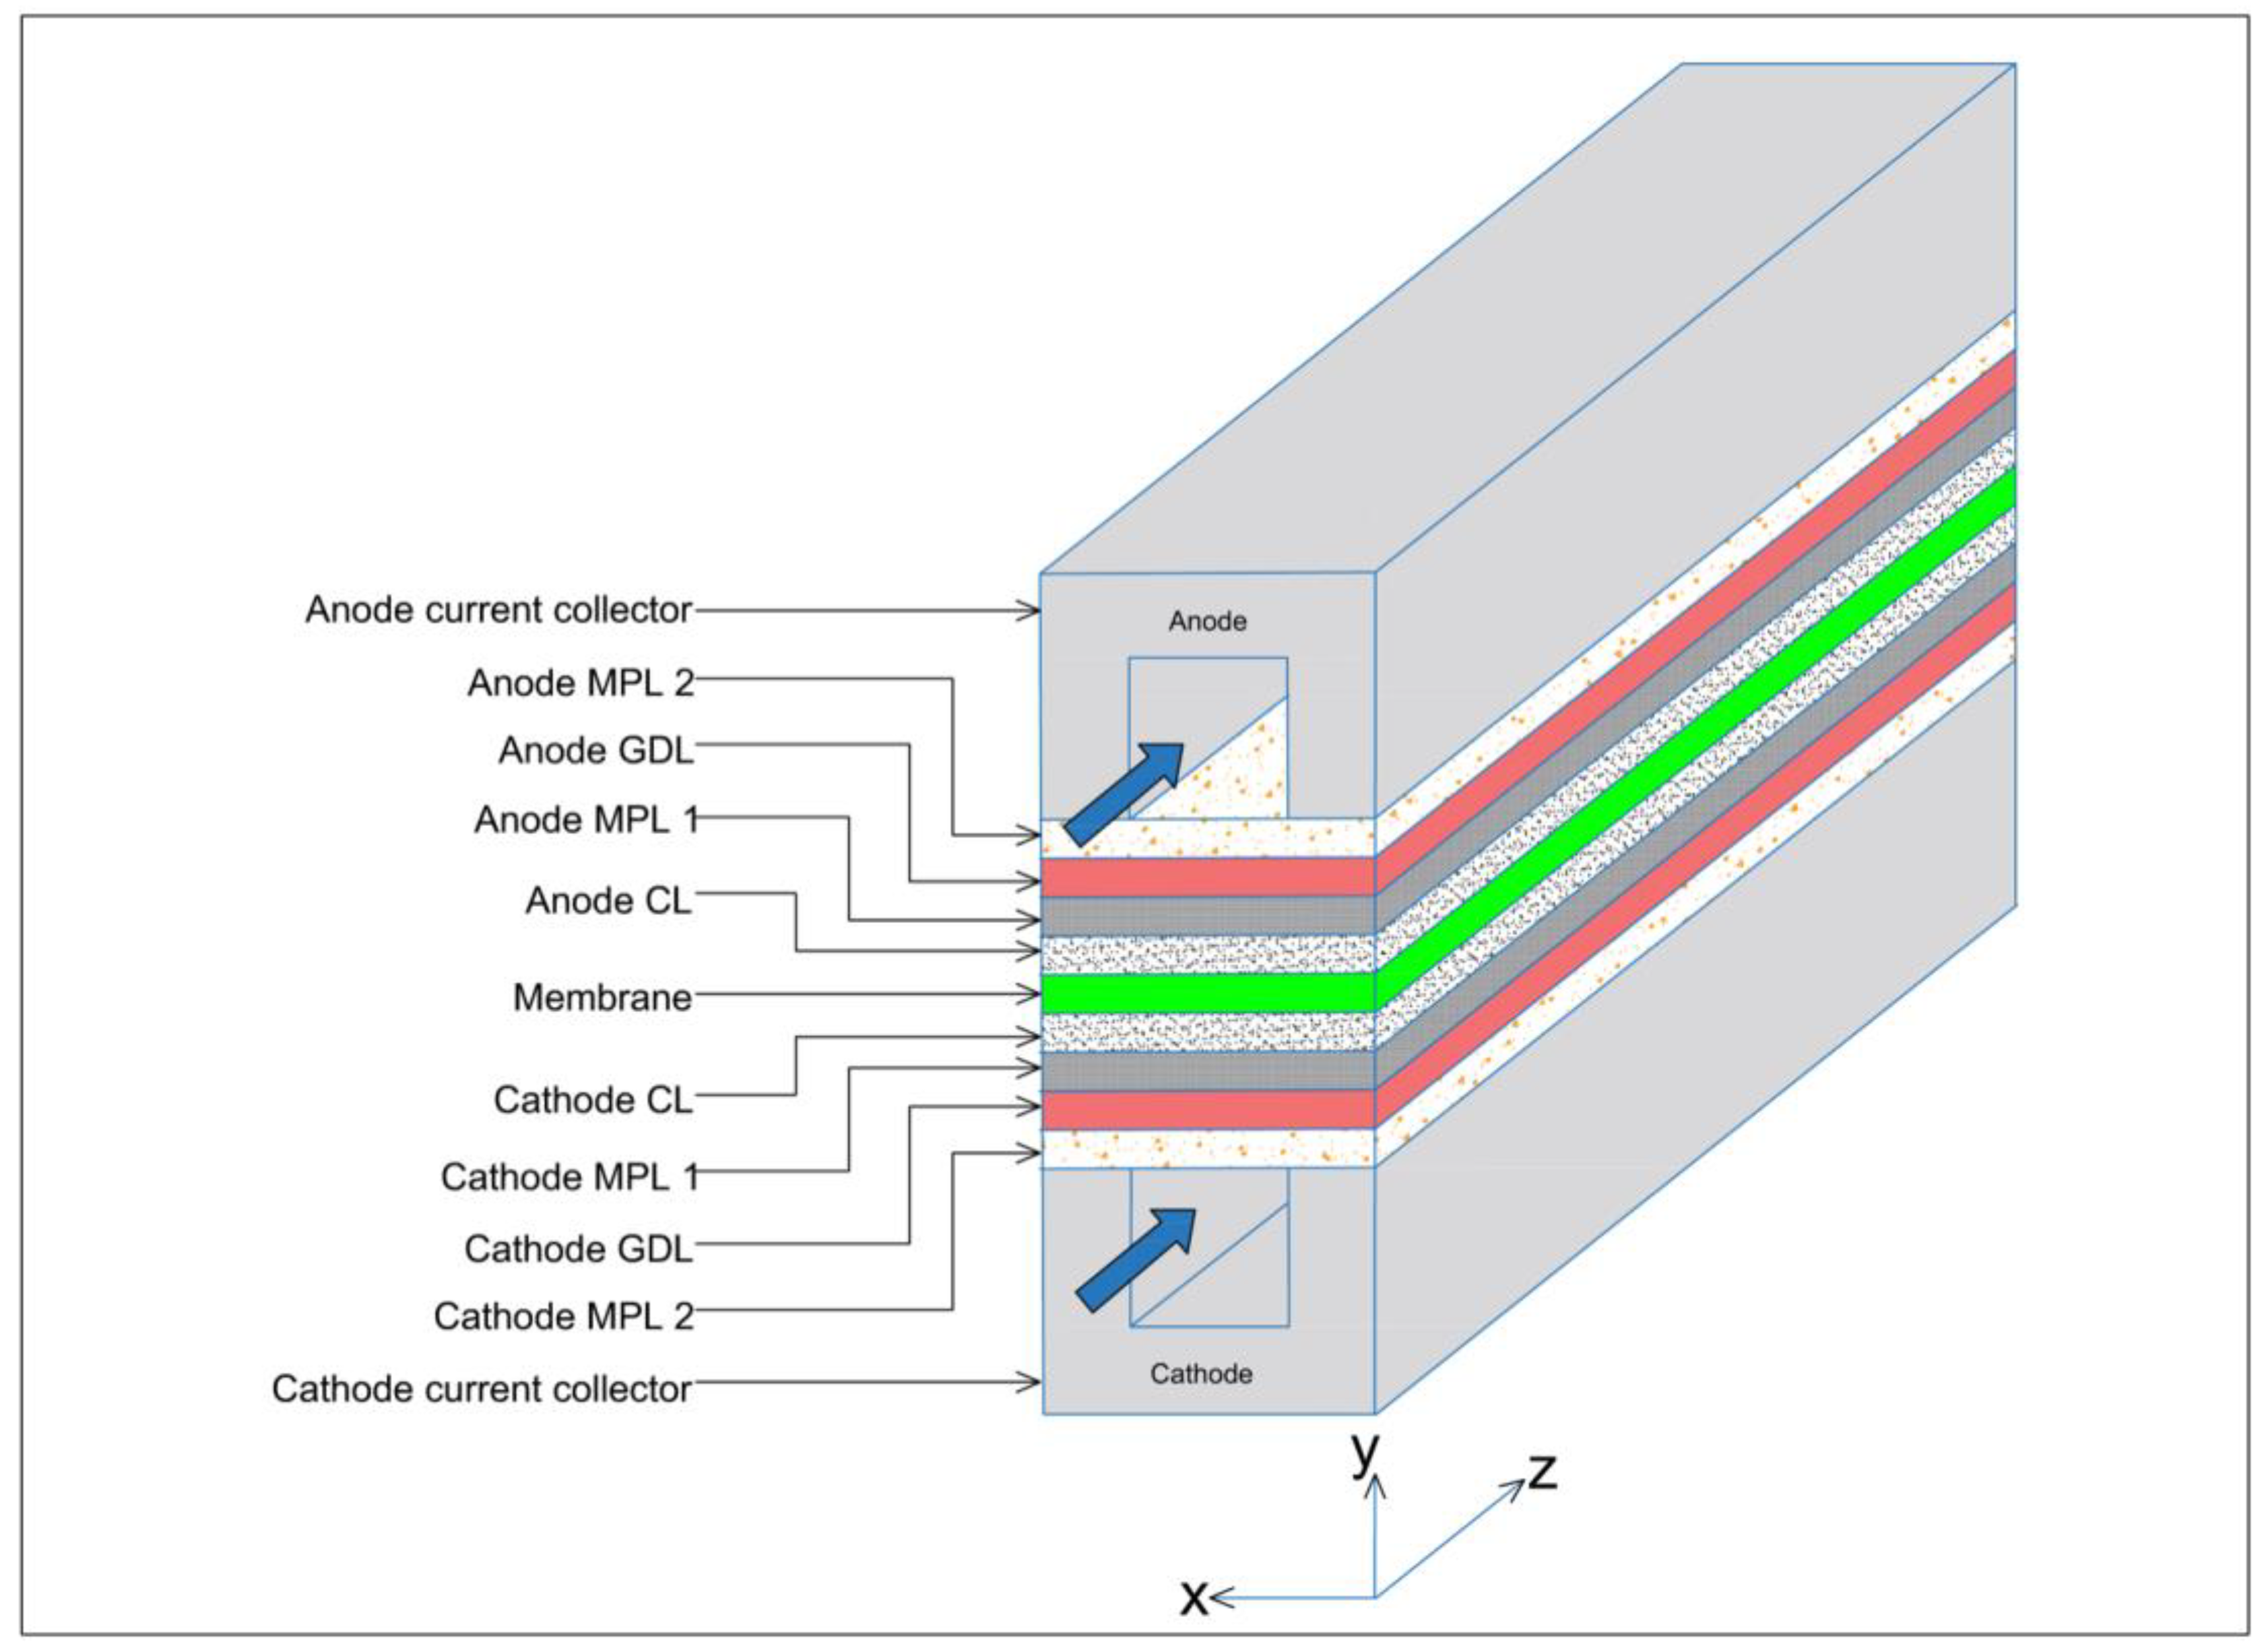
2.2. Model Geometry

The three-dimensional, straight gas flow channel computational domain of the PEFC model is shown in Figure 1 and consists of cathode and anode bipolar plates (or current collectors), cathode and anode flow channels, cathode and anode catalyst layers, cathode and anode GDLs, cathode and anode MPLs, and the membrane electrolyte. Only half of the channel width was considered in the PEFC model due to symmetry and to reduce computational time. The geometrical, operational, and physical parameters of this model are presented in Table 1.

2.3. Governing Equations

The equations which govern the transport of physical quantities are detailed in this section. Equations (1)–(7) were already used and defined in detail in our previous study [26] but are briefly stated here for ease of reference [25,26]. Note that the mathematical expressions of the source terms are placed in the Supplementary Materials attached to this paper.
Mass transport equation
· ε ρ u = 0
where ε is the porosity of the porous medium, and ρ and u are the mixture fluid density and velocity vector, respectively.
Momentum transport equation
· ε ρ u u = ε P + · ( μ ε u ) + ε 2 μ u K
where P is the pressure of the gas mixtures, µ is the dynamic viscosity of the gas mixtures, and K is the permeability of the porous medium.
Species transport equation
· ( ε ρ u Y k ) = · ( ρ D k j e f f Y k ) + S k
where Y k is the mass fraction of species k , and D k j e f f is the effective binary diffusivity of species j into k . D k j e f f is calculated using the Bruggeman’s correlation as follows [30]:
D k j e f f = ε τ D k j
where τ is the tortuosity of the porous medium, and D k j is the bulk binary diffusivity of species k into j . S k is the source term that represents either consumption or production of species k (H2, O2, or H2O).
Energy transport equation
· ρ c p u T = · k e f f T + S e
where T is the temperature, c p is the specific heat capacity of the gas mixtures, and k e f f is the effective thermal conductivity. S e is the heat source term and takes one of the forms shown in the Supplementary Materials.
Charge transport equations
Two potential equations for the electronic and ionic conduction were solved. The equations are expressed as follows:
· σ s ϕ s = S ϕ , s
· σ m ϕ m = S ϕ , m
where ϕ s and ϕ m are the electrical (solid-phase) and ionic (membrane-phase) potentials, respectively. S ϕ , s and S ϕ , m are the solid-phase potential and membrane-phase potential, respectively.
Liquid water transport equations
· ρ l K r l μ g K r g μ l u = · ρ l D s s + S l
where K r l and K r g are the relative permeability of liquid and gaseous phases of water, respectively, and are given as follows [25]:
K r l = s 3
K r g = ( 1 s ) 3
where s is the liquid water saturation. The capillary diffusion coefficient D s in Equation (8) is given as follows [25]:
D s = K s 3 μ l d P c d s
where μ l is the dynamic viscosity of liquid water. P c is the capillary pressure and is given as follows [25]:
P c = σ c o s ( θ c ) ε K 0.5 ( 1.417 s 2.12 s 2 + 1.263 s 3 )
where σ is the surface tension of water, θ c is the contact angle, and K is the absolute permeability.

2.4. Boundary Conditions and Numerical Procedure

Mass flow rate boundary conditions were specified for the inlets of the anode and cathode gas flow channels. An operating temperature of 353 K and the species mass fractions were also specified at the inlets of the gas flow channels with the inlet liquid water saturation set to zero. The fluid mass flow rate is defined as a function of a typical operating current density ( i o p ), which is, in this case, 1.0 A/cm2, the active area of the fuel cell ( A a c t ), the mass fraction of the gas reactant ( Y ), and the stoichiometric ratio ( ξ ) of the reactant gas, which was set as 1.5 and 2 for the hydrogen and oxygen gases, respectively. Therefore, the anodic and the cathodic mass flow rates can be given as follows [25]:
Q a = ξ a M H 2 2 F Y H 2 i o p A a c t
Q c = ξ c M O 2 4 F Y O 2 i o p A a c t
The boundary conditions for the anode and cathode outlets and wall terminals were the same as those specified in our previous work [26]. The above conservation equations governing mass, heat, and charge, and liquid water transport in the PEFC together with the coupled boundary conditions were solved using the polymer electrolyte membrane (PEM) fuel cell module provided by the commercial solver ANSYS Fluent. The semi-implicit method for pressure-linked equations (SIMPLE) algorithm was employed for the pressure–velocity coupling with the second-order upwind discretisation scheme for the conservation of momentum, species, energy, charge, and liquid water equations. A mesh independence test was carried out on the model. It was found that a mesh size of about 1.4 million cells gave a solution independent of the mesh; doubling the mesh size to about 2.7 million cells resulted in a variation of less than 0.3% in the key performance indicator, which was, in this case, the average current density at 0.55 V. The meshed geometry of the computational domain is shown in Figure 2; Table 1 shows the geometrical, operational, and physical parameters of the PEFC model.

3. Results and Discussion

Figure 3 shows the polarisation curve for the simulated PEFC model to be in good agreement with the experimental data of Wang et al. [29]. This imparts much confidence in the model developed, and therefore we could proceed with confidence with the parametric studies.
The first part of this investigation was aimed at studying the sensitivity of the performance of the modelled PEFC (with single-sided and double-sided MPL-coated GDL) to the interfacial contact resistance between the fuel cell components. To achieve this aim, the experimentally estimated interfacial contact resistance values that a typical MPL-coated GDL makes with a graphite bipolar plate at a typical clamping pressure (1.5 bar) [8] were employed in the model and realistically changed. The outcomes of the study are discussed below.

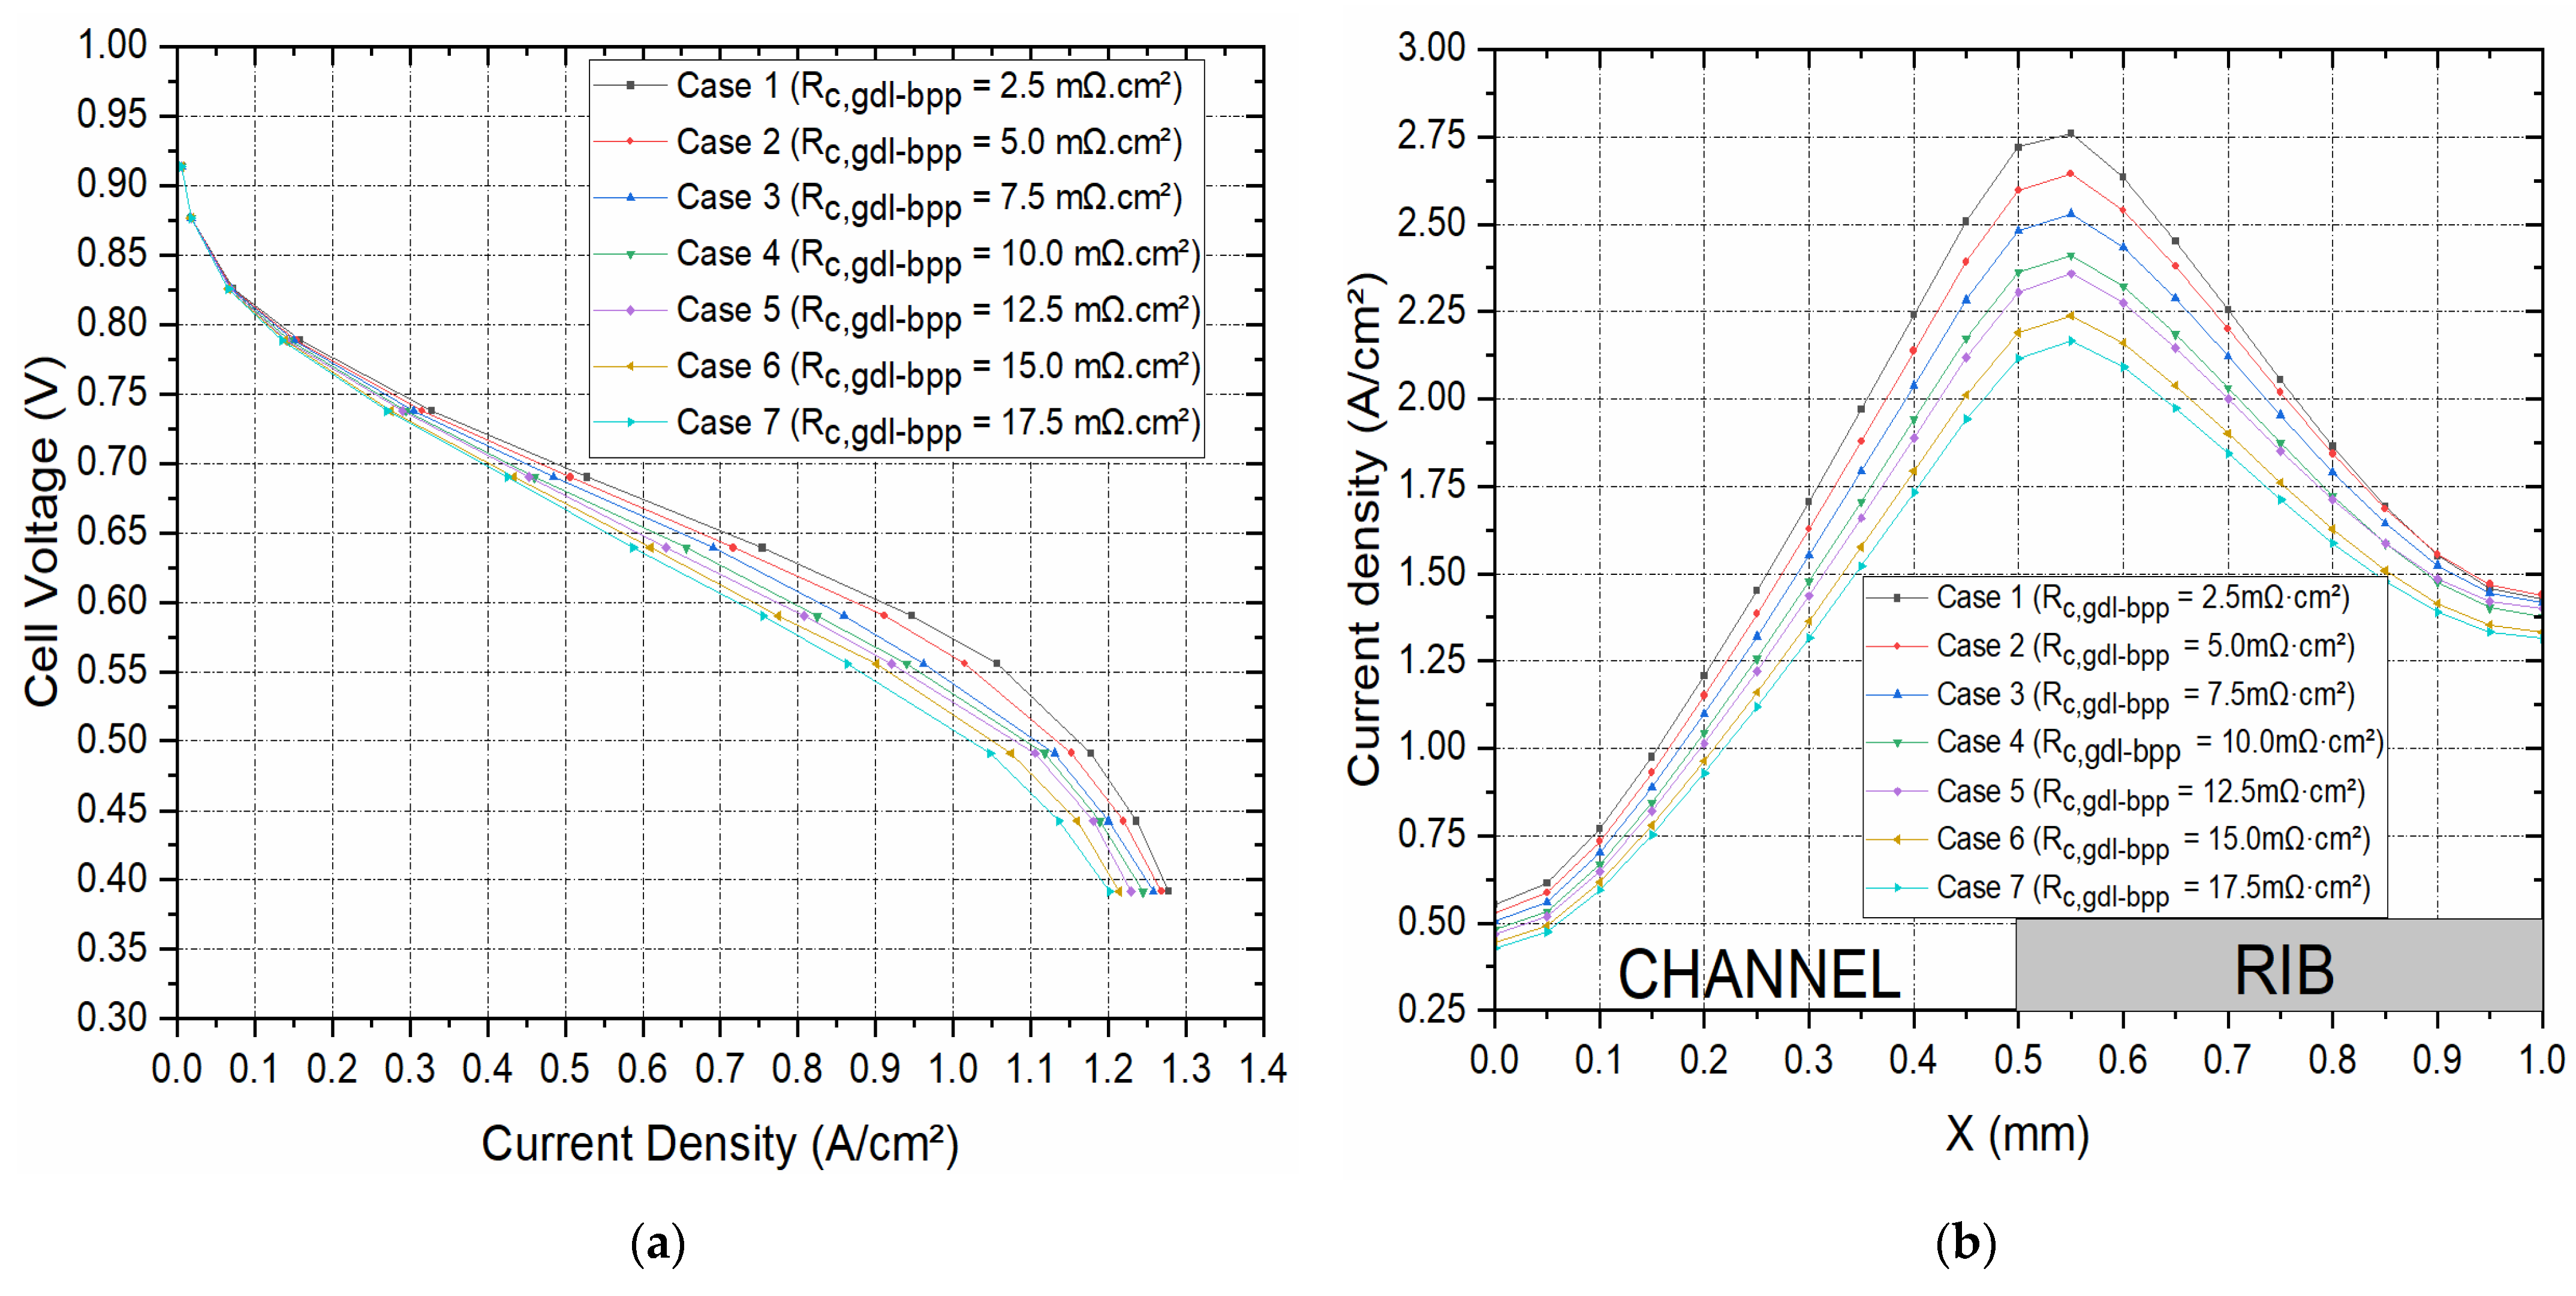
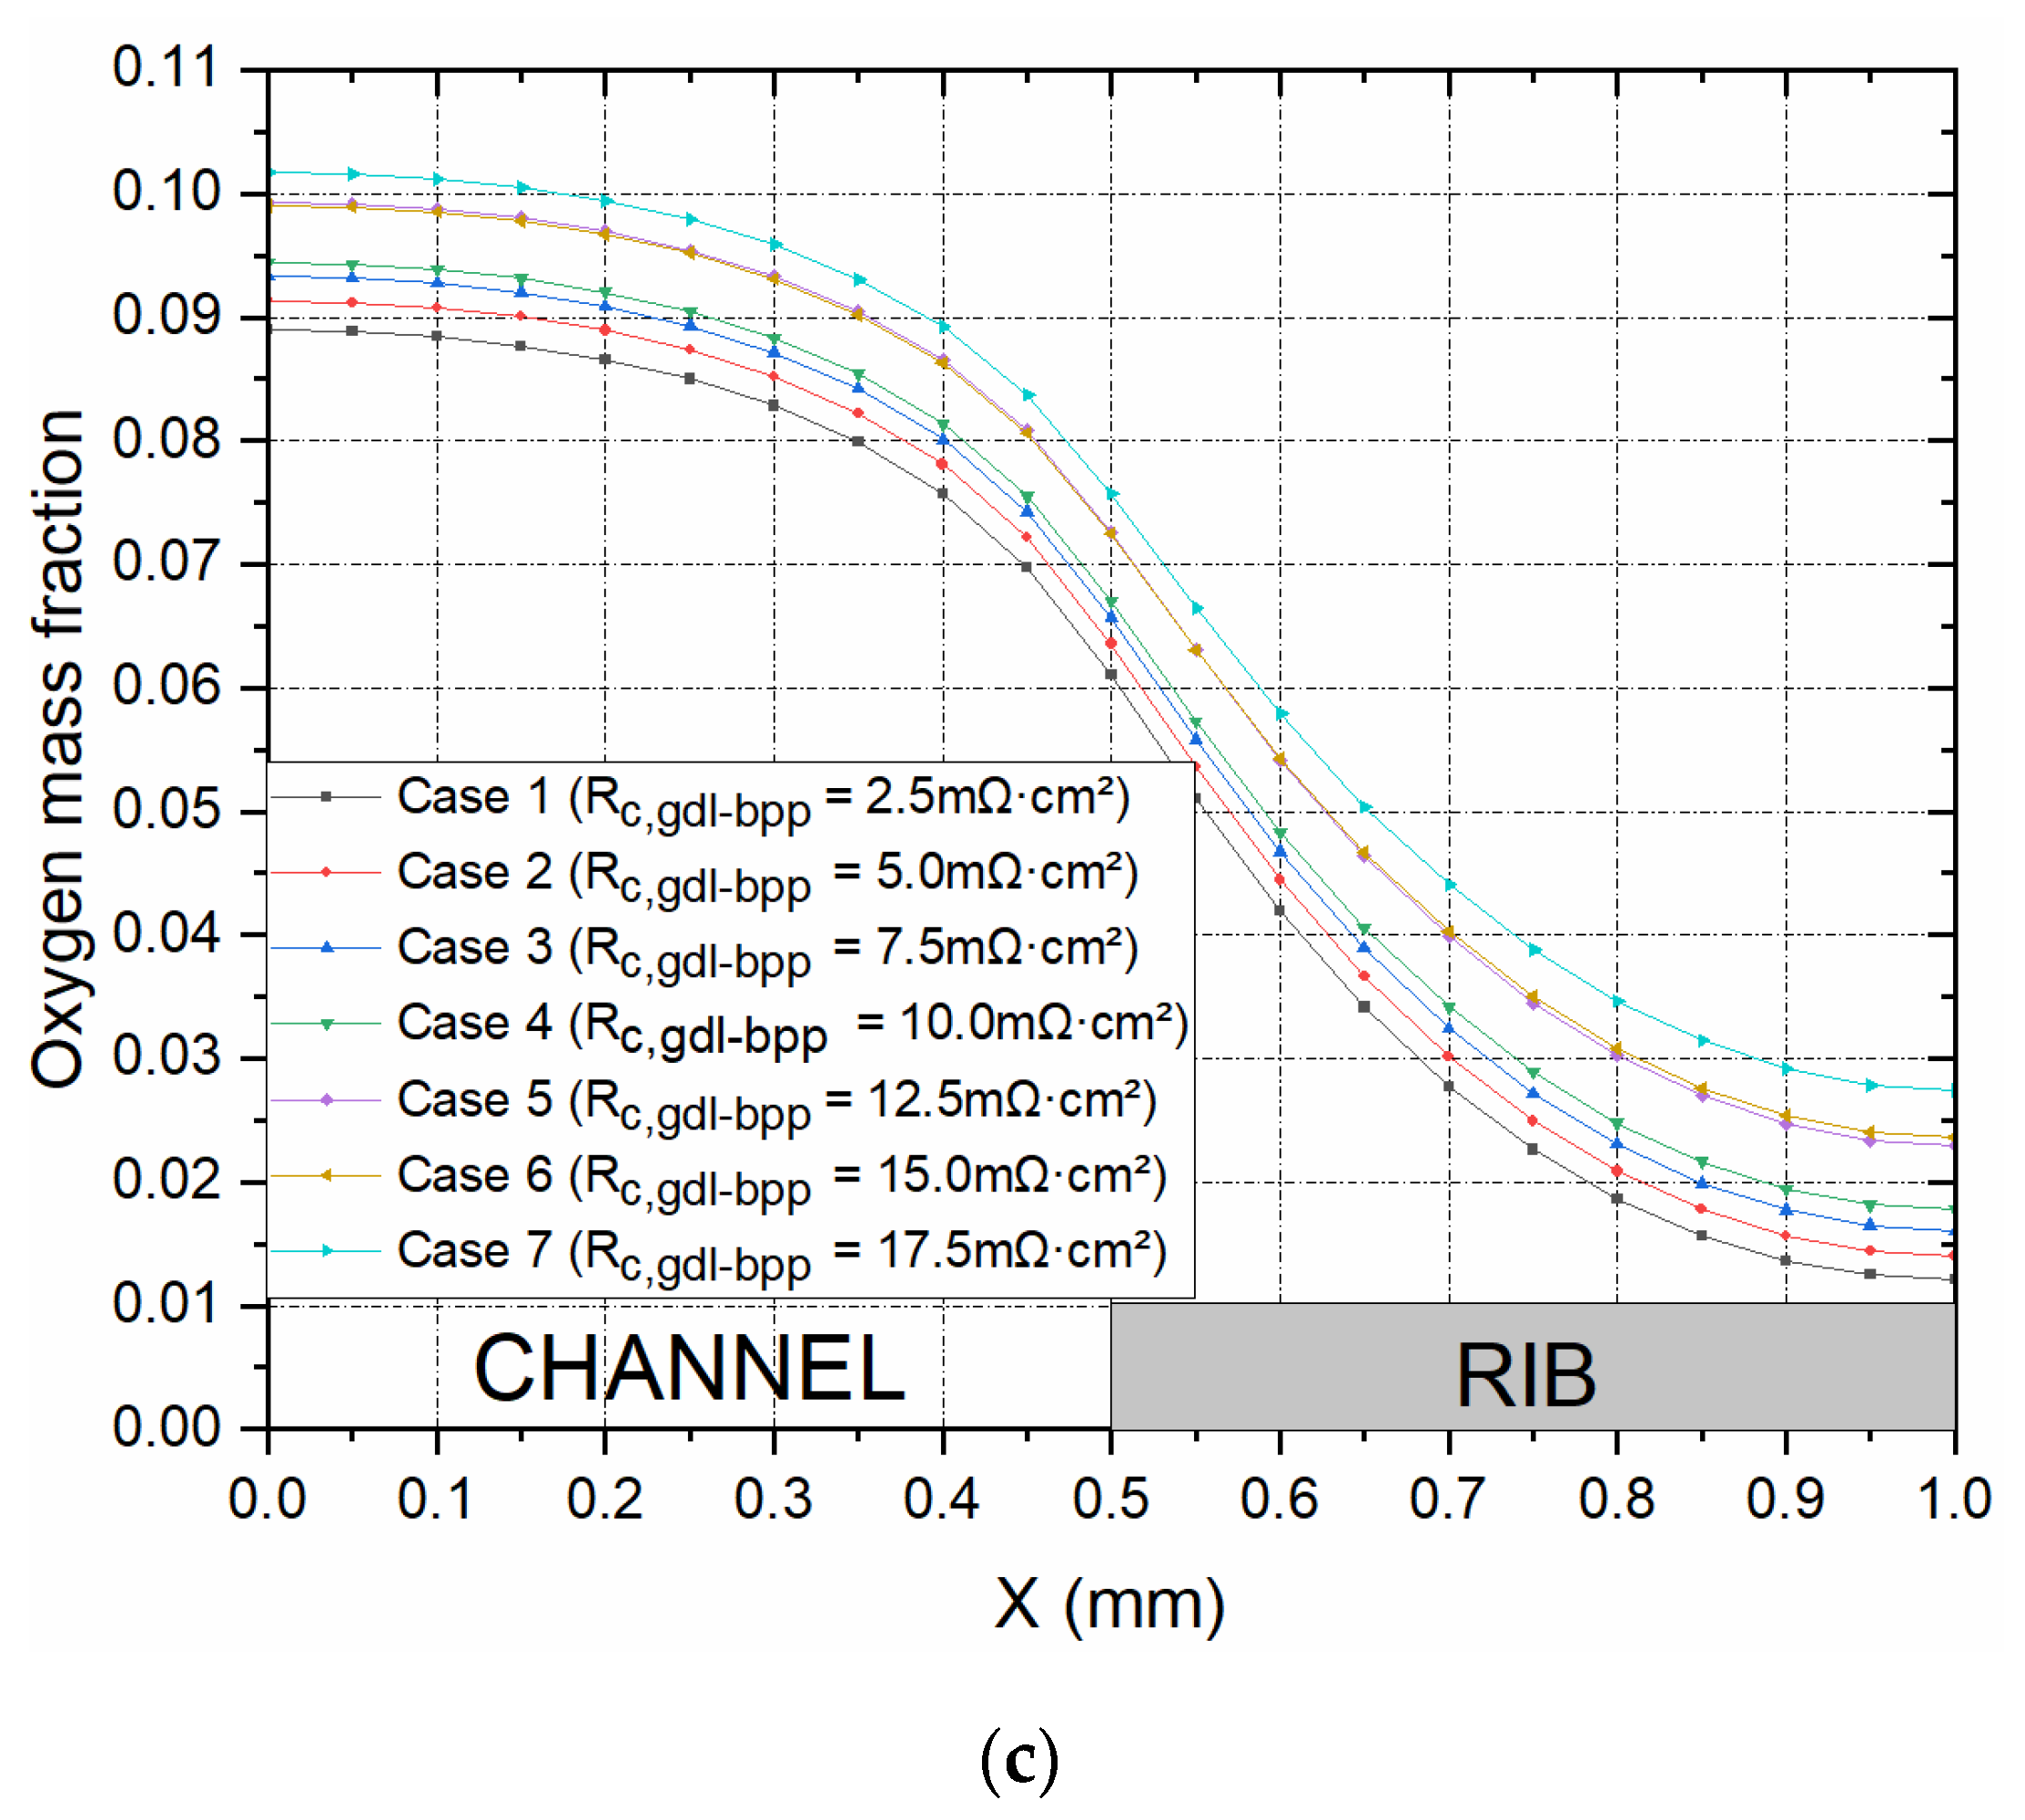
3.1. Contact Resistance between the GDL and the Bipolar Plate

Figure 4a shows the polarisation curves for seven cases where the contact resistance between the GDL and the bipolar plate was systematically and realistically changed from 2.5 to 17.5 mΩ·cm2 to correspond to realistic clamping pressures [8]. Note that the values 2.5, 5.0, and 7.5 mΩ·cm2 were most likely the values obtained when coating the surface of the carbon substrate facing the bipolar plate with an MPL [8]; see Figure 5. As expected, the fuel cell performed better, with decreasing the contact resistance between the GDL and the bipolar plate. For example, the current density at 0.55 V increased by 29.4% when the contact resistance decreased from 17.5 to 2.5 mΩ·cm2. This was evidently due to the decrease in the ohmic losses of the fuel cell with the above decreasing contact resistance. In addition, this signifies that using double-sided MPL-coated GDLs (the cases where 2.5, 5.0, and 7.5 mΩ·cm2 were used) could significantly improve the fuel cell performance. Figure 4b shows the distribution of the current density taken at the midpoint of the cathode GDL, half the length of the fuel cell channel, at a cell potential of 0.55 V. In accordance with the above global results, the case with the lowest contact resistance between the GDL and the bipolar plate showed the highest local current distribution. Further, it can be observed from the latter figure that the current density, for all the cases, reached its peak at the interface of the gas flow channel and the current collector rib, and this is due to the fact that this position is the point where the transport of oxygen and the transport of charge are both optimised. Figure 4c shows the distribution of oxygen at the same position as the current density. This figure shows that oxygen concentration increased with increasing contact resistance between the GDL and the bipolar plate; this signifies that the rate of reaction is higher with decreasing contact resistance, and, as such, more oxygen is consumed in the catalyst layer. As a general note, for all the cases, the oxygen concentration was at its maximum at the middle of the flow channel, and this is due to this being the position with the least mass transport resistance.

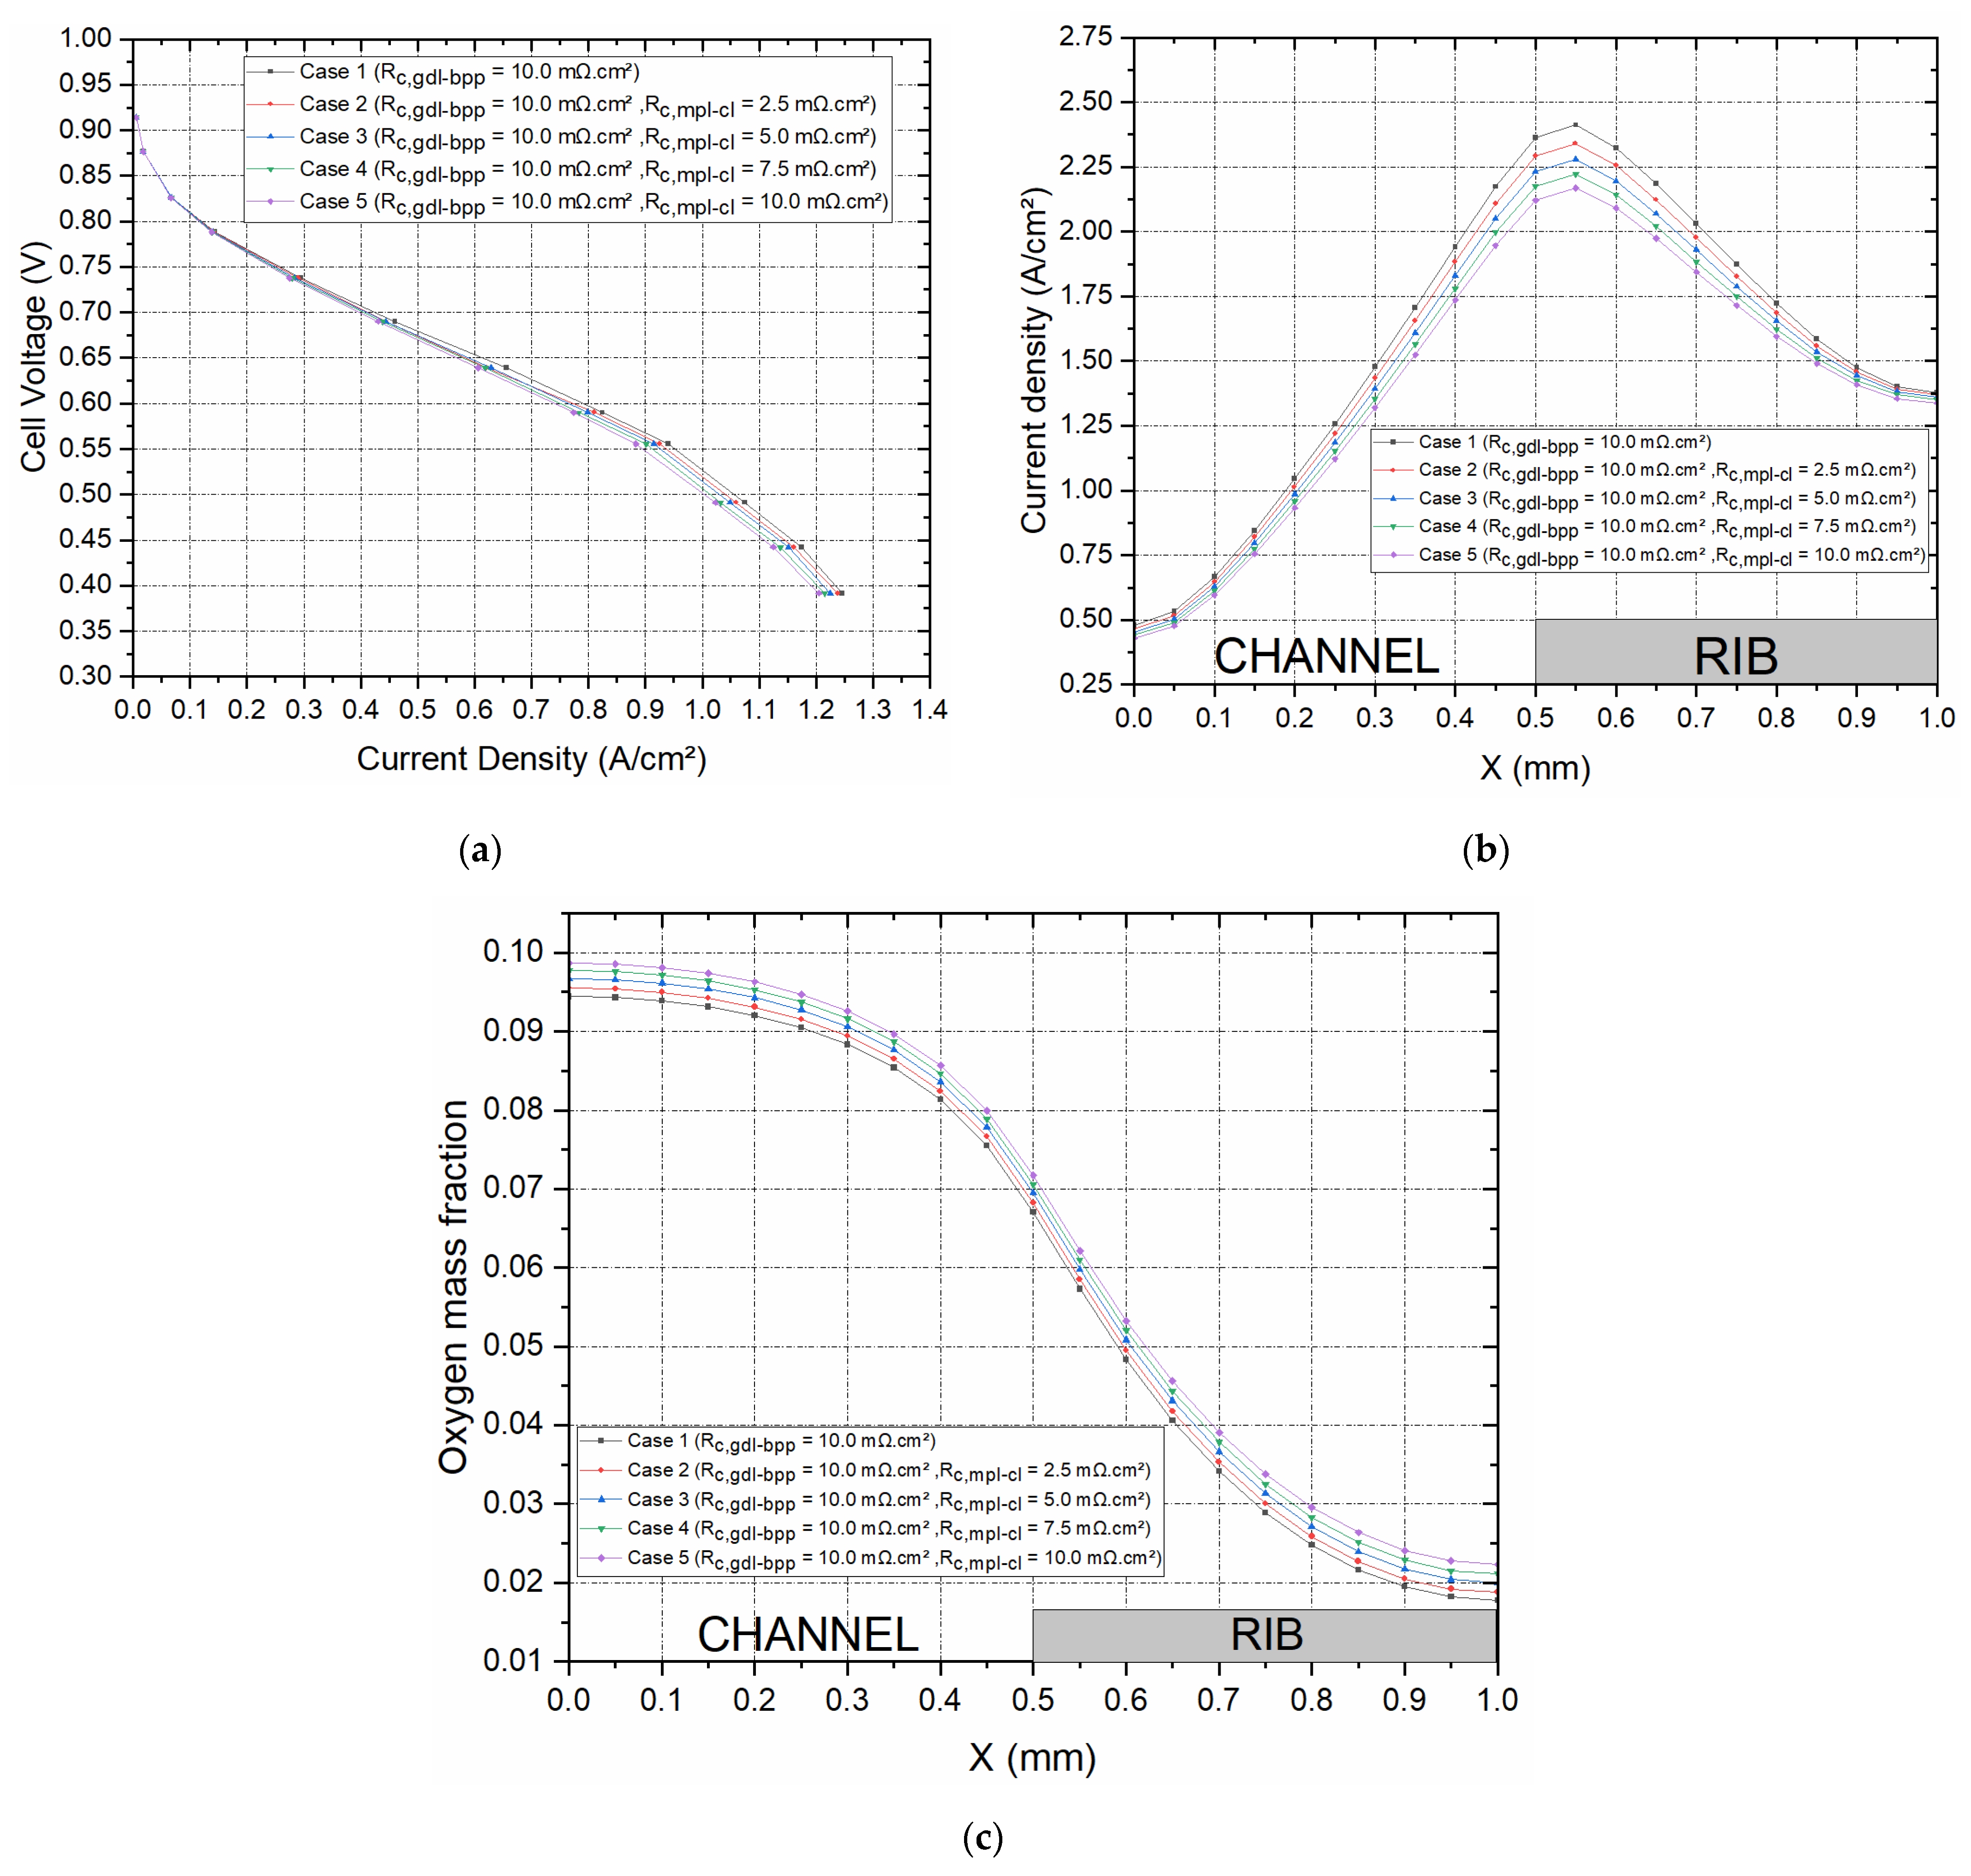
3.2. Contact Resistance between the MPL and the Catalyst Layer

One of the assumptions for this PEFC model was that the catalyst layer is deposited directly on the gas diffusion media instead of the membrane. Therefore, the interfacial contact resistance between the GDL and the catalyst layer was assumed to be negligible, and the gas diffusion electrode was assumed to be homogenous. The assumption was made at the initial stage to simplify the model and also because there are no existing experimentally estimated values of the interfacial resistance between the MPL and the catalyst layer in the open literature. However, to investigate the sensitivity of the global PEFC performance, as well as the local distribution of the current density and oxygen mass fraction, within the cathode GDL, the interfacial contact resistance between the MPL and the catalyst layer was realistically changed between 0 and 10 mΩ·cm2 for a given GDL–BPP contact resistance of 10 mΩ·cm2. The polarisation curves, for the cases investigated, as well as the distribution of current density and oxygen within the cathode GDL are shown in Figure 6. As expected, the fuel cell performance improved with decreasing contact resistance. To illustrate this situation, the current density at 0.55 V increased by 11.8% when the contact resistance between the MPL and the catalyst layer decreased from 10 to 0 mΩ·cm2. Additionally, the local distribution of the oxygen and current density within the cathode GDL was similar to that obtained in the previous section; the current density increased and oxygen concentration decreased with increasing MPL–CL contact resistance.

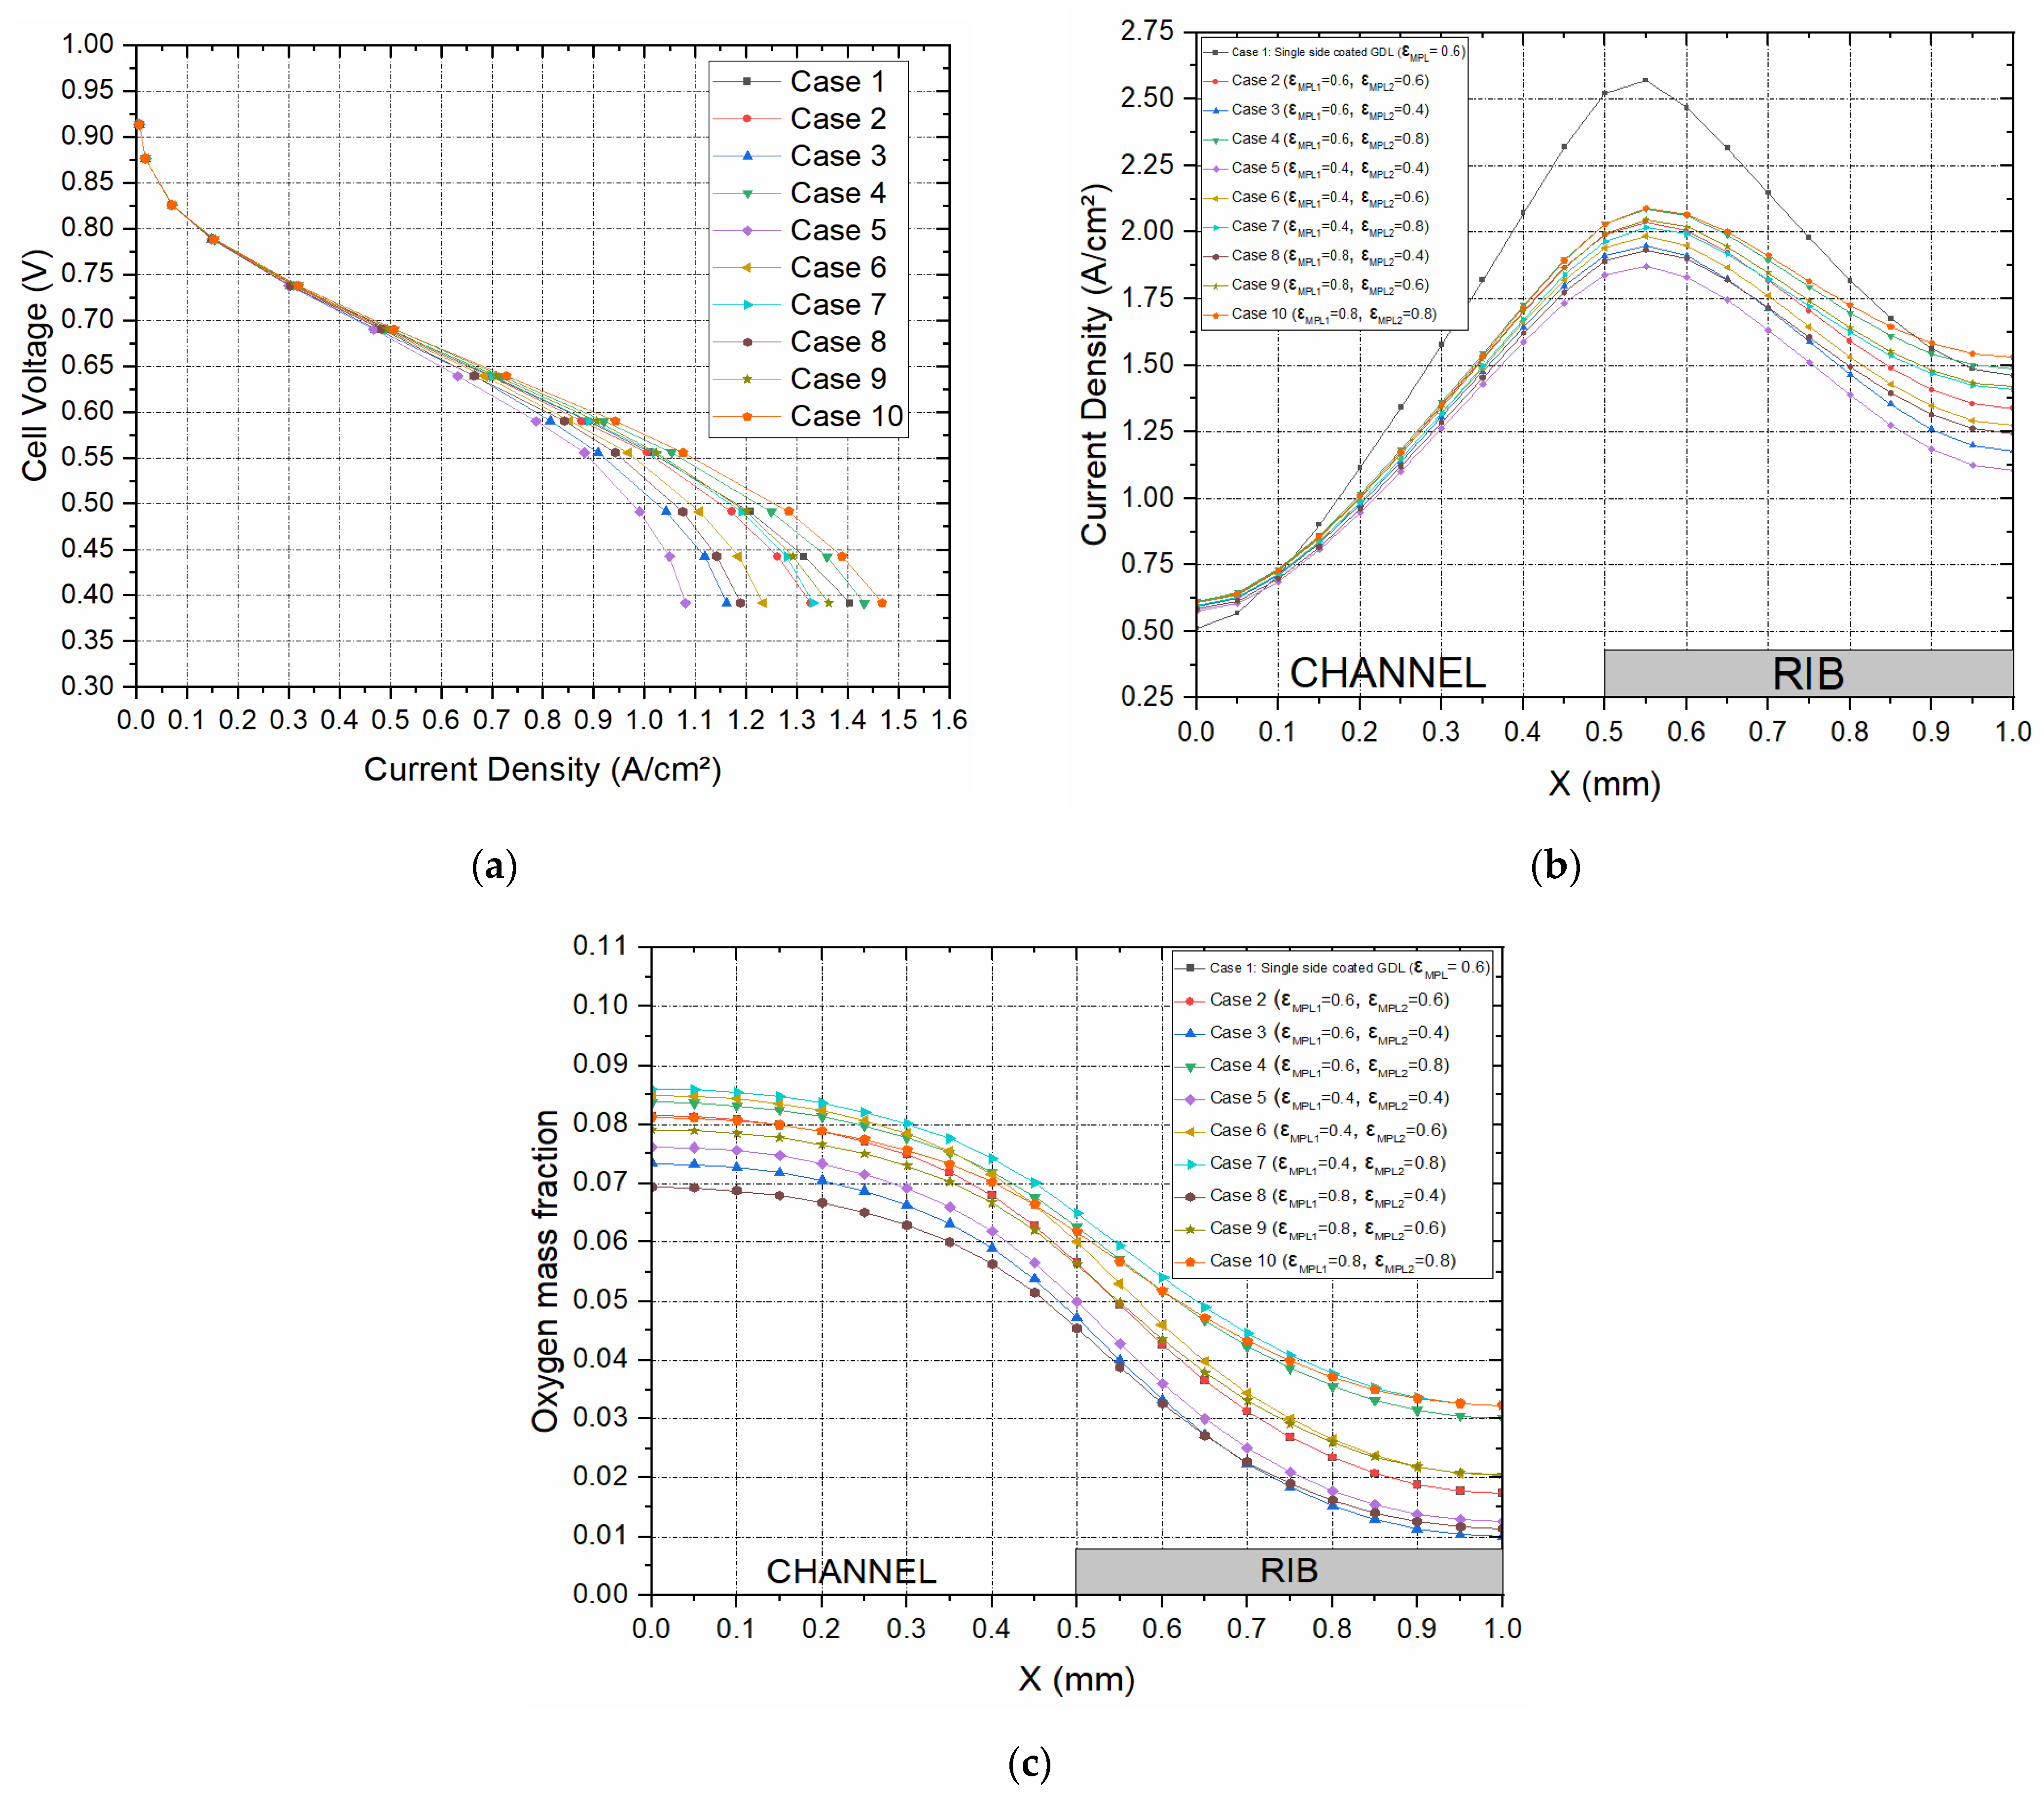
3.3. Impact of MPL Porosity

A parametric design investigation is carried out in this section to investigate the effect of the porosities of the MPLs on both sides of the GDL substrate, and the model is simulated with various MPL porosities, as shown in Table 2. Note that ε M P L 1 is the porosity of the MPL between the GDL and the catalyst layer, and ε M P L 2 is the porosity of the MPL between the GDL and the bipolar plate for both the anode and cathode sides of the modelled PEFC. Additionally, it should be noted that the porosity of the carbon substrate for all the cases is 0.7. The results of the study are shown in Figure 7. There are a number of observations that may be extracted from Figure 7a. The first observation is that the fuel cell performance, in general, improves as the porosities of the MPLs increase, and this is evidently due to the reduced mass transport resistance; the best performance is realised for the MPLs with 0.8 porosities. The second observation is that the increase in the porosity of the MPL facing the bipolar plate has a more positive impact on the fuel cell performance compared to that of the MPL facing the catalyst layer. For example, the current density at 0.4 V for the set where ε M P L 1 is 0.6 and ε M P L 2 is 0.8 is greater than the set where ε M P L 1 is 0.8 and ε M P L 2 is 0.6 by around 8.2% (0.11 A/cm2). This could be attributed to the fact that the MPL facing the bipolar plate is in direct contact with the flow channel, and hence the GDL is supplied with a larger amount of reactant gases as the porosity of this MPL increases. The third observation is that the fuel cell performs better with the base case (Case 1) where the GDL is single-sided MPL coated than with Case 2 where the GDL is double-sided MPL coated with the same porosity as the MPL of Case 1. This is evidently due to the longer diffusion path in the latter case. The distribution of the local current within the cathode GDL (Figure 7b) follows more or less the same trend as the polarisation curves. Interestingly, the distribution of oxygen within the cathode GDL (Figure 7c) does not follow the same trends displayed in Figure 7a,b. This can be attributed to the combined effects of the mass transport resistance and reaction rate at the catalyst layer. For example, Case 8 (where the porosities of the two MPLs are both 0.8) does not show the lowest oxygen concentration within the cathode GDL as is the case in the previous sections where the case with the best fuel cell performance shows the lowest oxygen concentration in the GDL. This is mainly due to the fact that the supply rate of oxygen outweighs its consumption rate. Further, it can be seen that the porosity of the MPL facing the bipolar plate is predominantly the limiting factor when it comes to the concentration of the reactant gases within the GDLs. For example, Case 8 (where the porosity of the MPL facing the bipolar plate is 0.4) features the lowest oxygen concentration within the cathode GDL. On the other hand, Case 7 (where the porosity of the MPL facing the bipolar plate is 0.8) demonstrates the maximum oxygen concentration within the cathode GDL.

4. Conclusions

A three-dimensional, multiphase PEFC model with straight channels was developed. The impact of the interfacial contact resistances between the GDL and both the bipolar plate and the catalyst layer, as well as the MPL porosity, was investigated through conducting a series of parametric studies. The key findings of the study are as follows:
  • The interfacial contact resistance between the MPL and the catalyst layer needs to be captured in the modelled PEFC. Otherwise, the fuel cell performance could be overestimated by up to 6%;
  • Incorporating an extra MPL at the interface between the GDL and the bipolar plate could significantly improve the fuel cell performance by up to 30%, and this is due to the reduction in the contact resistance between the GDL and the bipolar plate;
  • The fuel cell performance is more sensitive to the porosity of the MPL facing the bipolar plate than the MPL facing the catalyst layer. This is attributable to the fact that the MPL facing the bipolar plate is in direct contact with the flow channel, and hence the GDL is supplied with a larger amount of reactant gases as the porosity of this MPL increases;
  • Likewise, the porosity of the MPL facing the bipolar plate is predominantly the limiting factor for the distribution of oxygen concentration within the cathode GDL.
The current study improves the understanding of the impact of the interfacial contact resistance between the GDL and the bipolar plates on the performance of the PEFC. It shows the need for realistic values of the interfacial contact resistance to be incorporated into the fuel cell model and their importance. In addition, the study provides useful insights relating to improving the efficiency of fuel cells by having a double-sided MPL-coated GDL.

Supplementary Materials

The following supporting information can be downloaded at: https://www.mdpi.com/article/10.3390/en16114363/s1. The Supplementary Materials documents contains information of the source terms, and their descriptions, for the equations that govern the transport of physical quantities in the PEFC model. References [31,32,33,34,35] are cited in the supplementary materials.

Author Contributions

I.C.O.: methodology, software, formal analysis, investigation, validation, writing—original draft, writing—review and editing, visualisation. M.S.I.: conceptualisation, methodology, software, formal analysis, investigation, validation, writing—original draft, writing—review and editing, supervision. D.B.I.: supervision, writing—review and editing. K.H.: supervision, writing—review and editing. L.M.: supervision, writing—review and editing. M.P.: supervision, writing—review and editing, project administration. All authors have read and agreed to the published version of the manuscript.

Funding

This research received no external funding.

Data Availability Statement

The data are available upon reasonable request.

Acknowledgments

The first author would like to acknowledge and appreciate the financial support from the Government of Nigeria through the Tertiary Education Trust Fund (TETFund) and Akwa Ibom State University.

Conflicts of Interest

The authors declare no conflict of interest.

References

  1. Zhou, P.; Wu, C.W.; Ma, G.J. Contact resistance prediction and structure optimization of bipolar plates. J. Power Sources 2006, 159, 1115–1122. [Google Scholar] [CrossRef]
  2. Zhou, Y.; Lin, G.; Shih, A.J.; Hu, S.J. A micro-scale model for predicting contact resistance between bipolar plate and gas diffusion layer in PEM fuel cells. J. Power Sources 2007, 163, 777–783. [Google Scholar] [CrossRef]
  3. Qiu, D.; Janßen, H.; Peng, L.; Irmscher, P.; Lai, X.; Lehnert, W. Electrical resistance and microstructure of typical gas diffusion layers for proton exchange membrane fuel cell under compression. Appl. Energy 2018, 231, 127–137. [Google Scholar] [CrossRef]
  4. Lai, X.; Liu, D.; Peng, L.; Ni, J. A mechanical–electrical finite element method model for predicting contact resistance between bipolar plate and gas diffusion layer in PEM fuel cell. J. Power Sources 2008, 182, 153–159. [Google Scholar] [CrossRef]
  5. Zhang, L.; Liu, Y.; Song, H.; Wang, S.; Zhou, Y.; Hu, S.J. Estimation of contact resistance in proton exchange membrane fuel cells. J. Power Sources 2006, 162, 1165–1171. [Google Scholar] [CrossRef]
  6. Vikram, A.; Chowdhury, P.R.; Phillips, R.K.; Hoorfar, M. Measurement of effective bulk and contact resistance of gas diffusion layer under inhomogeneous compression—Part I: Electrical conductivity. J. Power Sources 2016, 320, 274–285. [Google Scholar] [CrossRef]
  7. Sow, P.K.; Prass, S.; Kalisvaart, P.; Merida, W. Deconvolution of electrical contact and bulk resistance of gas diffusion layers for fuel cell applications. Int. J. Hydrogen Energy 2015, 40, 2850–2861. [Google Scholar] [CrossRef]
  8. Ismail, M.S.; Ingham, D.B.; Ma, L.; Pourkashanian, M. The contact resistance between gas diffusion layers and bipolar plates as they are assembled in proton exchange membrane fuel cells. Renew. Energy 2013, 52, 40–45. [Google Scholar] [CrossRef]
  9. Ye, D.; Gauthier, E.; Benziger, J.B.; Pan, M. Bulk and contact resistances of gas diffusion layers in proton exchange membrane fuel cells. J. Power Sources 2014, 256, 449–456. [Google Scholar] [CrossRef]
  10. Atyabi, S.A.; Afshari, E.; Wongwises, S.; Yan, W.-M.; Hadjadj, A.; Shadloo, M.S. Effects of assembly pressure on PEM fuel cell performance by taking into accounts electrical and thermal contact resistances. Energy 2019, 179, 490–501. [Google Scholar] [CrossRef]
  11. Bouziane, K.; Khetabi, E.; Lachat, R.; Zamel, N.; Meyer, Y.; Candusso, N. Impact of cyclic mechanical compression on the electrical contact resistance between the gas diffusion layer and the bipolar plate of a polymer electrolyte membrane fuel cell. Renew. Energy 2020, 153, 349–361. [Google Scholar] [CrossRef]
  12. Chen, S.; Feng, S.; Lu, W.; Chen, Q. Numerical study on the impact of interface contact resistance on the performance of a PEMFC with serpentine flow field. IOP Conf. Ser. Earth Environ. Sci. 2021, 675, 012200. [Google Scholar] [CrossRef]
  13. Lee, F.C.; Ismail, M.S.; Ingham, D.B.; Hughes, K.J.; Ma, L.; Lyth, S.M.; Pourkashanian, M. Alternative architectures and materials for PEMFC gas diffusion layers: A review and outlook. Renew. Sustain. Energy Rev. 2022, 166, 112640. [Google Scholar] [CrossRef]
  14. Zamel, N.; Xianguo, L. Effective transport properties for polymer electrolyte membrane fuel cell-With focus on the gas diffusion layer. Prog. Energy Combust. Sci. 2013, 39, 111–146. [Google Scholar] [CrossRef]
  15. El-Kharouf, A.; Pollet, B.G. Gas Diffusion Media and Their Degradation. In Polymer Electrolyte Fuel Cell Degradation; Academic Press: Boston, MA, USA, 2012; Chapter 4; pp. 215–247. [Google Scholar]
  16. Ozden, A.; Shahgaldi, S.; Li, X.; Hamdullahpur, F. A review of gas diffusion layers for proton exchange membrane fuel cells—With a focus on characteristics, characterization techniques, materials and designs. Prog. Energy Combust. Sci. 2019, 74, 50–102. [Google Scholar] [CrossRef]
  17. Kitahara, T.; Konomi, T.; Nakajima, H. Microporous layer coated gas diffusion layers for enhanced performance of polymer electrolyte fuel cells. J. Power Sources 2010, 195, 2202–2211. [Google Scholar] [CrossRef]
  18. Kitaharaa, T.; Nakajimaa, H.; Moria, K.; Inamoto, M. Influence of Hydrophilic and Hydrophobic Double MPL Coated GDL on PEFC Performance. ECS Trans. 2012, 50, 437–444. [Google Scholar] [CrossRef]
  19. Chun, J.H.; Park, K.T.; Jo, D.H.; Lee, J.Y.; Kim, S.G.; Park, S.H.; Lee, E.S.; Jyoung, J.-Y.; Kim, S.H. Development of a novel hydrophobic/hydrophilic double micro porous layer for use in a cathode gas diffusion layer in PEMFC. Int. J. Hydrogen Energy 2011, 36, 8422–8428. [Google Scholar] [CrossRef]
  20. Park, S.; Popov, B.N. Effect of cathode GDL characteristics on mass transport in PEM fuel cells. Fuel 2009, 88, 2068–2073. [Google Scholar] [CrossRef]
  21. Qi, Z.; Kaufman, A. Improvement of water management by a microporous sublayer for PEM fuel cells. J. Power Sources 2002, 109, 38–46. [Google Scholar] [CrossRef]
  22. Nam, J.H.; Lee, K.-J.; Hwang, G.-S.; Kim, C.-J.; Kaviany, M. Microporous layer for water morphology control in PEMFC. Int. J. Heat Mass Transf. 2009, 52, 2779–2791. [Google Scholar] [CrossRef]
  23. Wang, X.; Zhang, H.; Zhang, J.; Xu, H.; Zhu, X.; Chen, J.; Yi, B. A bi-functional micro-porous layer with composite carbon black for PEM fuel cells. J. Power Sources 2006, 162, 474–479. [Google Scholar] [CrossRef]
  24. Wang, X.L.; Zhang, H.M.; Zhang, J.L.; Xu, H.F.; Tian, Z.Q.; Chen, J.; Zhong, H.X.; Liang, Y.M.; Yi, B.L. Micro-porous layer with composite carbon black for PEM fuel cells. Electrochim. Acta 2006, 51, 4909–4915. [Google Scholar] [CrossRef]
  25. Li, S.; Yuan, J.; Andersson, M.; Xie, G.; Sunden, B. Influence of anisotropic gas diffusion layers on transport phenomena in a proton exchange membrane fuel cell. Int. J. Energy Res 2017, 41, 2034–2050. [Google Scholar] [CrossRef]
  26. Okereke, I.C.; Ismail, M.S.; Ingham, D.; Hughes, K.J.; Ma, L.; Pourkashanian, M. The effects of GDL anisotropic transport properties on the PEFC performance. Int. J. Numer. Methods Heat Fluid Flow 2023, 33, 648–672. [Google Scholar] [CrossRef]
  27. Bruggeman, D.A.G. Calculation of various physics constants in heterogeneous substances I dielectricity constants and conductivity of mixed bodies from isotropic substances. Ann. Phys. 1935, 24, 636–664. [Google Scholar] [CrossRef]
  28. Ismail, M.S.; Hughes, K.J.; Ingham, D.B.; Ma, L.; Pourkashanian, M. Effects of anisotropic permeability and electrical conductivity of gas diffusion layers on the performance of proton exchange membrane fuel cells. Appl. Energy 2012, 95, 50–63. [Google Scholar] [CrossRef]
  29. Wang, L.; Husar, A.; Zhou, T.; Liu, H. A parametric study of PEM fuel cell performances. Int. J. Hydrogen Energy 2003, 28, 1263–1272. [Google Scholar] [CrossRef]
  30. Ismail, M.S.; Ingham, D.B.; Hughes, K.J.; Ma, L.; Pourkashanian, M. Effective diffusivity of polymer electrolyte fuel cell gas diffusion layers: An overview and numerical study. Int. J. Hydrogen Energy 2015, 40, 10994–11010. [Google Scholar] [CrossRef]
  31. Alhazmi, N.; Ismail, M.S.; Ingham, D.B.; Hughes, K.J.; Ma, L.; Pourkashanian, M. The in-plane thermal conductivity and the contact resistance of the components of the membrane electrode assembly in proton exchange membrane fuel cells. J. Power Sources 2013, 241, 136–145. [Google Scholar] [CrossRef]
  32. Zawodzinski, T.A.; Springer, T.E.; Uribe, F.; Gottesfeld, S. Characterisation of polymer electrolytes for fuel cell applications. Solid State Ionics 1993, 60, 199–211. [Google Scholar] [CrossRef]
  33. Gostick, J.T.; Fowler, M.W.; Pritzker, M.D.; Ioannidis, M.A.; Behra, L.M. In-plane and through-plane gas permeability of carbon fibre electrode backing layers. J. Power Sources 2006, 162, 228–238. [Google Scholar] [CrossRef]
  34. Pharaoh, J.G.; Karan, K.; Sun, W. On effective transport coefficients in PEM fuel cell electrodes: Anisotropy of the porous transport layers. J. Power Sources 2006, 161, 214–224. [Google Scholar] [CrossRef]
  35. Springer, T.E.; Zawodzinski, T.A.; Gottesfeld, S. Polymer electrolyte fuel-cell model. J. Electrochem. Soc. 1991, 138, 2334–2342. [Google Scholar] [CrossRef]
Figure 1. Schematic geometry of the computational domain for the base case of the PEFC model.
Energies 16 04363 g001
Figure 2. The meshed geometry for the computational domain [26]. Note that (i) the anode catalyst layer has been zoomed in on to show the mesh across the catalyst layer, and (ii) the number of elements in the z-direction is 350.
Energies 16 04363 g002
Figure 3. The polarisation curve generated from the numerical model as compared to the experimental polarisation curve taken from Wang et al. [29].
Energies 16 04363 g003
Figure 4. (a) The polarisation curves and the distribution of (b) current density and (c) the oxygen mass fraction within the cathode GDL at 0.55 V for the set of contact resistances investigated.
Energies 16 04363 g004aEnergies 16 04363 g004b
Figure 5. Schematic geometry of the computational domain incorporating the MPL at the GDL–bipolar plate interface.
Energies 16 04363 g005
Figure 6. Cell performance for a given GDL–BPP contact resistance of 10.0 mΩ·cm2 and contact resistance values 2.5 mΩ·cm2, 5.0 mΩ·cm2, and 7.5 mΩ·cm2 at the MPL–CL interface; (a) the polarisation curves and the distribution of (b) the current density and (c) the oxygen mass fraction within the cathode GDL at 0.55 V.
Energies 16 04363 g006
Figure 7. (a) Polarisation curves and the distribution of (b) current density and (c) the oxygen mass fraction within the cathode GDL at 0.55 V for the porosities of the single-sided and double-sided MPL-coated GDL computation cases shown in Table 2.
Energies 16 04363 g007
Table 1. Geometrical and physical properties for the base case of the PEFC model [25,27,28,29].
PropertyValue
Channel length5 × 10−2 m
Channel height1.0 × 10−3 m
Channel width1.0 × 10−3 m
Current collector rib width1.0 × 10−3 m
Current collector height1.5 × 10−3 m
GDL thickness2.0 × 10−4 m
MPL thickness5.0 × 10−5 m
Catalyst layer thickness1.0 × 10−5 m
Membrane thickness5.0 × 10−5 m
Operating temperature353 K
Gauge pressure at anode1 atm
Gauge pressure at cathode1 atm
Relative humidity of inlet gases100%
Stoichiometric ratio, anode1.5
Stoichiometric ratio, cathode2
Oxygen/nitrogen molar ratio in air0.21/0.79
Catalyst layer porosity0.2
GDL porosity0.7
MPL porosity0.6
Reference hydrogen concentration, c H 2 r e f 56.4 mol/m3
Reference oxygen concentration, c O 2 r e f 3.39 mol/m3
Electrical conductivity of current collector20,000 S/m
Electrical conductivity of GDL5000 S/m
Electrical conductivity of catalyst layer2000 S/m
Electrical conductivity of MPL5000 S/m
GDL permeability3.0 × 10−12 m2
MPL permeability1.0 × 10−1 m2
Catalyst layer permeability2 × 10−13 m2
Membrane permeability1.8 × 10−18 m2
Thermal conductivity of GDLs 1.7 / 21   W / ( m · K )
Thermal conductivity of MPL 10   W / ( m · K )
Thermal conductivity of catalyst layers 0.3   W / ( m · K )
Thermal conductivity of current collector 100   W / ( m · K )
Thermal conductivity of the membrane 0.25   W / ( m · K )
GDL/MPL/CL contact angle110/130/95
Faraday’s constant96,485 C/mol
Universal gas constant8.314 J/ ( mol · K )
Anode inlet mass fraction of hydrogen0.1105
Anode inlet mass fraction of water0.8895
Cathode inlet mass fraction of oxygen0.1503
Cathode inlet mass fraction of water0.3541
Anode flow rate1.3518 × 10−7 kg/s
Cathode flow rate1.10331 × 10−6 kg/s
Anode concentration exponents0.5
Cathode concentration exponents1
Anode   reference   exchange   current   density ,   i 0 , a r e f 100 A/m²
Cathode reference exchange current density, i 0 , c r e f 0.0001760881 A/m²
Transfer coefficients for anode reaction0.5
Transfer coefficients for cathode reaction1
Anode specific surface area, a a 1.0 × 10⁷ m−1
Cathode specific surface area, a c 1.0 × 10⁷ m−1
Table 2. Cases investigated for the MPL porosities.
Case No. ε M P L 1 ε M P L 2
1 (Single MPL)0.6NA
20.60.6
30.60.4
40.60.8
50.40.4
60.40.6
70.40.8
80.80.4
90.80.6
100.80.8
Disclaimer/Publisher’s Note: The statements, opinions and data contained in all publications are solely those of the individual author(s) and contributor(s) and not of MDPI and/or the editor(s). MDPI and/or the editor(s) disclaim responsibility for any injury to people or property resulting from any ideas, methods, instructions or products referred to in the content.

