Article

Cost Assessment of Centralizing Swine Manure and Corn Stover Co-Digestion Systems

1
Department of Agricultural and Biological Systems Engineering, Iowa State University, Ames, IA 50011, USA
2
Department of Economics, Iowa State University, Ames, IA 50011, USA
*
Author to whom correspondence should be addressed.
Energies 2023, 16(11), 4315; https://doi.org/10.3390/en16114315
Submission received: 27 April 2023 / Revised: 22 May 2023 / Accepted: 23 May 2023 / Published: 25 May 2023

Abstract

:
Livestock in the state of Iowa, United States (US) produce over 50 × 106 Mg of wet-basis manure yearly. Biogas production from manure’s anaerobic digestion (AD) can reduce greenhouse gas emissions, control odors, and provide renewable energy. Despite these benefits, AD is rarely deployed at swine farms in Iowa. In this work, we explore the economics of AD systems in Iowa to evaluate reasons for low deployment and explore the production cost impacts of biogas cleaning and injection into the natural gas grid, amending manure with biomass, and centralizing digesters across multiple farms. This work presents a static, spreadsheet-based technoeconomic model that embodies literature-based estimates of key system technical parameters, costs, and transportation fuel incentives and permits the examination of various scenarios. Key findings include that under the model assumptions, distributed, farm-scale digesters are not competitive with average natural gas prices in Iowa. A centralized production scenario can be competitive, provided that programs such as the low-carbon fuel standard (LCFS) and the renewable fuel standard (RFS) have sufficiently high credit values.

1. Introduction

Anaerobic digestion (AD) is a process by which microbes break down organic materials in an oxygen-free environment, resulting in two output streams: a stabilized digestate typically suitable for land application and an energy-rich gas referred to as biogas. Anaerobic digestion feedstocks include industrial and municipal wastewater, manure, crop residues, and food waste [1]. Biogas is composed mainly of greenhouse gases, namely methane and carbon dioxide. The AD process captures the methane and displaces fossil fuels when it is utilized as an energy source [1]. In addition to providing a renewable energy source that is independent of short-term weather fluctuations (i.e., wind, sunlight), AD of animal manure offers other benefits, including reductions in odor from, and pathogen populations in, the manure slurry, as well as reduced overall methane emissions [1,2]. Digester effluent (i.e., digestate) can be applied to cropland to improve soil health and provide critical macronutrients [3].
In 2020, manure-based anaerobic digesters in the United States (US) were estimated to have reduced greenhouse gas emissions by 5 × 10⁶ Mg CO2eq and generated the energy equivalent of 15 × 106 GJ [4]. In 2021, there were 273 operational manure-based anaerobic digesters in the US, with the majority (81%) processing dairy manure and 16% processing swine manure [4]. According to AgSTAR [5], swine-manure-based digestion systems can be profitable at farm sizes greater than 2000 head. Iowa has more swine farms (~2200 farms) that fit this category than any other US state [5]. The opportunity to achieve economies of scale on Iowa swine farms has improved, as most of Iowa’s hogs (69%) are now produced on farms greater than 5000 head and the common farm size in the state is between 2000–4999 head [6]. Economies of scale appear to be necessary for current AD technologies.
Multiple investigators have attempted to understand the costs of farm-based energy from swine AD with a wide range of results. Bhatt and Tao [7] modeled costs for swine manure digestion ranging from flows of 1–227 Mg wet manure per day, finding estimated energy costs of USD 20–USD 130 per GJ, significantly higher than the cost of natural gas in the US, which averaged USD 3.54 per GJ from 2016–2020 (Citygate: [8,9]). A prior study by Beddoes et al. [10] reported swine manure AD followed by electricity generation to provide electricity at USD 20–USD 30 per GJ, which is far more expensive than current renewable electricity options, such as photovoltaic or wind [10,11]. When considering only the biogas production portion of these systems, Beddoes et al. [10] found that the cost of energy production ranged from USD 3–USD 6 GJ−1, with the lowest value (USD 3 GJ−1) achieved by a single covered lagoon digester. Faulhaber et al. [12] explored the impact of digester size on AD energy costs and defined a dimensionless methane cost ratio by dividing the biogas energy cost (USD GJ−1) by the retail price of natural gas (USD GJ−1) [12]. They showed that under baseline assumptions, even large (1000-head dairy) systems had methane cost ratios greater than unity (meaning they were more expensive than natural gas), but that carbon credits and low-interest loans could make these systems more economically competitive.
In addition to these results, the failure rate of US farm-based digesters is relatively high, e.g., in 1998, this rate was approximately 50% [13]. According to more recent AgSTAR data, failure rates have decreased to approximately 23% [14]. Unfavorable economic factors and system operations, which require management, time, and skill combined to make AD economically challenging. Still, centralized digesters handling the manure of multiple farms may allow a dedicated operations staff to manage day-to-day maintenance tasks, reducing the management burden on farmers and potentially reducing digester abandonment [15].
The majority of anaerobic digester projects since 2000 have been combined heat and power systems, but in recent years, projects focused on producing renewable natural gas (RNG) for use in vehicles have become popular [4]. The number of RNG projects that upgrade biogas for pipeline injection in the US increased by 85% from 2019–2020 [16]. These RNG projects have greater capital costs due to the need for equipment to upgrade the biogas for pipeline injection. However, when marketed as a transportation fuel, RNG production allows methane to qualify for renewable identification numbers (RINs) and the low-carbon fuel standard (LCFS) creating an additional revenue source for the biogas producer.
The economic viability of AD is challenging. ADs are bioreactors with relatively low volumetric productivities, i.e., <0.1 g biogas L−1 h−1 [17,18] compared to 2 g ethanol L−1 h−1 or greater for ethanol fuel production fermenters [19]. So, although AD reactors are rather simple and low cost to make, the low volumetric productivities remain challenging. One approach to overcoming this economic challenge is to increase the volumetric productivity of the digester by increasing its feed rate, specifically by adding other carbonaceous feedstocks—typically agricultural or food residues—to the influent [20,21]. This approach is termed co-digestion and is one of three approaches used to make AD more cost effective. Other approaches include decreasing the unit cost of digestion by building one digester for multiple farms and cleaning and injecting the resulting methane into a pipeline to realize carbon credits available in certain markets.
In this work, a static spreadsheet-based technoeconomic model is built to explore the costs of AD for large-scale swine farms typical of Iowa, aiming to clarify the challenges and opportunities for greater AD deployment. We expand beyond previously published models by considering scenarios with RIN and LCFS credits to reflect the current carbon credit climate and including the costs of upgrading biogas to RNG to qualify for those credits. To explore the possibilities of leveraging economies of scale, we model both one-digester-per-farm systems and joint (among five farms) systems. Additionally, we examine the impact of co-digesting corn stover with swine manure to increase the energy production of the digester because corn stover is a highly available crop residue in the US Midwestern region [22]. Finally, we consider the impact of distance to an injection point on the system’s economic viability.

2. Materials and Methods

2.1. Scenario Description

The cost of producing biogas was calculated for four different scenarios (represented as S1 through S4), reflecting typical Midwest agriculture in 2020. In each scenario, costs were calculated based on farm sizes of 4800 pigs, representative of a common farm with two 2400-head barns [23,24]. S1 consists of a single digester, receiving deep-pit effluent. Corn stover is added until 12% solids is reached, but no water is added. Wet digestion processes operate between 5–20% total solids (TS) [25]. The biogas is cleaned and injected into the natural gas grid on site. In the second scenario (S2), a volume of water equivalent to manure volume is assumed to be added to the digester to permit higher corn stover additions within the 12% solids limit. This leads to higher biogas production but requires a larger digester volume. This is a critically important aspect of this model. S2 and subsequent scenarios allow additional carbon feedstock into the digester and require a larger digester volume. In S3, the benefits of centralized biogas cleaning are explored by assuming that five decentralized digesters share the cost of a single centralized biogas cleaning (also referred to as upgrading) and injection point, as investigated previously by Hengeveld et al. [26]. The assumption is that farms are 4 km from the centralized point, which is realistic for the concentrated production areas of the region being modeled [27,28]. In S3, biogas must be transported, but each farm uses its own manure, stover, and water. Finally, in S4, we examine the impact of leveraging economies of scale by centralizing digestion, cleaning, and injection among five farms. We account for the cost of these five farms hauling their manure to the central digester where the biogas is produced, cleaned, and injected. A summary of the differences between the scenarios is shown in Table 1. To help readers keep track of the scenarios, we use the following shorthand descriptions: S1: single digester, stover amended; S2–S1: w/water and stover amended; S3–S2: w/centralized upgrading; and S4: centralized digester/upgrading, water and stover amended.

2.2. Digester Input

In each scenario, it is assumed that all the manure produced is used in biogas production. The base manure production assumption is 4.5 L−1 day−1 head−1 [29]. The digesters are assumed to operate 24 h per day for 340 days each year. The assumed methane production for swine slurry is 350 mL g−1 volatile solids (VS) [21,30,31]. We assume a TS content for the manure of 8%, a VS content of 6%, and a density identical to water (1000 kg m−3) [32]. The cost of manure was calculated based on its nitrogen content, 6 kg m−3 (0.05 lb gal−1) [29], and assuming 95% of the nitrogen to be plant-available nitrogen [33]. We assumed that nitrogen has a value of USD 1.06 kg−1 [34]. This cost is applied to all scenarios because we assume that a separate entity from the farm runs the digesters. Manure transportation costs were calculated according to Equation (1), where d is the two-way transportation distance in km and CMT is the cost of manure transportation in 2019 USD Mg−1. In S4, this calculation amounted to USD 8.40 Mg−1 (2019 USD), assuming a 4 km transportation distance for each farm [35]. On-farm manure transportation costs are not considered because those operations occur even in non-AD cases. The only manure transportation costs considered in this work are those required for off-farm transport, as in S4.
C M T   $   Mg 1 = $ 0.27 d + $ 2.88
According to Moody et al. [36], the methane production of untreated corn stover is assumed to be 180 mL g−1 VS, and the TS content and VS content of wet corn stover are assumed to be 90.3% and 84.1%, respectively. The lignin content of corn stover inhibits its biodegradability and, therefore, its methane production [21]. Pre-treatment of corn stover can enhance methane production, but this analysis focuses on untreated corn stover. The assumed methane production is lower than could be achieved if the corn stover was pre-treated because untreated corn stover has low biodegradability [37,38]. Corn stover costs vary in estimates and models from USD 20–100 Mg−1 [39,40,41,42,43,44,45]. In this study, a value of USD 51 Mg−1 was selected (USD 35 bale−1 [45]). Given the large variability and the importance of this assumption, the sensitivity of the S1 and S4 configurations to the price of corn stover is explored. The price is assumed to include the transportation of the corn stover to the digesters. The digesters are assumed to achieve 75% of the methane production assumptions from both inputs. In each scenario, the mass of corn stover added to the digesters is calculated to meet a 12% solids content after the addition of manure and water. Corn stover accounts for 37% of the input solids in S1 and 70% of the input solids in S2–S4.
There are two critical land areas in this system: the land required to receive the nutrients in the digestate safely and the land required to provide stover as an energy amendment to the digester. We compare these two land requirements as follows. We assume corn stover is produced at a rate of approximately 11 Mg ha−1 (dry matter; 5 US ton ac−1 [46]). Stover harvest recommendations range from 30–50% based on tillage practices at the farm [47]. Because we assume digestate will be land applied, we assume an aggressive harvesting rate of 60% or 6.7 Mg ha−1. This results in a land requirement for biomass demand, ranging from 56 ha yr−1 (140 ac yr−1) in S1 to 1100 ha yr−1 (2760 ac yr−1) in S4. We again assume the manure’s nitrogen content to be 0.006 Mg m−3 and assume the corn stover’s nitrogen content to be 6 kg N per Mg corn stover [48]. We assume digestate is applied at a rate of 168 kg N ha−1 (150 lb ac−1). This results in a land application requirement of 275 ha in S1, 315 ha in S2–S3, and 1580 ha in S4. Therefore, the land needed for biomass harvest is 71% of the digestate application land requirement at its maximum demand. Table 2 shows the details of this calculation. Harvesting corn stover at a 50% rate (5.6 Mg ha−1) would result in corn stover harvest on 85% of the land needed for digestate application in S2–S4. At a 30% harvest rate, the harvest and application land areas would not be in balance (corn harvest on 142% of digestate application land). Although corn stover cost is treated as a constant in this analysis, harvesting at a lower rate and a larger land area would likely increase costs associated with using corn stover as an AD feedstock.

2.3. Biogas Production

Total possible methane production for the digester in each scenario was computed based on digester inputs and conversion rates as described above. After applying the 75% digester efficiency assumption, the methane production of the digester in S1 was 209 m3 kg VS−1 and 168 m3 kg VS−1 in the other three scenarios, in line with values reported in manure and biomass co-digestion studies [20,21,49,50]. Methane was converted to biogas by assuming the biogas is 60% methane by volume. The volume fraction of methane in biogas in this type of system varies, but reported values reported range from 50 to 70% [39,51,52,53]. The annual biogas production ranged from approximately 0.23 to 2.4 × 10⁶ m3, depending on scenario. The annual energy production in each scenario was calculated by assuming the energy density of methane is 37.6 MJ m−3 (1010 BTU ft−3; [54]) and by applying a biogas cleaning efficiency of 97%, meaning 97% of methane is available after the biogas upgrading process [55].

2.4. Digestate Production

Solid and liquid digestate production was calculated as the remaining mass after biogas was produced. By assuming the biogas produced is 60% methane, 6% water vapor, and 34% carbon dioxide by volume, the total mass of biogas was calculated. The mass of solid digestate was calculated by subtracting the mass of methane and carbon dioxide from the input solids. The mass of liquid digestate was calculated by subtracting the mass of biogas and solid digestate from the total digester input.
We assumed a recycle rate of 50% [56,57] (50% of the liquid at the solid separator is returned to the digester, 50% of the effluent sent to liquid storage). After the digester reaches the steady state, both the solid and liquid portions of the digestate can be land-applied and have value as a fertilizer. The value of this fertilizer was calculated based on the manure and corn stover’s nitrogen contents, assuming N is conserved in digestion. Again, we assumed nitrogen has a value of USD 1 kg−1, and the plant-available nitrogen contents of the digester inputs were 95% for the swine manure [33] and 50% for the corn stover.

2.5. Capital Costs

Digester volume for our scenarios was calculated according to Equation (2), where HRT is the hydraulic retention time in days; S is herd size; M is daily manure production in m3 d−1 head−1; CSvol is the volume of corn stover added to the digester; and Wvol is the volume of water added to the digester.
V = H R T S × M + C S v o l + W v o l
Capital costs for plug flow digesters were presented by Faulhaber et al. [12] in terms of dairy farm herd size as shown in Equation (3), where CD is the capital cost of the digester and S is the herd size in terms of the number of cows. Equation (4) was used to relate Faulhaber et al.’s [12] herd size to the digester volume. In Equation (4), V is the digester volume in m3, HRT is the hydraulic retention time in days, and M is the daily manure production in m3 d−1 head−1. Equation (4) enables the conversion from herd size to digester volume for the use of the Faulhaber et al.’s [12] equation in our work. According to the ASABE Manure Production and Characteristics Standard [32], dairy cows produce manure at a rate of 0.068 m3 d−1 head−1. Assuming a hydraulic retention time of 30 days, combining Equations (3) and (4), and converting from 2012 USD to 2019 USD, we can calculate the capital cost of the digesters according to Equation (5). In the final cost calculation, the manure production value for swine mentioned previously (4.5 L−1 day−1 head−1) was used to calculate digester volume according to Equation (2).
C D $ = $ 13 , 575 × S 0.59
S = V M × H R T
C D $ = $ 9900 × V 0.59
The capital cost of biogas upgrading and RNG injection equipment was adapted from the report by Williams et al. [58]. Annual upgrading, injection, piping, and compression capital costs were adjusted from 2015 USD to 2019 USD, and the California multiplier was excluded. These capital costs were divided by the methane flows given in the report for a unit capital cost in USD GJ−1. The unit capital costs were plotted against the methane flows as shown in Figure 1. The unit capital cost for these components in S1–S4 was calculated using the power trend line from Figure 1 and the methane flows in each scenario. This resulted in unit capital costs of upgrading and injection equipment ranging from USD 9.54 GJ−1 in S3 and S4 to USD 26.80 in S1.
Pipeline costs were calculated in S1–S3. In S1 and S2, the digesters are assumed to be located 500 m from the natural gas grid injection point [55]. In these cases, we assume a relatively short distance from the digester to the injection point because we assume a farm would not undertake a new RNG project when located very far from an injection point. In S3, biogas is transported 4 km (2.5 miles) from the digester to the centralized cleaning and injection point. Hengeveld et al. [26] presented installed pipeline capital costs in the Netherlands ranging from USD 50,000 km−1 (USD 80,000 mile−1) to USD 373,000 km−1 (USD 600,000 mile−1), depending on the ease of installation and pipeline diameter (converted from 2014 EUR to 2019 USD) [26]. The EPA Landfill Gas Energy Cost Model [59] estimates that pipeline costs for RNG projects are USD 600,000 total for pipelines less than 1.6 km (1 mile) and USD 0.62 M km−1 (USD 1 M mile−1) for pipelines one mile or longer. In this model, we utilize the EPA figure but explore how the Hengeveld assumptions influence costs. For S1 and S2, the pipeline capital to transport RNG to the injection point is USD 600,000 total because the distance is less than 1 mile. In S3, the distance was assumed to be 2.5 miles, which corresponds to a cost of USD 2.5 M. We assume the centralized biogas cleaning point in S3 and the centralized digester in S4 is located directly on an injection point (distance = 0 m), so no additional pipeline cost is considered. In S3, additional costs of biogas compression, H2S removal, and dewatering were calculated based on the findings of Hengeveld et al. [26] and converted to 2019 USD.
Capital costs for solids separation for digestate were calculated as screw press separators according to Møller et al. [60], assuming each of the farm-scale digesters in S1–S3 would require one separator and S4 would require five. Storage for digestate was calculated as one year of manure volume stored in a covered lagoon to account for the timing of land application. Lagoon cost was calculated as USD 7.34 m−3 (USD 0.028 gal−1) [61]. Assuming a depth of 15 ft, the cost of the cover was estimated as USD 11 m−2 (USD 1 ft−2) of the surface area [62]. All of the capital costs, excluding the upgrading and injection capital, were summed and an annual capital cost was computed assuming a 15-year lifespan at 7% interest. This was converted to a unit capital cost based on the energy production (USD GJ−1), then added to the capital cost of upgrading and injection. Table 3 summarizes the capital cost components for all scenarios.

2.6. Operating Costs

Operating costs for labor, maintenance, biogas upgrading and injection, energy, and solids handling were calculated. Labor costs are based on Aui and Wright [39], which included salaries for a plant manager and two yard employees for a total annual commitment of USD 190,000 for a digester producing 8300 m3 biogas per day. The labor cost was normalized based on biogas production, converted to 2019 USD, and scaled linearly for each scenario. Annual operating and maintenance cost of upgrading and injection were calculated as USD 42,400 m−3 min−1 (USD 1200 scfm−1) capacity [59]. An additional maintenance cost was applied as 10% of the annual capital cost, excluding the cost of upgrading and injection. The digester’s energy use was assumed to be 1.24 MJ m−3 biogas and the screw press energy demand was assumed to be 0.53 kWh Mg−1 [26,60]. The average cost of industrial electricity in Iowa is USD 0.0689 kWh−1 [63]. An additional cost for solids handling was included as USD 5.00 Mg−1 of solid digestate [39]. Other operating costs covered previously include manure and corn stover costs and the cost of manure transportation. Table 4 summarizes all operating cost calculations.

2.7. Renewable Fuel Identification Numbers and the Low-Carbon Fuel Standard

A source of income for biogas producers included in our model is RINs. RINs are bought and sold within fuel markets to meet compliance with the RFS [64]. Biogas producers that utilize manure qualify for D3 RINs, defined as cellulosic fuels. We used the average price of D3 RINs from 2016–2019 of USD 1.92 per gallon of ethanol equivalent [65]. This value was converted to a price per GJ using a gallon of ethanol’s energy content (0.08 GJ or 77,000 BTU), then this credit was applied to each scenario’s annual energy production.
California’s LCFS is a program designed to reduce the carbon footprint of the state’s transportation fuel supply through the use of low-carbon and renewable fuels [66]. This program allows for additional credits to be collected by the RNG producer. Utilizing spreadsheets titled “Biomethane from Anaerobic Digestion of Organic Waste” and “Biomethane from Anaerobic Digestion of Dairy and Swine Manure” provided by CARB, we calculated carbon intensity (CI) scores for compressed natural gas produced from the swine manure and corn stover inputs. Swine manure results in a negative carbon intensity equal to approximately −100 g CO2eq MJ−1. The CI score for corn stover was calculated to be approximately 14 g CO2eq MJ−1. These CI scores were then compared to the diesel compliance standard in 2030, set by CARB to be 80.36 CO2eq MJ−1. Corn stover saves 66 g CO2eq MJ−1 and swine manure saves 180 g. Total carbon emissions reduction values were calculated separately for the energy production from methane for each feedstock, then multiplied by the 2016–2019 average value of USD 136 Mg−1 CO2 emissions avoided [67] and summed for a total credit value. The value of LCFS credits ranged from USD 21 GJ−1 in S1 to USD 16 GJ−1 in S2-4. Both credits require the end use of the RNG is as a transportation fuel.

2.8. Final Cost Calculation

The minimum selling price (MSP) for each scenario was calculated by summing annualized capital and operating costs and subtracting the annualized RIN, LCFS, and digestate credit values. As mentioned in previous sections, costs were converted to 2019 USD. The year 2019 was chosen due to extreme price and inflation volatility since the beginning of the COVID-19 pandemic. Sensitivity analysis was completed by varying each of the model inputs individually by 1%. The change in final cost was observed, and the sensitivity coefficients (percent change in output divided percent change in input) were calculated for each input [68].

2.9. Natural Gas Comparison

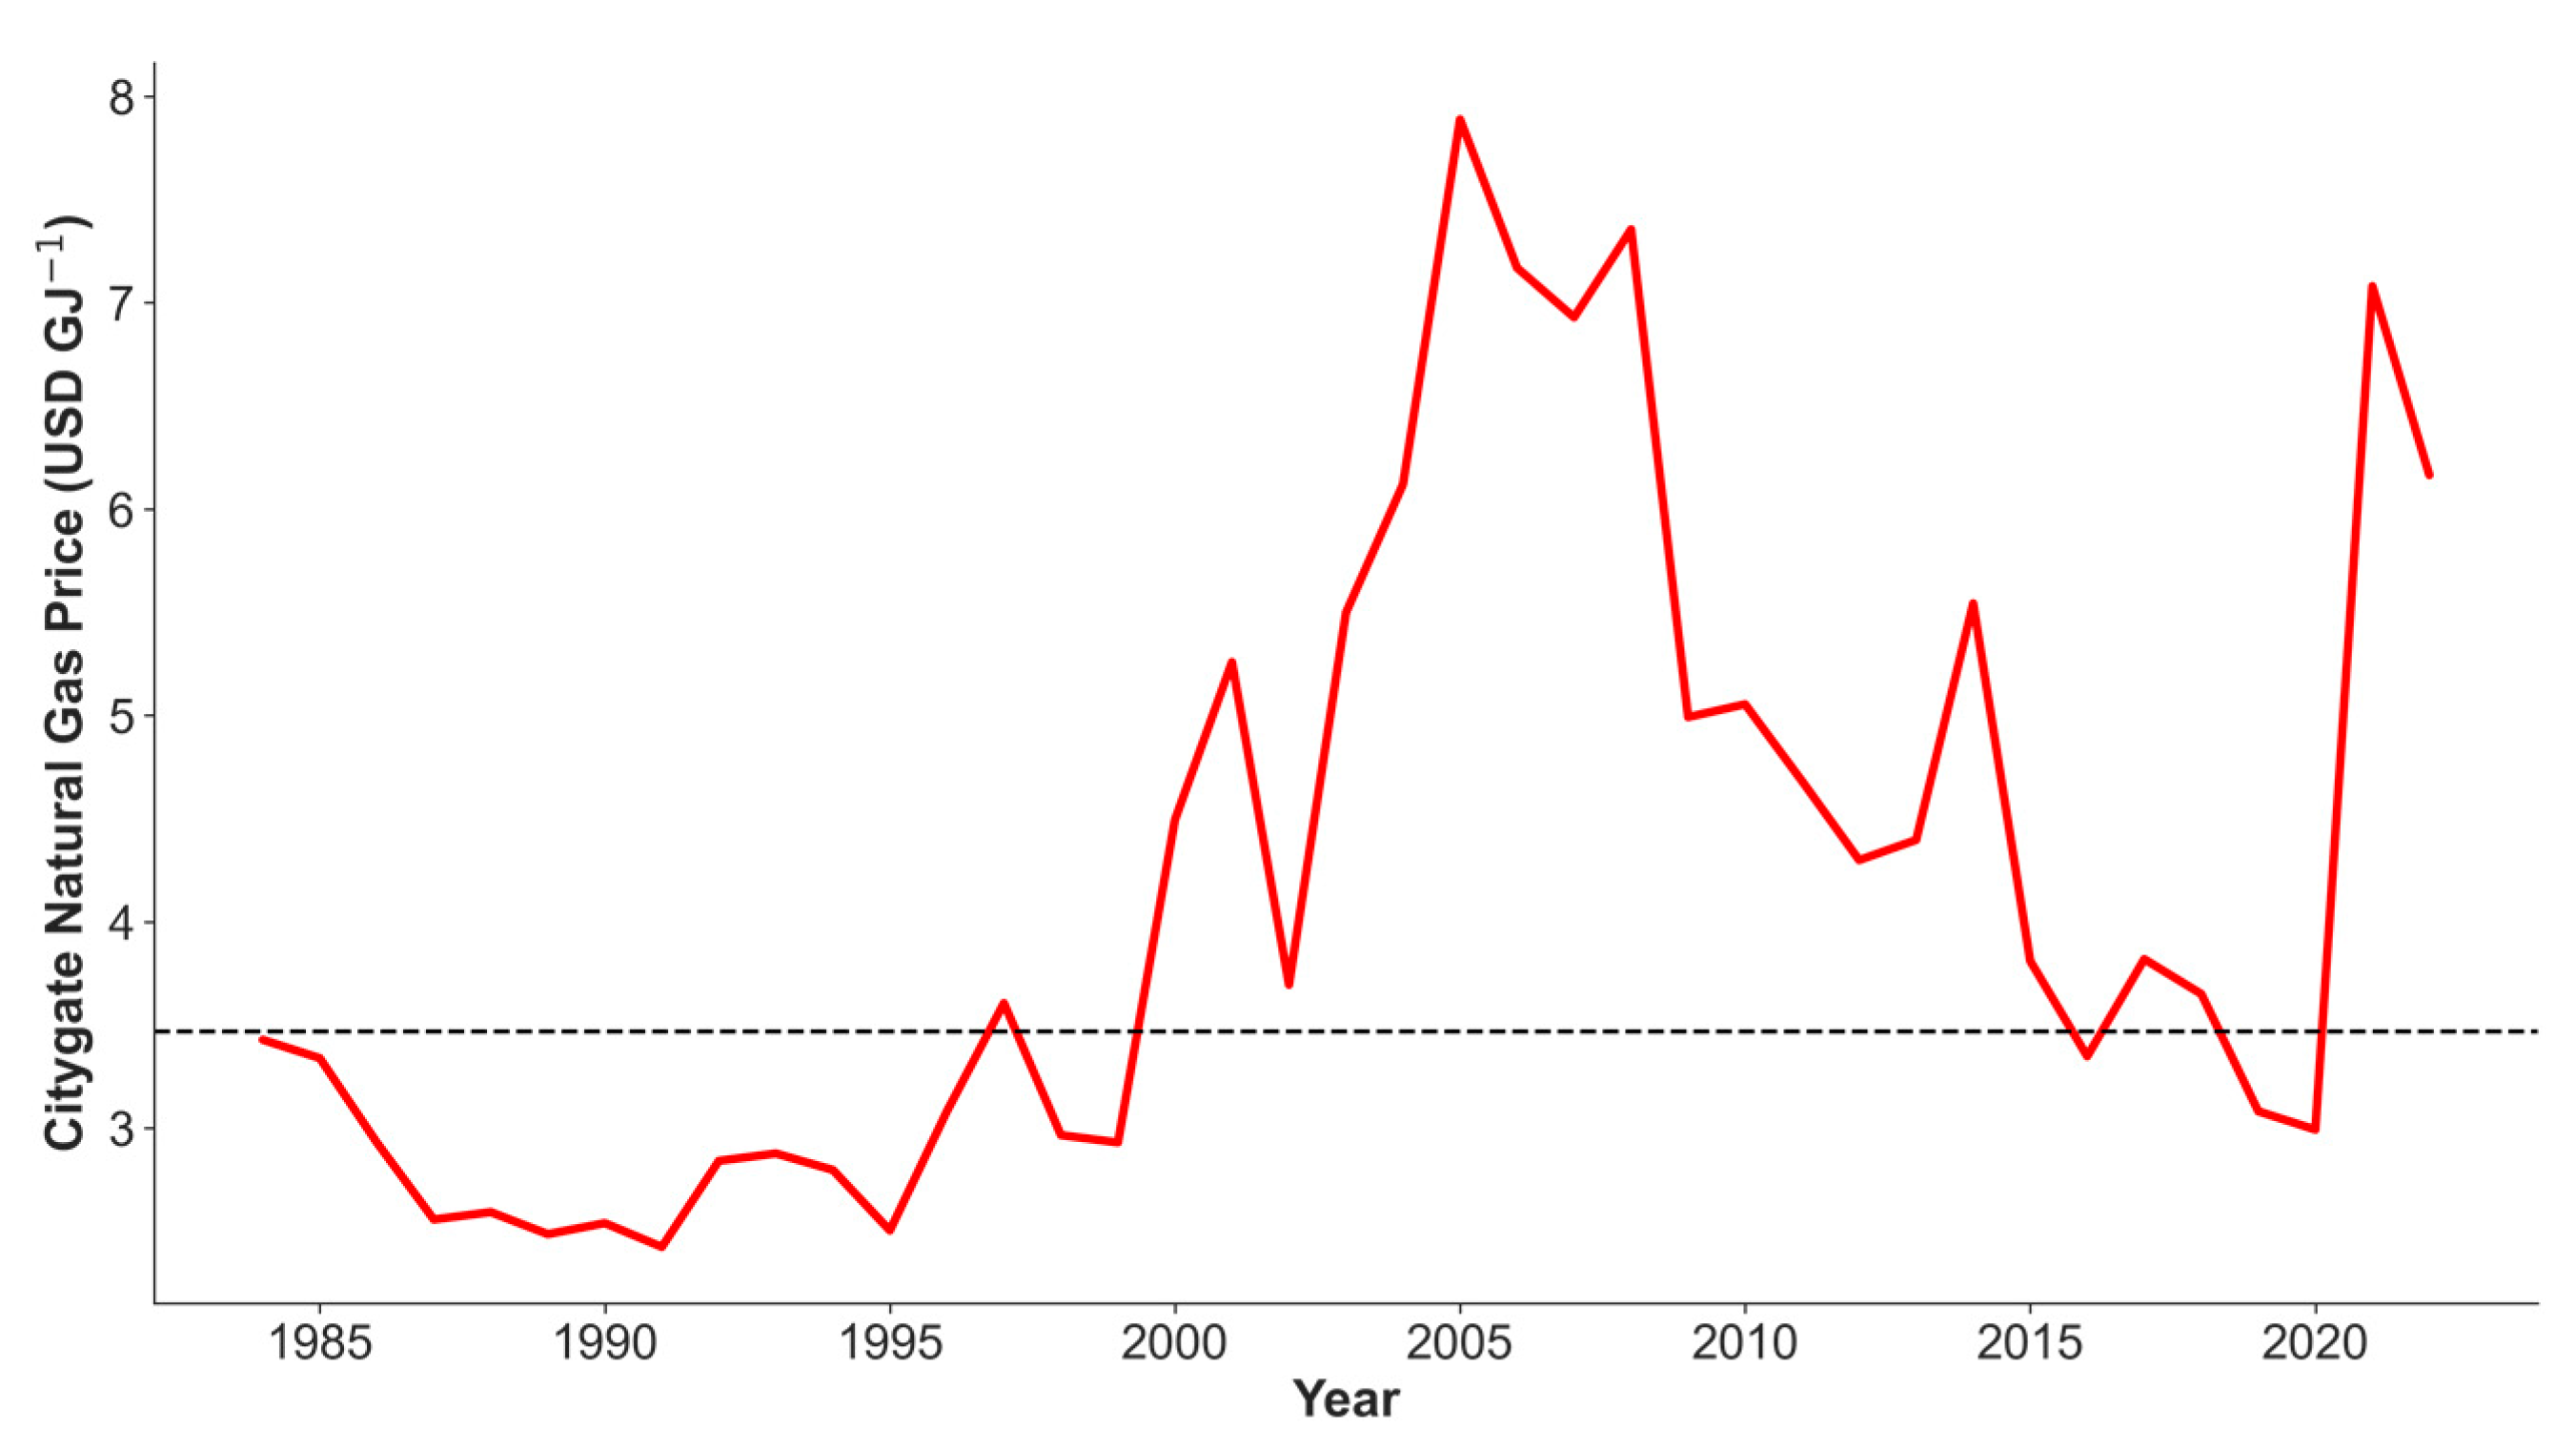
The 2016–2019 Citygate price of natural gas in Iowa was used to compare to biogas cost, consistent with the timespan used to average LCFS and RIN credits. According to the US Energy Information Administration, this price is USD 3.91 per 1000 ft3 [9]. Using the average Iowa natural gas energy content of 39.8 MJ m−3 (1067 BTU ft−3; [69]), this translates to a cost of USD 3.47 GJ−1. Figure 2 shows the average Citygate natural prices in Iowa since 1984. The World Bank [70] forecasts a 15% increase in natural gas commodity prices in the US in 2030, relative to 2019, and predicts it to continue to rise to a 31% increase in 2035 (constant USD (2010 = 100)). A sharp increase in price was seen after 2020 in Iowa, which may make the systems described in this paper more competitive than when compared to the 2016–2019 average.

3. Results and Discussion

3.1. Annual Production and Costs

Digester size, annual manure and corn stover inputs, annual digestate output, and the annual production of biogas, methane, and energy are summarized in Table 5. Because S1 utilizes less corn stover than the other scenarios, it is the lowest-production scenario. S2 and S3 have equal productions, and S4 has five times the production of S2 and S3, simply because it employs a single reactor receiving five times the feedstock.
Table 6 shows the MSP broken down by each cost category in the model (USD GJ−1 basis). The higher volumetric carbon loading rate of S2 results in a 15% drop in the pre-credit raw cost per GJ energy produced compared to S1. In addition to the increased methane production from adding additional carbon through corn stover, the increased input mass and production required an increased size of digester and cleaning and injection equipment, leading to economy-of-scale advantages in S2 over S1. In contrast, the LCFS and digestate credits in S1 are greater than in S2 because less corn stover is added to the digester. Perhaps surprisingly, the centralized upgrading scenario (S3) was approximately 21% more expensive on a raw cost basis than S2. The economies of scale leveraged by centralized upgrading was overshadowed by the cost of transporting biogas to the centralized injection point via pipeline. S4 is the least costly scenario. The economy of scale associated with totally centralized production was more significant than the disadvantage of transporting manure, consistent with the results of Hengeveld et al. [26]. This result may vary with pipeline costs and biogas or manure transportation distances, which we explore further in Section 3.4

3.2. Capital

The unit capital costs of each component are summarized in Table 7. The cost of upgrading and injection makes up the majority of the cost in three scenarios (S1, S2, and S4). Williams et al. [58] noted that total annual capital, operating, and maintenance costs for upgrading and injection can range from approximately USD 7 to 25 GJ−1 when upgrading biogas for natural gas pipeline injection, depending on scale. Summing our capital and operating costs for upgrading and injection yields similar results, with unit costs from USD 12 GJ−1 in S4 to 30 GJ−1 in S1. Additionally, in S1 and S2, 500 m of pipeline to connect to the natural gas grid was included in the upgrading and injection cost category in Table 7. In S3, upgrading and injection cost is only 18% of the total capital cost due to the large investment cost for the biogas transportation pipeline, which accounts for over 50% of the total capital cost in S3. The portion of cost from the digester ranges from 25% in S1 to 42% in S4. Digester capital costs vary depending on digester type chosen and could be much lower if a different digester type (e.g., covered lagoon) is utilized. The strong economy of scale associated with digester capital cost resulted in unit digester costs in S4 being approximately half of the unit costs of the digester in S1, S2, or S3. The annual capital costs of S4 are significantly higher than in any other scenario, but those costs are more than offset by the higher energy production and economies of scale, making it the least expensive scenario on a per GJ basis.

3.3. Natural Gas Comparison

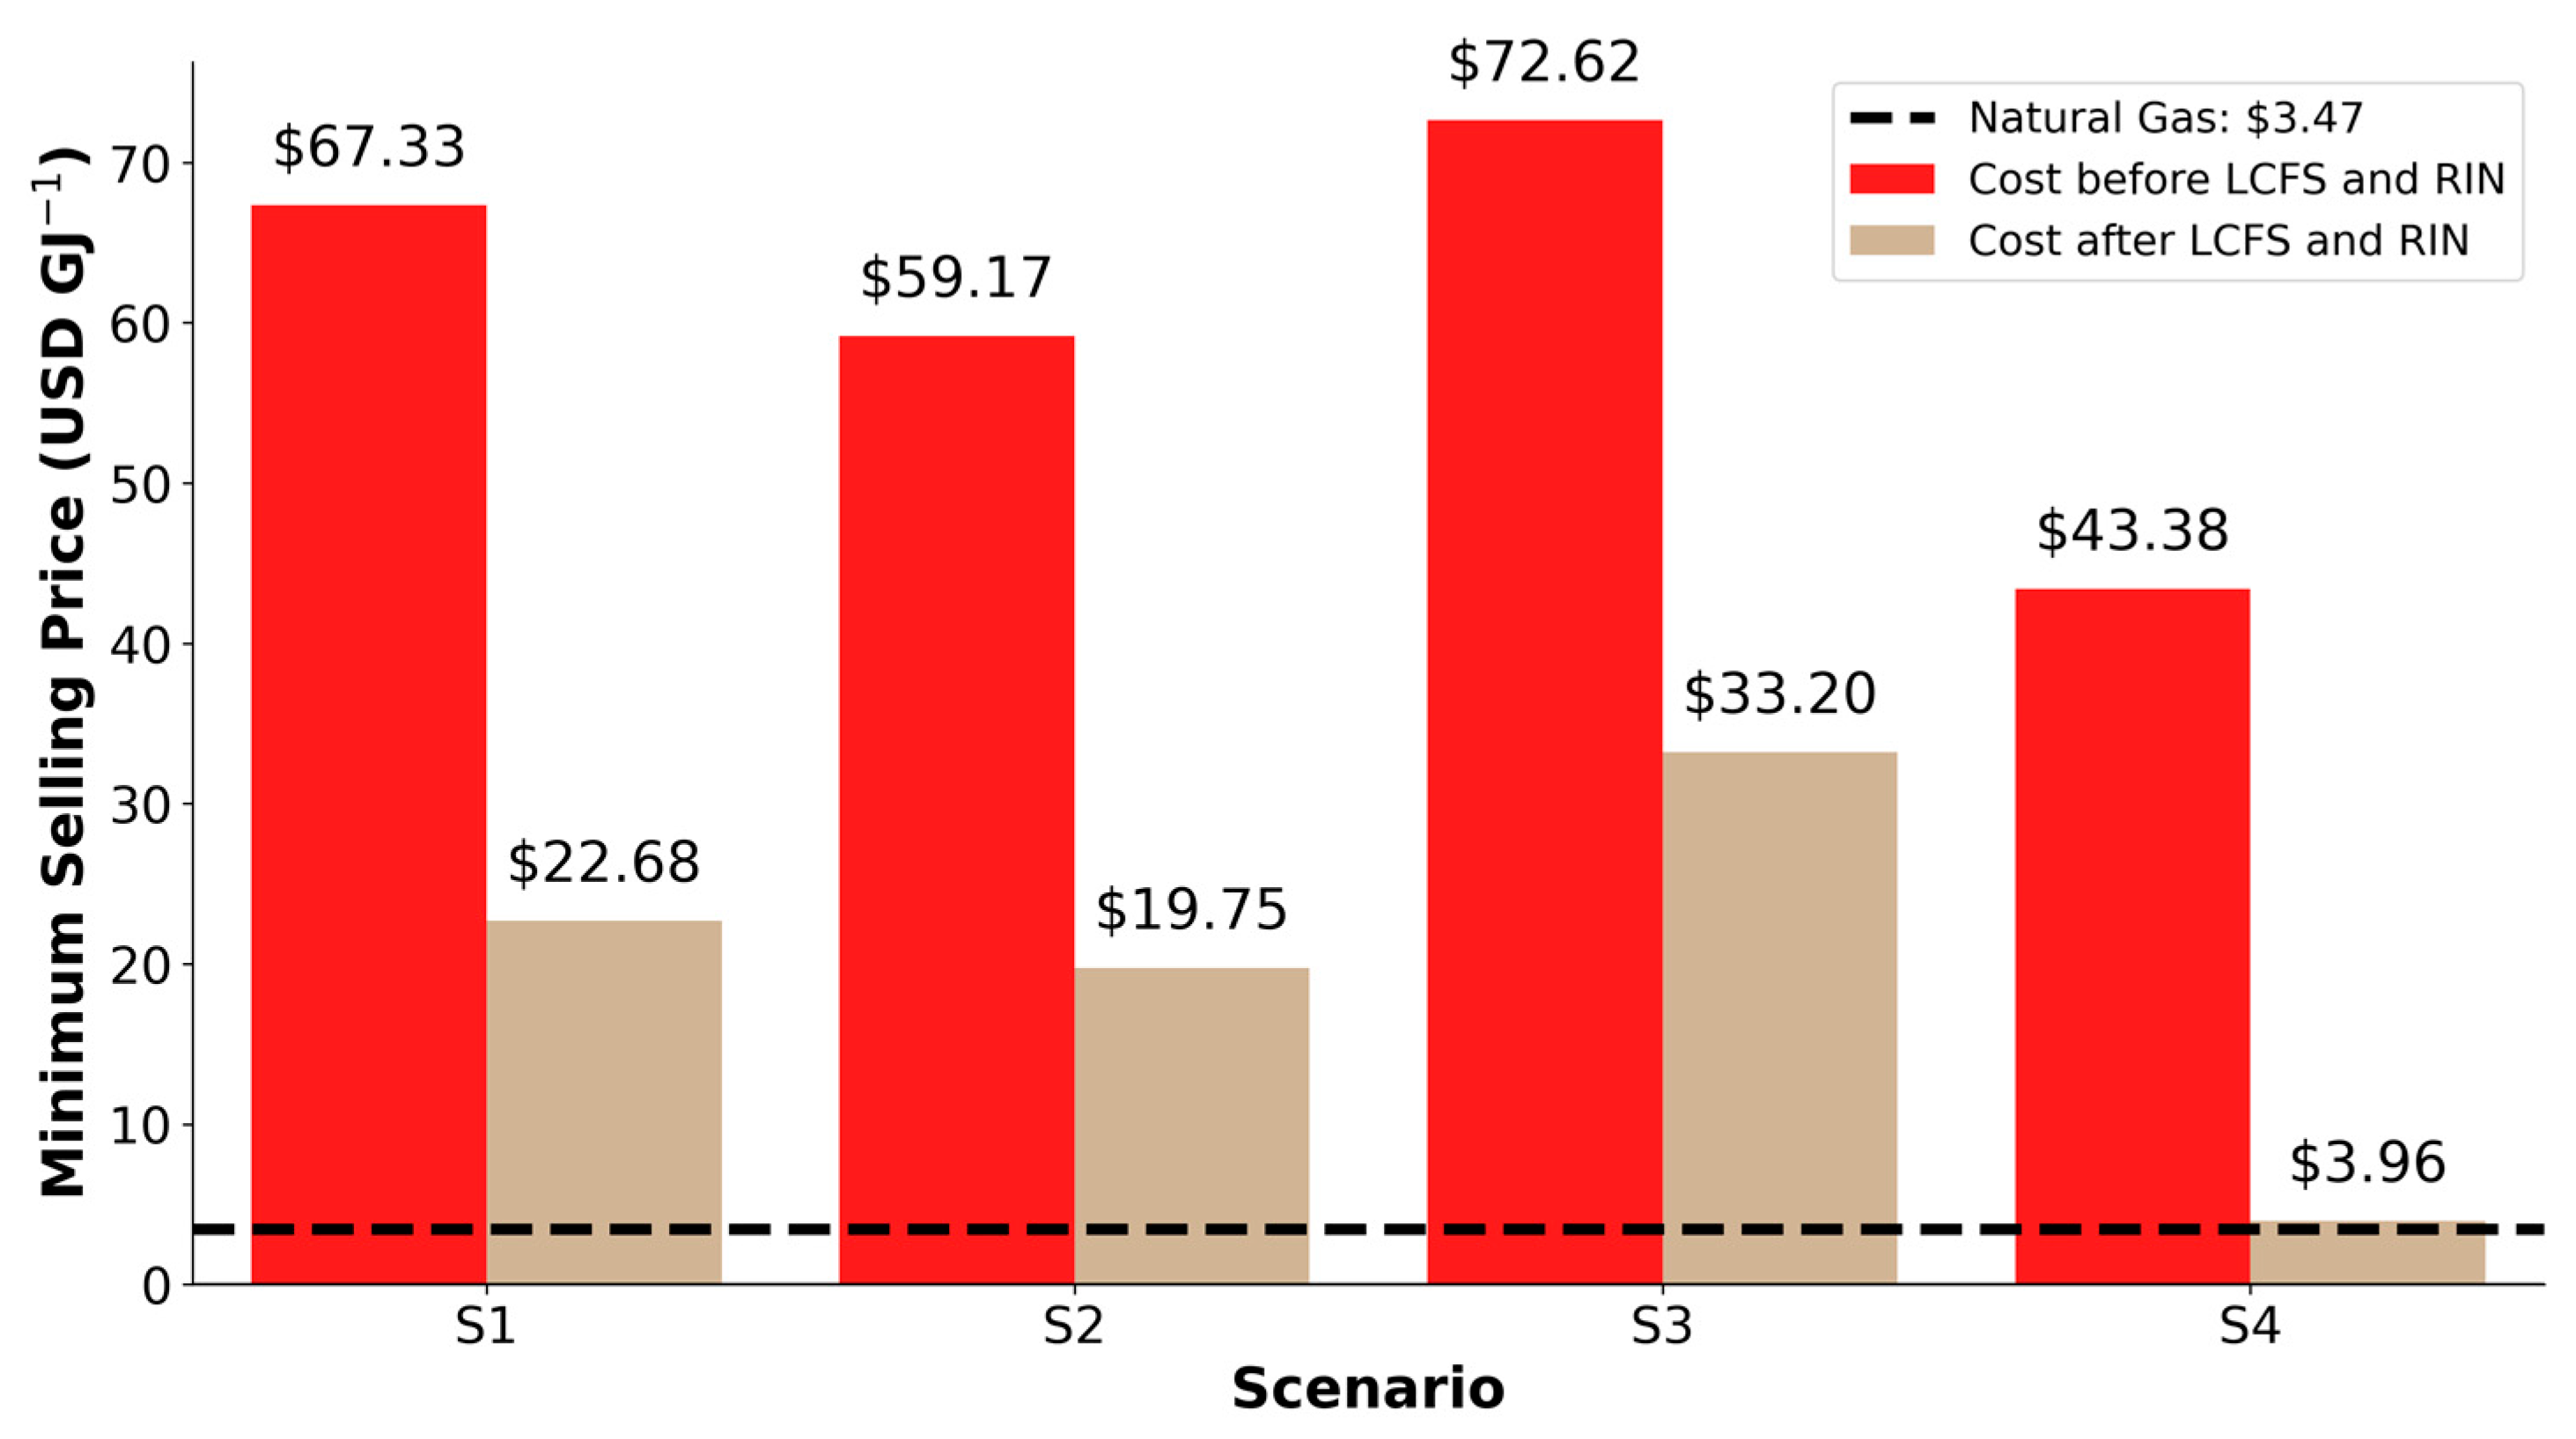
Figure 3 shows the scenario costs compared to the average price of natural gas in Iowa before (including the credit value of digestate as fertilizer) and after RIN and LCFS credits are applied. Before considering these significant credits, there are no scenarios that are competitive with the cost of natural gas. After applying the value of these credits, the costs become more competitive, with S4 being approximately USD 0.50 GJ−1 more than the comparison natural gas price. The other three scenarios range from USD 16 to 30 GJ−1 more than natural gas after applying RIN and LCFS values. These results highlight the heavy reliance on these credits for swine AD RNG systems to begin to become competitive with fossil fuels.

3.4. Effect of Transportation Distances

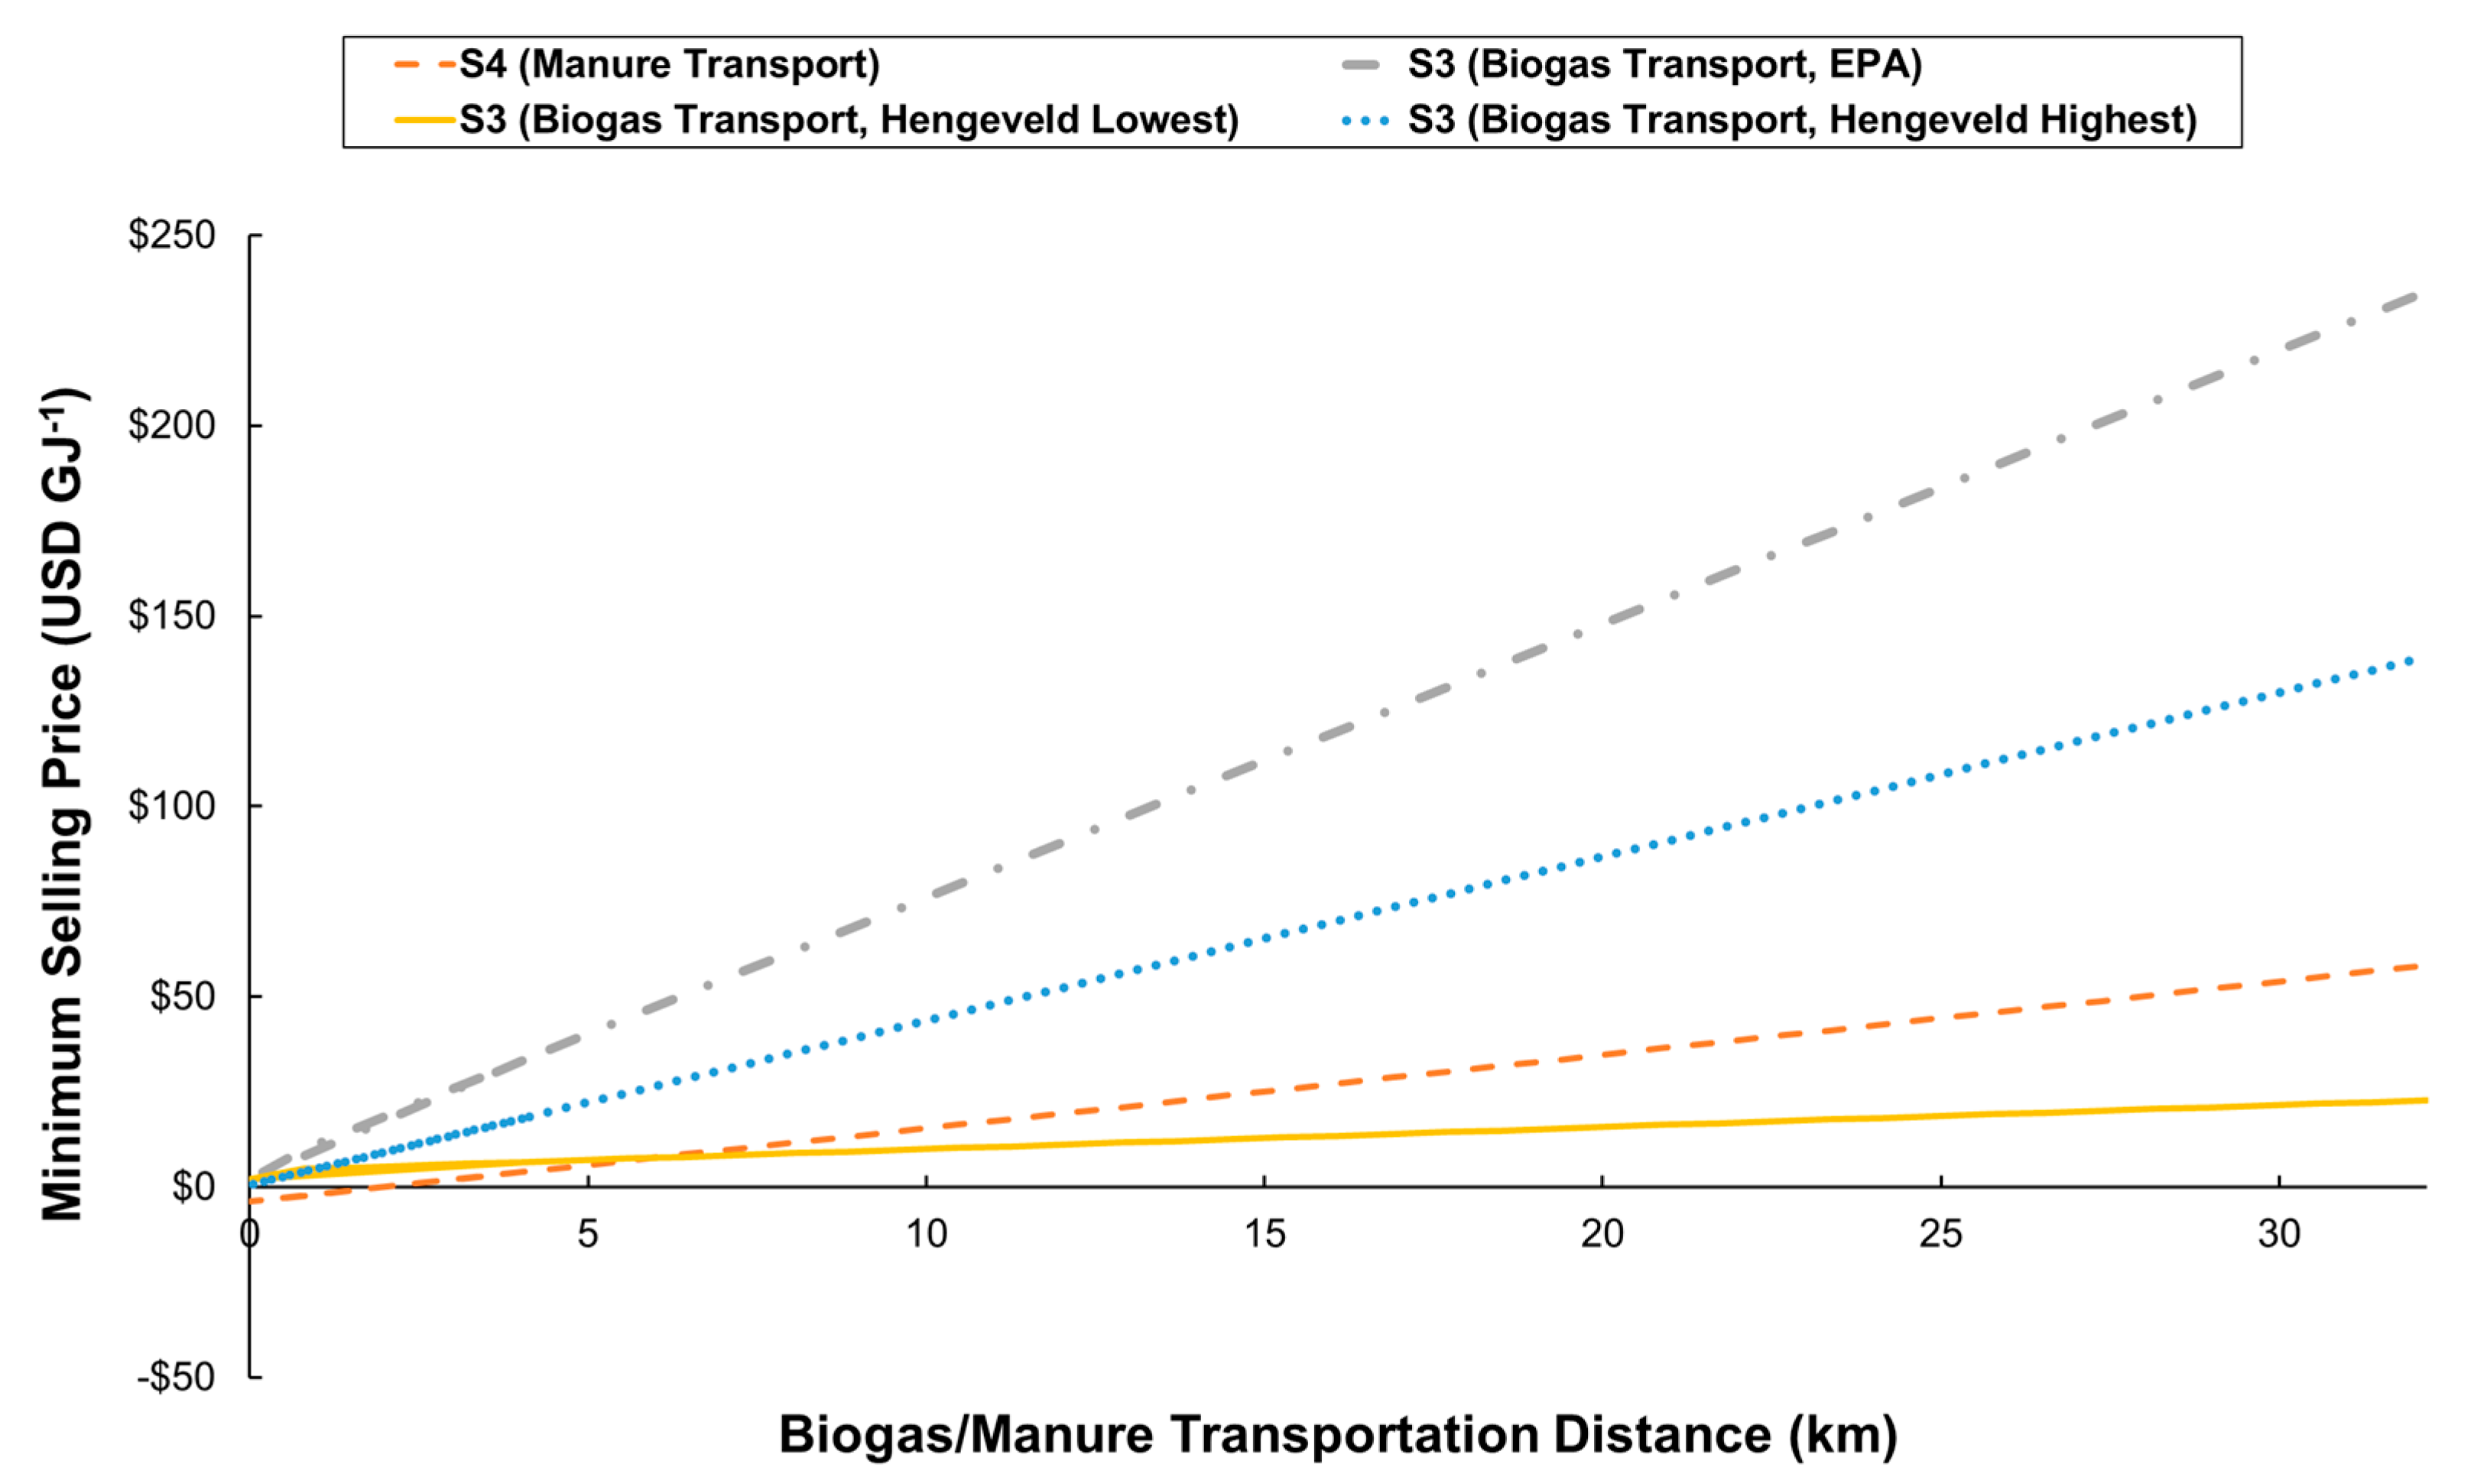
The cost impacts of transportation distance, either of biogas in S3 or of manure in S4, were explored by changing one-way distance over the range of 0 to 32 km (0–20 miles). The cost of the biogas pipeline was calculated three different ways. First, the cost was calculated using the USD 50,000 km−1 (USD 1,000,000 mile−1) capital cost utilized in the model. Then, the highest and lowest cost for the biogas pipeline according to Hengeveld et al. [26] were utilized instead (i.e., (USD 373,000 and USD 50,000 km−1, respectively). As shown in Figure 4, the energy production costs of S3 exceeds that of S4 for all distances, unless the pipeline can be installed at 50,000 km−1 (USD 80,000 mi−1), which seems unrealistically low as this is 8% of the recommended cost estimation by the EPA [59]. At a manure transportation distance of 32 km (20 miles), the energy production cost in S4 increases by USD 54 GJ−1 from the base case, greatly decreasing its competitiveness with the cost of natural gas. For centralized digestion systems similar to those modeled in this work to compete with fossil fuels, the transportation distance of the manure should be minimized. Swine farms in close proximity to each other with a central location for pipeline injection would be preferred, but this siting is not typical for other reasons [71]. For small-scale digestion with centralized biogas upgrading and injection, significantly lower pipeline costs are needed to be competitive with fossil fuels. Other methods of biogas transportation may prove to be a better choice.

3.5. Sensitivity Analysis

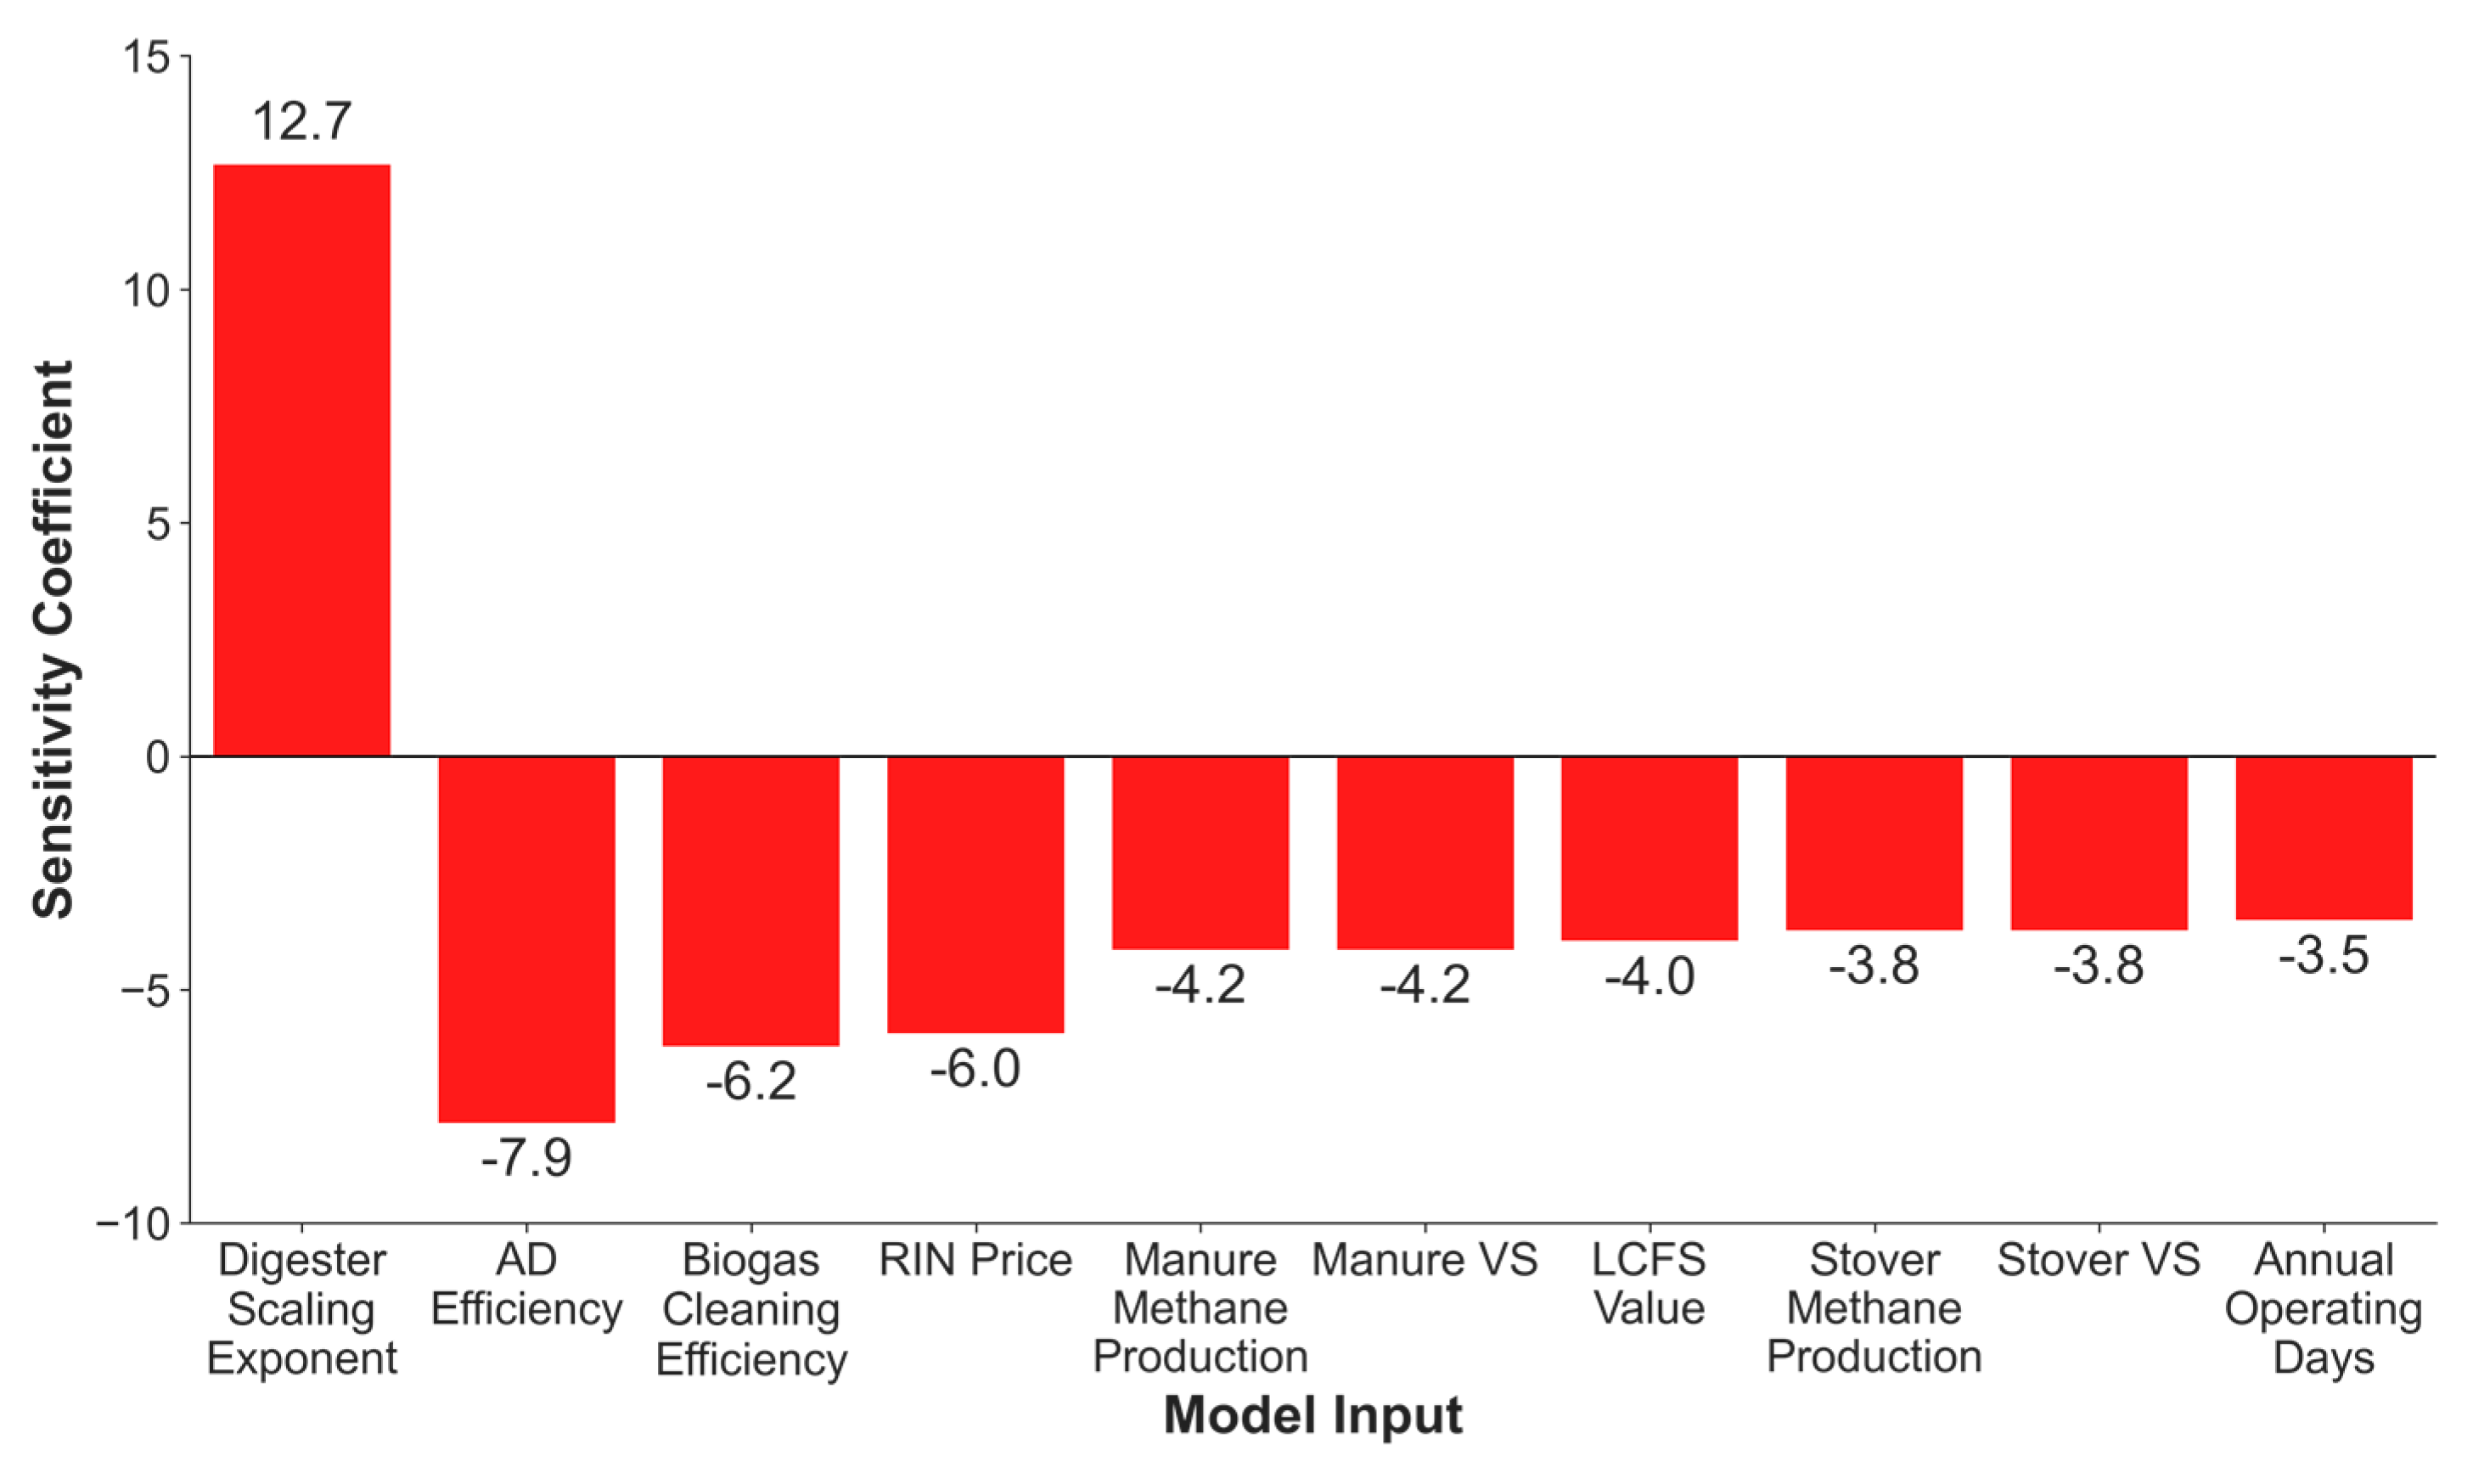
The sensitivity analysis results for the ten most sensitive model inputs in S4 are shown in Figure 5. For example, S4 had a base MSP of USD 3.96 (Figure 3); a 1% increase in biogas cleaning efficiency would lead to a 6.2% decrease in MSP (i.e., down to approximately USD 3.70). The 10 largest sensitivity coefficients ranged in magnitude from 3.5 to just under 13. Unsurprisingly, the highly non-linear digester scaling exponent, which drives the overall capital cost, had the highest sensitivity coefficient. The scaling exponent value was calculated by Faulhaber et al. [12] based on available AgSTAR data. While an increased scale generally decreases unit capital costs, the magnitude of this decrease depends on several different factors, such as location, unique design characteristics, and the type of digester selected. Additionally, the assumed efficiency of the digester was a highly sensitive input. This value was assumed to be 75% of the assumed methane potential of the inputs that could be reached. This value may increase or decrease based on environmental factors, such as weather.
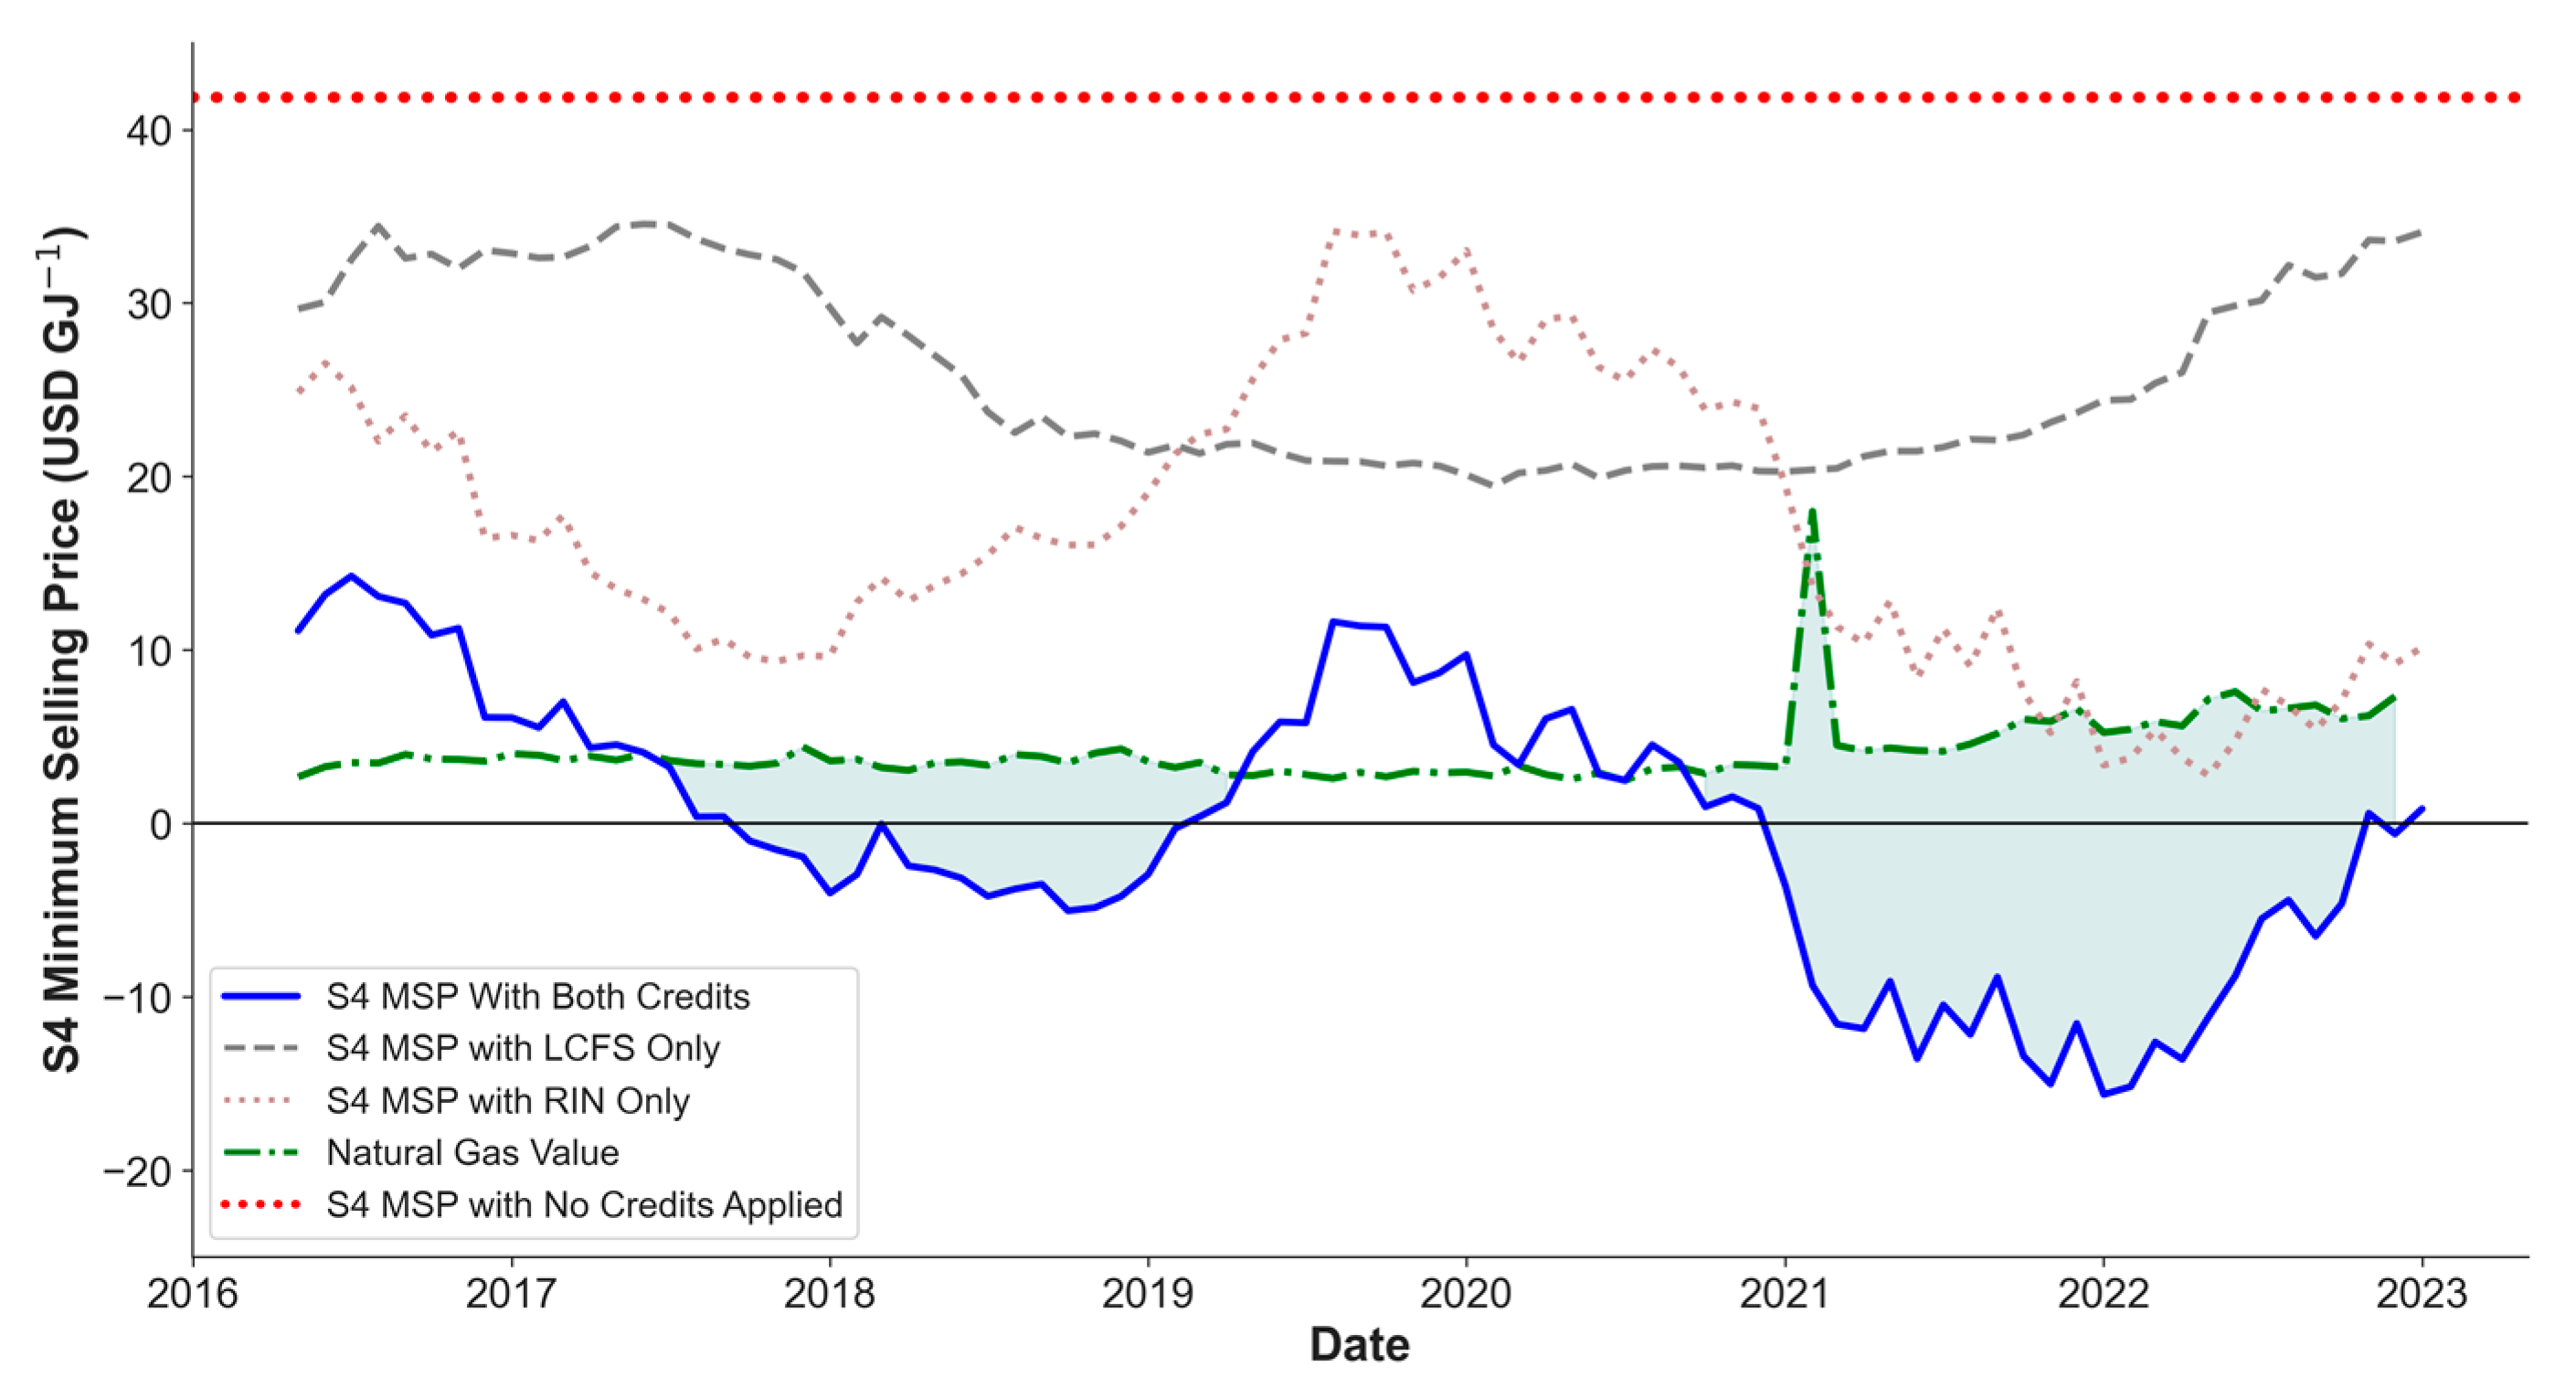
The minimum selling price in S4 was very sensitive to both RIN and LCFS credit values, with a 1% change resulting in a 6.0% and 4.0% change in the final energy production cost, respectively. As shown in Figure 6, the value of both credits vary greatly over time and influence the competitiveness of S4 with natural gas. With no credits applied (red dotted line), S4 is never competitive with natural gas. With either credit applied independently, S4 is rarely competitive. Given the high sensitivity of the model results to these values, the volatility in their prices would profoundly affect the profitability of the system.
Less sensitive input assumptions in the top ten include the process assumptions related to input properties, namely methane production and VS content. These inputs may vary based on the age of the manure or specific livestock feeding information. The biogas cleaning efficiency was also among the most sensitive assumptions, which could change based on biogas cleaning methods deployed at the digester. The results were also sensitive to the annual operating days assumption, which was placed at 340 days yr−1.
The impact of utilizing corn stover in the digesters was also explored. The benefit of adding corn stover varied with scale. When comparing S1 (farm-scale digester, no water added) to an identical scenario without corn stover additions, the price at which adding corn stover stops being advantageous is USD 70 Mg−1. In a similar comparison, S4 (centralized digester with water addition) was compared to an identical scenario without corn stover (or water) addition. At the base price of USD 51 Mg−1, adding corn stover decreases the MSP by approximately USD 4 GJ−1. The price at which adding corn stover stops being advantageous in S4 is USD 81 Mg−1. The wide-ranging prices for corn stover discussed above (USD 20–100 Mg−1) could have a significant impact on the viability of the system. At a price of USD 100 Mg−1, the MSP in S4 is approximately USD 7.50 GJ−1 greater than the price of natural gas and is much less competitive.

4. Conclusions

This modelling effort suggests that centralized biogas production systems utilizing swine manure and corn stover are more cost effective than smaller-scale, decentralized digester systems. The diseconomies of scale associated with transporting manure and stover were smaller than the economy of scale associated with a larger digester and single cleanup and injection point. Critically, even the centralized scenario was highly reliant on transportation fuel-based greenhouse-gas-reduction credits to be competitive with fossil methane. This causes risk, because these credits are variable over time and frequently subject to policy changes. If on-farm (rather than centralized) digesters are used, a centralized biogas upgrading and injection point could only reduce the cost of production under very low biogas transport assumptions. Future research into low-cost biogas transport systems may be justified. Given the uncertainty of carbon credit prices, other incentives may be required to aid in the adoption of centralized systems. The environmental impacts of the system (harvesting corn stover, large volumes of manure in one location, methane leakage from the system) were not explored, but further research on these points is required to understand the overall costs of the system.

Author Contributions

Conceptualization, D.S.A. and D.R.R.; Formal analysis, G.M.M.; Investigation, G.M.M.; Methodology, G.M.M., D.S.A. and D.R.R.; Supervision, D.S.A. and D.R.R.; Writing—original draft, G.M.M.; Writing—review and editing, D.S.A., B.J.M. and D.R.R. All authors have read and agreed to the published version of the manuscript.

Funding

This research received no external funding.

Data Availability Statement

Publicly available datasets were analyzed in this study. These data can be found here: https://github.com/gabbymyers/Swine-Manure-and-Corn-Stover-Codigestion (accessed on 24 May 2023).

Conflicts of Interest

The authors declare no conflict of interest.

Abbreviations

USUnited States of America
ADAnaerobic Digestion/Digester
RINRenewable Identification Number
RFSRenewable Fuels Standard
LCFSLow-Carbon Fuel Standard
USDUnited States Dollar
RNGRenewable Natural Gas
TSTotal Solids
VSVolatile Solids
S1, S2, S3, S4Scenarios 1–4
EPAUnited States Environmental Protection Agency
CICarbon Intensity
CARBCalifornia Air Resources Board
MSPMinimum Selling Price

References

  1. Ward, A.J.; Hobbs, P.J.; Holliman, P.J.; Jones, D.L. Optimisation of the Anaerobic Digestion of Agricultural Resources. Bioresour. Technol. 2008, 99, 7928–7940. [Google Scholar] [CrossRef] [PubMed]
  2. Chiumenti, R.; Chiumenti, A.; da Borso, F.; Limina, S.; Landa, A. Anaerobic Digestion of Swine Manure in Conventional and Hybrid Pilot Scale Plants: Performance and Gaseous Emissions Reduction. In Proceedings of the 2009 ASABE Annual International Meeting, Reno, NV, USA, 21–24 June 2009; American Society of Agricultural and Biological Engineers: St. Joseph, MI, USA, 2009. [Google Scholar]
  3. EPA. Environmental Benefits of Anaerobic Digestion (AD). Available online: https://www.epa.gov/anaerobic-digestion/environmental-benefits-anaerobic-digestion-ad (accessed on 2 February 2023).
  4. AgSTAR. AgSTAR Data and Trends. Available online: https://www.epa.gov/agstar/agstar-data-and-trends (accessed on 2 February 2023).
  5. AgSTAR. Market Opportunities for Biogas Recovery Systems at U.S. Livestock Facilities; AgSTAR: Mankato, MN, USA, 2018. [Google Scholar]
  6. Decision Innovation Solutions. Iowa Pork Industry Contribution Study 2020; Decision Innovation Solutions: Urbandale, IA, USA, 2020. [Google Scholar]
  7. Bhatt, A.H.; Tao, L. Economic Perspectives of Biogas Production via Anaerobic Digestion. Bioengineering 2020, 7, 74. [Google Scholar] [CrossRef]
  8. EIA. Table A4. Approximate Heat Content of Natural Gas; U.S Energy Information Administration: Washington, DC, USA, 2021.
  9. EIA. Natural Gas Prices. Available online: https://www.eia.gov/dnav/ng/ng_pri_sum_dcu_SIA_a.htm (accessed on 2 February 2023).
  10. Beddoes, J.C.; Bracmort, K.S.; Burns, R.T.; Lazarus, W.F. An Analysis of Energy Production Costs from Anaerobic Digestion Systems on U.S. Livestock Production Facilities; Natural Resources Conservation Service United States Department of Agriculture: Washington, DC, USA, 2007. [Google Scholar]
  11. EIA. Levelized Costs of New Generation Resources in the Annual Energy Outlook; U.S Energy Information Administration: Washington, DC, USA, 2021.
  12. Faulhaber, C.R.; Raman, D.R.; Burns, R.T. An Engineering-Economic Model for Analyzing Dairy Plug-Flow Anaerobic Digesters: Cost Structures and Policy Implications. Trans. ASABE 2012, 55, 41247. [Google Scholar] [CrossRef]
  13. Lusk, P. Methane Recovery from Animal Manures the Current Opportunities Casebook; National Renewable Energy Laboratory: Golden, CO, USA, 1998.
  14. AgSTAR. Livestock Anaerobic Digester Database. Available online: https://www.epa.gov/agstar/livestock-anaerobic-digester-database (accessed on 20 December 2021).
  15. Aldrich, B.S.; Fiesinger, T. Centralized Anaerobic Digestion Options for Groups of Dairy Farms; Rural Business-Cooperative Service: Washington, DC, USA, 2005. [Google Scholar]
  16. Burmahl, B. Turning Waste to Energy: Tracking Renewable Natural Gas Transportation Projects. Available online: https://www.anl.gov/article/turning-waste-to-energy-tracking-renewable-natural-gas-transportation-projects (accessed on 2 February 2023).
  17. Homan, E. Biogas from Manure. Available online: https://extension.psu.edu/biogas-from-manure (accessed on 14 March 2023).
  18. Varol, A.; Ugurlu, A. Comparative Evaluation of Biogas Production from Dairy Manure and Co-Digestion with Maize Silage by CSTR and New Anaerobic Hybrid Reactor. Eng. Life Sci. 2017, 17, 402–412. [Google Scholar] [CrossRef] [PubMed]
  19. Chen, S.; Xu, Z.; Li, X.; Yu, J.; Cai, M.; Jin, M. Integrated Bioethanol Production from Mixtures of Corn and Corn Stover. Bioresour. Technol. 2018, 258, 18–25. [Google Scholar] [CrossRef] [PubMed]
  20. Fujita, M.; Scharer, J.M.; Moo-Young, M. Effect of Corn Stover Addition on the Anaerobic Digestion of Swine Manure. Agric. Wastes 1980, 2, 177–184. [Google Scholar] [CrossRef]
  21. González, R.; González, J.; Rosas, J.G.; Smith, R.; Gómez, X. Biochar and Energy Production: Valorizing Swine Manure through Coupling Co-Digestion and Pyrolysis. C-J. Carbon Res. 2020, 6, 43. [Google Scholar] [CrossRef]
  22. Kadam, K.L.; McMillan, J.D. Availability of Corn Stover as a Sustainable Feedstock for Bioethanol Production. Bioresour. Technol. 2003, 88, 17–25. [Google Scholar] [CrossRef]
  23. Miller, D. Designing ‘Greener’ Pig Barns. Available online: https://www.nationalhogfarmer.com/facilities-equipment/designing-greener-pig-barns-0919 (accessed on 22 February 2023).
  24. Vansickle, J. Double-Wide Wean-to-Finish Facilities. Available online: https://www.nationalhogfarmer.com/mag/farming_doublewide_weantofinish_facilities (accessed on 22 February 2023).
  25. Baldwin, S.; Anthony, L.; Wang, M. Development of a Calculator for the Techno-Economic Assessment of Anaerobic Digestion Systems; Final report submitted to BC Ministry of Agriculture and Land and BC Life Sciences; Chemical and Biological Engineering, University of British Columbia: Vancouver, BC, Canada, 2009. [Google Scholar]
  26. Hengeveld, E.J.; van Gemert, W.J.T.; Bekkering, J.; Broekhuis, A.A. When Does Decentralized Production of Biogas and Centralized Upgrading and Injection into the Natural Gas Grid Make Sense? Biomass Bioenergy 2014, 67, 363–371. [Google Scholar] [CrossRef]
  27. Iowa DNR. AFO Siting. Available online: https://programs.iowadnr.gov/maps/afo/ (accessed on 14 March 2023).
  28. Konopacky, J.; Rundquist, S. EWG Study and Mapping Show Large CAFOs in Iowa Up Fivefold Since 1990. Available online: https://www.ewg.org/interactive-maps/2020-iowa-cafos/ (accessed on 14 March 2023).
  29. Smith, B.C.; Andersen, D.S.; Harmon, J.D.; Stinn, J.P. Case Study of Swine Finishing Manure Nutrient Characteristics for Land Application. In Proceedings of the 2017 ASABE Annual International Meeting, Spokane, WA, USA, 16–19 July 2017; American Society of Agricultural and Biological Engineers: St. Joseph, MI, USA, 2017. [Google Scholar]
  30. Andersen, D.S.; Van Weelden, M.B.; Trabue, S.L.; Pepple, L.M. Lab-Assay for Estimating Methane Emissions from Deep-Pit Swine Manure Storages. J. Environ. Manag. 2015, 159, 18–26. [Google Scholar] [CrossRef]
  31. California Air Resources Board. Compliance Offset Protocol Livestock Projects; California Air Resources Board: Sacramento, CA, USA, 2014. [Google Scholar]
  32. ASABE. ASAE D384.2 Manure Production and Characteristics; ASABE: St. Joseph, MI, USA, 2005. [Google Scholar]
  33. Sawyer, J.E.; Mallarino, A.P. Using Manure Nutrients for Crop Production; Iowa State University Extension and Outreach: Ames, IA, USA, 2016. [Google Scholar]
  34. Schnitkey, G.; Paulson, N.; Zulauf, C.; Swanson, K.; Baltz, J. Fertilizer Prices, Rates, and Costs for 2023; Department of Agricultural and Consumer Economics: Chicago, Il, USA, 2022. [Google Scholar]
  35. Ghafoori, E.; Flynn, P.; Feddes, J. Pipeline vs. Truck Transport of Beef Cattle Manure. Biomass Bioenergy 2007, 31, 168–175. [Google Scholar] [CrossRef]
  36. Moody, L.B.; Burns, R.T.; Bishop, G.; Sell, S.T.; Spajic, R. Using Biochemical Methane Potential Assays to Aid in Co-Substrate Selection for Co-Digestion. Appl. Eng. Agric. 2011, 27, 433–439. [Google Scholar] [CrossRef]
  37. Li, Y.; Zhang, R.; Liu, X.; Chen, C.; Xiao, X.; Feng, L.; He, Y.; Liu, G. Evaluating Methane Production from Anaerobic Mono- and Co-Digestion of Kitchen Waste, Corn Stover, and Chicken Manure. Energy Fuels 2013, 27, 2085–2091. [Google Scholar] [CrossRef]
  38. Liu, C.M.; Wachemo, A.C.; Yuan, H.R.; Zou, D.X.; Liu, Y.P.; Zhang, L.; Pang, Y.Z.; Li, X.J. Evaluation of Methane Yield Using Acidogenic Effluent of NaOH Pretreated Corn Stover in Anaerobic Digestion. Renew. Energy 2018, 116, 224–233. [Google Scholar] [CrossRef]
  39. Aui, A.; Wright, M. Life Cycle Cost Analysis of the Operations of Anaerobic Digesters in Iowa; Iowa State University: Ames, IA, USA, 2014. [Google Scholar]
  40. Aui, A.; Wang, Y.; Mba-Wright, M. Evaluating the Economic Feasibility of Cellulosic Ethanol: A Meta-Analysis of Techno-Economic Analysis Studies. Renew. Sustain. Energy Rev. 2021, 145, 111098. [Google Scholar] [CrossRef]
  41. Thompson, J.L.; Tyner, W.E. Corn Stover for Bioenergy Production: Cost Estimates and Farmer Supply Response. Biomass Bioenergy 2014, 62, 166–173. [Google Scholar] [CrossRef]
  42. Kazi, F.K.; Fortman, J.; Anex, R.; Kothandaraman, G.; Hsu, D.; Aden, A.; Dutta, A. Techno-Economic Analysis of Biochemical Scenarios for Production of Cellulosic Ethanol; National Renewable Energy Laboratory: Golden, CO, USA, 2010.
  43. Davis, R.E.; Grundl, N.J.; Tao, L.; Biddy, M.J.; Tan, E.C.; Beckham, G.T.; Humbird, D.; Thompson, D.N.; Roni, M.S. Process Design and Economics for the Conversion of Lignocellulosic Biomass to Hydrocarbon Fuels and Coproducts: 2018 Biochemical Design Case Update; Biochemical Deconstruction and Conversion of Biomass to Fuels and Products via Integrated Biorefinery Pathways; National Renewable Energy Laboratory: Golden, CO, USA, 2018. [Google Scholar]
  44. Ertl, D. 2013 Sustainable Corn Stover Harvest; Iowa Corn Promotion Board: Johnston, IA, USA, 2013. [Google Scholar]
  45. Edwards, W. Estimating a Value for Corn Stover; Iowa State University: Ames, IA, USA, 2020. [Google Scholar]
  46. Arora, K.; Licht, M.; Leibold, K. Industrial Corn Stover Harvest; Iowa State University: Ames, IA, USA, 2014. [Google Scholar]
  47. Khanna, M.; Paulson, N. To Harvest Stover or Not: Is It Worth It? Department of Agricultural and Consumer Economics: Chicago, Il, USA, 2016. [Google Scholar]
  48. Sawyer, J.E.; Mallarino, A.P. Nutrient Considerations with Corn Stover Harvest; Iowa State University: Ames, IA, USA, 2014. [Google Scholar]
  49. Comino, E.; Rosso, M.; Riggio, V. Investigation of Increasing Organic Loading Rate in the Co-Digestion of Energy Crops and Cow Manure Mix. Bioresour. Technol. 2010, 101, 3013–3019. [Google Scholar] [CrossRef]
  50. Lehtomäki, A.; Huttunen, S.; Rintala, J.A. Laboratory Investigations on Co-Digestion of Energy Crops and Crop Residues with Cow Manure for Methane Production: Effect of Crop to Manure Ratio. Resour. Conserv. Recycl. 2007, 51, 591–609. [Google Scholar] [CrossRef]
  51. Jie, L.; Liu, S.; Zhang, S.; Peng, L.; Wang, J.; Pan, Y. Biogas Yields during Anaerobic Co-Digestion of Corn Stover and Cattle Manure with Different Proportions. IOP Conf. Ser. Earth Environ. Sci. 2020, 546, 42045. [Google Scholar] [CrossRef]
  52. Wang, H.; Lim, T.T.; Duong, C.; Zhang, W.; Xu, C.; Yan, L.; Mei, Z.; Wang, W. Long-Term Mesophilic Anaerobic Co-Digestion of Swine Manure with Corn Stover and Microbial Community Analysis. Microorganisms 2020, 8, 188. [Google Scholar] [CrossRef]
  53. Gontupil, J.; Darwin, M.; Liu, Z.; Cheng, J.J.; Chen, H.C. Anaerobic Co-Digestion of Swine Manure and Corn Stover for Biogas Production. In Proceedings of the 2012 ASABE Annual International Meeting, Dallas, TX, USA, 29 July–1 August 2012; American Society of Agricultural and Biological Engineers: St. Joseph, MI, USA, 2012. [Google Scholar]
  54. Angel, S.; Sanchez, B.; Marcy, C. EIA Uses the Heat Content of Fossil Fuels to Compare and Aggregate Energy Sources. Available online: https://www.eia.gov/todayinenergy/detail.php?id=40833# (accessed on 2 February 2023).
  55. Bekkering, J.; Broekhuis, T.A.; van Gemert, W.J.T. Operational Modeling of a Sustainable Gas Supply Chain. Eng. Life Sci. 2010, 10, 585–594. [Google Scholar] [CrossRef]
  56. Estevez, M.M.; Sapci, Z.; Linjordet, R.; Schnürer, A.; Morken, J. Semi-Continuous Anaerobic Co-Digestion of Cow Manure and Steam-Exploded Salix with Recirculation of Liquid Digestate. J. Environ. Manag. 2014, 136, 9–15. [Google Scholar] [CrossRef] [PubMed]
  57. Zeb, I.; Ma, J.; Frear, C.; Zhao, Q.; Ndegwa, P.; Yao, Y.; Kafle, G.K. Recycling Separated Liquid-Effluent to Dilute Feedstock in Anaerobic Digestion of Dairy Manure. Energy 2017, 119, 1144–1151. [Google Scholar] [CrossRef]
  58. Williams, R.; Ely, C.; Martynowicz, T.; Kosusko, M. Evaluating the Air Quality, Climate, and Economic Impacts of Biogas Management Technologies; United States Environmental Protection Agency: Washington, DC, USA, 2016. [Google Scholar]
  59. EPA. Landfill Gas Energy Cost Model User’s Manual Version 3.5; U.S Energy Information Administration: Washington, DC, USA, 2021.
  60. Møller, H.; Lund, I.; Sommer, S.G. Solid–Liquid Separation of Livestock Slurry: Efficiency and Cost. Bioresour. Technol. 2000, 74, 223–229. [Google Scholar] [CrossRef]
  61. NRCS. Costs Associated with Development and Implementation of Comprehensive Nutrient Management Plans; U.S. Department of Agriculture: Washington, DC, USA, 2003.
  62. Chastain, J.P. Covers: A Method to Reduce Odor from Manure Storages; Clemson University: Clemson, SC, USA, 2008. [Google Scholar]
  63. EIA. Electric Power Monthly. Available online: https://www.eia.gov/electricity/monthly/epm_table_grapher.php?t=epmt_5_6_a (accessed on 1 March 2021).
  64. EPA. Renewable Identification Numbers (RINs) under the Renewable Fuel Standard Program. Available online: https://www.epa.gov/renewable-fuel-standard-program/renewable-identification-numbers-rins-under-renewable-fuel-standard (accessed on 2 February 2023).
  65. EPA. RIN Trades and Price Information. Available online: https://www.epa.gov/fuels-registration-reporting-and-compliance-help/rin-trades-and-price-information#:~:text=Price%3A%240.05%26Max.Price%3A%243.50 (accessed on 2 February 2023).
  66. California Air Resources Board. Low Carbon Fuel Standard. Available online: https://ww2.arb.ca.gov/our-work/programs/low-carbon-fuel-standard (accessed on 2 February 2023).
  67. California Air Resources Board. Weekly LCFS Credit Transfer Activity Reports. Available online: https://ww2.arb.ca.gov/resources/documents/weekly-lcfs-credit-transfer-activity-reports (accessed on 2 February 2023).
  68. Hamby, D.M. A Review of Techniques for Parameter Sensitivity Analysis of Environmental Models. Environ. Monit. Assess. 1994, 32, 135–154. [Google Scholar] [CrossRef]
  69. EIA. Heat Content of Natural Gas Consumed. Available online: https://www.eia.gov/dnav/ng/ng_cons_heat_a_EPG0_VGTH_btucf_a.htm (accessed on 1 March 2021).
  70. World Bank Group. Commodity Markets Outlook: Causes and Consequences of Metal Price Shocks, April 2021; World Bank: Washington, DC, USA, 2021. [Google Scholar]
  71. Seaman, J.S.; Fangman, T.J. Biosecurity for Today’s Swine Operation. Available online: https://extension.missouri.edu/publications/g2340 (accessed on 11 April 2023).
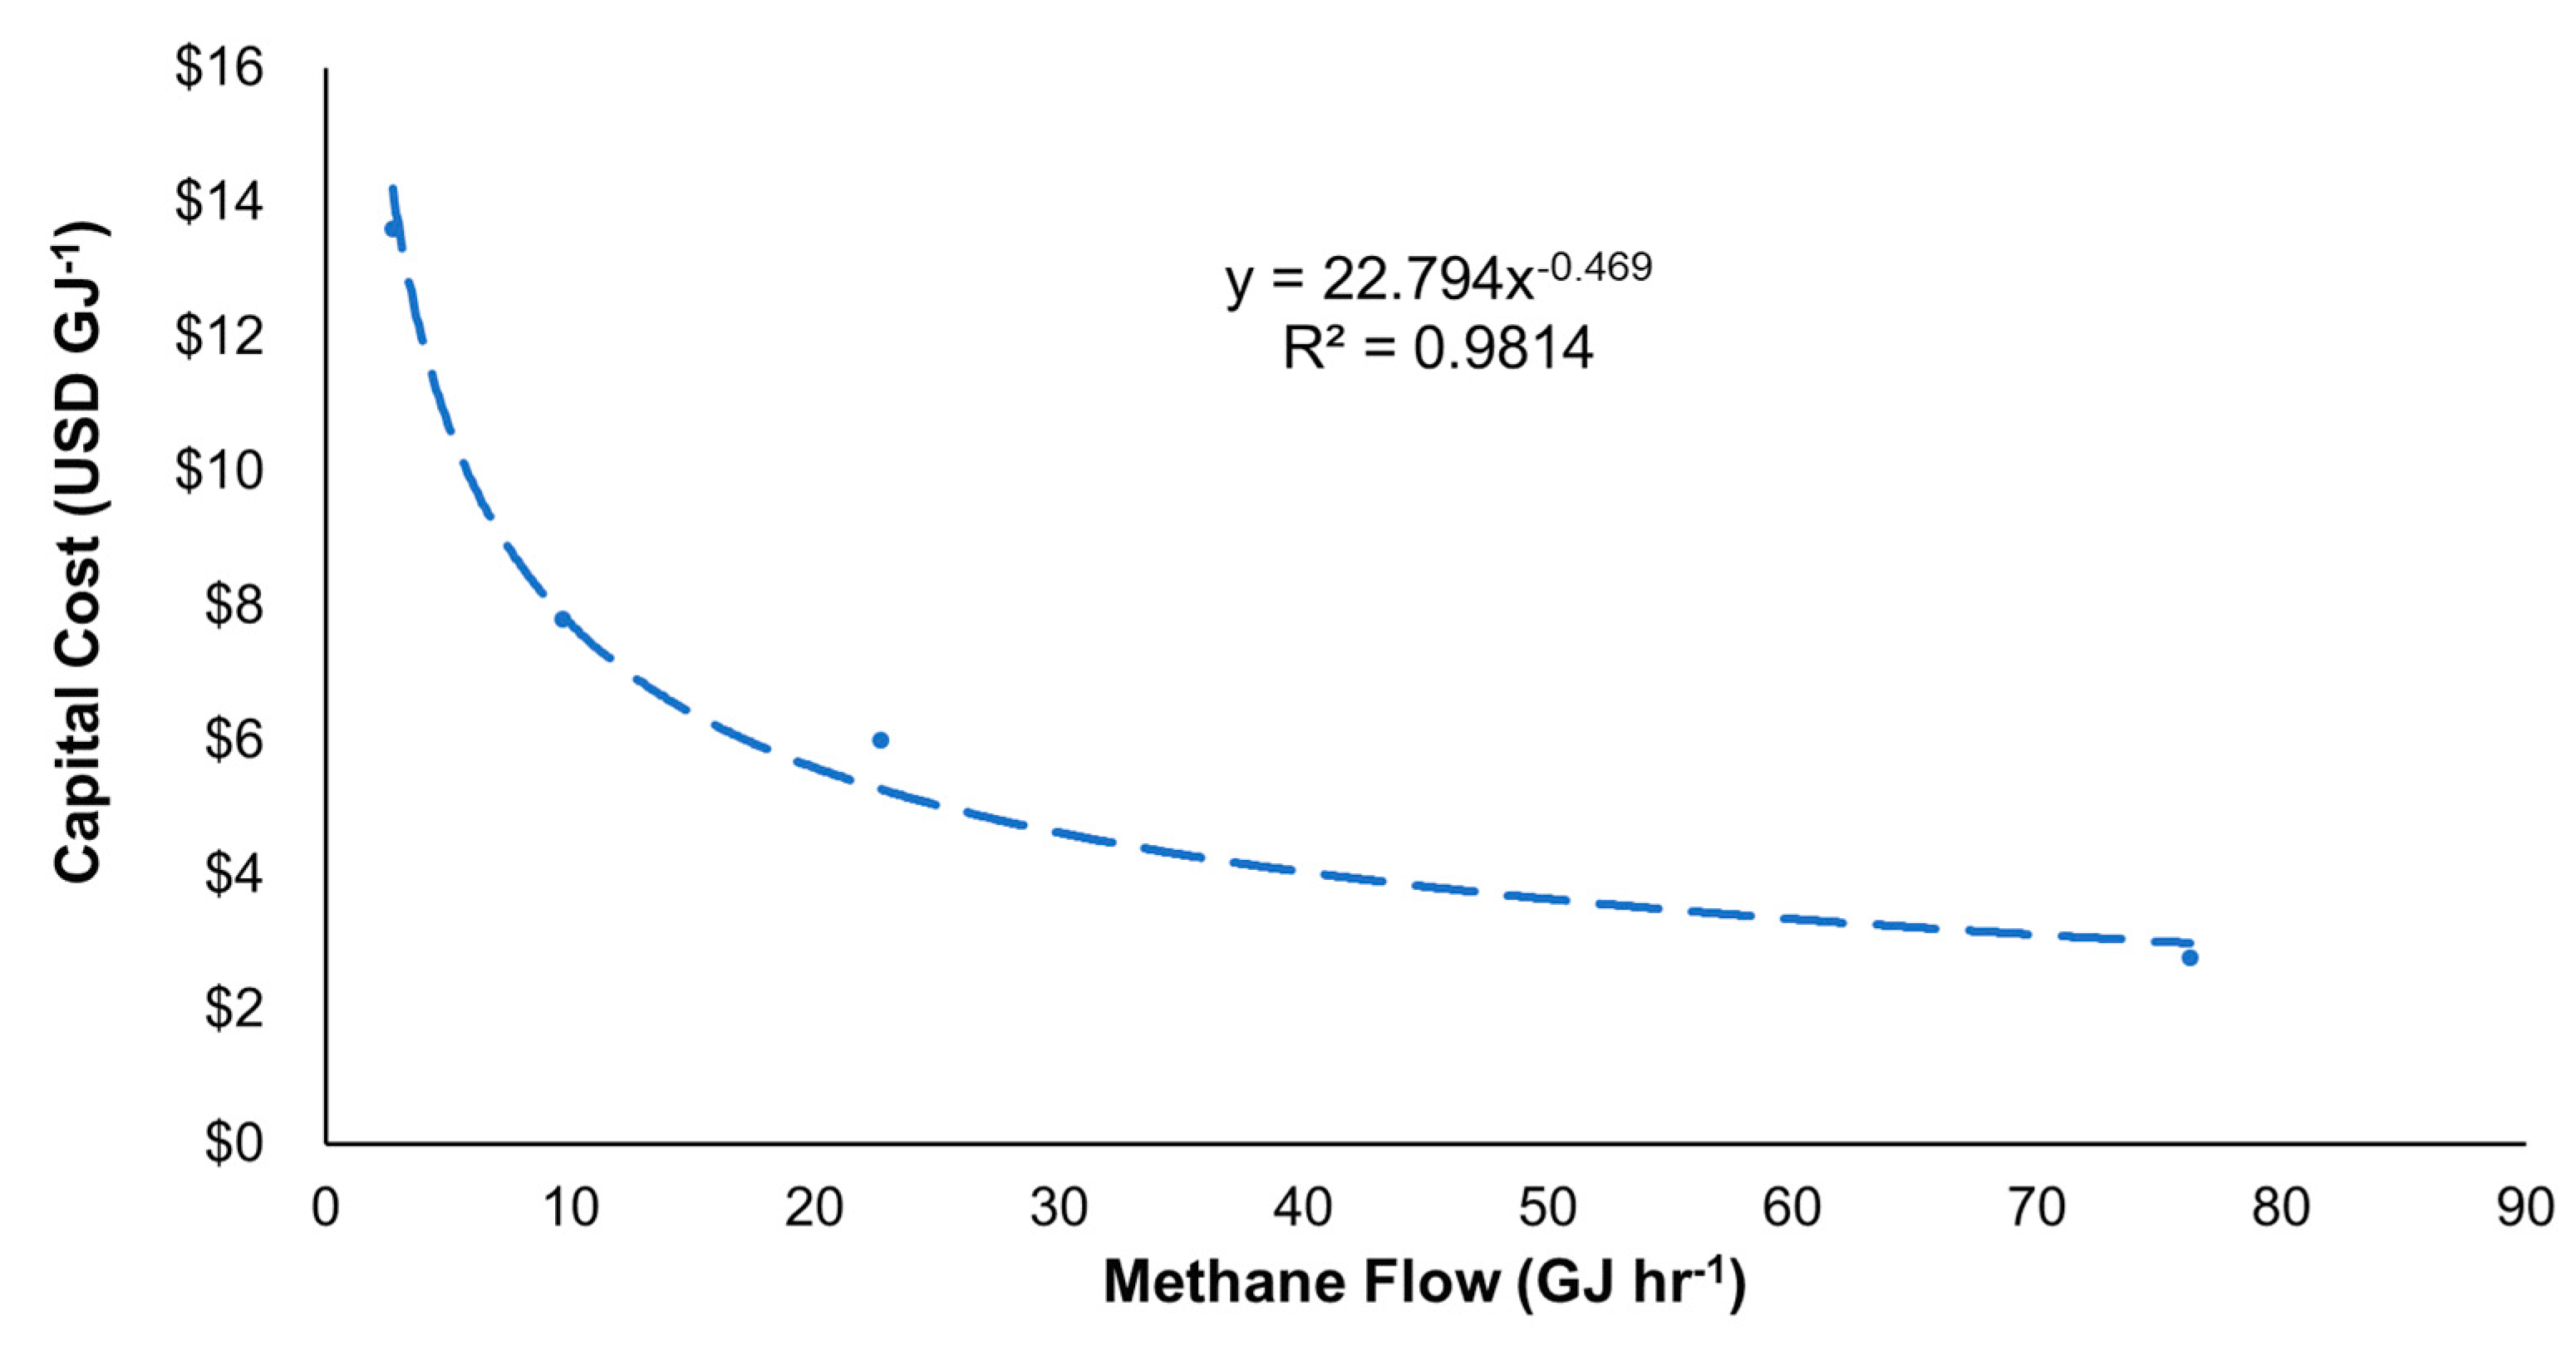
Figure 1. Upgrading and Injection Capital Cost. The capital cost for upgrading and injection was adapted from four cost estimates in Williams et al. [58]. A dashed line is included to show the relationship between cost and scale used to calculated upgrading and injection capital costs in this work.
Energies 16 04315 g001
Figure 2. Iowa Citygate Natural Gas Price. The average annual Citygate price for Iowa from 1984–2022 (nominal dollars) is shown. The 2016–2019 average (denoted with the dashed line) was used as a comparison in this paper.
Energies 16 04315 g002
Figure 3. The calculated minimum selling prices before and after applying low-carbon fuel standard (LCFS) and renewable identification number (RIN) credits in 2019 USD per GJ for each scenario is compared to the cost of natural gas in Iowa. S1 = single digester, stover amended; S2 = S1 w/water and stover amended; S3 = S2 w/centralized upgrading; S4 = centralized digester/upgrading, water and stover amended.
Energies 16 04315 g003
Figure 4. The effect of biogas transportation distance to the centralized cleaning and injection on the overall cost in S3 is shown to be calculated using three different pipeline capital cost assumptions [26,59]. The effect of manure transportation distance on the overall cost of S4 is also shown for comparison.
Energies 16 04315 g004
Figure 5. Sensitivity analysis results. The sensitivity coefficients, calculated as percent change result from a 1% change in input value for the ten most sensitive assumptions in the most cost-competitive scenario (S4, centralized digester/upgrading, water and stover amended), is shown.
Energies 16 04315 g005
Figure 6. The minimum selling price in S4 is explored under differing LCFS and RIN credit values. The shaded portions of the graph show when the minimum selling price of S4 is less than the Citygate price of natural gas in Iowa [9].
Energies 16 04315 g006
Table 1. Summary of Modeled Scenarios: Total solids (TS); Anaerobic Digester (AD).
ParameterS1S2S3S4
Farm size4800 pigs4800 pigs4800 pigs5 farms of 4800 pigs
Location of digesterOn-farmOn-farmOn-farmCentralized location: 2.5 miles from 5 farms
Water additionNoneEquivalent to manure volumeEquivalent to manure volumeEquivalent to manure volume
Corn stoverAdded to 12% AD TSAdded to 12% AD TSAdded to 12% AD TSAdded to 12% AD TS
Biogas upgradingOn-farmOn-farmCentralized location: 2.5 miles from 5 farmsAt centralized AD site
Table 2. Biomass Use/Land Application Balance. S1 = single digester, stover amended; S2 = S1 w/water and stover amended; S3 = S2 w/centralized upgrading; S4 = centralized digester/upgrading, water and stover amended.
UnitS1S2S3S4
Corn stover demandMg yr−1375150015007500
Corn stover harvest rateMg ha−16.76.76.76.7
Corn stover harvest land requirementha yr−1562232231116
Digestate nitrogen contentMg yr−146.35353265
Land application requirementha yr−12753153151576
Portion of land application area needed for stover harvest 20%71%71%71%
Table 3. Capital Cost Calculations in 2019 United States Dollars (USD).
ParameterCalculationComment
AD cost C D = $ 9900 × V 0.59 C D = capital cost of digester
V = volume of digester, m3
Adapted from Faulhaber et al. [12]
S1 and S2 pipeline costUSD 600,000Pipeline for RNG to injection point: EPA [59] suggestion for pipelines shorter than 1.6 km
S3 pipeline costUSD 620,000 km−1Pipeline for raw biogas to centralized upgrading and injection point: EPA [59] suggestion for pipelines longer than 1.6 km
LagoonUSD 7.34 m−3 (lagoon)
USD 11 m−2 (cover)
Storage calculated for one year of manure volume
Upgrading and injection C U I = 22.794 × x 0.469 x = methane   flow   to   the   equipment ,   GJ   hr 1  
C U I = Unit capital cost of the upgrading and injection equipment, USD GJ−1
Adapted from Williams et al. [58]
S3 biogas compressor C B C = $ 173.5 × 0.23 B C B C   = Investment cost of biogas compressor, USD 1000 s
B = hourly biogas flow, m3 hr−1
Adapted from Hengeveld et al. [26]
S3 biogas dewatering and H2S removalUSD 7800Adapted from Hengeveld et al. [26]
Screw press costUSD 18,890Adapted from Møller et al. [60]: assumed one needed in S1–S3, five needed in S4
Interest rate7%Assumption
Project lifetime15 yearsAssumption
Table 4. Operating Costs in 2019 USD.
ParameterValueNote
Manure costUSD 86.40 m−3Based on the plant-available nitrogen content of the manure, discussed in Section 2.2
Corn stover costUSD 51 Mg−1From Edwards [45]; range discussed in Section 2.2 and explored in Section 3.5
S4 manure transportation C M T   $   Mg 1 = $ 0.27 d + $ 2.88 d = two-way transportation distance, km
Adapted from Ghafoori et al. [35]
LaborUSD 0.08 m−3 biogas productionAdapted from Aui and Wright [39]
Upgrading and injection, O and MUSD 42,400 m−3 min−1Annual cost based on capacity; adapted from EPA [59]
Solid digestate handlingUSD 5 Mg−1Aui and Wright [39]
Digester energy demand1.234 Mg m−3 biogasHengeveld et al. [26]
Screw press energy demand0.53 kWh Mg−1 digestateMøller et al. [60]
Energy costUSD 0.0689 kWh−1Iowa industrial energy cost [63]
Other maintenance10% of capitalApplied to all capital costs, except upgrading and injection
Table 5. Summary of digester size and annual inputs and outputs for the four modeled scenarios. S1 = single digester, stover amended; S2 = S1 w/water and stover amended; S3 = S2 w/centralized upgrading; S4 = centralized digester/upgrading, water and stover amended.
ParameterS1S2S3S4
Digester size (m3)1.22 × 1033.68 × 1033.68 × 10318.4 × 103
Manure processed (m3 yr−1)73407340734036,700
Corn stover processed (Mg yr−1)375150015007500
Solid digestate produced (Mg yr−1)6.46 × 1051.45 × 1061.45 × 1067.17 × 106
Biogas (m3 yr−1)2.64 × 1054.77 × 1054.77 × 1052.39 × 106
Methane (m3 yr−1)1.53 × 1052.78 × 1052.78 × 1051.39 × 106
Energy (GJ yr−1)578010,50010,50052,300
Table 6. Overall and component costs of energy from each digester scenario. S1 = single digester, stover amended; S2 = S1 w/water and stover amended; S3 = S2 w/centralized upgrading; S4 = centralized digester/upgrading, water and stover amended.
Costs (USD GJ−1)S1S2S3S4
ManureUSD 7.66USD 4.24USD 4.24USD 4.24
Corn stoverUSD 3.31USD 7.32USD 7.32USD 7.32
Manure transportUSD 0.00USD 0.00USD 0.00USD 9.78
CapitalUSD 53.91USD 42.38USD 53.63USD 18.15
Operating costsUSD 10.33USD 9.93USD 12.13USD 8.58
MSP (pre-credit)USD 75.20USD 63.87USD 77.32USD 48.08
Digestate creditUSD −7.87USD −4.69USD −4.69USD −4.69
RINUSD −23.63USD −23.63USD −23.63USD −23.63
LCFSUSD −21.02USD −15.79USD −15.79USD −15.79
MSP (including credits)USD 22.68USD 19.75USD 33.20USD 3.96
Table 7. Unit capital costs by component (USD GJ−1) for each scenario. S1 = single digester, stover amended; S2 = S1 w/water and stover amended; S3 = S2 w/centralized upgrading; S4 = centralized digester/upgrading, water and stover amended.
ComponentS1S2S3S4
DigesterUSD 14.00USD 14.83USD 14.83USD 7.67
Upgrading and injectionUSD 38.19USD 26.60USD 9.54USD 9.54
Biogas transportUSD 0.00USD 0.00USD 28.31USD 0.00
Storage and separationUSD 1.71USD 0.95USD 0.95USD 0.95
TotalUSD 53.91USD 42.38USD 53.63USD 18.15
Disclaimer/Publisher’s Note: The statements, opinions and data contained in all publications are solely those of the individual author(s) and contributor(s) and not of MDPI and/or the editor(s). MDPI and/or the editor(s) disclaim responsibility for any injury to people or property resulting from any ideas, methods, instructions or products referred to in the content.