Abstract
Liquefying hydrogen is an efficient way to store and transport hydrogen. However, the hydrogen liquefaction process is energy intensive. Therefore, an integrated liquefaction process of hydrogen and natural gas utilizing the mixed refrigerant cycle and the hydrogen Claude cycle is proposed. The process not only couples a steam methane reforming process to produce hydrogen and a carbon dioxide refrigeration cycle to assist in pre-cooling, but also employs a solar energy absorption refrigeration system to enhance energy efficiency. The proposed process is simulated and optimized using HYSYS and the particle swarm optimization algorithm, and energy, exergy, and economic analyses are performed. The energy analysis shows that the specific energy consumption of the proposed process is 5.2201 kWh/kg, a reduction of 10.67% compared to the base case. The exergy loss and exergy efficiency are 64,904 kW and 62.21%, which are 13.63% and 6.63% lower than the base case, respectively. The economic analysis shows that the total annualized cost of the process is USD 28.6 million per year. The proposed integrated liquefaction process not only realizes the high efficiency of energy utilization but also follows the development trend of integrated energy systems.
1. Introduction
Currently, the largest share of the world’s energy system is still fossil energy, such as oil and coal. However, fossil energy sources have brought environmental problems while meeting global economic development [1,2]. As a green, sustainable, and emission-free secondary energy source, hydrogen (H2) can solve problems such as environmental pollution, and will play an important part in the energy system [3]. However, the problem of H2 storage and transportation must be solved in order to achieve the massive use of H2 in the future. At present, high-pressure gaseous storage, low-temperature liquid storage, and solid-state storage are the major storage approaches for H2, among which low-temperature liquid storage is the only storage method that meets the U.S. Department of Energy’s target for on-board H2 storage [4]. At 1 bar pressure, liquid hydrogen (LH2) has an energy density per unit volume of 8.5 MJ/L and a volume density 800 times higher than that of H2, making it very easy to store and transport [5,6]. Nevertheless, H2 liquefaction requires a great deal of energy and is an energy-intensive process. Therefore, the development of a more efficient H2 liquefaction process is essential.
The basic H2 liquefaction processes are the liquid nitrogen (LN2) pre-cooling Linde-Hampson liquefaction process, the LN2 pre-cooling H2 Claude liquefaction process, and the helium-cooled liquefaction process. Based on these liquefaction processes, the literature has designed many conceptual H2 liquefaction processes, which are primarily classified into the LN2 pre-cooled liquefaction process, the helium (He) pre-cooled liquefaction process, the mixed refrigerant (MR) pre-cooled liquefaction process, and the liquefied natural gas (LNG) cold energy pre-cooled liquefaction process based on the pre-cooling method [7]. Moreover, in recent years, improving the energy efficiency of the H2 liquefaction process through renewable energy has become a hot research topic.
Table 1 provides the performance parameters of commercial and conceptual H2 liquefaction processes. The currently operating commercial H2 liquefaction process has a high specific energy consumption (SEC) and a low exergy efficiency (EXE). For the conceptual H2 liquefaction process with LN2 pre-cooling, the SEC is between 7–11 kWh/kg. However, LN2 pre-cooling processes are built near air separation plants to avoid LN2 production and transportation costs [8]. Compared to the conceptual H2 liquefaction process with LN2 and He pre-cooling, the H2 liquefaction process with MR pre-cooling exhibits a lower SEC because of the wider refrigeration temperature of MR. Additionally, conceptual H2 liquefaction processes coupling renewable energy sources have high energy efficiency, such as the process designed by Yilmaz [9], which has an EXE of 78.3%. Therefore, the use of MR pre-cooling and renewable energy is an attractive way to increase the energy efficiency of the H2 liquefaction process.

Table 1.
Comparative results of commercial and conceptual H2 liquefaction processes.
Undoubtedly, the conceptual H2 liquefaction processes currently designed have been significantly improved in terms of energy efficiency. However, some equipment used in conceptual H2 liquefaction processes exhibits negative values of exergy loss, such as the processes designed in the studies of [21,23]. Furthermore, the H2 liquefaction processes coupled with steam methane reforming (SMR) to H2, such as the process designed by the study of [25], not only exhibits a high SEC (11.05 kWh/kg) but the by-product of carbon dioxide (CO2) from SMR is directly emitted into the atmosphere, which has an environmental impact. A similar problem exists in the process designed by Bi and Ju [32]. Therefore, these issues need to be effectively addressed in the development of a conceptual H2 liquefaction process. Furthermore, as the global energy system moves toward decarbonization, LNG and LH2 will both take on significant roles in the future. Therefore, it is necessary to design an integrated liquefaction process to achieve the simultaneous liquefaction of natural gas (NG) and H2, which will improve the efficiency of energy utilization. However, it was found that an integrated process to liquefy H2 and NG simultaneously by coupling H2 production and renewable energy sources has rarely been studied.
As a result, an integrated liquefaction process of H2 and NG with an MR cycle and H2 Claude cycle is proposed and optimized in this paper. The novelty of the proposed process is not only the coupling of SMR to H2 and to a solar energy absorption refrigeration system (ARS), but also the utilization of the CO2 refrigeration cycle to assist pre-cooling to reduce the environmental impact of the CO2 by-product. The proposed integrated liquefaction process is first modeled employing HYSYS V10 to explore whether the conceptual model is doable. The particle swarm optimization (PSO) algorithm is then applied to optimize the process. Finally, energy analyses, exergy analyses, and economic analyses are carried out to evaluate the performance of the process. The proposed integrated liquefaction process not only realizes the high efficiency of energy utilization, but also follows the development trend of integrated energy systems.
2. Process Description
2.1. Overall Configuration
The overall structure of the proposed process is presented in Figure 1, which includes a pre-cooling unit, a sub-cooling unit, an ARS unit, an H2 production unit, and a liquefaction unit. The liquefaction unit includes H2 liquefaction and NG liquefaction. The pre-cooling unit uses the MR cycle and the CO2 cycle to reduce the temperature of H2 to −192 °C and the temperature of NG to −157 °C. The sub-cooling unit utilizes the H2 Claude cycle to eventually reduce the temperature of the H2 to −253 °C. After that, the H2 and NG are depressurized to 110 kPa by expanders to complete the liquefaction. The H2 production unit utilizes the SMR process. The ARS uses solar energy as a heat source to improve the utilization of renewable energy. During H2 liquefaction, the conversion of ortho-H2 to para-H2 is carried out by a four-stage adiabatic ortho-para H2 conversion (OPC). Ultimately, the LH2 is obtained with a para-H2 concentration of 96.48%.
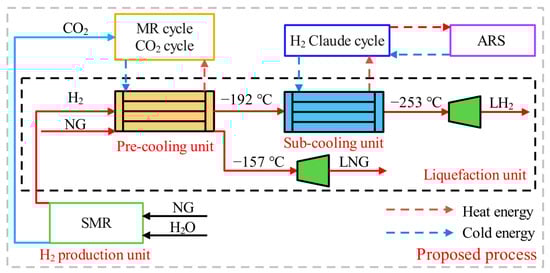
Figure 1.
The overall structure of the proposed process.
2.2. Proposed Process
Figure 2 provides a flow chart of the proposed process, including the MR cycle, CO2 cycle, H2 Claude cycle, ARS cycle, SMR process, H2 liquefaction unit, and NG liquefaction unit. In the H2 liquefaction unit, H2 (stream H1) from the SMR process is first pressurized to 2100 kPa by the compressor (C8). The cooler (E8) then reduces the temperature of H2 (stream H2) to 25 °C. Subsequently, the pre-cooling heat exchangers HX1 and HX2 pre-cool the temperature of H2 (stream H3) to −192 °C. After pre-cooling, the sub-cooling heat exchangers HX3, HX4, and HX5 further lower the temperature of H2 (stream H7) to −253 °C. Finally, H2 (stream H11) is liquefied when the pressure is reduced to 110 kPa in the expander (EX9). During H2 liquefaction, OPC is performed in reactors R1, R2, R3, and R4. In the NG liquefaction unit, the HX1 and HX2 cool the temperature of NG (stream NG1) to −157 °C. The expander (EX4) then reduces the pressure of the sub-cooled NG (stream NG3) to 110 kPa. Finally, the stream NG4 undergoes phase separation in the separator (S3) and completes the liquefaction. In the MR cycle, the separator (S2) first separates the pressurized MR (stream PR1) into a gas phase (stream PR3) and a liquid phase (stream PR2) refrigerant. Afterward, the HX1 and HX2 lower the temperature of the stream PR3 to −193 °C. Next, after the expander (EX3) reduces the pressure of stream PR10, stream PR11 enters HX2 for full heat exchange with the hot fluid. For refrigerant stream PR2, the HX1 first reduces its temperature to −30 °C. After the expander (EX1) decreases the pressure of stream PR4, the outlet stream PR5 of EX1 then enters HX1 to provide cold energy. Finally, the two streams of refrigerant enter different compression units to increase the same evaporation pressure. In the CO2 cycle, the by-product CO2 of the SRM process is used as a refrigerant and is cooled to 25 °C by a cooler after a three-stage pressurization. The HX1 then further reduces the temperature of the refrigerant CO2 to −30 °C. Finally, after the CO2 is decompressed by the expander (EX2), the low-temperature and low-pressure refrigerant CO2 goes to HX1 for heat exchange.
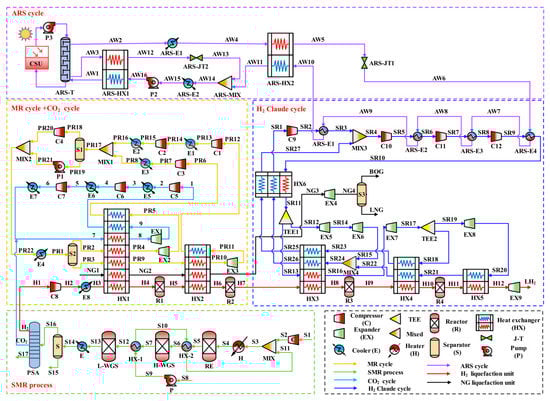
Figure 2.
Flow chart of the proposed process.
In the H2 Claude cycle, the HX6 first cools the temperature of the sub-cooling refrigerant (stream SR11) to −171.60 °C. The TEE1 then splits stream SR11 into two streams of refrigerant (stream SR12 and stream SR13). Stream SR12 mixes with stream SR22 in MIX4 after being depressurized by the expanders EX5 and EX6. After mixing, the outlet stream SR24 of MIX4 exchanges heat with the hot fluid through HX3. Meanwhile, the HX3 first reduces the temperature of stream SR13 to −221.00 °C. The expander EX7 then drops the pressure of stream SR16 to 352.29 kPa. Subsequently, stream SR17 enters TEE2 and is split into two streams of refrigerant (stream SR18 and stream SR19). Stream SR18 flows directly into HX4 to provide cold energy, and stream SR20 enters HX5 for heat exchange after being depressurized by expander EX8.
In the ARS cycle, solar energy is first converted into thermal energy to heat the circulating water by the collector-storage unit (CSU). The heated circulating water is then pressurized by pump (P3) and enters the absorption tower (ARS-T) to heat the ammonia-water solution. The ammonia (stream AW2) leaving the top of the ARS-T first enters the cooler (ARS-E1), where its temperature is cooled to 25 °C. The temperature of stream AW4 is then further cooled to −30 °C within the ARS-HX2. Subsequently, stream AW5 is depressurized by the throttle valve (ARS-JT1) and cools the refrigerant at the compressor outlet through ARS-E4, ARS-E3, ARS-E2, and ARS-E1. Immediately afterward, stream AW10 is returned to the ARS-HX2 to cool itself. Finally, stream AW11 is mixed with stream AW13 to provide cold energy to ARS-HX1.
In the SMR process, NG (stream S1) and H2O (stream S8) are first pressurized to the same reforming pressure, and then H2O (stream S9) is heated to a gaseous state in HX-1 and HX-2 to recover the waste heat. Subsequently, stream S2 and stream S11 are mixed and enter the heater (H) to be heated to a reforming temperature before entering the reforming reactor (RE) for reaction. In the reforming stage, CH4 reacts with H2O to form carbon monoxide (CO) and H2. Immediately afterward, stream S6 enters a high-temperature water gas shift reactor (H-WGS) and a low-temperature water gas shift reactor (L-WGS) to further convert CO to H2. After conversion, the temperature of stream S13 is cooled to 25 °C by the cooler (E), and then enters the separator (S) for water separation. Finally, the syngas containing a large amount of H2 (stream S16) enters the pressure swing adsorption (PSA) for purification.
In the SMR process, the following reactions occur in RE:
CH4 + H2O = CO + 3H2 ∆H298K = +206 kJ/mol
The following reactions occurred in H-WGS and L-WGS:
CO + H2O = CO2 + H2 ∆H298K = −41 kJ/mol
In the SMR process, the conversion of CH4 is 85% due to thermodynamic limitations [33]. Furthermore, to simplify the purification of H2, the component separator in HYSYS is utilized to simulate a PSA unit. The composition of NG is shown in Table 2, reference [34]. In this paper, the H2 yield of the SMR process is about 42.48%. The flow rate of the H2 produced by the SMR process is set to 3.5 kg/s. Therefore, the NG consumption is 9.43 kg/s.
Table 2.
The composition and ratio of NG.
3. Process Simulation and Optimization
3.1. Conditions and Assumptions
The HYSYS V10 is used to simulate the process and the famous Peng-Robinson equation of state is used to calculate the physical parameters, which are widely used in the design of conceptual H2 liquefaction processes to prove that the process is technically feasible, as in the literature [13,14,18,19,20,21,22,23,26,30,31,34,35]. The flow rate, temperature, and pressure of the feed NG are 12,600 kg/h, 25 °C, and 5500 kPa, respectively. The composition of NG is presented in Table 2. The pressure of feed H2 is 2100 kPa, and the flow rate and temperature are the same as the NG. In addition, the simulation assumptions within Table 3 of the existing literature are implemented. In this paper, for subsequent discussion and analysis, the pre-optimized process is called the base case, and the post-optimized process is called the proposed process.
Table 3.
Simulation assumptions.
3.2. Ortho-Para Hydrogen Conversion
H2 consists of ortho-H2 and para-H2, where the nuclear spins of ortho-H2 are in the same direction, while para-H2 has the opposite spin direction. The percentage concentration of ortho-H2 and para-H2 is 75%:25% at ambient temperature [5]. When the temperature drops, ortho-H2 will automatically shift to para-H2 because of the higher energy of ortho-H2. The percentage concentration of para-H2 in LH2 is about 100% when the temperature is reduced to 20 K. However, the conversion of ortho-H2 to para-H2 will yield a heat of 527 kJ/kg, which is greater than the potential heat of vaporization of H2 (452 kJ/kg). When LH2 is stored as ortho-H2 for a longer period, LH2 will be lost by 50% after 10 days [37]. Thus, OPC must be set to facilitate the conversion of ortho-H2 to para-H2 during H2 liquefaction. In this paper, four stages of adiabatic OPC are set in different temperature intervals. Equation (3) is the OPC conversion equation.
ortho-H2 → para-H2 + Heat
Based on the available literature, this paper employs the reactor within HYSYS for adiabatic OPC. The conversion (Con) rate of the reactor is temperature dependent, as given in Equation (4).
where C0, C1, and C2 are conversion factors, and T is the temperature (K). When the temperature is changed, the concentration of para-H2 in the equilibrium H2 has to be changed as well. Therefore, it is necessary to tune the above conversion factors to ensure that the concentration of pata-H2 is in agreement with the data provided by Harkness et al. [38]. The same approach can be found in the literature [20,21].
3.3. Process Optimization
In this paper, the process is globally optimized using SEC as the objective function, which is the ratio of the actual energy consumption of the process to the product flow rate, as in Equation (5):
where X is the optimization variable, WCi and WPk are the input work of the compressor and pump, kW, WEXj is the output work of the expander, kW, and m is the mass flow rate, kg/h.
The SEC of the process is mainly influenced by the mass flow rate and the pressure of the refrigerant. Therefore, these parameters are selected as optimization variables. Furthermore, for the optimized HYSYS-built process to converge, the constraints within Table 4 need to be set.
Table 4.
The constraint condition.
To enhance the optimization efficiency, the constraints within Table 4 are added to the objective function using the penalty function in this paper, as shown in Equation (6):
where α is the penalty factor, which takes a fixed value of 20,000. The gi(X) is the constraint function, as shown in Table 5.
Table 5.
Constraint functions.
The PSO algorithm is a population-based intelligent optimization algorithm with the features of simplicity, rapid convergence, and fewer adjustment parameters. Therefore, this paper optimizes the process using the PSO algorithm, and a description of the PSO algorithm can be found in the literature [34]. During optimization, to achieve data interoperability, MATLAB first connects with HYSYS V10 through the Active X component. The PSO algorithm is then invoked to optimize the parameters. The framework of the PSO algorithm to optimize the process is presented in Figure 3, and the adjustment parameters of the PSO algorithm are given in Table 6.
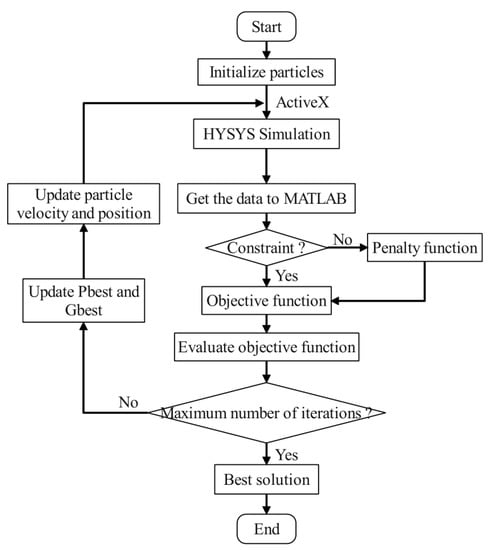
Figure 3.
The framework for the PSO algorithm to optimize the process.
Table 6.
The adjustment parameters of the PSO algorithm.
4. Results and Discussions
4.1. Energy Analysis
Figure 4 shows the SEC of the base case and the proposed process. In the proposed process, the SECs of the pre-cooling cycle and the sub-cooling cycle are 1.3504 kWh/kg and 3.8696 kWh/kg, which are 15.31% and 9.77% lower than the base case. The total SEC of the proposed process is 5.2201 kWh/kg, a reduction of 10.67%. The optimization variables for the base case and the proposed process are shown in Table 7. For the MR cycle, the largest increase in refrigerant flow rate after optimization is C2, with a 9.31% increase, followed by a 6.50% increase in the flow rate of refrigerant C3. Conversely, the refrigerant H2 shows the largest decrease in flow rate, at 66.59%, while the total refrigerant flow rate increased by 0.76%. Despite the increase in the total refrigerant flow rate after optimization, the evaporation pressure of the refrigerant decreased by 15.44%, and the condensation pressure increased by 12.90% and 18.46%. Thus, the change in pressure leads to a lower SEC of the process. For the CO2 cycle, the refrigerant flow rate is optimized to be 35.11% lower, while the condensation pressure is reduced by 46.84%, compensating for the lack of cooling energy due to the lower refrigerant flow rate. For the H2 Claude cycle, after optimization, the total refrigerant flow rate was reduced by 6.64%. Moreover, the evaporation pressure decreased by 6.12%, and the condensation pressure increased by 2.06% and 6.68%, respectively. Changes in flow rate and pressure result in a lower SEC for the sub-cooling cycle. The above analysis shows that optimizing the process is necessary, although the knowledge-based process allows the process to operate safely when the constraints are met; the SEC of the process is not the lowest.
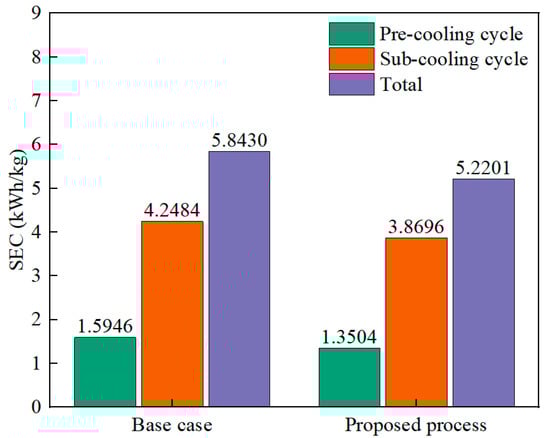
Figure 4.
The SEC of the base case and proposed process.
Table 7.
Optimization variables of the base case and proposed process.
4.2. Composite Curve Analysis
The temperature-heat flow composite curve (THCC) of the heat exchanger characterizes the trend of the temperature of the cold and hot fluid with the total heat flow. The narrower the spacing of THCC, the higher the heat transfer efficiency of the heat exchanger. The temperature difference composite curve (TDCC) of the heat exchanger represents the trend of the approach temperature (AT) of the cold and hot fluid. The smaller AT improves the heat transfer efficiency when MITA is satisfied. Figure 5 and Figure 6 present the THCC and TDCC of the heat exchanger for the proposed process, where the yellow region in the figure represents the constraint MITA (1–3 °C). In a heat exchanger, the minimum AT of the heat exchanger is called MITA. Ideally, the performance of the heat exchanger is better when all ATs are in this region. However, some of the ATs are usually out of the 1–3 °C range due to the thermal properties of the refrigerant and the thermodynamic conditions, but the liquefaction process is still feasible in this case.
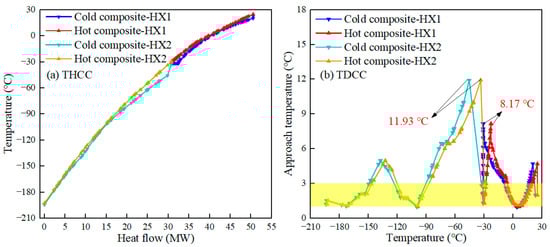
Figure 5.
THCC and TDCC of the HX1 and HX2 in the proposed process.
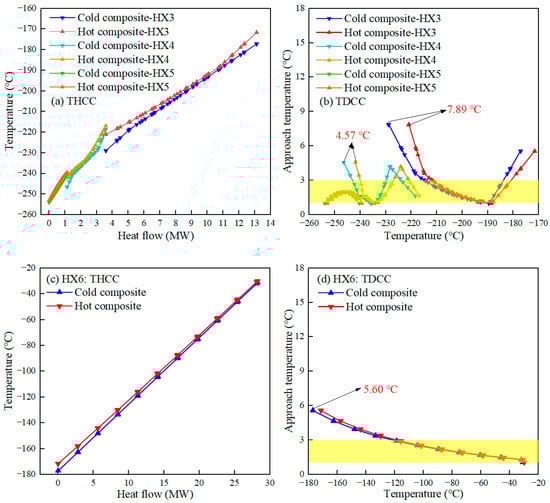
Figure 6.
THCC and TDCC of the HX3–HX6 in the proposed process.
From Figure 5a, it can be seen that in the middle region of HX1, the THCC has a smaller spacing, while at the cold end of HX1, the THCC displays a larger spacing due to the presence of pure refrigerant CO2. Even though the use of CO2 cycle-assisted pre-cooling resulted in a larger spacing at the cold end of HX1, the purpose of using this refrigeration cycle is to reduce the SMR process by-product CO2 emission and thus mitigate its environmental impact. Figure 5a shows that the cold end and the middle region of HX2 have a small spacing, while the hot end of HX2 has a larger spacing. For TDCC, Figure 5b shows that the peak values of AT are lower for HX1 and HX2, indicating that both HX1 and HX2 have better heat transfer performance.
From Figure 6a, it is clear that the two ends of the THCC of HX3 still have a large spacing. This is because the temperature of H2 is raised by the exothermic OPC, but the refrigerant, which always remains in the gas phase, cannot provide the cold energy to match it. Furthermore, the HX4 and HX5 have a smaller spacing of THCC, especially HX5, where THCC almost overlaps, which is attributed to the optimal refrigerant flow rate and pressure providing reasonable cold energy. For TDCC, Figure 6b suggests that the AT of HX5 varies strictly between 1 °C and 3 °C, which improves the heat transfer efficiency of HX5. Furthermore, the peak values of AT for HX3 and HX4 are smaller. Figure 6c shows that the spacing of THCC of HX6 is smaller, except between the cold ends of HX6. As shown in Figure 6d, the peak value of AT of TDCC of HX6 is 5.60 °C, which indicates that the heat transfer performance of HX6 is higher.
4.3. Exergy Analysis
For a given thermal system, exergy analysis is an essential method to find where exergy losses are greatest and to provide a basis for the subsequent optimization of the process structure. In a thermal system, when the kinetic and potential energy of the fluid is not considered, exergy is calculated as in Equation (7).
where the ex is the mass exergy, kJ/kg, h and s are the mass enthalpy and mass entropy, kJ/kg and kJ/(kg k), and h0 and s0 are the mass enthalpy and mass entropy at ambient temperature (298.15 K) and pressure (101.3 kPa). The exergy losses of the process mainly originate from compressors, coolers, heat exchangers, expanders and reactors, etc. The equations for calculating the exergy losses of these devices based on Equation (7) are shown in Table 8.
Table 8.
The equation for calculating the exergy loss of equipment.
The actual process is irreversible due to the additional work needed to overcome the energy loss. The irreversibility of the process is assessed by calculating the EXE of the process. A larger EXE indicates a lower irreversibility of the process. The EXE is calculated as shown in Equation (8):
where μex is the EXE, and are the exergies of the product and feed, kW, and Wtotal is the total energy consumption of the process, kW.
The exergy loss ratio shows the percentage of total exergy loss for each major piece of equipment, and is calculated as in Equation (9):
Based on the equations given in Table 8 and Equation (8), the exergy losses and EXE of three refrigeration cycles for the base case and the proposed process are calculated, and the results are presented in Figure 7. In the base case, the exergy losses of the pre-cooling cycle, sub-cooling cycle, and ARS cycle are 18,527 kW, 40,647 kW, and 15,971 kW, while the exergy losses of the three refrigeration cycles in the proposed process are reduced by 16.61%, 14.37%, and 8.27%. The total exergy loss of the proposed process is 64,904 kW, which is 13.63% lower than the base case. This is because the optimal refrigerant flow and pressure provide the matching cold energy. Furthermore, the sub-cooling cycle is the highest exergy loss after optimization, which accounts for 53.62% of the total exergy loss. This is due to the lower cooling temperature of the sub-cooling cycle, which is between −188 °C and −253 °C. Figure 7 also presents the EXE of the base case and the proposed process. In the proposed process, the EXEs of the pre-cooling cycle and sub-cooling cycle increase by 9.29% and 5.60%. The total EXE of the process is 62.21%, an improvement of 6.63%, indicating the proposed process’s high energy efficiency.
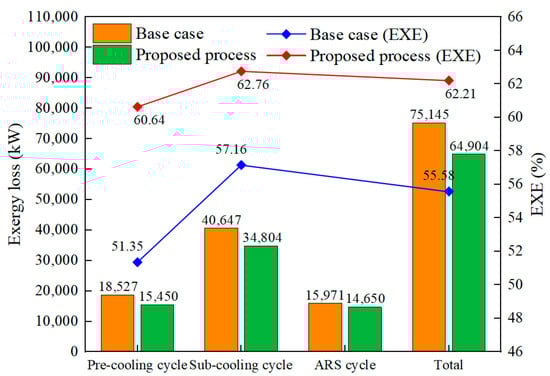
Figure 7.
Exergy loss and EXE of three refrigeration cycles in the base case and proposed process.
The exergy losses and exergy loss rates for the main equipment of the proposed process are shown in Figure 8. The equipment with the largest exergy loss is the heat exchanger due to the larger local AT, the exergy loss is 21,009 kW, and the exergy loss rate is 32.37%. The reactor has the highest exergy loss due to the use of adiabatic OPC, with an exergy loss of 17,601 kW (27.12%). The expander and compressor have low exergy losses, with exergy losses of 8880 kW (13.68%) and 6729 kW (10.37%), respectively. In the sub-cooling cycle, the temperature of the refrigerant at the compressor outlet is cooled using the ARS cycle. As a result, the exergy loss of the cooler is reduced to 5802 kW and the exergy loss rate is 8.94%.
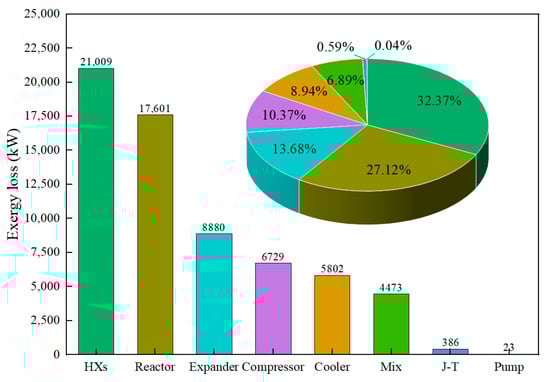
Figure 8.
The exergy loss and exergy loss rate of the main equipment for the proposed process.
4.4. Economic Analysis
For the proposed process, an economic analysis is conducted to assess the economics of the proposed integrated liquefaction process. The economics metrics include capital expenditures (CAPEX), operating expenditures (OPEX), and operations and maintenance (O&M) expenditures. Table 9 gives the formulae for CAPEX, OPEX, and O&M, where W is the power, and A is the area of the heat exchanger. Considering that HYSYS only provides UA values for the heat exchanger, A is therefore calculated using UA, where the U value is determined from the literature [32], with the value of U of 0.5 kW/(m2∙K). Furthermore, Z and t represent the annual interest rate and the payment period, respectively. Based on reference [39], Z and t are set to 0.07 and 20 years, respectively.
Table 9.
The equations and relationships of the economic indicators of the proposed process.
Based on the formula given in Table 9 to calculate the purchase cost of the equipment, the results are shown in Figure 9. The total equipment cost (TEC) of the proposed process is USD 32.9 million. The equipment with the largest purchase cost is the compressor, accounting for 59.65% of TEC. This is because more compressors are used in the refrigeration cycle, and the higher energy consumption leads to higher purchase costs. The purchase cost of heat exchangers is considered the second largest (USD 6.67 million), accounting for 20.27% of TEC. Improving heat transfer efficiency can further reduce the purchase cost of heat exchangers. The purchase cost of the cooler and expander is low, accounting for 2.87% and 1.95% of TEC.
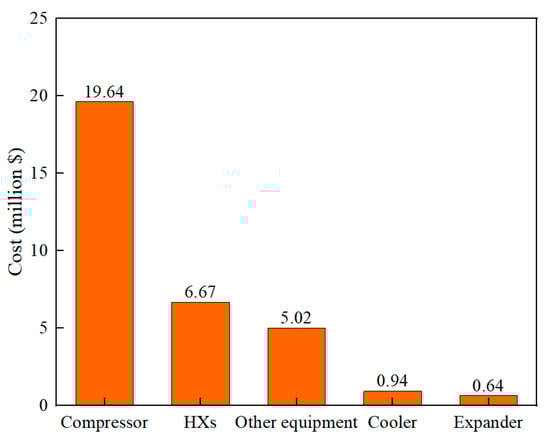
Figure 9.
The cost of the equipment for the proposed process.
Figure 10 presents the CAPEX, OPEX, and O&M of the Geng and Sun [42] and the proposed process. The TAC of the proposed process is USD 28.60 million annually, where the CAPEX accounts for 49.51% due to the higher TEC. The OPEX is USD 11.44 million per year, and 83% of the cost comes from the electricity consumed by the compressor. Compared to the process designed by Geng and Sun [42] with the same product yield, the TAC of the proposed process is increased by USD 3.18 million per year. Although the TAC of the proposed process increases, the process integrates the SMR process, the LNG co-generation, the CO2 refrigeration cycle, and the solar ARS. The higher equipment purchase cost leads to an increase in TAC. In general, the TAC of the proposed process is not very high, which indicates that it is economically feasible.
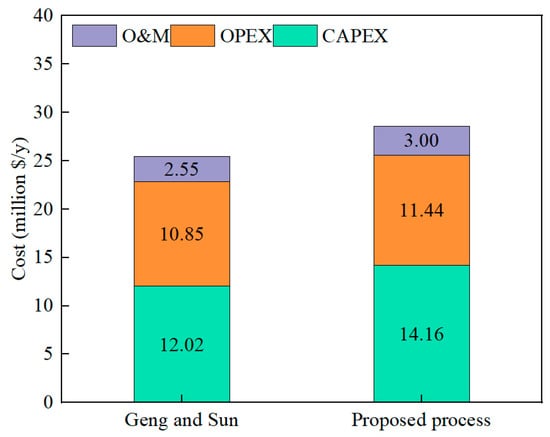
Figure 10.
The CAPEX, OPEX, and O&M of the Geng and Sun [42] and the proposed process.
4.5. Comparison with Other Processes
The proposed integrated liquefaction process is compared with the process in Table 1. It is known that the SEC is effectively reduced and the EXE is effectively enhanced compared to the commercial H2 liquefaction process. Compared with the conceptual H2 liquefaction process with LN2 pre-cooling, the proposed process has a 25.86–51.89% reduction in SEC and a 14.93–72.81% improvement in EXE. Furthermore, the proposed integrated liquefaction process still exhibits lower SEC compared to the conceptual H2 liquefaction processes of MR and LNG cold energy pre-cooling, except for the process designed by Lee et al. [23]. However, the exergy loss of the heat exchanger in their designed process is negative due to the unreasonable structure of the process, which is unrealistic. Compared to the conceptual H2 liquefaction process using renewable energy sources, although the EXE of the proposed integrated liquefaction process is not the highest due to the different process structure, the proposed process exhibits a lower SEC, which is 18.56% lower than the geothermal energy-based process designed by Seyam et al. [29], and 8.74% lower than the solar energy-based process designed by Karimi et al. [31]. Overall, the proposed process not only achieves the production of LH2 and LNG with high energy efficiency, but also couples the SMR process and solar energy ARS to improve energy utilization, which is consistent with the current trend of integrated energy systems.
5. Conclusions and Further Work
Considering the problems of the current conceptual H2 liquefaction process and the development of energy systems toward a low-carbon direction, this paper proposes an integrated liquefaction process of H2 and NG based on the MR cycle and H2 Claude cycle. The novelty of the proposed integrated liquefaction process is not only the co-production of LH2 and LNG with high energy efficiency, but also the production of H2 using the SMR process. Meanwhile, the process uses a CO2 refrigeration cycle to assist in pre-cooling to reduce the environmental impact. Furthermore, solar energy ARS is used to enhance the utilization of renewable energy. The process is simulated and optimized using the HYSYS and PSO algorithms. The energy, exergy, and economic analyses are then carried out to evaluate the thermodynamic performance and economics of the process. Finally, the proposed process with better liquefaction performance is demonstrated in comparison with the other processes. The following main conclusions are drawn:
(1) The energy analysis indicates that the SECs of the pre-cooling and sub-cooling cycles of the proposed process are 1.3504 kWh/kg and 3.8696 kWh/kg, which are 15.31% and 9.77% lower than the base case, respectively. Furthermore, the total SEC of the proposed integrated liquefaction process is 5.2201 kWh/kg, a reduction of 10.67%.
(2) The composite curve analysis shows that the composite curve of the heat exchanger is well matched, and the cold energy can be reasonably distributed as a result of the optimal refrigerant flow rate and pressure, which proves that the heat exchanger has a high heat transfer efficiency.
(3) The exergy analysis shows a total exergy loss of 64,904 kW, which is 13.63% lower than the base case. Among them, the heat exchanger has a large exergy loss, with an exergy loss and exergy loss rate of 21,009 kW and 32.37%, respectively.
(4) After optimization, the total EXE of the proposed process is 62.21%, which is 6.63% higher than that the base case, indicating that the proposed process has high energy efficiency.
(5) The economic analysis shows that the TAC of the proposed integrated liquefaction process is USD 28.60 million per year, which demonstrates that the process is economically feasible.
The low SEC of the proposed integrated liquefaction process is an attractive factor, but the proposed process needs to be further analyzed through advanced exergy analysis and exergy-environmental analysis to assess the irreversibility and overall emissions. Furthermore, a life cycle assessment was also performed to further demonstrate that the process is feasible from the theoretical stage to the practical stage.
Author Contributions
Conceptualization, F.Y., J.G. and H.S.; methodology, F.Y., J.G. and G.R.; software, F.Y., L.Z. and J.L.; validation, F.Y., J.G., G.R. and H.S.; formal analysis, F.Y.; investigation, F.Y.; data curation, F.Y. and J.G.; writing—original draft preparation, F.Y.; writing—review and editing, F.Y., J.G., G.R., H.S., L.Z. and J.L.; visualization, F.Y., J.G. and G.R.; supervision, F.Y. All authors have read and agreed to the published version of the manuscript.
Funding
This research received no external funding.
Data Availability Statement
The data is contained within the article.
Conflicts of Interest
The authors declare that they have no conflict of interest.
References
- Rusman, N.; Dahari, M. A review on the current progress of metal hydrides material for solid-state hydrogen storage applications. Int. J. Hydrog. Energy 2016, 41, 12108–12126. [Google Scholar] [CrossRef]
- Bairrão, D.; Soares, J.; Almeida, J.; Franco, J.F.; Vale, Z. Green Hydrogen and Energy Transition: Current State and Prospects in Portugal. Energies 2023, 16, 551. [Google Scholar] [CrossRef]
- Sánchez-Bastardo, N.; Schlögl, R.; Ruland, H. Methane pyrolysis for zero-emission hydrogen production: A potential bridge technology from fossil fuels to a renewable and sustainable hydrogen economy. Ind. Eng. Chem. Res. 2021, 60, 11855–11881. [Google Scholar] [CrossRef]
- Aziz, M. Liquid Hydrogen: A Review on Liquefaction, Storage, Transportation, and Safety. Energies 2021, 14, 5917. [Google Scholar] [CrossRef]
- Valenti, G. Hydrogen liquefaction and liquid hydrogen storage. In Compendium of Hydrogen Energy; Elsevier: Amsterdam, The Netherlands, 2016; pp. 27–51. [Google Scholar]
- Zhang, S.; Liu, G. Design and performance analysis of a hydrogen liquefaction process. Clean Technol. Environ. Policy 2021, 24, 51–65. [Google Scholar] [CrossRef]
- Yin, L.; Ju, Y. Review on the design and optimization of hydrogen liquefaction processes. Front. Energy 2020, 14, 530–544. [Google Scholar] [CrossRef]
- Krasae-in, S.; Stang, J.H.; Neksa, P. Development of large-scale hydrogen liquefaction processes from 1898 to 2009. Int. J. Hydrog. Energy 2010, 35, 4524–4533. [Google Scholar] [CrossRef]
- Yilmaz, C. A case study: Exergoeconomic analysis and genetic algorithm optimization of performance of a hydrogen liquefaction cycle assisted by geothermal absorption precooling cycle. Renew Energy 2018, 128, 68–80. [Google Scholar] [CrossRef]
- Aasadnia, M.; Mehrpooya, M. Large-scale liquid hydrogen production methods and approaches: A review. Appl. Energy 2018, 212, 57–83. [Google Scholar] [CrossRef]
- Baker, C.R.; Shaner, R.L. A study of the efficiency of hydrogen liquefaction. Int. J. Hydrog. Energy 1978, 3, 321–334. [Google Scholar] [CrossRef]
- Ohira, K. A Summary of Liquid Hydrogen and Cryogenic Technologies in Japan’s WE-NET Project. In Proceedings of the AIP Conference Proceedings, Anchorage, AK, USA, 22–26 September 2003; American Institute of Physics: Anchorage, AK, USA, 2004; pp. 27–34. [Google Scholar]
- Yin, L.; Ju, Y. Process optimization and analysis of a novel hydrogen liquefaction cycle. Int. J. Refrig. 2020, 110, 219–230. [Google Scholar] [CrossRef]
- Bi, Y.; Yin, L.; He, T.; Ju, Y. Optimization and analysis of a novel hydrogen liquefaction process for circulating hydrogen refrigeration. Int. J. Hydrog. Energy 2022, 47, 348–364. [Google Scholar] [CrossRef]
- Shimko, M.A.; Gardiner, M.R. Innovative Hydrogen Liquefaction Cycle. FY 2008 Annual Progress Report, DOE Hydrogen Program. 2008. Available online: https://www.mendeley.com/catalogue/d58c2233-c427-3524-9a1c-92db5017d0ab/ (accessed on 11 April 2023).
- Yuksel, Y.E.; Ozturk, M.; Dincer, I. Analysis and assessment of a novel hydrogen liquefaction process. Int. J. Hydrog. Energy 2017, 42, 11429–11438. [Google Scholar] [CrossRef]
- Krasae-In, S. Optimal operation of a large-scale liquid hydrogen plant utilizing mixed fluid refrigeration system. Int. J. Hydrog. Energy 2014, 39, 7015–7029. [Google Scholar] [CrossRef]
- Asadnia, M.; Mehrpooya, M. A novel hydrogen liquefaction process configuration with combined mixed refrigerant systems. Int. J. Hydrog. Energy 2017, 42, 15564–15585. [Google Scholar] [CrossRef]
- Sadaghiani, M.S.; Mehrpooya, M.; Ansarinasab, H. Process development and exergy cost sensitivity analysis of a novel hydrogen liquefaction process. Int. J. Hydrog. Energy 2017, 42, 29797–29819. [Google Scholar] [CrossRef]
- Aasadnia, M.; Mehrpooya, M. Conceptual design and analysis of a novel process for hydrogen liquefaction assisted by absorption precooling system. J. Clean. Prod. 2018, 205, 565–588. [Google Scholar] [CrossRef]
- Qyyum, M.A.; Riaz, A.; Naquash, A.; Haider, J.; Qadeer, K.; Nawaz, A.; Lee, H.; Lee, M. 100% saturated liquid hydrogen production: Mixed-refrigerant cascaded process with two-stage ortho-to-para hydrogen conversion. Energy Convers. Manag. 2021, 246, 114659. [Google Scholar] [CrossRef]
- Naquash, A.; Riaz, A.; Lee, H.; Qyyum, M.A.; Lee, S.; Lam, S.S.; Lee, M. Hydrofluoroolefin-based mixed refrigerant for enhanced performance of hydrogen liquefaction process. Int. J. Hydrog. Energy 2022, 47, 41648–41662. [Google Scholar] [CrossRef]
- Lee, H.; Haider, J.; Abdul Qyyum, M.; Choe, C.; Lim, H. An innovative high energy efficiency–based process enhancement of hydrogen liquefaction: Energy, exergy, and economic perspectives. Fuel 2022, 320, 123964. [Google Scholar] [CrossRef]
- Kim, H.; Haider, J.; Qyyum, M.A.; Lim, H. Mixed refrigerant–based simplified hydrogen liquefaction process: Energy, exergy, economic, and environmental analysis. J. Clean. Prod. 2022, 367, 132947. [Google Scholar] [CrossRef]
- Yang, J.-H.; Yoon, Y.; Ryu, M.; An, S.-K.; Shin, J.; Lee, C.-J. Integrated hydrogen liquefaction process with steam methane reforming by using liquefied natural gas cooling system. Appl. Energy 2019, 255, 113840. [Google Scholar] [CrossRef]
- Bian, J.; Yang, J.; Li, Y.; Chen, Z.; Liang, F.; Cao, X. Thermodynamic and economic analysis of a novel hydrogen liquefaction process with LNG precooling and dual-pressure Brayton cycle. Energy Convers. Manag. 2021, 250, 114904. [Google Scholar] [CrossRef]
- Riaz, A.; Qyyum, M.A.; Min, S.; Lee, S.; Lee, M. Performance improvement potential of harnessing LNG regasification for hydrogen liquefaction process: Energy and exergy perspectives. Appl. Energy 2021, 301, 117471. [Google Scholar] [CrossRef]
- Yilmaz, C.; Kaska, O. Performance analysis and optimization of a hydrogen liquefaction system assisted by geothermal absorption precooling refrigeration cycle. Int. J. Hydrog. Energy 2018, 43, 20203–20213. [Google Scholar] [CrossRef]
- Seyam, S.; Dincer, I.; Agelin-Chaab, M. Analysis of a clean hydrogen liquefaction plant integrated with a geothermal system. J. Clean. Prod. 2020, 243, 118562. [Google Scholar] [CrossRef]
- Ghorbani, B.; Mehrpooya, M.; Amidpour, M. A novel integrated structure of hydrogen purification and liquefaction using natural gas steam reforming, organic Rankine cycle and photovoltaic panels. Cryogenics 2021, 119, 103352. [Google Scholar] [CrossRef]
- Karimi, M.; Mehrpooya, M. Proposal and investigation of a novel hybrid hydrogen production and liquefaction process using solid oxide electrolyzer, solar energy, and thermoelectric generator. J. Clean. Prod. 2022, 331, 130001. [Google Scholar] [CrossRef]
- Bi, Y.; Ju, Y. Design and analysis of an efficient hydrogen liquefaction process based on helium reverse Brayton cycle integrating with steam methane reforming and liquefied natural gas cold energy utilization. Energy 2022, 252, 124047. [Google Scholar] [CrossRef]
- Kothari, R.; Buddhi, D.; Sawhney, R. Comparison of environmental and economic aspects of various hydrogen production methods. Renew. Sustain. Energy Rev. 2008, 12, 553–563. [Google Scholar] [CrossRef]
- Geng, J.; Sun, H. A novel integrated hydrogen and natural gas liquefaction process utilizing a modified double mixed refrigerant process pre-cooling system. Appl. Therm. Eng. 2023, 224, 120085. [Google Scholar] [CrossRef]
- Sadaghiani, M.S.; Mehrpooya, M. Introducing and energy analysis of a novel cryogenic hydrogen liquefaction process configuration. Int. J. Hydrog. Energy 2017, 42, 6033–6050. [Google Scholar] [CrossRef]
- Zhang, J.; Meerman, H.; Benders, R.; Faaij, A. Technical and economic optimization of expander-based small-scale natural gas liquefaction processes with absorption precooling cycle. Energy 2020, 191, 116592. [Google Scholar] [CrossRef]
- Sherif, S.A.; Goswami, D.Y.; Stefanakos, E.L.; Steinfeld, A. Handbook of Hydrogen Energy; CRC Press: Boca Raton, FL, USA, 2014; pp. 567–592. [Google Scholar]
- Harkness, R.W.; Deming, W.E. The equilibrium of para and ortho hydrogen. J. American Chemical Society 1932, 54, 2850–2852. [Google Scholar] [CrossRef]
- Faramarzi, S.; Nainiyan, S.M.M.; Mafi, M.; Ghasemiasl, R. A novel hydrogen liquefaction process based on LNG cold energy and mixed refrigerant cycle. Int. J. Refrig. 2021, 131, 263–274. [Google Scholar] [CrossRef]
- Aasadnia, M.; Mehrpooya, M.; Ansarinasab, H. A 3E evaluation on the interaction between environmental impacts and costs in a hydrogen liquefier combined with absorption refrigeration systems. Appl. Therm. Eng. 2019, 159, 113798. [Google Scholar] [CrossRef]
- Cavalcanti, E.J.C. Exergoeconomic and exergoenvironmental analyses of an integrated solar combined cycle system. Renew. Sustain. Energy Rev. 2017, 67, 507–519. [Google Scholar] [CrossRef]
- Geng, J.; Sun, H. Optimization and analysis of a hydrogen liquefaction process: Energy, exergy, economic, and uncertainty quantification analysis. Energy 2023, 262, 125410. [Google Scholar] [CrossRef]
Disclaimer/Publisher’s Note: The statements, opinions and data contained in all publications are solely those of the individual author(s) and contributor(s) and not of MDPI and/or the editor(s). MDPI and/or the editor(s) disclaim responsibility for any injury to people or property resulting from any ideas, methods, instructions or products referred to in the content. |
© 2023 by the authors. Licensee MDPI, Basel, Switzerland. This article is an open access article distributed under the terms and conditions of the Creative Commons Attribution (CC BY) license (https://creativecommons.org/licenses/by/4.0/).