Article

Deterministic and Probabilistic Prediction of Wind Power Based on a Hybrid Intelligent Model

1
School of Electrical and Information Engineering, University of Sydney, Sydney, NSW 2006, Australia
2
College of Transportation, Nanchang JiaoTong Institute, Nanchang 330100, China
3
School of Information Science and Technology, Northwest University, Xi’an 710069, China
4
Department of Electrical Engineering, Hong Kong Polytechnic University, Kowloon, Hong Kong
5
Henan International Joint Laboratory of Behavior Optimization Control for Smart Robots, Henan Provincial Key Laboratory of Smart Lighting, College of Computer and Artificial Intelligence, Huanghuai University, Zhumadian 463000, China
*
Author to whom correspondence should be addressed.
Energies 2023, 16(10), 4237; https://doi.org/10.3390/en16104237
Submission received: 29 April 2023 / Revised: 14 May 2023 / Accepted: 15 May 2023 / Published: 22 May 2023

Abstract

:
Uncertainty in wind power is often unacceptably large and can easily affect the proper operation, quality of generation, and economics of the power system. In order to mitigate the potential negative impact of wind power uncertainty on the power system, accurate wind power forecasting is an essential technical tool of great value to ensure safe, stable, and efficient power generation. Therefore, in this paper, a hybrid intelligent model based on isolated forest, wavelet transform, categorical boosting, and quantile regression is proposed for deterministic and probabilistic wind power prediction. First, isolated forest is used to pre-process the original wind power data and detect anomalous data points in the power sequence. Then, the pre-processed original power sequence is decomposed into sub-frequency signals with better profiles by wavelet transform, and the nonlinear features of each sub-frequency are extracted by categorical boosting. Finally, a quantile-regression-based wind power probabilistic predictor is developed to evaluate uncertainty with different confidence levels. Moreover, the proposed hybrid intelligent model is extensively validated on real wind power data. Numerical results show that the proposed model achieves competitive performance compared to benchmark methods.

1. Introduction

Wind energy, as a low-carbon and renewable energy source, is a feasible and promising key solution to alleviate the current climate change dilemma. At present, wind power is growing rapidly around the world, and the total installed capacity of worldwide wind power has reached 837 GW [1]. However, wind power generation always shows peaks and strong fluctuations due to weather conditions. The randomness and intermittency of wind power brings great challenges to large-scale wind power grid connection, stable operation of power systems, and economic dispatch [2]. To alleviate the potential negative impact of wind power’s characteristics on the electrical energy system, an effective solution is to properly incorporate probabilistic predictions of wind power generation into the decision model [3]. Therefore, accurate and reliable prediction results are important to reduce the operation risk and cost of wind power dispatch uncertainty and to improve system reliability with high wind power penetration [4].
Traditionally, the methods commonly used in wind power forecasting are generally divided into three categories: physical methods, statistical methods, and machine learning methods. Physical methods are based on physical principles to simulate energy conversion processes and use meteorological parameters such as temperature, barometric pressure, wind speed, and wind direction and altitude to build predictive models [5,6]. Unlike physical methods, statistical methods use statistical models to learn the linear relationships existing in historical data, for instance, using Kalman filtering [7] or auto-regressive moving average (ARMA) [8]. Although these two methods have promising applications in wind power prediction, they still have certain limitations. The physical model is often time-consuming, complex, and computationally expensive and is more suitable for mid-to-long-term wind power forecasting, with data sources including long-term average wind maps or numerical weather prediction (NWP) [9]. The statistical method often relies on strong linear relationships that require the exclusion of morbid data points, and its model performance is significantly degraded in wind power forecasting with strong volatility and high randomness [10]. Machine learning, as a powerful data processing tool, has been applied to a wide range of fields such as the energy trading market [11] and power grids [12] and also plays a crucial role in wind power forecasting. Conventional machine learning methods include the K-nearest neighbors algorithm (KNN) [13], support vector regression (SVR) [14], decision tree (DT) [15], multilayer perceptron (MLP) [16], etc. Unfortunately, conventional machine learning methods for wind power prediction have difficulty dealing with the increasingly extensive data associated with high-dimensional large-scale wind power generation and suffer from under-fitting and dimensional catastrophes [17]. More specifically, these conventional machine learning methods are capable of producing reliable predictions with limited amounts of time-series data, but their predictive accuracy tends to diminish as the amount of data grows.
Recently, deep learning has been introduced into wind power prediction as a branch of machine learning to extract nonlinear high-dimensional features. Deep learning methods generally include recurrent neural networks (RNNs) [18], convolutional neural networks (CNNs) [19], deep belief networks (DBNs) [20], long short-term memory neural networks (LSTMs) [21], deep reinforcement learning (DRL) [22], etc. Experimental results indicate that the accuracy of wind power prediction based on deep learning is superior to that of traditional machine learning methods. This is because the deep learning model has better feature representation ability that can extract hidden sophisticated nonlinear relationships and meaningful features from large amounts of data. Nevertheless, deep-learning-based wind power prediction models are not always flawless due to their large number of parameters, high running costs, and relatively high maintenance workload when updating parameters in real deployments [23]. Categorical boosting (CatBoost), one of the best machine learning models, has achieved competitive performance in different types of tasks compared to deep learning. It is well known that CatBoost is an algorithm for gradient boosting on decision trees and can greatly reduce the training convergence time [24,25]. Further, CatBoost has been successfully applied to time-series prediction, such as weather forecasting [26], short-term electricity spot prices [27], wind and rainfall [28], and traffic flows [29]. The superiority of CatBoost in time-series forecasting leads to its increasing application in wind power prediction.
However, a single CatBoost model may not be sufficient to handle large amounts of wind power data containing complex nonlinear relationships and hidden features. It is quite imperative to explore more hybrid intelligence schemes to improve the accuracy of CatBoost-based models in the field of wind power forecasting. It is noteworthy that boosting algorithms are increasingly popular in feature selection and processing, and hybrid models have been shown to solve complicated wind energy prediction problems [30]. Under these circumstances, a natural extension is that if CatBoost takes into account better time-dependent features, more accurate wind power predictive performance can be explored in this paper. Consequently, we initially propose a hybrid intelligent model base on isolation forest, wavelet transform (WT), and CatBoost for deterministic wind power prediction. Herein, isolation forest is used as an outlier detection tool to eliminate the morbid data points in the raw wind power, thus ensuring the smoothness of the processed data. WT is used to decompose a single wind power sequence to various sub-sequences, which are then fed into the CatBoost model to improve the prediction accuracy. Even though deterministic prediction can provide some valuable information to power system participants, errors in deterministic wind power forecasting are completely unavoidable due to the uncertainty of meteorological data. To allay these concerns, a quantile-regression (QR)-based probabilistic predictor is developed to assess the wind power uncertainty at different confidence levels. The main contributions of this paper are described below:
  • To obtain more meaningful training features, isolation forest is introduced to detect morbid data points of wind power, and WT is utilized to extract multi-level time-frequency features from wind power sequence data.
  • To reduce errors in deterministic wind power forecasting, a new hybrid intelligent model is initially constructed by isolated forest, WT, and CatBoost to accurately predict wind power.
  • To reasonably evaluate the uncertainty of wind power, a probabilistic predictor based on QR is developed to generate prediction intervals at different confidence levels.
The remainder of this paper is organized as follows: In Section 2, a new hybrid intelligent model is proposed for deterministic wind power forecasting. In Section 3, we detail the quantile-regression-based probability prediction module and performance criterion. In Section 4, we present the simulation experiment results. Finally, we conclude this paper in Section 5.

2. The Proposed Hybrid Intelligent Model for Wind Power Prediction

In this section, a new hybrid intelligent point model consisting of isolated forest, WT, and CatBoost is proposed to reduce errors in deterministic wind power forecasting, as seen in Figure 1. The submodules in the proposed hybrid model are analyzed and discussed in detail below.

2.1. Isolated Forest

In general, anomalous data may appear in wind power sequence data obtained by the control center due to wind farm failures or communication delays. To reduce overfitting of these data by the training model, it is quite necessary to process these outliers. Thus, a score-based isolation forest [31] is used to detect outliers, and this works on the principle that outliers can be isolated by segmenting them with fewer random features than normal points. The score-based outlier detection method for wind power is described as follows:
s ( x , ψ ) = 2 E ( h ( x ) ) c ( ψ )
where s ( · ) is an outlier function that measures whether a record x is an outlier, E ( h ( x ) ) denotes the average value of h ( x ) from a collection of isolation trees, and c ( ψ ) is used to normalize h ( x ) as follows:
c ( ψ ) = 2 H ( ψ 1 ) 2 ψ 1 ψ , ψ > 2 1 , ψ = 2 0 , otherwise
where H ( i ) is the harmonic number, which can be estimated by H ( i ) = ln ( i ) + 0.5772156649 [32]. In Equation (1), anomaly score s is monotonic to h ( x ) . If outliers of sample x are processed, lower scores (outliers) of wind power data can be excluded manually according to a preset anomaly proportional coefficient.

2.2. Wavelet Transform

Typically, raw wind power data series involve characteristics such as nonlinearity and dynamics, manifested by spikes and high volatility. It is worth noting that these characteristics are one of the main factors affecting the prediction accuracy of wind power [33]. WT, which decomposes the wind speed data into more stationary components, is an effective solution for reducing the effects of high fluctuations in wind power. Discrete wavelet decomposition is generally favored for its efficiency in providing the right information to extract multi-level time–frequency features from a time series by decomposing the time series into low- and high-frequency sub-series. Here, discrete WT is used to decompose the processed data (after outlier detection), specifically as follows:
W a v e l e t ( m , n ) = 2 m 2 t = 0 T 1 g ( t ) ϕ [ ( t n 2 m ) / 2 m ]
where g ( t ) is the signal to be decomposed, ϕ ( · ) is the mother wavelet, and m and n are the translation and scaling variables, respectively. In this paper, the Mallat algorithm, as a fast, discrete WT algorithm, is utilized to decompose the original wind power sequence. We choose the 4th-order Daubechies wavelet (Db4) as the mother wavelet function to provide a balance between wavelength and smoothness. After this, the original wind power sequence can be decomposed into different sub-series at different frequency levels via WT.

2.3. Categorical Boosting

Boosting is an ensemble learning method that reduces the training error by combining several weak learners into a single powerful learner [34,35]. CatBoost, as one of ensemble learning methods, is a new deep learning algorithm based on the gradient boosting decision tree (GBDT), which has many improvements in overcoming model overfitting and handling parallelism [24]. CatBoost uses an ordered boosting algorithm to improve the fitting ability and accuracy of the model. Additionally, it uses a symmetric tree-based decision tree algorithm, which makes it more effective in dealing with high-dimensional sparse data [36]. Further, it is an effective solution for regression tasks and can handle categorical features well. Considering these benefits, Catboost is selected as the learning model in this paper for ultra-short-term wind power forecasting.
For categorical feature processing, an efficient target-based statistics (TS) algorithm is adopted by CatBoost [27]. The ordered target statistics based on average label values can be described as follows:
x k i = x j D k [ x k j = x k i ] · y j + a · p x j D k [ x k j = x k i ] + a
where [ x k j = x k i ] = 1 if x k j = x k i and is 0 otherwise, D is the dataset, and x k = [ x k 1 , , x k m ] denotes the feature vector of the kth sample. D k = D / { x k } = { ( x k , y k ) } k = 1 , , n is a randomly ordered dataset, excluding x k ; p, a > 0 , and y i R are the prior value, the corresponding weight, and the target value, respectively. Note that TS can estimate the expected target value of each category in an effective way.
As shown in Figure 1, after data preprocessing through the isolation forest, the proposed point prediction module based on WT-CatBoost achieves higher prediction accuracy and lower over-fitting.

3. Probabilistic Wind Power Prediction and Performance Criterion

Due to the chaotic nature of the weather, the wind power sequence always shows peaks and strong fluctuations. These characteristics highly affect the accuracy of wind power prediction. Generally speaking, if probabilistic prediction of wind power is properly incorporated into decision-making models, the operating risk and cost of wind power dispatch uncertainty can be greatly decreased, and meaningful information can be provided to power system participants [2]. Aiming at this, we propose a probabilistic predictor for wind power to assess uncertainty at different confidence levels. The details of the probability prediction module and performance criterion are given below.

3.1. Quantile-Regression-Based Probabilistic Forecasting

In this subsection, we construct a probabilistic wind power prediction model by quantile regression (QR) in combination with the previous deterministic hybrid prediction model. It is worth mentioning that QR is introduced by [37] without making any assumptions about the shape of the wind power distribution to be predicted.
The purpose of QR is to approximate the conditional distribution of a random variable by means of quantiles and to estimate the uncertainty of wind power with different confidence levels based on a linear mapping between the predicted and actual values of the conditional distribution. Specifically, the goal is to minimize
β ^ τ = argmin β j = 1 N ρ τ y j f ( β , x j )
where N is the size of datasets, β is a parameter vector to optimize, ( x i , y i ) denotes a pair of vector, and ρ τ ( · ) is the nominal absolute function, defined as follows:
ρ τ ( u ) = τ u , if u 0 , ( τ 1 ) u , if u < 0 .
where τ denotes the quantile probability level. Once the parameter β ^ τ is estimated, the uncertainty forecasting results in different quantiles, expressed as
y ^ τ , j = f ( β ^ τ , x j )
where y ^ τ , j is the τ th quantile estimated using the QR method. We note that QR estimates each quantile individually. From a set of quantities, the prediction intervals under different nominal coverages are obtained. The ( 1 α ) × 100 % confidence level prediction interval at time t is generated by using the the τ = 1 α 2 quantile as the upper bound and the τ = α 2 quantile as the lower bound [38]. These are defined by
P I ( 1 α ) × 100 % ( t ) = I ( t ) τ = α 2 , I ( t ) τ = 1 α 2
where P I ( 1 α ) × 100 % is the confidence level prediction interval and I ( t ) τ = α 2 is calculated by Equation (7). For instance, P I 80 % ( t ) is estimated by the two extremes quantiles, i.e., α = 0.2 , I ( t ) τ = 0.1 and I ( t ) τ = 0.9 .

3.2. Implementation of the Proposed Hybrid Intelligence Model

In order to mitigate the adverse effects of these characteristics on the accuracy of wind power prediction, this paper proposes a new hybrid intelligence method for probabilistic wind power forecasting based on isolated forest, WT-CatBoost, and QR. In brief, the proposed hybrid model consists of a data pre-processing module, a deterministic point prediction module, and a probabilistic prediction module, as seen in Figure 1. More precisely, the data preprocessing module is used to smooth the training data, and isolated forest is used to detect these outliers. These outliers, nulls, and missing values in the original wind power sequence are filled using a linear interpolation method. After this, WT is applied to decompose the pre-processed original power sequence into well-profiled high- and low-frequency signals, and the meaningful features of each sub-frequency are extracted by CatBoost. Then, QR is introduced as a non-parametric method to estimate these uncertainties in wind power generation. Wind power prediction intervals with different confidence levels are generated using the QR method. Finally, accurate and reliable deterministic and probabilistic wind power prediction results can be fed into power system operation and control.

3.3. Performance Criterion

3.3.1. Errors for Point Prediction Performance

Generally, the assessment of point prediction performance is measured by comparing the error between the actual and predicted values. In this paper, three evaluation metrics, mean absolute error (MAE), root mean square error (RMSE), and mean absolute percentage error (MAPE), are selected to validate the predictive performance of the proposed hybrid model. They are as follows:
MAE = 1 T t = 1 T | P t a P t f |
RMSE = 1 T t = 1 T P t a P t f 2
MAPE = 1 T t = 1 T | P t a P t f | P t a
where T is the number of test samples and P t f and P t a are the predicted and actual value, respectively, corresponding to the tth sample. It is known that a smaller MAE/MAPE/RMSE of a prediction model indicates better prediction performance and vice versa.

3.3.2. Errors for Probabilistic Performance

Here, the prediction interval coverage probability (PICP) and average interval sharpness (AIS) are used to evaluate the probability prediction performance [39]. By definition, from Equation (8), the predicted values are expected to lie within the constructed prediction interval with a specific probability ( 1 α ) × 100 % . The PICP is used to assess the ratio of the true values that fall within the upper and lower bounds of the prediction interval. Essentially, the PICP serves as a measure of the coverage probability of the prediction interval, which is defined as
PICP = 1 T t = 1 T c t α × 100 %
c t α = 1 , P t a P I ( 1 α ) × 100 % ( t ) 0 , P t a P I ( 1 α ) × 100 % ( t )
where c t α is the indicator of PICP. Theoretically, P I C P ( 1 α ) × 100 % indicates that the prediction interval is reliable; otherwise it is an invalid interval.
AIS is a metric that provides comprehensive evaluation of coverage and interval width. It also offers an average measure of interval sharpness. It is defined as follows:
AIS = 1 T t = 1 T 2 α δ t α 4 [ L t α P t a ] , P t a < I ( t ) τ = α 2 2 α δ t α , P t a P I ( 1 α ) × 100 % ( t ) 2 α δ t α 4 [ P t a U t α ] , P t a > I ( t ) τ = 1 α 2
where I ( t ) τ = 1 α 2 and I ( t ) τ = α 2 are, respectively, the upper bound and lower bound of the prediction interval. The prediction interval width δ t α = I ( t ) τ = 1 α 2 I ( t ) τ = α 2 . We note that the larger AIS in the prediction interval indicates better predictive quantiles.

4. Numerical Results and Analysis

Due to the lesser impact of meteorological parameters on ultra-short-term wind power prediction compared to long-term prediction, this paper proposes a direct prediction method for wind power prediction that does not consider meteorological features such as wind speed, wind direction, temperature, etc. In this section, the proposed hybrid intelligence model is comprehensively evaluated based on actual historical wind power data from a wind farm in China. Therefore, the simulation data results in this section are obtained from the same wind farm data. The data cover the period from January 2020 to December 2021 with 15-min resolution. The entire wind power prediction dataset is divided into two types of sets: a training dataset and a test dataset. Two test weeks, 1–7 February 2021 (Case 1) and 1–7 July 2021 (Case 2), are taken as the test datasets in order to take into consideration seasonal differences, and the rest of the data constitute the training dataset. To more objectively evaluate the deterministic prediction performance of wind power with multiple temporal resolutions, this section presents six prediction ranges from 15 to 90 min. We consider eXtreme gradient boosting (XGBoost) [34], Tree [15], SVR [14], and a back-propagation neural network (BPNN) [40] as benchmark methods to demonstrate the feasibility of the proposed hybrid intelligent method. Furthermore, the probabilistic prediction performance of wind power at different confidence levels is present in the next subsection. The proposed QR-based hybrid method is sufficiently compared with the XGBoost+QR, SVR+QR, and Deep AR [41] methods.

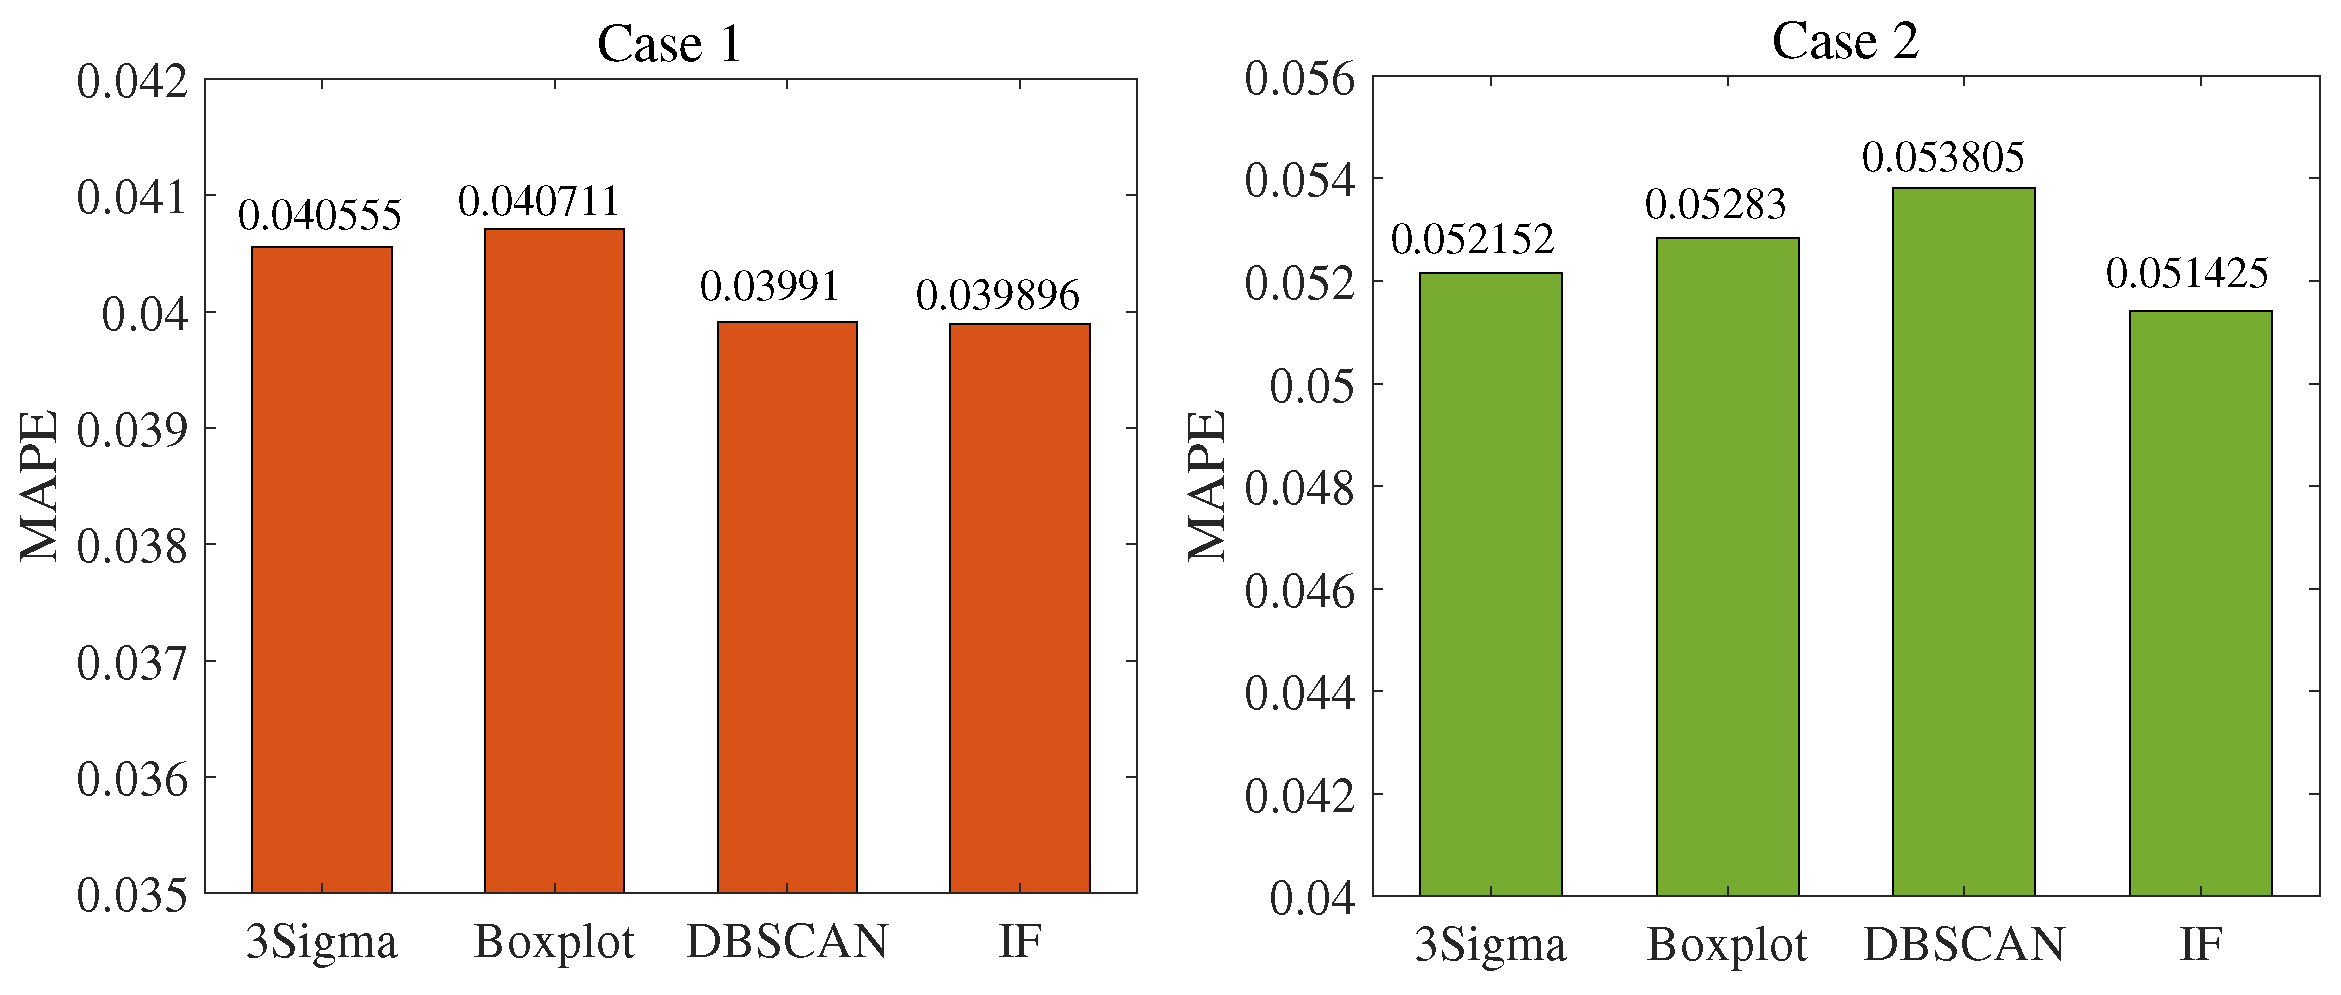
4.1. Outlier Detection Based on Isolated Forest

To validate the effectiveness of isolated forest in the data processing module, we evaluate the effect of isolated forests on the predictive performance of the proposed hybrid intelligence model, where a 15-min-ahead test dataset is used. In Figure 2, we show the MAPE results for the isolated forest at different outlier ratios, and the marked points indicate the minimum values. In the plots, the optimal anomaly ratios for Case 1 and Case 2 are 0.04 and 0.02 , respectively. In both cases, the best outlier ratios are greater than 0, indicating that 4 percent and 2 percent of outliers in the prediction process are overfitting during the training process. If these detected outliers are eliminated in the training data, the prediction accuracy of the proposed method can be improved. The ratio of outliers corresponding to the minimum MAPE value in Case 2 is smaller than that in Case 1, which is due to environmental factors at different time stages. This indicates that more original features need to be retained during model training to mitigate underfitting.
In Figure 3, three benchmark outlier detection methods, including 3Sigmia [42], Boxplot [43], and DBSCAN [44], are tested to demonstrate the effectiveness of isolated forest. To be fair, the test conditions of the three benchmark outlier detection methods are the same as those of the isolated forest. In the figure, the MAPE values for isolated forest in the two cases are 0.039896 and 0.051425 , respectively. Compared with 3Sigmia, Boxplot, and DBSCAN, the MAPE of the isolated forest method in Case 1 is reduced by 0.000659 , 0.000815 , and 0.000014 , respectively, and Case 2 by 0.000727 , 0.001405 , and 0.00238 , respectively. From these results, the isolated forest method shows higher anomaly data handling capability in different cases compared to the three benchmarks. This is mainly due to the fact that isolated forest can build a local model through sub-sampling, reducing the impact of swamping and masking on the model effect. Therefore, the isolated forest used in the data processing module can effectively handle high-dimensional continuous data and improve the prediction performance of the proposed hybrid intelligence model.

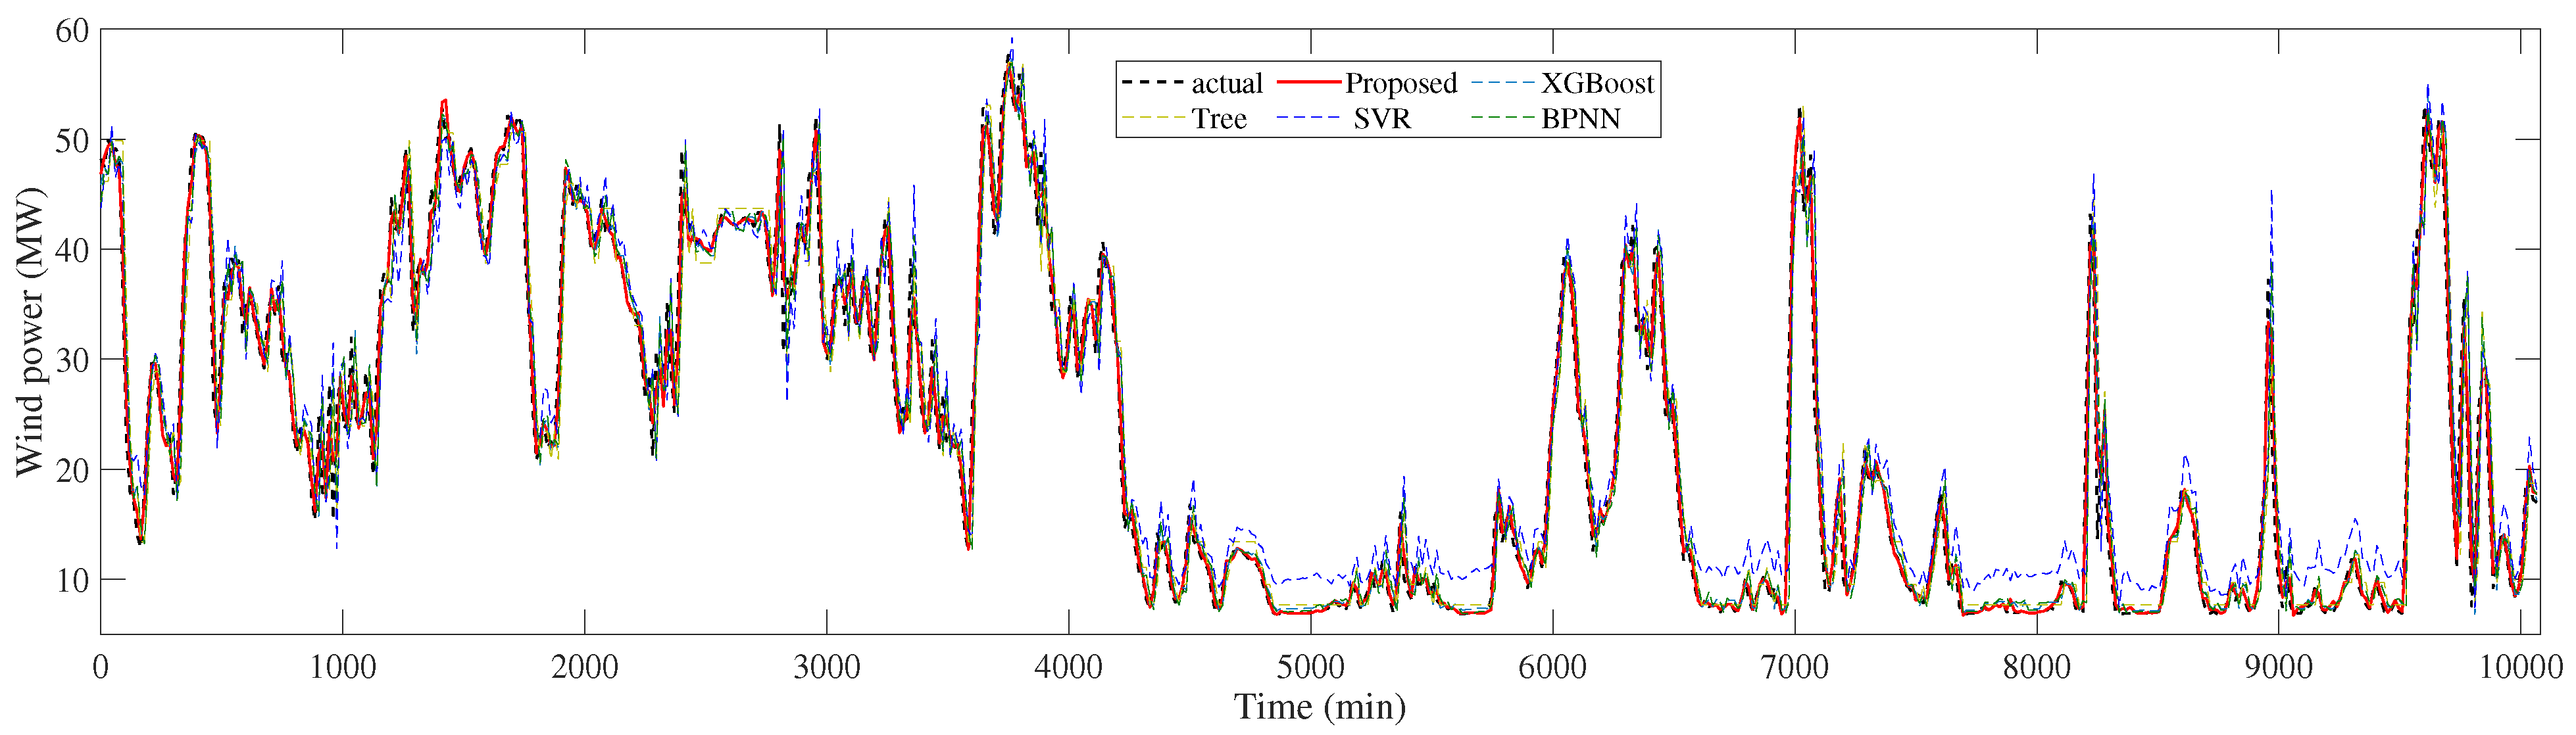
4.2. 15-Min-Ahead Prediction Results

Figure 4 and Figure 5 show the 15-min-ahead prediction results for the four benchmark methods and the proposed model for Case 1 and Case 2. The red and black lines in Figure 4 and Figure 5 represent the predicted and actual power curves, respectively. It is clear that the prediction curve of the proposed method is very close to the actual curve. This means that the proposed hybrid method has more convincing prediction results than other comparative methods. Table 1 presents the 15-min-ahead prediction results for both cases. From Table 1, it can be seen that the MAPEs of the proposed method are 0.0399 and 0.0514 for Case 1 and Case 2, respectively, with a mean value of 0.0457 . The mean MAPEs for the four benchmark methods for the two test cases are 0.1126 , 0.1265 , 0.1410 , and 0.1139 , respectively. Compared with XGBoost, Tree, SVR, and BPNN, the average MAPE of the proposed method has been decreased by 0.0669 , 0.0808 , 0.0953 , and 0.00682 , respectively. Similarly, the MAE index has been, on average, decreased by 1.7083 , 2.0069 , 2.3732 , and 1.7415 , respectively, and the mean RMSE has been decreased by 2.4376 , 2.7660 , 2.9518 , and 2.4858 , respectively. Obviously, the proposed method exhibits the best performance, followed by XGBoost, BPNN, Tree, and SVR in that order.

4.3. Multi-Step-Ahead Prediction Results

Then, we further investigate the multi-step prediction performance of the proposed model and perform simulation and analysis on Case 1 and Case 2. The prediction steps range from 30 min to 90 min with an interval of 15 min. Table 2 presents the MAE and RMSE metrics for different prediction methods in 30-min-ahead prediction. It is clear from Table 2 that the proposed method has a significant performance improvement over the benchmark methods. Compared with XGBoost, Tree, SVR and BPNN, the MAE has been, on average decreased by 2.6715 , 3.0414 , 3.2161 , and 2.6484 , respectively, and RMSE by 3.7198 , 4.2468 , 4.2123 , and 3.6835 , respectively. It turns out that the proposed hybrid intelligence method also has good performance in 30-min-ahead prediction.
Figure 6 and Figure 7 show the mean MAPEs of Case 1 and Case 2 over different forecast ranges, respectively. As can be seen from the figure, the MAPEs of the proposed method increase with the increase of the prediction range. This is because the longer forecast range reduces the feature correlation and thus increases the uncertainty of wind power forecasts. Compared with other benchmark methods, the MAPE of the proposed method is the smallest in all prediction horizons, which indicates that the proposed hybrid method has the best prediction performance. Therefore, it can be proved from the multi-step forecasting results that the proposed method has more excellent and robust forecasting performance.

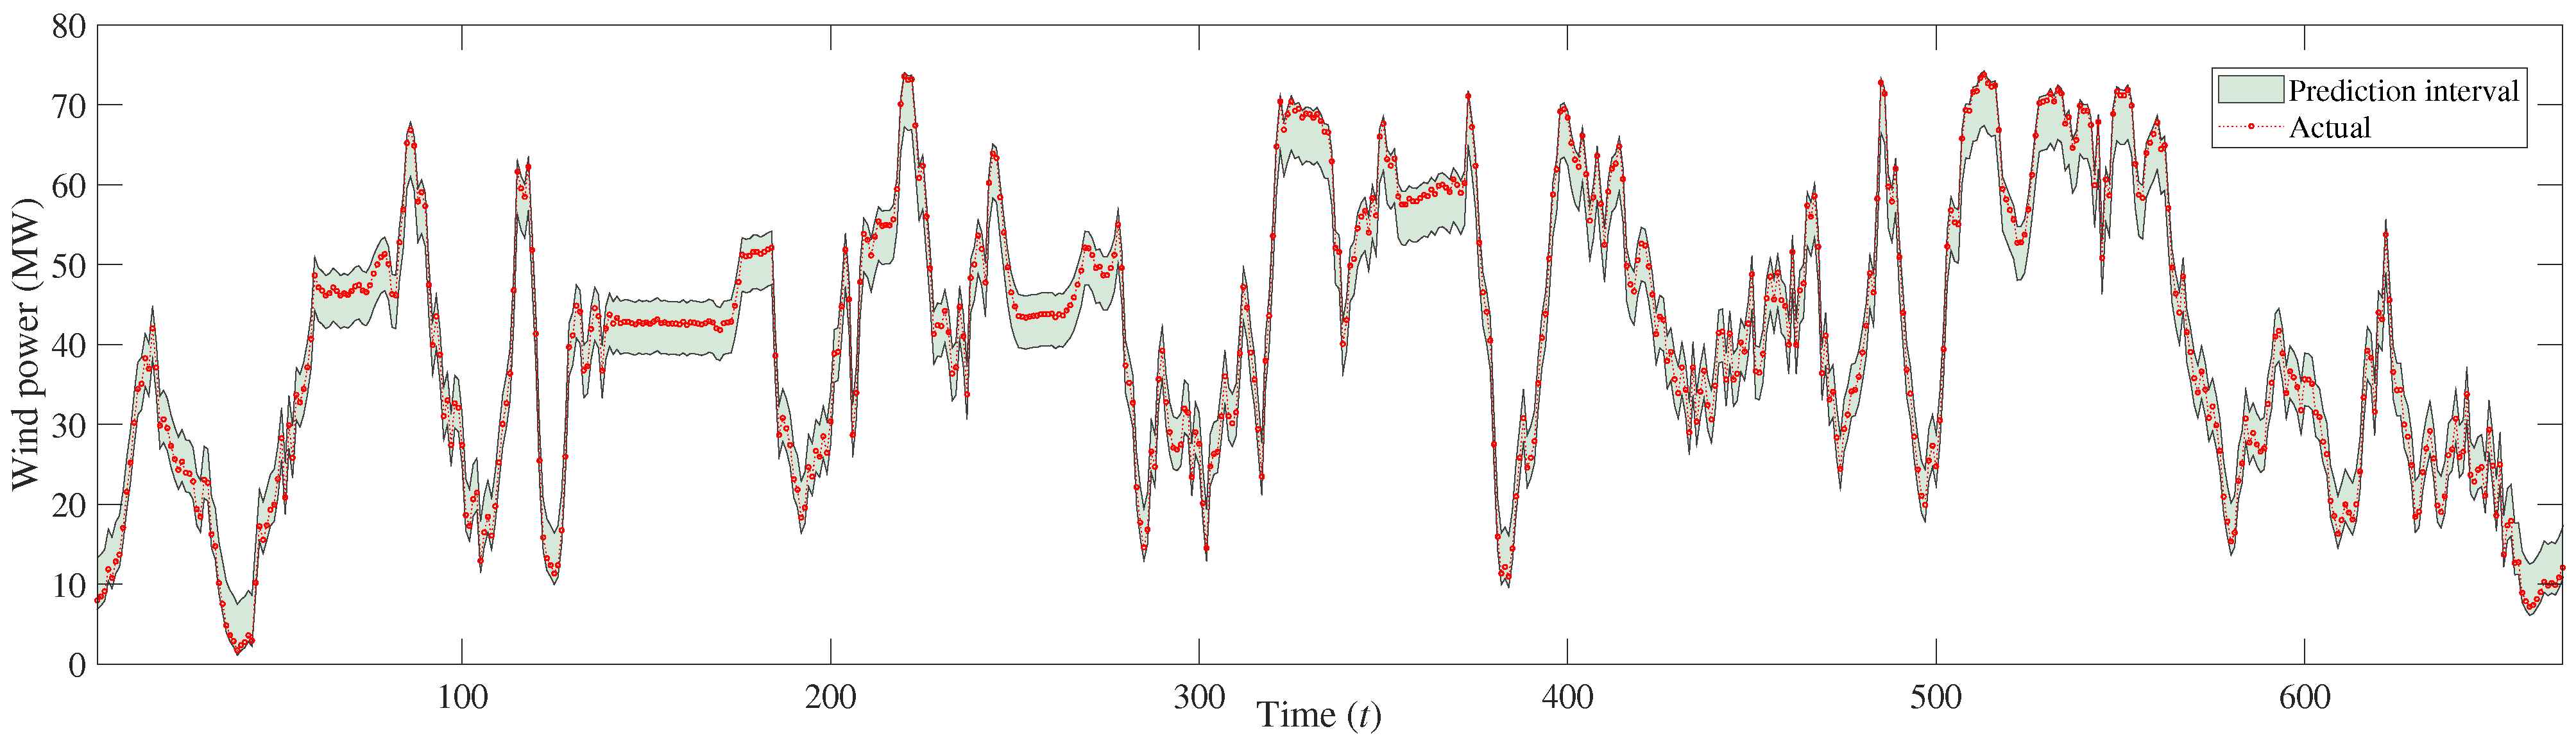
4.4. Probabilistic Prediction Results

In this subsection, to fully demonstrate the overall advantages of the proposed hybrid intelligent method, we choose XGBoost+QR, SVR+QR, and Deep AR as three benchmark methods, where PICP and AIS are adopted to evaluate the wind power probabilistic prediction results. Figure 8 and Figure 9 present the 30-min-ahead prediction interval with 80% confidence level obtained from the proposed hybrid method in Case 1 and Case 2, respectively. In the plots, the red dashed line is the actual wind power and the light blue area is the wind power prediction interval. It can be seen that the actual power is within a larger percentage of the constructed lower and upper bounds. The actual power line, lower boundary, and upper boundary are very similar in shape. Further, it can be clearly seen that the line trends in each plot have strong fluctuations, showing the nonlinear and non-stationary characteristics of wind power in different cases.
Table 3 presents the 30-min-ahead probabilistic ACP and AIS at 80% confidence level in these two cases. We note that the PICP shows the reliability of the prediction interval and that the prediction interval is considered reliable when the PICP is higher than a given confidence level. As shown in Table 3, all benchmark methods and the proposed method except SVM are valid for all cases. Compared with XGBoost+QR, SVR+QR, and Deep AR, the AISs of the proposed method in Case 1 are reduced by 3.5857 , 3.9511 , and 3.6536 , respectively, and in Case 2 by 3.2374 , 4.3922 , and 3.1260 , respectively. The AIS results show that the proposed hybrid intelligence approach has better prediction interval quality than other benchmark methods, which is due to the fact that the larger the AIS, the better the prediction quality.
Furthermore, we study the AIS performance under different confidence levels in both cases. The AIS curves of the proposed and benchmark methods at confidence levels ranging from 32 to 98 % are shown in Figure 10 and Figure 11. For Case 1, the AIS results for all three benchmark methods are close to each other. For Case 2, SVM+QR has the worst AIS performance, while the other two benchmark methods have similar AIS performance. Apparently, in both cases, the proposed hybrid intelligence method performs best at different confidence levels. These results show that the proposed method performs excellently in probabilistic wind power prediction and will be very attractive in practical applications.

5. Conclusions

In this paper, a new hybrid intelligent model based on isolated forest, wavelet transform, categorical boosting, and quantile regression is proposed for deterministic and probabilistic wind power forecasting. Isolated forest is used to detect anomalous data points to smooth the wind power sequence, and its effectiveness is verified by comparison with three benchmark outlier detection methods. Wavelet transform is applied to decompose the wind power sequence into well-profiled high- and low-frequency signals, categorical boosting is exploited to extract meaningful features of wind power, and quantile regression is developed to evaluate the uncertainty with various confidence levels. Then, the proposed hybrid method is sufficiently validated and analyzed on real wind power data from China. Compared with the XGBoost, Tree, SVR, and BPNN methods, the deterministic prediction results from 15 min to 90 min show that the proposed hybrid method has better deterministic prediction performance. In addition, the proposed method also shows good probabilistic prediction performance at different confidence levels compared to the XGBoost+QR, SVR+QR, and Deep AR methods. These experimental results demonstrate that the proposed hybrid intelligent model is an excellent solution to the wind power prediction problem. In the future, the proposed hybrid model will be of great attraction and practical application in power systems.

Author Contributions

J.Z.: conceptualization, methodology, and writing—original draft. R.Z.: conceptualization, methodology, writing—original draft, and supervision. Y.Z. (Yanfeng Zhao): resources, conceptualization, and formal analysis. J.Q.: resources and writing—review and editing. S.B.: resources, conceptualization, and writing—review and editing. Y.Z. (Yuxiang Zhu): methodology, writing—review and editing, visualization, and funding. G.L.: resources, visualization, editing, and funding. All authors have read and agreed to the published version of the manuscript.

Funding

This research was supported in part by the National Science Foundation of China under grant 61973177, in part by the Postgraduate Joint Training Base Project of Henan Province under grant YJS2022JD45, and in part by the Key Science and Technology Research of Henan Province under grant Nos. 232102210129, 232102210076, 232102210074, 232102211038, 222102210232, and 222102210279.

Data Availability Statement

Data sharing not applicable: data were obtained from the collaboration with companies and are not available for confidentiality reasons.

Conflicts of Interest

The authors declare no conflict of interest.

Abbreviations

The following abbreviations are used in this manuscript:
ARMAAuto-regressive moving average
NWPNumerical weather prediction
KNNK-nearest neighbors algorithm
SVRSupport vector regression
DTDecision tree
MLPMultilayer perceptron
RNNRecurrent neural network
CNNConvolutional neural network
DBNDeep belief network
DRLDeep reinforcement learning
CatBoostCategorical boosting
WTWavelet transform
QRQuantile regression
TSTarget-based statistics
GBDTGradient-boosting decision tree
MAEMean absolute error
RMSERoot mean square error
MAPEMean absolute percentage error
PICPPrediction interval coverage probability
AISAverage interval sharpness
XGBoosteXtreme gradient boosting
BPNNBack-propagation neural network

References

  1. GWEC. Global Wind Report; Global Wind Energy Council: Bonn, Germany, 2022. [Google Scholar]
  2. Cui, W.; Wan, C.; Song, Y. Ensemble Deep Learning-Based Non-Crossing Quantile Regression for Nonparametric Probabilistic Forecasting of Wind Power Generation. IEEE Trans. Power Syst. 2022, 1–16. [Google Scholar] [CrossRef]
  3. Choi, J.; Eom, H.; Baek, S.M. A Wind Power Probabilistic Model Using the Reflection Method and Multi-Kernel Function Kernel Density Estimation. Energies 2022, 15, 9436. [Google Scholar] [CrossRef]
  4. Liu, G.; Wang, C.; Qin, H.; Fu, J.; Shen, Q. A Novel Hybrid Machine Learning Model for Wind Speed Probabilistic Forecasting. Energies 2022, 15, 6942. [Google Scholar] [CrossRef]
  5. Liu, C.; Zhang, X.; Mei, S.; Zhen, Z.; Jia, M.; Li, Z.; Tang, H. Numerical weather prediction enhanced wind power forecasting: Rank ensemble and probabilistic fluctuation awareness. Appl. Energy 2022, 313, 118769. [Google Scholar] [CrossRef]
  6. Hoolohan, V.; Tomlin, A.S.; Cockerill, T. Improved near surface wind speed predictions using Gaussian process regression combined with numerical weather predictions and observed meteorological data. Renew. Energy 2018, 126, 1043–1054. [Google Scholar] [CrossRef]
  7. Hur, S.H. Short-term wind speed prediction using Extended Kalman filter and machine learning. Energy Rep. 2021, 7, 1046–1054. [Google Scholar] [CrossRef]
  8. Ezzat, A.A.; Jun, M.; Ding, Y. Spatio-temporal asymmetry of local wind fields and its impact on short-term wind forecasting. IEEE Trans. Sustain. Energy 2018, 9, 1437–1447. [Google Scholar] [CrossRef]
  9. Allen, D.; Tomlin, A.; Bale, C.; Skea, A.; Vosper, S.; Gallani, M. A boundary layer scaling technique for estimating near-surface wind energy using numerical weather prediction and wind map data. Appl. Energy 2017, 208, 1246–1257. [Google Scholar] [CrossRef]
  10. Li, Y.; He, Y.; Su, Y.; Shu, L. Forecasting the daily power output of a grid-connected photovoltaic system based on multivariate adaptive regression splines. Appl. Energy 2016, 180, 392–401. [Google Scholar] [CrossRef]
  11. Bae, K.Y.; Jang, H.S.; Jung, B.C.; Sung, D.K. Effect of prediction error of machine learning schemes on photovoltaic power trading based on energy storage systems. Energies 2019, 12, 1249. [Google Scholar] [CrossRef]
  12. Xu, D.; Liu, J.; Yan, X.G.; Yan, W. A novel adaptive neural network constrained control for a multi-area interconnected power system with hybrid energy storage. IEEE Trans. Ind. Electron. 2017, 65, 6625–6634. [Google Scholar] [CrossRef]
  13. Tripathy, D.S.; Prusty, B.R.; Bingi, K. A k-nearest neighbor-based averaging model for probabilistic PV generation forecasting. Int. J. Numer. Model. Electron. Netw. Devices Fields 2022, 35, e2983. [Google Scholar] [CrossRef]
  14. Maldonado, S.; Gonzalez, A.; Crone, S. Automatic time series analysis for electric load forecasting via support vector regression. Appl. Soft Comput. 2019, 83, 105616. [Google Scholar] [CrossRef]
  15. Torres-Barrán, A.; Alonso, Á.; Dorronsoro, J.R. Regression tree ensembles for wind energy and solar radiation prediction. Neurocomputing 2019, 326, 151–160. [Google Scholar] [CrossRef]
  16. Samadianfard, S.; Hashemi, S.; Kargar, K.; Izadyar, M.; Mostafaeipour, A.; Mosavi, A.; Nabipour, N.; Shamshirband, S. Wind speed prediction using a hybrid model of the multi-layer perceptron and whale optimization algorithm. Energy Rep. 2020, 6, 1147–1159. [Google Scholar] [CrossRef]
  17. Ma, Z.; Mei, G. A hybrid attention-based deep learning approach for wind power prediction. Appl. Energy 2022, 323, 119608. [Google Scholar] [CrossRef]
  18. Kisvari, A.; Lin, Z.; Liu, X. Wind power forecasting—A data-driven method along with gated recurrent neural network. Renew. Energy 2021, 163, 1895–1909. [Google Scholar] [CrossRef]
  19. Gu, C.; Li, H. Review on deep learning research and applications in wind and wave energy. Energies 2022, 15, 1510. [Google Scholar] [CrossRef]
  20. Wang, K.; Qi, X.; Liu, H.; Song, J. Deep belief network based k-means cluster approach for short-term wind power forecasting. Energy 2018, 165, 840–852. [Google Scholar] [CrossRef]
  21. Han, L.; Jing, H.; Zhang, R.; Gao, Z. Wind power forecast based on improved Long Short Term Memory network. Energy 2019, 189, 116300. [Google Scholar] [CrossRef]
  22. Zhang, W.; Chen, Q.; Yan, J.; Zhang, S.; Xu, J. A novel asynchronous deep reinforcement learning model with adaptive early forecasting method and reward incentive mechanism for short-term load forecasting. Energy 2021, 236, 121492. [Google Scholar] [CrossRef]
  23. Liu, X.; Zhang, L.; Zhang, Z.; Zhao, T.; Zou, L. Ultra Short Term Wind Power Prediction Model Based on WRF Wind Speed prediction and catboost. In Proceedings of the IOP Conference Series: Earth and Environmental Science, Sanya, China, 8–10 July 2021; Volume 838, p. 012001. [Google Scholar]
  24. Prokhorenkova, L.O.; Gusev, G.; Vorobev, A.; Dorogush, A.V.; Gulin, A. CatBoost: Unbiased boosting with categorical features. In Proceedings of the Advances in Neural Information Processing Systems 31: Annual Conference on Neural Information Processing Systems 2018, NeurIPS 2018, Montréal, QC, Canada, 3–8 December 2018; pp. 6639–6649. [Google Scholar]
  25. Wu, L.; Huang, G.; Fan, J.; Zhang, F.; Wang, X.; Zeng, W. Potential of kernel-based nonlinear extension of Arps decline model and gradient boosting with categorical features support for predicting daily global solar radiation in humid regions. Energy Convers. Manag. 2019, 183, 280–295. [Google Scholar] [CrossRef]
  26. Niu, D.; Diao, L.; Zang, Z.; Che, H.; Zhang, T.; Chen, X. A machine-learning approach combining wavelet packet denoising with Catboost for weather forecasting. Atmosphere 2021, 12, 1618. [Google Scholar] [CrossRef]
  27. Zhang, F.; Fleyeh, H.; Bales, C. A hybrid model based on bidirectional long short-term memory neural network and Catboost for short-term electricity spot price forecasting. J. Oper. Res. Soc. 2022, 73, 301–325. [Google Scholar] [CrossRef]
  28. Taylor, W.O.; Anagnostou, M.N.; Cerrai, D.; Anagnostou, E.N. Machine Learning Methods to Approximate Rainfall and Wind From Acoustic Underwater Measurements (February 2020). IEEE Trans. Geosci. Remote Sens. 2021, 59, 2810–2821. [Google Scholar] [CrossRef]
  29. Singh, R.; Gaonkar, G.; Bandre, V.; Sarang, N.; Deshpande, S. Gradient Boosting Approach for Traffic Flow Prediction Using CatBoost. In Proceedings of the 2021 International Conference on Advances in Computing, Communication, and Control (ICAC3), Mumbai, India, 3–4 December 2021; pp. 1–5. [Google Scholar]
  30. Massaoudi, M.; Refaat, S.S.; Abu-Rub, H.; Chihi, I.; Wesleti, F.S. A Hybrid Bayesian Ridge Regression-CWT-Catboost Model for PV Power Forecasting. In Proceedings of the 2020 IEEE Kansas Power and Energy Conference (KPEC), Manhattan, KS, USA, 13–14 July 2020; pp. 1–5. [Google Scholar]
  31. Liu, F.T.; Ting, K.M.; Zhou, Z.H. Isolation forest. In Proceedings of the 2008 eighth ieee international conference on data mining, Pisa, Italy, 15–19 December 2008; pp. 413–422. [Google Scholar]
  32. Liu, F.T.; Ting, K.M.; Zhou, Z.H. Isolation-based anomaly detection. ACM Trans. Knowl. Discov. Data 2012, 6, 1–39. [Google Scholar] [CrossRef]
  33. Tascikaraoglu, A.; Sanandaji, B.M.; Poolla, K.; Varaiya, P. Exploiting sparsity of interconnections in spatio-temporal wind speed forecasting using Wavelet Transform. Appl. Energy 2016, 165, 735–747. [Google Scholar] [CrossRef]
  34. Chen, T.; Guestrin, C. XGBoost: A Scalable Tree Boosting System. In Proceedings of the 22nd ACM SIGKDD International Conference on Knowledge Discovery and Data Mining, San Francisco, CA, USA, 13–17 August 2016; Krishnapuram, B., Shah, M., Smola, A.J., Aggarwal, C.C., Shen, D., Rastogi, R., Eds.; ACM: New York, NY, USA, 2016; pp. 785–794. [Google Scholar] [CrossRef]
  35. Ke, G.; Meng, Q.; Finley, T.; Wang, T.; Chen, W.; Ma, W.; Ye, Q.; Liu, T.Y. Lightgbm: A highly efficient gradient boosting decision tree. In Proceedings of the Advances in Neural Information Processing Systems 30: Annual Conference on Neural Information Processing Systems 2017, Long Beach, CA, USA, 4–9 December 2017; pp. 3146–3154. [Google Scholar]
  36. Dorogush, A.V.; Ershov, V.; Gulin, A. CatBoost: Gradient boosting with categorical features support. arXiv 2018, arXiv:1810.11363. [Google Scholar]
  37. Bracale, A.; Caramia, P.; De Falco, P.; Hong, T. Multivariate quantile regression for short-term probabilistic load forecasting. IEEE Trans. Power Syst. 2019, 35, 628–638. [Google Scholar] [CrossRef]
  38. Lauret, P.; David, M.; Pedro, H.T. Probabilistic solar forecasting using quantile regression models. Energies 2017, 10, 1591. [Google Scholar] [CrossRef]
  39. Wang, J.; Wang, S.; Li, Z. Wind speed deterministic forecasting and probabilistic interval forecasting approach based on deep learning, modified tunicate swarm algorithm, and quantile regression. Renew. Energy 2021, 179, 1246–1261. [Google Scholar] [CrossRef]
  40. Gunawan, A.; Thamrin, S.; Kuntjoro, Y.D.; Idris, A.M. Backpropagation Neural Network (BPNN) Algorithm for Predicting Wind Speed Patterns in East Nusa Tenggara. Trends Renew. Energy 2022, 8, 107–118. [Google Scholar] [CrossRef]
  41. Salinas, D.; Flunkert, V.; Gasthaus, J.; Januschowski, T. DeepAR: Probabilistic forecasting with autoregressive recurrent networks. Int. J. Forecast. 2020, 36, 1181–1191. [Google Scholar] [CrossRef]
  42. Xu, X.; Lei, Y.; Li, Z. An incorrect data detection method for big data cleaning of machinery condition monitoring. IEEE Trans. Ind. Electron. 2019, 67, 2326–2336. [Google Scholar] [CrossRef]
  43. De Vito, S.; Di Francia, G.; Esposito, E.; Ferlito, S.; Formisano, F.; Massera, E. Adaptive machine learning strategies for network calibration of IoT smart air quality monitoring devices. Pattern Recognit. Lett. 2020, 136, 264–271. [Google Scholar] [CrossRef]
  44. Lin, Y.; Wang, J. Probabilistic deep autoencoder for power system measurement outlier detection and reconstruction. IEEE Trans. Smart Grid 2019, 11, 1796–1798. [Google Scholar] [CrossRef]
Figure 1. The main steps of the prediction process for the proposed model.
Energies 16 04237 g001
Figure 2. The MAPE results of isolated forest for different outlier ratios.
Energies 16 04237 g002
Figure 3. The MAPE results for different outlier detection methods.
Energies 16 04237 g003
Figure 4. The 15-min-ahead wind power forecasting results of different prediction models for Case 1.
Energies 16 04237 g004
Figure 5. The 15-min-ahead wind power forecasting results of different prediction models for Case 2.
Energies 16 04237 g005
Figure 6. The MAPE statistics for different forecasting horizons in Case 1.
Energies 16 04237 g006
Figure 7. The MAPE statistics for different forecasting horizons in Case 2.
Energies 16 04237 g007
Figure 8. The 30-min-ahead prediction interval with 80% confidence level obtained from the proposed hybrid method in Case 1.
Energies 16 04237 g008
Figure 9. The 30-min-ahead prediction interval with 80% confidence level obtained from the proposed hybrid method in Case 2.
Energies 16 04237 g009
Figure 10. The AIS statistics under different confidence levels in Case 1.
Energies 16 04237 g010
Figure 11. The AIS statistics under different confidence levels in Case 2.
Energies 16 04237 g011
Table 1. Performance evaluation for the 15-min-ahead predicted results.
MethodsCase 1Case 2Average
MAERMSEMAPEMAERMSEMAPEMAERMSEMAPE
Proposed1.29471.83130.03991.06841.70280.05141.18161.76710.0457
XGBoost3.12234.28450.09572.65754.12480.12952.88994.20470.1126
Tree3.42864.57330.10612.94844.49290.14683.18854.53310.1265
SVR3.50994.67700.12133.59964.76090.16083.55484.71890.1410
BPNN3.17644.34750.09782.66984.15830.13012.92314.25290.1139
Table 2. Performance evaluation for the 30-min-ahead predicted results.
Week Indexes1–7 February 20201–7 July 2020Average
MAERMSEMAERMSEMAERMSE
Proposed1.95612.73551.70322.63811.82962.6868
XGBoost4.80456.47424.19776.33914.50116.4066
Tree5.24117.17904.49806.68824.87106.9336
SVR5.15236.92574.93916.87265.04576.8991
BPNN4.68846.31734.26776.42324.47806.3703
Table 3. The 30-min-ahead probabilistic ACP and AIS at 80% confidence level in these two cases.
CaseMetricXGBoost+QRSVR+QRDeep ARProposed
Case 1PICP100%100%100%100%
AIS−6.1008−6.4662−6.1687−2.5151
Case 2PICP100%68%100%100%
AIS−5.1985−6.3533−5.0871−1.9611
Disclaimer/Publisher’s Note: The statements, opinions and data contained in all publications are solely those of the individual author(s) and contributor(s) and not of MDPI and/or the editor(s). MDPI and/or the editor(s) disclaim responsibility for any injury to people or property resulting from any ideas, methods, instructions or products referred to in the content.

