1. Introduction
This review deals with both high-pressure and low-pressure pneumatic systems. In high-pressure pneumatic systems, compressed air is usually stored in a tank, with pressures ranging from 100 to 500 bar depending on specific applications. High-pressure pneumatics play an important role in modern manufacturing processes, modern technologies, and energy storage. High-pressure compressed air has many applications, most commonly in air propulsion systems (200 bar), underwater survey activities (450 bar) and air storage in tanks (500 bar). Most applications of low-pressure industrial pneumatic systems use up to 10 bar pressures. In industrial practice, this pressure level is used for operational and economic reasons. The low-pressure pneumatic system is also due to the technical capability of single-stage compressors. These compressors can be stationary or mobile, depending on their intended use. Low-pressure pneumatic systems are compressed air systems (CAS) used in industry, manufacturing, mining, power engineering, road transport, railway, marine and aviation, pneumatic tools, medical equipment, blow-off technology, cleaning, and cooling, etc. [
1]. CAS networks are used to transmit and deliver compressed air energy (CAE) to pneumatic equipment (actuators, motors, engines, tools), machinery, and conveyors, etc. Compressed air must be delivered with sufficient capacity, pressure and quality to meet the demand of consumers and ensure the proper operation of pneumatic devices [
2]. Incorrectly designed and selected CAS can increase energy costs, cause equipment failures, reduce production efficiency, and increase maintenance requirements [
3]. In CAS, there are also many cases of wasted compressed air energy, mainly due to leaks, pressure drops, overpressure, misuse, and mismanagement of the compressed air distribution [
4]. Industrial CAS consists of three major parts: the compressed air production plant (compressors, compressed air tanks, drying, filters, regulator systems), the compressed air pipeline, and compressed air consumers [
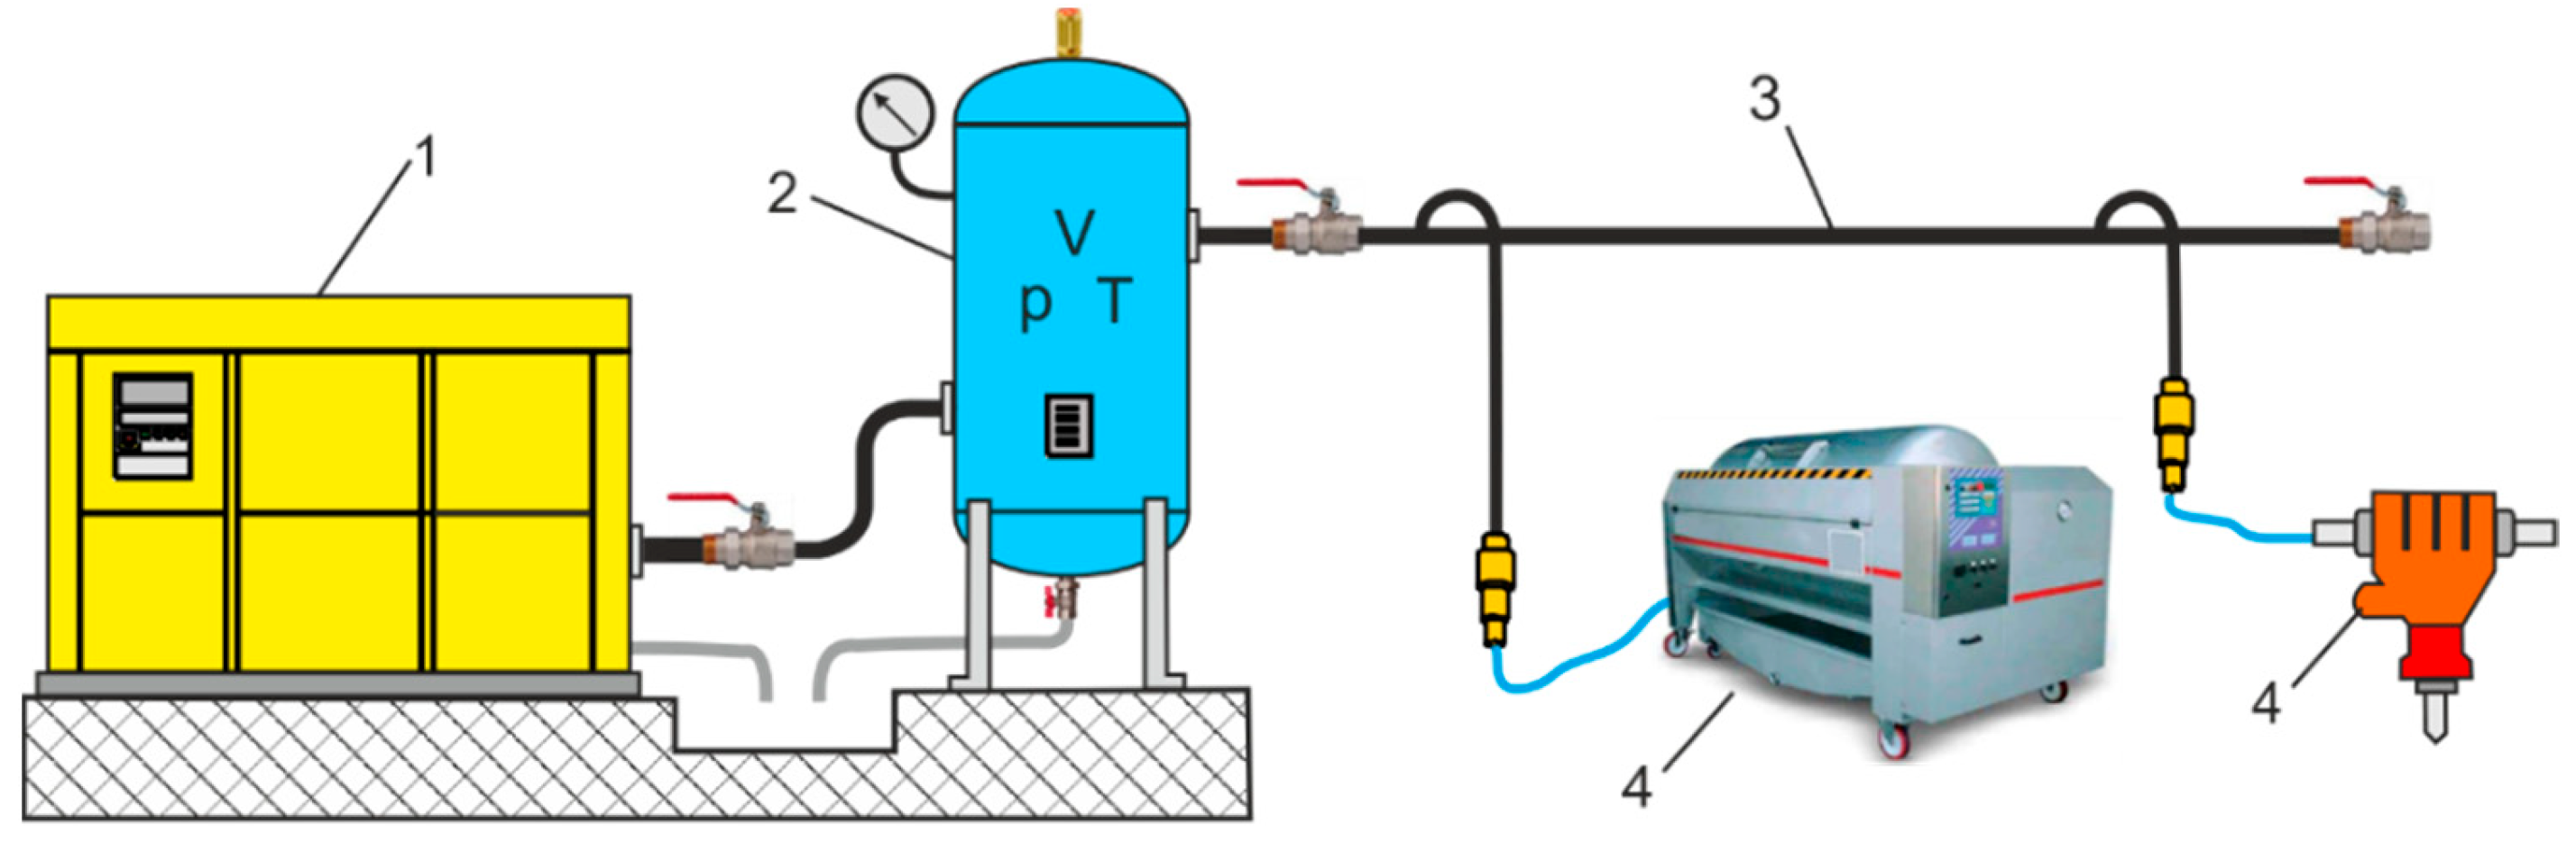
5]. To receive, store and deliver compressed air, CASs use compressed air receiving tanks (CARTs), also called air compressor tanks, compressed air tanks, compressed air receivers, or compressed air storage tanks. CARTs provide additional compressed air capacity during periods of increased demand and provide a reserve of compressed air when the air compressor is turned off. The compressed air stored in CART is used as a temporary demand spike, known as “events of sudden demand”, and as a standby supply system when a short-term power outage occurs and the compressor loses power unexpectedly (usually due to a breakdown). In the event of short-term demand for high air capacity at long intervals, stand-alone tanks are used. Large stand-alone expansion tanks are used for a small-capacity compressor. Two types of CARTs are used in the CASs:
Figure 1 shows a diagram of an industrial CAS with a separate stand-alone CART located near the compressor.
In general, there may be one or more vertical or horizontal CARTs in a CAS that receive air from the compressor, store it under pressure, and deliver it to the final use. CARTs are used in different sizes: small horizontals from 5 to 50 L and large verticals from 100 to 5000 L. The size of a CART is determined by the compressor capacity and the demand for compressed air. CART calculations for compressed air demand are not restricted to the sum of each unit’s air consumption. The total consumption of compressed air is the sum of the air consumed by users, including increases of 10% to 20% of the compressed air demand. Catalogue air consumption data for tools and air machines are the basis for calculating the required CART capacity. Other factors that affect air consumption should also be considered [
6], such as leakage, pressure loss, utilization factor, adapting the compressor to air consumption, extremely short air consumption peak, and future changes in air demand. At some points of CAS installation with high air consumption located at a considerable distance from the compressor, a stand-alone CART must be used. A CART balances the pulsation of the compressor pressure and ensures constant pressure in the pipelines. A side function of a CART is to cool the air and collect condensate [
7].
A CART is an energy storage device charged from an external source that releases this energy into pneumatic systems. Energy savings are possible in the production and treatment of compressed air, compressed air networks, end-use devices, general design, and system operation [
8]. Some of that energy is lost as a result of CAS inefficiencies, pressure losses and leaks, and other constraints. Energy losses in CAS can be divided into three main groups: losses due to waste, artificial demand, and inadequate usable energy. Energy savings opportunities in CAS [
9]:
Reduction in electrical consumption for compressor drive, improvement of compressor efficiency (16% energy savings).
Reducing energy losses in CASs by reducing air leakage and pressure losses (energy savings of 18%).
Increasing the efficiency of pneumatic control, using new methods of energy saving control (2% energy savings).
Reducing the cost of energy demand and reducing operating time decreases operating pressure (it is difficult to estimate energy savings).
Reducing the air-inlet temperature by 1% results in energy savings of 3%. The higher the pressure required for the CAS, the higher the cost of producing compressed air. Reducing energy consumption contributes to reducing carbon dioxide (CO
2) emissions into the atmosphere. In the European Union, CAS energy consumption accounts for approximately 10% of total industrial energy consumption. Approximately 75% of CAS operating costs are related to energy consumption. The efficiency of the CAS system is very limited due to misuse, mismanagement, and the low efficiency of pneumatic components, which is approximately 30%. Increasing the size of the tank results in greater energy savings. For example, a tank upsizing from 2.5 m
3 to 4.2 m
3 should increase the compressor idle time by 62%. Publication [
10] presents a systemic approach to CAS energy efficiency, including, among others: system analysis and harmonization of compressed air production and consumption, minimization of losses, optimization of pneumatic systems, ans automation and integration of the device.
CART also improves CAS performance and efficiency by reducing the number of compressor cycles, damping the air pulsation of the compressor, and removing dirt from the compressor. By reducing the number of air compressor cycles, CART reduces the peak demand for compressed air. In turn, reducing the number of compressor cycles reduces energy consumption and component wear and thus extends the life of the compressor. The CART works like a damper, absorbing vibrations from the air compressor motor and pulses from the air stream. This minimizes the stress on the pipes and other CAS components. Particulates entering the air stream due to corrosion processes in the pipe and compressor wear processes may be deposited in the CART. As a result, the airflow from the CART is cleaner and drier than that coming directly from the air compressor.
Improving the energy efficiency of CART means using less energy from compressed air to perform the same task or achieve the same result. Therefore, improving the energy efficiency of a CART contributes to eliminating energy wastage. This means that improving the energy efficiency of CART saves money on compressing air, reduces energy costs for consumers, improves the competitiveness of businesses, increases the robustness and reliability of CAS, and contributes to the protection of the environment as one of the most cost-effective means of combating climate change and a vital component in achieving net zero carbon dioxide.
Pneumatic energy efficiency is the ratio of the useful output of the work to the energy input of a pneumatic system. Energy efficiency indicates how well a system converts the energy stored in a CART into mechanical work. Higher air efficiency results in lower consumption and energy costs, as well as a lower environmental impact. The pneumatic efficiency can vary depending on the type, design, and operation of the system. Several factors, such as air quality, pressure, flow, and consumption, can influence the energy efficiency of a pneumatic system. Contaminants can cause friction and damage, which is why it is important to use filters and dryers to keep the air supply clean. Compressed air pressure affects the output power of pneumatic components, so regulators and valves must be used to control flow and pressure. In addition, pipes and hoses of the appropriate size and material should be used to optimize airflow and reduce pressure drop. Finally, pneumatic components must be designed to reduce power consumption and costs. Improving the energy efficiency of a pneumatic system depends on optimizing the factors that affect it, such as air quality, air pressure, airflow, air consumption, and operating conditions. Intelligent and energy-efficient pneumatic components must be used to adjust the pressure and air flow according to the load and demand of the application. Compressed air management systems can also be used to monitor and optimize the operation and performance of the compressor and pneumatic system. These systems usually include variable-speed drives, pressure sensors, and energy counters. Regular maintenance and inspection also contribute to optimizing CAS energy efficiency, reducing air consumption, noise, and waste, and improving the performance and service life of pneumatic equipment.
2. CART Calculations and Selection
The selection of air compressors for the CART size depends on four factors: the capacity of the air compressor, the peak capacity requirements for the maximum demand, the diameter of the piping, and the consistency of the stored air (good consistency is that 1/3 should be wet and 2/3 should be dry). Article [
11] analyzes the reciprocating compressor and CART in the context of variable air consumption. The most important is the selection of a CART size based on the compressor capacity and the demand for compressed air (air consumption). In the case of multiple compressors, the minimum recommended tank volume is adjusted to the maximum compressor capacity. The volume of the tank depends on the control mode of the air compressor. The variable-speed drive (VSD) air compressor requires a significant reduction in tank volume. In the dual control mode of the compressor, the load/unload mode, requires the tank volume to be calculated as follows [
12],
where
V is the tank volume in m
3,
pa is the atmospheric pressure in kPa,
pmax is the maximum pressure in the receiver (cut-out pressure) in kPa,
pmin is the minimum pressure in the receiver (cut-in pressure) in kPa, and
fc are the allowed cycles of load/unload of a compressor in 1/h, and σ is the it is the ratio of the required air consumption of
qr in m
3/min and the compressor capacity of
qc in m
3/min
The σ ratio depends on the type of compressor, for a reciprocating compressor σ = 0.5, and for a screw compressor σ = 0.092.
The volume required of the air tank for an average demand of compressed air within a certain pressure range is
where
V is the volume of the receiving tank in m
3,
qd is the demand for compressed air in m
3/min,
pa is the atmospheric pressure in kPa,
t is the time (min),
p1 is the initial tank pressure (kPa),
p2 is the final tank pressure (kPa), and Δ
p is the permissible pressure drop.
From (2), the time of the allowed pressure drop is
The air receiving tank is also used to adjust the rate of pressure drop for end users,
where
K is the constant factor,
K =
pa/
V.
The mass balance equation in a CART during the compression and expansion processes is determined by the ideal gas law
where Δ
m is the change mass inside a CART volume,
T2 is the final temperature,
T1 is the initial temperature, and
R is the individual gas constant.
The influence of temperature is ignored in the technical calculations of the volume and the allowed pressure drop time. The temperature in the CAS is about the same as the ambient temperature. Under isothermal conditions, the air power is given as
where
p is the absolute pressure (equal to the gauge pressure
pg and the atmospheric pressure
pa).
To evaluate the energy efficiency of the CAS, various key energy performance indicators are used, such as specific power consumption (
SPC) in kW/Nm
3/h (kWh/Nm
3), defined as the relationship between compressor power in kW and free air delivery (FAD) in Nm
3/h:
where
PA is the average compressor power, and
qFAD is the free air delivery of the compressor;
where
qcn is the normal compressor capacity in Nm
3/h,
pn is the normal pressure,
pn = 101.325 kPa,
pi is the inlet pressure in kPa,
Tn is the normal temperature,
Tn = 273.15 K,
Ti is the inlet temperature.
The compressor capacity
qc is converted to FAD, which refers to the compression of air from the inlet pressure to the discharge pressure [
13]. To produce 1 Nm
3 of compressed air, approximately
SPC = 0.10 kWh/Nm
3 [
14] is required.
Calculation of annual energy consumption:
where
EC is the annual energy consumption (kWh/year), and
H is the annual operating hours (h/year).
Calculations of annual energy cost:
where
AEC is the annual energy costs (€/year), and
ER is the energy rate (€/kWh).
The carbon dioxide (CO
2) emission ratio is defined as the amount of carbon dioxide (in kg) generated during the production of 1 m
3/h of compressed air.
where
CER is the CO
2 emission ratio in kgCO
2/m
3/h,
EI is the intensity of CO
2 emission in kgCO
2/kWh, in 2016 for the European Union
EI = 0.2958 kgCO
2/kWh, in 2022 for Poland
EI = 0.667 kgCO
2/kWh.
3. CART in Measurement Systems
Methods of charging and discharge of the air tank according to [
15] are used as alternative methods to determine the flow characteristics of the pneumatic components. To measure the flow parameters of pneumatic components, air tanks are used for the in-line test and the air exhaust test in the atmosphere. The schematic diagrams of the measurement systems to determine the flow characteristics of the pneumatic components are presented in
Figure 2.
Air tank methods are used to determine the instantaneous mass flow rate, sonic conductance, the critical pressure ratio of pneumatic components, and the charging and discharging times of the tank [
16,
17]. In the paper [
18], the discharge of the supply tank and the charging of the isothermal tank were used to test the flow in various pressure regulators. The article [
19] proposes a method to calculate the flow rate characteristics of pneumatic components during the isothermal discharge of air tanks.
In the mechatronics laboratory at the Kielce University of Technology, Poland, a measurement test stand based on the tank method was built. This test stand measures the static characteristics of the proportional directional control valves, the flow rate
qv =
f(
u) and the pressure
p =
f(
u) according to the control signal
u.
Figure 3 shows a diagram of the measuring test stand of the static characteristics of the proportional directional control valves. The flow rate on the way 1 → 2 and 1 → 4 of the proportional directional control valve is adjusted by the proportional electromagnetic solenoid in the voltage range
u from 0 to 10 V. The air decompressed in the tank at pressure
p1 flows through the proportional valve along path 1 → 2 to the air compression tank at pressure
p2, and through path 1 → 4 to the air compression tank at pressure
p4. Pressure changes in tanks are measured with pressure transducers. The measurement method consists of determining the mass flow rate through the proportional directional control valve based on the pressure measurement in the air compression tanks at constant volume (
V = const),
where
Vi is the volume of the
i-th air compression tank, and
is the specific volume of the
i-th air compression tank.
The result of the processes of adiabatic expansion and compression of air in tanks are equations
where
p1 is the pressure in the air expansion tank,
pi is the pressure in the i-th air compression tanks, and
κ is the adiabatic index.
Differentiating the equation of the adiabatic process leads to the solution.
After substituting (14) and (15) into the relationship (13), a formula is obtained for the mass flow
qmi and volume and
qvi through the proportional directional control valves:
Leakage in CAS is usually the largest source of energy waste associated with compressed air usage. Leakage not only wastes energy in the CAS, but also results in pressure drops that affect the operation of pneumatic systems. Leakage causes considerable waste, often up to 40–50% of energy consumption. Leakage can occur at a number of points in a compressed air pneumatic pipeline system. Leakage in compressed air pipes can be estimated by measuring the pressure drop in a CART.
Figure 4 shows a diagram for measuring leaks using a CART pressure drop test.
The volumetric leakage rate can be estimated by
where:
V is the volume of a CART,
p1 is the absolute operating pressure,
p2 is the absolute lower pressure,
pa is the atmospheric pressure, and
t is the leakage time.
Power loss
PL due to leakage in CAS:
Annual energy losses (
AEL) due to annual leakage in compressed air installation:
where
HL is the annual leakage in hours.
Annual energy cost due to leakage losses (
AECL) in compressed air installation:
The leakage is also proportional to the operating pressure, and if the pressure is reduced to 0.3 bar, the leakage is reduced by 4% [
20]. Compressed air leaks are usually not noticed and may “silently” cause unnecessary costs, even during production breaks or weekends.
Energy losses due to compressed air leaks in the CAS are associated with additional CART charging. This implies the additional use of electricity to power the compressor, that is, it is a waste of energy. This waste of energy contributes to the carbon dioxide emissions rate, that is:
where
CERL is the carbon dioxide emission rate in kgCO
2/m
3/h.
The authors proposed a patented automatic parameter measurement in pipeline branches to directly measure CAS leak rates [
21,
22,
23]. This method estimates the pressure drop ratio of a tank over two time intervals.
Figure 5 shows the author’s patented automatic measurement system (AMS) to measure the flow rate through leaks in industrial compressed air pipes. This new indirect method of compressed air leakage is estimated by measuring pressure drop ratios in two-time intervals. The method of measuring compressed air leakage in a pneumatic system based on indirect measurement consists of determining the relation between the air flow
qL at the leak point and the air flow rate
qvc measured with a flow meter on the branch of pipeline.
The theoretical basis for measuring a leak in pneumatic pipes is the mass flow of compressed air:
where
dm is the differential mass,
ρ is the density,
V is the volume of CART.
For a constant volume
V (
V = const), the left component of the right side (6) is omitted, and we obtain the following,
Compressed air leakage in pneumatic pipes occurs at a pressure that decreases with time dp/dt and at a nearly constant temperature T = idem.
Equation (24) with respect to the polytropic process of a perfect gas is given as follows:
where
p is the absolute pressure,
T is the absolute temperature,
R is the specific gas constant,
n is the polytropic index.
Based on (25), considering the Clapeyron equation for a perfect gas, the volumetric flow rate
qv is as follows.
When the entire compressed air consumption device is switched off, then the total leakage flow
qL occurs at the leak points
The compressed air leakage equations in two measured states are determined on the basis of (26) and (27):
- −
for air leakage without controlled flow
- −
for air leakage with controlled flow
where
qvc is the volume of air flow through the adjustable control unit (measured by a flowmeter),
pL is the absolute measurement pressure during leakage without the controlled flow,
pLc is the absolute measurement pressure during leakage with the controlled flow,
tL is the measurement time during leakage without the controlled flow, and
tLc is the measurement time during air leakage with the controlled flow.
For the instantaneous leakage flow rate, differentials (28) and (29) were transformed using a logarithmic function of the form:
where
pLu,
pLd are the absolute pressure values upstream and downstream during leakage without controlled flow and
pLcu,
pLcd are the absolute pressure values upstream and downstream during leakage with controlled flow.
The transformation of (30) and (31) gives the formula for calculating the leakage flow rate
qL based on the controlled flow in the branch line:
This method consists of measuring the pressure drop ratio. This measurement method allows us to measure leakage in a wide range from very small (local) values to very large values, e.g., in the event of serious damage to pneumatic equipment. The proposed method is convenient for automatically measuring the leakage rate in any compressed air piping system.
Another method is to measure gas leakage with a connected parallel valve based on standard flow through a calibrated orifice [
24,
25]. This method is based on the measurement of pressure drop in two ranges:
- −
first range without valve flow
- −
second range with the valve flow
where
qL is the total air leakage flow rate,
qvs is the standard volumetric flow rate through a calibrated orifice, Δ
p1 is the pressure drop in the first range, Δ
p2 is the pressure drop in the second range, Δ
t1 is the time period of the first range, Δ
t2 is the time period of the second range,
p1 is the initial absolute pressure in the first range, and
p2 is the initial absolute pressure in the second range.
Transformations (33) and (34) give the formula for calculating the leakage flow
qL based on the standard flow in the valve in the parallel connecting line:
The disadvantage of this measurement method is the need to determine the relative pressure drop Δp/p in the pneumatic pipeline and the appropriate adjustment of the flow through the calibrated orifice to the leakage flow.
4. Review of CART Application
CARTs are used in various pneumatic installations and are called tanks, receivers, reservoirs, or vessels, depending on their applications. So-called compressed air containers are used by truckers, trailers, special vehicles, or railways.
Some articles explore the possibility of recovering and storing compressed air energy by introducing additional CARTs into the pneumatic control system. Examples of energy-efficient pneumatic control systems are discussed in [
26]. In [
27], methods for reducing air consumption in pneumatic actuator systems were proposed. CART is used to absorb exhausted compression air, and a booster valve raises the air to a higher pressure to be used again. According to experiments, cylinder exhaust air can save about 40% of compressed air. A pneumatic cylinder very often produces thrust in only one direction when the piston rod is extending, and in the opposite direction when the piston rod is retracting, a much lower pressure is sufficient. Here, it is possible to use CART to reduce the supply pressure. Energy savings consist of accumulating exhaust air in a CART recovered from the pneumatic cylinder as it is extended. The energy stored in a CART is then used to retract the actuator. Energy savings in the pneumatic cylinder system is associated with reduced consumption of compressed air.
Figure 6 shows a schematic diagram of an energy-efficient pneumatic system based on the concepts of the authors in this review. The air consumption in a pneumatic cylinder decreases as the operating pressure is reduced. The standard operating gauge pressure for the pneumatic system is 6 bar (0.6 MPa). The optimization of air consumption in pneumatic cylinders has several advantages: reduction in energy consumption, reduction in operating costs, reduction in maintenance and service costs, and reduction in unplanned downtime and related costs. The average air consumption in a double-acting pneumatic cylinder for various pressures in the extension and retraction directions is calculated using the formula:
where
qvc is the average air consumption in the double-acting pneumatic cylinder,
s is the stroke of the piston,
n is the number of cycles,
pa is the ambient pressure,
Ae is the area of the piston in the extend direction,
Ar is the area of the piston in the retract direction,
pe is the absolute extend pressure, and
pr is the absolute retract pressure.
The energy of compressed air in a CART at adiabatic expansion from the pressure
pri can be calculated from the formula:
where
V is the tank volume,
κ is the air adiabatic index (specific heat ratio),
κ = 1.4.
The energy requirement reduction from a CART resulting from retract pressure reduction in the pneumatic cylinder can be determined by the energy consumption rate (
ECR),
The bar graphs in
Figure 7 show the relative air consumption in the pneumatic cylinder and the energy requirement of a CART in relation to the absolute retract pressure of the pneumatic cylinder. After reducing the retract pressure from 7 to 3 bar, the air consumption in the pneumatic cylinder was reduced by 58% and the energy requirement in a CART was reduced by 72%.
The pneumatic brake system consists of a supply reservoir, a primary reservoir (rear reservoir), a secondary reservoir (front reservoir), and a parking reservoir [
28]. Compressed air stored in the supply reservoir is distributed through a four-way protection valve to the primary and the secondary reservoir. The safety of vehicle braking depends on the energy stored in the air reservoirs. According to the modelled curves, the time needed to reach a minimum acceptable pressure of 6.5 bar was determined in the air reservoir.
Figure 8 shows the simplified diagram of the tractor trailer air brake system. In five minutes, the pressure in the air storage reservoir should not drop 0.2 bar below the shutdown pressure specified by the vehicle manufacturer when the engine is idle [
29].
Article [
30] describes a methodology to test the performance of the tractor pneumatic braking system while taking into account the regulations developed by the Working Group on Agricultural Tractors (WGAT) of the European Commission. The charging time of the reserve air tank and the average pressure increase time were analyzed. The values obtained are lower than the maximum allowed values for tractors designed to haul trailers. The proper selection of the compressed air reservoir in the two-line system was checked by performing additional full braking. The test results show that the pressure in the compressed air tank was correctly chosen.
To improve the energy efficiency of multiple actuator pneumatic systems, the control system was designed and tested to recover compressed air [
31]. This article explains the sustainable operating procedure of a multi-actuator pneumatic system by collecting and reusing the compressed air used. The main disadvantage of the proposed approach is the increase in the cycle time of the pneumatic system. This was caused by the lowering of pressure and the modification of the control characteristics of the pneumatic circuit. Compared to the standard pneumatic system, the air consumption in the recovery system at 4 bar was reduced by 4.54 L per manipulator cycle, or 37%. Based on the results [
31], a bar chart was presented in
Figure 9 showing the energy efficiency (energy savings) of the compressed air recovery system.
The new proposed exhausted air recycling system (EARS) is shown schematically in
Figure 10. The tests showed the possibility of recovering compressed air energy from pneumatic actuators and tools previously exhausted in the atmosphere. Energy from the exhaust air recovered for a CART is converted into electricity through an air turbine motor and a DC generator. The exhaust air from the pneumatic devices is collected in a low-pressure intermediate air tank. The low 2 bar exhaust air pressure is then increased to 10 bar output pressure in the pressure booster. Under workshop conditions, the EARS is used, which provides a closed loop between the air compressor and the air tools, capturing the exhausted air from the pneumatic tools and returning to the compressor. Compared to traditional pneumatic tools, energy consumption is reduced by almost 50% and noise levels by 40% to 80% [
32]. The article demonstrated the development of technology for recovering the energy from the exhaust air from pneumatic actuators. The recovered low-pressure air was used to power a pneumatic system that converts mechanical energy into electrical energy. A device called an energy harvesting unit (EHU) has also been demonstrated that converts the stored energy of compressed air into electrical energy. Experiments have shown that around 20–50% of the exhaust air can be recovered using this system.
In paper [
33], the energy recovery configuration and working principles are introduced. The results of the experiments showed that the energy efficiency exceeded 23%. When the number of exhaust air collection cycles increases, the air pressure gradually increases. For 5 cycles, the air pressure in the reservoir reaches 4.36 bar, as shown in the bar charts in
Figure 11.
The article [
34] presents a hybrid pneumatic electric system to recycle compressed air energy from the output of pneumatic actuators to produce electricity. A control strategy has been developed to manage the actuation system and ensure a proper energy recovery operation. Compared to an upstream vane air motor, exhaust energy recovery has been found to increase energy efficiency from 7.2% to 15.3% over a supply air pressure range of 3.5 to 6.4 bar. Based on the results of [
34],
Figure 12 presents a bar chart showing energy recycling in the compressed air system.
Reusing exhaust air is one way to recover energy in pneumatic control systems [
35]. Typical air tanks have an energy density that is too low for effective exhaust air recovery. To solve this problem, constant-pressure elastic accumulators can be used in the pneumatic system. The elastic accumulator is used to receive the exhausted air from the primary cylinder. The secondary cylinder is supplied from this accumulator, but not by the air compressor. It is a means of saving energy and improving the energy efficiency of the air system.
Numerous energy storage solutions are available depending on the energy conversion source. Energy storage technologies stand out: electrical, thermal, electrochemical, mechanical, hydro-pumped, and compressed air. The compressed air energy source (CAES) is the most suitable energy storage technology for long-term and full-scale applications [
36,
37]. In CAES, high-pressure compressed air (between 45 and 74 bars) is stored in underground structures (abandoned mines, aquifers, rock caverns) or in surface tanks. The surplus electricity (off-peak) is converted into compressed air stored in tanks. When there is a need to generate additional electrical power (during peak load), stored compressed air is used to drive the air expanders and actuate the electrical generator. CAES can come in a variety of configurations depending on specific operating conditions. CAES can be used on a large scale, has a quick start-up time (about 9 min during an emergency start-up), and is an inexpensive installation when geological formation is used. A typical large-scale CAES capability is in the range of 50 to 300 MW. CAESs are potentially attractive for levelling power loads in electrical networks. On a small scale, CAES uses CARTs to store compressed air energy [
38]. Paper [
39] presents a small-scale compressed air energy storage system (CAES) with a DC generator driven by a pneumatic motor, when the power source is a small stand-alone CART. This energy harvesting unit operated at an average power of 92 W, reached a maximum power of 289 W, produced 7.7 kJ of electricity, and had an energy efficiency of 51%.
Figure 13 shows the basic diagram of a small-scale CAES system.
Experimental study [
40] evaluated the use of compressed air in energy storage as a potential replacement for electrochemical batteries. A CART with a storage pressure of 80–100 bar and a capacity of 12 m
3 equals a 12 V electric battery.
CART as power sources is used in many small motor vehicles, such as bicycles, tricycles, and four wheelers [
41]. The implementation of compressed air in light-duty propulsion vehicles will reduce pollutant emissions from transport by 50% to 60% [
42]. The propulsion mechanism of the tricycle is an important design for its operation. Two solutions are accepted, air motors and pneumatic cylinders [
43,
44]. Air motors are more interesting in applications for the propulsion of light-duty vehicles because of their high torque in relation to mass. However, the cost-effectiveness of using a pneumatic cylinder that can easily be coupled to a bicycle wheel must be considered [
45]. The propulsion of the bike is adapted to its construction. Traditional tricycle models look like upright models, but there are also recumbent deltas or recumbent tadpoles.
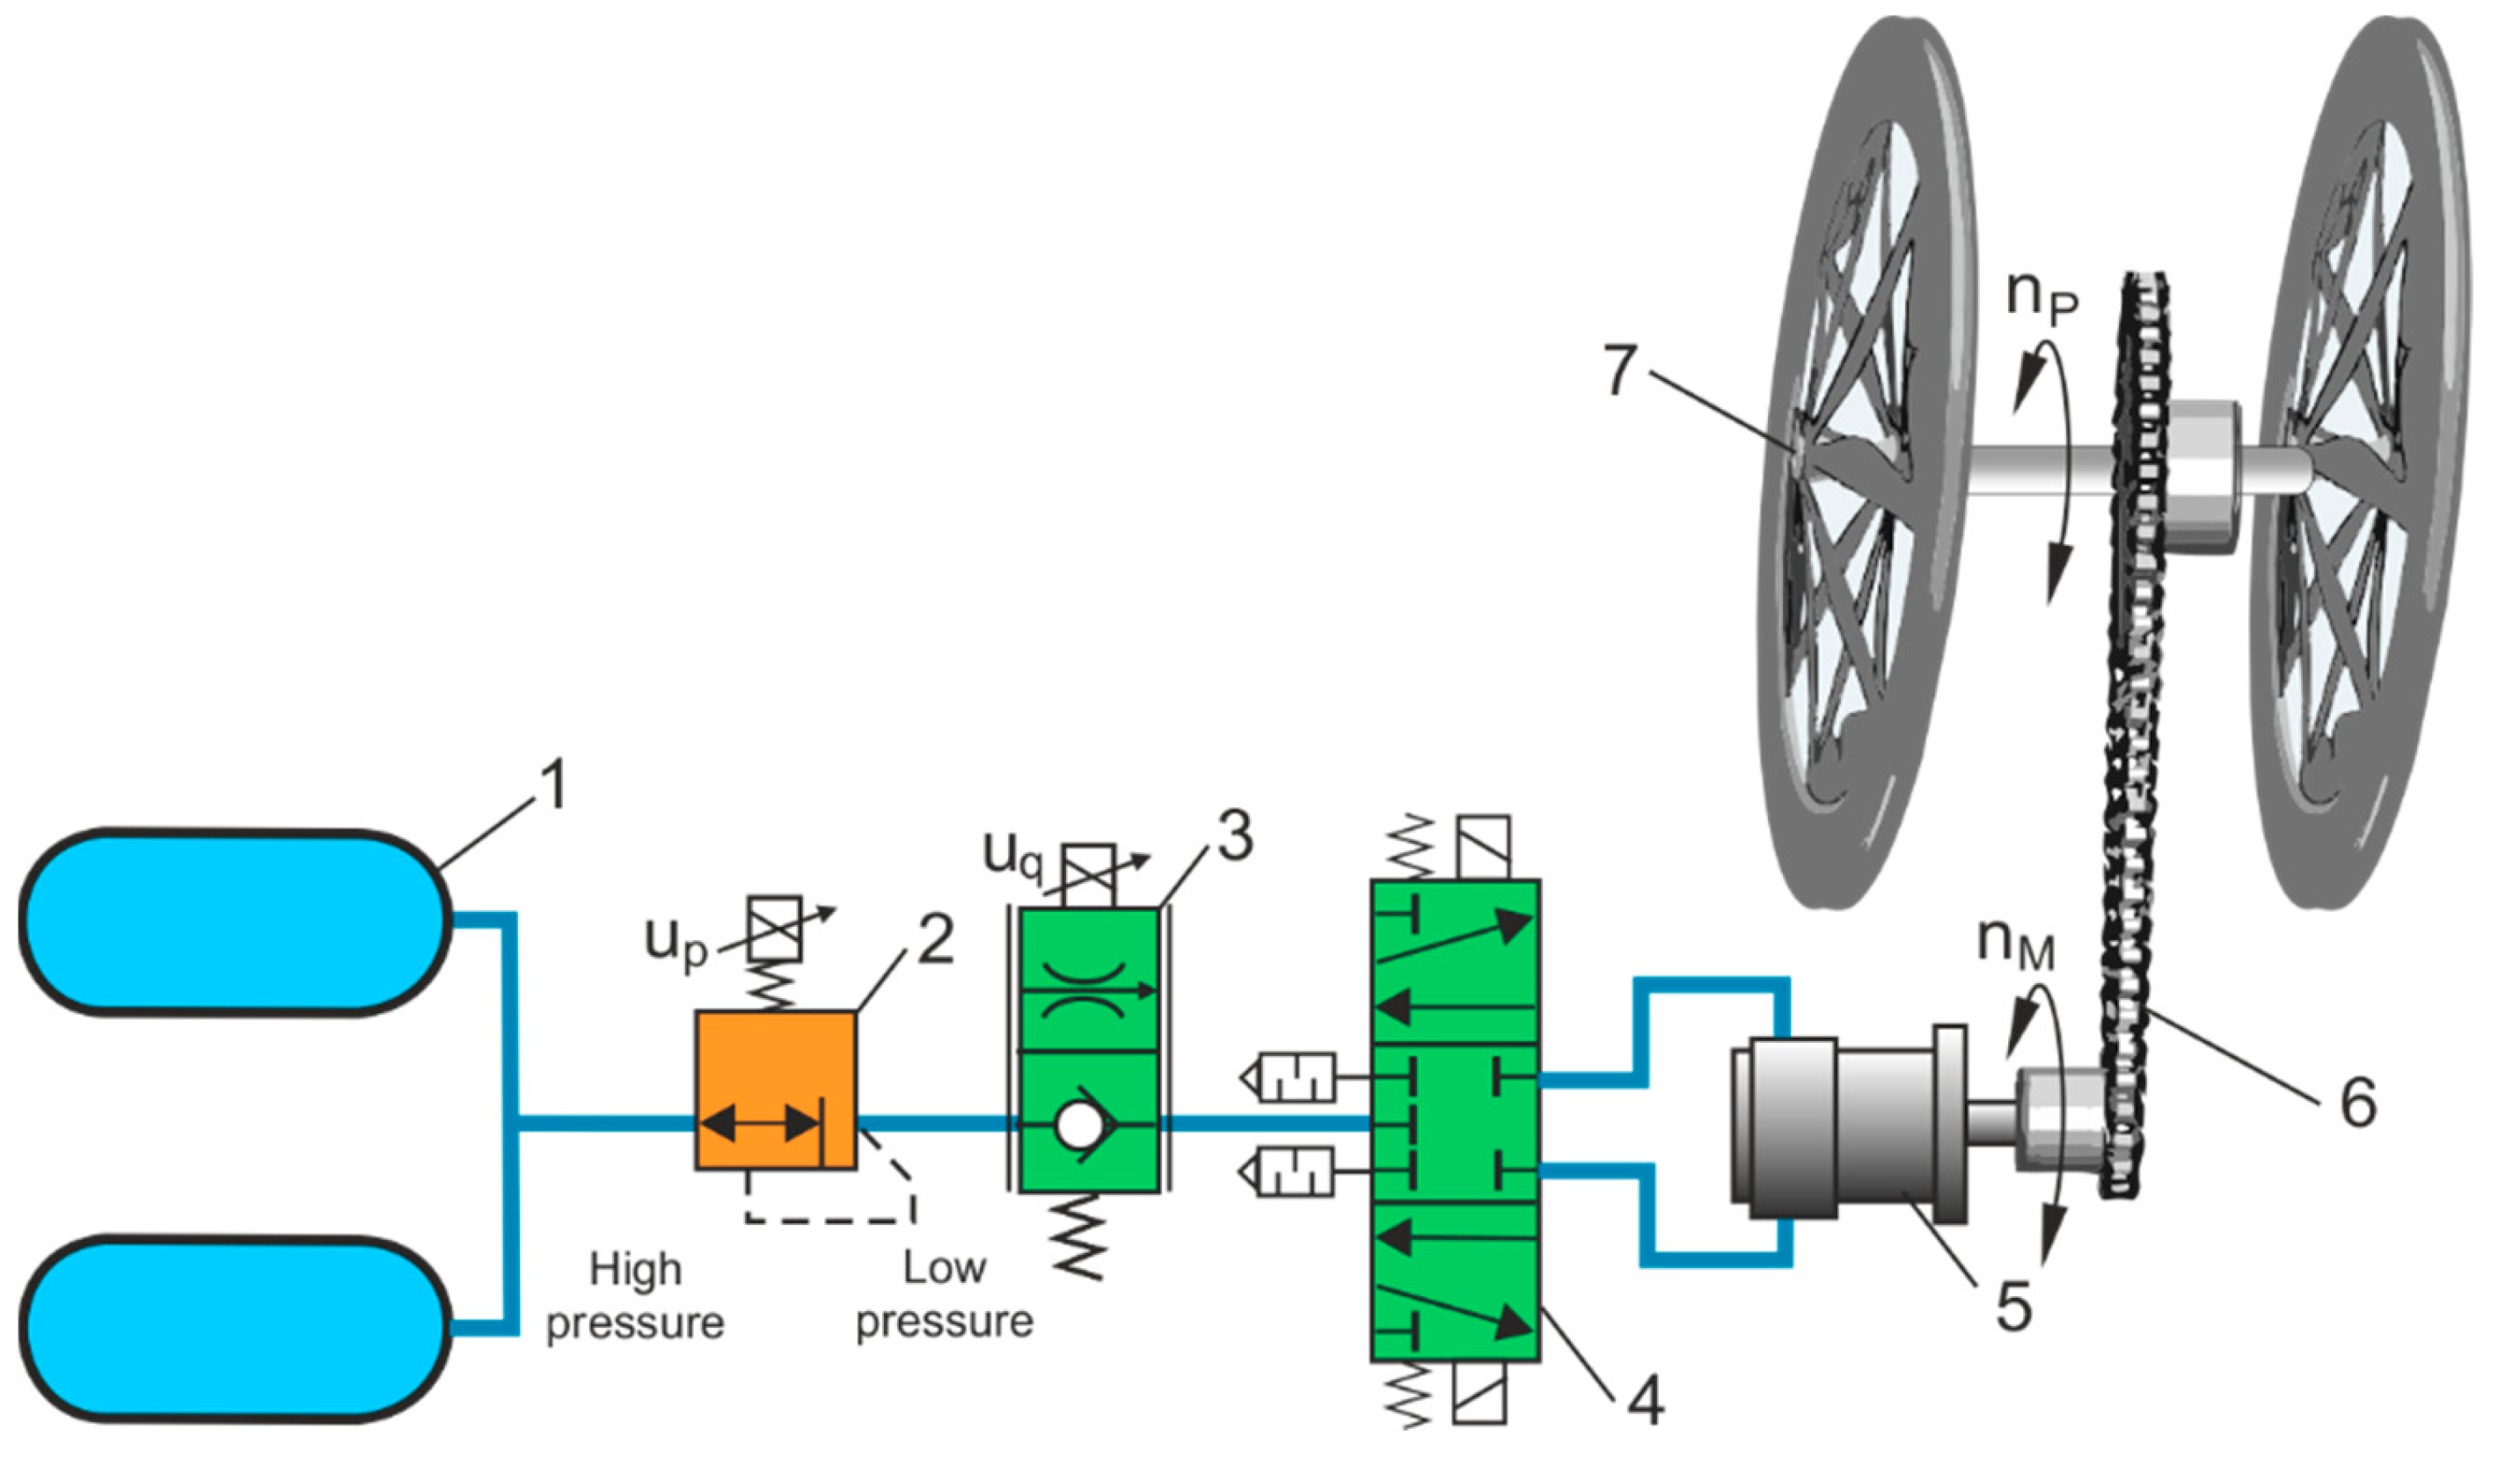
Figure 14 shows a functional diagram of the propulsion of the air bike. The pneumatic cylinder works with the crank mechanism, which converts the linear reciprocation of the piston rod into the rotational motion of the rear wheel of the bicycle.
The concept of motorcycle propulsion with air power is shown in
Figure 15 [
46]. Two CARTs with a capacity of 9 dcm
3 and a pressure of 250 bar were used as energy sources. A 5 dcm
3 buffer tank was installed between the pressure regulator and the air engine to stabilize the air pressure. Air motorcycle travels up to 5 km with a maximum speed of 38.2 km/h.
Compressed air vehicles (CAVs) are also known as compressed air cars (CACs) and air powered cars (APCs). The CAVs are powered by air motors supplied by CART. The conclusions of the CAV review showed that the clean energy of compressed air is difficult to use in vehicles, despite the fact that it is extremely beneficial to the environment [
47]. The disadvantages of pneumatic propulsion are the low efficiency and low energy density of a CART. The functional scheme of the high-pressure propulsion system used in the CAV is shown in
Figure 16.
Many different CAVs are being developed, both two-wheeled, three-wheeled, and four-wheeled. One of the few CAVs in production is the AirPod car from Motor Development International (MDI [
48]. The driver steers the AirPod car with a joystick, and two passengers can sit in the back seat, facing backward. AirPod car parameters: car weight 220 kg, CART weight 80 kg with compressed air pressure 350 bar, maximum speed of 45 km/h, range of 220 km. It takes about three minutes to fill the air tank, using only 1.5 euros of electricity.
The compressed air piston engine is the result of the conversion of an internal combustion engine (ICE) to a compressed air engine (CAE). Due to their nature of work and simple construction, CAEs are used in two- and four-stroke engines.
Figure 17 shows the functional schematic of the compressed air piston engine. The idea behind this conversion is to generate the force on the engine piston by means of compressed air rather than the combustion process. The compressed air inlet is located directly above the engine plunger. The pneumatic solenoid valve provides compressed air to the engine at any angle of rotation of the crankshaft rotation angle, which is important to optimize engine efficiency. The maximum calculation power for air motors is 50% lower than the basic ICE version [
49], but the maximal torque of the air motor is 30% higher. Air motors from 4000 rpm are characterized by a significant reduction in energy indicators. The results of the research [
50] show that the ICE, after modification, can operate as a compressed air engine at an air pressure of 5 to 9 bar, a power output of 0.96 kW and a torque of 9.9 Nm. The efficiency of the compressed air engine is low due to the low air consumption and insufficiently expanded compressed air inside the cylinder.
In a pneumatic hybrid vehicle (PHV), during a brake event, the pneumatic engine operates in compressor mode, converting the kinetic energy of the vehicle into potential energy in the form of compressed air, which is then stored in a pressure tank for later use. In paper [
51], a control strategy for air engine load control during compressor mode operation has been developed and investigated. A hybrid pneumatic drive that combines compressed air supply and ICE may be the better solution for vehicle applications. Hybrid air cars (HACs) are propelled by two energy sources, fuel and pressurized air. Currently, researchers in the area of vehicle engineering are focused on finding new high-efficiency HACs, called air-powered hybrid cars (APHCs) or pneumatic hybrid vehicles (PHVs). Innovative HACs have four operating modes: gasoline mode, compressed air mode, combined power mode, and brake energy recovery mode [
52]. In HACs, it is also possible to use regenerative braking, where the energy recovered during braking is stored on a CART. In regenerative braking mode, the engine acts as a two-stroke compressor and converts the vehicle’s kinematic energy into compressed air stored in a CART. Energy stored in a CART can be used in a variety of ways. The first option is to power the vehicle, either by operating the internal combustion engine as an air engine or by driving the wheels directly through air engines. The second option to use the stored braking energy in a CART is to start the ICE using an air motor. To improve the energy efficiency of conventional vehicles powered by ICE, [
53] proposed the concept of starting with compressed air assisted. In [
54], the experimental performance of the hybrid air system was reviewed and evaluated.
Figure 18 presented a functional scheme of the HAC concept [
55]. The major automotive manufacturers have ignored this hybrid technology. Hybrid Air by PSA Peugeot Citroen is developing the hybrid powertrain trend by combining compressed air energy storage technology with a petrol engine [
56]. However, despite the manufacturer’s statement, Hybrid Air was never brought into production. Unfortunately, due to the financial difficulties of PSA and the lack of additional investors, the work was discontinued. Hybrid compressed air technology shows promise, has great potential and can be used in the future. In addition, it is also a cheaper and more environmentally friendly alternative to the hybrid electric car (HEC) or hybrid electric vehicle (HEV). A pneumatic and combustion hybrid is technologically feasible and inexpensive and has the potential to compete successfully with HEC [
57]. In the paper [
58], a new form of hybrid pneumatic combustion engine (HPCE) based on a compressed air injection booster was proposed. HPCE regenerates energy wasted on engine braking to improve engine performance and fuel economy.
The purpose of a review of a CART application is to show the importance of energy efficiency in various pneumatic systems. The review focused only on certain CART applications, especially in energy-efficient pneumatic systems, pneumatic brake systems, air energy recovery systems, energy storage systems, air bike propulsions, motorcycle air powered propulsion, compressed air vehicles, compressed air engine, hybrid air vehicles. The technical characteristics of the individual pneumatic systems were cited. Compressed air in a CART is advantageous because of its varied storage volumes, the possibility of storage at high pressure, the low-cost quick filling, the easy storage and recovery of air energy, and the long service life. In the reviewed processes for charging and discharging CART (energy storage, compressed air energy used), the characteristics of the flow valves are omitted. Further investigation will be conducted to analyze the valve-to-tank-to-valve system. The pneumatic systems presented equipped with air motors or an air engine do not take into account their torque, power, and air consumption characteristics. The solutions described for the recovery of energy from exhaust air are not used on an industrial scale. Compared to other energy storage methods, CART energy storage has advantages such as durability, long discharge time, and different sizes. Researchers face several challenges, such as the storage of adiabatic energy in compressed air. The other challenge is the use of CARTS with constant pressure in the discharging process. In this case, various design solutions are used to change the volume of the tank, e.g., by moving the plunger.
5. Numerical Solution of a CART Charging and Discharging Process
The air compression and expansion processes in a CARTs include charging, discharging, and simultaneous charging and discharging.
Figure 19 shows the base diagrams of a CART configuration.
The SMC manufacturer offers software to calculate the air tank charge and discharge parameters, using the online version of the model selection program [
59]. The SMC calculator helps to determine the charging and discharging times of the selected air tank, as well as the pressure and temperature conditions of isothermal and adiabatic processes. The Kaeser toolbox calculators allow one to determine the optimization potential of the compressed air station, correctly configure pipelines and tanks, save energy by avoiding leaks, and increase CAS efficiency [
60]. The results obtained from the manufacturer’s calculators are not completely accurate and may differ from the measurement results obtained with actual equipment. In these calculators, only CART parameters are taken into account and the flow parameters of CART inlet and outlet valves are completely ignored. As CART charging and discharge processes depend on the flow parameters of the valves, a valve-to-tank-to-valve system must be considered. CART charging and discharging process is a fundamental thermodynamic problem that usually relies on simplified solutions for isothermal or adiabatic processes. In technical calculations, a CART charging and discharging processes are considered to be an adiabatic process.
Polytropic processes during CART charging and discharging are difficult to estimate with simplified methods. In the charging process, the inlet pressure remains constant, while the pressure in a CART increases. In the discharge process, the pressure in a CART decreases, and the outlet pressure is constant. Exact analytical solutions are difficult to obtain for these processes, especially for a CART unloading process. Therefore, new numerical solutions were proposed to determine the parameters of the polytropic CART charging and discharging process. In this numerical solution, polytropic charging and discharging processes were taken into account in the valve-to-tank-to-valve system, as shown in
Figure 20.
The charging and discharge parameters of a CART are determined from the mass flow balance equation. The mass flow balance based on changes in the air mass of the tank, the air mass inflow of the tank, and the air mass outflow of the tank is written as follows:
where:
qm is the instantaneous mass flow rate inside a CART,
qm(in) is the mass flow rate through the air inlet valve, and
qm(out) is the mass flow rate through the air outlet valve.
At a constant volume
V (
V = const) of a CART, the instantaneous mass flow equation can be written
where
ϑ is the specific volume.
From the derivative of the equation of the polytropic process it follows.
where
p is the instantaneous air pressure inside the tank, and
n is the polytropic exponent.
With (40) and (41) and the ideal gas law (
p ϑ =
R T), the instantaneous mass flow rates inside the tank were determined
where
T is the temperature inside the tank, and
R is the individual gas constant (for air
R = 287 J kg
−1 K
−1).
Substitution (42) for (39) results in;
During the polytropic charging process of a CART, the air inlet valve is open and the air outlet valve is closed. Next, (43) is written as follows:
The charging process takes into account a choked flow and a subsonic flow condition in the air input valve.
During the polytropic discharging process of a CART, the air outlet valve is open while the air inlet valve is closed. Next, (43) is written as follows:
The discharge process takes into account a choked flow and a subsonic flow condition in the air outlet valve.
The mass flow rate through the air inlet valve (charging process) and the air outlet valve (discharging process) for choked (sonic) and subsonic flow was written as follows [
61,
62,
63].
In the air inlet valve, the charging process is determined by:
where
pin is the inlet pressure,
Tin is the inlet temperature,
p is the current pressure in a CART,
bin is the critical pressure ratio of the inlet valve, and
Cin is the sonic conductance of the inlet valve.
In the air outlet valve, the discharging process is determined by,
where
p is the current pressure in a CART,
Ts is the initial temperature in a CART,
pout is the outlet pressure,
bout is the critical pressure ratios of the outlet valve, and
Cout is the sonic conductance of the outlet valve.
The sonic conductance of the inlet and outlet valves is:
where
Cdin and
Cdout are the discharge coefficient dependent on the Reynolds number and the ratio of the geometric parameters of the inlet or outlet valve passage;
Ain and
Aout are the flow cross-sectional areas in the inlet or outlet valves calculated on the basis of their nominal diameters,
where
din and
dout are the nominal diameters (air passage diameters) of the inlet and outlet valves from the manufacturer’s data sheets.
In (48) a constant
K factor in ms
−1·Pa
−1 was introduced.
where Ψ
max is the maximum value of the flow function.
In pneumatic systems, the reference atmospheric conditions ANR (Atmosphere Normale de Reference) is introduced, with the following parameters values: pressure
pN = 100 kPa, temperature
TN = 293.15 K, gas constant
RN = 288 Jkg
−1·K
−1, and density
ρN = 1.185 kg/m
3 at relative humidity RH = 65% [
64].
The maximum theoretical value of the flow function Ψ
max for the free flow of air into the atmosphere:
at the critical pressure ratio:
where
κ is the adiabatic index,
κ = 1.4.
The polytropic process of gas compression and expansion during the charging and discharging of a CART is considered. The Poisson relation between pressure and temperature for a polytropic process is given as follows:
The temperature as a pressure function is derived from (53)
where
n is the polytropic index taking a value from 0 to 1.4.
The logarithmic transformation of (54) and (55) is obtained
where
Kin and
Kout are the slopes of the logarithmic characteristics.
5.1. Numerical Solution for a CART Polytropic Charging Process
Under choked flow conditions, the pressure in the tank increases from the initial pressure pc0 to the pressure pc1 = bin pin at the time from tc0 to tc1.
Integrating the differential Equation (44) is obtained:
where
qm1(in) is the mass flow rate,
τc1 is the time constant,
And
Tc1 is the temperature,
From the solution of the integral Equation (58), a CART charge time interval Δ
tc1 in the choked flow condition is calculated:
from transformation (61), a charge pressure
p1(
t) was obtained in the range of
pc0 to
pc1 at the time interval Δ
tc1Under subsonic flow conditions, the pressure in the tank increases from pressure pc1 to the final pressure pc2 at the time from tc1 to tc2. The charging process ends when the pressure in the tank reaches the inlet pressure, pc2 = pin.
By integrating the differential Equation (44) is obtained:
where
qm2(in) is the mass flow rate,
τc2 is the time constant,
Tc2 is the temperature,
bin is the critical pressure ratio in the subsonic flow range,
bin =
pc1/
pin.
Integral functions (64) were transformed as follows:
where
f(
p) is the integrand function:
To solve the integrand function (69), the value of which is fC in the interval 〈pc2, pc1〉, the numerical method based on the Simpson method, a quad function in Matlab was used.
From the solution of the integral Equation (68), a CART charge time interval Δ
tc2 in the subsonic flow condition is calculated
Formula (64) was transformed into the derivative of the charge pressure
p2(
t) in the range of
pc1 to
pc2 at the time interval Δ
tc2The non–stiff differential Equation (71) was solved based on the Runge–Kutta (ode45 function) medium order method in Matlab software. As a result, the pressure increase p2(t) was determined during a CART charging process under the subsonic flow condition: pc1 ≤ p2 ≤ pc2 and tc1 ≤ t2 ≤ tc2.
The total CART charge time is calculated by adding the time intervals (62) and (70),
5.2. Numerical Solution for a CART Polytropic Discharge Process
Under choked flow conditions, the pressure in the tank drops from the initial pressure pd0 = ps to the pressure pd1 = (1 − bout) pd0 at the time from td0 to td1.
By integrating the differential Equation (45) is obtained
where
qm1(out) is the mass flow rate,
τd1 is the time constant,
Td1 is the temperature,
From the solution of the integral Equation (73), a CART discharge time interval Δ
td1 in the choked flow condition is calculated,
From transformation (77), a drop pressure
p1(
t) was obtained in the range of
pd0 to
pd1 at the time interval Δ
td1,
Under the subsonic flow condition, the pressure in the tank drops from the pressure pd1 to the final pressure pd2 at the time from td1 to td2. CART discharge process ends when the pressure reaches the outlet pressure, pd2 = pout.
By integrating the differential Equation (45) is obtained,
where
qm2(out) is the mass flow rate,
τd2 is the time constant,
Td2 is the temperature,
bout is the critical pressure ratio in the subsonic flow range,
bout =
pout/
pd1.
The integral functions (79) were transformed as follows:
where
f(
p) is the integrand function,
To solve the integrand function (84), the value of which is fD in the interval 〈pd2, pd1〉, the numerical method based on the Simpson method, a quad function in Matlab was used.
From the solution of the integral Equation (83), a CART discharge time interval Δ
td2 in the subsonic flow condition is calculated,
The (79) was transformed into the derivative of the drop pressure
p2(
t) in the range of
pd1 to
pd2 at the time interval Δ
td2,
The non–stiff differential Equation (86) was solved based on the medium order method Runge-Kutta (ode45 function) in Matlab software. As a result, the pressure drop p2(t) was determined during a CART discharge process under the subsonic flow condition pd1 ≤ p2 ≤ pd2 and td1 ≤ t2 ≤ td2.
The total CART discharge time is calculated by adding the time intervals (77) and (85),
Numerical or experimental studies of CART charging and discharging processes of are rare in the literature. In this Review, a new numerical solution using nonlinear differential equations was proposed. Numerical solutions are justified by indefinite pressure changes during charging and discharging of a CART, and during choked (sonic) and subsonic flow through the inlet and outlet valves. In the next publication, the authors will present a test stand for evaluating the energy efficiency of a CART charging and discharging processes. Numerical solutions for CART charging and discharging processes will be experimentally tested. In numerical solution and experimental tests, CART will be charged and discharged using selected inlet and outlet valves. The measuring equipment used in the test stand will allow for automatic measurement of instantaneous pressure, temperature, and polytropic exponent during a CART charging and discharging processes. The automatic control system allows the inlet and outlet valves to be switched while measuring the charging or discharging curves of a CART. The following valve-to-tank-to-valve systems will be considered, the capacity of the small horizontal tanks from 5 to 50 L and the large vertical tanks from 100 to 5000 L, the low pressure from 2 to 10 bar and the high pressure from 50 to 500 bar. The nominal diameters of the inlet and outlet valves can be small from 3 to 6 mm, medium from 6 to 20 mm, or large from 20 to 100 mm. The verified charging and discharging parameters of a CART will be used for road tests of a newly designed tricycle bike with pneumatic propulsion, which will be used for recreational and rehabilitation purposes for older adults.
6. Energy of Compressed Air in CART
The energy of compressed air in a CART with volume
V after adiabatic compression from initial pressure
p1 to charging pressure
p2 can be calculated from the formula:
where
κ is the air adiabatic index (specific heat ratio),
κ = 1.4.
The charge pressure p2 is considered equal to the storage pressure in the tank. One of the criteria for selecting an air tank is the stored energy density.
The charge pressure
p2 is equal to the storage pressure in the tank and the energy
E(1,2) is the stored energy of a CART. The energy stored related to tank volume is the stored energy density as one of CART selection criteria:
During the full expansion of the adiabatic discharge of a CART, the storage pressure
p2 drops to the atmospheric pressure
pa and the storage energy density can be expressed by the following equation:
In practice, a CART discharge process must be stopped once the pressure in the tank drops below the operating pressure
po (
po >
pa) required for the correct operation of pneumatic actuators, tools, or other devices. The unexploited energy density in the air tank can be expressed as follows:
The effective density of the storage energy
Ede(2,o) is equal to the difference between the storage energy density
Ed(2,a) and the unexploited energy density
Edu(o,a)Energy in J is often converted to kWh, 1 J = 2.778 × kWh.
According to (89) and (90), the volume energy density is only a function of the pressure in a CART and the ambient pressure. Therefore, the only way to increase the volume energy density is to increase the pressure in a CART. The increase in pressure in the CART affects the inefficiency of the air expansion process, partially negating the advantages of storing energy at high pressure. A compromise must be reached between increasing and reducing the pressure in a CART. Energy savings must also be considered. There are several ways to conserve energy in a CART. One way is to adjust the pressure of the compressed air to the energy demand. The energy costs of air compression and the costs of air consumption increase considerably as the pressure increases. The reduction in energy consumption for air compression resulting from pressure reduction in a CART can be determined by the energy reduction rate [
65]:
where:
ERR is the energy-reduced rate,
Ec is the full charge energy,
Er is the reduced charge energy,
pc is the full absolute charge pressure,
pr is the reduced absolute pressure, and
pa is the atmospheric pressure.
According to (93), reducing the charge pressure in a CART by 1 bar reduces energy consumption by 8%.
The energy density of a CART is lower than that of batteries used in vehicles such as lead acid (Pb–acid), nickel metal hydride (Ni-MH), and lithium ion (Li-Ion). Although Pb-Acid and Ni-MH batteries are much heavier and have a lower energy density per mass, they have a higher energy density per volume compared to CART. According to work [
66],
Figure 21 shows the energy densities of different batteries and fuels on a logarithmic scale.
This comparison is based on the reported densities of battery and fuel energy [
66]. In the case of CART and CNG, it refers to compressed air and gas pressures up to 300 bar. The low energy density of compressed air poses significant challenges in the design of air vehicles that have limited space for the installation of CART. This difficulty can be mitigated by using high-pressure carbon-fiber tanks.
According to work [
67],
Figure 22 shows a comparison of the energy efficiency of the main energy storage technologies.
The performance of compressed air storage and lead-acid batteries was compared in terms of energy stored, costs, and payback period [
68]. By comparing costs, the 840 kWh/35 kW CAES installation costs USD 23,780 and 1400 kWh lead acid battery connected to the 3.5 kW converter costs USD 130,307.
7. Future Directions for CART
Future directions leading to increasing the energy efficiency of a CART charging and discharging processes:
CART charging and discharging process is a fundamental thermodynamic problem that is most often based on simplified solutions for isothermal and adiabatic processes [
69,
70,
71]. However, they are actually polytropic processes for which it is difficult to estimate the polytropic index dependent on various factors. Thermodynamic processes in a CART are complex because in the charging process, the input pressure to the CART remains constant, whereas in the discharging process, the pressure in a CART decreases. Numerical solutions should be used to determine the polytropic characteristics of a CART charging and discharge process, as well as automated measurement methods.
- 2.
Determination of the polytropic index.
The polytropic process of gas compression and expansion during the charging and discharging of a CART must be considered. The instantaneous polytropic index
n is an indicator of the effect of heat transfer during a charging or discharging process. The polytropic index values
n in the air tank discharge process were experimentally determined and these values are
n = 1.03–1.13 [
72]. Work [
73] provides theoretical solutions to the instantaneous polytropic index
n for the charge and discharge processes of a CART. However, theoretical predictions for the polytropic index
n should be tested experimentally.
- 3.
Determination of the flow parameters C and b.
Data sheets for industrial pneumatic valves include the flow coefficients
Cv in imperial units gpm according to the ANSI standard [
74] or
Kv in metric units m
3/h (or
kv in L/min) according to the VDI/VDE 2173 standard [
75]. The relation of
Cv to
Kv is expressed as follows,
Cv = 1.16
Kv and
Kv = 0.862
Cv. When applying the flow factors
Cv or
Kv to pneumatic valves, complications occur when they are determined using water as the test fluid. Therefore, when selecting the input and outlet valves, two flow parameters must be guided, the sonic conductance
C and the critical pressure ratio
b, which are defined in the ISO 6358 standard [
76,
77]. The C value corresponds to the maximum flow of the valve when the air that passes through the valve reaches the sonic flow condition (choked flow). The value
b is the critical pressure ratio, the downstream pressure in relation to the upstream pressure, when the flow state changes from subsonic to choked (sonic) or vice versa. Determining the flow parameters
C and
b for a particular valve under operating conditions is only experimentally possible on the test bench. The alternative flow parameter is the effective sectional area
S according to the JIS B 8390 standard [
78]. The S represents the maximum constant flow rate in a choked flow. Conversion of the sonic conductance
C in dm
3 s
−1∙bar
−1 to the effective sectional area
S in mm
2 applies: S = 5 C.
- 4.
Increasing energy efficiency in CART.
To keep the energy stored in a CART at the same level, it is necessary to maintain a constant temperature. If the air stored in a CART is cooled, the charging pressure will decrease, and the amount of energy available will decrease. Cooled compressed air also affects the operation of pneumatic equipment, particularly the air motor and the air engine. When the temperature of compressed air changes, heat exchangers should be used. It can improve the efficiency of the compressed air motor by installing an air heater. According to the Gay-Lussac law, when the temperature of the gas increases, the pressure of the gas also increases. In high-pressure propulsion, charging of a CART requires a compressor with a pressure of 200–300 bar, which is not readily available due to the high-pressure danger. The energetic efficiency of pneumatic installations depends on the humidity of the compressed air. Wet compressed air requires complete drying, which consumes a lot of heat energy. By limiting the leakage of compressed air from a CART, its self-discharge is avoided, and hence the loss of energy is reduced.
8. Discussion of the HTB Air Propulsion System
The authors continue a research project [
79], with the objective of which a new hybrid tricycle bike (HTB) with pedaling mode and a high-pressure air propulsion system. The HTB is designed to improve and rehabilitate older people and disabled adults. The HTB has a propulsion system that significantly reduces the muscle strength of the driver and also allows longer travel times. The HTB can be designed according to individual needs. After the use of structural composite elements, the weight of the tricycle has been significantly reduced, and its ergonomics and ease of use have also increased. The HTB will have several modes of propulsion, foot, pneumatic, and hybrid (foot-pneumatic). The pneumatic propulsion mode will be operated by automatic control, and the hybrid mode will be operated by semi-automatic control. The HTB is stable, operates quietly and is smooth, and gives users the feeling of being in control of the vehicle.
Figure 23 shows a functional scheme of the HTB high-pressure air propulsion system.
In the calculations and selection of the HTB air propulsion system, traction data, chain transmission, air motor parameters, and a CART discharge process are taken into account.
8.1. Traction Data
Basic HTB traction data: D diameter of the propulsive wheel, M total weight of the tricycle with load, v maximum speed, L circumference of the propulsive wheel, L = π D, nP rotation speed of the propulsive wheel, nP = v/L, S travel distance, S = v t, t travel time.
8.2. Propulsive Wheel Parameters
Assuming that a constant speed of the tricycle bike is reached and acceleration is zero, the propulsive force FP is equal to the rolling resistance force FR
where
c is the coefficient of rolling friction and
g is the gravitational acceleration.
Then the propulsive force FP is equal to the sum of the resistance forces FR.
Propulsive power required on the propulsive wheel
where
ηP is the efficiency of the propulsion system.
8.3. Chain Transmission
Chain transmission ratio as the rotational speed ratio and the torque ratio.
where
i is the chain transmission ratio as the sprocket ratio,
i = 3 = 57/19,
nM is the rotation speed of the air motor and
TM is the torque of the air motor.
The biggest advantage of a chain is its ability to deliver almost all of the power of the air motor to the rear wheel. The chain drive has the lowest drop in power around 1% to 3%.
8.4. Air Motor Parameters
Air motor performance characteristics can be determined theoretically or by using manufacturer data. Both methods are acceptable, but in general the manufacturer’s data are more appropriate for a particular project and application.
The air consumption
qvM of the air motor is calculated as follows:
where
Vg is the displacement of the air motor,
pM is the operating pressure,
δ is the coefficient of air motor filling (
δ = 0.45 ÷ 0.7 [
80]), and
ηq is the flow efficiency of air motor (
ηq = 0.85 ÷ 0.95 [
81]).
The power of compressed air
PCR of the air motor is determined for the adiabatic expansion from operating pressure
pM to atmospheric pressure
pN under ANR conditions:
where
κ is the specific heat ratio of air,
κ = 1.4.
The mechanical power on the shaft of an air motor is as follows:
where
ηm is the mechanical efficiency (
ηm = 0.85 ÷ 0.9 [
82]), and
ηn is the filling efficiency based on speed.
The efficiency of the air motor is determined as follows:
where
ηP is the overall efficiency of the air motor, which includes the thermodynamic efficiency, the volumetric efficiency, and the mechanical efficiency,
ηP = 0.70 ÷ 0.90.
From an energy efficiency point of view, the air motor should operate in a nominal power range.
The torque
TMi for the different rotational speeds
nMi of the air motor is a linear function of the pressure
pMi. This can be determined from the static characteristics of the selected air motor:
where
n0 is the free speed for
TMi = 0, and
TMs is the stall torque for
nMi = 0.
The torque (102) is inserted into the mechanical power (100), then one obtains the following:
The tricycle bike travel time t was determined from CART discharge time, from the charge pressure pC to the air motor operating pressure pM.
The acceleration of the air tricycle can be adjusted to the user needs by adjusting the air flow to the motor as a valve. This tricycle has an extensive range of speed settings. At low speeds, air motors are more energy efficient than electrical motors. The required torque of an air motor is lower than that of an electric motor, resulting in a reduced size and weight of the air motor.
A prototype of our HTB design has the following parameters: air motor torque 50 Nm, air motor power 250 W, tank capacity 2 × 9 m3, tank pressure 25 MPa, travel time 30 min, travel distance 7.5 km at maximum speed 15 km/h. In comparison, an e-tricycle assist pedal with 500 W power and 500 Wh battery capacity has a speed of 25 km/h, torque 60 Nm, and a travel distance of 40 km. The travel distance of an e-bike depends on the battery capacity.


