
Comparative Life Cycle Assessment of Carbon Dioxide Mineralization Using Industrial Waste as Feedstock to Produce Cement Substitutes


Abstract
1. Introduction
2. Materials and Methods
2.1. Functional Unit
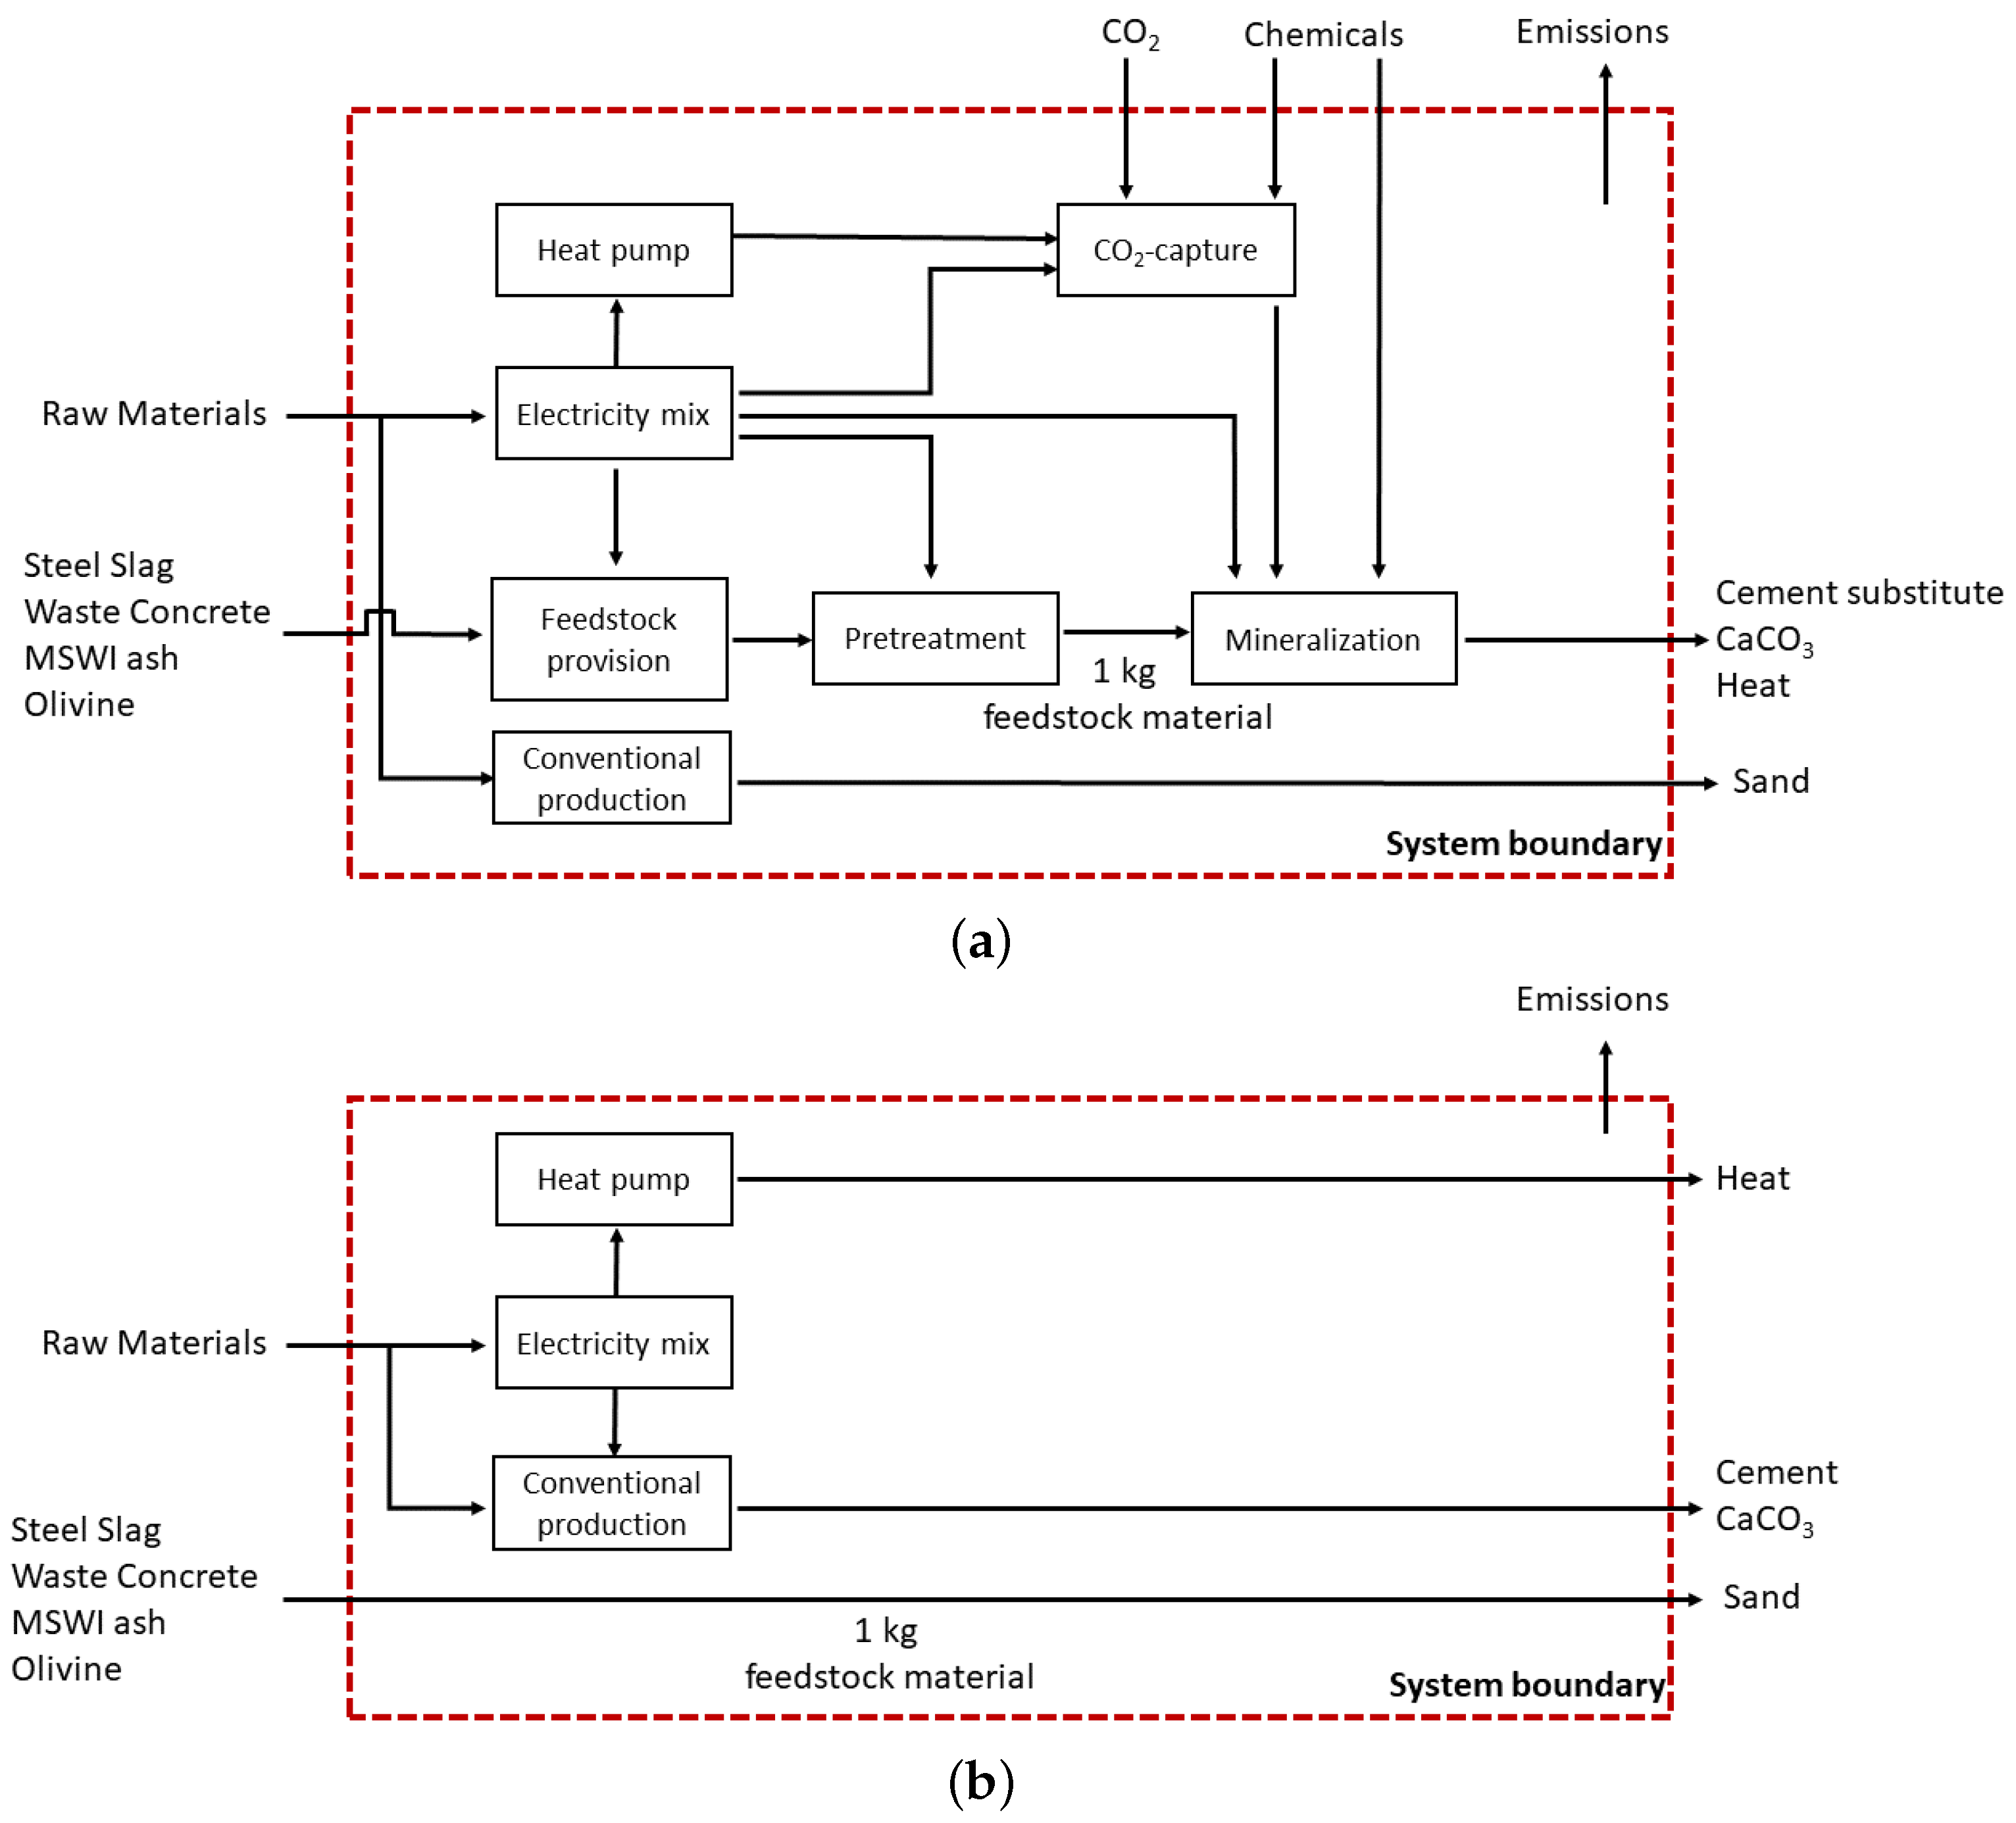
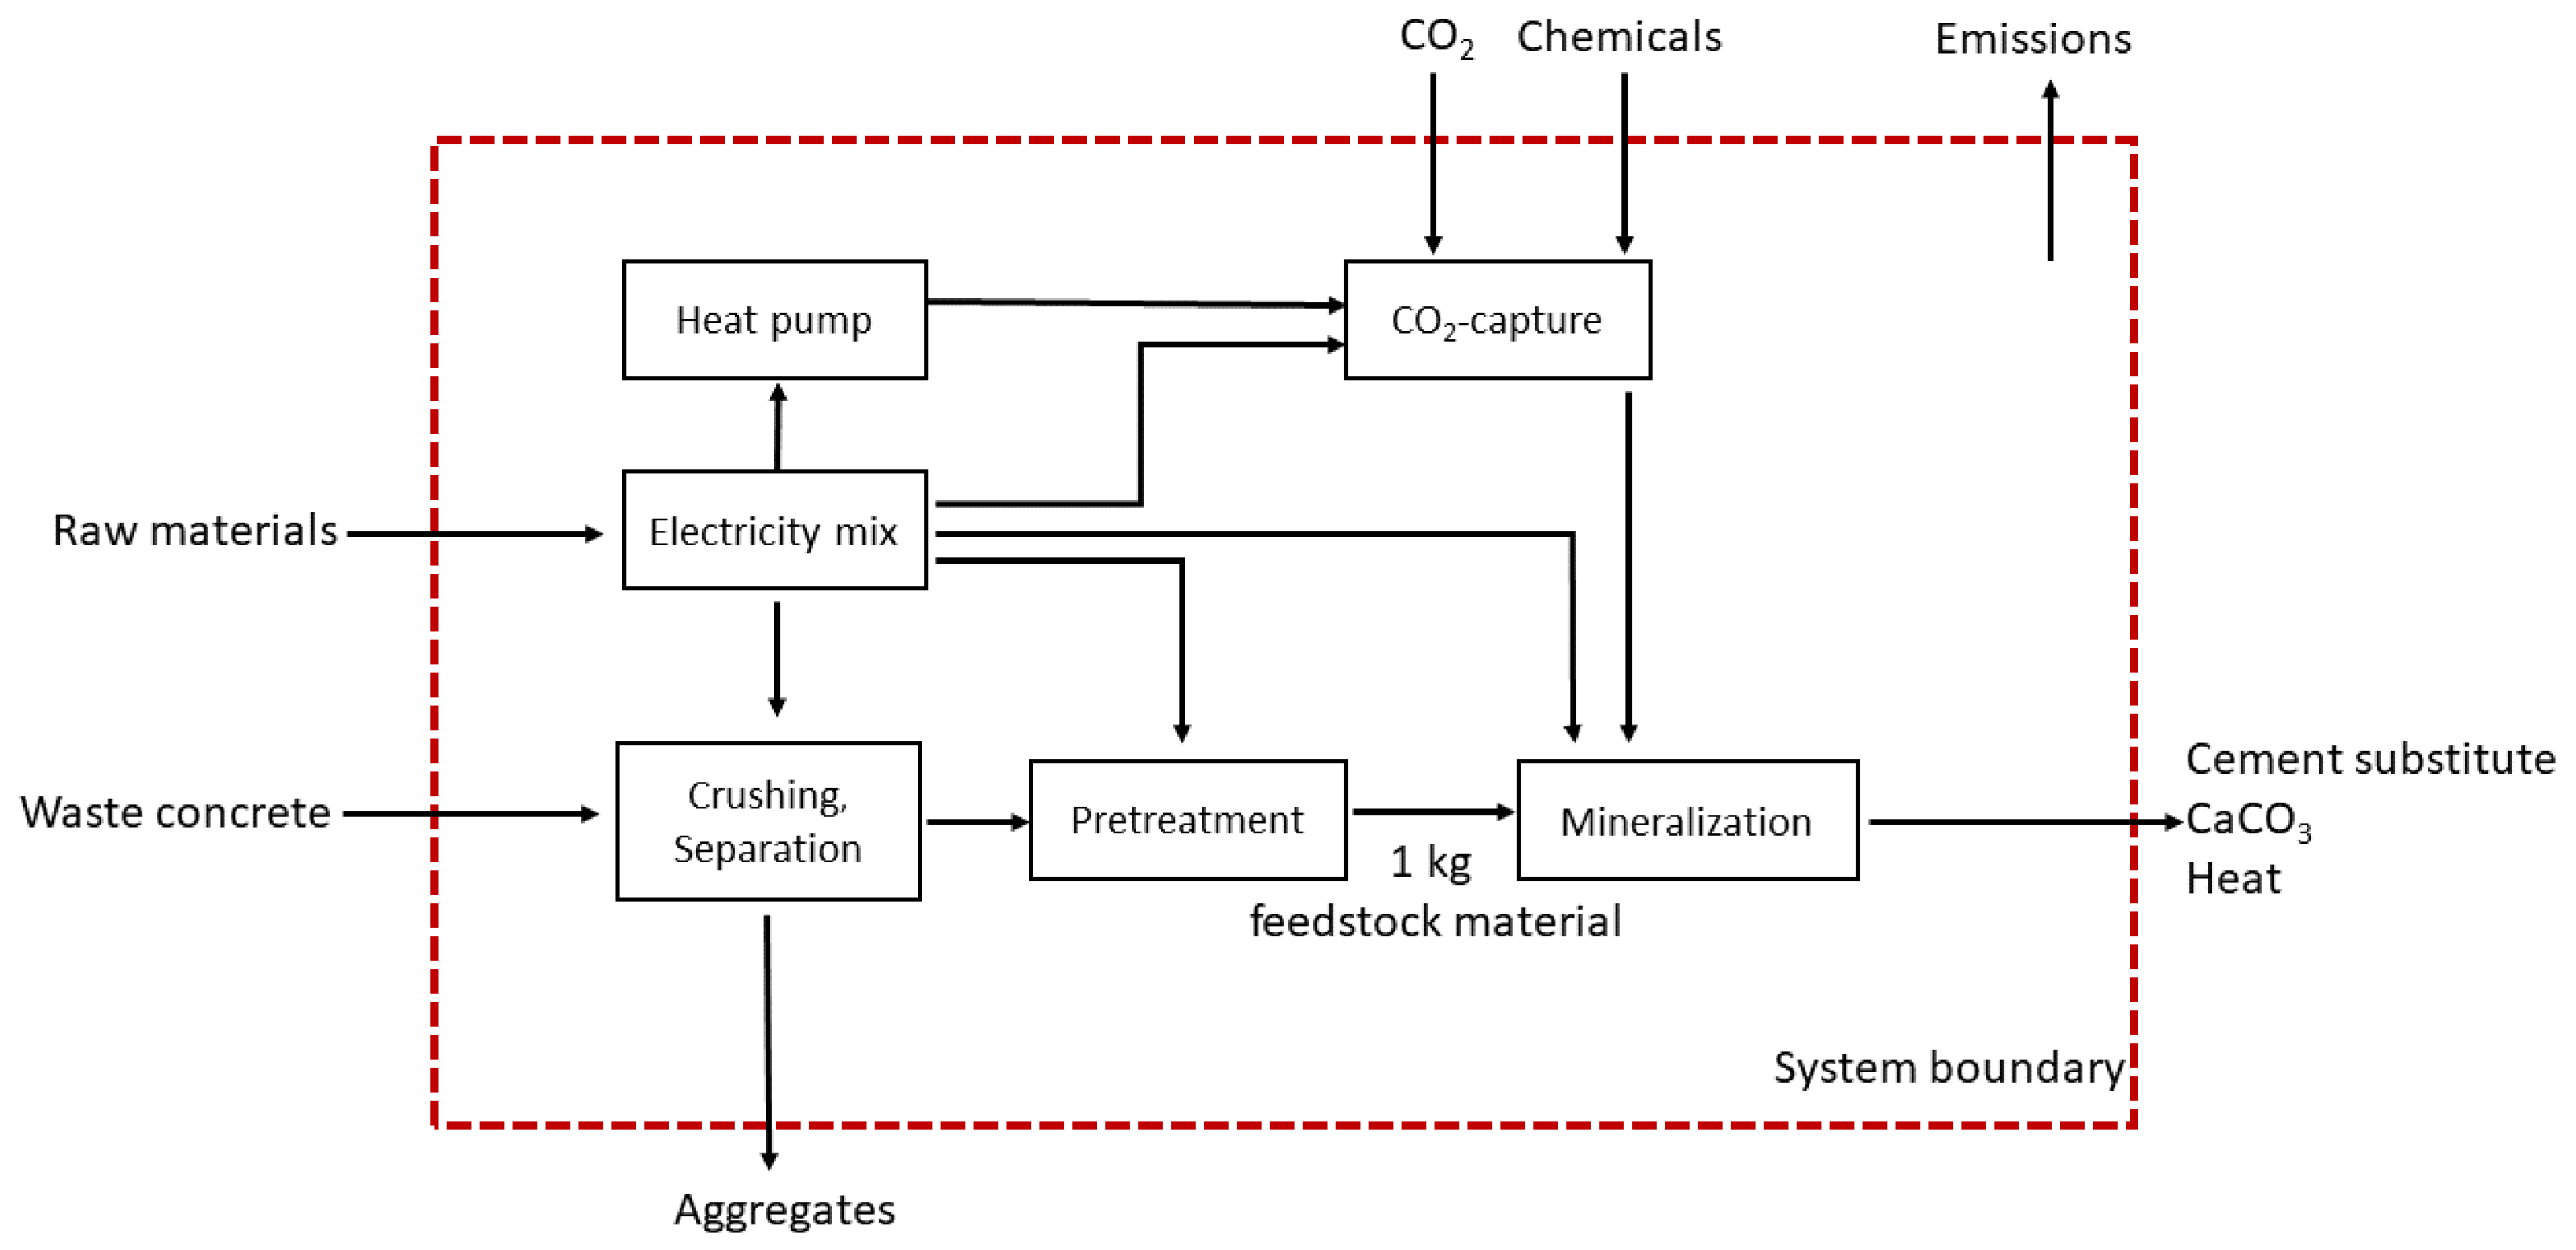
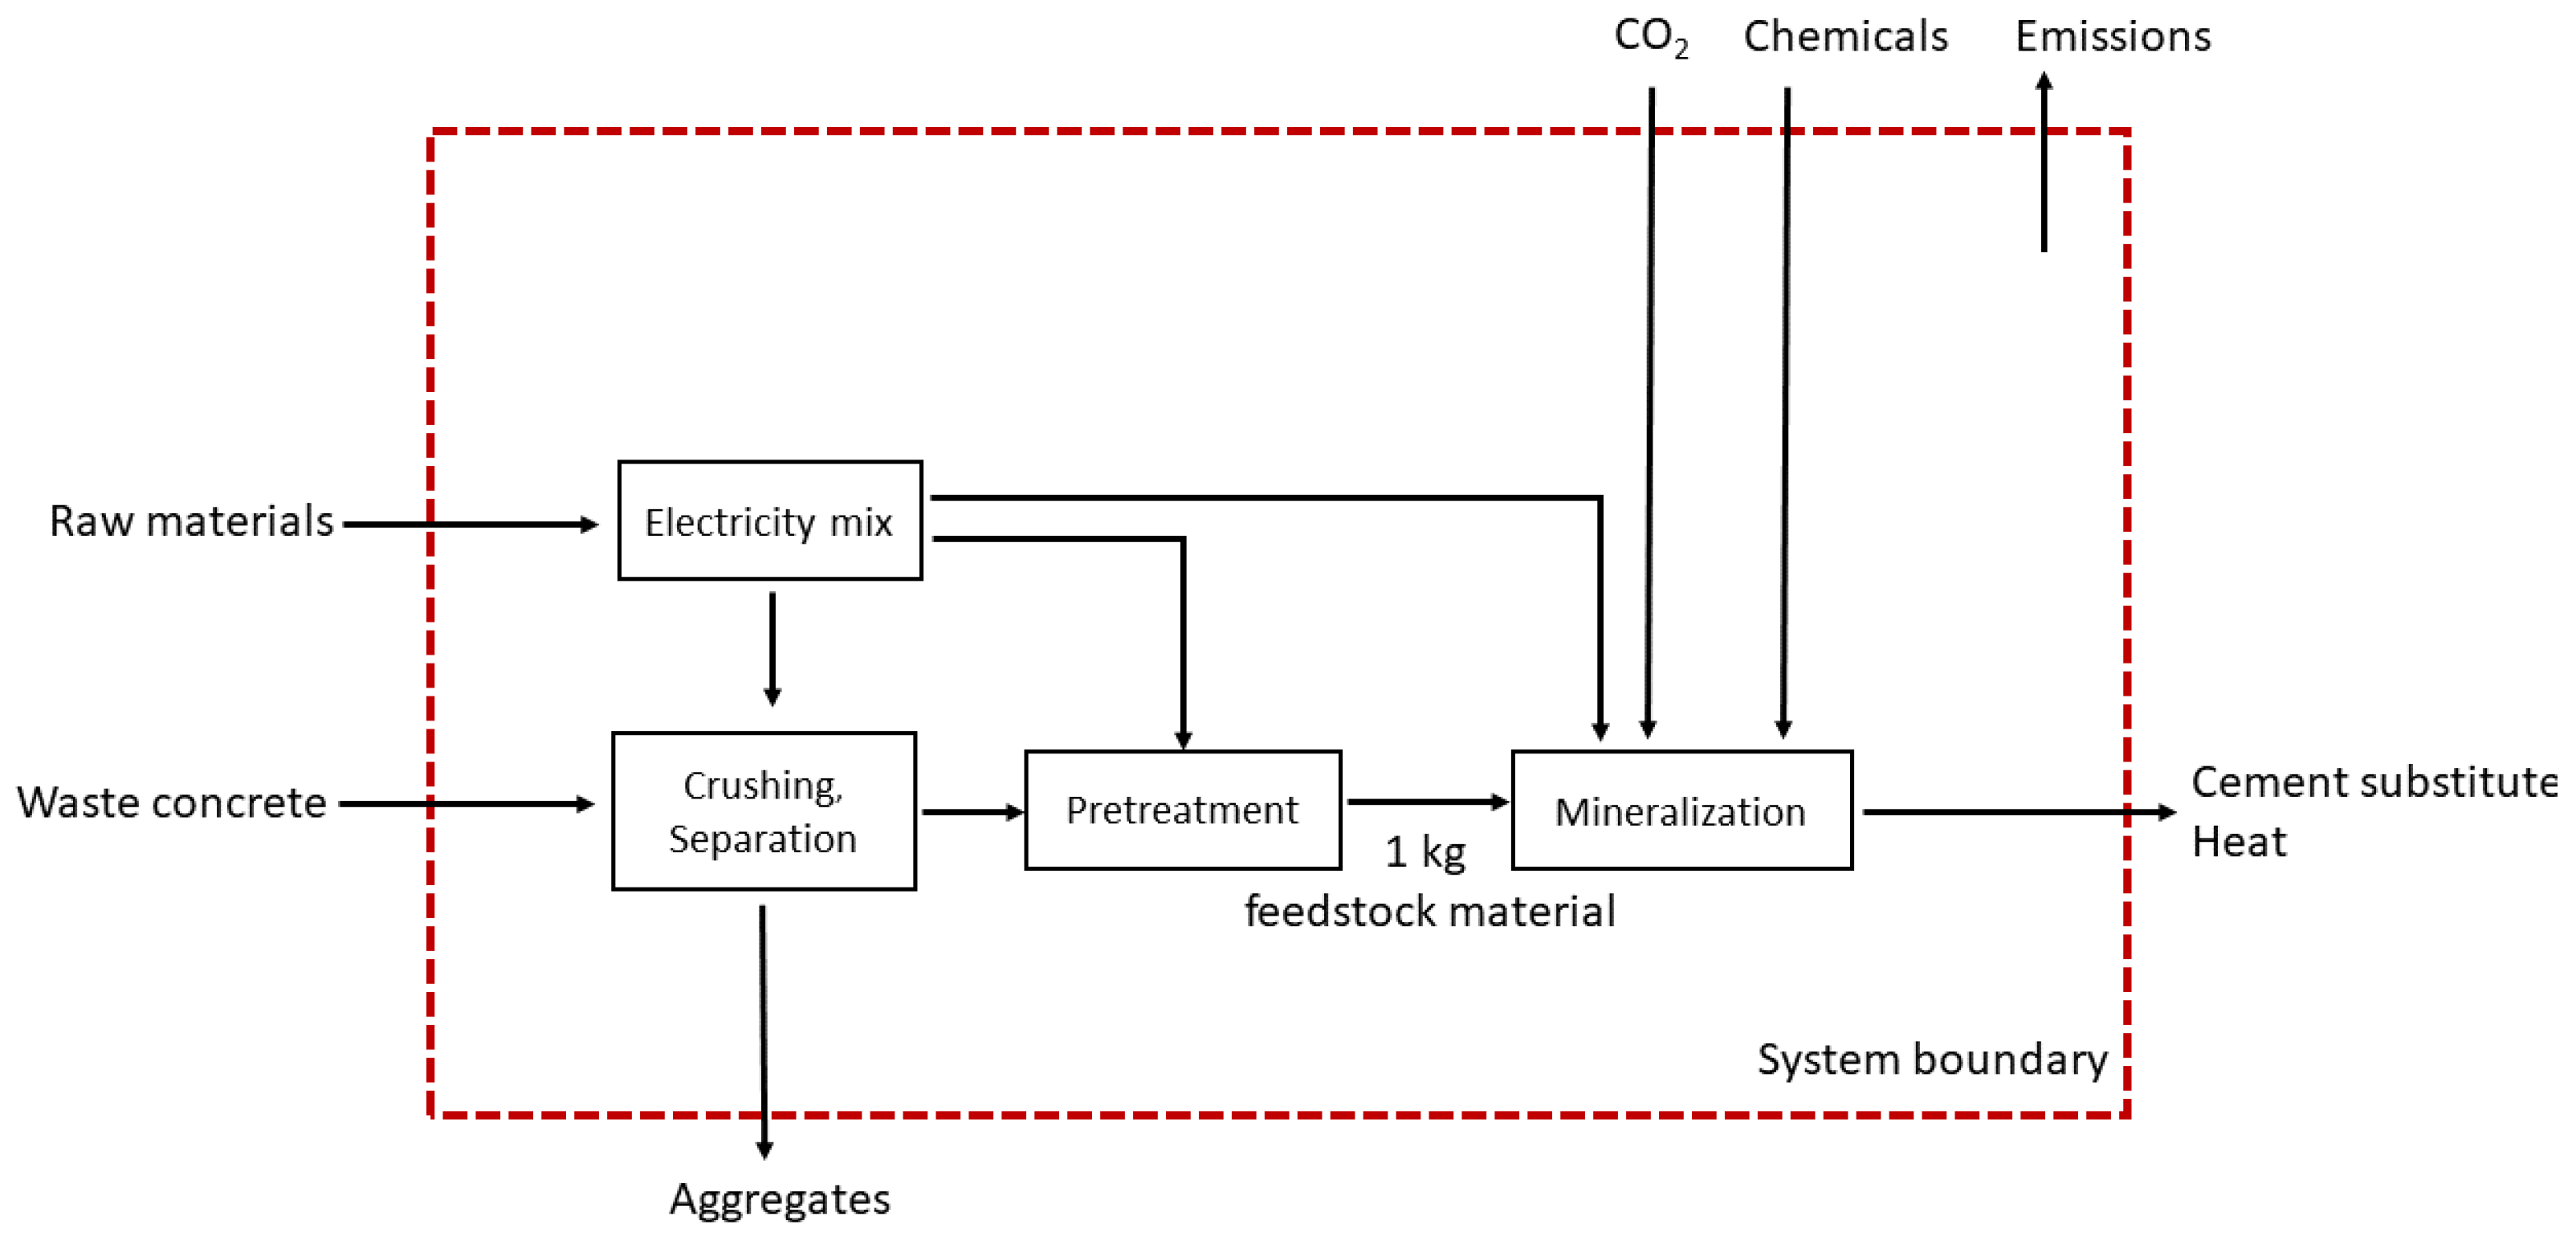
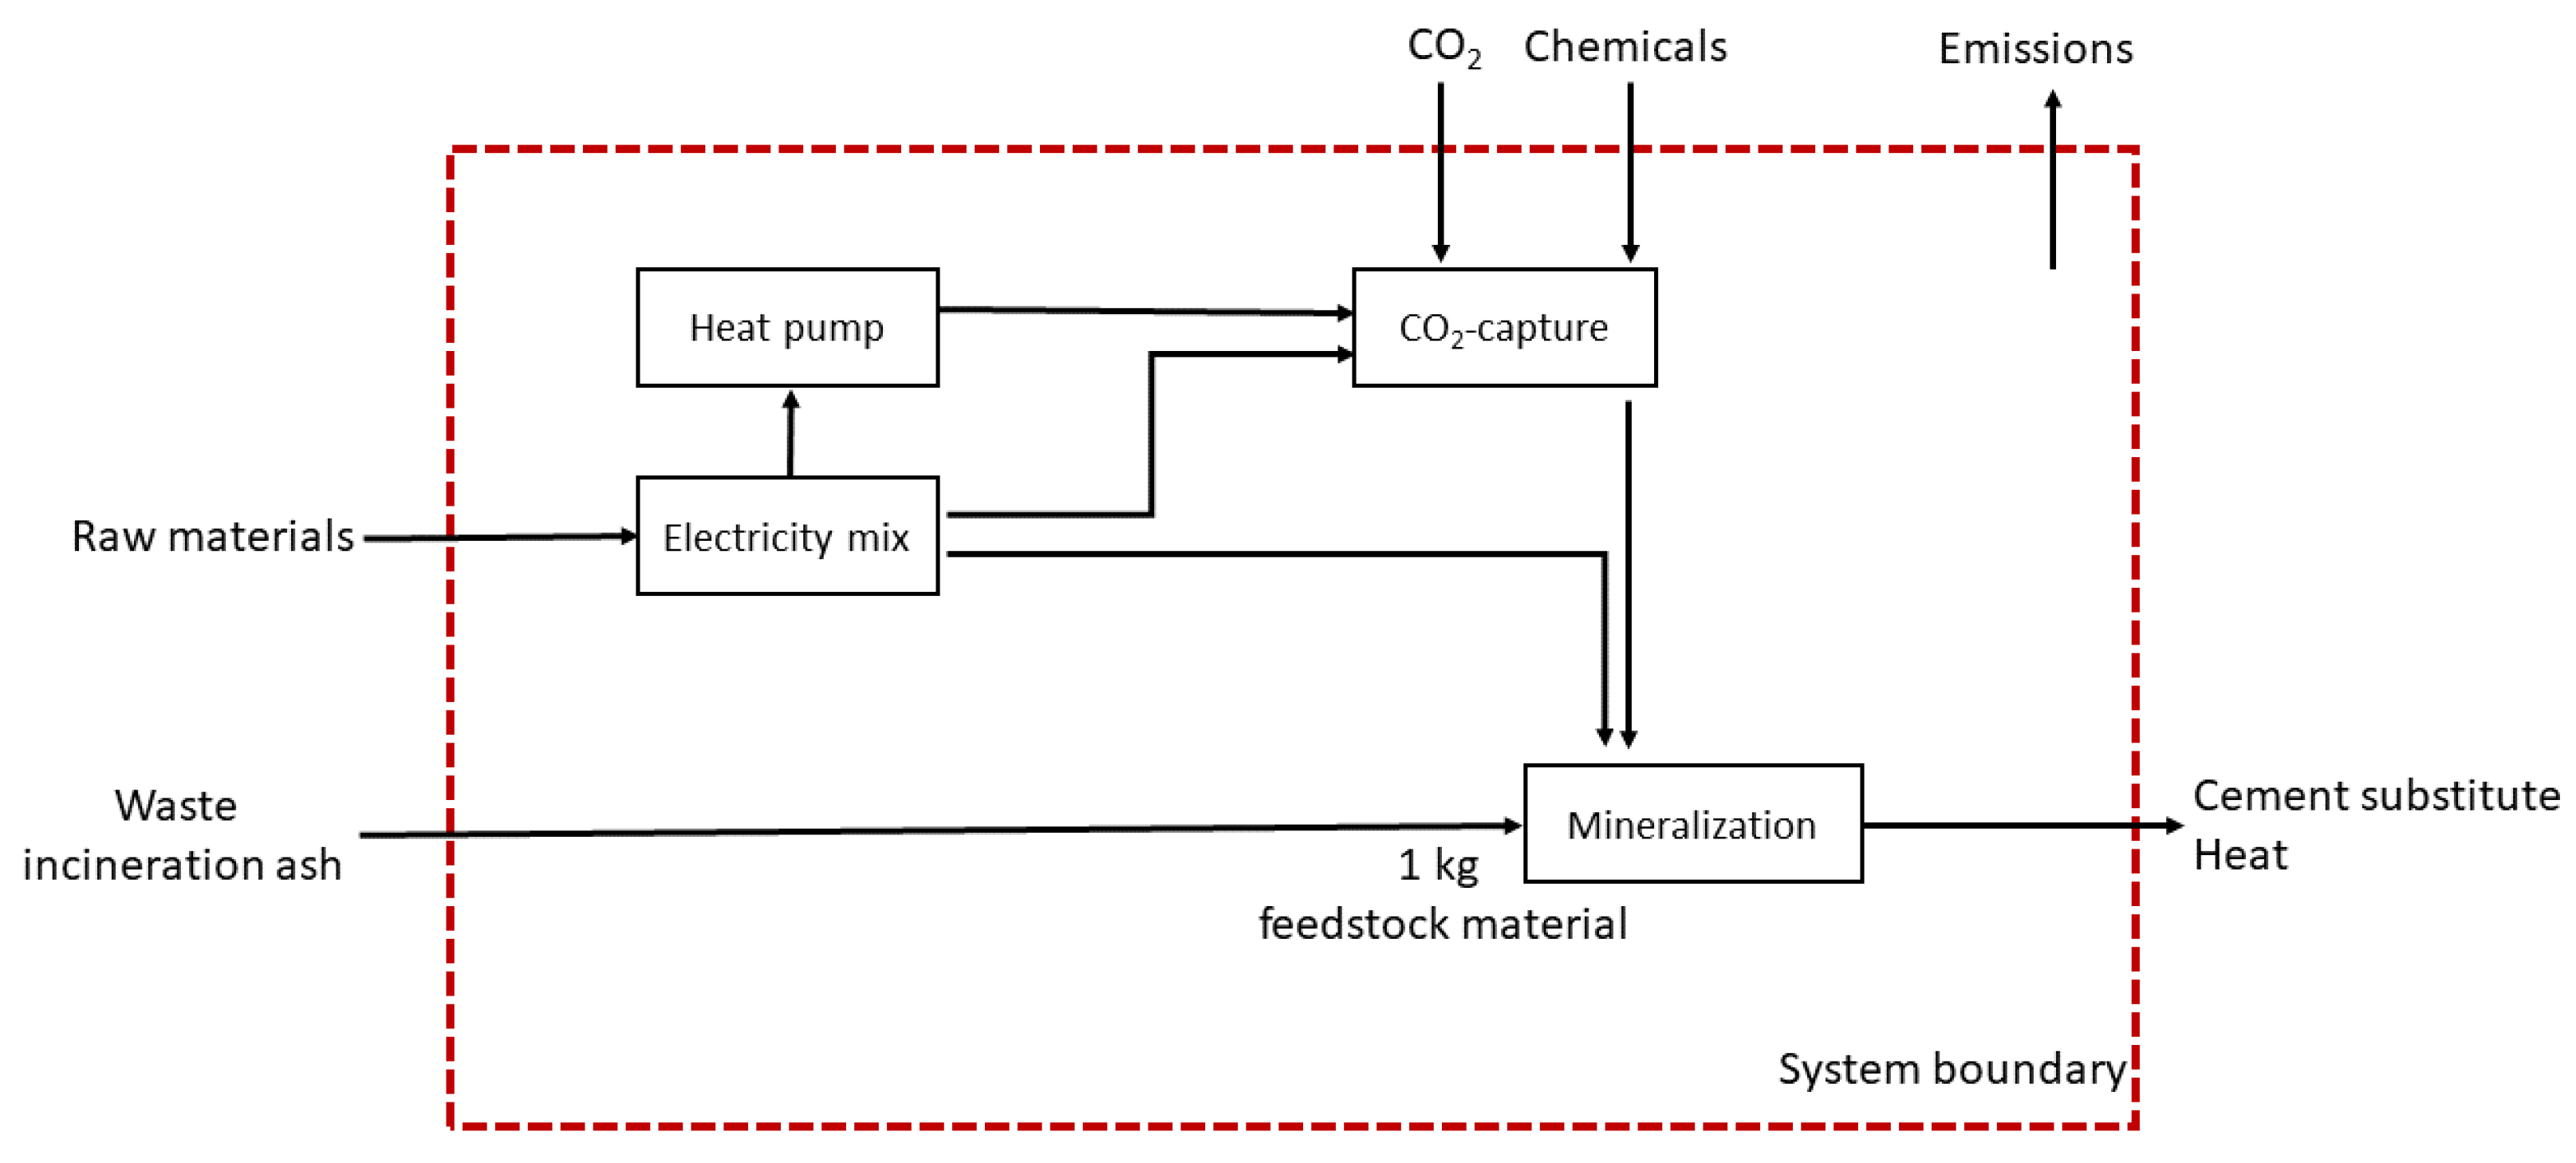
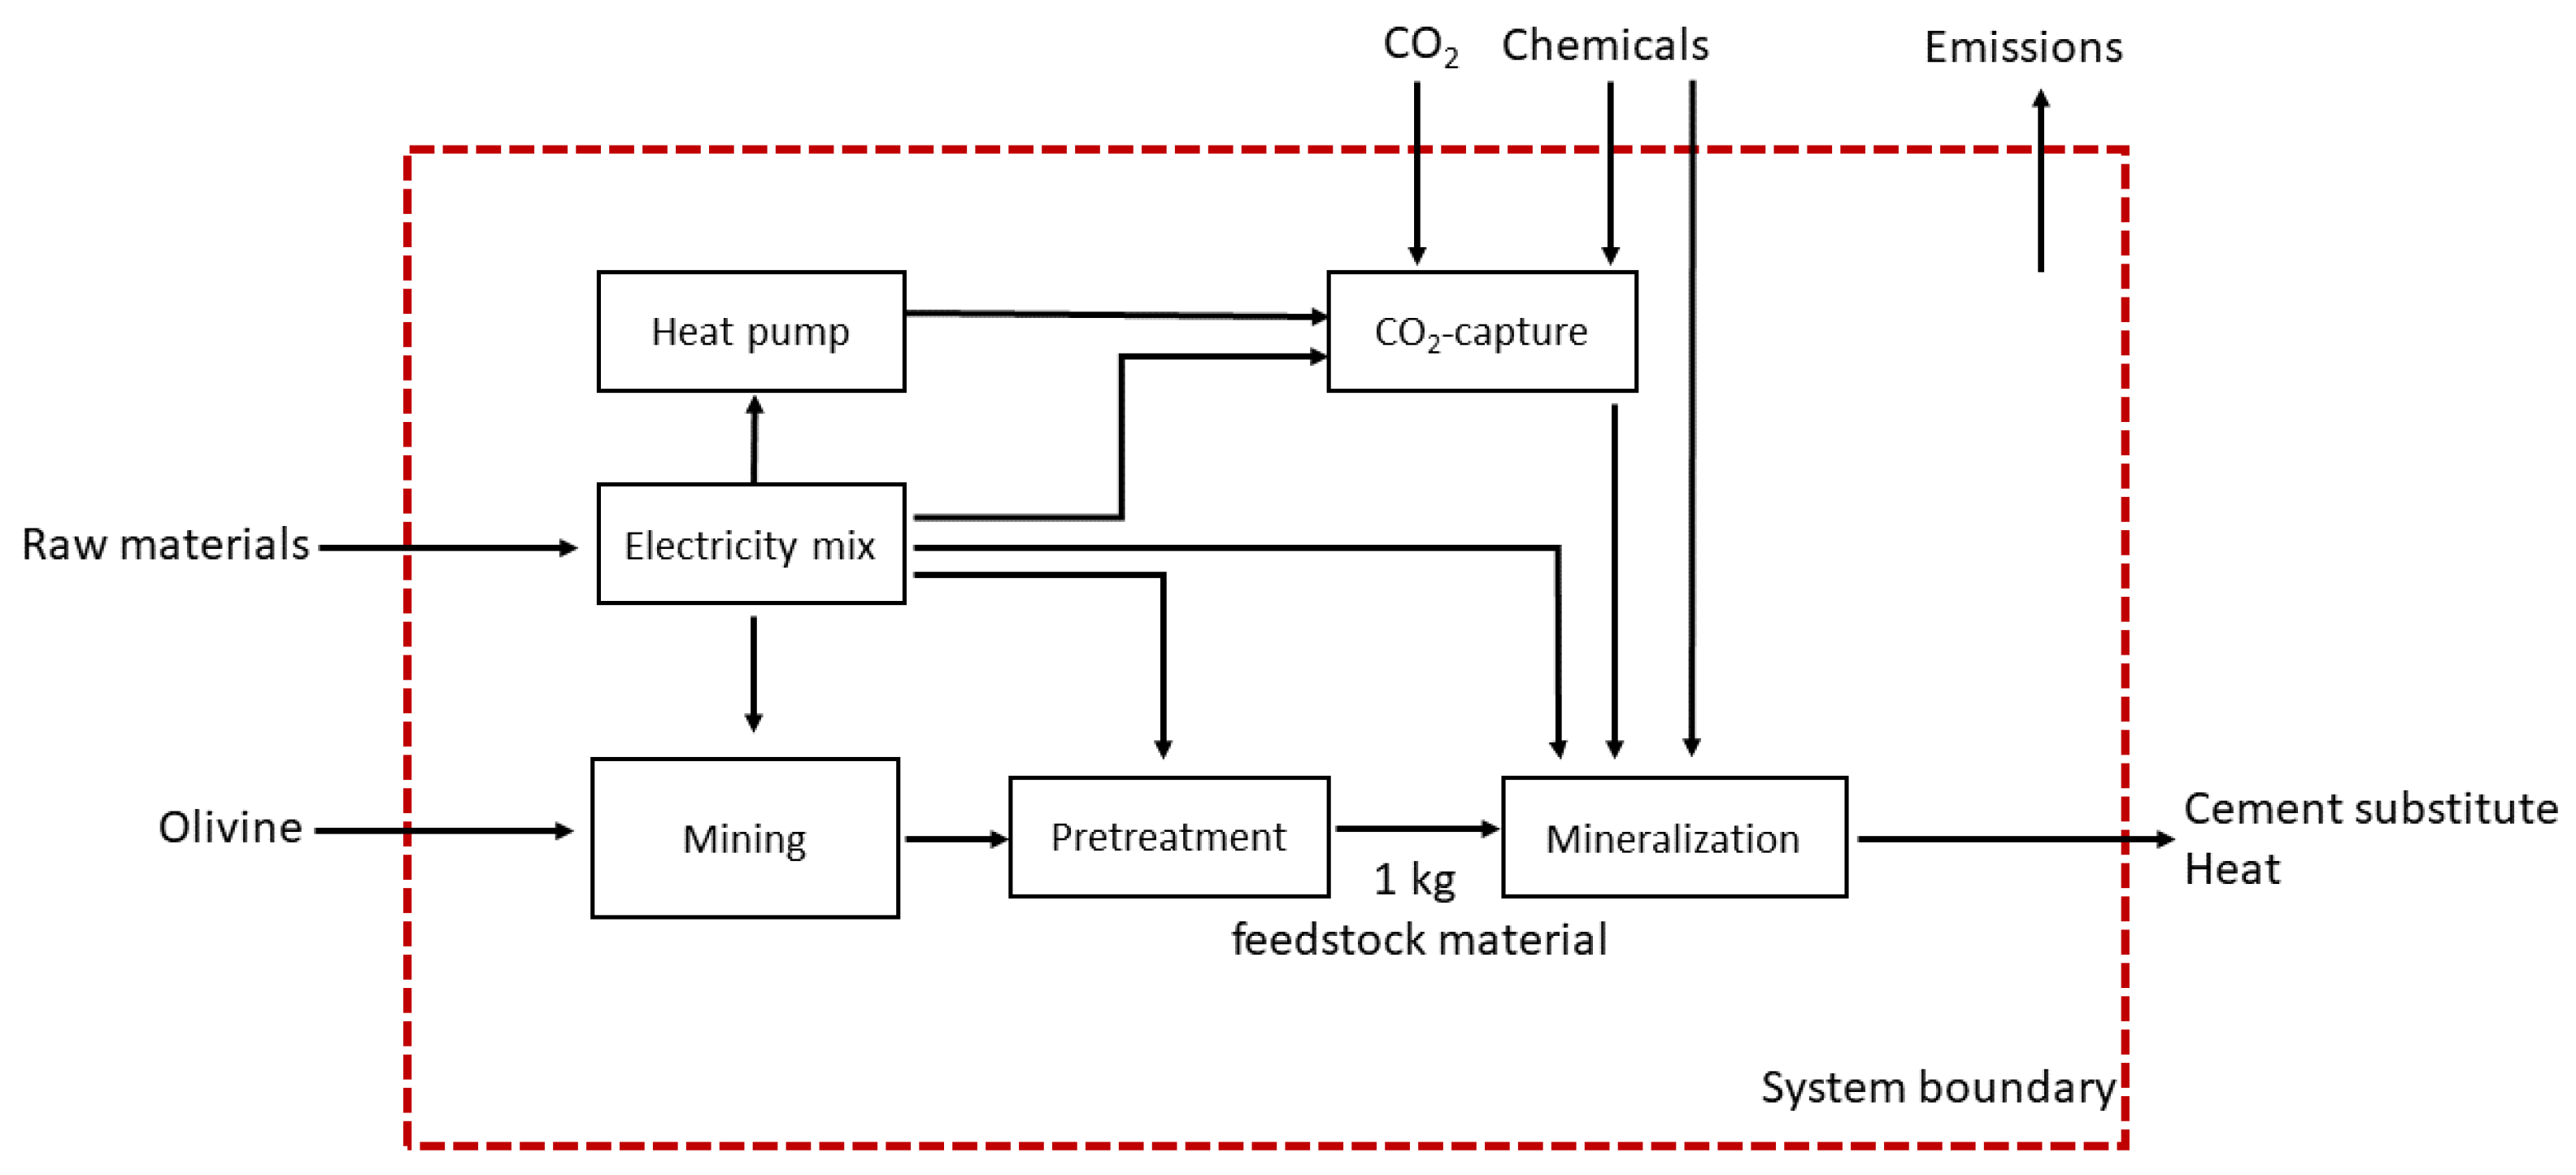
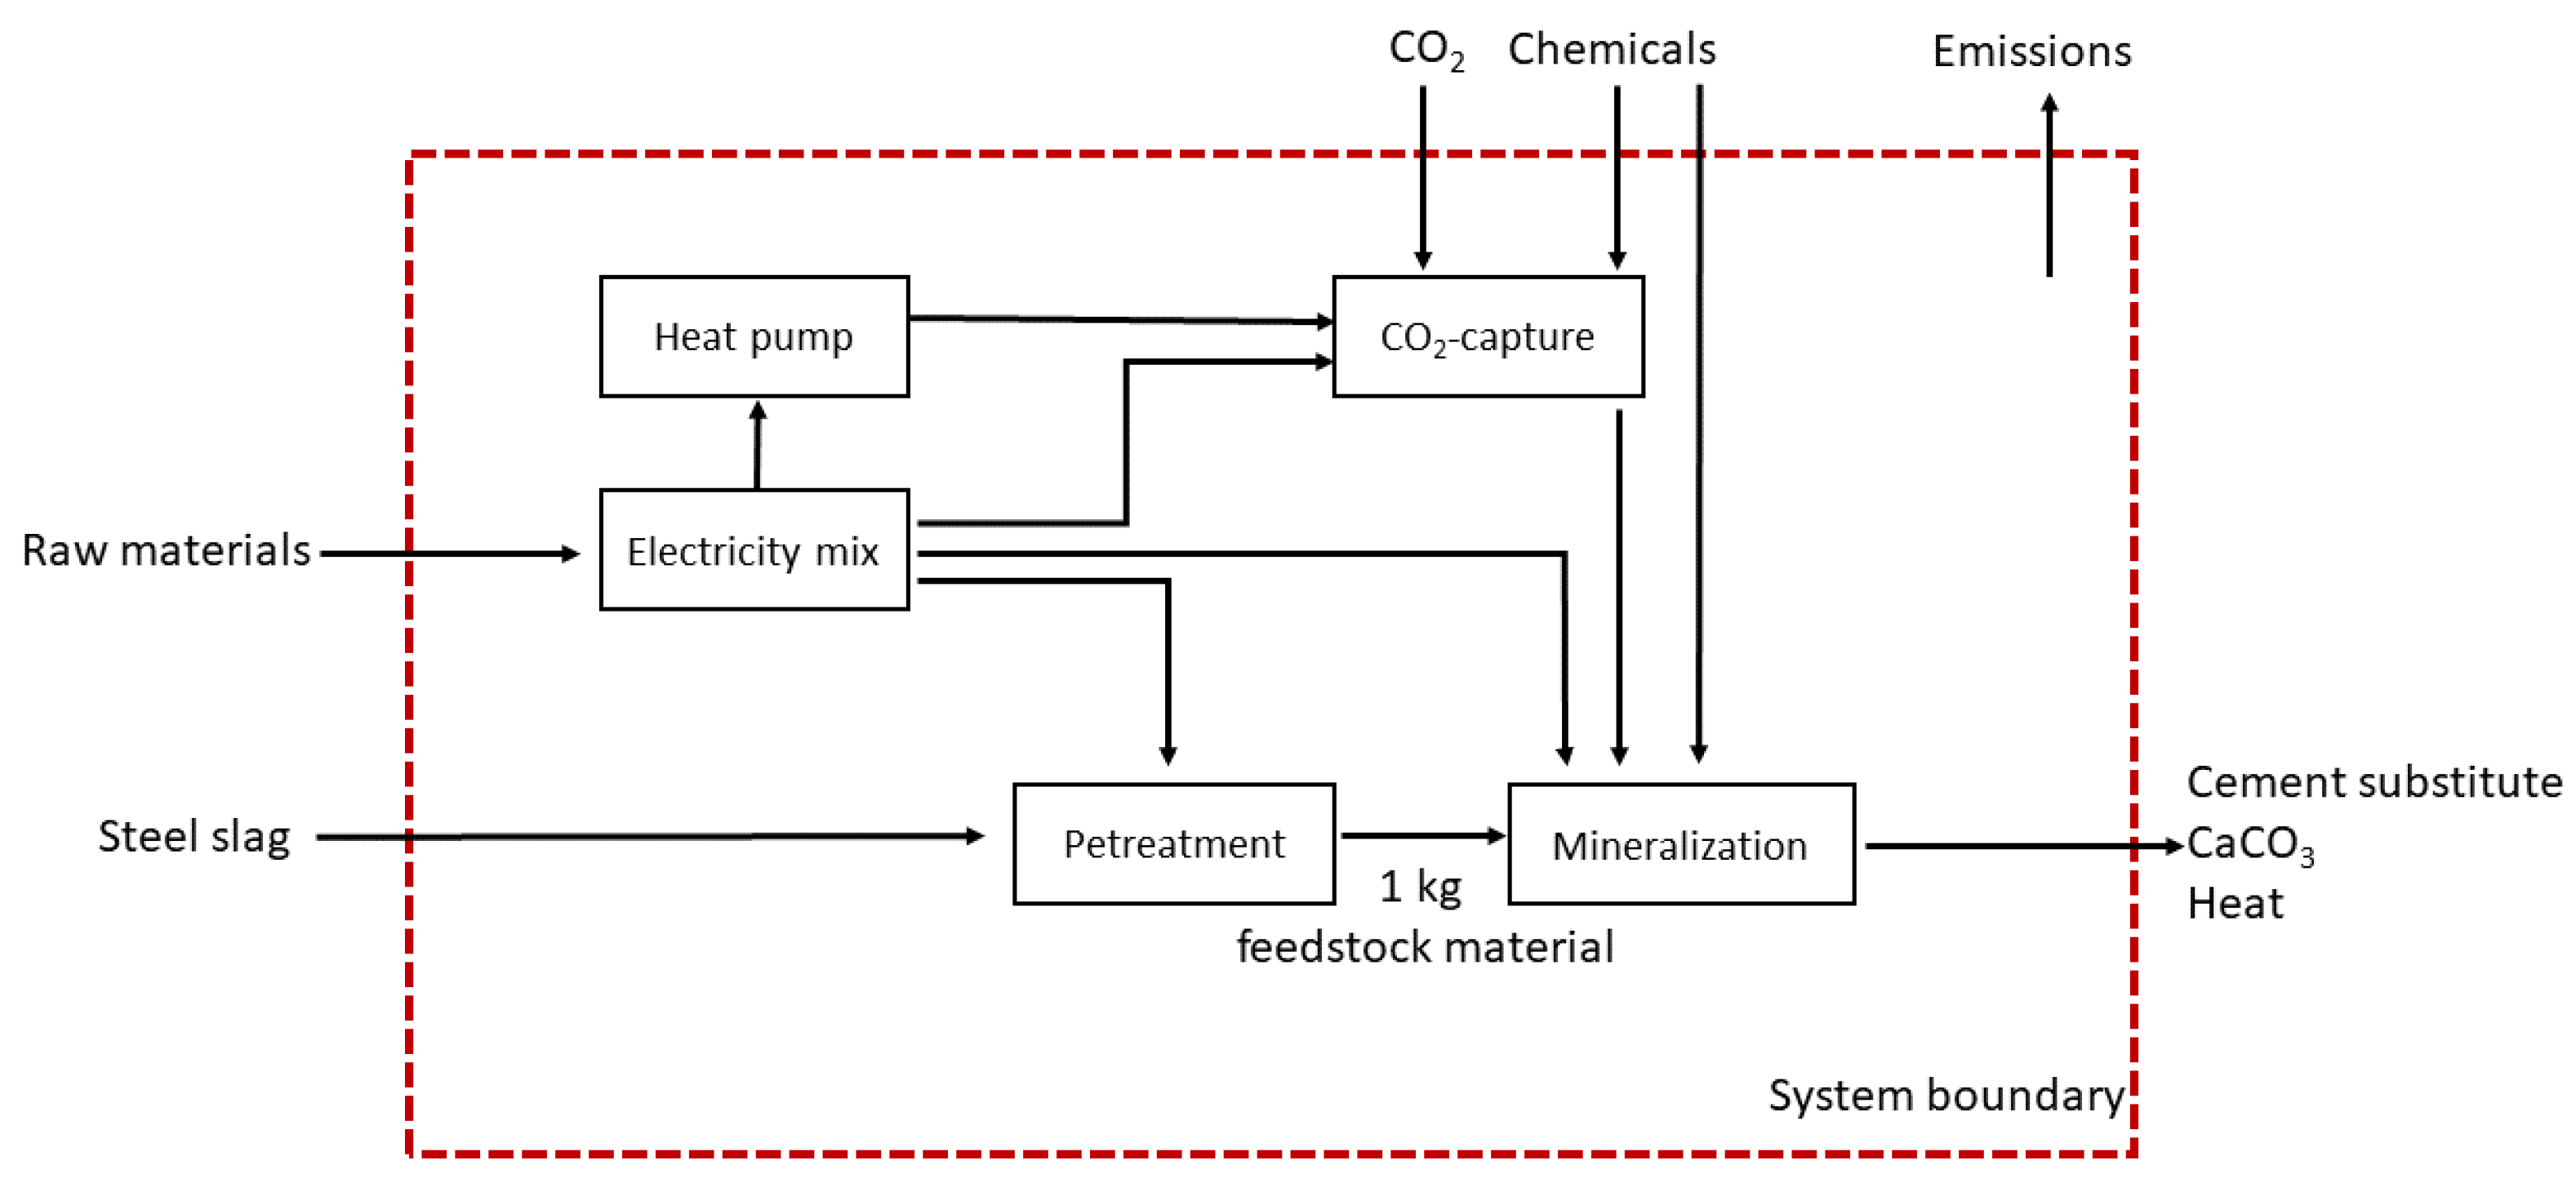
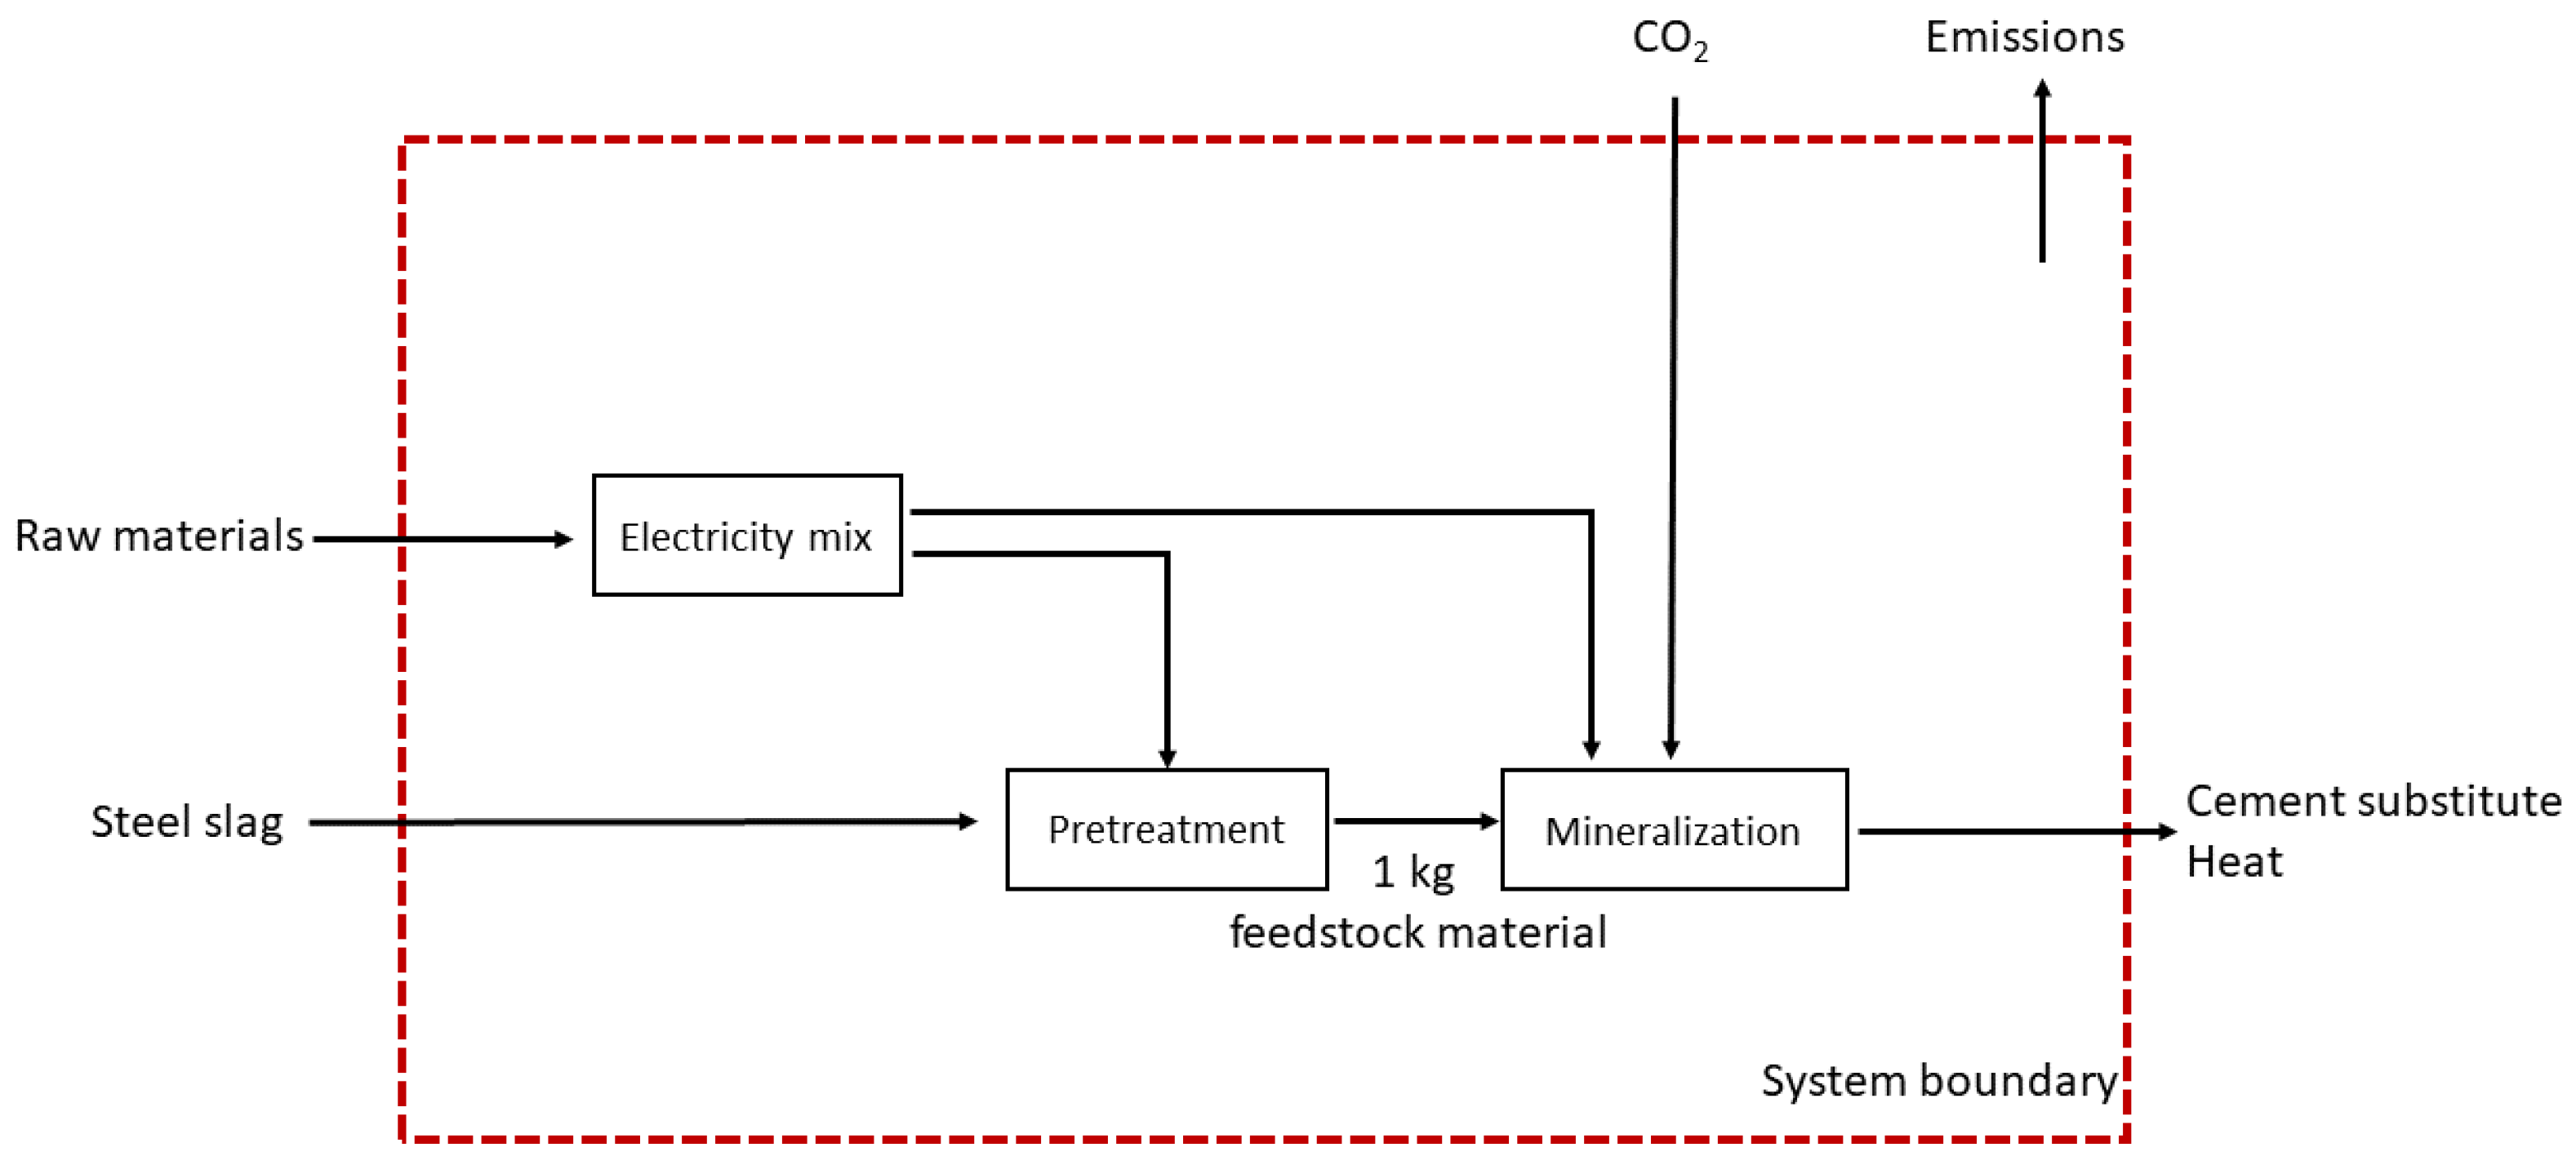
2.2. System Boundary
2.3. Life Cycle Inventory Processes
2.3.1. Mineralization Processes

| Process Name | Feedstock | TRL-Level | Literature Source |
|---|---|---|---|
| HiGCarb | Steel slag | 4 | Pan et al., 2015 [11] |
| Slag2PCC | Steel slag | 5 | Said et al., 2016 [24] |
| Conc1-Min | Waste concrete | 4 | Katsuyama et al., 2005 [26] |
| Conc2-Min | Waste concrete | 5 | Pasquier et al., 2018 [25] |
| MSWI-Min | MSWI-ash | 4 | Chang et al., 2015 [5] |
| Oliv-Min | Olivine | 3 | Eikeland et al., 2015 [27] |
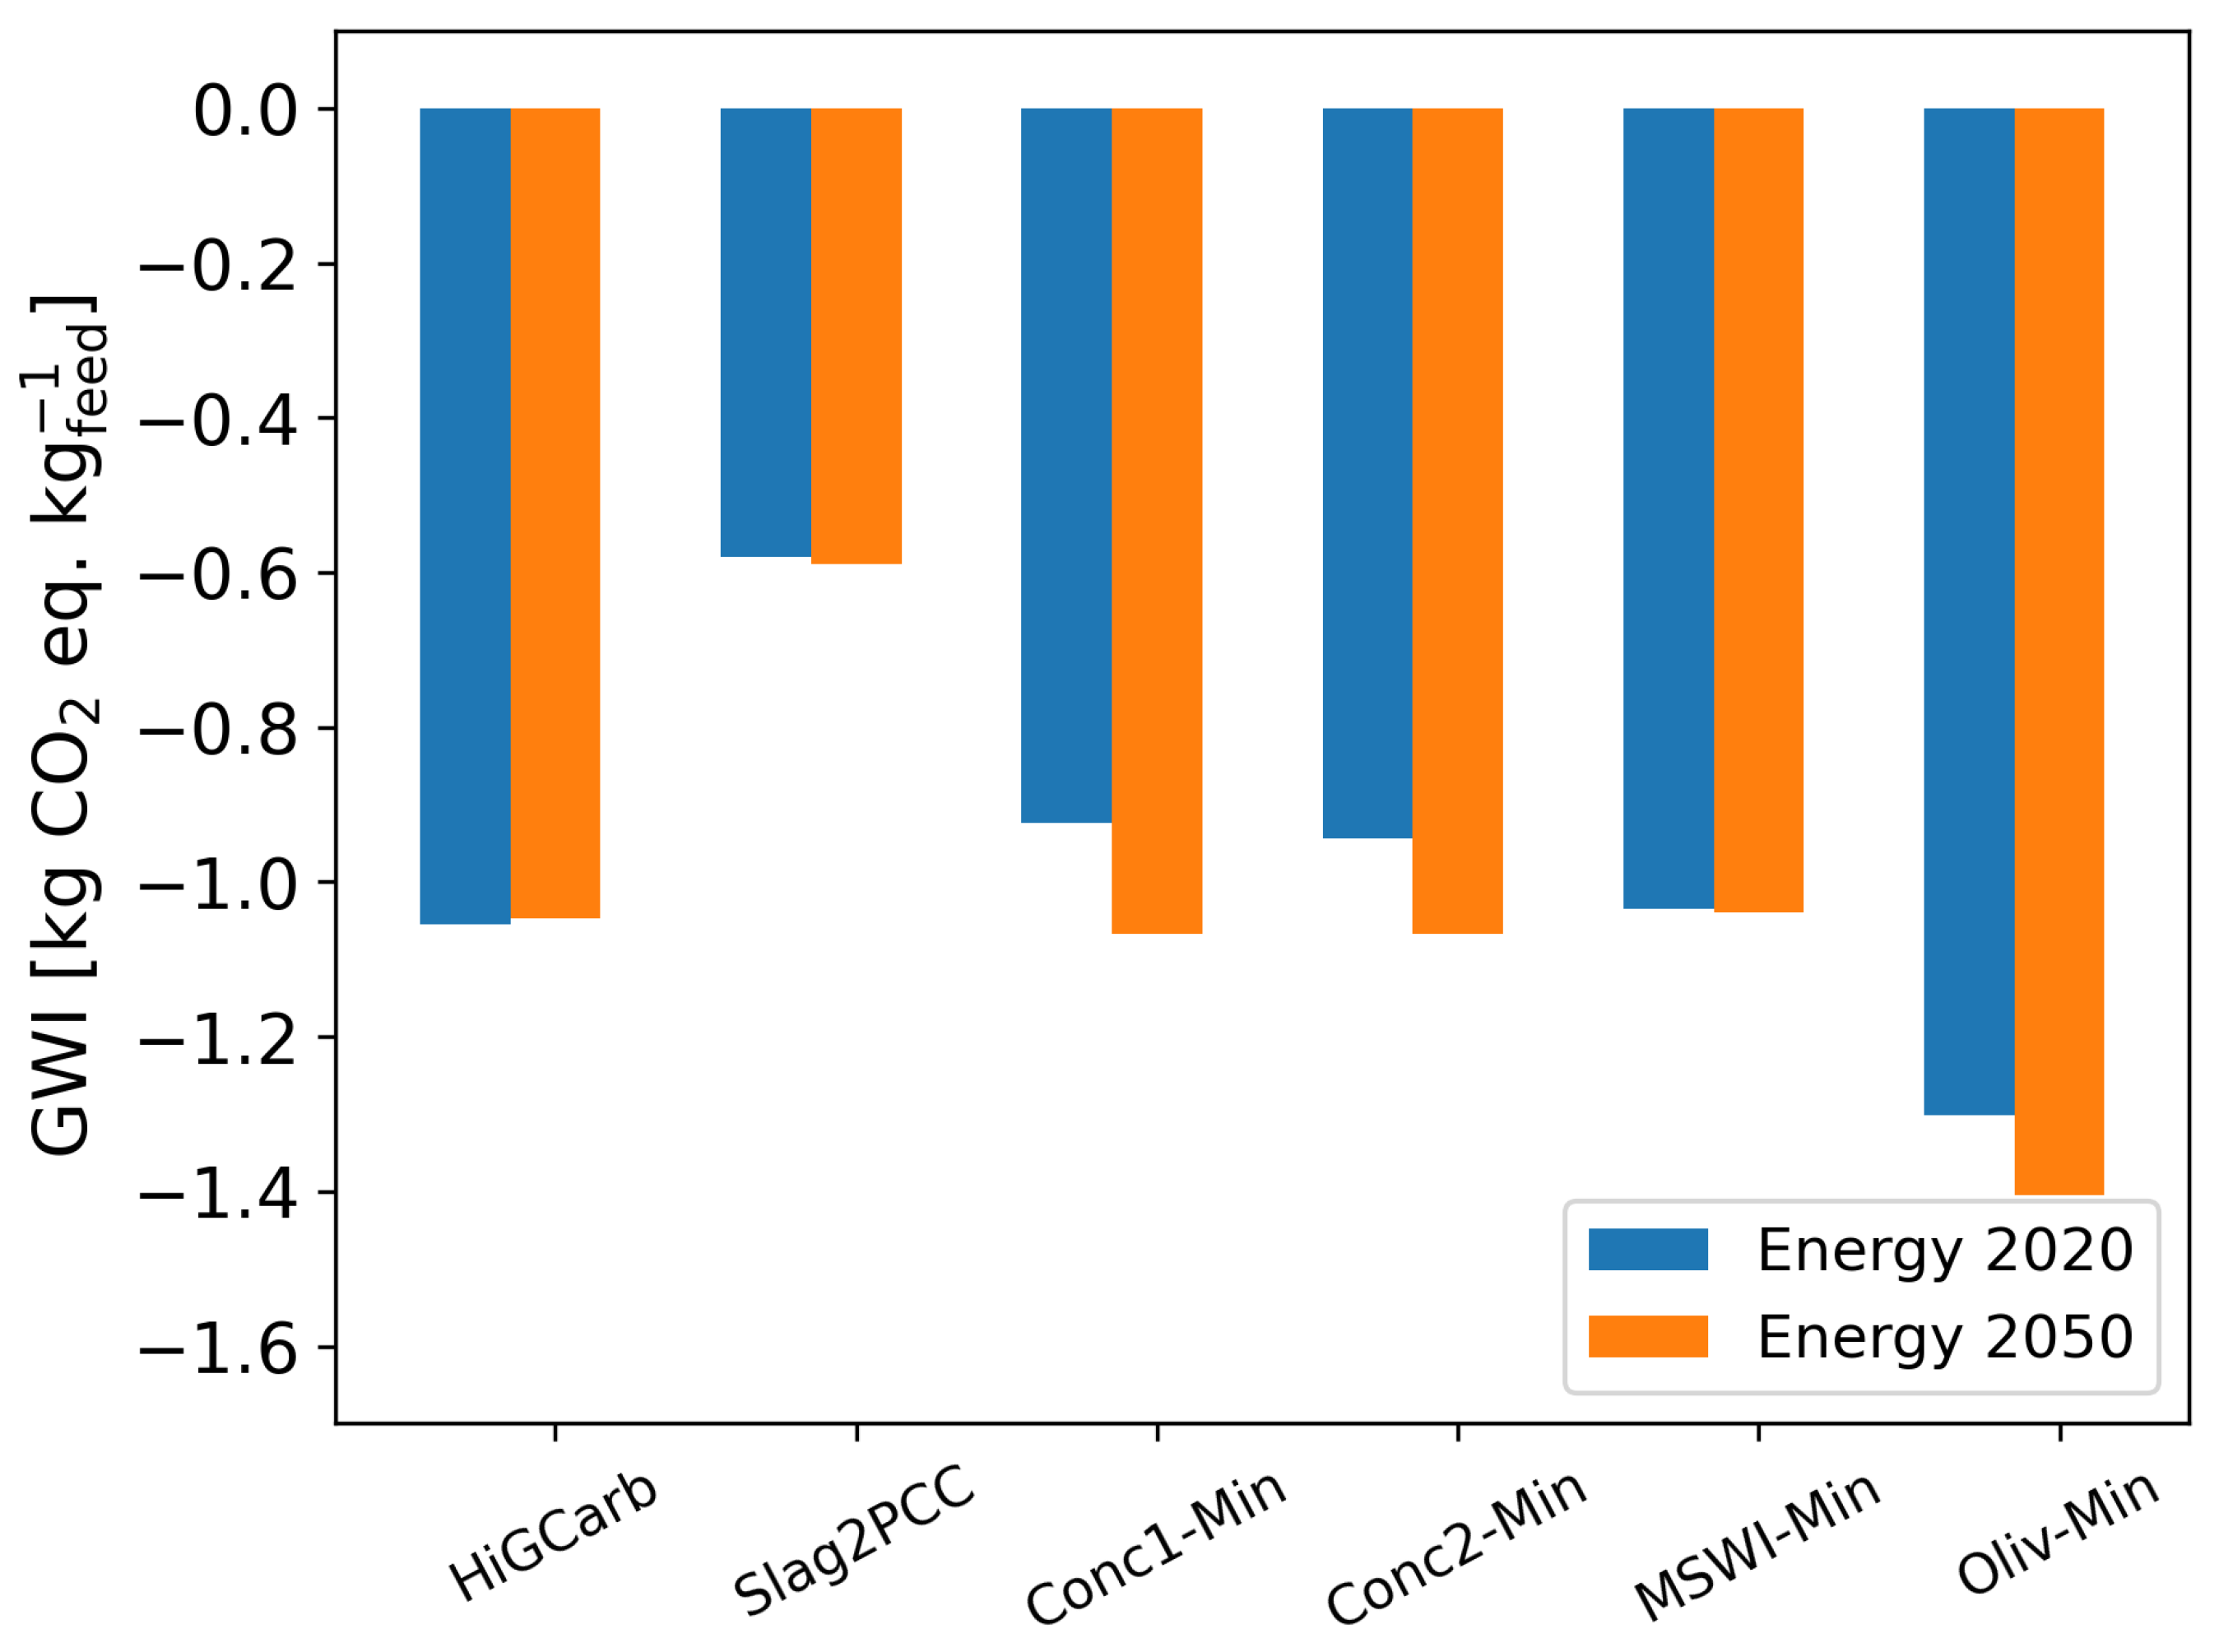
2.3.2. Energy
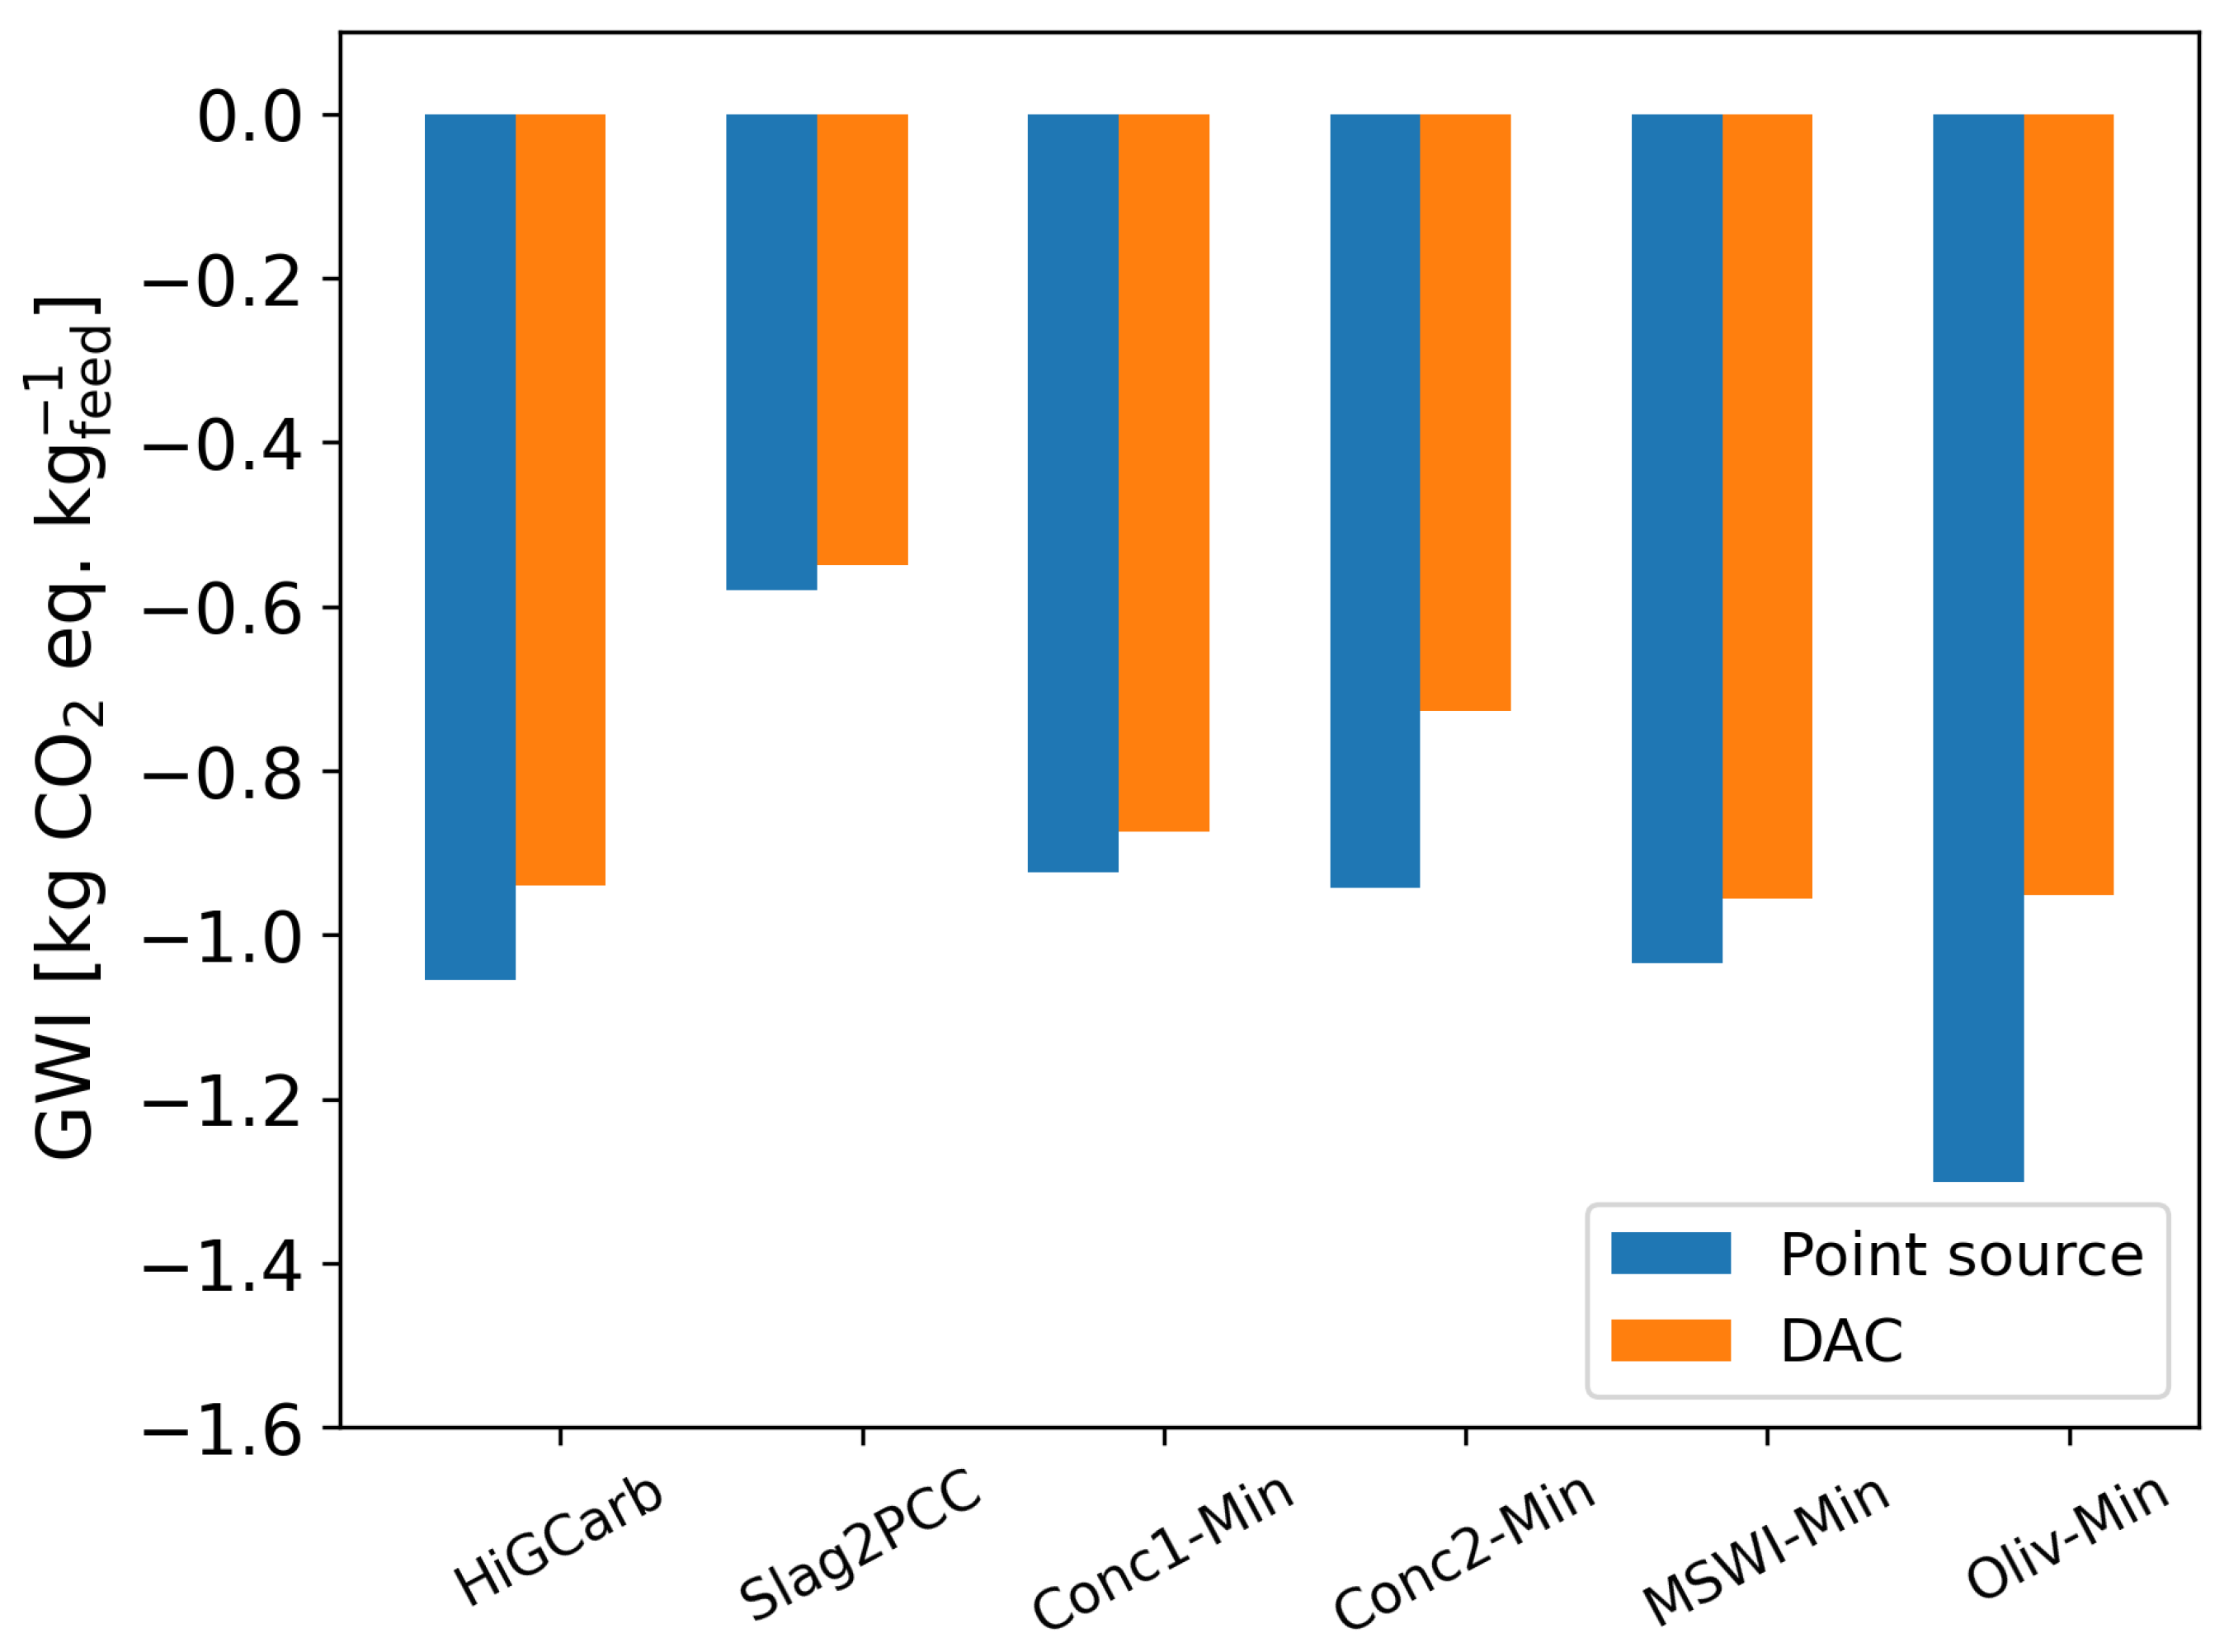
2.3.3. CO-Source
2.3.4. Products
3. Results
3.1. Base Case
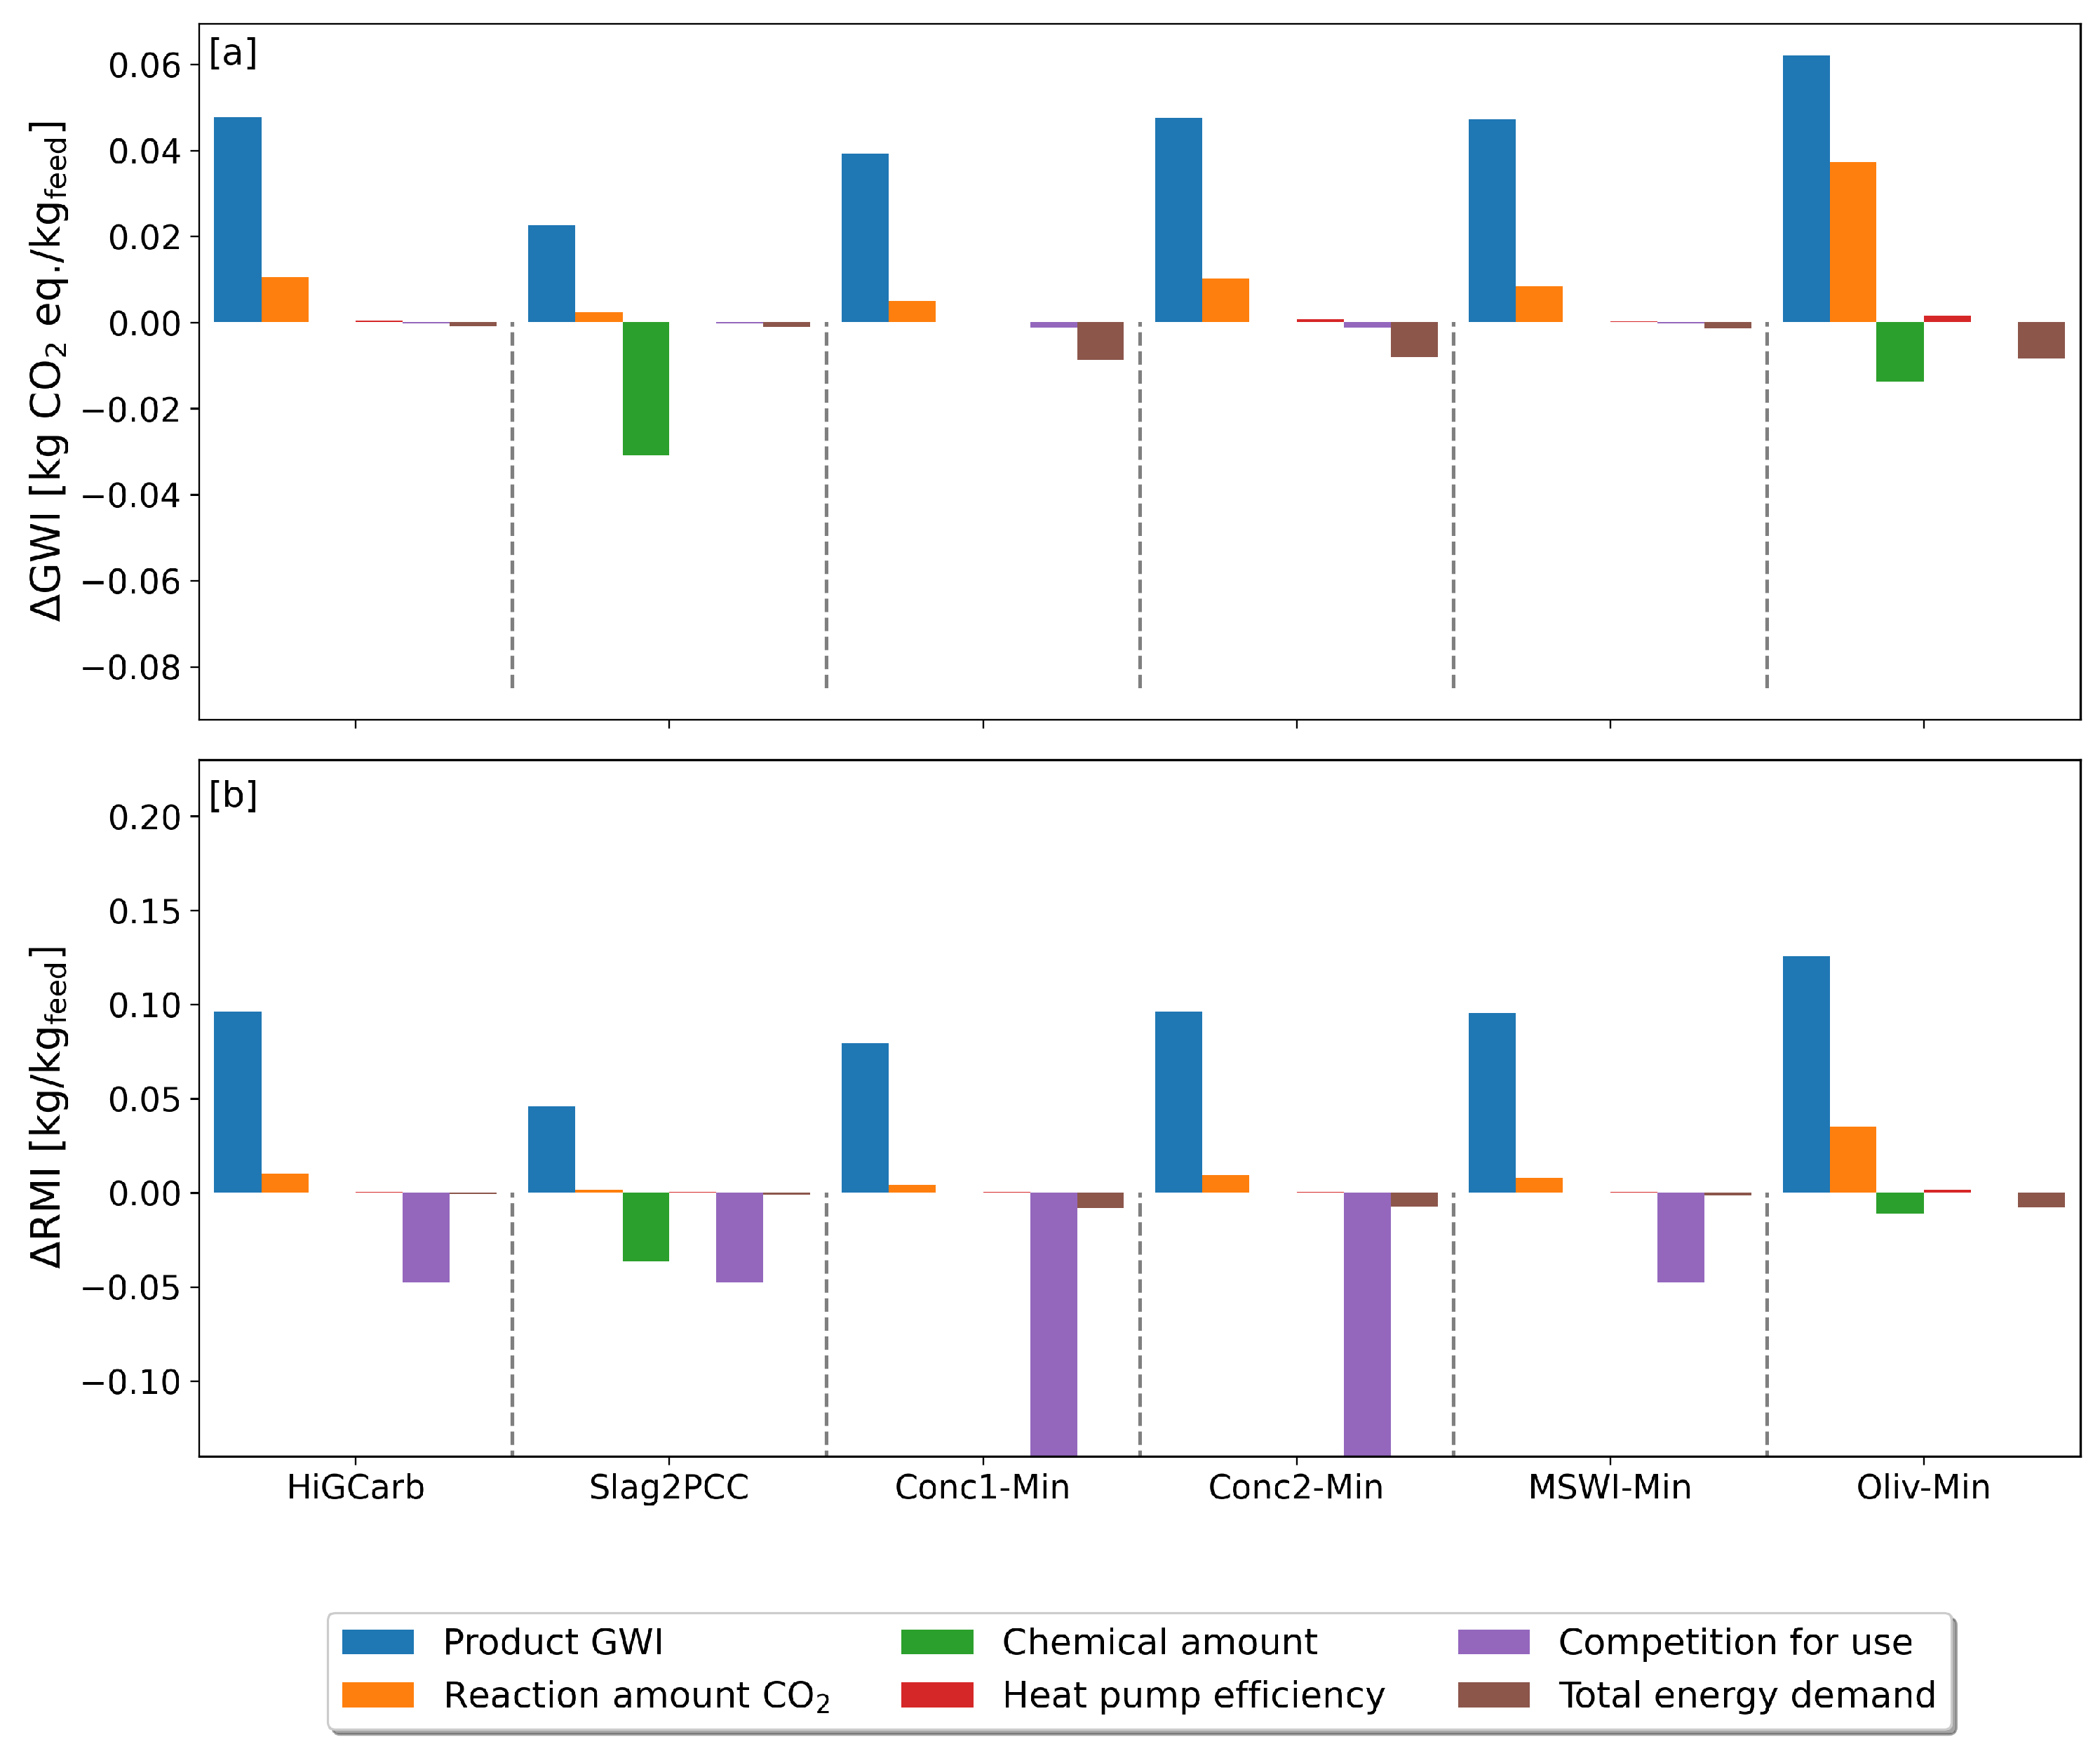
3.2. Sensitivity Analysis
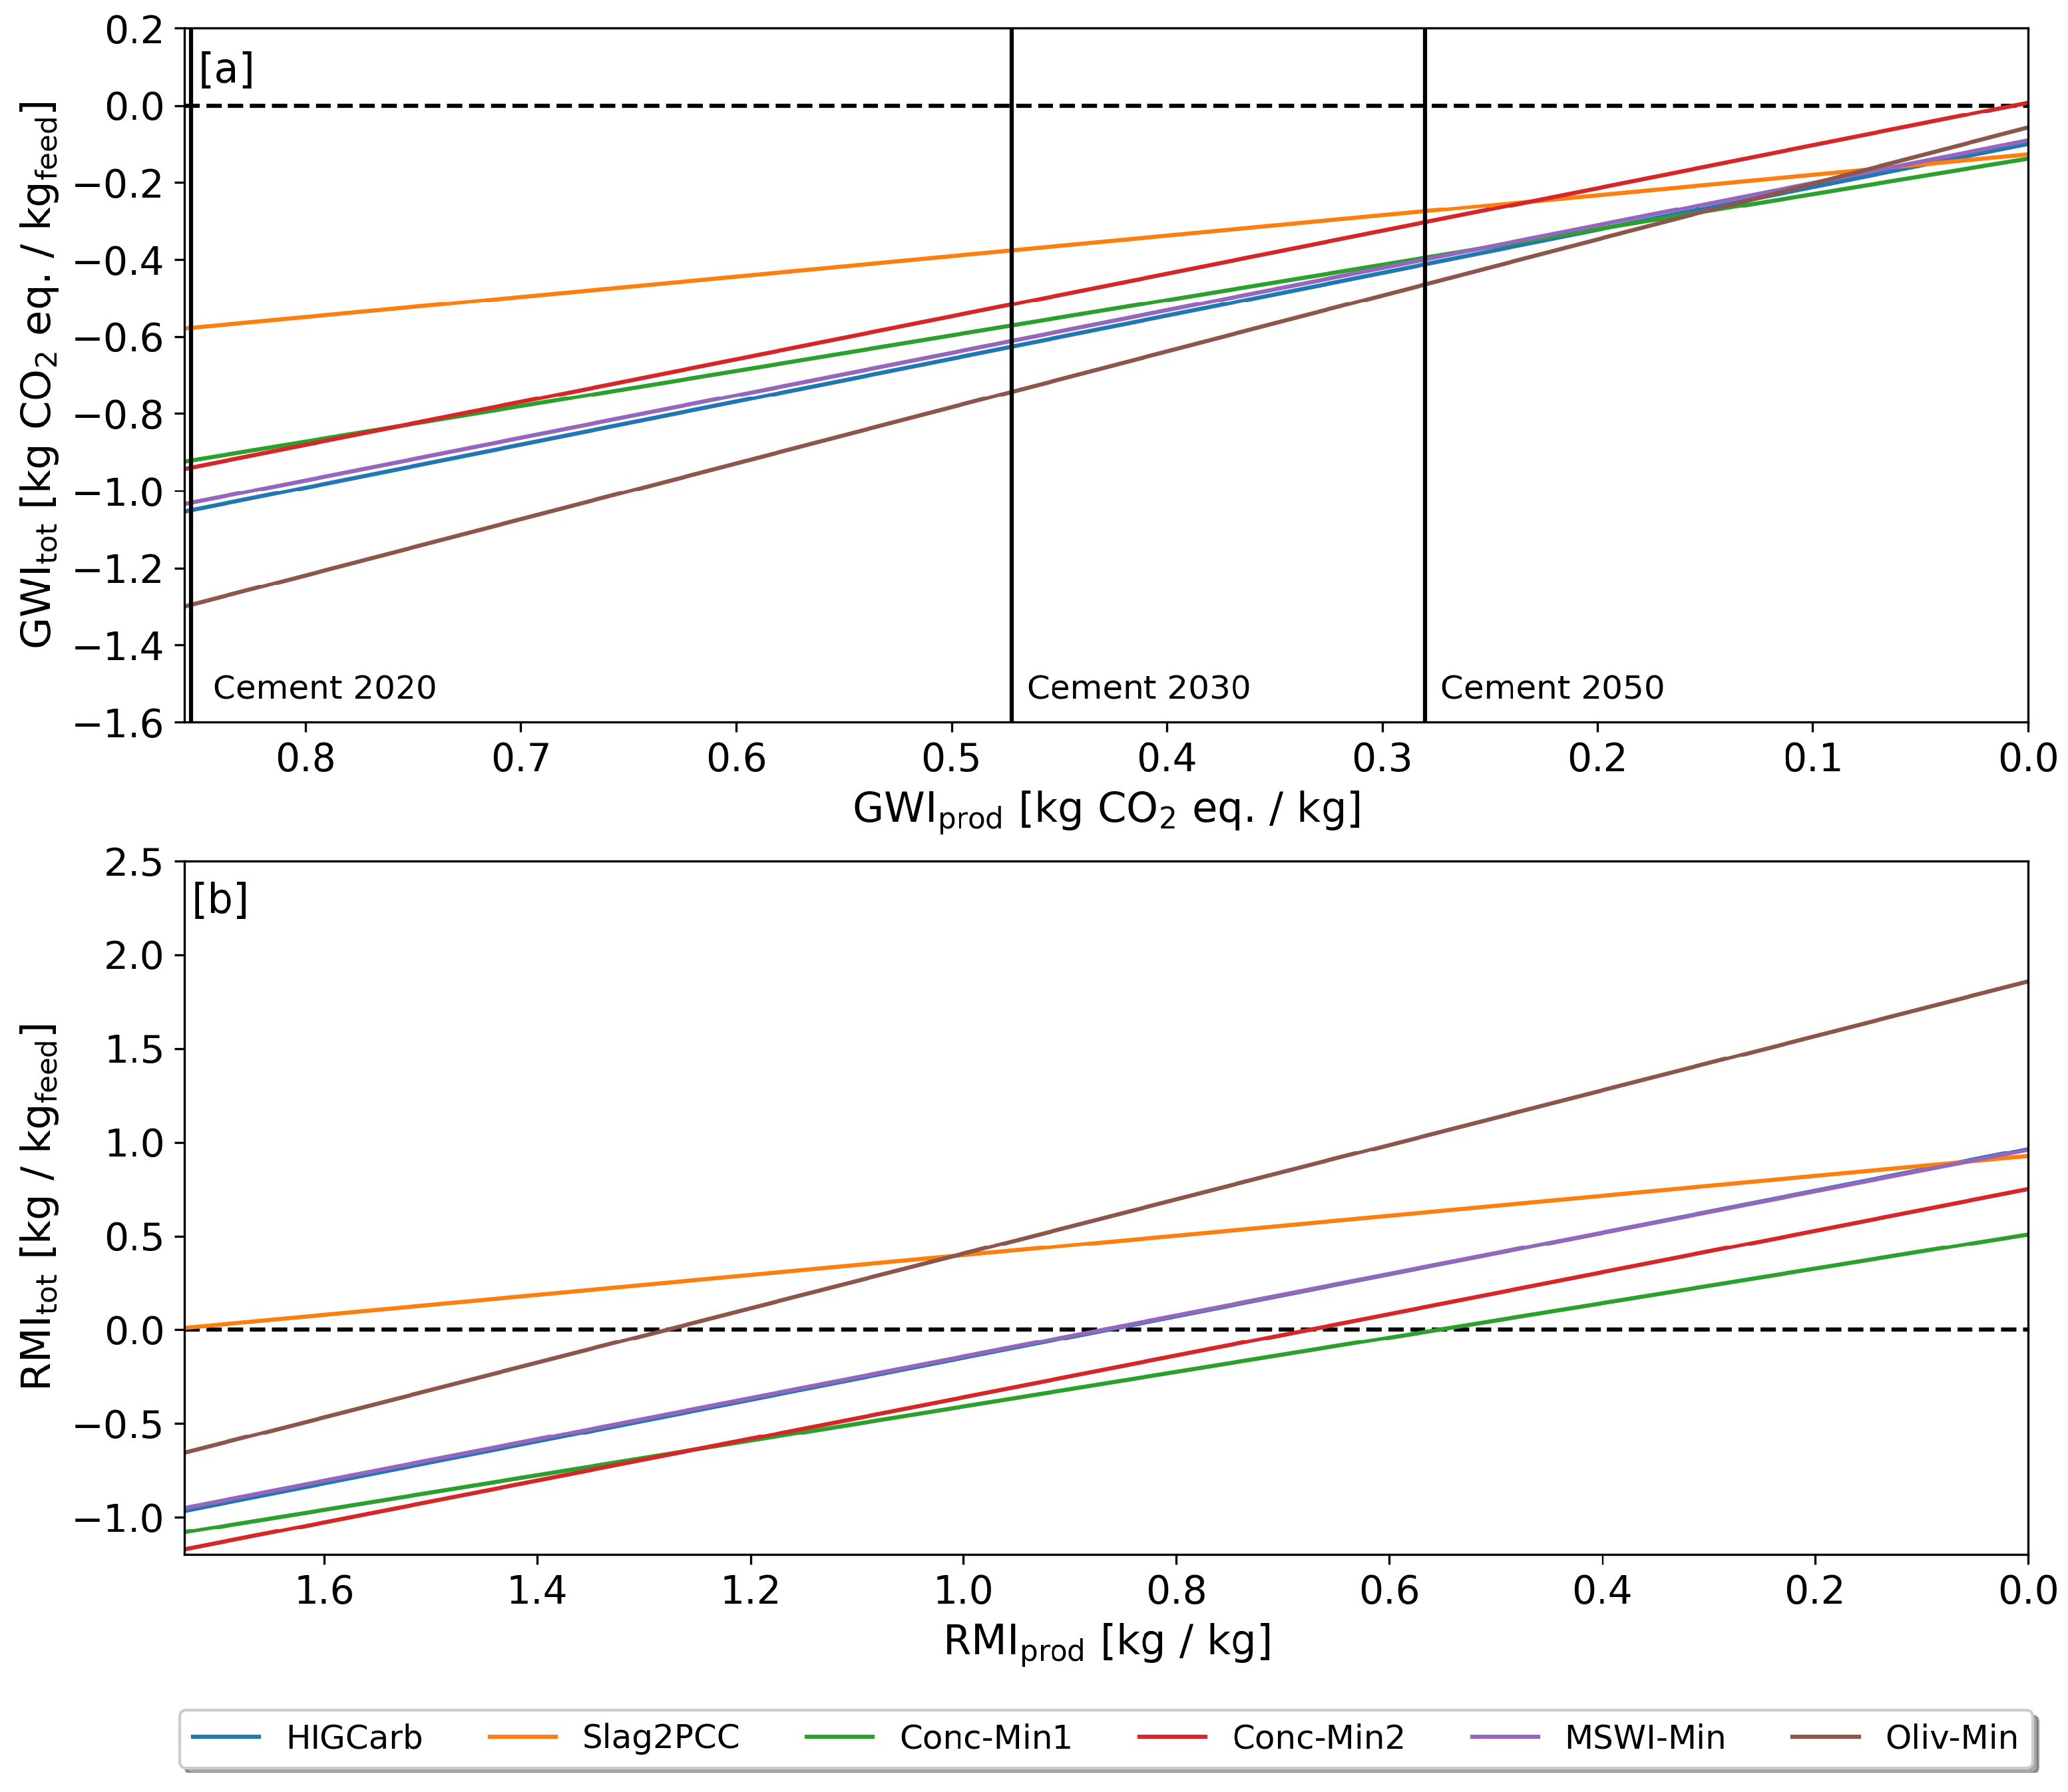
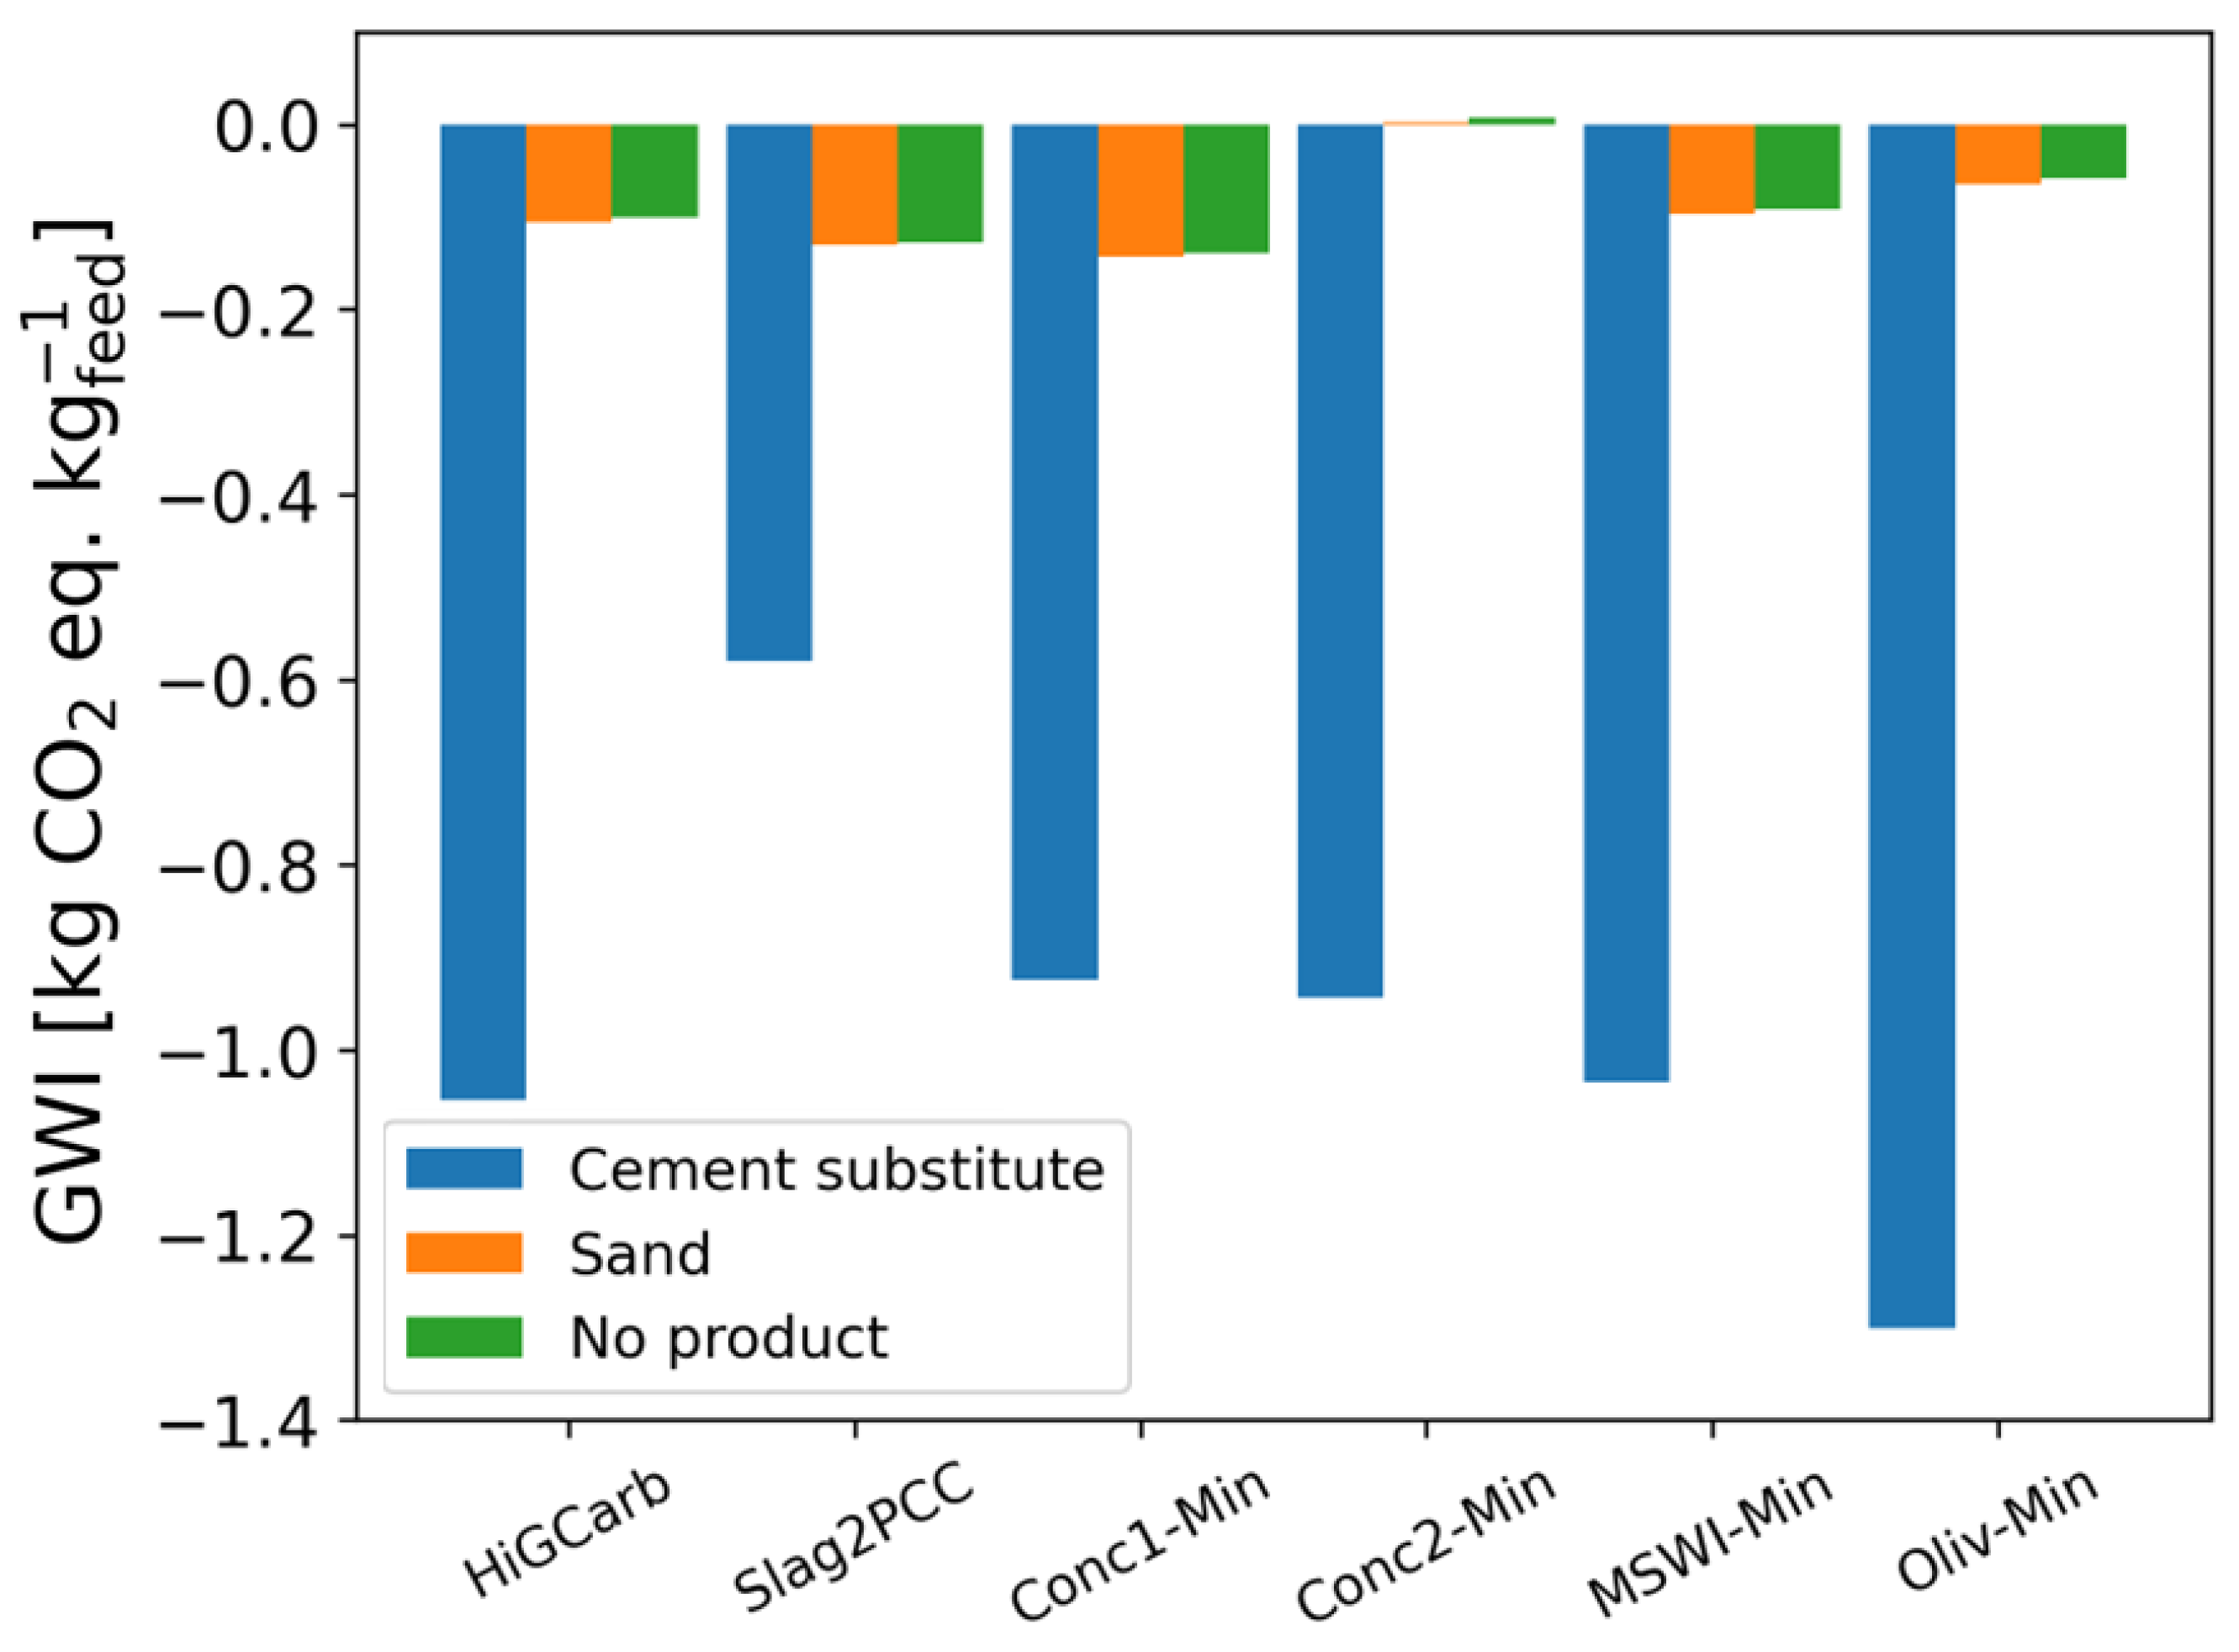
3.3. Product Effect
3.4. Effect of Functional Unit
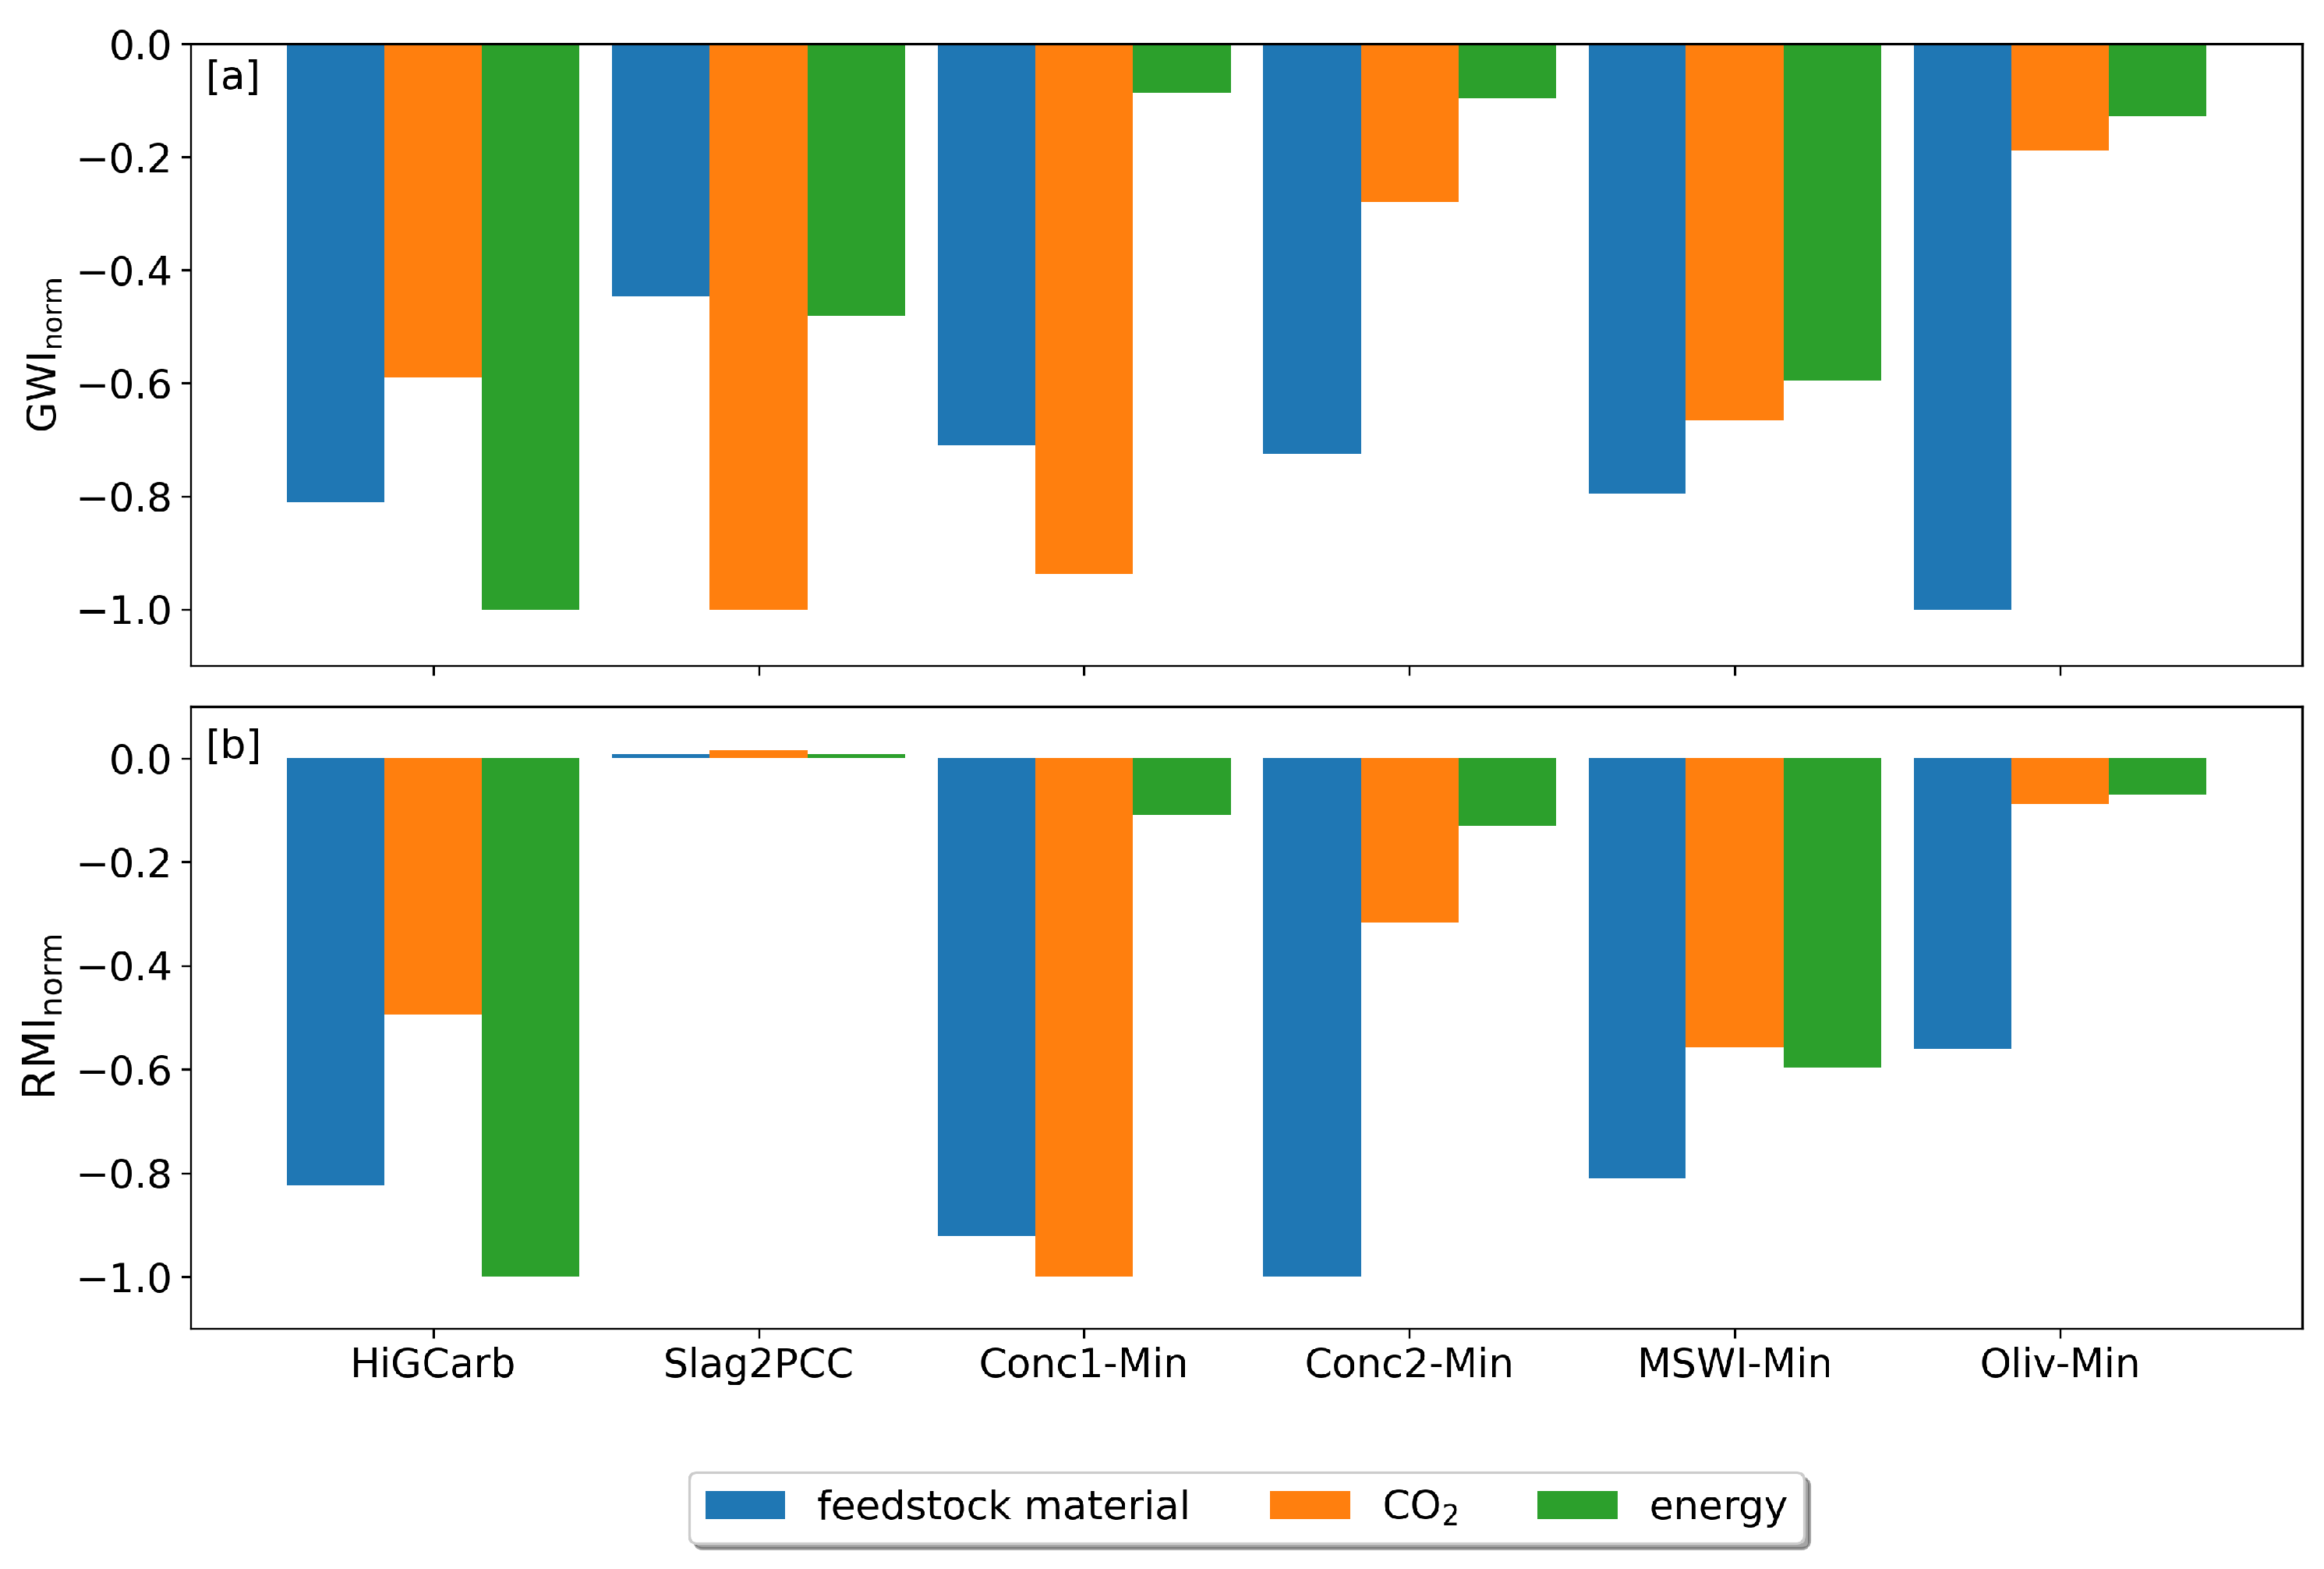
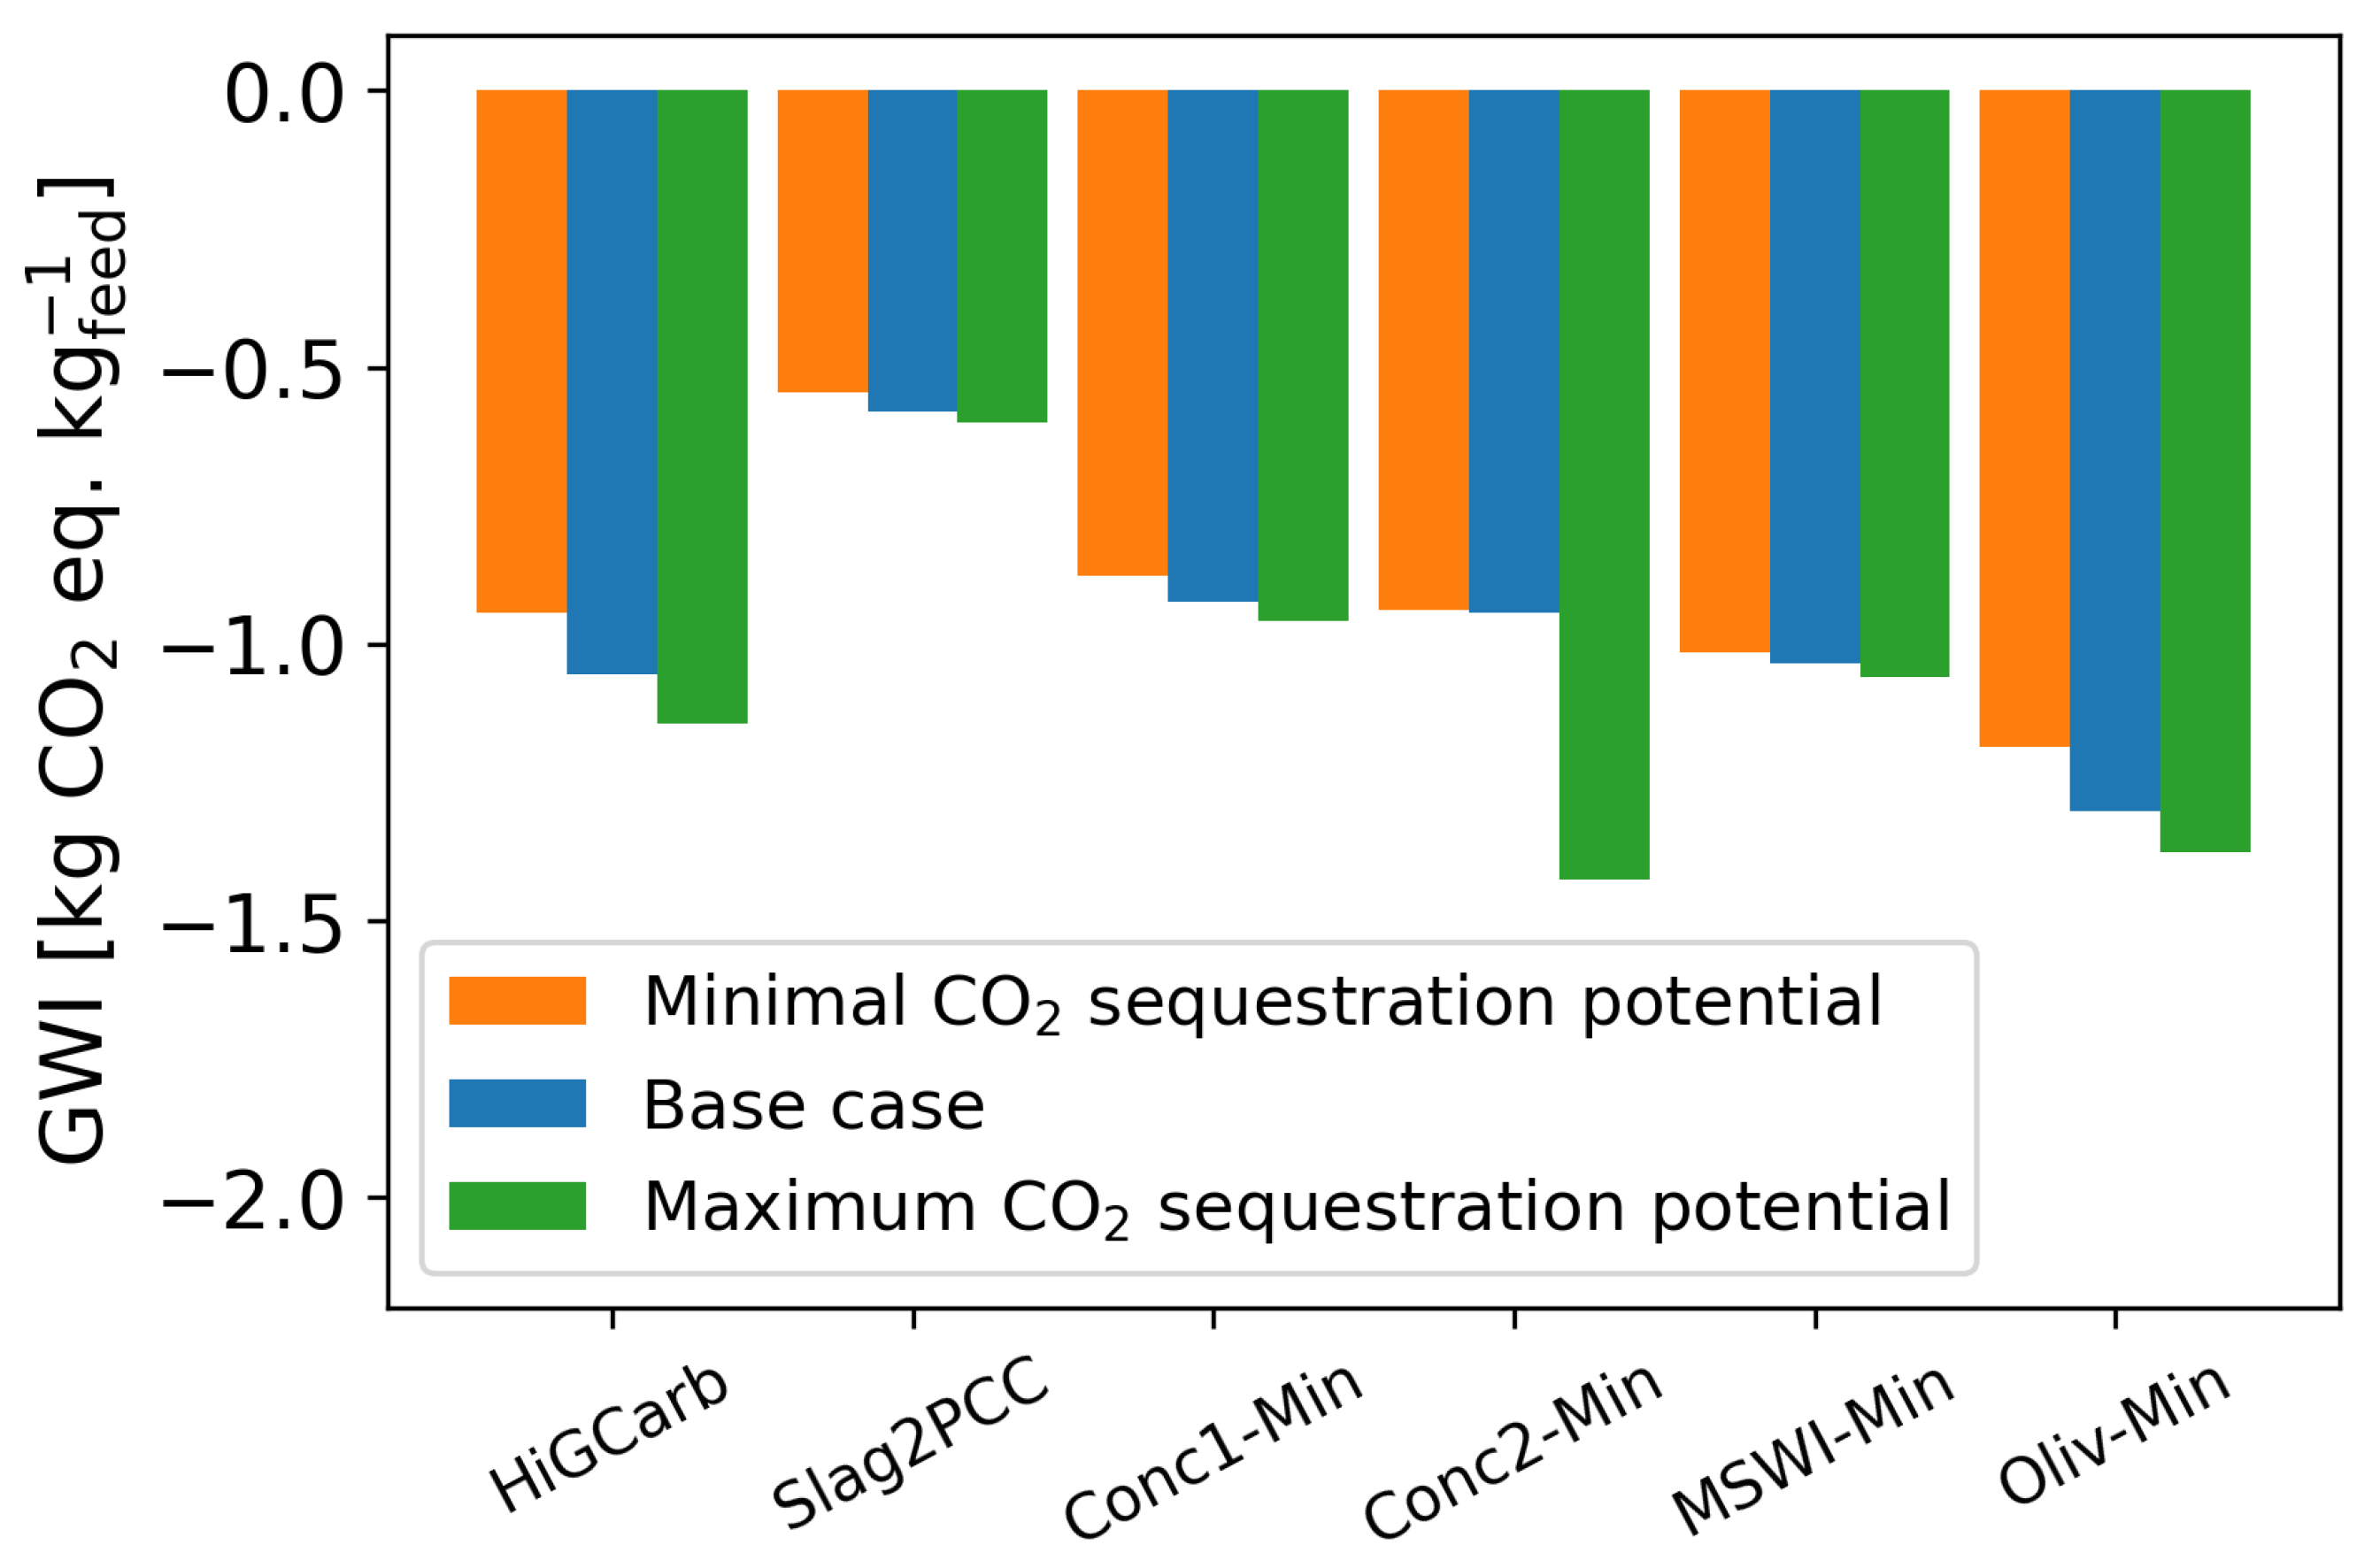
3.5. Reduction Potentials
4. Discussion
5. Conclusions
Author Contributions
Funding
Data Availability Statement
Conflicts of Interest
Abbreviations
| LCA | Life Cycle Assessment |
| GWI | Global warming impact |
| RMI | Raw material input |
| CCU | Carbon capture and utilization |
| CCS | Carbon capture and storage |
| CDR | Carbon dioxide removal |
| PCC | Precipated Calcium Carbonate |
| TRL | Technology Readiness Level |
| COP | Coefficient of performance |
Appendix A


| Feedstock Material | Waste Generation DE [Mt a] | [%] | [%] | [Mt CO] | Utilization Rate |
|---|---|---|---|---|---|
| waste concrete | 24.6 [6] | 26.4–26.8 [38] | 0.63–1.2 [38] | 3.1–5.5 | 94% [7] |
| steel slag | 5.4 [8] | 25–57 [39,40,41] | 1.1–3.3 | 92% [8] | |
| MSWI ash | 5.2 [9] | 16.4–21.1 [5] | 1.9–2.1 [5] | 0.8–1.0 | 94% [9] |
| paper industry waste | 7.1 [42] | 2.8–19 [43] | 0.2–1.1 | ||
| red mud | 1.7 [44,45,46] | 0-14 [47] | 0–0.2 | ||
| coal ash | 15.6 [48] | 1–50 [39,48,49] | 1.1–3.9 | 87% [48,50] | |
| wood power plant ash | 1.8 [51,52] | 39.2 [51] | 6.4 [51] | 0.08 |
| Name | Feedstock | T | p | TRL | [kg] | [kg] | |
|---|---|---|---|---|---|---|---|
| HiGCarb | Steel slag | 50 °C | 30 bar | 4 | 0.040 | 0.12 | 1.12 |
| Slag2PCC | Steel slag | RT | 10.3 bar | 5 | 0.028 | 0.038 | 0.53 |
| Conc1-Min | Waste concrete | RT | 1 bar | 4 | 0.011 | 0.065 | 0.92 |
| Conc2-Min | Waste concrete | RT | 1 bar | 5 | 0.0081 | 0.22 | 1.11 |
| MSWI-Min | MSWI-ash | 25 °C | 1 bar | 4 | 0.018 | 0.10 | 1.10 |
| Oliv-Min | Olivine | 190 °C | 100 bar | 3 | 0.21 | 0.45 | 1.45 |
| Name | Feedstock | [%] | [%] | W [kW h t] |
|---|---|---|---|---|
| HiGCarb | Steel slag | 27.3 | 12.16 [53] | |
| Slag2PCC | Steel slag | 27.3 | 12.16 [53] | |
| Conc1-Min | Waste concrete | 51.40 | 1.50 | 13.49 [53] |
| Conc2-Min | Waste concrete | 37.2 | 8.2 | 13.49 [53] |
| MSWI-Min | MSWI-ash | 16.4 | 1.9 | |
| Oliv-Min | Olivine | 0.2 | 41.1 |
| Inputs | HiGCarb | Slag2PCC | Conc1-Min | Conc2-Min | MSWI-Min | Oliv-Min | ||
|---|---|---|---|---|---|---|---|---|
| Steel Slag | kg | 1 | 1 | |||||
| Concrete waste fine fraction | kg | 1 | 1 | |||||
| MSWI-Ash | kg | 1 | ||||||
| Olivine | kg | 1 | ||||||
| CO | kg | 0.12 | 0.038 | 0.065 | 0.22 | 0.10 | 0.45 | |
| Electricity | kWh | 0.040 | 0.028 | 0.011 | 0.008 | 0.018 | 0.21 | |
| water | kg | 50 | 9 | 0.035 | 5 | |||
| NHCl | kg | 0.48 | ||||||
| NaHCO | 0.21 | |||||||
| Outputs | ||||||||
| Min–Mix | kg | 1.12 | 0.54 | 0.92 | 1.11 | 1.10 | 1.45 | |
| CO | kg | 0.0032 | 0.11 | |||||
| CaCO | kg | 0.50 | 0.15 |
| Inputs | Concrete Crushing | Olivine Mining | ||
|---|---|---|---|---|
| Concrete waste | kg | 4.63 | ||
| Olivine (in ground) | kg | 1 | ||
| Electricity | kWh | 0.36 | 0.0017 | |
| Water | kg | 0.64 | ||
| Outputs | ||||
| Concrete waste fine fraction | kg | 1.00 | ||
| Gravel | kg | 2.48 | ||
| Sand | kg | 1.14 | ||
| Olivine | kg | 1 |

| Input | Point Source | DAC |
|---|---|---|
| electricity [MJ] | 0.356 | 2.52 |
| heat [MJ] | 2.86 | 11.9 |
| monoethanolamine [g] | 1.52 | 7.5 |
| steel [g] | 0.046 | |
| stainless steel [g] | 0.00142 | |
| aluminium [g] | 0.0041 | |
| polyurethane [g] | 0.00054 | |
| copper [g] | 0.00052 | |
| concrete [g] | 0.00036 |
| Energy Source | Energy 2021 [%] | Energy 2050 [%] |
|---|---|---|
| wind | 24.1 | 76.8 |
| lignite | 20.2 | |
| nuclear | 12.3 | |
| photovoltaic | 10.7 | 19.2 |
| natural gas | 10.4 | |
| hard coal | 9.4 | |
| biogas | 8.8 | |
| hydro | 4.0 | 4.0 |
| oil | 0.3 |


References
- IPCC. Climate Change 2022: Mitigation of Climate Change; IPCC: Geneva, Switzerland, 2022. [Google Scholar]
- Romanov, V.; Soong, Y.; Carney, C.; Rush, G.E.; Nielsen, B.; O’Connor, W. Mineralization of Carbon Dioxide: Literature Review. ChemBioEng Rev. 2015, 2, 231–256. [Google Scholar] [CrossRef]
- Renforth, P.; Washbourne, C.L.; Taylder, J.; Manning, D.A.C. Silicate production and availability for mineral carbonation. Environ. Sci. Technol. 2011, 45, 2035–2041. [Google Scholar] [CrossRef]
- Bobicki, E.R.; Liu, Q.; Xu, Z.; Zeng, H. Carbon capture and storage using alkaline industrial wastes. Prog. Energy Combust. Sci. 2012, 38, 302–320. [Google Scholar] [CrossRef]
- Chang, E.E.; Pan, S.Y.; Yang, L.; Chen, Y.H.; Kim, H.; Chiang, P.C. Accelerated carbonation using municipal solid waste incinerator bottom ash and cold-rolling wastewater: Performance evaluation and reaction kinetics. Waste Manag. 2015, 43, 283–292. [Google Scholar] [CrossRef]
- Destatis. Umwelt: Abfallentsorgung 2017. Available online: https://www.destatis.de/DE/Themen/Gesellschaft-Umwelt/Umwelt/Abfallwirtschaft/Publikationen/Downloads-Abfallwirtschaft/abfallentsorgung-2190100177004.pdf?__blob=publicationFile (accessed on 1 February 2023).
- Bundesverband Baustoffe—Steine und Erden e.V. Mineralische Bauabfälle Monitoring 2016; Bundesverband Baustoffe—Steine und Erden e.V.: Berlin, Germany, 2016. [Google Scholar]
- Merkel, T. Erzeugung und Nutzung von Eisenhüttenschlacken in Deutschland und Europa 2017. Rep. FEhS Inst. 2018, 25, 34–36. [Google Scholar]
- Alwast, H.; Riemann, A. Verbesserung der umweltrelevanten Qualitäten von Schlacken aus Abfallverbrennungsanlagen; Federal Environment Agency: Dessau-Roßlau, Germany, 2010. [Google Scholar]
- Ostovari, H.; Sternberg, A.; Bardow, A. Rock ‘n’ use of CO2: Carbon footprint of carbon capture and utilization by mineralization. Sustain. Energy Fuels 2020, 4, 4482–4496. [Google Scholar] [CrossRef]
- Pan, S.Y.; Chen, Y.H.; Chen, C.D.; Shen, A.L.; Lin, M.; Chiang, P.C. High-Gravity Carbonation Process for Enhancing CO2 Fixation and Utilization Exemplified by the Steelmaking Industry. Environ. Sci. Technol. 2015, 49, 12380–12387. [Google Scholar] [CrossRef]
- Mattila, H.P.; Hudd, H.; Zevenhoven, R. Cradle-to-gate life cycle assessment of precipitated calcium carbonate production from steel converter slag. J. Clean. Prod. 2014, 84, 611–618. [Google Scholar] [CrossRef]
- Di Maria, A.; Snellings, R.; Alaerts, L.; Quaghebeur, M.; van Acker, K. Environmental assessment of CO2 mineralisation for sustainable construction materials. Int. J. Greenh. Gas Control 2020, 93, 102882. [Google Scholar] [CrossRef]
- Nduagu, E.; Bergerson, J.; Zevenhoven, R. Life cycle assessment of CO2 sequestration in magnesium silicate rock—A comparative study. Energy Convers. Manag. 2012, 55, 116–126. [Google Scholar] [CrossRef]
- Xuan, D.; Zhan, B.; Poon, C.S.; Zheng, W. Carbon dioxide sequestration of concrete slurry waste and its valorisation in construction products. Constr. Build. Mater. 2016, 113, 664–672. [Google Scholar] [CrossRef]
- DIN EN ISO 14040; Environmental Management—Life Cycle Assessment—Principles and Framework. DIN: Berlin, Germany, 2009.
- DIN EN ISO 14044; Environmental Management—Life Cycle Assessment—Requirements and Guidelines. DIN: Berlin, Germany, 2018.
- Hoppe, W.; Thonemann, N.; Bringezu, S. Life Cycle Assessment of Carbon Dioxide-Based Production of Methane and Methanol and Derived Polymers. J. Ind. Ecol. 2018, 22, 327–340. [Google Scholar] [CrossRef]
- UNEP. Global Guidance for Life Cycle Impact Assessment Indicators: Volume 1. 2016. Available online: https://www.lifecycleinitiative.org/training-resources/global-guidance-lcia-indicators-v-1/ (accessed on 1 February 2023).
- Mostert, C.; Bringezu, S. Measuring Product Material Footprint as New Life Cycle Impact Assessment Method: Indicators and Abiotic Characterization Factors. Resources 2019, 8, 61. [Google Scholar] [CrossRef]
- Schmid, C.; Hahn, A. Potential CO2 utilisation in Germany: An analysis of theoretical CO2 demand by 2030. J. CO2 Util. 2021, 50, 101580. [Google Scholar] [CrossRef]
- UBA. Wege in Eine Ressourcenschonende Treibhausgasneutralität; Umweltbundesamt: Dessau-Roßlau, Germany, 2019. [Google Scholar]
- Müller, L.J.; Kätelhön, A.; Bachmann, M.; Zimmermann, A.; Sternberg, A.; Bardow, A. A Guideline for Life Cycle Assessment of Carbon Capture and Utilization. Front. Energy Res. 2020, 8, 15. [Google Scholar] [CrossRef]
- Said, A.; Laukkanen, T.; Järvinen, M. Pilot-scale experimental work on carbon dioxide sequestration using steelmaking slag. Appl. Energy 2016, 177, 602–611. [Google Scholar] [CrossRef]
- Pasquier, L.C.; Kemache, N.; Mocellin, J.; Blais, J.F.; Mercier, G. Waste Concrete Valorization; Aggregates and Mineral Carbonation Feedstock Production. Geosciences 2018, 8, 342. [Google Scholar] [CrossRef]
- Katsuyama, Y.; Yamasaki, A.; Iizuka, A.; Fujii, M.; Kumagai, K.; Yanagisawa, Y. Development of a process for producing high-purity calcium carbonate (CaCO3) from waste cement using pressurized CO2. Environ. Prog. 2005, 24, 162–170. [Google Scholar] [CrossRef]
- Eikeland, E.; Blichfeld, A.B.; Tyrsted, C.; Jensen, A.; Iversen, B.B. Optimized carbonation of magnesium silicate mineral for CO2 storage. ACS Appl. Mater. Interfaces 2015, 7, 5258–5264. [Google Scholar] [CrossRef]
- Kremer, D.; Etzold, S.; Boldt, J.; Blaum, P.; Hahn, K.M.; Wotruba, H.; Telle, R. Geological Mapping and Characterization of Possible Primary Input Materials for the Mineral Sequestration of Carbon Dioxide in Europe. Minerals 2019, 9, 485. [Google Scholar] [CrossRef]
- Hangx, S.J.; Spiers, C.J. Coastal spreading of olivine to control atmospheric CO2 concentrations: A critical analysis of viability. Int. J. Greenh. Gas Control 2009, 3, 757–767. [Google Scholar] [CrossRef]
- Fraunhofer ISE. Öffentliche Nettostromerzeugung in Deutschland 2021. 2022. Available online: https://www.energy-charts.info/charts/energy_pie/chart.htm?l=de&c=DE&year=2021&interval=year (accessed on 10 May 2023).
- Bundesamt für Energie. News aus der Wärmepumpen-Forschung; Bundesamt für Energie: Berlin, Germany, 2017. [Google Scholar]
- Chauvy, R.; Verdonck, D.; Dubois, L.; Thomas, D.; de Weireld, G. Techno-economic feasibility and sustainability of an integrated carbon capture and conversion process to synthetic natural gas. J. CO2 Util. 2021, 47, 101488. [Google Scholar] [CrossRef]
- Skocek, J.; Zajac, M.; Ben Haha, M. Carbon Capture and Utilization by mineralization of cement pastes derived from recycled concrete. Sci. Rep. 2020, 10, 5614. [Google Scholar] [CrossRef]
- Cembureau. Cementing the European Green Deal: Reaching Climate Neutrality along the Cement and Concrete Value Chain by 2050; Cembureau: Bruxelles, Brussels, 2020. [Google Scholar]
- Ian, T. Carbon dioxide emissions in Germany 1990–2021. 2023. Available online: https://www.statista.com/statistics/449701/co2-emissions-germany/ (accessed on 10 May 2023).
- Deutsche Emissionshandelsstelle (DEHSt) im Umweltbundesamt. Treibhausgasemissionen 2021: Emissionshandelspflichtige stationäRe Anlagen und Luftverkehr in Deutschland (VET-Bericht 2021); Deutsche Emissionshandelsstelle (DEHSt) im Umweltbundesamt: Berlin, Germany, 2022.
- Statista. Deutsche Zementindustrie—Produktion bis 2021; Statista: Hamburg, Germany, 2022. [Google Scholar]
- Ben Ghacham, A.; Cecchi, E.; Pasquier, L.C.; Blais, J.F.; Mercier, G. CO2 sequestration using waste concrete and anorthosite tailings by direct mineral carbonation in gas-solid-liquid and gas-solid routes. J. Environ. Manag. 2015, 163, 70–77. [Google Scholar] [CrossRef]
- Zhang, N.; Chai, Y.E.; Santos, R.M.; Šiller, L. Advances in process development of aqueous CO2 mineralisation towards scalability. J. Environ. Chem. Eng. 2020, 8, 104453. [Google Scholar] [CrossRef]
- Sanna, A.; Dri, M.; Hall, M.R.; Maroto-Valer, M. Waste materials for carbon capture and storage by mineralisation (CCSM)—A UK perspective. Appl. Energy 2012, 99, 545–554. [Google Scholar] [CrossRef]
- Thienel. Schlacken und Hüttensand. 2017. Available online: https://www.unibw.de/werkstoffe-en/teaching/master-program/schlacken-und-huttensand.pdf (accessed on 10 May 2023).
- Statistisches Bundesamt. Erhebung über die Abfallerzeugung—Ergebnisbericht; Statistisches Bundesamt: Wiesbaden, Germany, 2014.
- Landesanstalt für Umwelt Baden-Württemberg. Abfallsteckbrief “0303 Papierherstellung”; Landesanstalt für Umwelt Baden-Württemberg: Karlsruhe, Germany, 2023. [Google Scholar]
- Fraunhofer ISI. Langfristszenarien für die Transformation des Energiesystems in Deutschland; Fraunhofer ISI: Karlsruhe, Germany, 2017. [Google Scholar]
- Sietz, M. (Ed.) Okobilanzierung in der Betrieblichen Praxis; Blottner: Taunusstein, Germany, 1997. [Google Scholar]
- Umweltbundesamt. Aluminium Factsheet; Umweltbundesamt: Dessau-Roβlau, Germany, 2019.
- World Aluminium. Bauxite Residue Management: Best Practice; World Aluminium: London, UK, 2015. [Google Scholar]
- Umweltbundesamt. Kraftwerksnebenprodukte—Steinkohleflugaschen und REA-Gips; Umweltbundesamt: Dessau-Roβlau, Germany, 2023.
- Kurzweil. Braunkohleflugasche—Ein Möglicher neuer Einsatzstoff für Bautechnische Zwecke; Kurzweil: Wellesley Hills, MA, USA, 1996. [Google Scholar]
- Wirtschaftsverband Mineralische Nebenprodukte e.V. Flugasche bleibt wichtiger Zusatzstoff für hochwertigen Beton. Available online: https://www.win-ev.org/verband/news/details/flugasche-bleibt-wichtiger-zusatzstoff-fuer-hochwertigen-beton/index.html (accessed on 10 May 2023).
- Vassilev, S.V.; Vassileva, C.G.; Song, Y.C.; Li, W.Y.; Feng, J. Ash contents and ash-forming elements of biomass and their significance for solid biofuel combustion. Fuel 2017, 208, 377–409. [Google Scholar] [CrossRef]
- Energie-Experten. Holzheiz- und Holzkraftwerke in Deutschland; Energie-Experten: Bremen, Germany, 2022. [Google Scholar]
- Bond, F. Crushing and Grinding Calculations. Br. Chem. Eng 1961, 6, 378–385, 543–548. Available online: https://www.911metallurgist.com/blog/wp-content/uploads/2015/11/Bond-F-C-1961-Crushing-and-Grinding-Calculations.pdf (accessed on 10 May 2023).
- Deutz, S.; Bardow, A. Life-cycle assessment of an industrial direct air capture process based on temperature–vacuum swing adsorption. Nat. Energy 2021, 6, 203–213. [Google Scholar] [CrossRef]


| Feedstock Material | Waste Generation DE [Mt a] | [Mt CO a] | Utilization Rate [%] |
|---|---|---|---|
| waste concrete | 24.6 [6] | 3.1–5.5 | 94 [7] |
| steel slag | 5.4 [8] | 1.1–3.3 | 92 [8] |
| MSWI ash | 5.2 [9] | 0.8–1.0 | 94 [9] |
| Product | GWI [kg CO eq. kg] | RMI [kg kg] |
|---|---|---|
| CaCO | 1.45 | 1.62 |
| Cement | 0.86 | 1.73 |
| Sand | 0.005 | 0.95 |
Disclaimer/Publisher’s Note: The statements, opinions and data contained in all publications are solely those of the individual author(s) and contributor(s) and not of MDPI and/or the editor(s). MDPI and/or the editor(s) disclaim responsibility for any injury to people or property resulting from any ideas, methods, instructions or products referred to in the content. |
© 2023 by the authors. Licensee MDPI, Basel, Switzerland. This article is an open access article distributed under the terms and conditions of the Creative Commons Attribution (CC BY) license (https://creativecommons.org/licenses/by/4.0/).
Share and Cite
Digulla, F.-E.; Bringezu, S. Comparative Life Cycle Assessment of Carbon Dioxide Mineralization Using Industrial Waste as Feedstock to Produce Cement Substitutes. Energies 2023, 16, 4118. https://doi.org/10.3390/en16104118
Digulla F-E, Bringezu S. Comparative Life Cycle Assessment of Carbon Dioxide Mineralization Using Industrial Waste as Feedstock to Produce Cement Substitutes. Energies. 2023; 16(10):4118. https://doi.org/10.3390/en16104118
Chicago/Turabian StyleDigulla, Finn-Erik, and Stefan Bringezu. 2023. "Comparative Life Cycle Assessment of Carbon Dioxide Mineralization Using Industrial Waste as Feedstock to Produce Cement Substitutes" Energies 16, no. 10: 4118. https://doi.org/10.3390/en16104118
APA StyleDigulla, F.-E., & Bringezu, S. (2023). Comparative Life Cycle Assessment of Carbon Dioxide Mineralization Using Industrial Waste as Feedstock to Produce Cement Substitutes. Energies, 16(10), 4118. https://doi.org/10.3390/en16104118