
Annual Thermal Management of the Photovoltaic Module to Enhance Electrical Power and Efficiency Using Heat Batteries

 ,
,  , ,
, ,  ,
,  , , , ,
Abstract
1. Introduction
2. Materials and Methods
2.1. Materials
2.2. Experimental Setup
3. Results
3.1. PV Module Thermal Profile Using PCMs
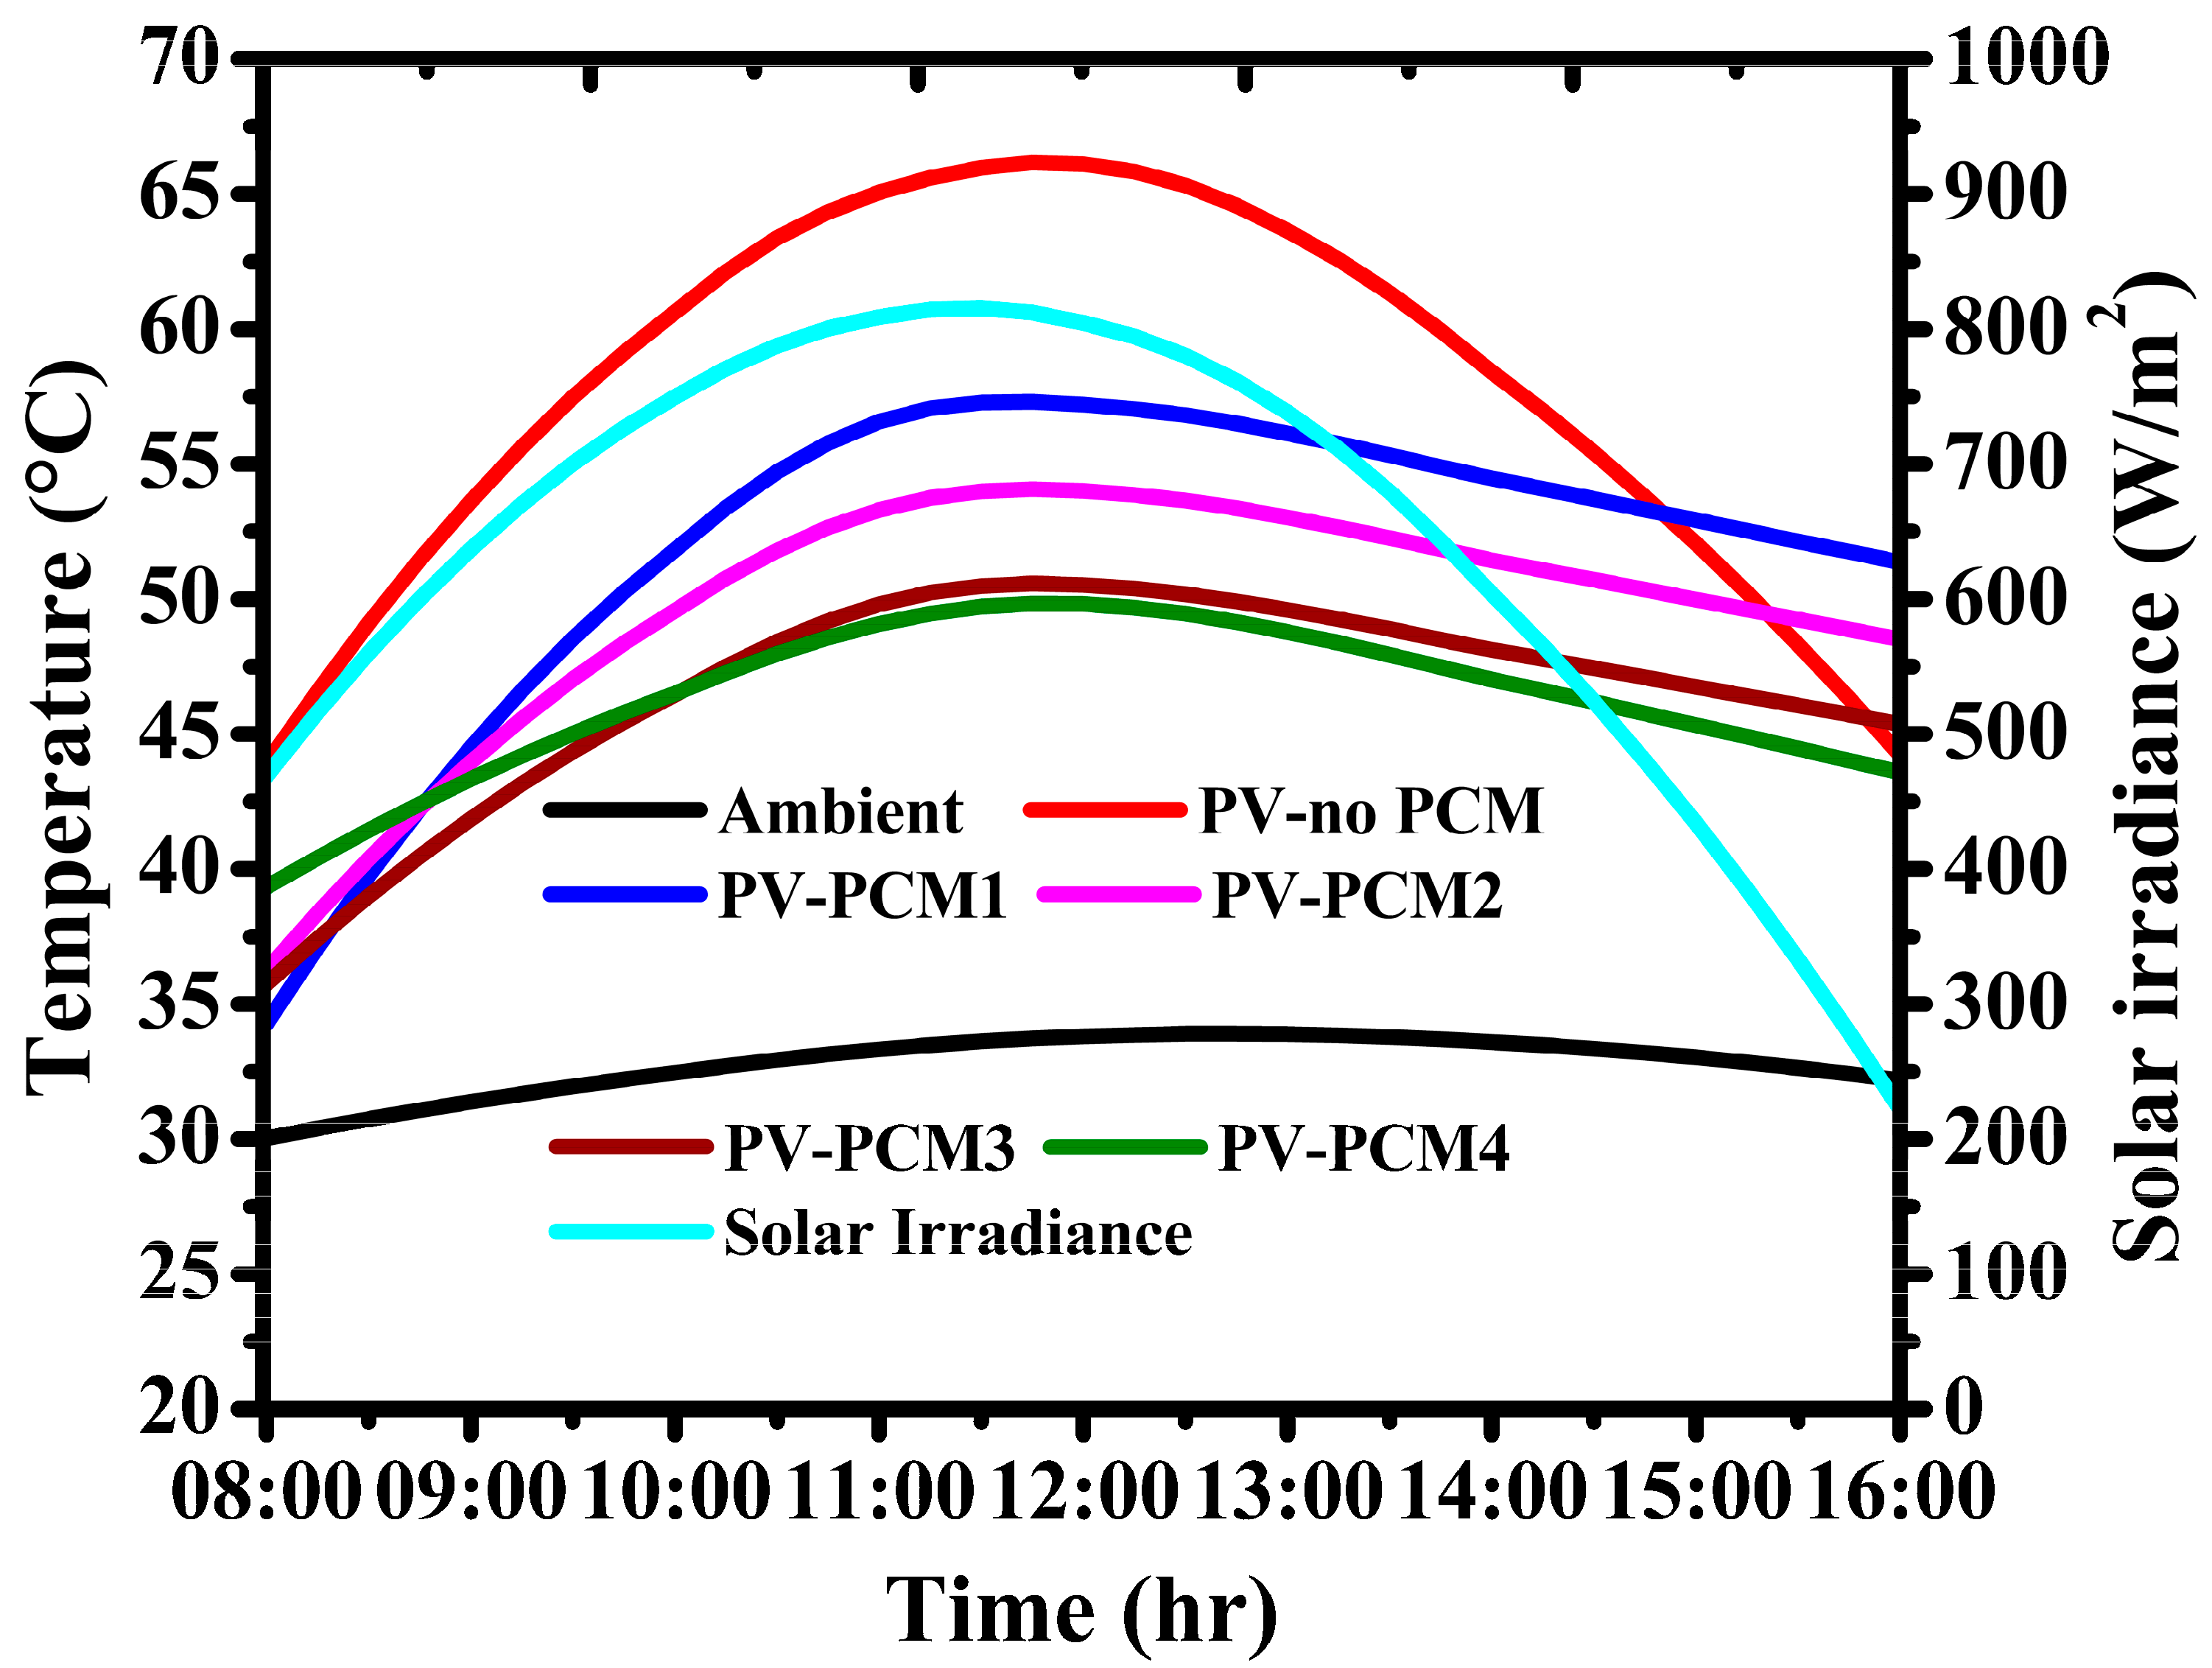
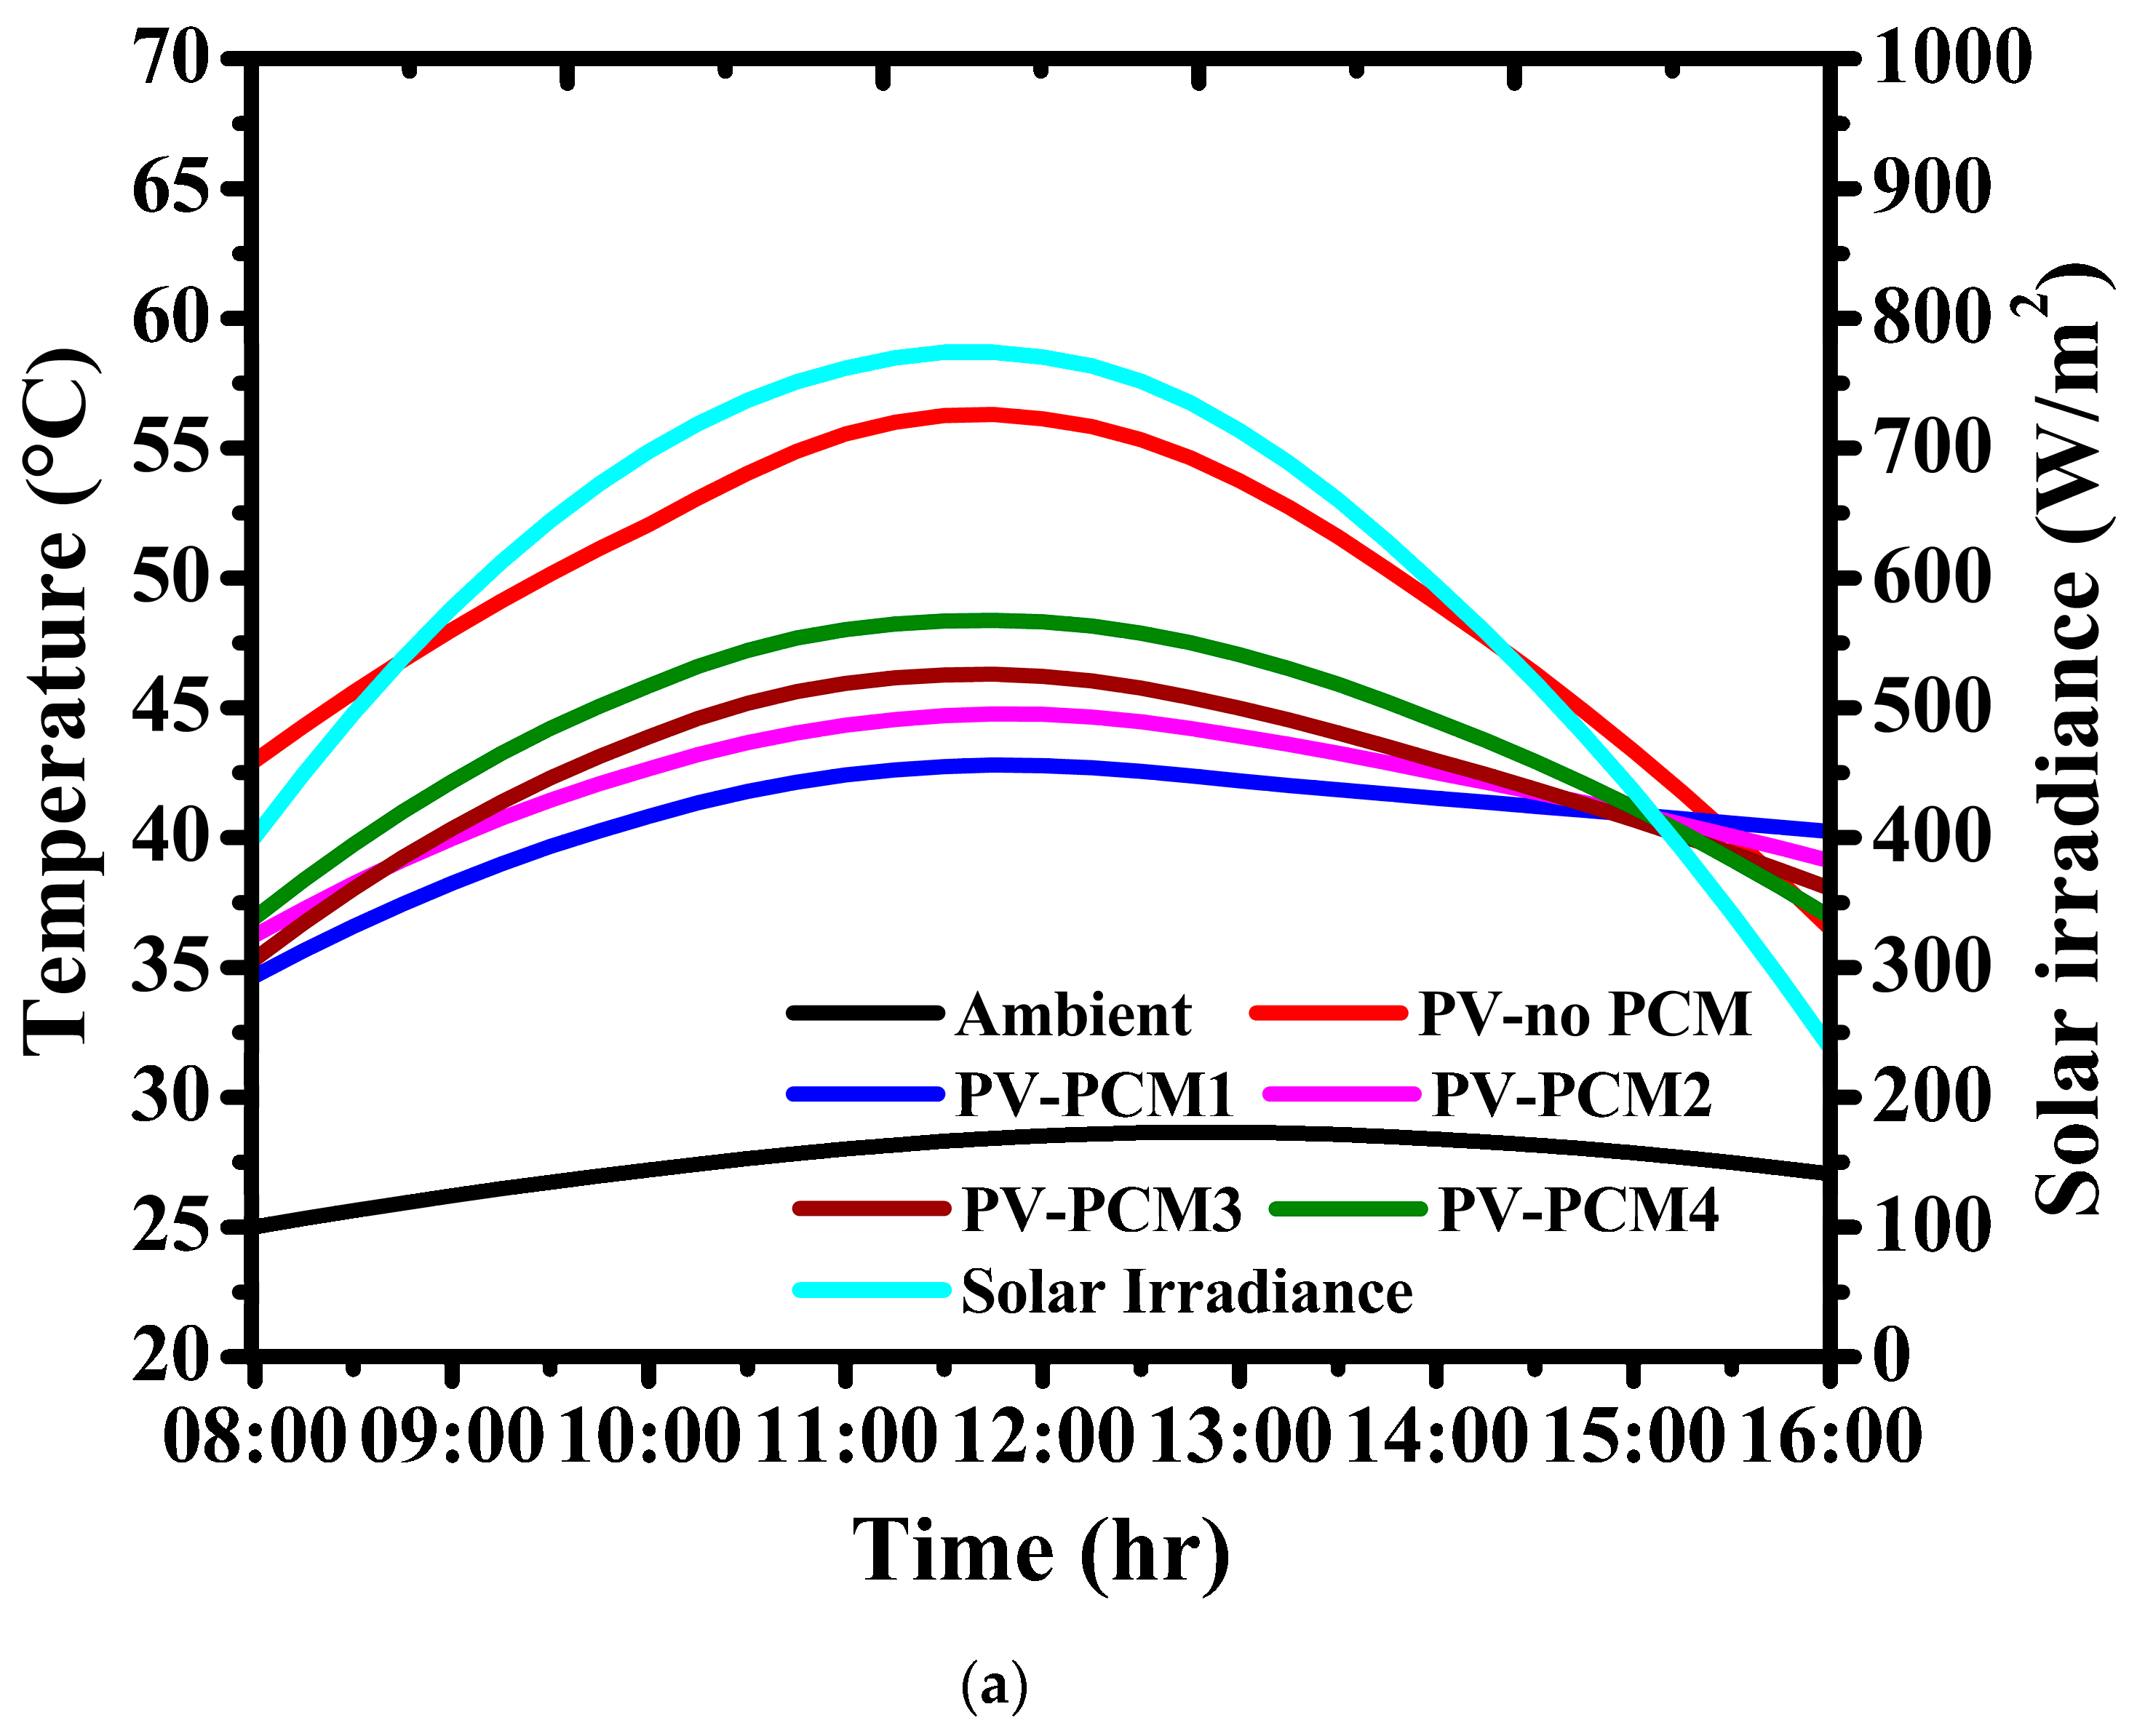
3.1.1. Pre-Summer
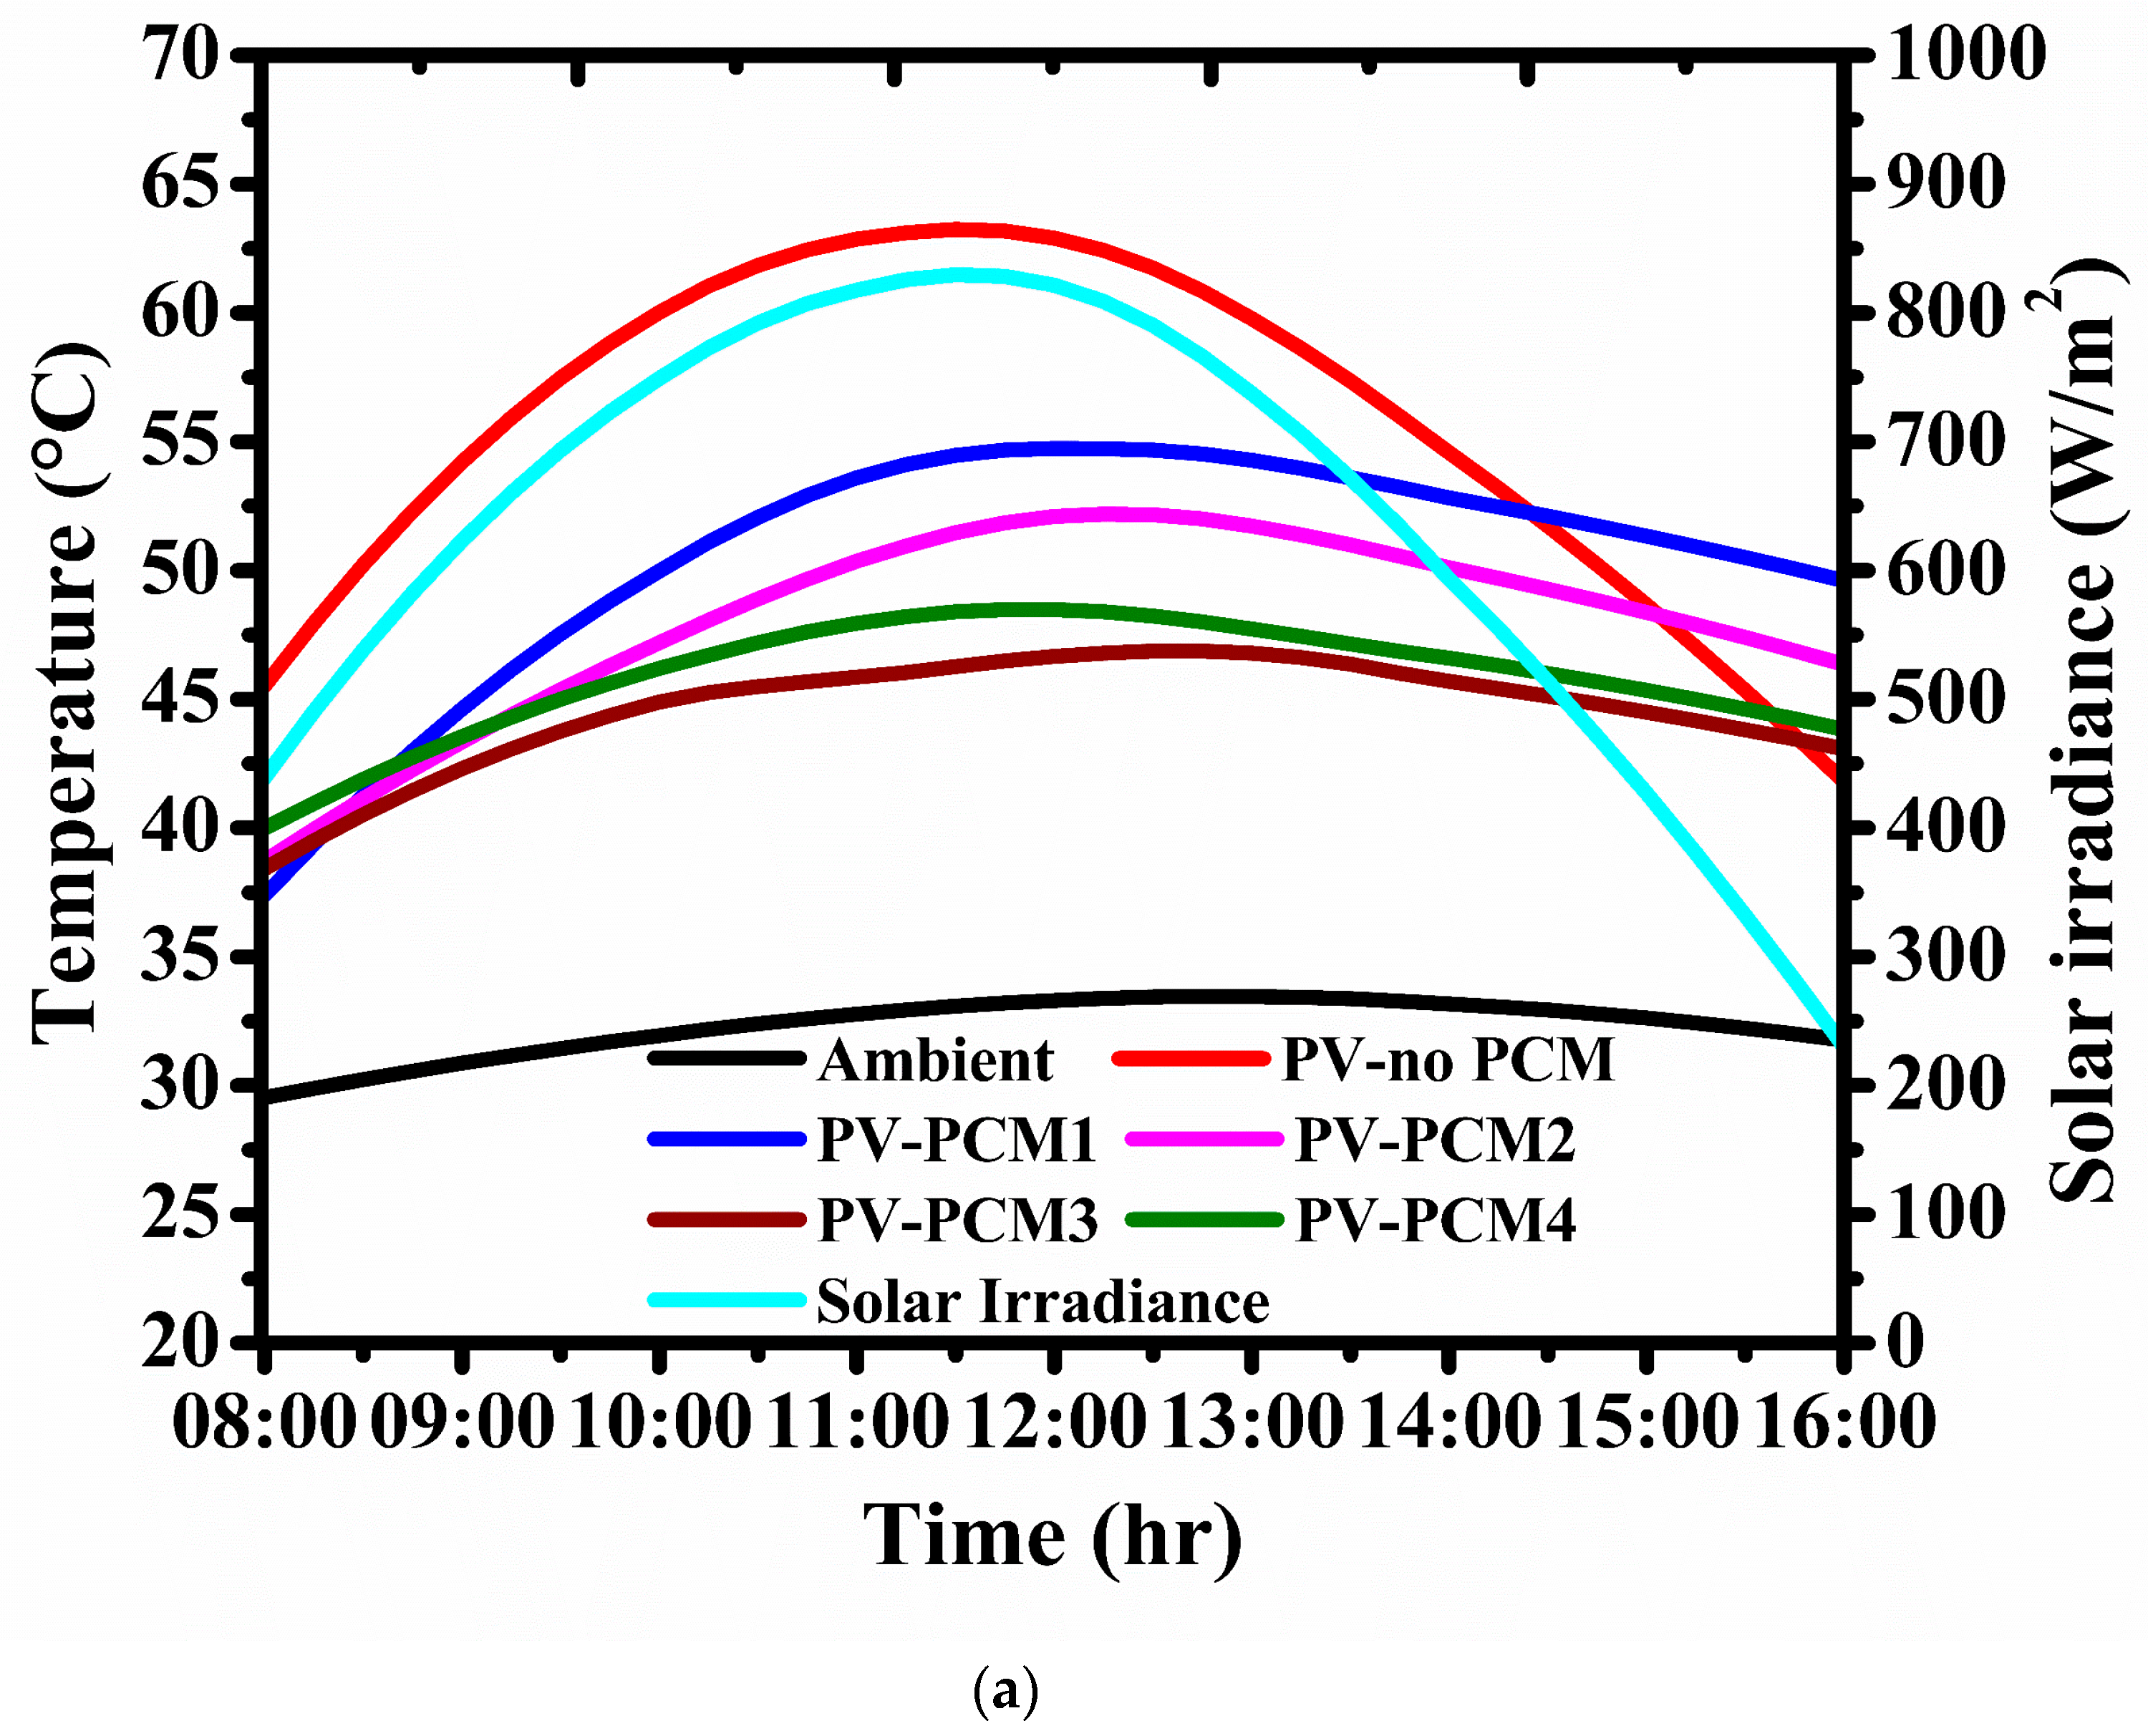
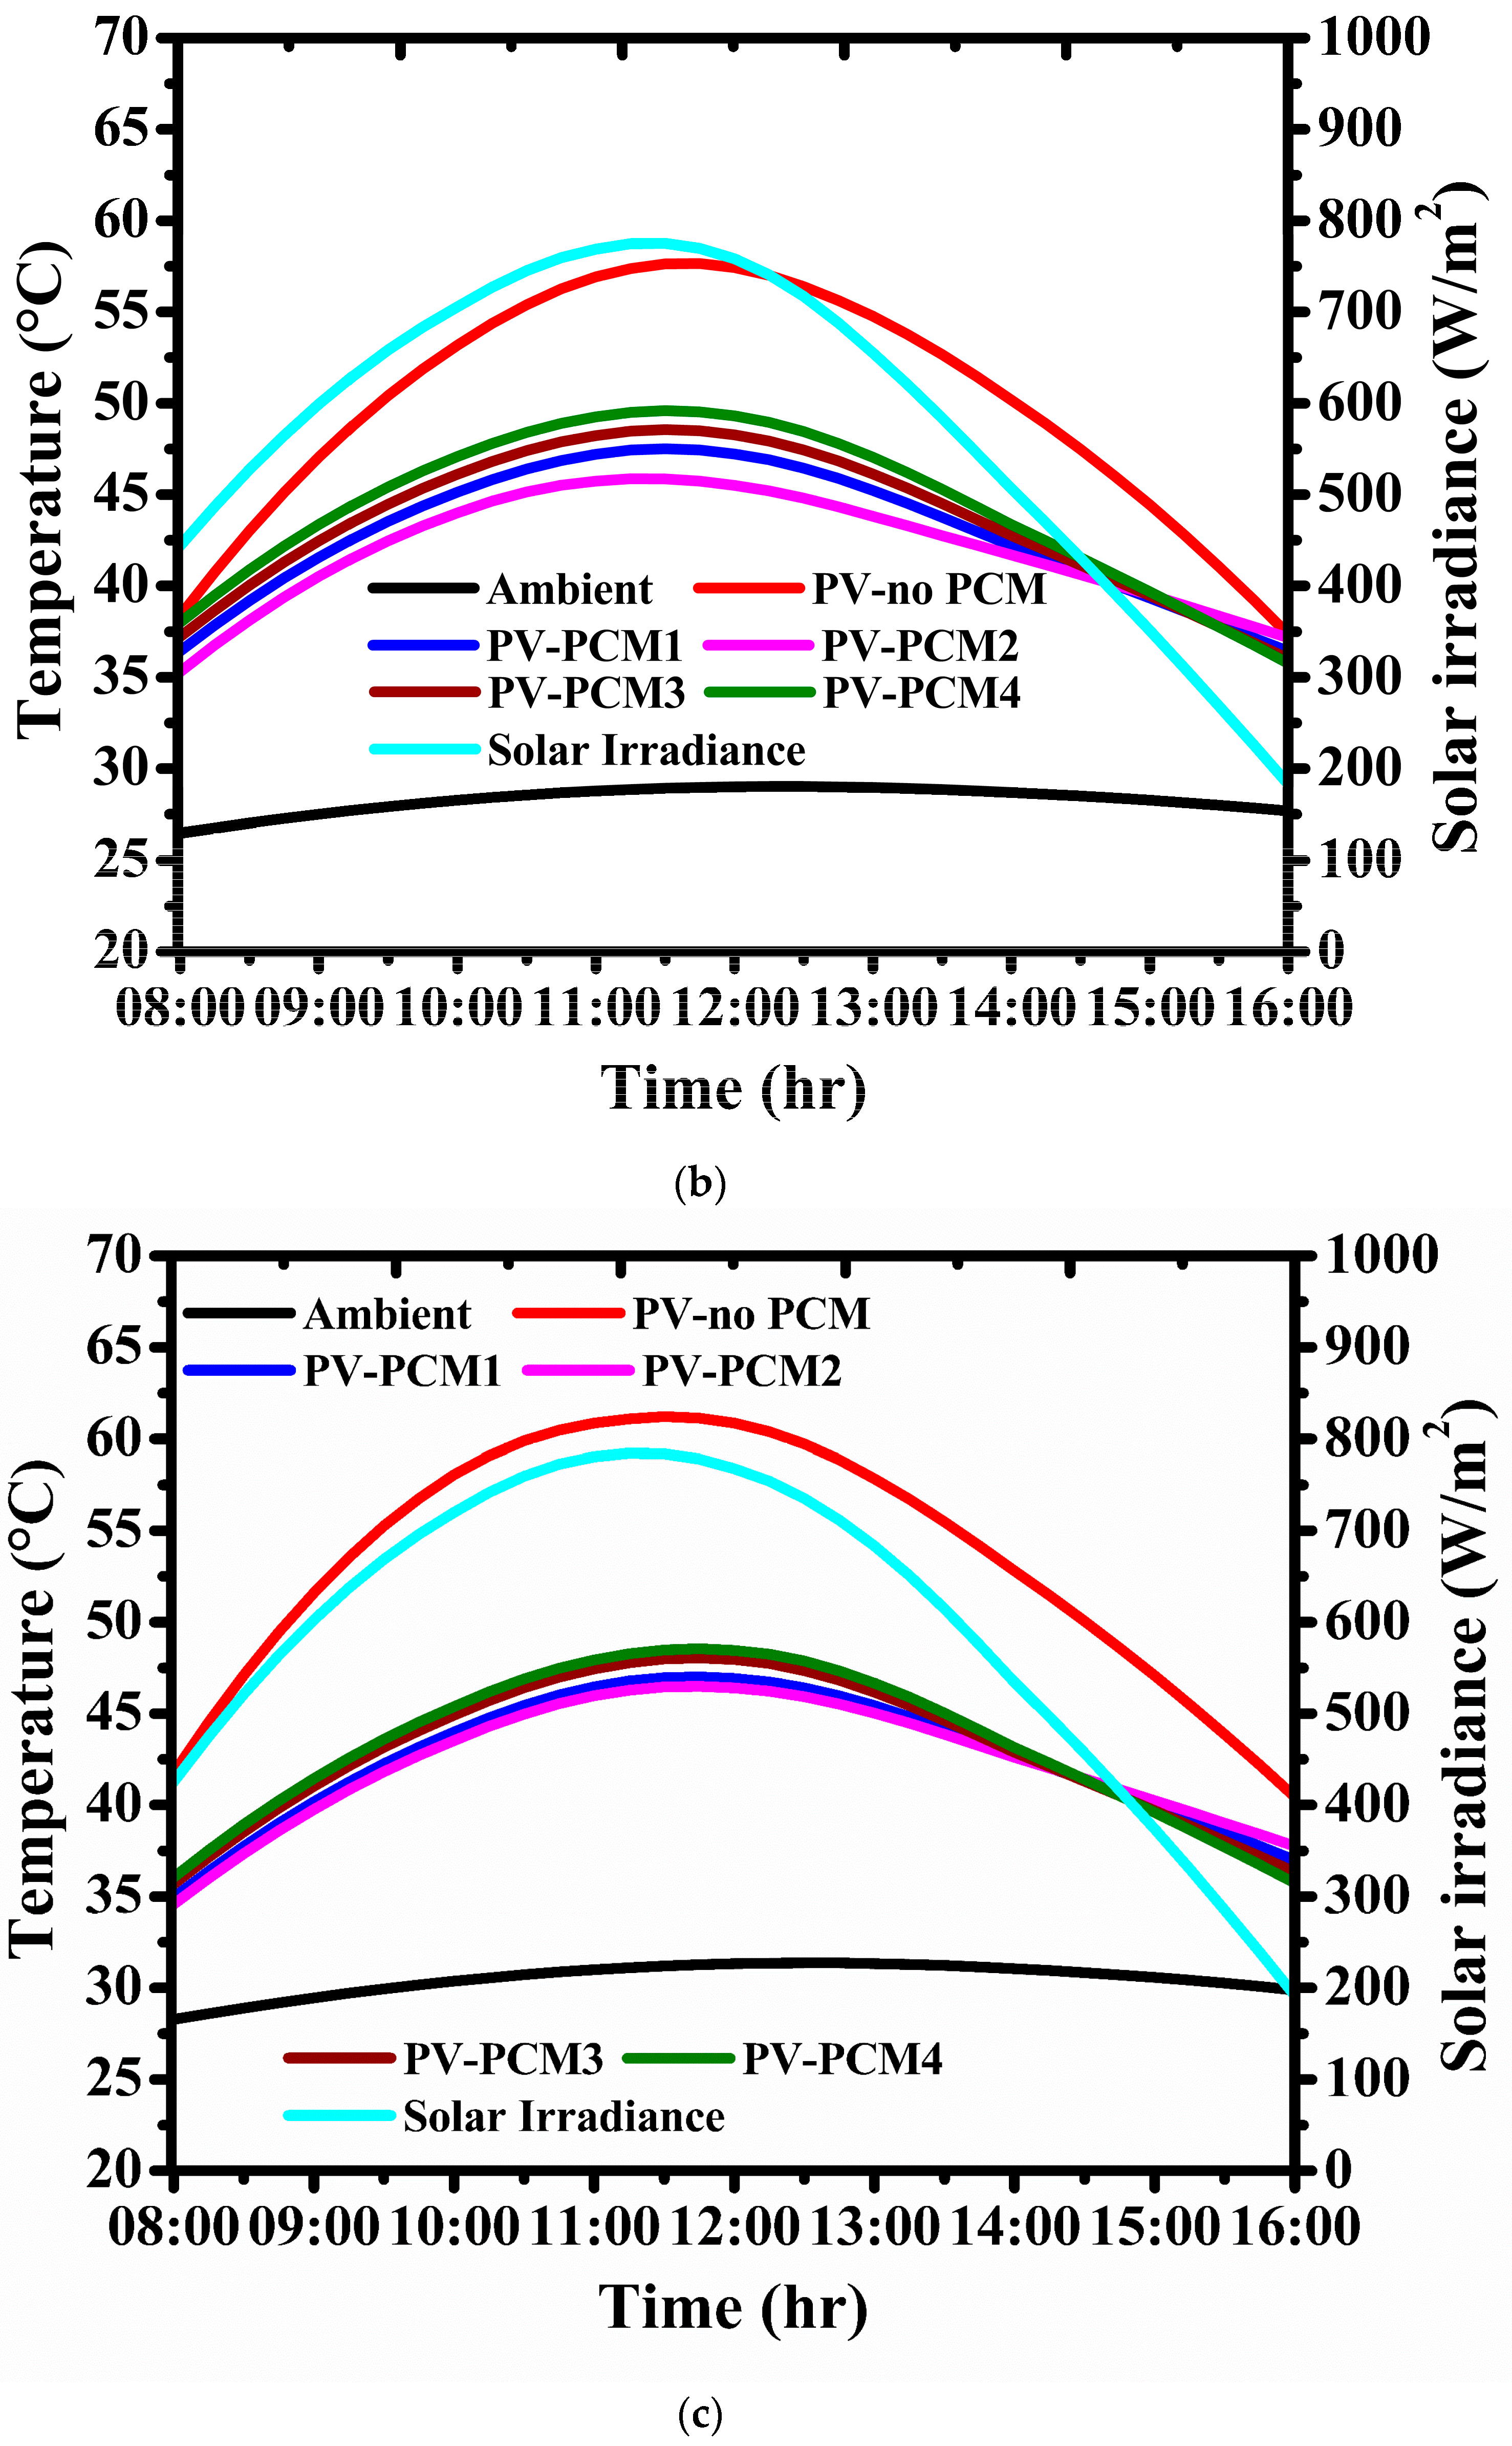
3.1.2. Summer
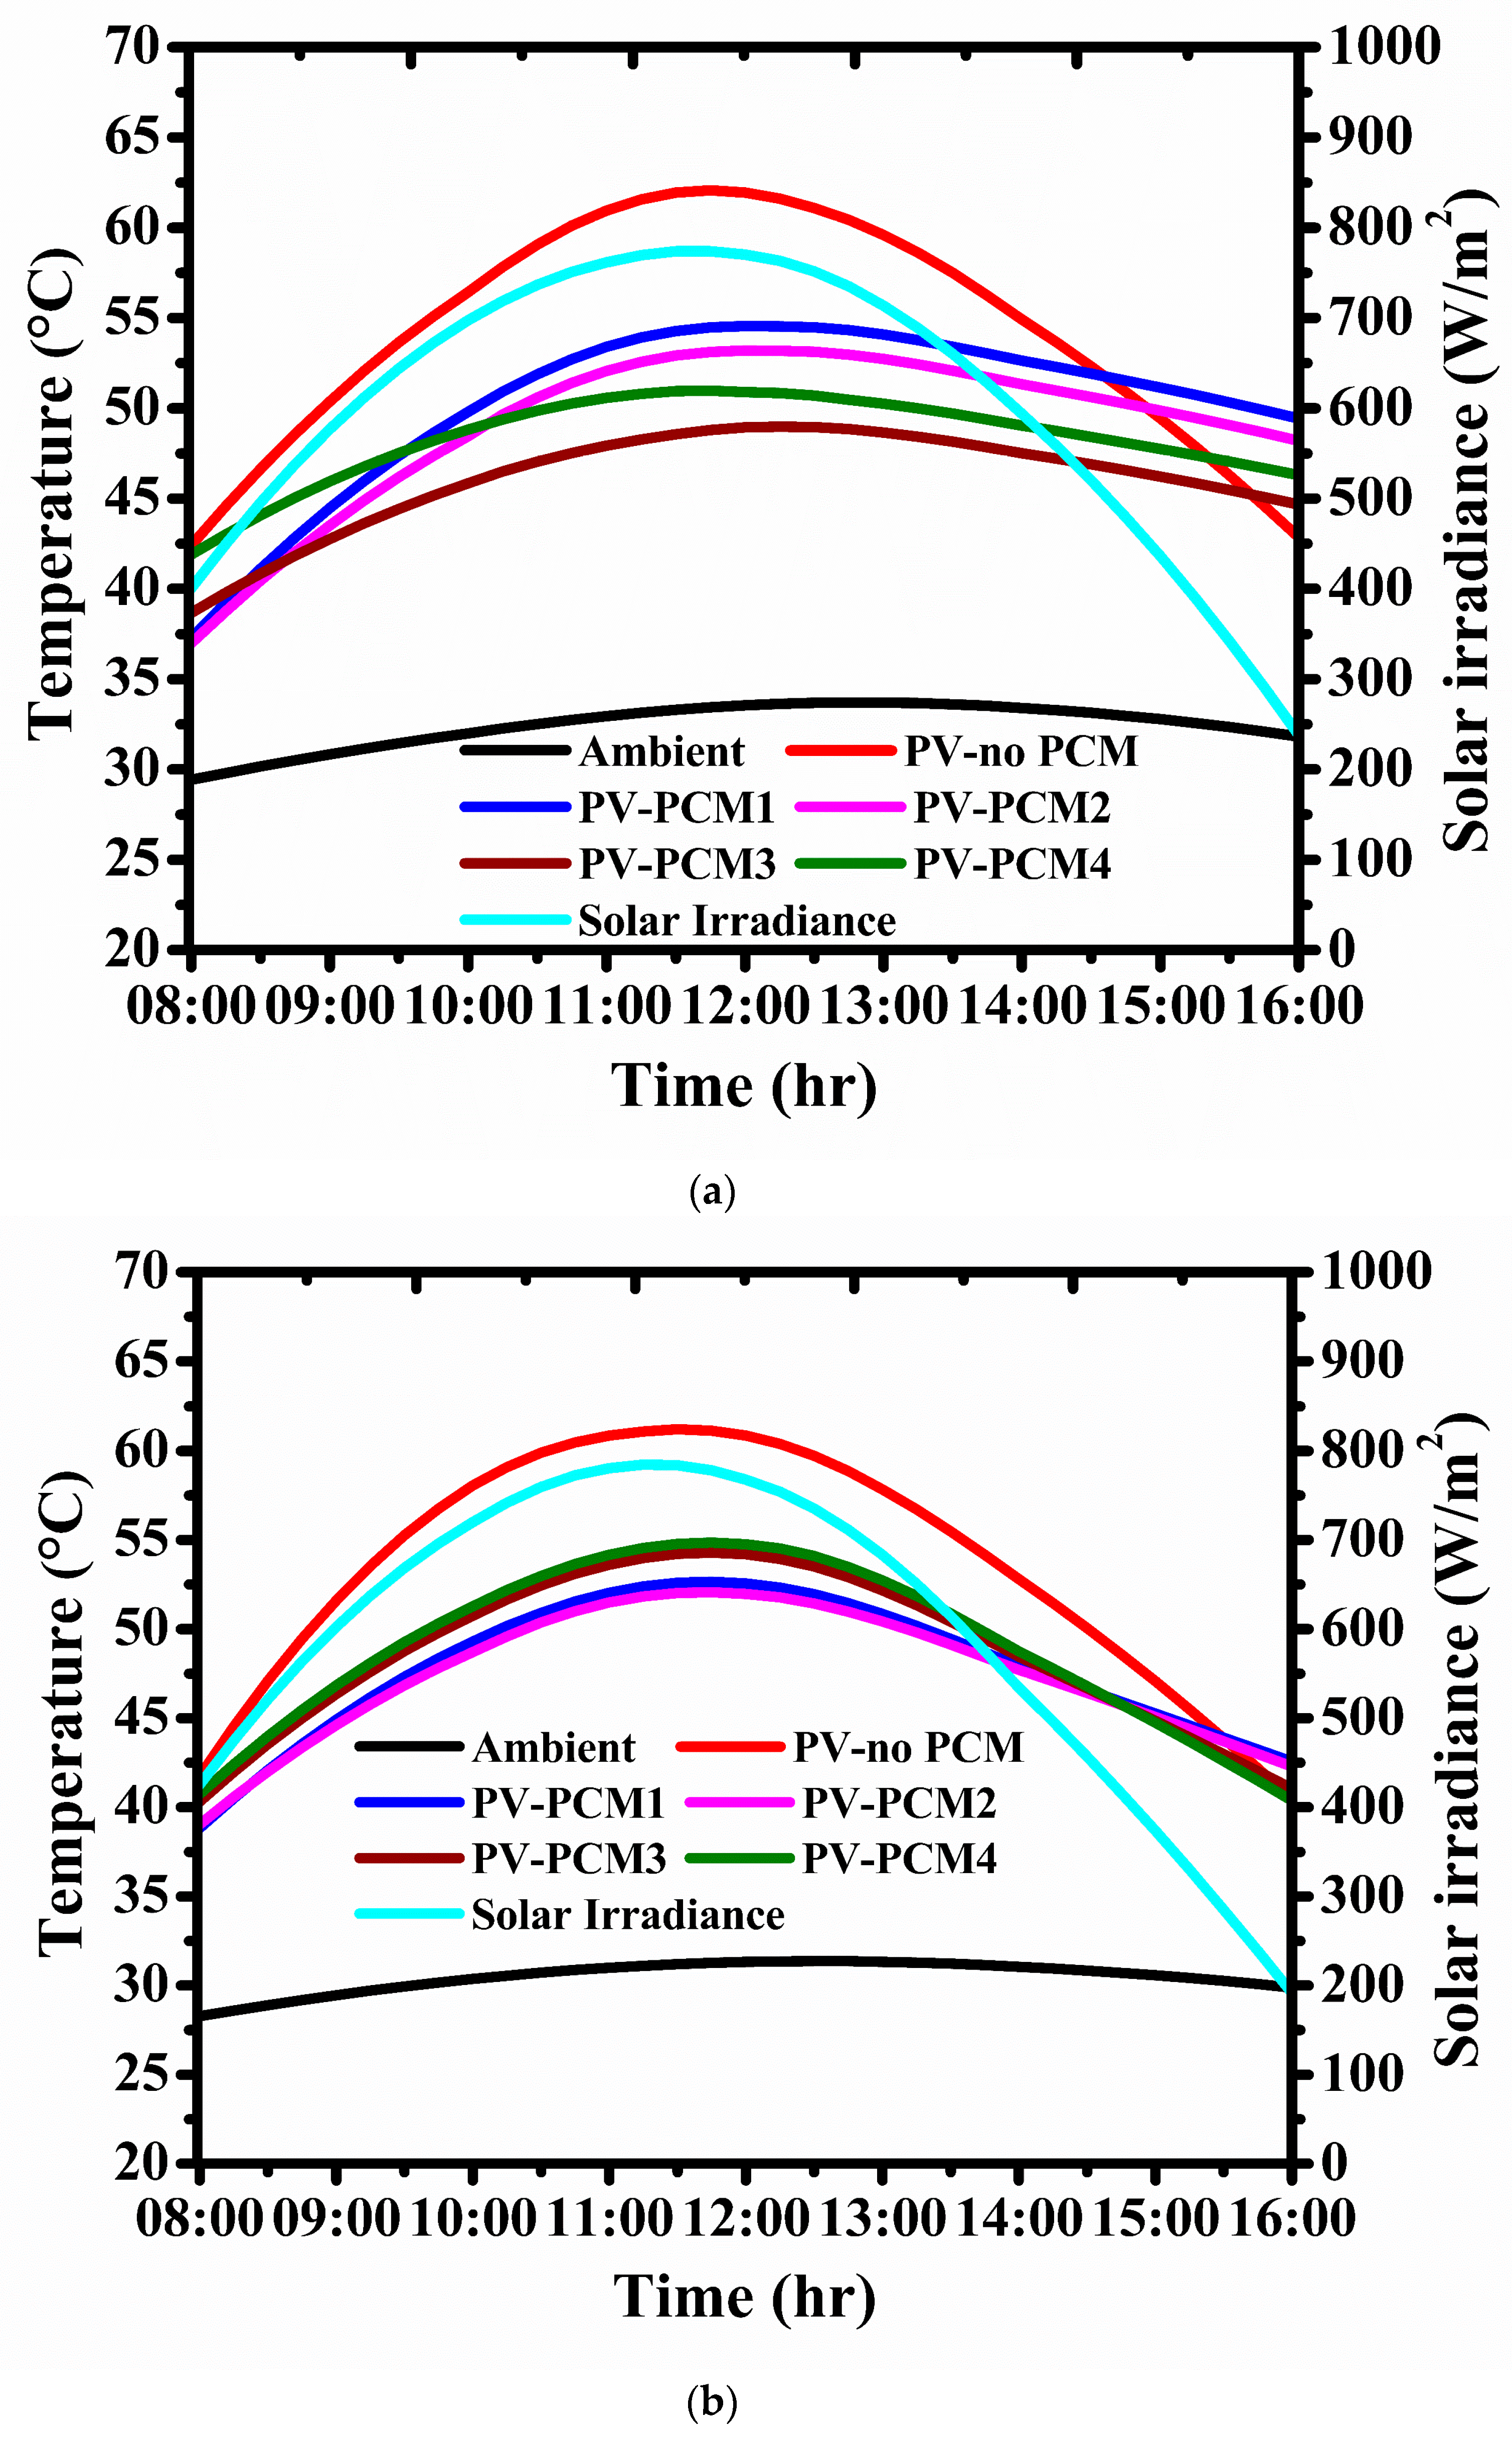
3.1.3. Post-Summer
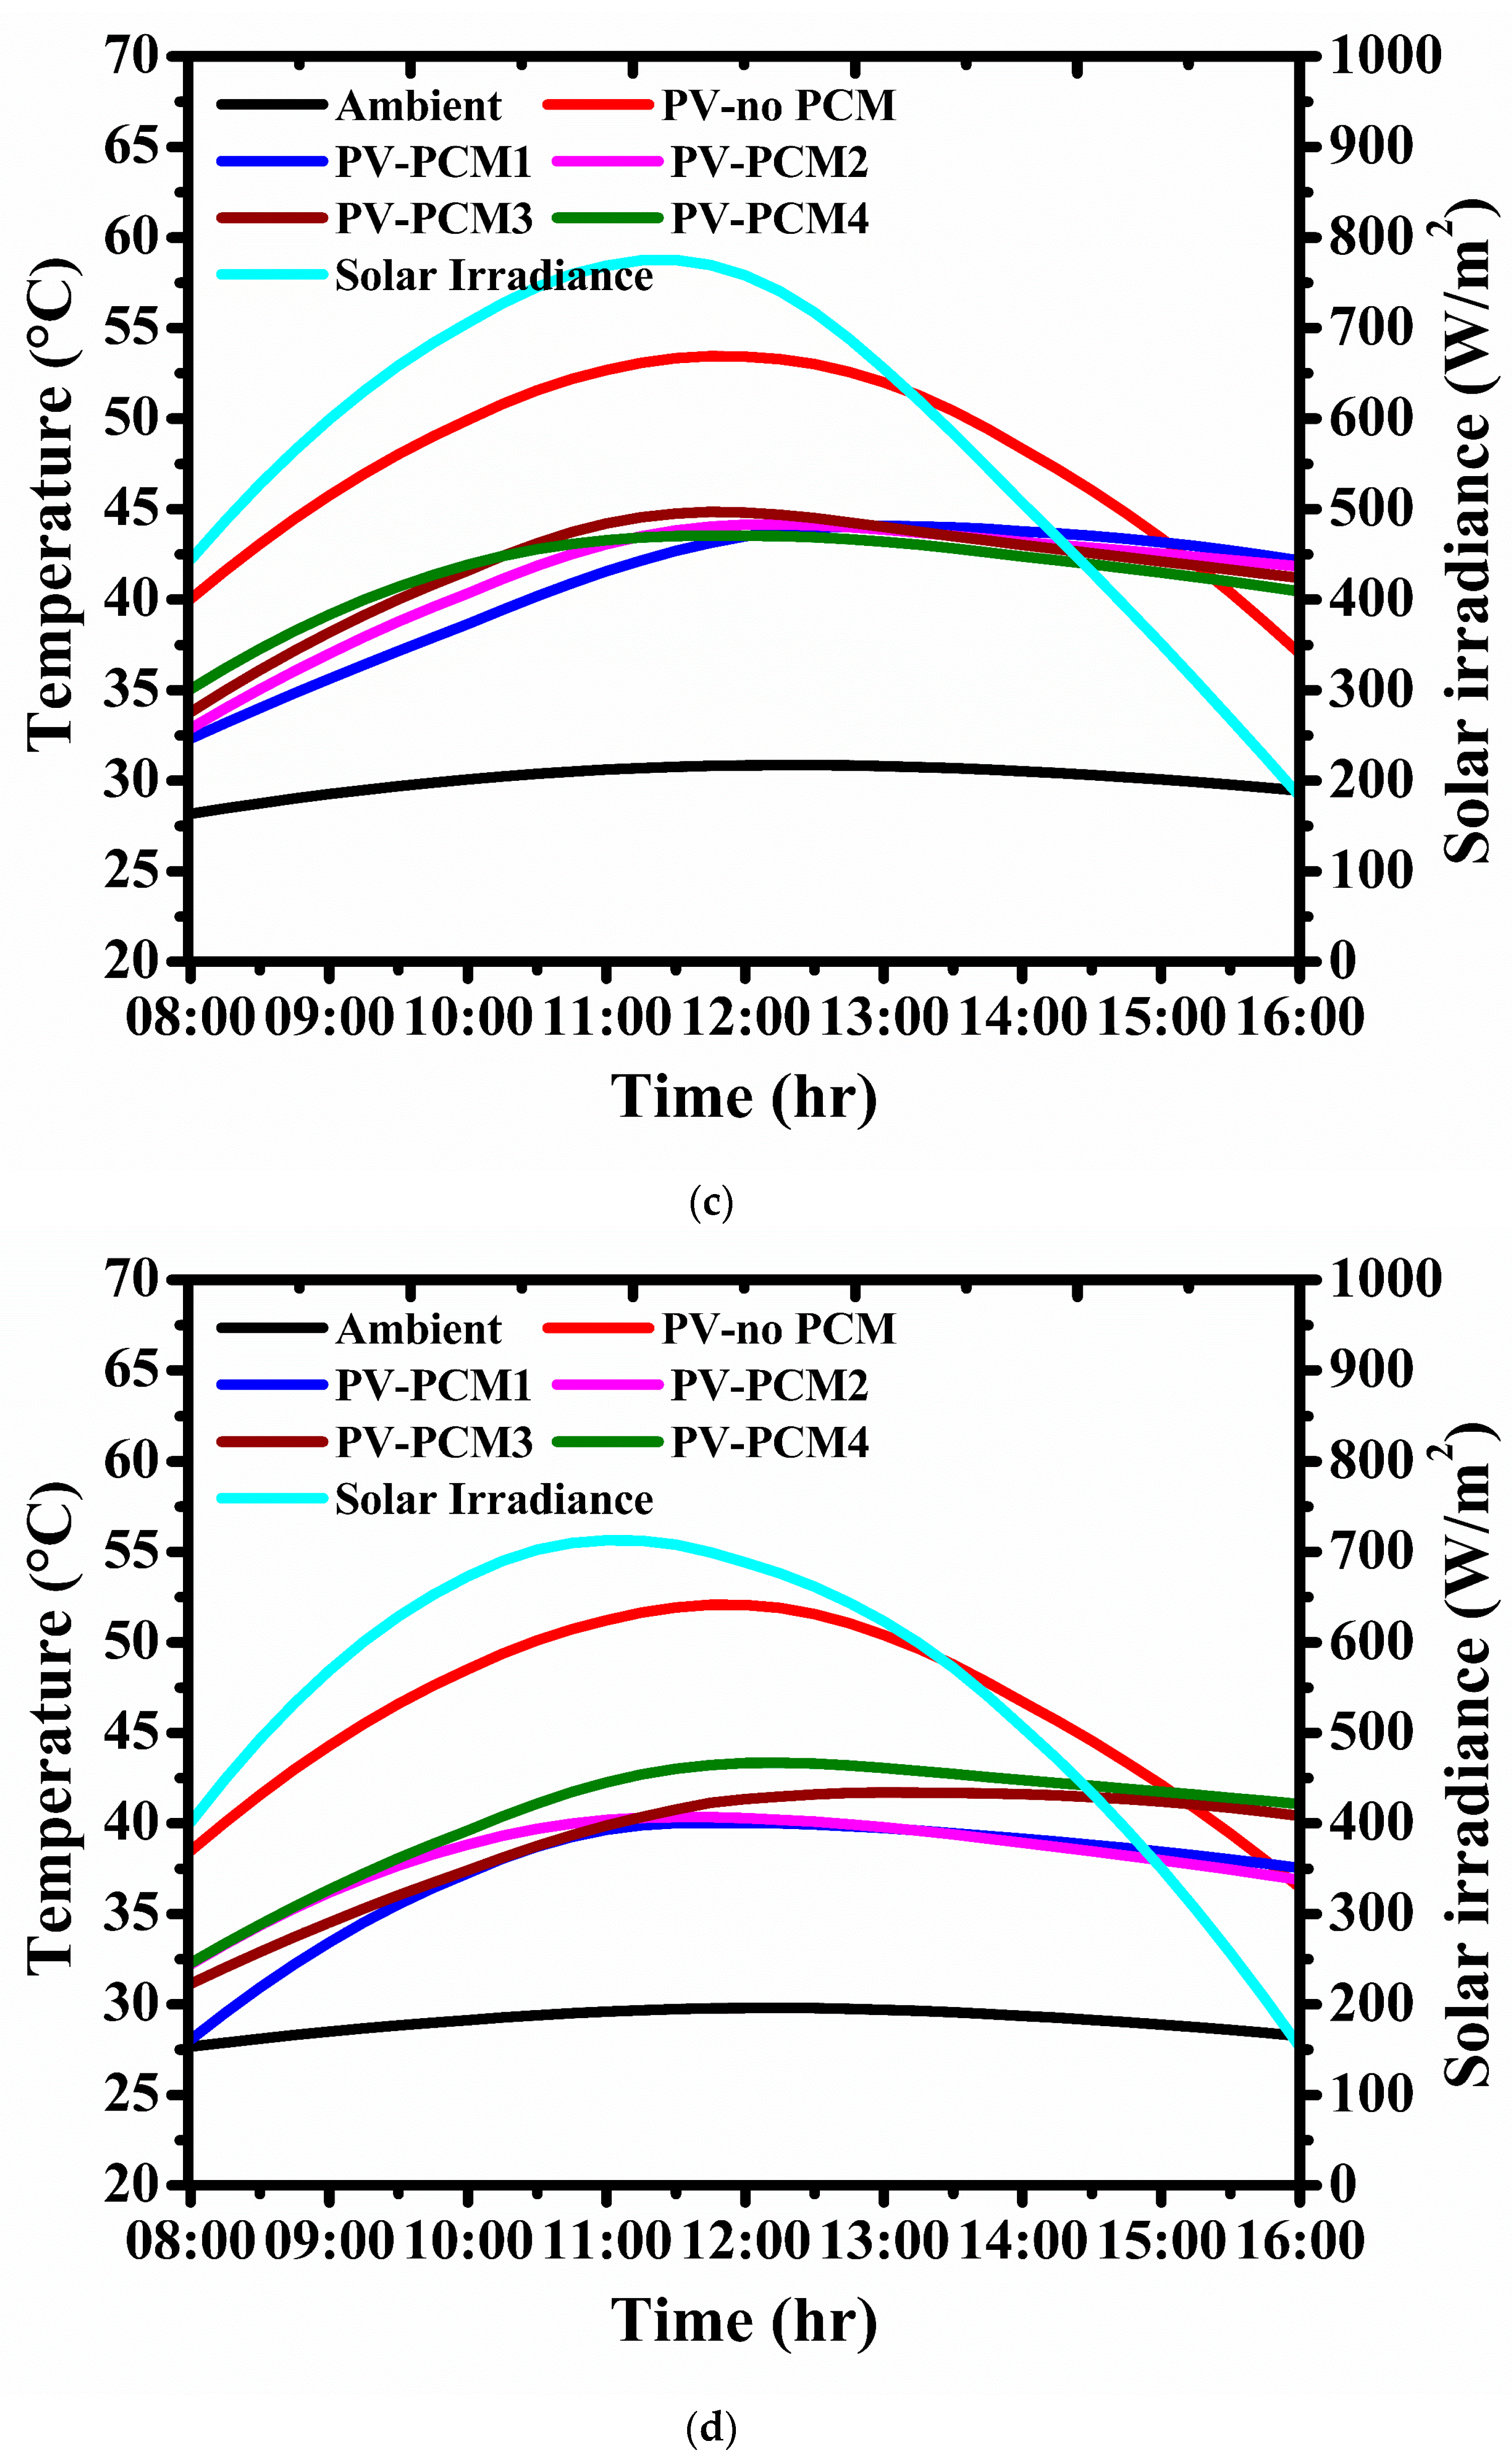
3.1.4. Pre-Monsoon and Monsoon
3.1.5. Winter and Post-Winter
3.1.6. Discussion of PCM Influence in Cooling the PV Module
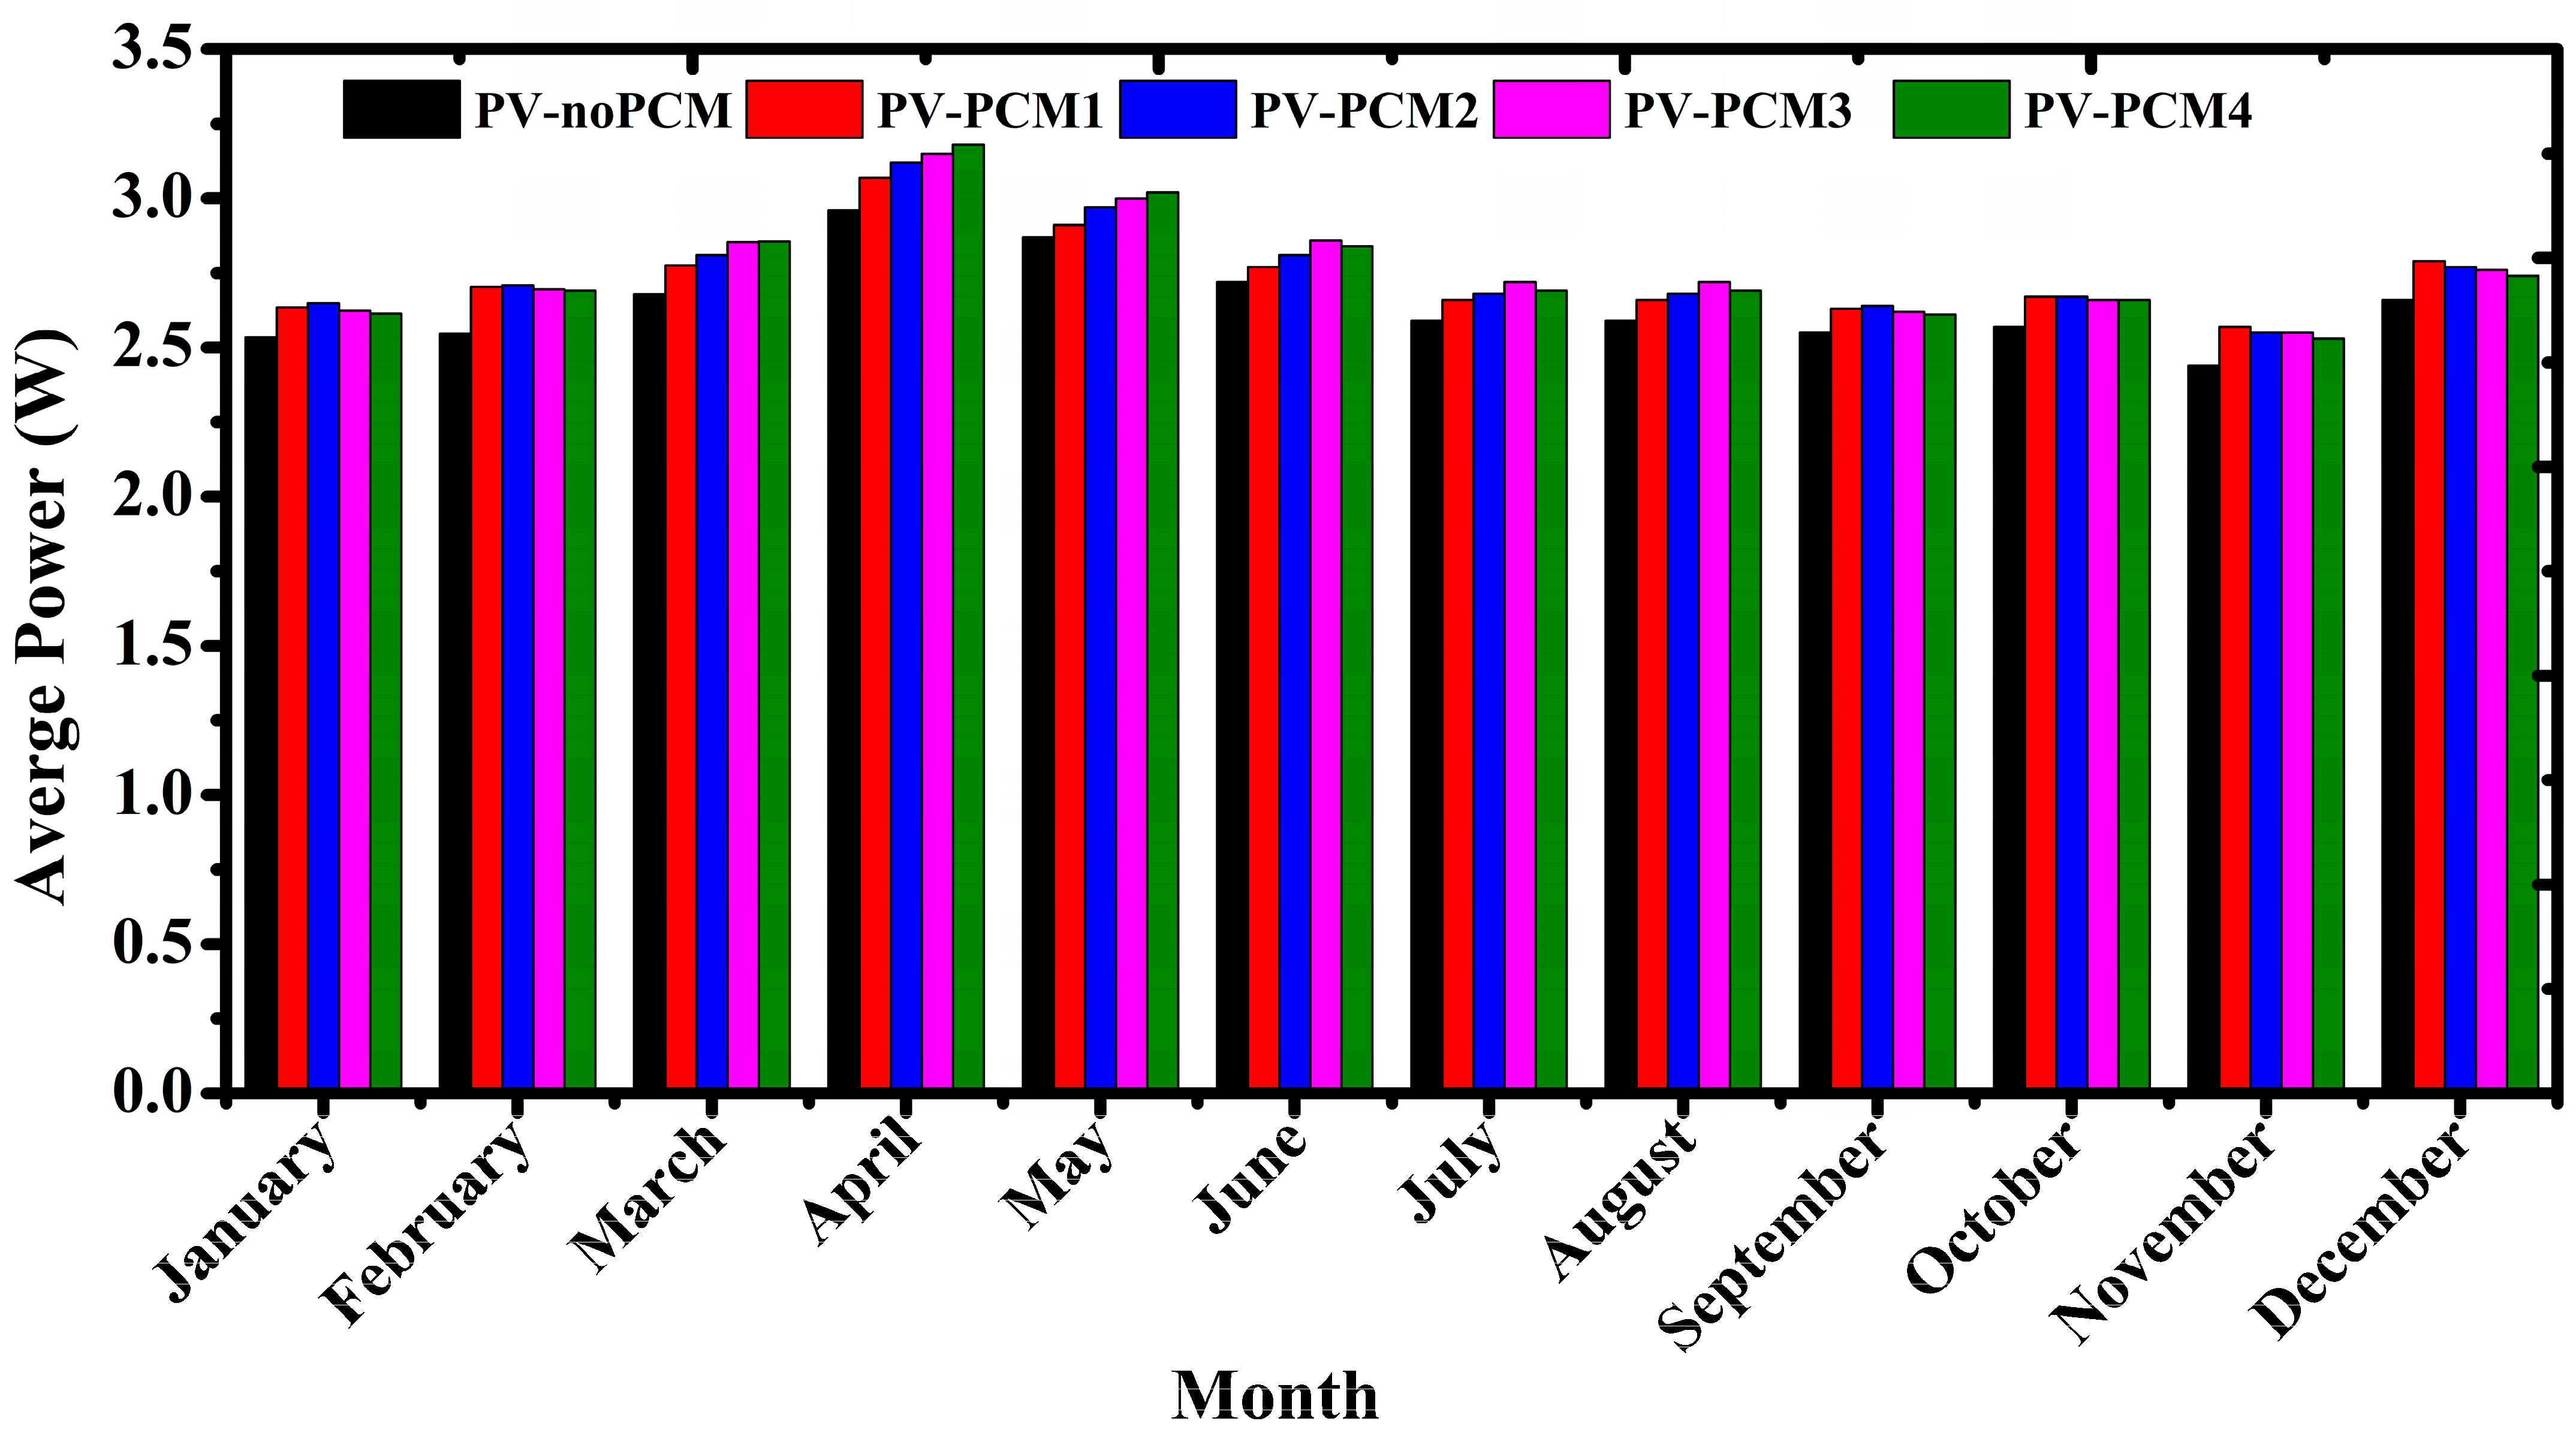
3.2. PV Module Electrical Profile
4. Conclusions
Author Contributions
Funding
Data Availability Statement
Conflicts of Interest
References
- Quang, D.V.; Milani, D.; Zahra, M.A. A review of potential routes to zero and negative emission technologies via the integration of renewable energies with CO2 capture processes. Int. J. Greenh. Gas Control 2023, 124, 103862. [Google Scholar] [CrossRef]
- Kolsi, L.; Al-Dahidi, S.; Kamel, S.; Aich, W.; Boubaker, S.; Ben Khedher, N. Prediction of Solar Energy Yield Based on Artificial Intelligence Techniques for the Ha’il Region, Saudi Arabia. Sustainability 2022, 15, 774. [Google Scholar] [CrossRef]
- Fathi, T.; Jouini, H.; Mami, A.; Ben Khedher, N.; Aich, W.; Boudjemline, A.; Boujelbene, M. Comparative Assessment between Five Control Techniques to Optimize the Maximum Power Point Tracking Procedure for PV Systems. Mathematics 2022, 10, 1080. [Google Scholar]
- Ang, T.-Z.; Salem, M.; Kamarol, M.; Das, H.; Nazari, M.; Prabaharan, N. A comprehensive study of renewable energy sources: Classifications, challenges and suggestions. Energy Strategy Rev. 2022, 43, 100939. [Google Scholar] [CrossRef]
- Alharthi, M.; Hanif, I.; Alamoudi, H. Impact of environmental pollution on human health and financial status of households in MENA countries: Future of using renewable energy to eliminate the environmental pollution. Renew. Energy 2022, 190, 338–346. [Google Scholar] [CrossRef]
- Pouladian-Kari, A.; Eslami, S.; Tadjik, A.; Kirchner, L.; Pouladian-Kari, R.; Golshanfard, A. A novel solution for addressing the problem of soiling and improving performance of PV solar systems. Sol. Energy 2022, 241, 315–326. [Google Scholar] [CrossRef]
- Abenante, L. Analytical modeling of reversible performance loss of PV modules and module arrays. Sol. Energy 2022, 239, 375–387. [Google Scholar] [CrossRef]
- Chiang, W.; Permana, I.; Wang, F.; Chen, H.; Erdenebayar, M. Experimental investigation for an innovative hybrid photovoltaic/Thermal (PV/T) solar system. Energy Rep. 2022, 8, 910–918. [Google Scholar] [CrossRef]
- Durganjali, C.S.; Avinash, G.; Megha, K.; Ponnalagu, R.; Goel, S.; Radhika, S. Prediction of PV cell parameters at different temperatures via ML algorithms and comparative performance analysis in Multiphysics environment. Energy Convers. Manag. 2023, 282, 116881. [Google Scholar] [CrossRef]
- Moharram, K.A.; Abd-Elhady, M.; Kandil, H.; El-Sherif, H. Enhancing the performance of photovoltaic panels by water cooling. Ain Shams Eng. J. 2013, 4, 869–877. [Google Scholar] [CrossRef]
- Moradi, K.; Ali Ebadian, M.; Lin, C.-X. A review of PV/T technologies: Effects of control parameters. Int. J. Heat Mass Transf. 2013, 64, 483–500. [Google Scholar] [CrossRef]
- Moradgholi, M.; Nowee, S.; Abrishamchi, I. Application of heat pipe in an experimental investigation on a novel photovoltaic/thermal (PV/T) system. Sol. Energy 2014, 107, 82–88. [Google Scholar] [CrossRef]
- Fudholi, A.; Sopian, K.; Yazdi, M.; Ruslan, M.; Ibrahim, A.; Kazem, H. Performance analysis of photovoltaic thermal (PVT) water collectors. Energy Convers. Manag. 2014, 78, 641–651. [Google Scholar] [CrossRef]
- Kumar, A.; Baredar, P.; Qureshi, U. Historical and recent development of photovoltaic thermal (PVT) technologies. Renew. Sustain. Energy Rev. 2015, 42, 1428–1436. [Google Scholar] [CrossRef]
- Lamnatou, C.; Chemisana, D. Photovoltaic/thermal (PVT) systems: A review with emphasis on environmental issues. Renew. Energy 2017, 105, 270–287. [Google Scholar] [CrossRef]
- Mostakim, K.; Hasanuzzaman, M. Global prospects, challenges and progress of photovoltaic thermal system. Sustain. Energy Technol. Assess. 2022, 53, 102426. [Google Scholar] [CrossRef]
- Chandrasekar, M.; Senthilkumar, T. Five decades of evolution of solar photovoltaic thermal (PVT) technology—A critical insight on review articles. J. Clean. Prod. 2021, 322, 128997. [Google Scholar] [CrossRef]
- Velmurugan, K.; Kumarasamy, S.; Wongwuttanasatian, T.; Seithtanabutara, V. Review of PCM types and suggestions for an applicable cascaded PCM for passive PV module cooling under tropical climate conditions. J. Clean. Prod. 2021, 293, 126065. [Google Scholar] [CrossRef]
- Velmurugan, K.; Elavarasan, R.M.; Van De, P.; Karthikeyan, V.; Korukonda, T.B.; Dhanraj, J.A.; Emsaeng, K.; Chowdhury, M.S.; Techato, K.; El Khier, B.S.A.; et al. A Review of Heat Batteries Based PV Module Cooling—Case Studies on Performance Enhancement of Large-Scale Solar PV System. Sustainability 2022, 14, 1963. [Google Scholar] [CrossRef]
- Abed, A.; Mouziraji, H.; Bakhshi, J.; Dulaimi, A.; Mohammed, H.; Ibrahem, R.; Ben Khedher, N.; Yaïci, W.; Mahdi, J. Numerical analysis of the energy-storage performance of a PCM-based triplex-tube containment system equipped with arc-shaped fins. Front. Chem. 2022, 10, 1057196. [Google Scholar] [CrossRef]
- Ma, T.; Li, Z.; Zhao, J. Photovoltaic panel integrated with phase change materials (PV-PCM): Technology overview and materials selection. Renew. Sustain. Energy Rev. 2019, 116, 109406. [Google Scholar] [CrossRef]
- Ali, H.M. Recent advancements in PV cooling and efficiency enhancement integrating phase change materials based systems—A comprehensive review. Solar Energy 2020, 197, 163–198. [Google Scholar] [CrossRef]
- Rekha, S.M.S.; Karthikeyan, V.; Thuy, L.T.; Binh, Q.; Techato, K.; Kannan, V.; Roy, V.; Sukchai, S.; Velmurugan, K. Efficient heat batteries for performance boosting in solar thermal cooking module. J. Clean. Prod. 2021, 324, 129223. [Google Scholar] [CrossRef]
- Fikri, M.A.; Samykano, M.; Pandey, A.; Kadirgama, K.; Kumar, R.; Selvaraj, J.; Rahim, N.; Tyagi, V.; Sharma, K.; Saidur, R. Recent progresses and challenges in cooling techniques of concentrated photovoltaic thermal system: A review with special treatment on phase change materials (PCMs) based cooling. Sol. Energy Mater. Sol. Cells 2022, 241, 111739. [Google Scholar] [CrossRef]
- Preet, S. A review on the outlook of thermal management of photovoltaic panel using phase change material. Energy Clim. Change 2021, 2, 100033. [Google Scholar] [CrossRef]
- Velmurugan, K.; Karthikeyan, V.; Korukonda, T.; Poongavanam, P.; Nadarajan, S.; Kumarasamy, S.; Wongwuttanasatian, T.; Sandeep, D. Experimental studies on photovoltaic module temperature reduction using eutectic cold phase change material. Solar Energy 2020, 209, 302–315. [Google Scholar] [CrossRef]
- Velmurugan, K.; Karthikeyan, V.; Kumarasamy, S.; Wongwuttanasatian, T.; Sa-ngiamsak, C. Thermal mapping of photovoltaic module cooling via radiation-based phase change material matrix: A case study of a large-scale solar farm in Thailand. J. Energy Storage 2022, 55, 105805. [Google Scholar] [CrossRef]
- Lim, J.-H.; Lee, Y.-S.; Seong, Y.-B. Diurnal Thermal Behavior of Photovoltaic Panel with Phase Change Materials under Different Weather Conditions. Energies 2017, 10, 1983. [Google Scholar] [CrossRef]
- Prasannaa, P.; Ramkumar, R.; Sunilkumar, K.; Rajasekar, R. Experimental study on a binary mixture ratio of fatty acid-based PCM integrated to PV panel for thermal regulation on a hot and cold month. Int. J. Sustain. Energy 2021, 40, 218–234. [Google Scholar] [CrossRef]
- Klugmann-Radziemska, E.; Wcisło-Kucharek, P. Photovoltaic module temperature stabilization with the use of phase change materials. Sol. Energy 2017, 150, 538–545. [Google Scholar] [CrossRef]
- Mahamudul, H.; Rahman, M.; Metselaar, H.; Mekhilef, S.; Shezan, S.; Sohel, R.; Karim, S.A.; Badiuzaman, W. Temperature Regulation of Photovoltaic Module Using Phase Change Material: A Numerical Analysis and Experimental Investigation. Int. J. Photoenergy 2016, 2016, 5917028. [Google Scholar] [CrossRef]
- Khedher, N.B.; Mahdi, J.; Majdi, H.; Al-Azzawi, W.; Dhahbi, S.; Talebizadehsardari, P. A hybrid solidification enhancement in a latent-heat storage system with nanoparticles, porous foam, and fin-aided foam strips. J. Energy Storage 2022, 56, 106070. [Google Scholar] [CrossRef]
- Ben Khedher, N.; Bantan, R.; Kolsi, L.; Omri, M. Performance investigation of a vertically configured LHTES via the combination of nano-enhanced PCM and fins: Experimental and numerical approaches. Int. Commun. Heat Mass Transf. 2022, 137, 106246. [Google Scholar] [CrossRef]
- Ben Khedher, N.; Mehryan, S.A.M. Study of tree-shaped optimized fins in a heat sink filled by solid-solid nanocomposite phase change material. Int. Commun. Heat Mass Transf. 2022, 136, 106195. [Google Scholar] [CrossRef]
- Karthikeyan, V.; Sirisamphanwong, C.; Sukchai, S.; Sahoo, S.; Wongwuttanasatian, T. Reducing PV module temperature with radiation based PV module incorporating composite phase change material. J. Energy Storage 2020, 29, 101346. [Google Scholar] [CrossRef]
- Li, X.; Cui, W.; Simon, T.; Ma, T.; Cui, T.; Wang, Q. Pore-scale analysis on selection of composite phase change materials for photovoltaic thermal management. Appl. Energy 2021, 302, 117558. [Google Scholar] [CrossRef]
- Abdulmunem, A.R.; Samin, P.; Rahman, H.; Hussien, H.; Ghazali, H. A novel thermal regulation method for photovoltaic panels using porous metals filled with phase change material and nanoparticle additives. J. Energy Storage 2021, 39, 102621. [Google Scholar] [CrossRef]
- Arıcı, M.; Bilgin, F.; Nižetić, S.; Papadopoulos, A. Phase change material based cooling of photovoltaic panel: A simplified numerical model for the optimization of the phase change material layer and general economic evaluation. J. Clean. Prod. 2018, 189, 738–745. [Google Scholar] [CrossRef]
- Elavarasan, R.M.; Velmurugan, K.; Subramaniam, U.; Kumar, A.; Almakhles, D. Experimental Investigations Conducted for the Characteristic Study of OM29 Phase Change Material and Its Incorporation in Photovoltaic Panel. Energies 2020, 13, 897. [Google Scholar] [CrossRef]
- Rashwan, S.S.; Shaaban, A.; Al-Suliman, F. A comparative study of a small-scale solar PV power plant in Saudi Arabia. Renew. Sustain. Energy Rev. 2017, 80, 313–318. [Google Scholar] [CrossRef]
- Srivastava, R.; Tiwari, A.; Giri, V. An overview on performance of PV plants commissioned at different places in the world. Energy Sustain. Dev. 2020, 54, 51–59. [Google Scholar] [CrossRef]
- Hasan, A.; Sarwar, J.; Alnoman, H.; Abdelbaqi, S. Yearly energy performance of a photovoltaic-phase change material (PV-PCM) system in hot climate. Solar Energy 2017, 146, 417–429. [Google Scholar] [CrossRef]
- Pluss®. Available online: https://pluss.co.in/save-pcms-product-range/ (accessed on 4 April 2023).


| PCM | OM31 (PCM1) | OM35 (PCM2) | OM37 (PCM3) | OM42 (PCM4) |
|---|---|---|---|---|
| Melting temperature (°C) | 32 | 35 | 37 | 42 |
| Latent heat of fusion (J/k) | 187 | 202 | 218 | 199 |
| Thermal conductivity (W/m·K) | 0.21 | 0.20 | 0.16 | 0.19 |
| Specification | Range |
|---|---|
| Rated power ) | 5 W |
| Open circuit voltage ) | 22.3 V |
| Short circuit current ) | 0.3 A |
| Electrical efficiency ) | 11.5% |
| Voltage at ) | 17.8 V |
| Current at ) | 0.28 A |
| Temperature co-efficient (β) | −0.45%/°C |
| Dimension (L × W) | 30 cm × 20 cm |
| Device Name | Range | Accuracy |
|---|---|---|
| K-type thermocouple | −270 to 1370 °C | ±0.30% |
| Multimeter | 200 mV to 1000 V, 200 µA to 10 A | ±1.3% |
| Pyranometer | 0 to 1600 W/m2 | ±0.25% |
| Temperature indicator | −50 to 400 °C | ±1.1% |
| PV-noPCM (°C) | PV-PCM1 (°C) | PV-PCM2 (°C) | PV-PCM3 (°C) | PV-PCM4 (°C) | Ambient (°C) | Solar Irradiance (W/m2) | |
|---|---|---|---|---|---|---|---|
| March (Pre-summer) | |||||||
| Average | 57.74 | 51.91 | 49.59 | 46.61 | 46.33 | 32.80 | 635.78 |
| Peak | 66.17 | 57.31 | 54.07 | 50.58 | 49.83 | 33.91 | 815.51 |
| April (Summer) | |||||||
| Average | 63.29 | 57.85 | 54.44 | 52.88 | 51.07 | 32.98 | 723.86 |
| Peak | 71.12 | 62.89 | 58.90 | 56.47 | 54.11 | 34.39 | 914.72 |
| May (Summer) | |||||||
| Average | 61.06 | 59.00 | 55.10 | 53.46 | 51.89 | 32.55 | 690.83 |
| Peak | 68.45 | 64.15 | 59.61 | 57.09 | 54.97 | 33.57 | 882.95 |
| June (Post-summer) | |||||||
| Average | 54.34 | 50.32 | 49.12 | 46.12 | 48.36 | 32.45 | 604.05 |
| Peak | 62.07 | 54.56 | 53.20 | 48.99 | 50.98 | 33.71 | 773.97 |
| July (Post-summer) | |||||||
| Average | 54.71 | 52.18 | 49.55 | 45.90 | 47.48 | 32.27 | 635.35 |
| Peak | 62.07 | 56.39 | 52.96 | 48.64 | 50.27 | 33.48 | 823.02 |
| August (Pre-monsoon) | |||||||
| Average | 53.22 | 49.29 | 48.11 | 45.20 | 47.39 | 31.80 | 592.18 |
| Peak | 61.09 | 53.67 | 52.33 | 48.33 | 50.04 | 33.09 | 770.65 |
| September (Pre-monsoon) | |||||||
| Average | 53.57 | 47.82 | 47.47 | 48.75 | 49.09 | 30.50 | 591.77 |
| Peak | 61.21 | 52.65 | 52.07 | 54.29 | 54.85 | 31.37 | 784.61 |
| October (Monsoon) | |||||||
| Average | 47.86 | 40.89 | 41.37 | 41.86 | 41.54 | 30.11 | 577.83 |
| Peak | 53.45 | 44.07 | 44.16 | 44.84 | 43.54 | 30.87 | 775.14 |
| November (Monsoon) | |||||||
| Average | 46.46 | 37.49 | 38.28 | 39.12 | 40.61 | 29.10 | 545.98 |
| Peak | 52.08 | 40.03 | 40.35 | 41.71 | 43.35 | 29.81 | 712.97 |
| December (Winter) | |||||||
| Average | 49.53 | 40.74 | 42.02 | 42.62 | 44.13 | 27.58 | 604.05 |
| Peak | 56.29 | 42.80 | 44.77 | 46.29 | 48.37 | 28.65 | 773.97 |
| January (Winter) | |||||||
| Average | 50.02 | 42.93 | 42.04 | 43.64 | 44.37 | 28.30 | 577.83 |
| Peak | 57.66 | 47.52 | 45.87 | 48.56 | 49.60 | 29.30 | 775.14 |
| February (Post-winter) | |||||||
| Average | 53.57 | 42.59 | 42.36 | 43.14 | 43.44 | 30.50 | 591.77 |
| Peak | 61.21 | 47.01 | 46.49 | 48.05 | 48.54 | 31.37 | 784.65 |
| Average Power (W) | Peak Power (W) | Average PR (%) | Peak PR (%) | Average η (%) | Peak η (%) | CUF | |
|---|---|---|---|---|---|---|---|
| January (Winter) | |||||||
| PV-noPCM | 2.53 | 3.30 | 88.46 | 94.14 | 12.80 | 13.19 | 16.89 |
| PV-PCM1 | 2.63 | 3.47 | 91.64 | 94.55 | 12.43 | 12.67 | 17.56 |
| PV-PCM2 | 2.65 | 3.50 | 92.04 | 95.06 | 12.38 | 12.58 | 17.66 |
| PV-PCM3 | 2.62 | 3.45 | 91.32 | 94.73 | 12.46 | 12.72 | 17.49 |
| PV-PCM4 | 2.61 | 3.44 | 90.99 | 94.85 | 12.50 | 12.67 | 17.42 |
| February (Post-winter) | |||||||
| PV-noPCM | 2.55 | 3.28 | 86.86 | 92.75 | 12.98 | 13.37 | 16.97 |
| PV-PCM1 | 2.70 | 3.53 | 91.79 | 95.22 | 12.41 | 12.64 | 18.03 |
| PV-PCM2 | 2.71 | 3.54 | 91.89 | 95.38 | 12.40 | 12.61 | 18.06 |
| PV-PCM3 | 2.70 | 3.51 | 91.54 | 94.89 | 12.44 | 12.69 | 17.97 |
| PV-PCM4 | 2.69 | 3.50 | 91.41 | 94.87 | 12.45 | 12.64 | 17.93 |
| March (Pre-summer) | |||||||
| PV-noPCM | 2.68 | 3.32 | 85.00 | 91.20 | 13.19 | 13.63 | 17.85 |
| PV-PCM1 | 2.78 | 3.47 | 87.61 | 95.52 | 12.89 | 13.17 | 18.51 |
| PV-PCM2 | 2.81 | 3.53 | 88.65 | 94.63 | 12.77 | 13.00 | 18.73 |
| PV-PCM3 | 2.85 | 3.60 | 89.99 | 94.86 | 12.62 | 12.82 | 19.02 |
| PV-PCM4 | 2.86 | 3.61 | 90.11 | 93.25 | 12.60 | 13.17 | 19.05 |
| April (Summer) | |||||||
| PV-noPCM | 2.96 | 3.63 | 82.51 | 88.50 | 13.48 | 13.89 | 19.75 |
| PV-PCM1 | 3.07 | 3.80 | 84.95 | 92.69 | 13.20 | 13.46 | 20.44 |
| PV-PCM2 | 3.12 | 3.88 | 86.47 | 92.57 | 13.02 | 13.25 | 20.82 |
| PV-PCM3 | 3.15 | 3.93 | 87.18 | 91.37 | 12.94 | 13.13 | 21.00 |
| PV-PCM4 | 3.18 | 3.98 | 87.99 | 91.01 | 12.85 | 13.46 | 21.20 |
| May (Summer) | |||||||
| PV-noPCM | 2.87 | 3.57 | 83.51 | 89.74 | 13.37 | 13.75 | 19.10 |
| PV-PCM1 | 2.91 | 3.65 | 84.43 | 92.32 | 13.26 | 13.53 | 19.39 |
| PV-PCM2 | 2.97 | 3.74 | 86.18 | 92.35 | 13.06 | 13.29 | 19.81 |
| PV-PCM3 | 3.00 | 3.79 | 86.91 | 91.15 | 12.97 | 13.16 | 19.98 |
| PV-PCM4 | 3.02 | 3.83 | 87.62 | 90.69 | 12.89 | 13.53 | 20.15 |
| June (Post-summer) | |||||||
| PV-noPCM | 2.59 | 3.22 | 86.52 | 91.87 | 13.02 | 13.42 | 17.29 |
| PV-PCM1 | 2.66 | 3.35 | 88.32 | 94.18 | 12.81 | 13.03 | 17.73 |
| PV-PCM2 | 2.68 | 3.37 | 88.86 | 94.30 | 12.75 | 12.96 | 17.84 |
| PV-PCM3 | 2.72 | 3.45 | 90.21 | 93.55 | 12.59 | 12.74 | 18.13 |
| PV-PCM4 | 2.69 | 3.41 | 89.20 | 92.10 | 12.71 | 13.03 | 17.92 |
| July (Post-summer) | |||||||
| PV-noPCM | 2.72 | 3.42 | 86.35 | 93.13 | 13.04 | 13.42 | 18.12 |
| PV-PCM1 | 2.77 | 3.54 | 87.49 | 93.89 | 12.91 | 13.12 | 18.48 |
| PV-PCM2 | 2.81 | 3.60 | 88.67 | 93.20 | 12.77 | 12.95 | 18.73 |
| PV-PCM3 | 2.86 | 3.69 | 90.30 | 93.85 | 12.58 | 12.72 | 19.10 |
| PV-PCM4 | 2.84 | 3.64 | 89.60 | 93.10 | 12.66 | 13.12 | 18.93 |
| August (Pre-monsoon) | |||||||
| PV-noPCM | 2.56 | 3.22 | 87.02 | 91.91 | 12.96 | 13.37 | 17.05 |
| PV-PCM1 | 2.62 | 3.35 | 88.78 | 94.24 | 12.76 | 12.98 | 17.47 |
| PV-PCM2 | 2.64 | 3.37 | 89.31 | 94.00 | 12.70 | 12.91 | 17.58 |
| PV-PCM3 | 2.68 | 3.44 | 90.62 | 93.70 | 12.55 | 12.71 | 17.85 |
| PV-PCM4 | 2.65 | 3.41 | 89.64 | 92.34 | 12.66 | 12.98 | 17.66 |
| September (Pre-monsoon) | |||||||
| PV-noPCM | 2.55 | 3.28 | 86.86 | 92.75 | 12.98 | 13.37 | 16.97 |
| PV-PCM1 | 2.63 | 3.43 | 89.44 | 93.48 | 12.68 | 12.93 | 17.56 |
| PV-PCM2 | 2.64 | 3.44 | 89.60 | 93.38 | 12.66 | 12.90 | 17.60 |
| PV-PCM3 | 2.62 | 3.40 | 89.03 | 92.81 | 12.73 | 13.02 | 17.46 |
| PV-PCM4 | 2.61 | 3.39 | 88.88 | 92.78 | 12.75 | 12.93 | 17.42 |
| October (Monsoon) | |||||||
| PV-noPCM | 2.57 | 3.37 | 89.43 | 94.28 | 12.68 | 12.97 | 17.11 |
| PV-PCM1 | 2.67 | 3.56 | 92.55 | 96.39 | 12.32 | 12.49 | 17.83 |
| PV-PCM2 | 2.67 | 3.54 | 92.34 | 96.14 | 12.35 | 12.49 | 17.77 |
| PV-PCM3 | 2.66 | 3.52 | 92.12 | 95.74 | 12.37 | 12.53 | 17.72 |
| PV-PCM4 | 2.66 | 3.54 | 92.26 | 95.17 | 12.36 | 12.49 | 17.75 |
| November (Monsoon) | |||||||
| PV-noPCM | 2.44 | 3.13 | 90.05 | 94.54 | 12.61 | 12.90 | 16.29 |
| PV-PCM1 | 2.57 | 3.32 | 94.08 | 98.31 | 12.15 | 12.28 | 17.10 |
| PV-PCM2 | 2.55 | 3.31 | 93.72 | 96.45 | 12.19 | 12.29 | 17.03 |
| PV-PCM3 | 2.55 | 3.32 | 93.34 | 96.93 | 12.23 | 12.36 | 16.99 |
| PV-PCM4 | 2.53 | 3.28 | 92.68 | 96.41 | 12.31 | 12.28 | 16.85 |
| December (Winter) | |||||||
| PV-noPCM | 2.66 | 3.31 | 88.68 | 94.53 | 12.77 | 13.12 | 17.73 |
| PV-PCM1 | 2.79 | 3.55 | 92.62 | 95.34 | 12.31 | 12.42 | 18.62 |
| PV-PCM2 | 2.77 | 3.52 | 92.05 | 94.64 | 12.38 | 12.52 | 18.49 |
| PV-PCM3 | 2.76 | 3.49 | 91.78 | 95.05 | 12.41 | 12.60 | 18.42 |
| PV-PCM4 | 2.74 | 3.45 | 91.10 | 94.33 | 12.49 | 12.42 | 18.26 |
Disclaimer/Publisher’s Note: The statements, opinions and data contained in all publications are solely those of the individual author(s) and contributor(s) and not of MDPI and/or the editor(s). MDPI and/or the editor(s) disclaim responsibility for any injury to people or property resulting from any ideas, methods, instructions or products referred to in the content. |
© 2023 by the authors. Licensee MDPI, Basel, Switzerland. This article is an open access article distributed under the terms and conditions of the Creative Commons Attribution (CC BY) license (https://creativecommons.org/licenses/by/4.0/).
Share and Cite
Poongavanam, P.; Chand, A.A.; Tai, V.B.; Gupta, Y.M.; Kuppusamy, M.; Dhanraj, J.A.; Velmurugan, K.; Rajagopal, R.; Ramachandran, T.; Prasad, K.A.; et al. Annual Thermal Management of the Photovoltaic Module to Enhance Electrical Power and Efficiency Using Heat Batteries. Energies 2023, 16, 4049. https://doi.org/10.3390/en16104049
Poongavanam P, Chand AA, Tai VB, Gupta YM, Kuppusamy M, Dhanraj JA, Velmurugan K, Rajagopal R, Ramachandran T, Prasad KA, et al. Annual Thermal Management of the Photovoltaic Module to Enhance Electrical Power and Efficiency Using Heat Batteries. Energies. 2023; 16(10):4049. https://doi.org/10.3390/en16104049
Chicago/Turabian StylePoongavanam, Prasannaa, Aneesh A. Chand, Van Ba Tai, Yash Munnalal Gupta, Madhan Kuppusamy, Joshuva Arockia Dhanraj, Karthikeyan Velmurugan, Rajasekar Rajagopal, Tholkappiyan Ramachandran, Kushal A. Prasad, and et al. 2023. "Annual Thermal Management of the Photovoltaic Module to Enhance Electrical Power and Efficiency Using Heat Batteries" Energies 16, no. 10: 4049. https://doi.org/10.3390/en16104049
APA StylePoongavanam, P., Chand, A. A., Tai, V. B., Gupta, Y. M., Kuppusamy, M., Dhanraj, J. A., Velmurugan, K., Rajagopal, R., Ramachandran, T., Prasad, K. A., Chand, S. S., Raj, S., & Mamun, K. A. (2023). Annual Thermal Management of the Photovoltaic Module to Enhance Electrical Power and Efficiency Using Heat Batteries. Energies, 16(10), 4049. https://doi.org/10.3390/en16104049