1. Introduction
To fully understand the motivation for the creation formulas and calculations for the pressure-multiplying efficiency, some terms and names need to be described, such as a description of rotary flow dividers or the definition of pressure-multiplying efficiency. The whole model of calculations is narrowly focused on specific quantities and values. We should also present the context of why it is more convenient to use this type of a model.
1.1. Rotary Flow Divider
Rotary flow dividers, which are closely related to gear pumps and motors, fall under this category. While gear pumps and motors have drive shafts to produce torque, rotary flow dividers do not possess any such feature. Instead, the individual sections of a rotary flow divider are essentially gear motors that are interconnected by a single shaft inside the device. This means that they share the same speed. They also share one inlet. Rotary flow dividers have similar gearings, housing dimensions, and gear bearings as gear pumps and motors.
Although rotary flow dividers are basically assemblies of two or more gear motors, it is not possible to claim they have the same behaviour as for these motors. Because of a shared inlet and shaft, every section of the divider interacts with each other.
These dividers are primarily utilized for the synchronization of linear motors, such as in lifting platforms or excavator buckets. They are commonly used in situations where piston rods need to extend evenly and at the same speed. In this operating mode, all sections of the divider share the same output pressure. Additionally, the input pressure is equivalent to the average of all the output pressures of the divider.
In situations where synchronization is necessary, using a throttle valve with stabilization or a tandem pump has been the go-to method for many years. However, a rotary flow divider is an alternative utilization that offers several advantages. One advantage of this alternative utilization is that it generates less heat than using a throttle valve. This is especially important in applications where overheating could lead to damage or failure of the equipment.
Additionally, it allows for the flow to be divided closer to the actuators. This is something that is not possible with a tandem gear pump, which divides the flow further upstream. Dividing the flow closer to the actuators can result in more precise control over the system, leading to improved efficiency and accuracy.
Moreover, a rotary flow divider can be utilized to split the flow into primary and secondary circuits, where different pressures are required. This can be especially useful in systems where multiple actuators are being operated simultaneously. The utilization of a rotary flow divider offers several benefits over traditional synchronization methods. By reducing heat and allowing for a more flexible flow division, it can help optimize system performance and improve efficiency [
1].
1.2. Pressure Intensifiers Utilization
Pressure intensifiers are usually used in specific situations, when a higher pressure is needed, but also when there has to be an accent on how big a part pressure multiplication takes in the whole working cycle. Thus, they are a security feature and generate energy savings. There are a lot of intensifier designs [
2,
3] or even compact assemblies which require a more specific utilization [
4,
5,
6]. They are designed to be as suitable as possible for the specific parameters and needs of a hydraulic circuit, where they are used.
Pressure intensifiers provide excellent performance, as they can provide a more efficient control of the pressure. This type of equipment also offers great versatility, can be implemented in many different applications, and can be integrated into existing systems with minimal modifications requirements.
There are many types of hydraulic pressure intensifiers. Some of them are able to work continuously, some are used to cover pressure peaks. There are also boosters and intensifiers which reach pressure level higher than 700 bar. The utilization depends on the specific hydraulic circuit, its requirements, and the price one is willing to spend on this type of component.
In general, pressure intensifiers can be used in two ways. The first one is as an assembly with pumps, which are not able to reach the required pressure, such as gear pumps or vane pumps. This assembly could be an alternative to piston pumps in the case of price comparison. Second, pressure intensifiers can also be implemented into already existing hydraulic circuit, when the purpose changes or when there is a change in external load. Therefore, instead of changing the dimensions of all circuit components, it is possible to implement a pressure intensifier in front of the actuator so that the load remains the same in the rest of the circuit and on the pump.
Utilizing pressure intensifiers can generate system design enhancements, improve functioning, reduce the cost and dimensions of the circuit components, and reduce energy costs [
7].
The effectiveness of pressure intensifiers has to be examined and defined to be correctly and effectively used in the circuit. The investigation of specific parts of the assembly and their efficiency can also be seen in many other fields of study such as transmission development [
8], and there are also approaches combining analytical and FEM analysis [
9]. Moreover, there are efficiency investigations in connection with load sensing [
10] or complex controlling [
11]. Therefore, pressure-multiplying efficiency was derived and defined.
1.3. Model Related Approaches
In studies on hydraulic components, many approaches exist. A model of a pressure intensifier could be compared to various gear pump models, because gear pumps have the closest design to that of rotary flow dividers and pressure intensifiers. It is possible to investigate specific areas using numerical simulations such as FEM for gear pump leakage [
12], cavitation [
13], or meshing gears for noise reduction [
14,
15]. A slightly different approach could be seen in computation fluid dynamics [
16,
17].
For some quantities it is possible to derive equations which lead to calculations describing real conditions, for example flow ripples [
18]. Efficiency can also be investigated by considering the probability of interaction of various factors [
19]. An effective way to determine real conditions and their interaction with the rest of the assembly is to look at the efficiency by confronting real measured values with theoretical calculations, such as from the perspective of a Stribeck curve analysis [
20] or the volume efficiency and axial clearance in gear pumps [
21].
Solutions such as a complex model for gear pump which can generate various quantities such as pressure, flow pulsations and much more were also investigated in [
22]. The authors put together a few models, for example, mechanical, hydraulic, and cavity models, which were supplemented with restrictions on design tolerances or surface roughness. The results of this large and complex model could yield bearing reactions, shaft torque, pressure, or flow pulsations.
Another possibility is to use a complex simulation of the surrounding environment and divide one quantity into various parts to investigate, such as in case of Hygesim, where the noise reduction was investigated [
23]. It divided the noise into three parts—mechanical (gearing), hydraulic pulsations, and cavitation. These three parts were calculated separately into three mathematical models and then put together into one acoustic model. With the use of Ansys Virtual Lab, it simulated noise tests.
On the other hand, in the case of noise investigations, it is possible to apply a much easier approach such as the FEM of meshing gears and classify these values into different noise levels [
24]. Both approaches are correct, but the choice depends on what needs to be found and in how much detail the observations need to be.
The approach used in this paper was more aimed at the simplicity and flexibility of a model that can be used in various situations. The purpose of the model was to observe, detect, and simulate the behaviour of the pressure-multiplying efficiency as the outlet pressure increased.
Compared to EgeMATor or HYGESim approaches, the advantages are the simplicity and adaptability to different types of intensifier designs. In the case of a wide range of usage of gear pumps, EgeMATor and HYGESim have their place in developing new, quieter pumps. However, pressure intensifiers are generally not used much in hydraulic circuits. They are used, for example, in additional equipment for agricultural or construction machines.
Thus, a more suitable approach is to create this model targeted at the results of specific quantities which are monitored the most and which define the essential characteristics used for development. In this case, more complex modelling would be unnecessary and useless. However, this model could be used to expand into a more complex one, if there is an extension of this type of pressure intensifier into more circuits and machines.
The pressure-multiplying efficiency is always calculated from values gained from measurements. However, it would be very convenient to be able to evaluate these types of intensifiers without a need to provide specific measurements to every type of intensifier and rather calculate its efficiency using only the general parameters of a hydraulic circuit. Therefore, this article is about the description of a model, which creates formulas for calculating the pressure-multiplying efficiency with only two input values, the pressure and speed of an intensifier. The final derived formulas are also used to predict the efficiency at pressure levels never measured before and then verified by measurements.
1.4. Pressure-Multiplying Efficiency
In paper [
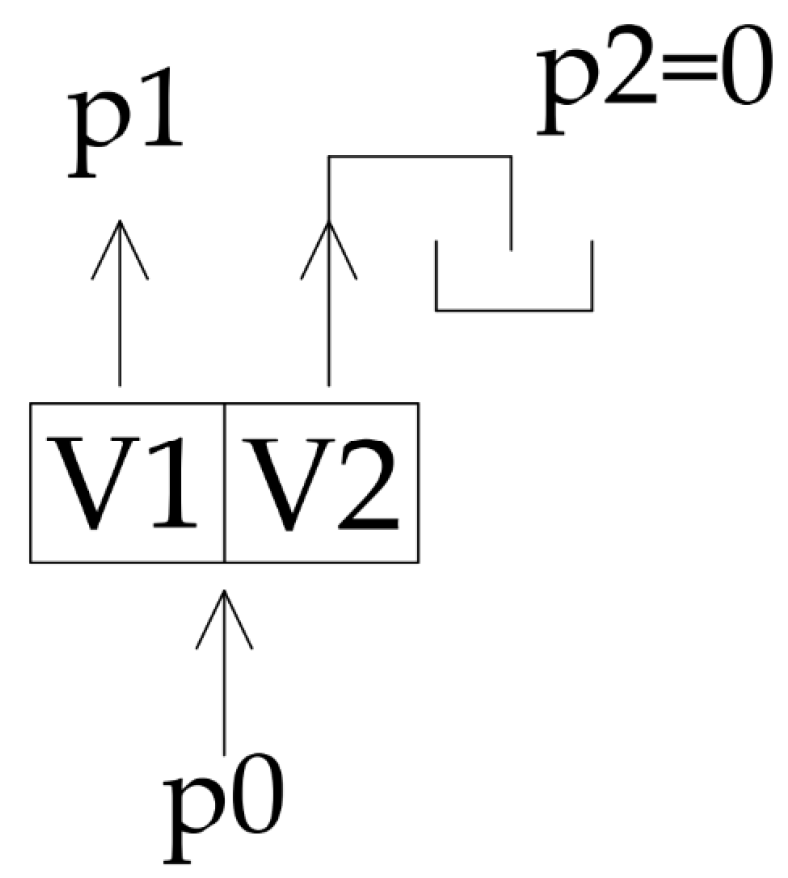
1], an evaluation methodology for rotary flow dividers used as pressure intensifiers was proposed. It stated that when there was (as an example) a two-section divider with two outputs and one of the outputs had a zero-pressure load (
), the input pressure (
) was half of another output pressure (
) (
Figure 1). It was one half because both sections of the divider had the same geometrical volumes (
).
Claiming that in the scenario of a two-section divider, the input pressure is one half of the loaded output pressure is a theoretical claim. The multiplying ratio is defined as the ratio between the sections’ geometrical volumes. To get real values, there must be efficiencies involved. Therefore, the pressure-multiplying efficiency was derived and used for the calculations.
In principal, the pressure-multiplying efficiency
is defined as the ratio between the theoretically calculated input pressure
and the measured value
as in Equation (
1).
The pressure-multiplying efficiency is a sum that takes into consideration various factors that can affect the theoretical output pressure of a pressure multiplier. These factors include friction losses, leaks, and inaccuracies in the flow—dividing, as well as internal leakage or fluid transfer through axial clearances. An accurate calculation requires accounting for all the different effects in the efficiency calculation. Ultimately, understanding and optimizing the pressure-multiplying efficiency is essential for maximizing the performance and effectiveness of pressure multipliers in a range of industrial applications [
7].
It stays in [
7]: “The definition of theoretical input pressure
to be put into Equation (
1) is needed. There are section volumes and pressures and pressure losses on outputs plugged to the tank entering these calculations. It is also more complicated for n-section divider or a divider with unequal section volumes. There was general formula derived for n-section divider with arbitrary section volumes and output pressure values (Equation (
2))”.
The denominator
is the measured input pressure value and the whole numerator defines the theoretical input pressure. It is calculated as the sum of the output pressures and the ratio of section volumes is taken into consideration. The number of sections is
n,
i is the sequence of these sections,
declares a specific section from all the sections loaded with the output pressure,
represents a specific section volume from all the sections included in the divider, and
represents the pressure value belonging to the volume
[
7].
In the case of the configuration in
Figure 1 where there is a two-section divider with geometrical volumes
and
, output pressures
and
, and input pressure
, Equation (
2) can be written as Equation (
3).
It is essential to consider pressure losses in any fluid system to ensure optimal performance and efficiency. However, neglecting pressure losses on outputs connected to the tank can lead to inaccurate results and compromise the system’s performance. Using Equation (
2), it is possible to calculate the multiplication with arbitrary output pressures, thus providing more precise results. Moreover, it is important to note that other output pressures do not necessarily have to be losses in piping. There could be other low-pressure devices added to the system, and Equation (
2) can still be applied to calculate the system’s performance accurately [
7].
One of the questions regarding the pressure-multiplying efficiency could be: why not use the efficiency description of gear motors? The answer is to be found in article [
1]. That article describes the problematic issue between the pressure-multiplying efficiency and volumetric efficiency and the hydro-mechanical efficiency used for the evaluation of gear pumps and motors.
That above-mentioned paper claims that a rotary flow divider was in principle an assembly of gear motors. However, to evaluate the hydro-mechanical efficiency, one would need to disassemble the divider and provide measurements for each section separately to define mechanical losses on every section. Moreover, there is no shaft sticking out from the divider. This type of measurement would be very inaccurate, complicated, and inefficient.
The article [
1] also claims that an evaluation using the volumetric efficiency would not be the best option. The divider needs to be evaluated by its flow-dividing inaccuracy that describes the quality of fluid transfer from input to output of every section.
1.5. Description of Types of Intensifiers and Measurements Used for Modelling
To create a measurement database, four types of dividers (A, B, C, D) were tested as pressure intensifiers. Their parameters such as geometrical volume ranges, maximum output pressure can be seen in
Table 1. All these devices were manufactured at the company Jihostroj [
25].
The geometrical volume represents one section only. The maximum pressure is the outlet pressure up to which a flawless run is guaranteed by the manufacturer in case of a standard use of the divider.
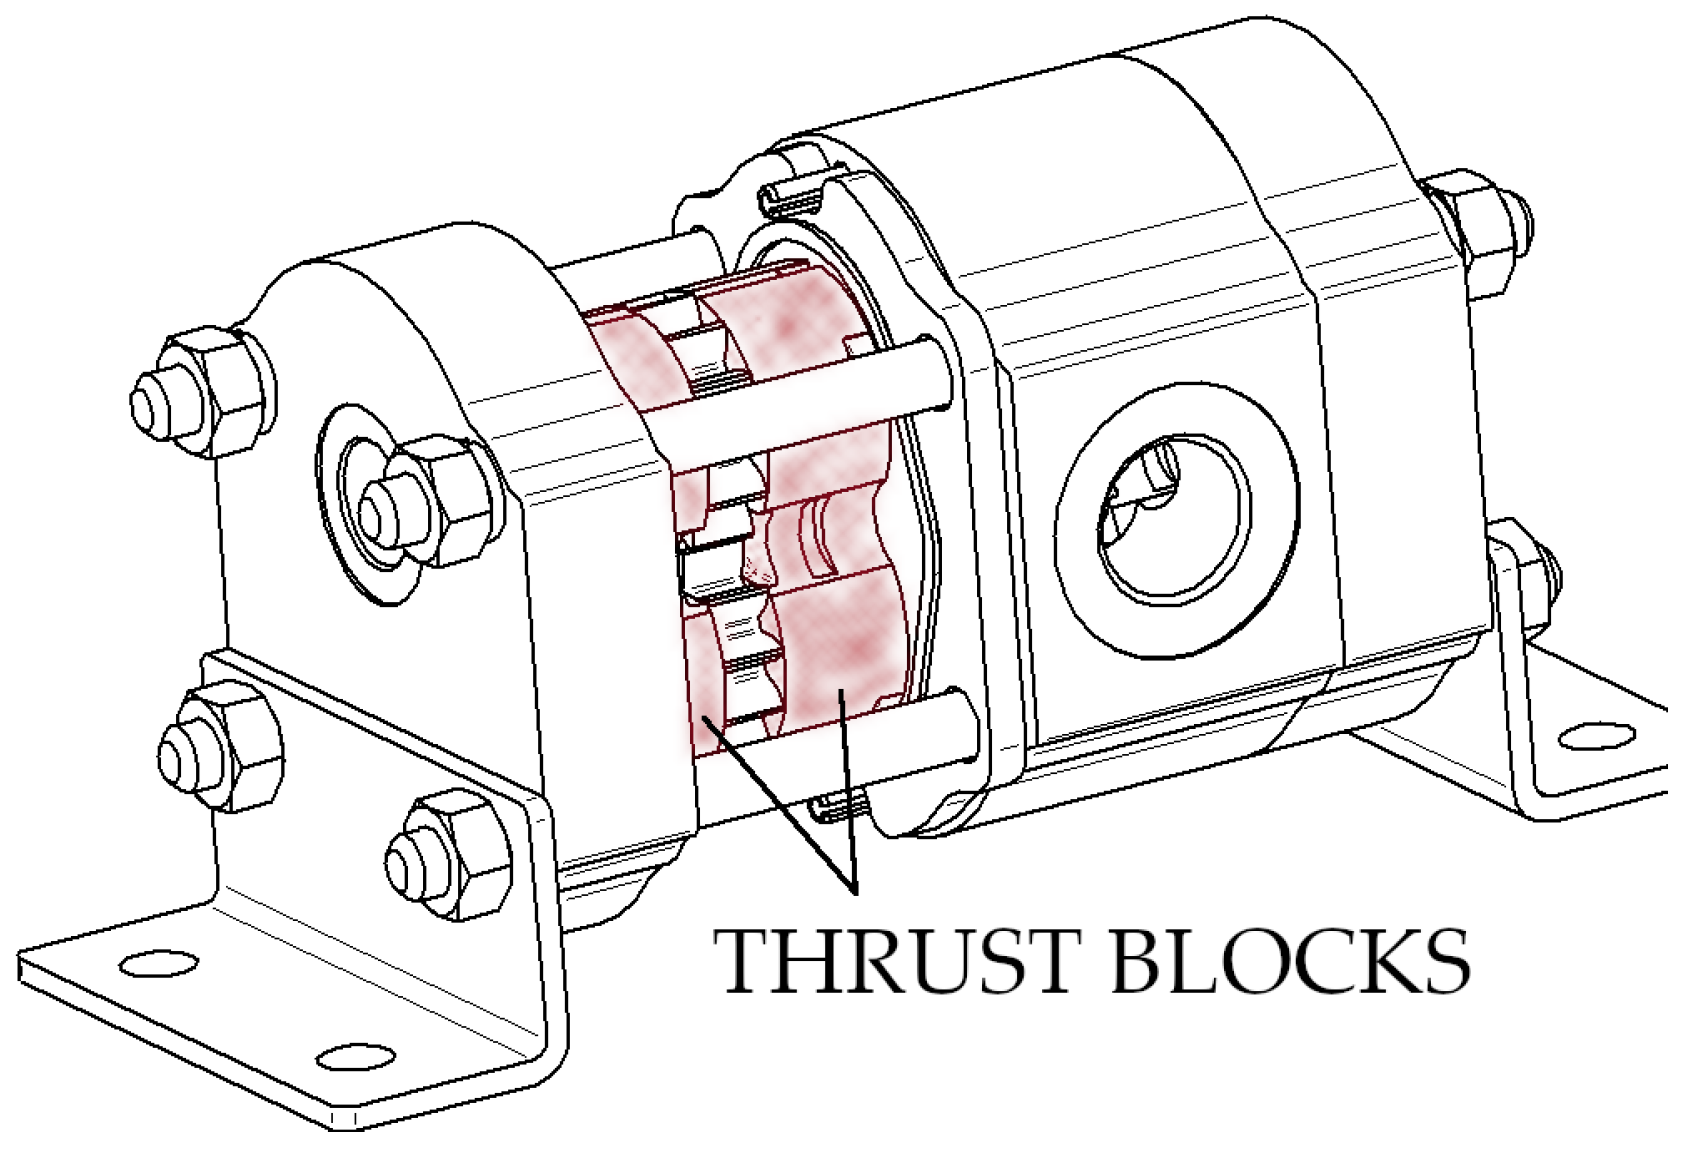
There are two types of rotary flow dividers. The first type is assembled with thrust blocks (TB divider), which are highlighted in red in
Figure 2. These components are equipped with a pressure-compensated function and designed to exert pressure against the gear faces. While this feature allows for an improved flow-dividing accuracy, it also leads to an increase in friction losses. Despite this drawback, the benefits of the pressure-compensated function make these components a desirable choice in certain applications requiring precise fluid management.
The second type is assembled without thrust blocks and called a NTB divider. Thus, there can be a lower friction and higher flow-dividing inaccuracy expected.
The description of divider types is given in [
7] as: “Type A is a NTB divider which belongs to the smallest (in comparison of volume). Type B is a TB divider considered in the middle in comparison of divider volumes. Type C and D are the biggest ones, when type C includes thrust blocks in its assembly and type D doesn’t. Bodies of NTB dividers are made of cast iron and in contrast TB divider’s bodies are made of aluminium alloy”.
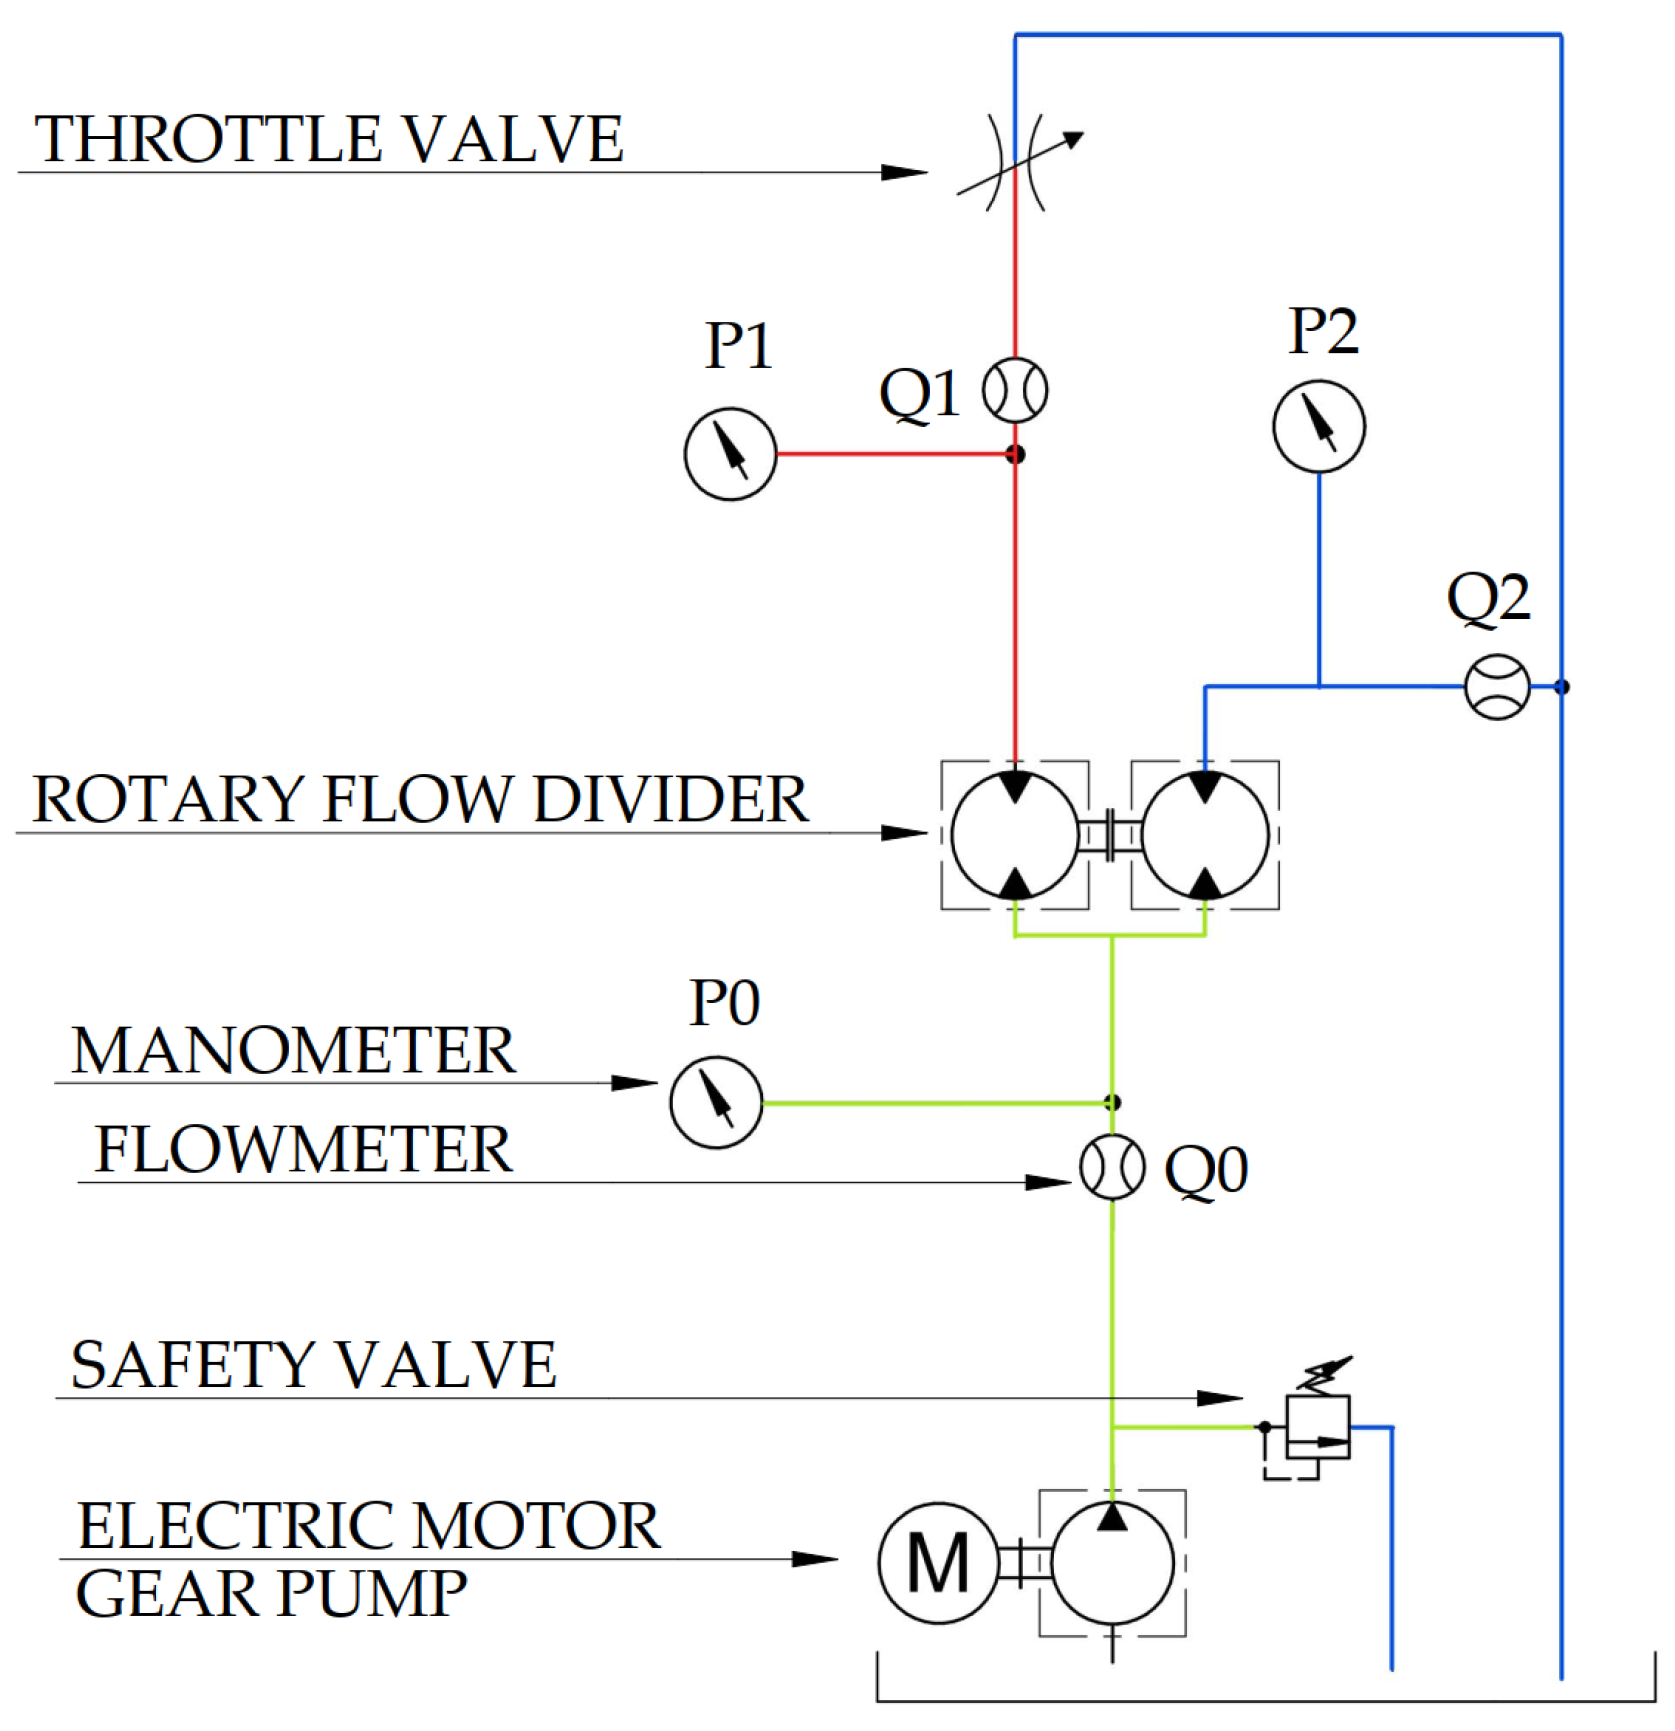
All the samples were tested on one measuring circuit, which can be seen in
Figure 3.
The input flow rate was maintained by using an electromotor with an adjustable speed and a gear pump assembly. The assembly was configured to have a = 17 cm3 gear pump. To ensure safety, a safety valve was installed and set at 270 bar. The flow rate and pressure of the input were measured using a flow meter and a manometer installed between the pump output and the divider input.
To monitor the output values, sensors were installed on every output. A manometer on the left output branch measured pressure
. This pressure was multiplied and sent to the hydraulic appliance. The throttle valve simulated the outer load. A manometer on the right output branch showed pressure
, which should ideally be zero. However, due to losses in piping, it was not the case. With the help of Equation (
3), there was no need to neglect passive pressure
and it could be calculated to obtain more accurate results. The measured values obtained from the flow meters on both output branches gave the possibility to evaluate the flow-dividing inaccuracy from one experiment along with the pressure multiplying efficiency.
The working fluid VG 46 was heated to a temperature range between 48 °C and 50 °C. All manometers were from Huba control. They were capable of measuring up to 400 bar with a declared resolution of 0.1%. The flow meter on the input could handle a flow up to 250 L/min and on the output ones, up to 160 L/min. All the flow meters were provided by the Kracht company with a declared accuracy of ±0.3% [
7].
From all the measurements taken (interpreted in [
7]), the best option to use as an intensifier was a two-section divider with thrust blocks—type B. This type was most likely to succeed in a test at 400 bar as an intensifier. It had the most consistent and predictable behaviour with an increasing pressure. The testing of this type of intensifier is described in the following sections as verifying measurements to the model calculation predictions.
2. Model Creation Motivation
The pressure-multiplying efficiency defines, describes, and characterizes the ability and quality of the pressure multiplication between the input and output of the pressure intensifier.
With the creation of a pressure-multiplying efficiency model, it is possible to define the efficiency using only the pressure and speed. Thus, it would not always be necessary to gather new measurements and calculate the pressure-multiplying efficiency from measured values.
In this paper, a derivation process of formula is described, which can be used to calculate the efficiency values for intensifiers made from two-section dividers with thrust blocks. These are the best candidates for pressure multiplication. The derivation of the formula for intensifiers made from other dividers, for example without thrust blocks, can be created in the same way but using different input data suitable for a specific design (for example without thrust blocks).
The behaviour of the pressure-multiplying efficiency depends on various factors. Firstly, it depends on the design, whether it is assembled with or without thrust blocks. In cases where thrust blocks are included, it also depends on their axial balance. Generally, it can be stated that it also depends on individual manufacturers and their preferences and detailed designs. These factors do not just change the pressure-multiplying efficiency but also the volumetric efficiency and mechanical efficiency.
The idea was to create a tool where the base was some characterizing polynomial (created from measurements). Then, based on that polynomial, a specific value can be calculated. The characterizing polynomial would be created from a measurement of specific intensifier designs, so this model could be applied to different intensifier designs and intensifiers from different manufacturers (with different characteristics). That is why it is an advantage to create a model as simple as possible, thus variable, flexible, and applicable to different types of intensifiers.
The results of this model are a formula defining the pressure-multiplying efficiency , where this quantity depends solely on the pressure and speed of the intensifier. Thus, it is possible to get an efficiency value using this formula without actual measurements. Due to the possible variability of geometrical volumes (and related speed) of intensifiers, this formula is relevant for searching the most effective run (maximum efficiency parameters) or dimensioning of a hydraulic circuit.
When there is a change in geometrical volume or a change due to the flow rate, there is also a change in the speed of the intensifier, thus the efficiency value will change.
3. Model Structure
The basis of the model is the reference characteristics of the pressure-multiplying efficiency and its dependence on the increasing pressure while having a reference speed.
Firstly, the measurement of input and output pressure in different speed modes on at least two pressure intensifiers must be done. Then, there is a calculation of a pressure-multiplying efficiency at different speed and pressure load levels. These efficiency characteristics are approximated using polynomials. After that, it is possible to create one average reference characteristic. Then, the theoretical speed (reference speed) for this characteristic must be found.
The pressure-multiplying efficiency could be declared based on a reference characteristic with the reference speed of the intensifier. To be able to define it at various speeds, there is a need to find a connection between different speed modes. To calculate the efficiency value at different speeds, a coefficient needs to be found. Thanks to that, the efficiency value can be corrected in connection to the actual speed of the intensifier.
Coefficient defines a value change based on the outlet pressure. After that, the characteristics of this coefficient are approximated with a polynomial to be available for all the various pressure values.
The result of the combination of the reference characteristic, its reference speed, and coefficient is a description of the pressure-multiplying efficiency depending only on the outlet pressure and actual speed.
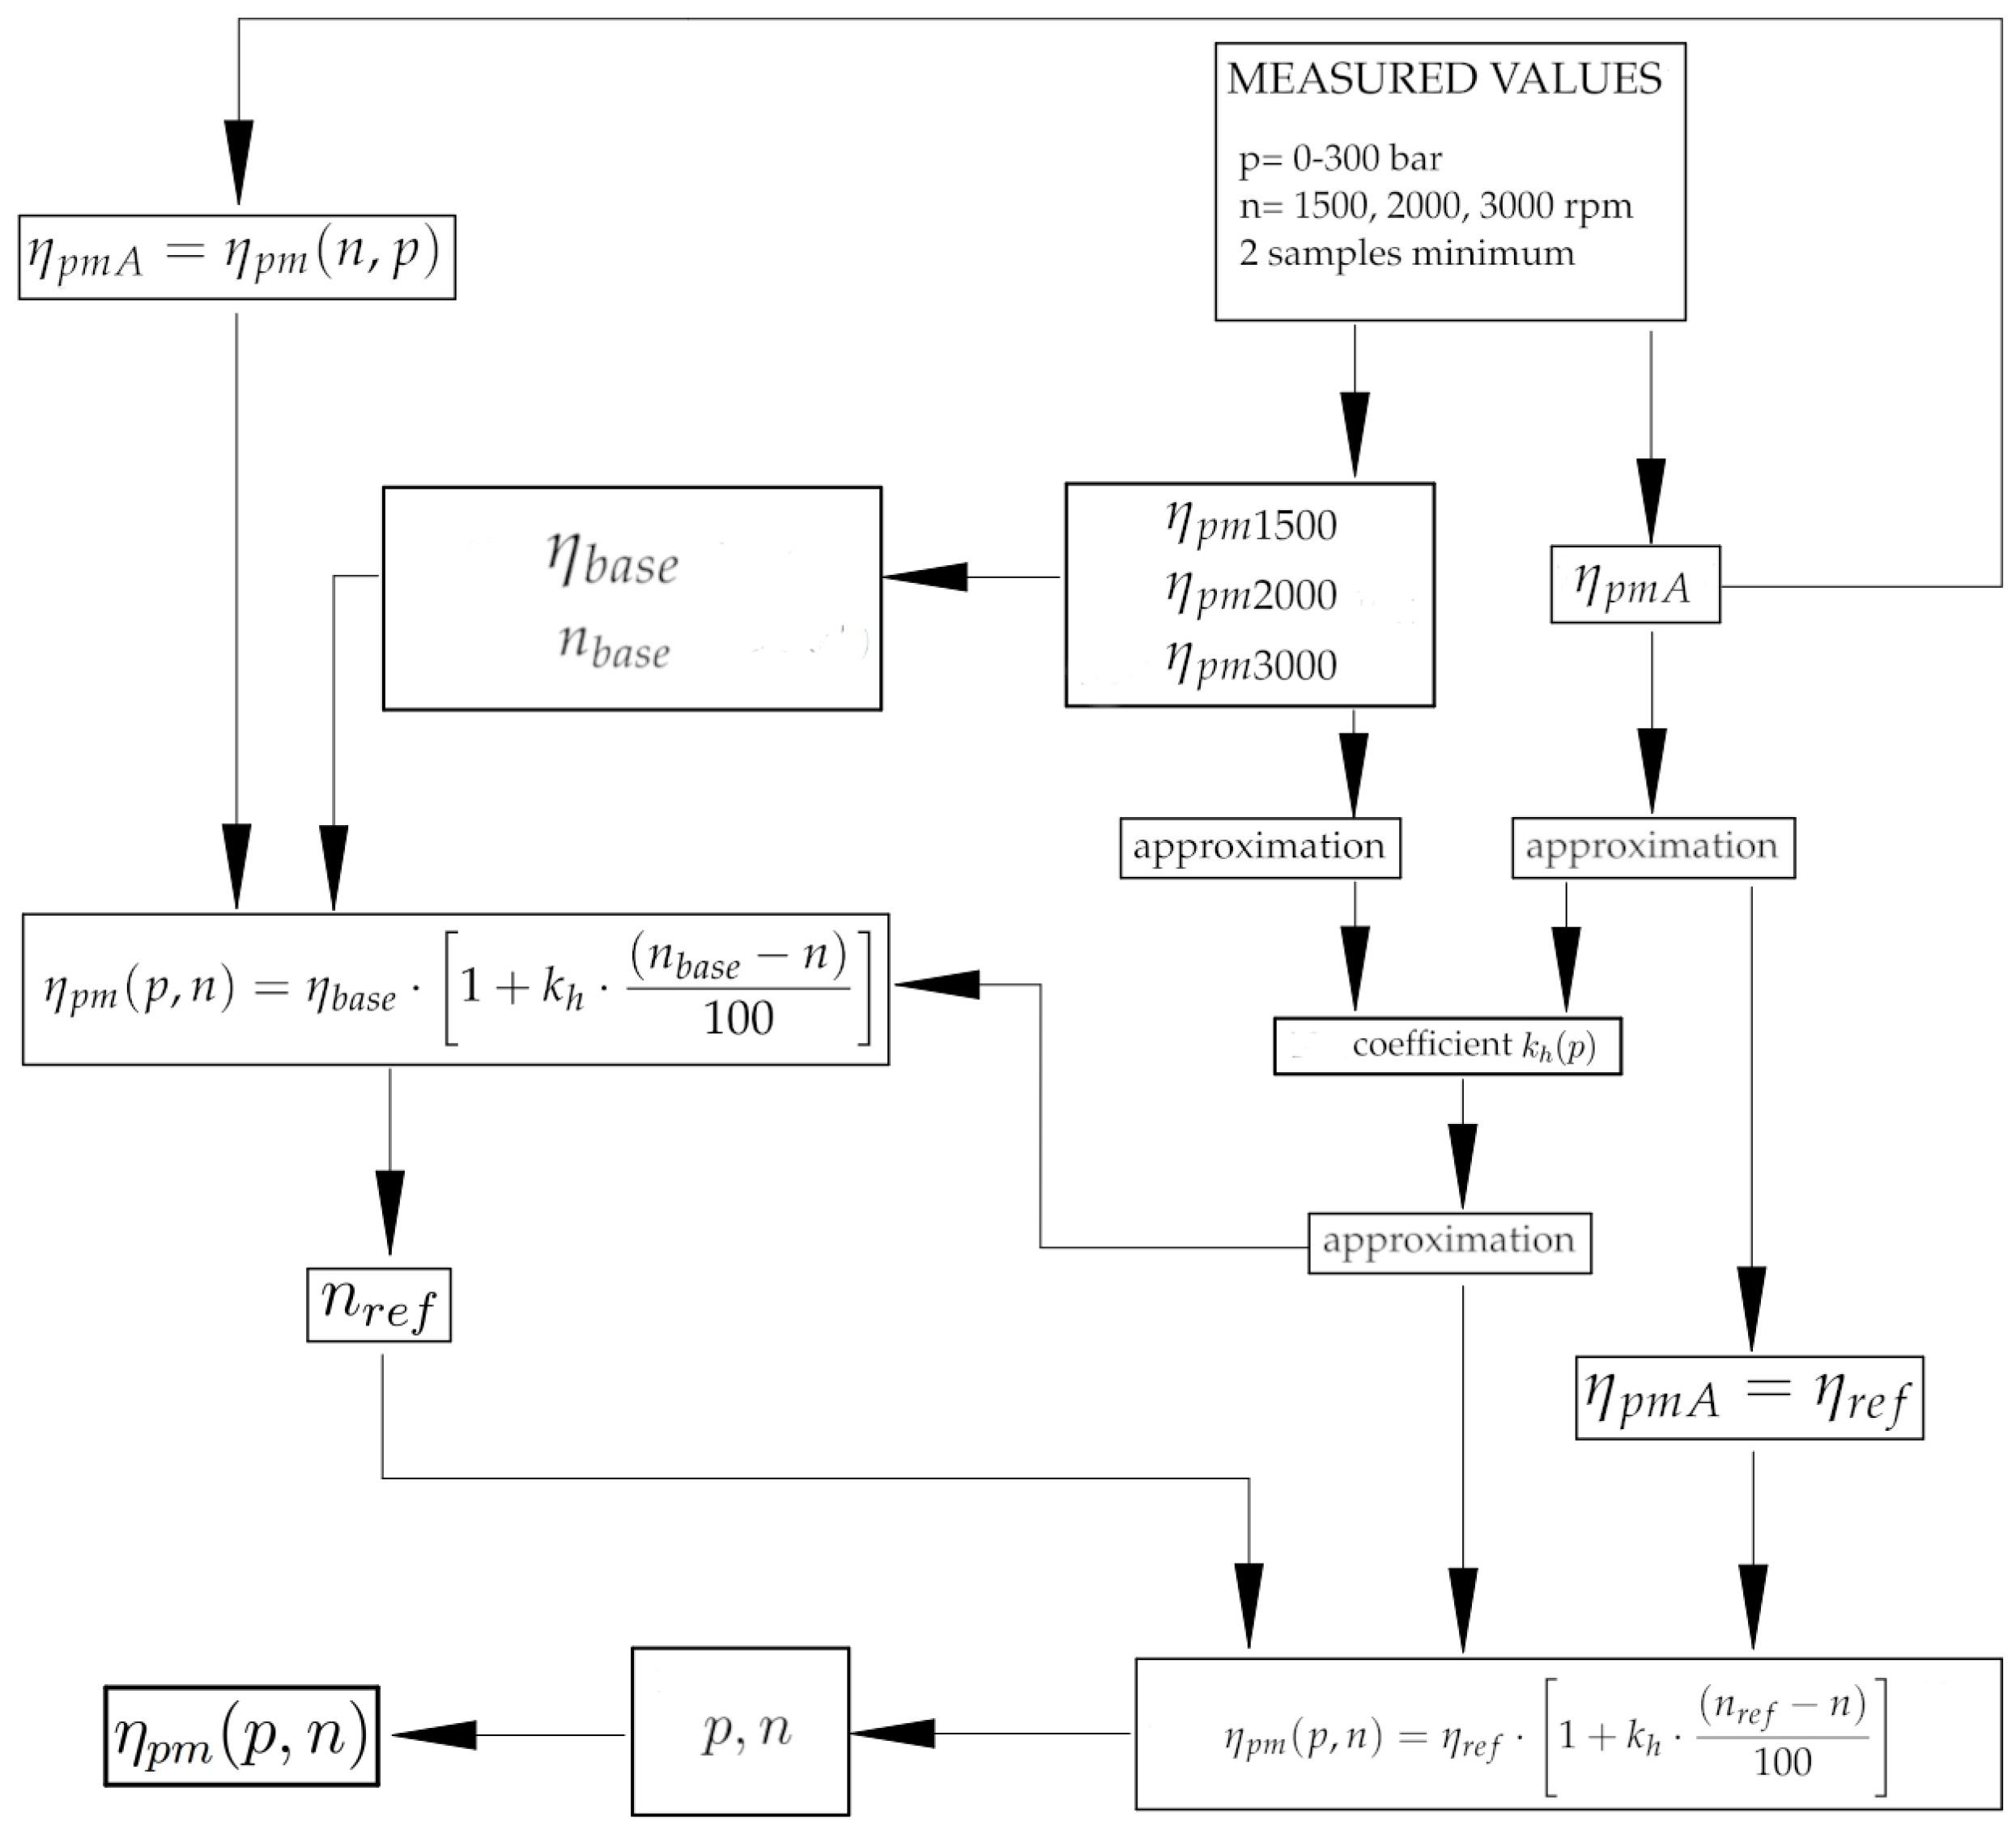
When pressure and speed are added to the final equation, the result is a calculated value of the pressure-multiplying efficiency. The model structure is shown in
Figure 4.
Thus, thanks to this model, there is a possibility to find optimal parameters at which the intensifier runs the most effectively. It is also possible to use this efficiency formula to suggest the best options in hydraulic circuits where the intensifier is involved.
The speed of the intensifier depends on its geometrical volume. A smaller intensifier will have a higher speed than a larger one, for the same input flow rate, and different speeds mean different efficiency values. Thus, there is a possibility to find the best option by changing the geometrical volume for a specific output pressure.
A better accuracy of the model could be provided by using more measured samples at the beginning to create the reference characteristic.
The precise values of polynomials described in the following description must be considered as unique for specific input values (measured values). Thus, it must be taken into consideration that the polynomials will change when the input values are changed, but the structure of the model remains the same. Moreover, as was mentioned in previous sections, the TB-divider and its values are described here as an example of the polynomial behaviour. The same process could be applied with different input values.
4. Overall Average Characteristic of Pressure-Multiplying Efficiency
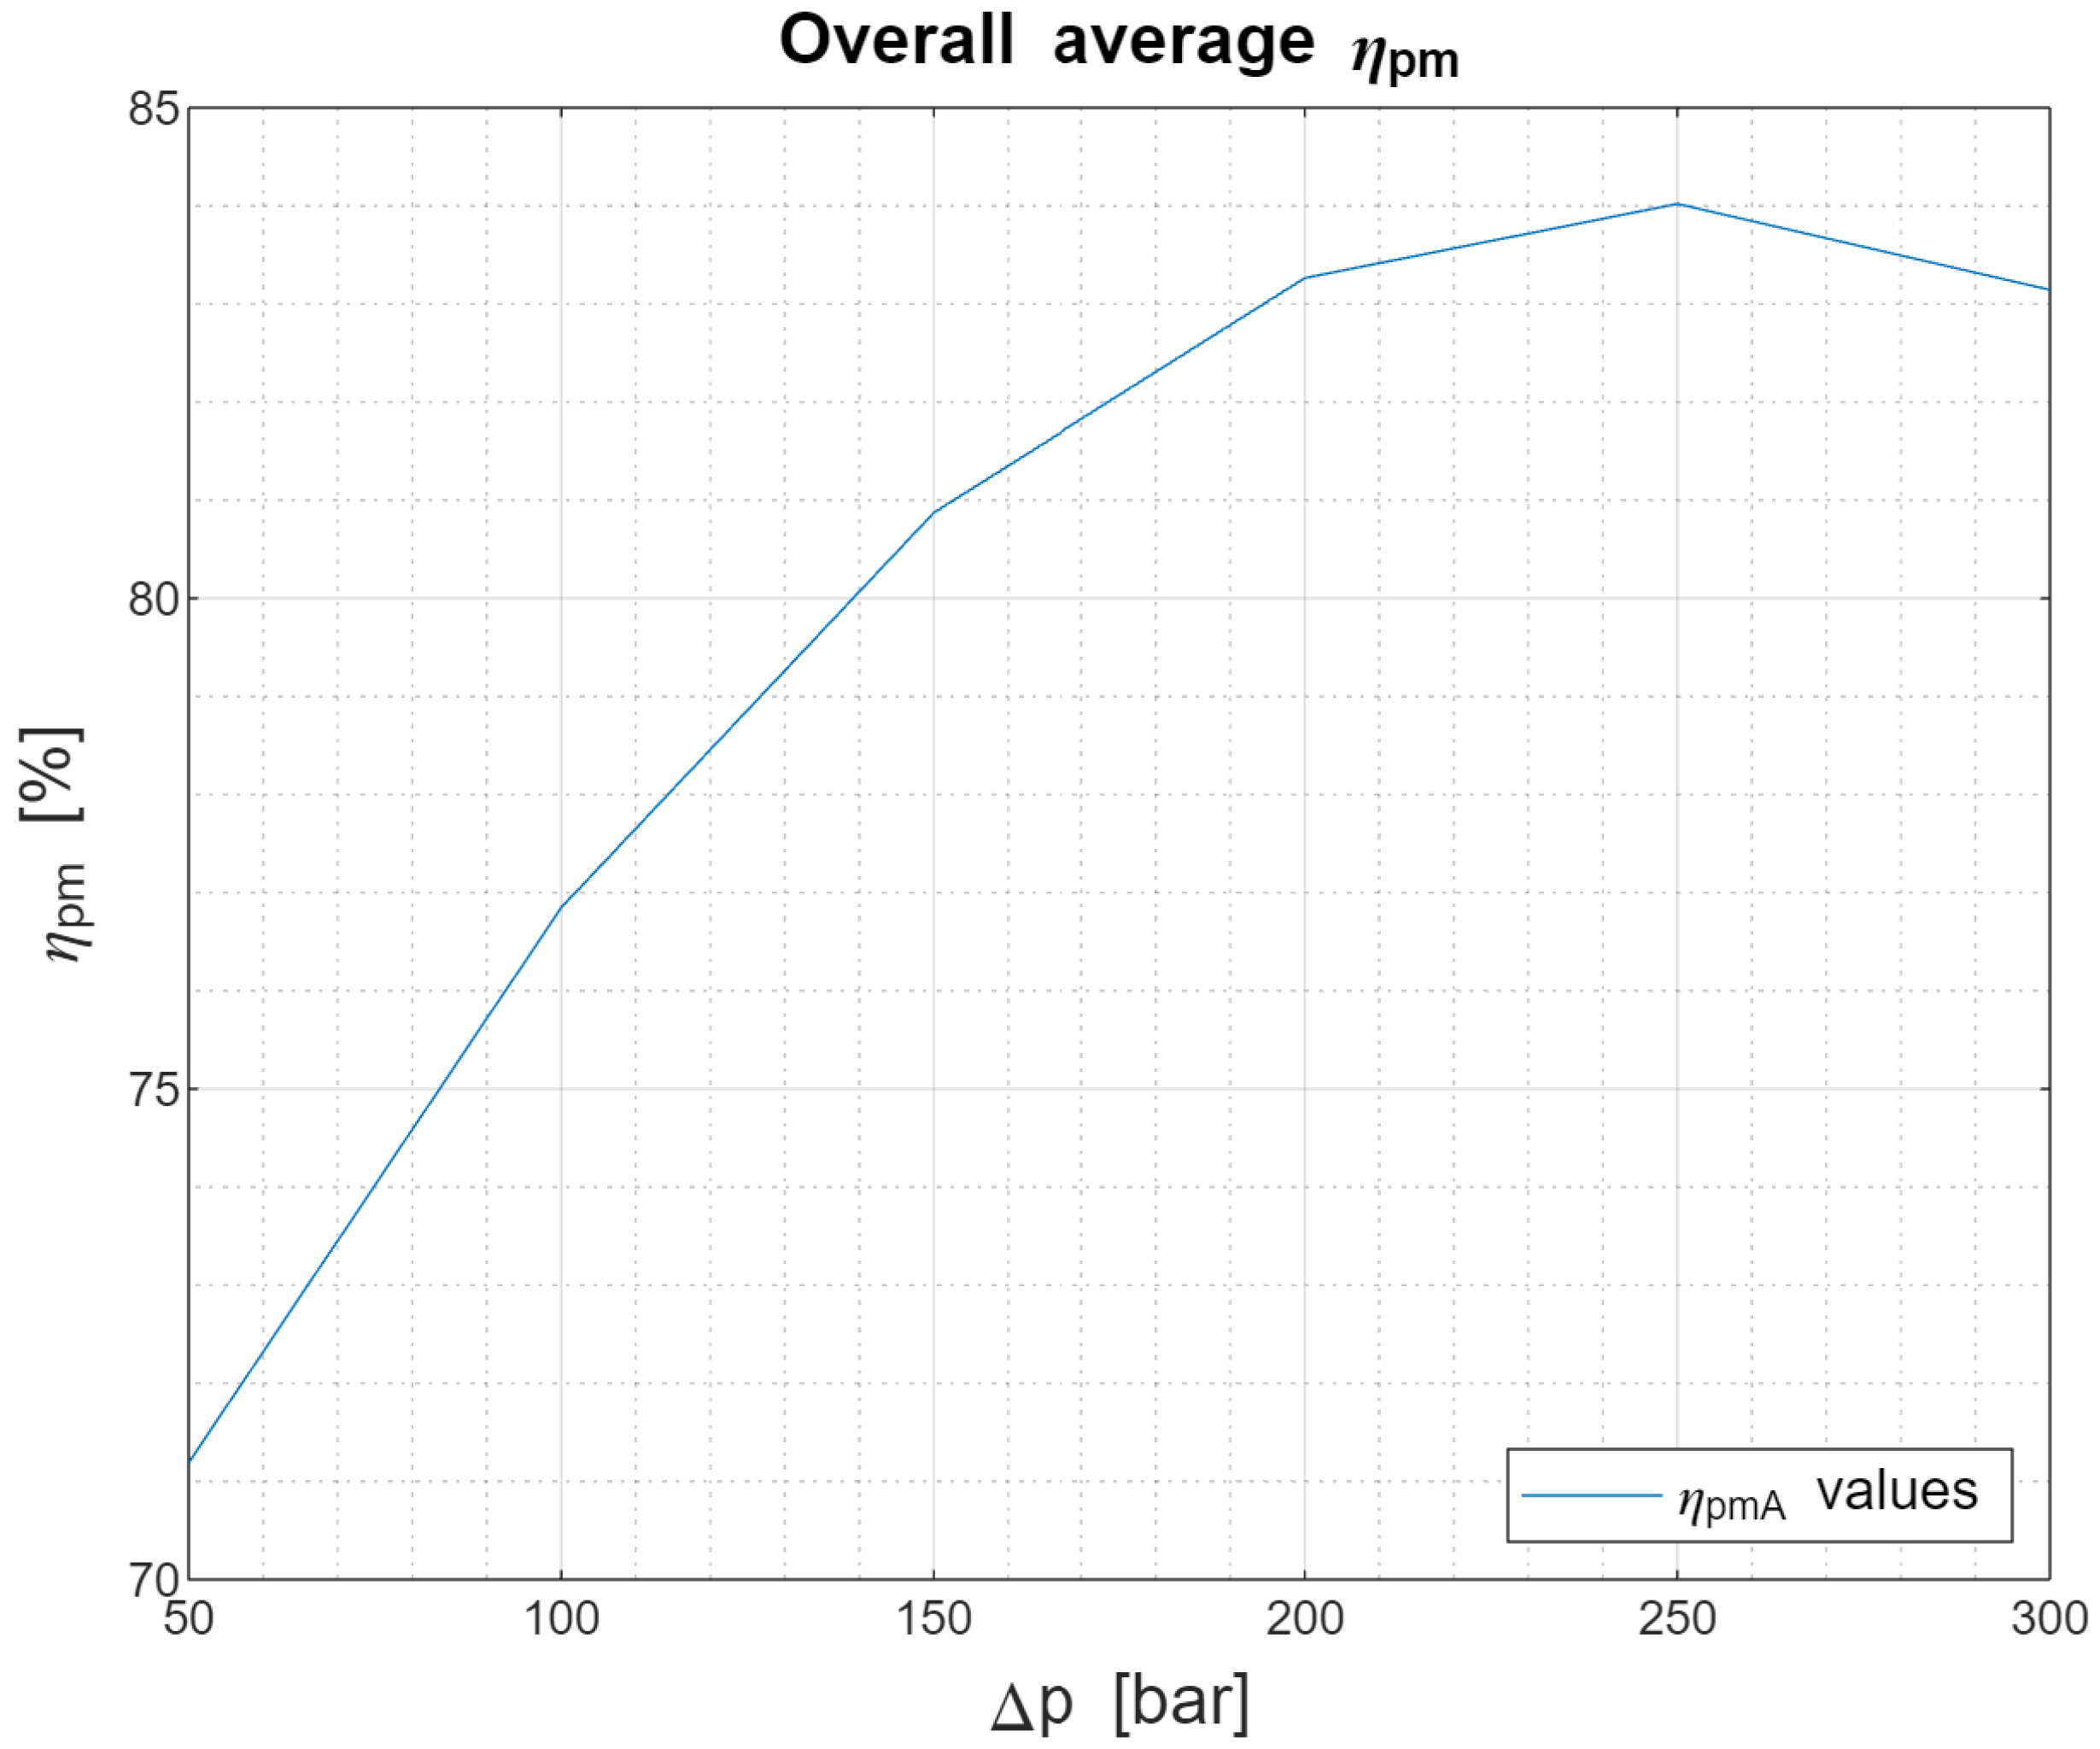
The first part of the pressure-multiplying efficiency formula was created using an approximated polynomial (
Figure 5) of the overall average characteristic of the efficiency. To create this characteristic, there was a need to gather measured data from different examples of pressure intensifiers. Samples were composed of different geometrical volumes and designs. Each of the measurement was proven to be repeatable.
All of the measurements are described in detail in article [
7]. The data were divided into categories of intensifiers: two-section, three-section, with thrust blocks, and without thrust blocks. The final characteristic was determined for each category separately. Their progresses were different, so their final prescription was not the same but depended on the technical design of various devices. Thus, the values in Equation (
4) must be seen as unique for specific input measured data.
At this point in this article, it is not important which data were chosen to examine the polynomial behaviour. As previously mentioned, in this article, a model creation with polynomials made from the data of TB-divider measurements is described. These polynomials will have different values when the input data change.
The average progress was also made according to the specific pressure loads (from 50 to 300 bar). The final polynomial is written in Equation (
4):
5. Dependence of the Development of the Polynomial on the Speed
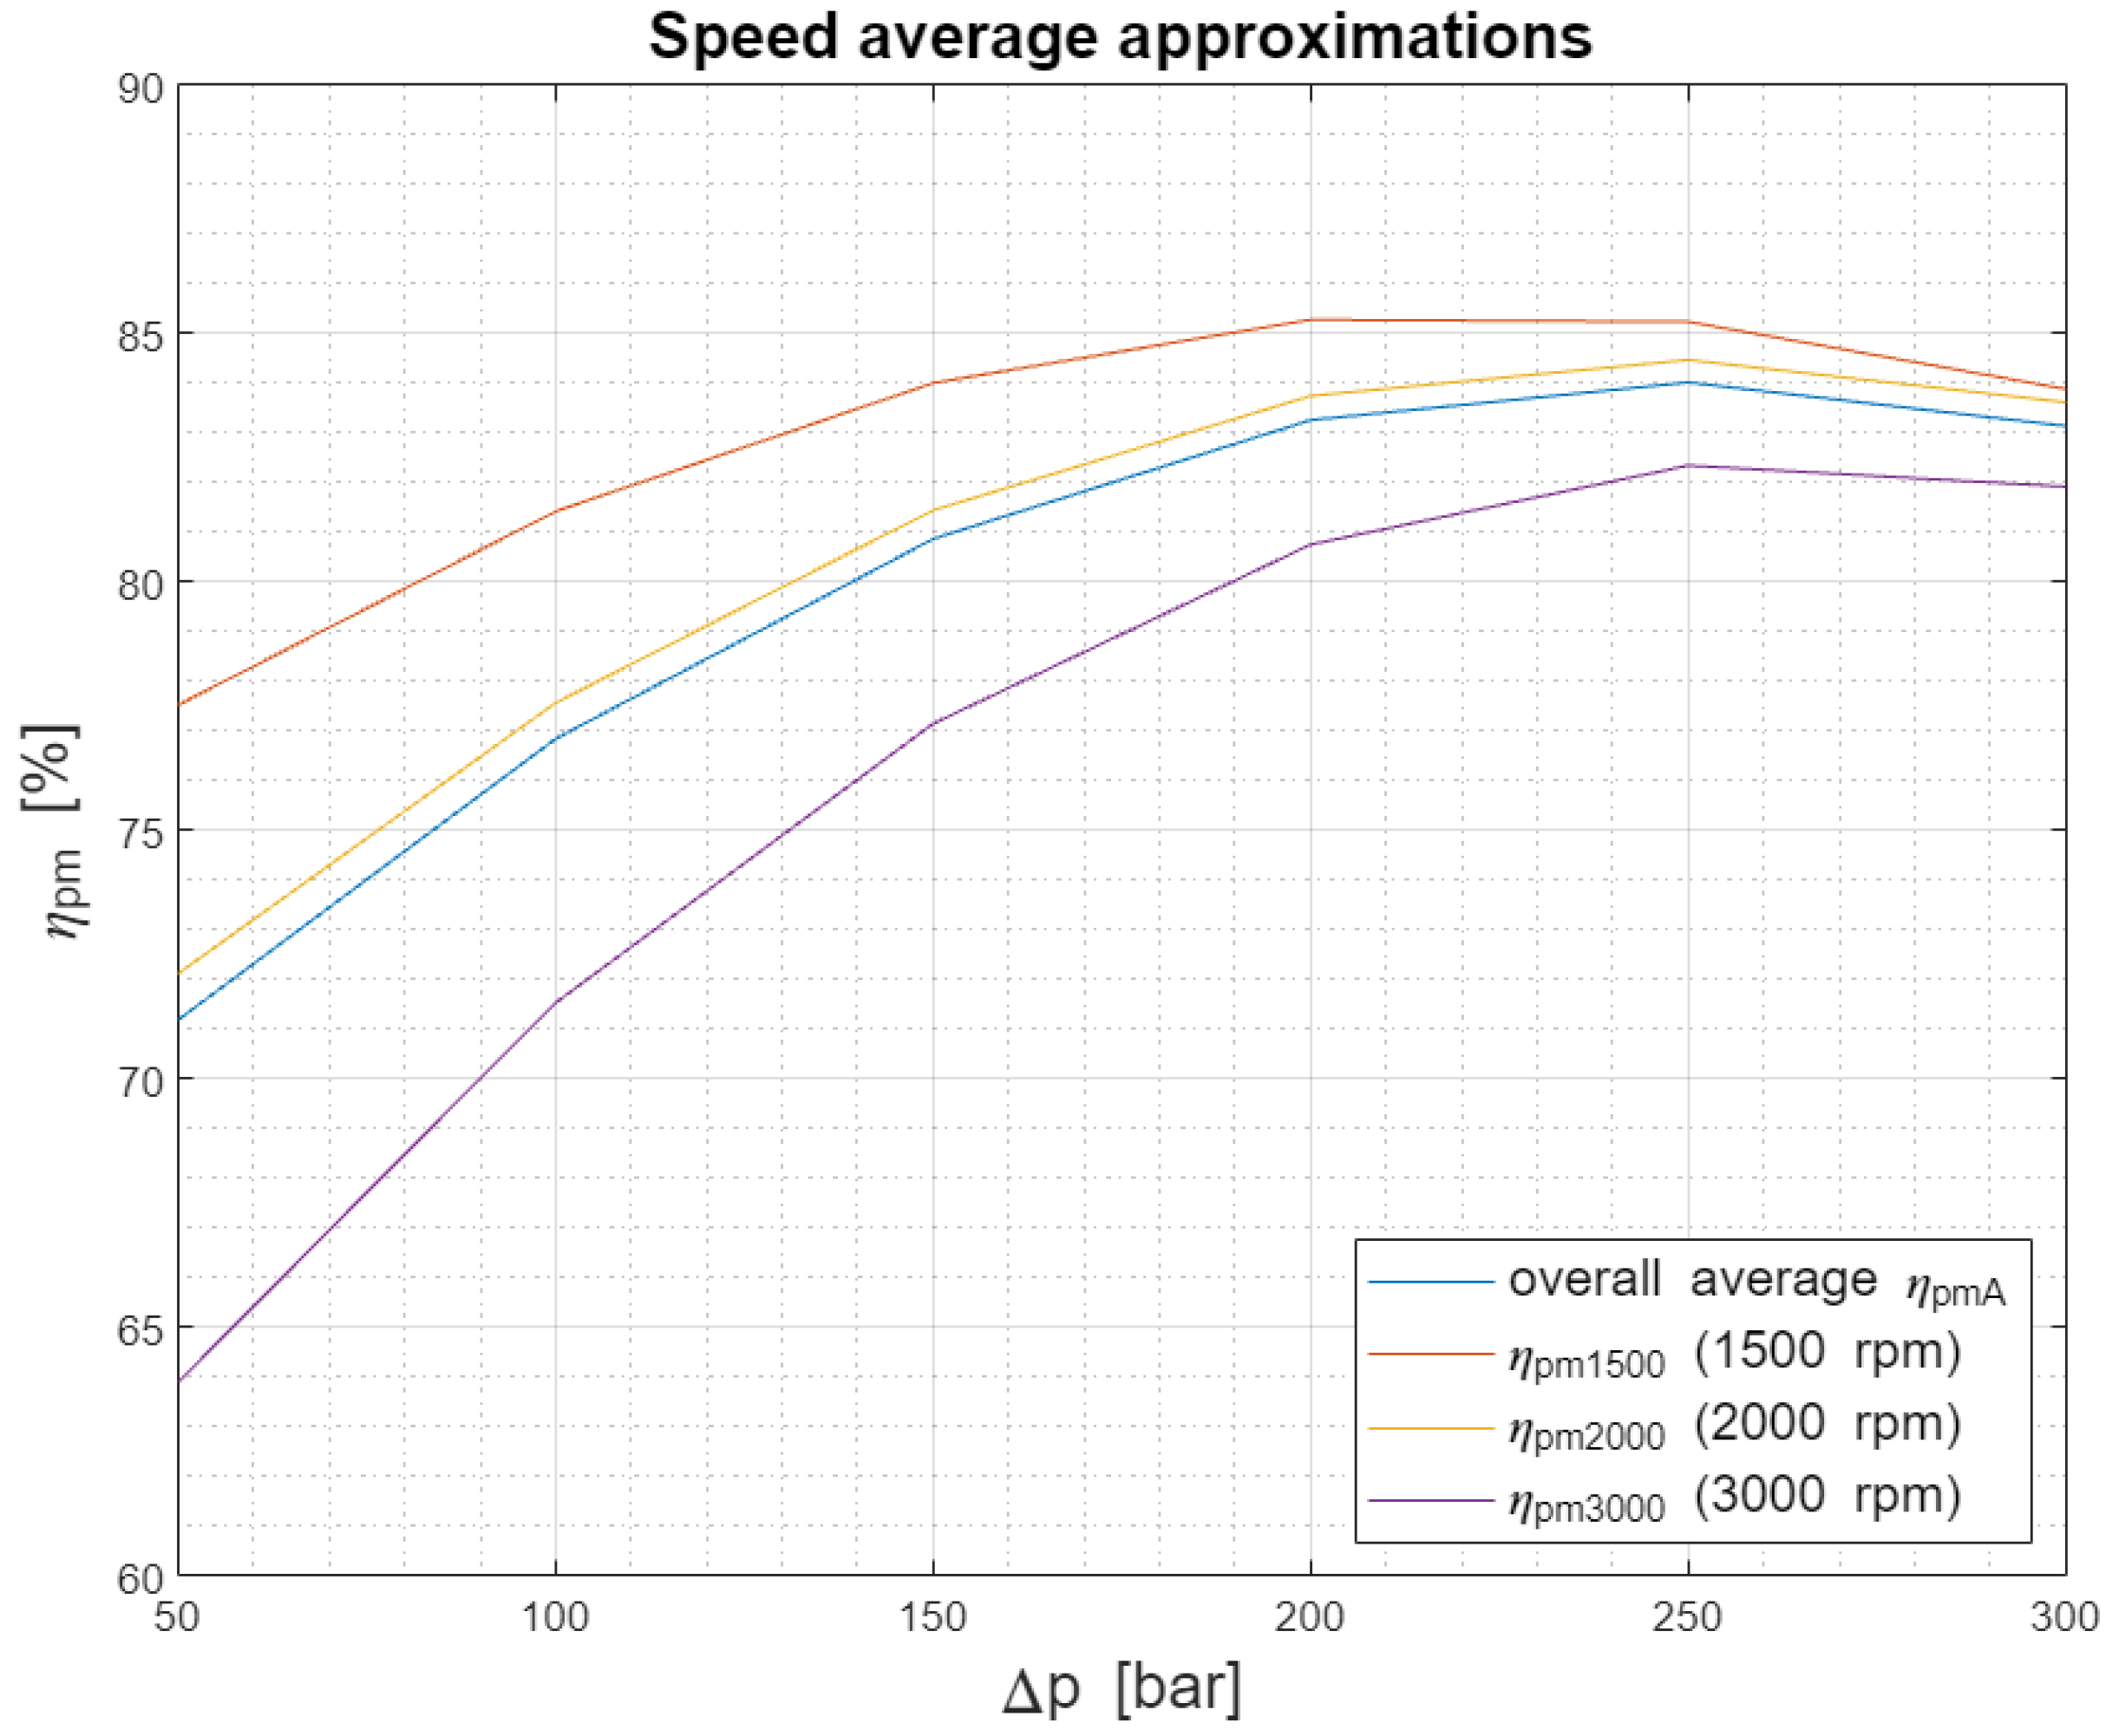
To develop another part of the final efficiency formula, there was a need to create average characteristics belonging to a particular speed of the intensifier. For every speed mode, there were characteristics from all the measured data. These characteristics were then approximated with a second-degree polynomial with a least-squares method.
These characteristics were the basic pillar to develop the second part of the equation. Compared to the overall average characteristic
, these characteristics were based not only on pressure values but also on speed. There were characteristics for 1500, 2000, and 3000 rpm in
Figure 6.
Thanks to these approximated values, a comparison was possible between the overall average and specific speed averages.
6. Coefficient
If there is a polynomial created for the overall average characteristic, a question is how to obtain from this point the efficiency value at a specific speed (e.g., 1500 rpm). The answer is the creation of a coefficient (Hradecky coefficient), which provides a proportional change of an efficiency value based on speed. This coefficient is basically derived from the ratio of the efficiency values.
Thus, there is a need to determine the ratios and , where the lower index represents the speed, and it is given for all the pressure values.
To get the actual values of an increase from the basic value, it must be subtracted from both ratios ( and ).
To get the comparable values of increases between the efficiency values, the second ratio must be divided by half: .
Therefore, these two comparable values of efficiency
increase were averaged. Thus, when the first efficiency value (at a lower speed) was multiplied by this averaged ratio, a new efficiency value would be equal to the efficiency at a speed higher than 500 rpm. Values for all the pressure levels are presented in
Table 2.
Thanks to these ratios, new efficiency values can be determined at an increased speed of 500 rpm. However, the goal was to have the ability to calculate the efficiency value at various speeds.
If there is a value of increase (or decrease) related to a change of 500 rpm, it is possible to divide it by 500, then the change will be related to 1 rpm. For practical reasons, we did not divide by 500 but by 5, so the final values were related to a change of 100 rpm.
Let us call this value (related to a 100 rpm change) coefficient
. It is a number that defines the proportional increase (or decrease) of efficiency value related to the speed difference. Coefficient
was defined for nominal pressure loads of 50, 100, 150, 200, 250, and 300 bar (see
Table 3).
For pressure loads not defined in the table, it is possible to interpolate the value with the help of neighbouring values, as it is a common practice for other coefficients defined by a table with specific values.
Generalization of for Various Pressure Values
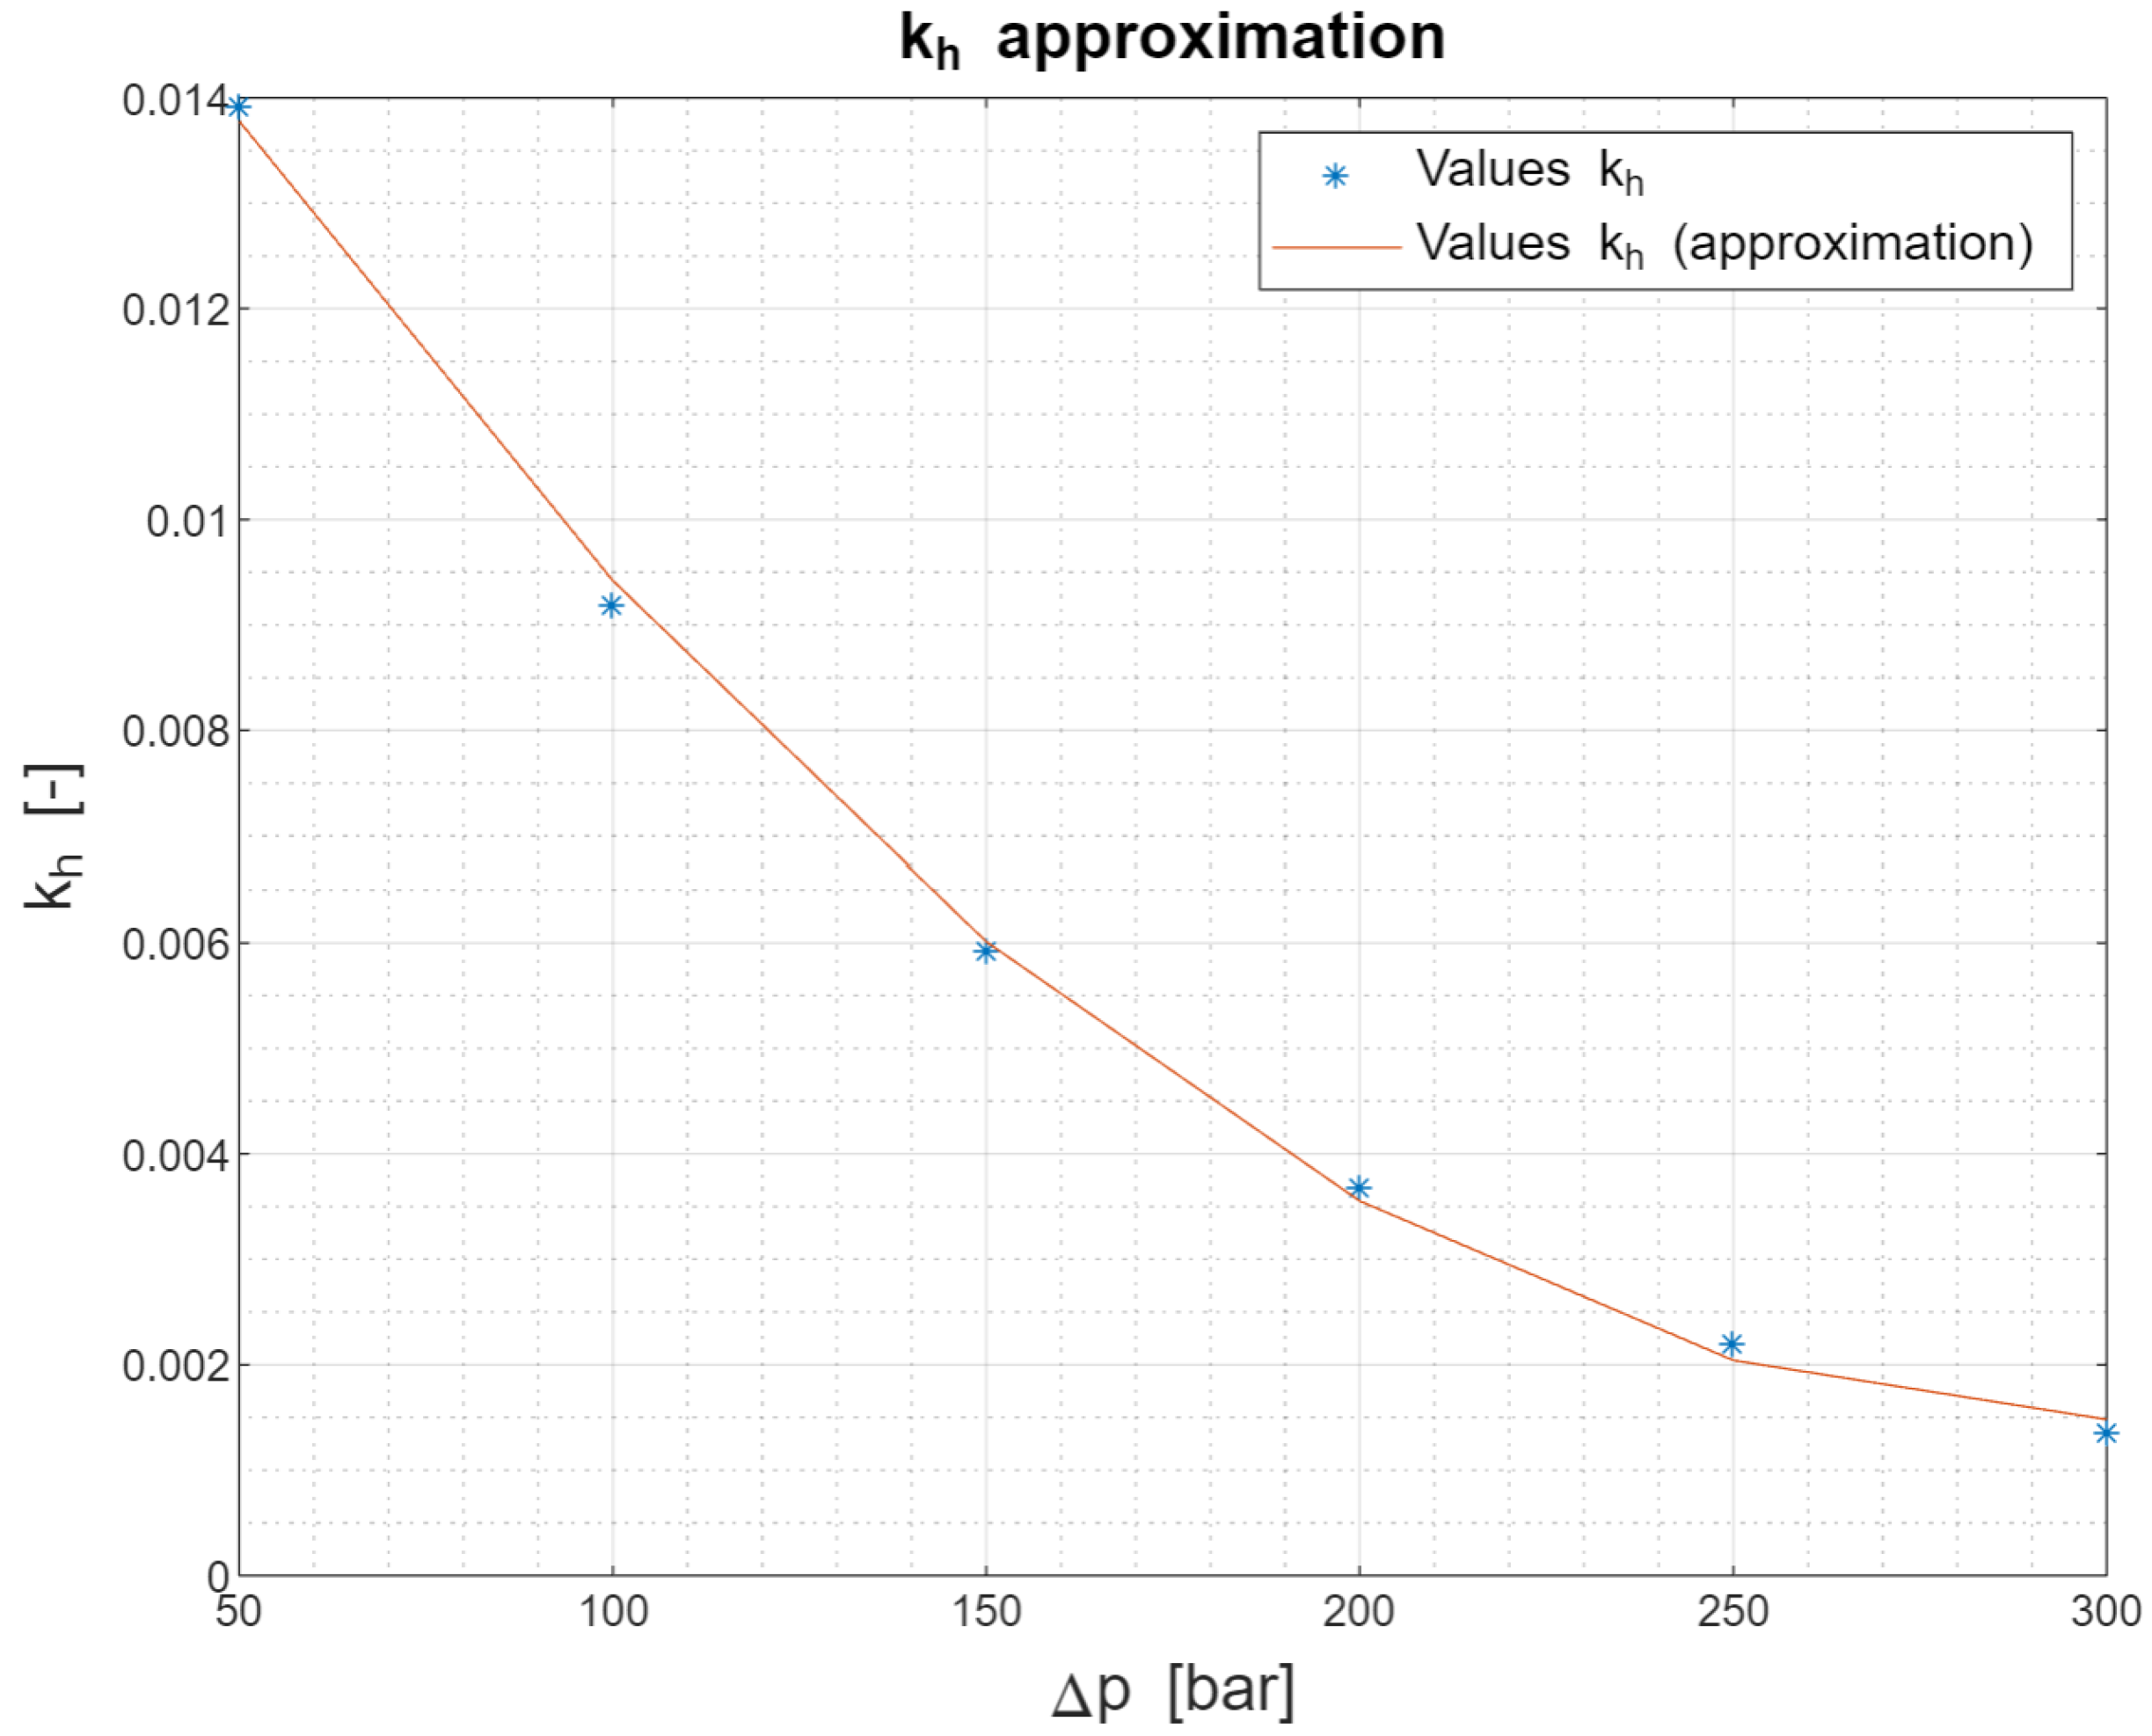
An alternative possibility for defining coefficient values for various pressures is by using a formula. In
Figure 7, the dependence of the
values on pressure is shown. If the values are fitted with a polynomial of the second degree, there is a prescription for the calculation of the coefficient value at various pressures and dependent only on the pressure.
The formula for this calculation was generated via Matlab in Equation (
5):
From
Figure 7, it can be seen that with an increasing pressure, the value of the coefficient decreases. In other words it is possible to say that curves of the efficiency in different speed modes converge to one common value (which is the average line of the efficiency) with the increasing pressure (
Figure 6).
7. Determination of the Reference Speed
Now that the coefficient has been determined, there is a known relation between the speed change and efficiency value change.
Let us define a formula which can be calculated for various efficiency values, by simply using pressure and speed (Equation (
6)):
Coefficient is already known. Pressure p and speed n are given (the pressure is required in the efficiency polynomials and in coefficient ).
There is a need to find the speed which belongs to the overall average curve of efficiency
. To do that, let us use Equation (
6). Let us say the overall efficiency
is
(and thus the speed
n is
). Now, to calculate any
, we need to start from some base curve of efficiency
.
In this scenario, there are three possibilities for substituting
. It is possible to start from a polynomial representing a specific speed (
,
,
). Thus,
is also known in all three cases and it is possible to write Equation (
7).
In Equation (
7), the only unknown value is the speed
(the speed which belongs to efficiency
). Thus, it is possible to transform Equation (
7) into Equation (
8):
If is substituted with the polynomials belonging to every speed (, , ), then there are three reference speed values for every pressure value. Taking their average, there exists a value of the speed that will suit the most the overall average efficiency at various pressure values.
After some calculations, it is possible to claim that the speed belonging to the average efficiency is defined by Equation (
9):
Now, the overall average efficiency characteristic is known as and its speed is also known as .
To use basic Formula (
6) for the calculations of any future efficiency values (at various speeds and pressures) the basic characteristic will always be just one polynomial, the overall average efficiency. Let us call it the reference efficiency
. Moreover, the speed belonging to this reference efficiency is called the reference speed
.
8. Final Formula
Thus, after defining the reference characteristic, it is possible to state Equation (
10):
The reference speed (
9) is now known and it is considered as a constant value. Thus, it is possible to modify Equation (
10) into Equation (
11):
To use Equation (
11) in this form, a specific value of the overall average efficiency for a specific pressure value would be required. In other words, one needs to substitute the value for
. The value could be, for example, read from
Figure 6. In that case, Formula (
11) would need more input values than the wanted pressure and speed values.
Therefore,
could be substituted with its polynomial prescription, which is directly dependent on the pressure only (Equation (
4)). Thus, it is simply enough to set the value of the pressure (Equation (
12)):
Now, the whole calculation depends just on the speed, pressure, and coefficient
. The coefficient could be substituted via a table or calculated from a graph (
Figure 7). In that case, there would be a polynomial describing the coefficient behaviour with the pressure (Equation (
5)).
Formula (
13) is the final formula for the calculations of the pressure-multiplying efficiency
. Only two values need to be known, pressure
p and speed
n. Then, the efficiency of the intensifier based on these two specific parameters can be determined.
Formula (
13) is the final formula generated from the specific input values (measured values). When the input values are changed, the polynomial values will also change.
9. Calculation Limitations
The whole Formula (
13) is based on measured data (then, basic polynomials are determined). The results of the calculations with Formula (
13) are guaranteed for the work range of an intensifier. The speed should be considered between 1500 and 3000 rpm, and the pressure up to 300 bar. Let us call this work range a safe range where efficiency calculations can be applied without hesitation. Prediction with unmeasured pressure and speed values via Formula (
13) is the subject of the next section. It should be noted, that every device has its limitations and when there are some predictions for its functioning outside the safe range, there should also be some verifying measurements provided.
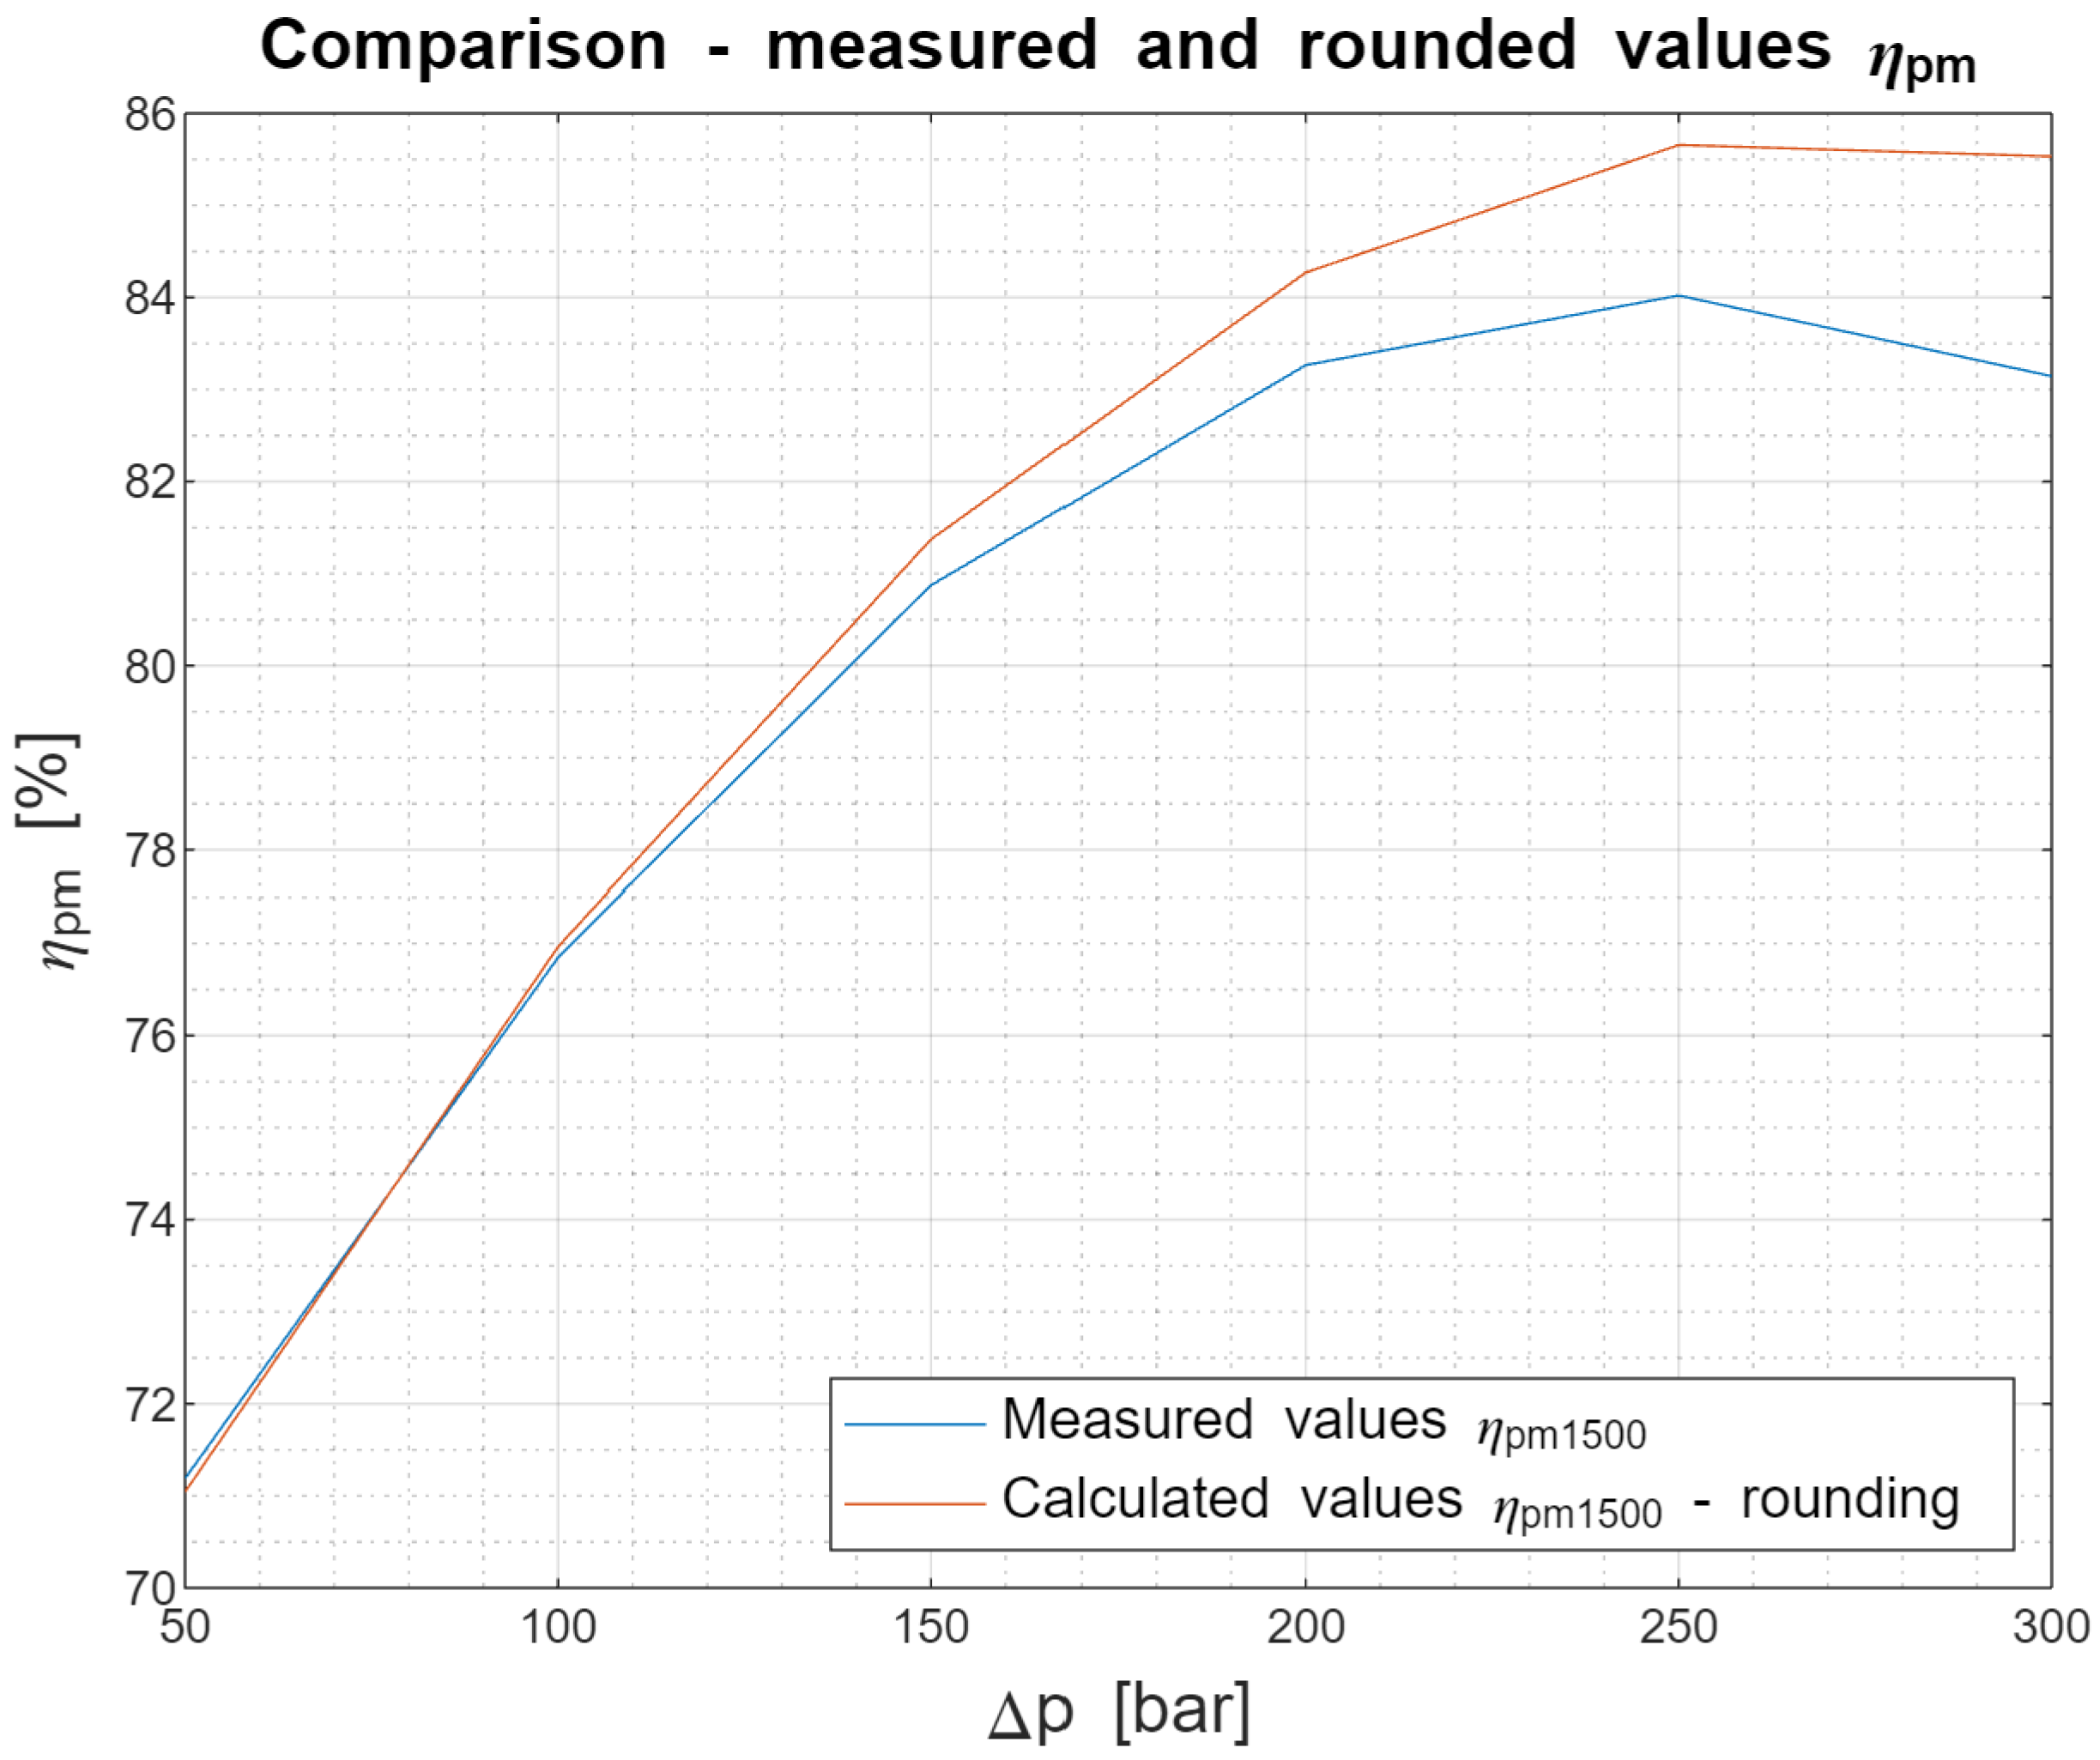
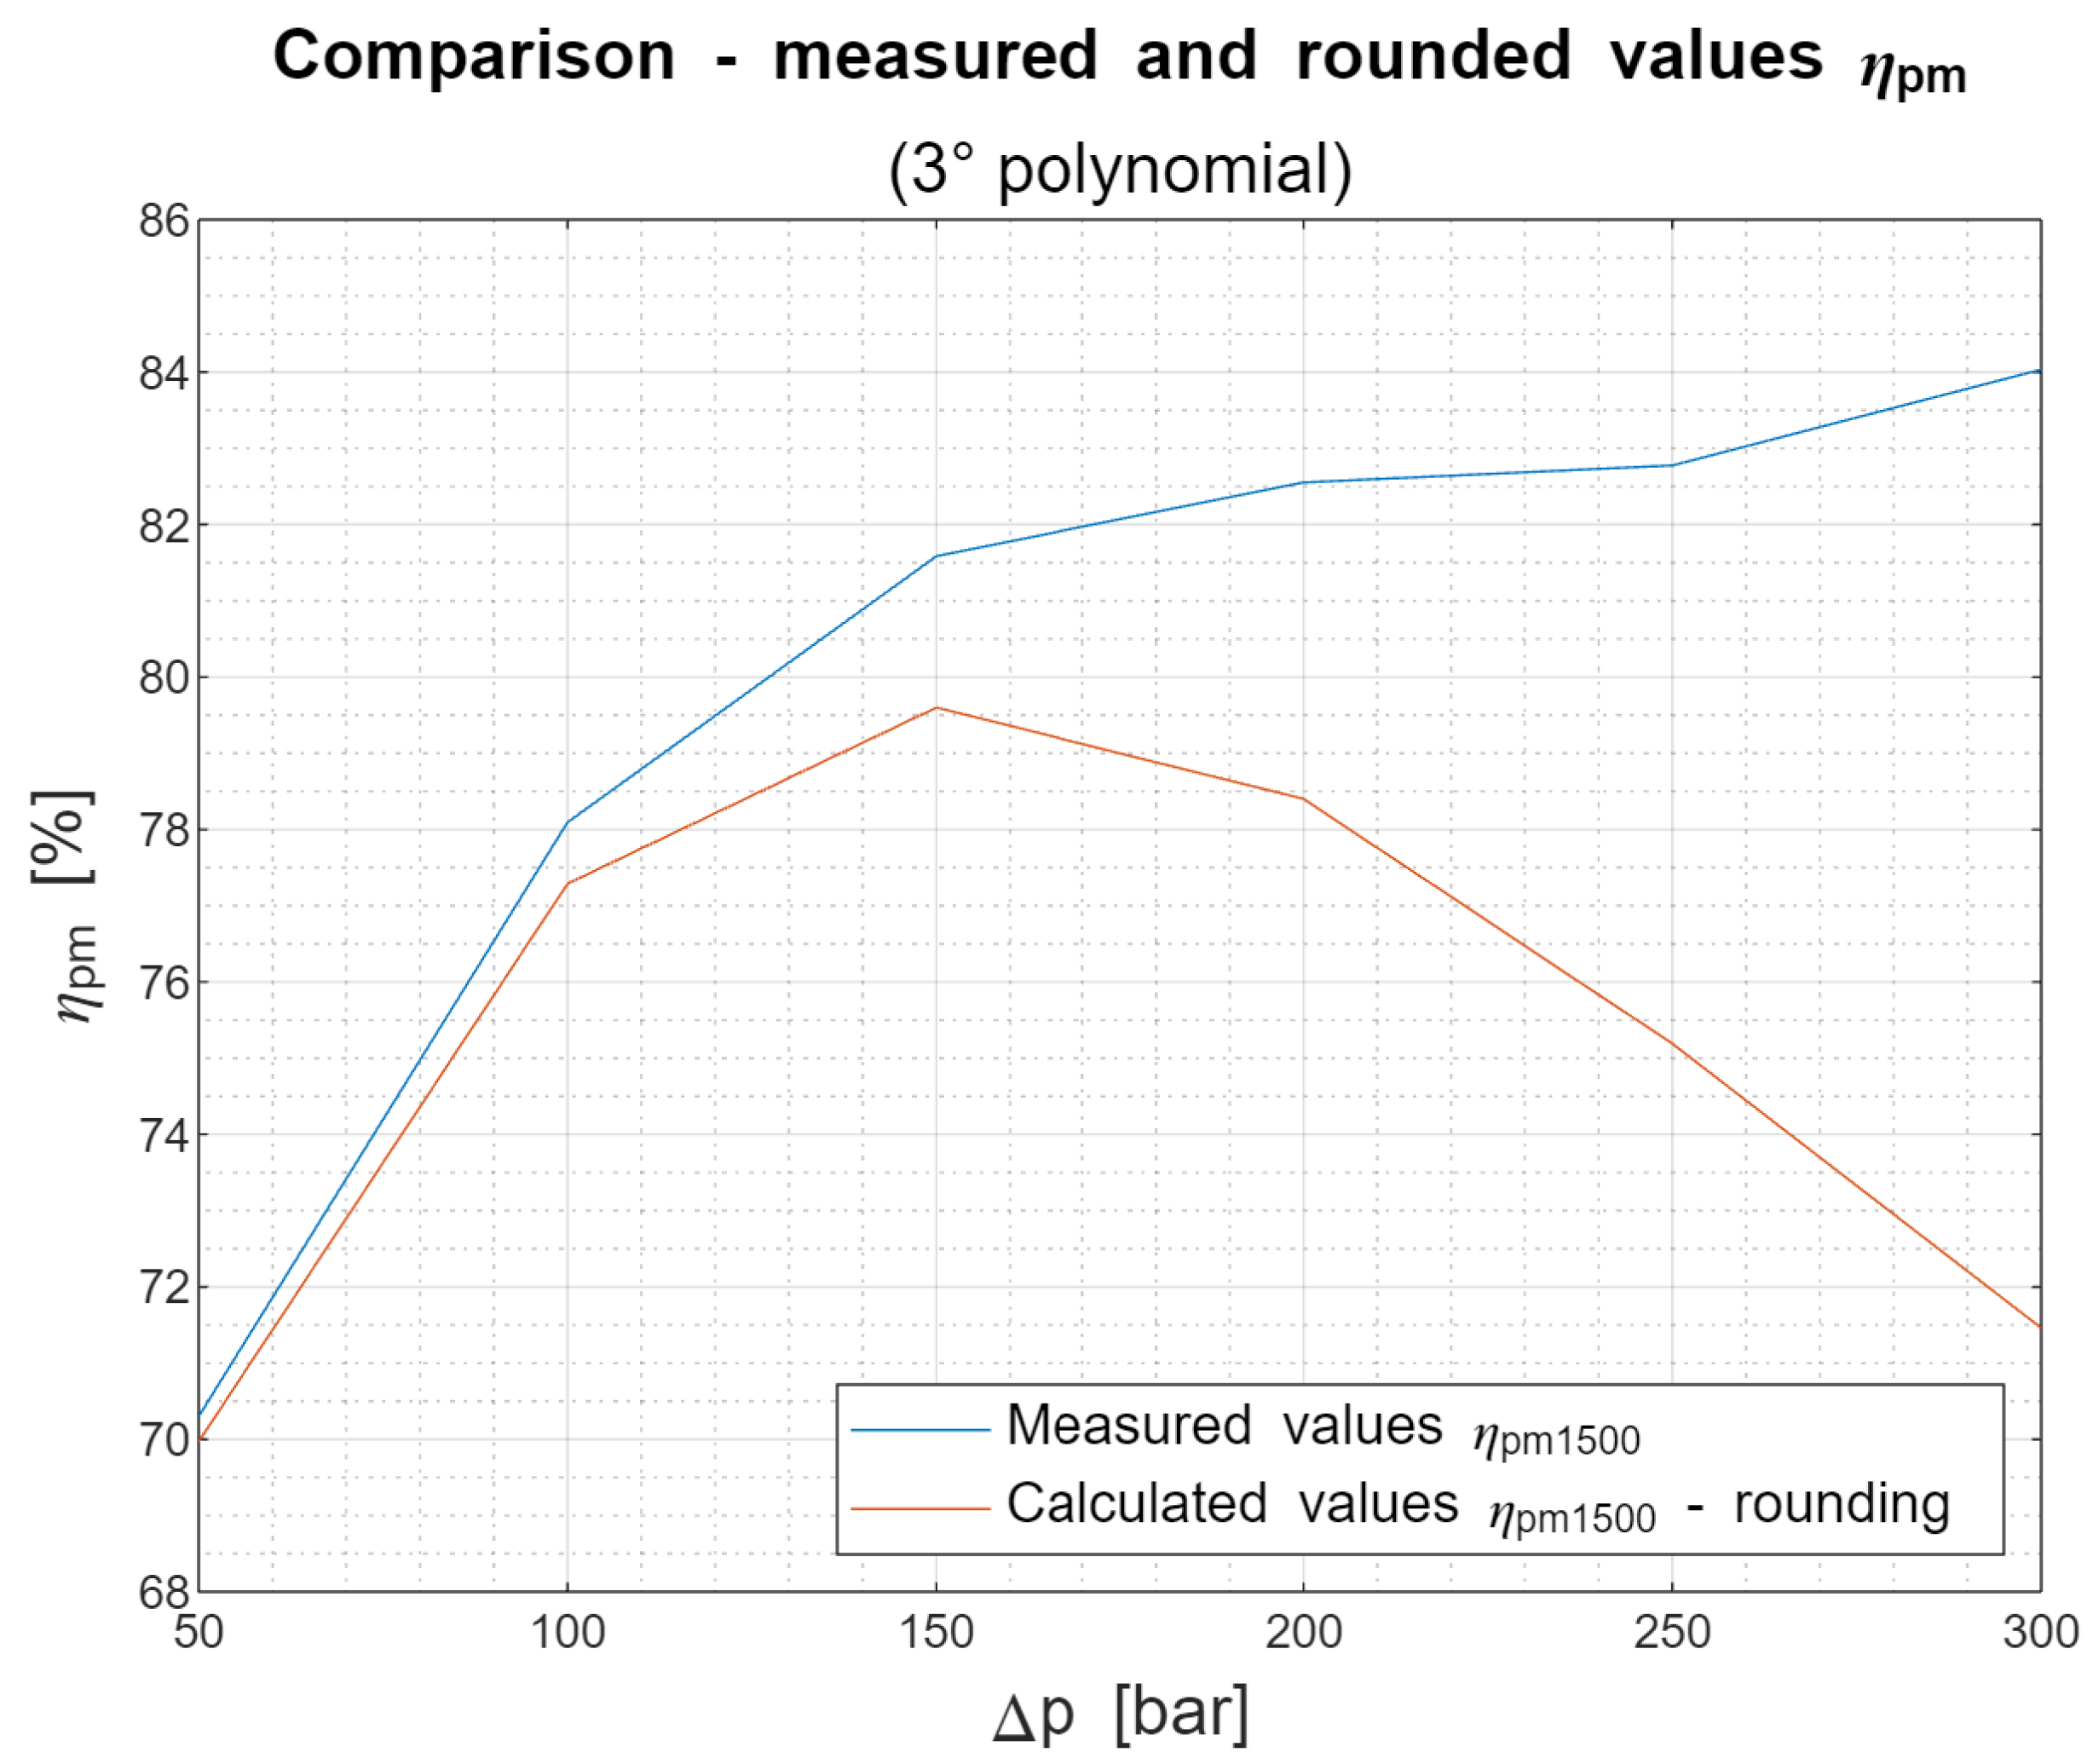
Moreover, a big source of calculation inaccuracies is rounding. If final Formula (
13) was calculated manually and the coefficients of the polynomials rounded to four decimal places, there would be a deviation of the calculated values from the measured ones, especially in the area of higher pressure. A comparison of calculations with rounding and measured values is shown in
Figure 8, where a difference up to one percent can be seen. Pictured are calculations at 1500 rpm.
There is also a deflection born during the creation of final Formula (
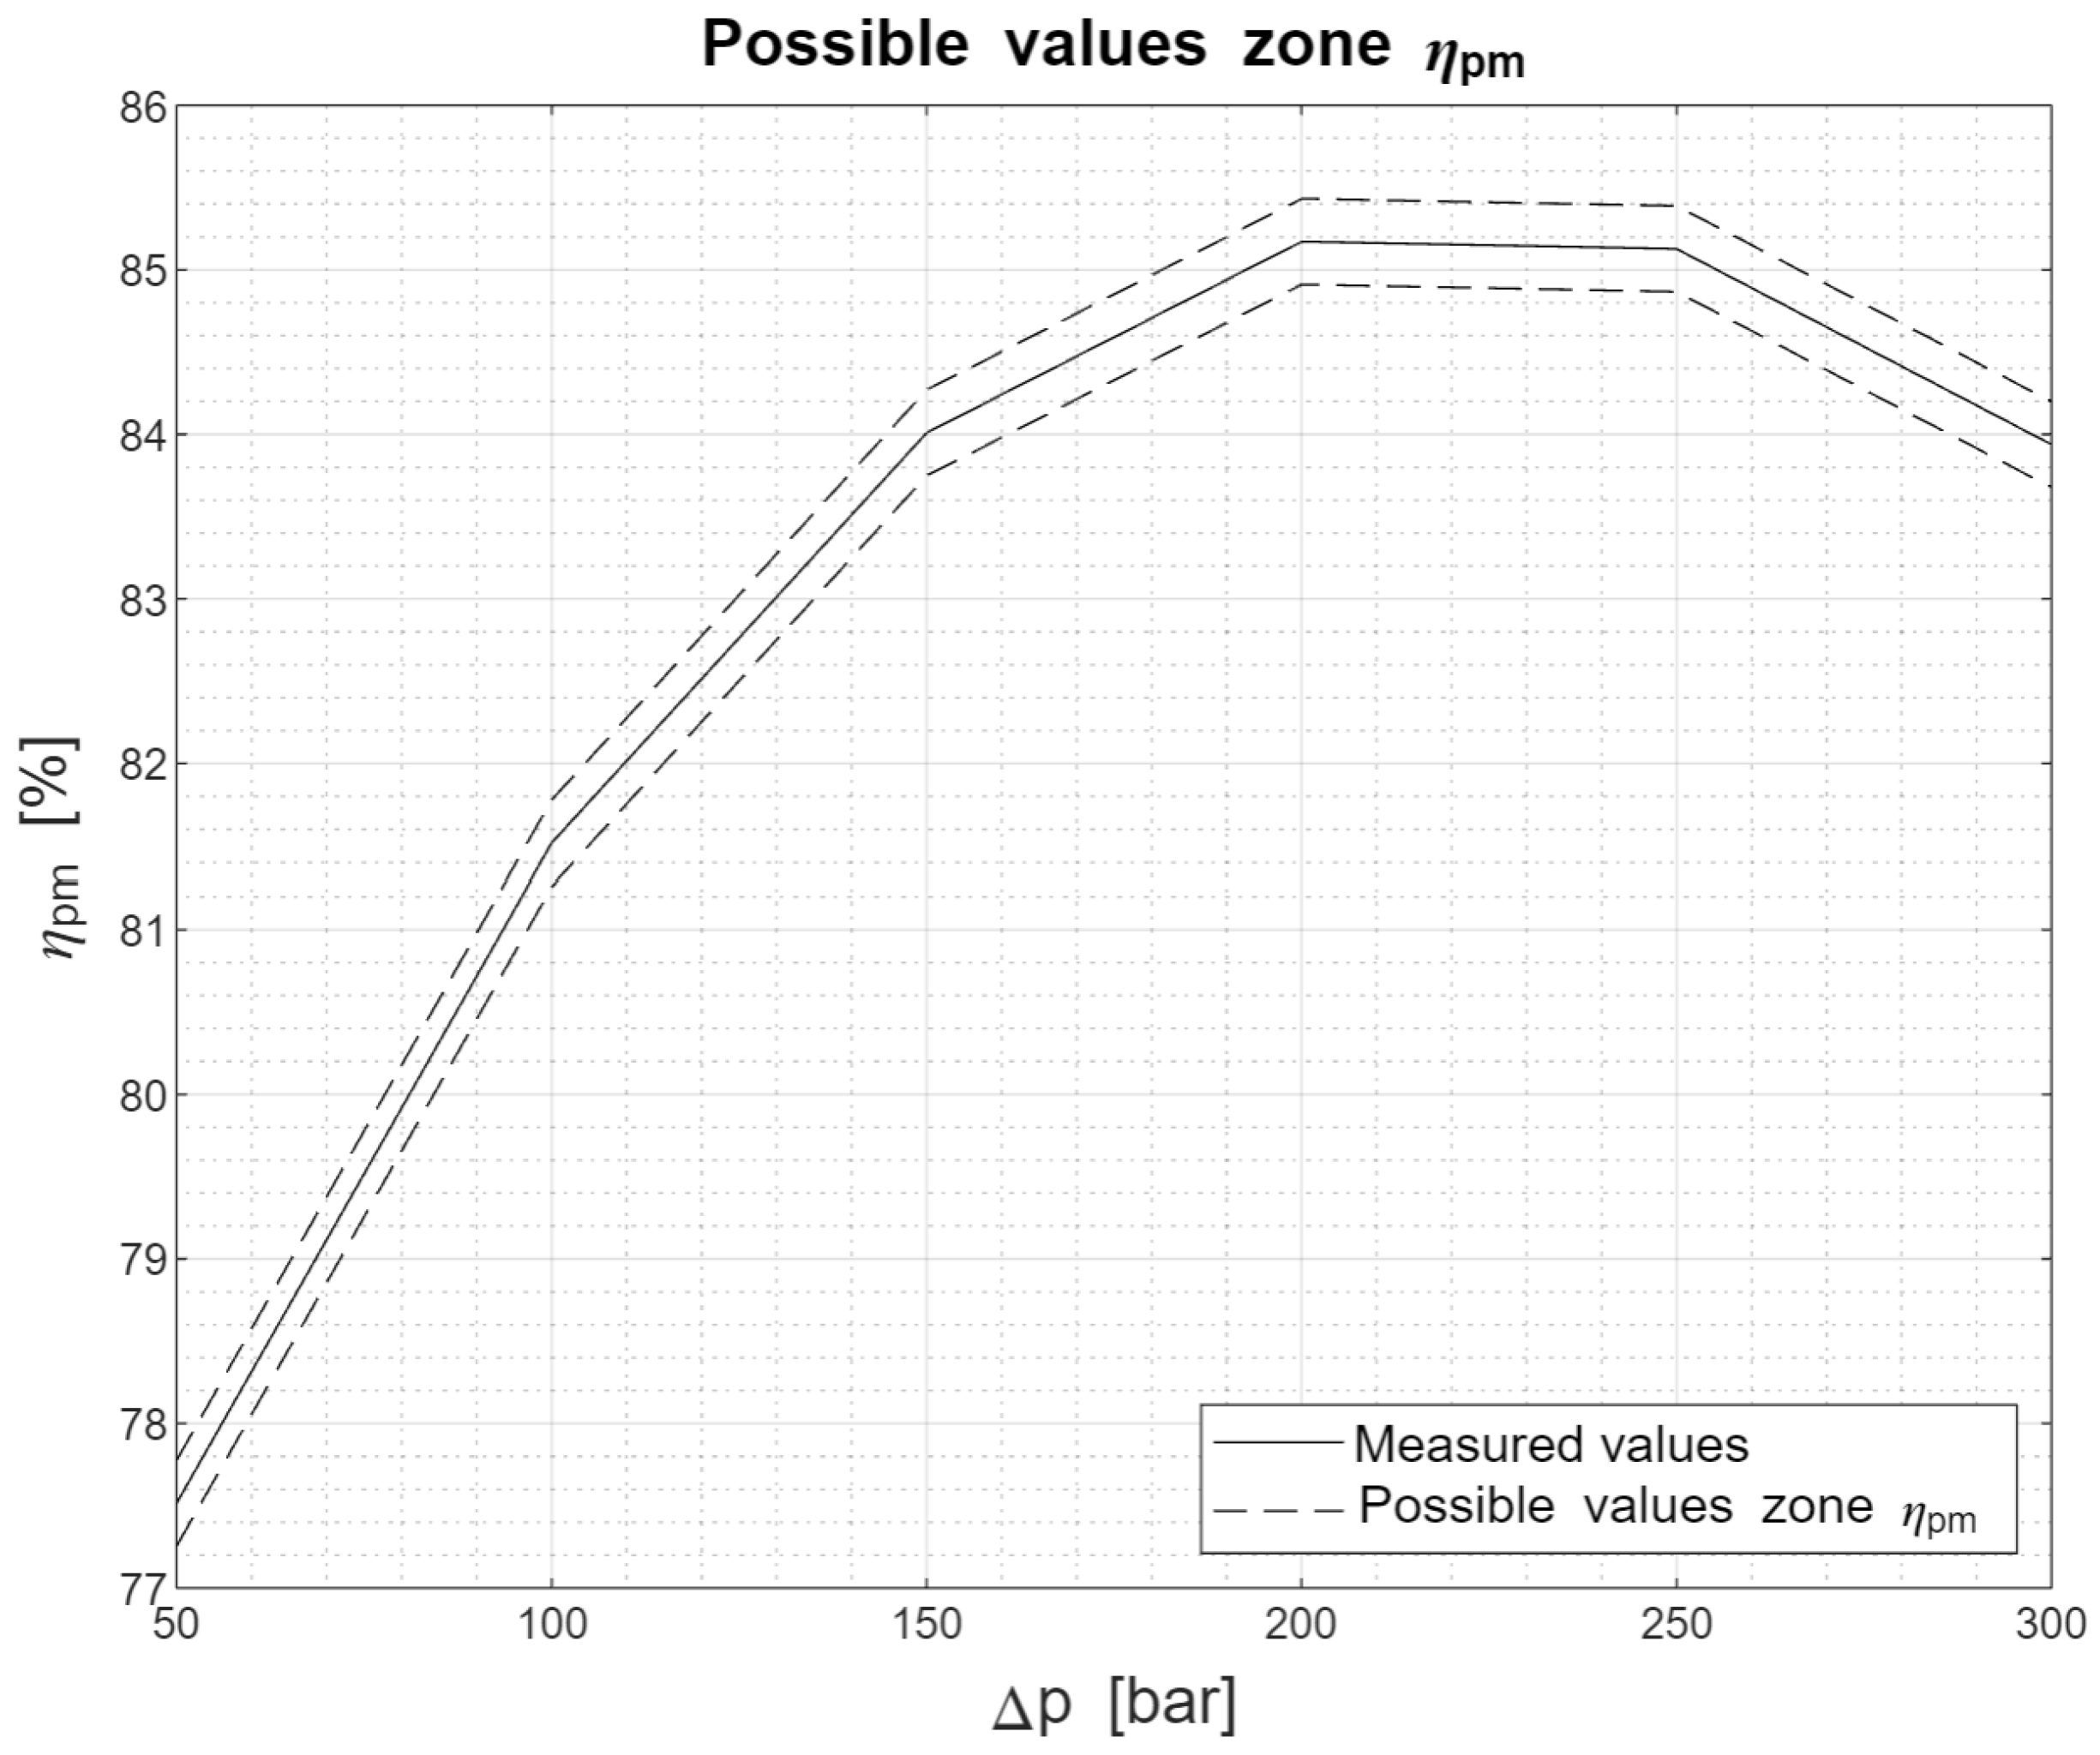
13). Inserted values (characteristics) were averaged from multiple measurements. Thus, it is necessary to consider the final calculated efficiency values with possible deflection. Measurements could be influenced by the manufacturing precision of a device, so two measurement values will not be exactly the same. Therefore, with this consideration, the final efficiency characteristic and its values should be considered as middle value, as indicated as an example in
Figure 9 with the possibility of peak values according to individual devices. As a result, it was established that the deviation from the final formula derivation process was up to
for the final characteristics.
Measured values were determined using the temperature of a working fluid in a range from 45 °C to 55 °C. Measurements were established with hydraulic fluids with viscosity VG 32 and VG 46, so the range of kinematic viscosity of a working fluid was from 30 to 50 mm2s−1. All measured intensifiers were used from the production range of Jihostroj a.s.
The calculations presented in this paper were based on measured data of intensifiers based on rotary flow dividers with thrust blocks. Intensifiers of different designs (without thrust blocks) have different characteristics for a given speed and pressure. However, using the calculations presented here, it is possible to use the measured data for intensifiers without thrust blocks and use them as input values to the calculations to create new formulas of pressure-multiplying efficiency for these different designed intensifiers. The whole procedure of derivation remains the same, including the derivation of the coefficient .
It is also possible to get more accurate calculations using third-degree polynomials instead of the second-degree one. Approximated values would be more precise and closer to the measured ones. However, for simplicity, the second-degree polynomials brings more than satisfying results. Using third-degree polynomials, there would not be any opportunity to use Formula (
13) and calculate it manually. Because of the necessary rounding, values would not respond to measured values as closely, which can be seen in
Figure 10.
The last reason to not use third-degree polynomials is that they reproduce the measured values too precisely in this case. The whole averages are based on the measured values and their average. If a measurement is too far from other measurements and is not removed, it could cause a great change in the averaged values. Thus, it could create some inflection points which should not be there. Thus, when using second-degree polynomials, they do not intersect the points precisely. This phenomenon will be useful in further investigations and the prediction of the efficiency value at higher pressure values.
10. Calculation of Efficiency Value in Unmeasured Parameters
Thanks to the model of the pressure-multiplying efficiency, it is possible to find a suitable efficiency value for various pressure p and speed n values. Searching for a suitable efficiency value can be useful especially when dealing with the efficiency of the whole hydraulic circuit. There is a need to consider all pressure drops and efficiencies for all the hydraulic components.
For example, if there is a need to save a 5 bar pressure drop and it is possible during the assembly to extend the dimensions of an intensifier, it is possible to use Equation (
13) and substitute a lower speed, which would be adequate for a bigger intensifier. Thus, the required flow rate would be the same, but the geometrical volume would be bigger; thus, the speed would be lower. Therefore, there would be an increase in the efficiency value, thus a reduced pressure drop. The question is, how big will the difference be for specific parameter changes. That is one of the reasons why we derived Formula (
13).
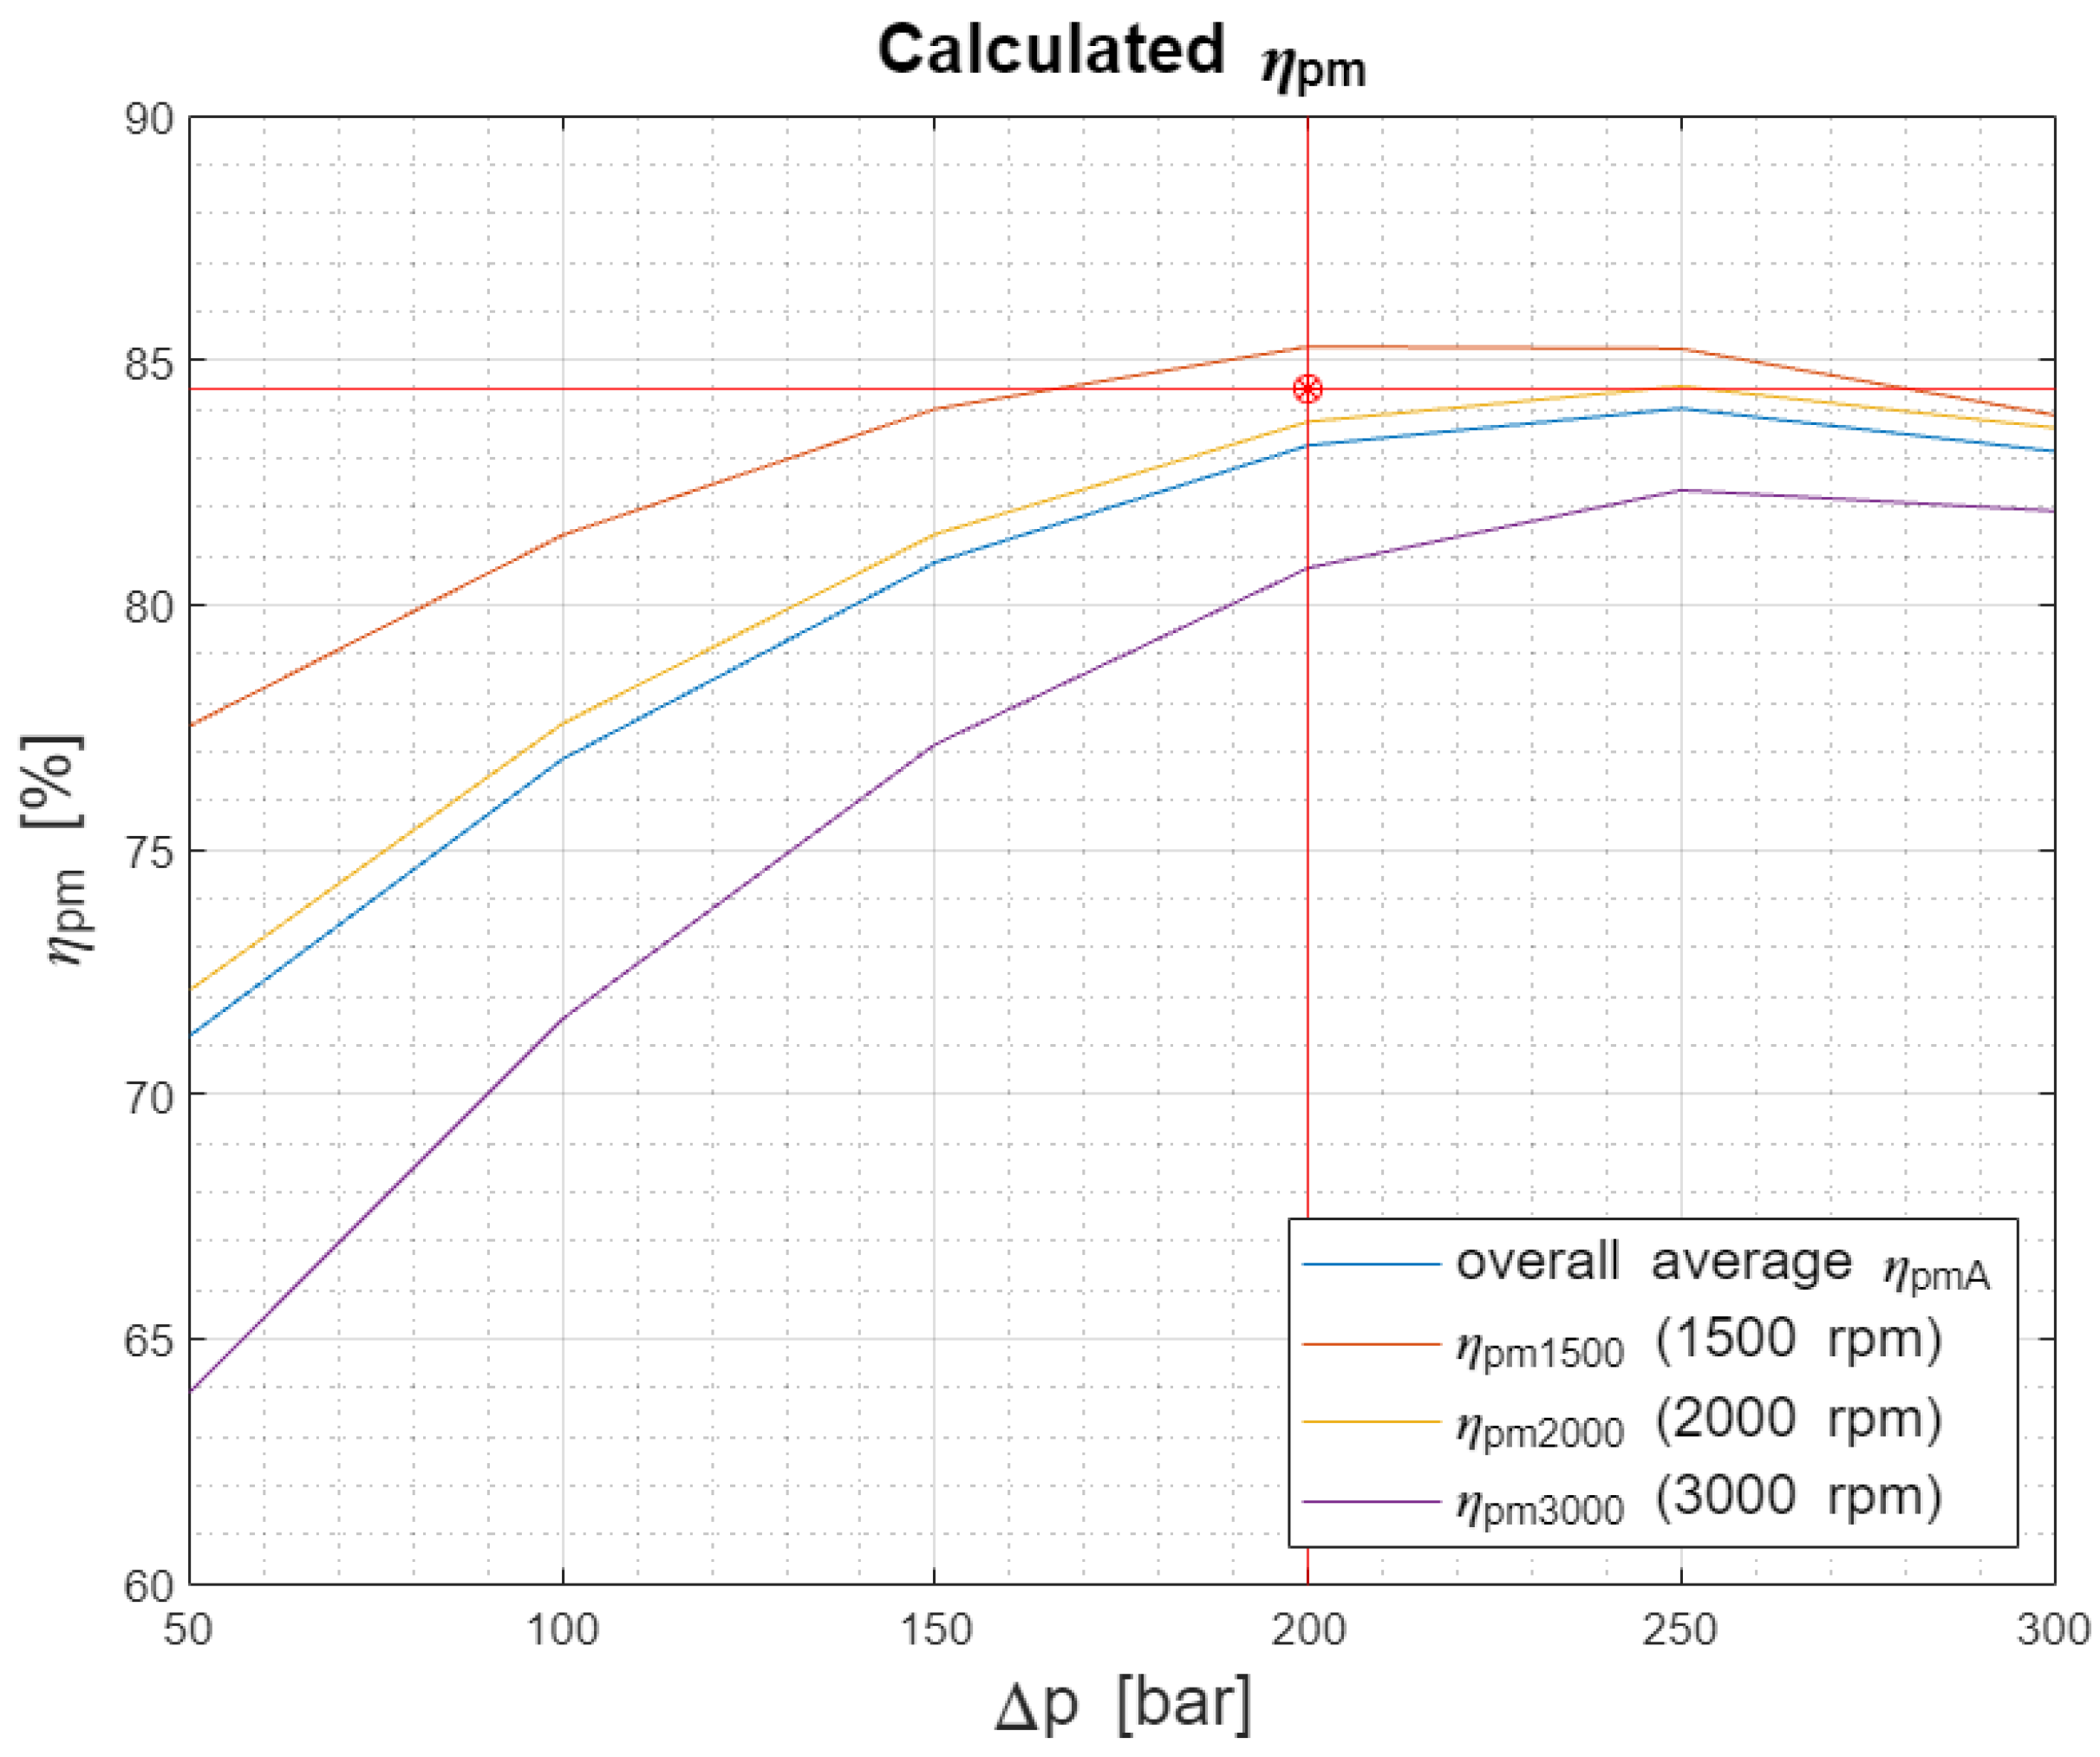
In
Figure 11, we show an example where there is a change of the intensifier’s speed
n from 2000 rpm to 1750 rpm during the same pressure resistance of 200 bar. An increase in efficiency
of
can be seen. The result from the calculation is displayed as a red point with a red cross. In the graph, the curves of the efficiency progress for different speeds are also displayed, so the difference in the efficiency value can be seen, when the speed is changed and calculated.
It is also possible to have a change in load and thus a change in pressure in the hydraulic circuit, and simultaneously, there is a change in flow rate (thus a change in the speed of an intensifier). Using new parameters and Formula (
13), it is possible to very quickly know how big the difference in efficiency will be due to pressure and speed changes.
In
Figure 12, a result from the calculations is displayed as a red point. The figure pictures a decrease of a pressure from 200 bar to 130 bar and simultaneously, there is a requirement for a linear hydraulic motor to extend more quickly, so the flow rate has to be higher, and the intensifier’s speed is also changed from 1500 rpm to 1800 rpm. Thus, as can be seen in
Figure 12, the result from the calculation is a decrease of the efficiency value of nearly
.
In
Figure 11 and
Figure 12, the new calculated values of the pressure-multiplying efficiency
(red points in the graphs) were derived without a need for new measurements, testing, or response to other parameters.As a result, it is possible to claim that it is convenient to use the derived model for pressure-multiplying efficiency calculations to get results and data about this efficiency when the run parameters are changed.
11. Prediction of Efficiency at 400 Bar
Until now, we used borders for the calculations at maximum pressure p = 300 bar, which were maximum values measured during input measurements. These calculations served especially to determine the efficiency values for unmeasured parameters.
Into the model for the pressure-multiplying efficiency, that is, final Formula (
13), values with even higher previous restrictions can be substituted. According to this, we can look into the behaviour of an intensifier running at pressure values higher than 300 bar. For the prediction, we chose a value of 400 bar because of potential applications in the industry [
7].
Before the prediction calculations, we need to decide the aim of the result. When the prediction is required to be valid for the whole range of intensifiers with thrust blocks, it is convenient to include all the input data from all the measurements. However, it will then be necessary to account for a higher deviation when compared to one measurement of a specific intensifier.
If there is a wish to predict more precisely, and the prediction is narrowed to just one specific type of intensifier, it is convenient to use input values just from the measurements of that specific type of intensifier. We should also note that polynomial values from final Formula (
13) will be slightly changed (values are generated by the model itself based on input values), but the structure of the equation will still remain the same. Thus, it is possible to use the calculation from general Formula (
11).
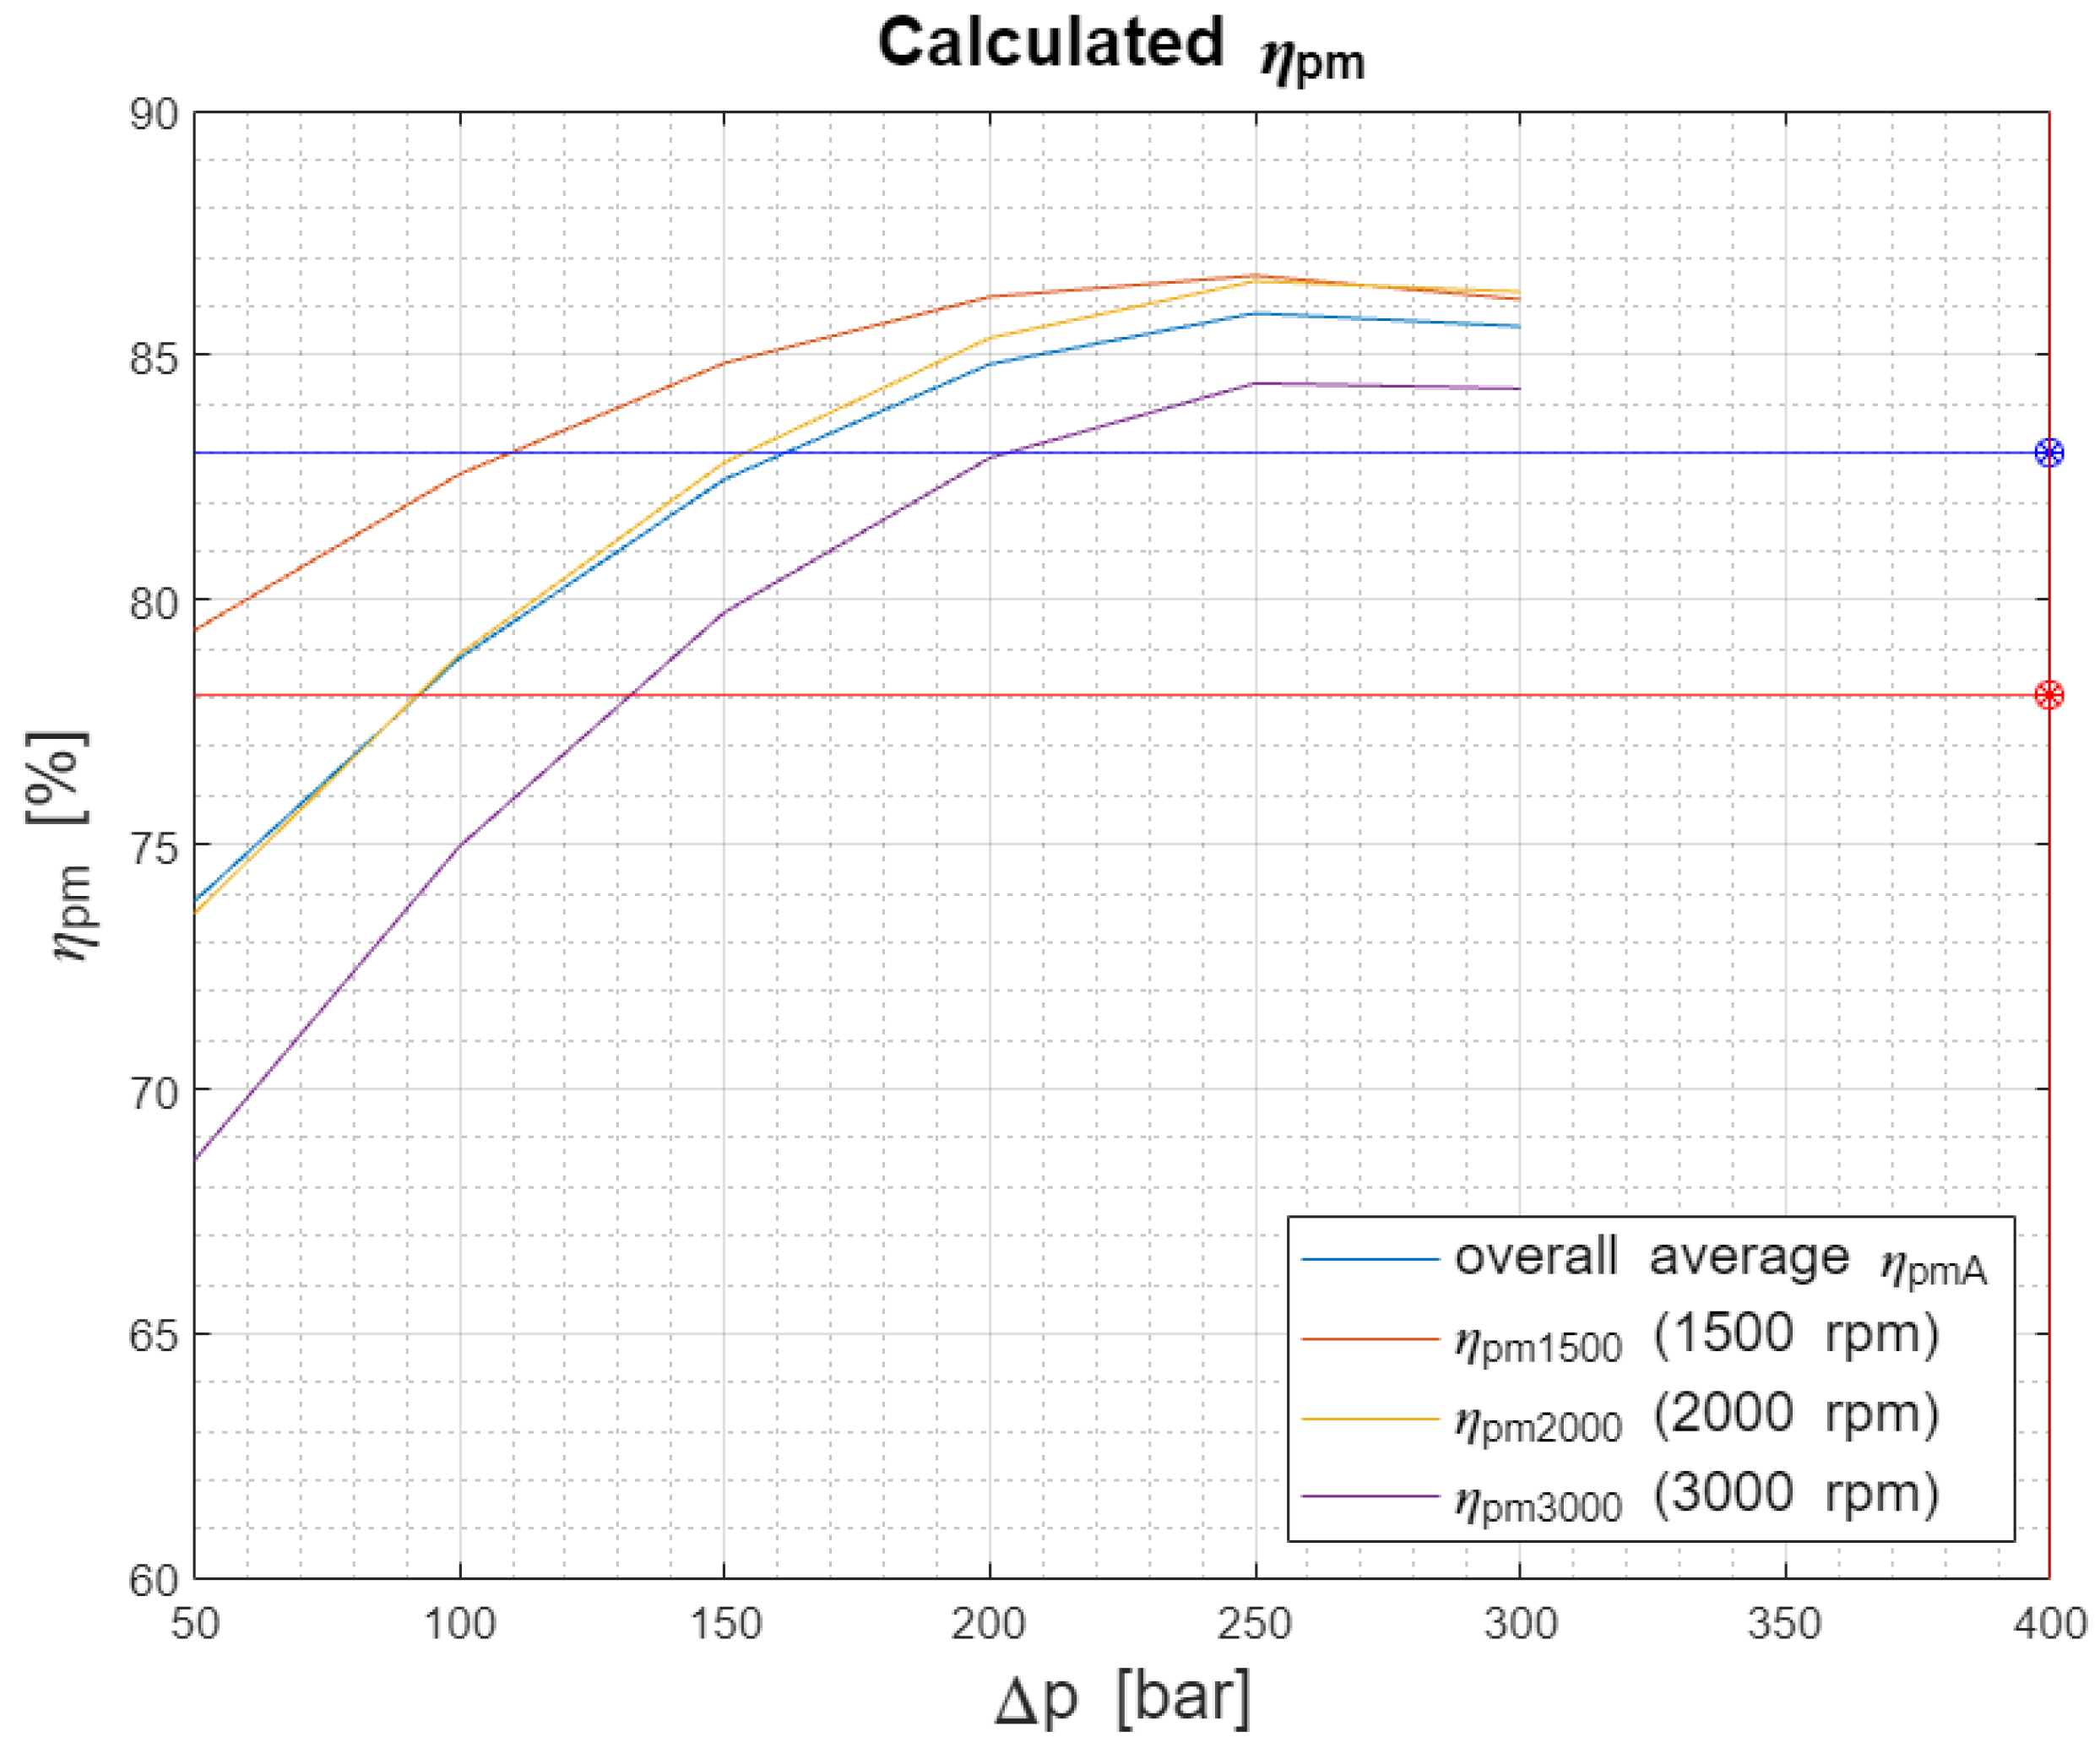
In
Figure 13, a comparison of two predicted values of efficiency for
p = 400 bar and
n = 1500 rpm can be seen. The red point represents the value calculated from the input values, which include all the measurements. The blue point represents the value calculated from the input values narrowed to one specific intensifier.
In
Figure 13, it is possible to see that when all measured data were used as input values, the calculated efficiency was lower than when only values from the type B intensifier were used. It was an expected result according to the fact that B-intensifiers were chosen as the most suitable to be used for higher pressures.
The particular efficiency value at 400 bar, when all of the measurements are included, was
at 1500 rpm and
at 2000 rpm. Its average is displayed in
Figure 13 by the red point, including the red line indicating the value on the y-axis. On the other hand, there were values including only specific measurements. Then, the efficiency value was
at 1500 rpm and
at 2000 rpm. These values are also displayed as averages in
Figure 13 by the blue point, including the blue line indicating the value on the y-axis. The polynomial including specific measurements is also pictured to see the graphic comparison with predicted values.
12. Verification of Measurements
The claim about the correctness of the predicted values at 400 bar had to be confirmed by measurements. Thus, two types of calculations were verified, i.e., the calculation with general input values and with specific input values, as was described in the previous paragraph.
The measurement itself was acquired from two samples of intensifier based on a two-section divider with thrust blocks, type B. The measurement conditions were the same as for all the previous measurements.
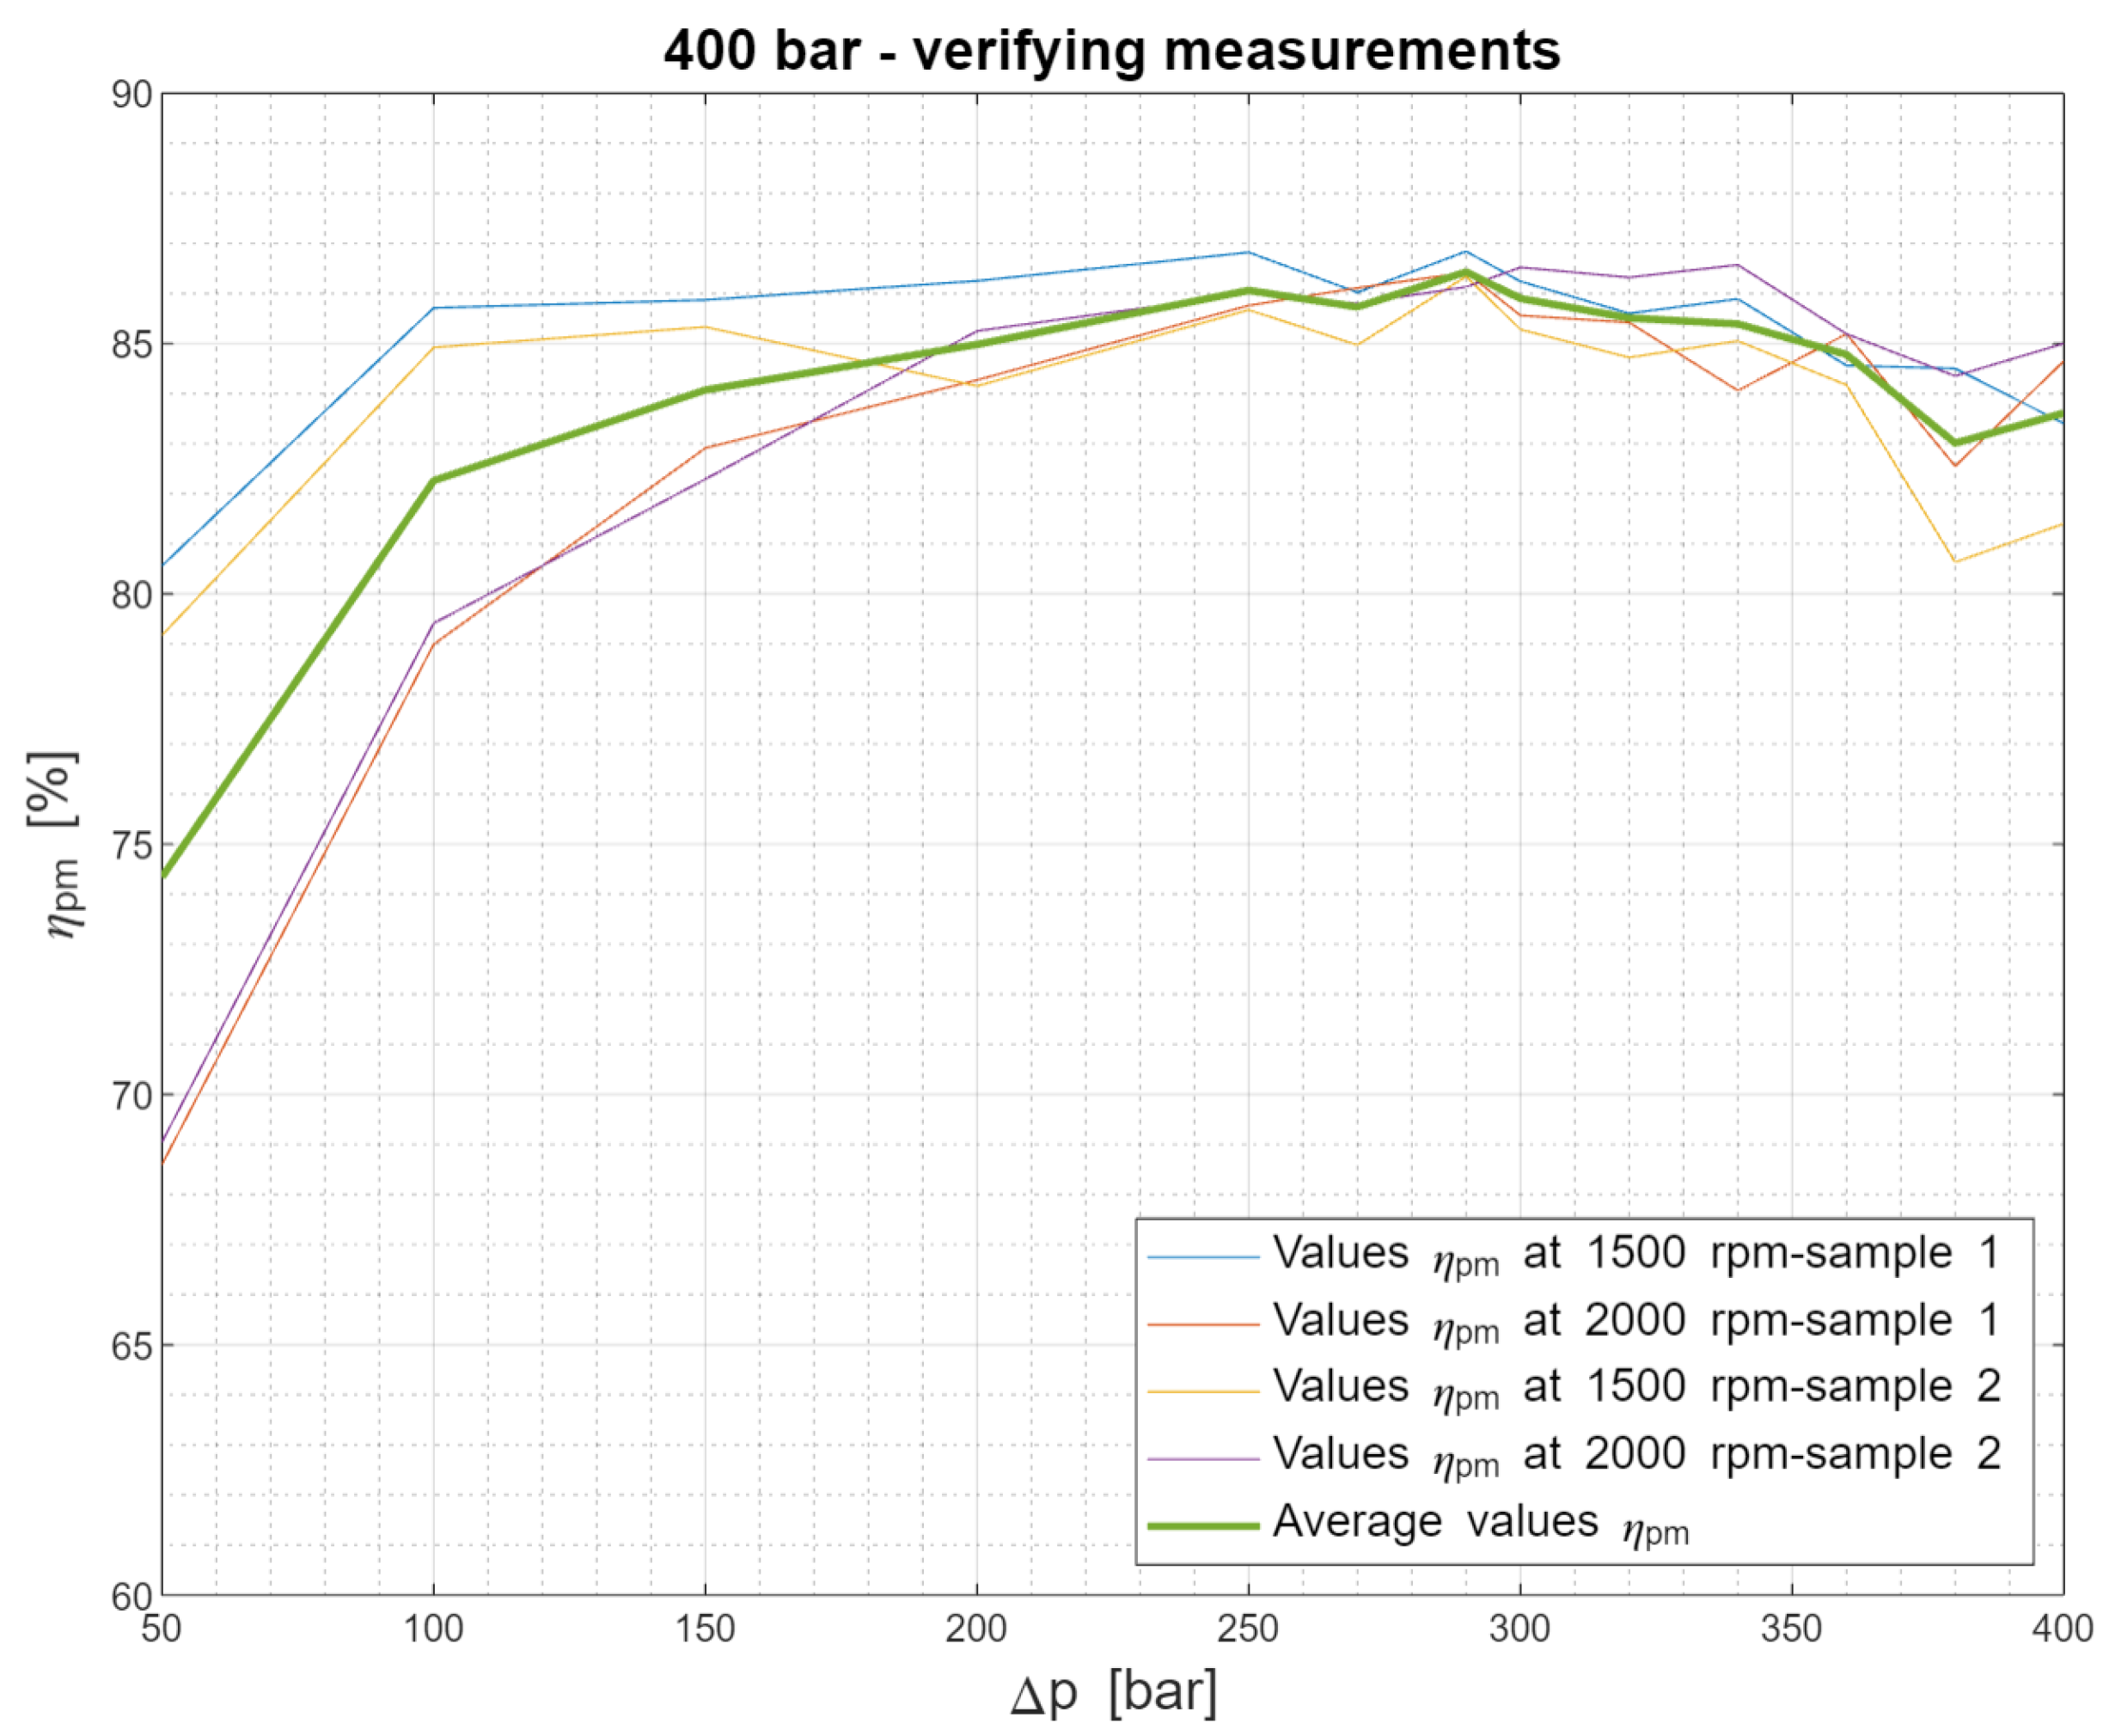
The intensifier was tested from 50 bar to 400 bar at two speed levels, 1500 and 2000 rpm. In
Figure 14, both measurements are pictured. Thus, the progress of both samples at both speed levels with increasing pressure can be seen. The thick green curve depicts the average progress.
The efficiency values were between 75 and 85%, reaching a maximum between 250 and 300 bar. There was a decrease after 300 bar, but the values did not go under the 80% border. The average efficiency at 400 bar was 83.61%. For these particular measurements, the value at 400 bar was from 81.4% to 85%. In
Figure 15, these values are added for a visual comparison.
The average value of the efficiency at 400 bar calculated from all measurements involved was 77.46%, which represented a relatively big deviation from the measurements, specifically, 6.16%. On the other hand, when just specific input measurements were used, the difference between measured and calculated values was just 1.32%. It can be considered as a satisfying deviation from the real value, and it is possible to claim that this model and its calculations and subsequent deductions can help orient the design, and that conclusions can be made. Experimental tests, which are more difficult to perform, could supplement these calculations.
13. Discussion
The pressure-multiplying efficiency describes the quality of the pressure intensification from the input to the output of an intensifier. This quantity is defined by measured values. To be able to determine the value of this efficiency with various parameters without performing new measurements and without using measured values, an intensifier model was derived. Thanks to this model, it was possible to generate a specific suitable formula, which provided a calculation to determine the efficiency value in various conditions.
Existing mathematical models and their structures, for example, gear pumps, were examined. Therefore, our goal was to create a simple program, focused specifically on pressure-multiplying efficiency calculations. According to the lower utilization of pressure intensifiers in machines in general, the goal was not to create a complex mathematical model, but rather a tool that could be useful in parametrization, design, and work with pressure intensifiers.
The foundation for the whole model derivation was inserting the measurements of two samples (minimum) of the intensifier, which were loaded up to 300 bar in various speed modes. Then, parameters appropriate to analyse the pressure-multiplying efficiency progress dependent on pressure (suitable polynomials) and speed (coefficient ) were generated. After generating a reference speed, a final formula was found. Then, to calculate the efficiency value, the desired pressure and speed were inserted.
We described situations found in technical practice, such as the calculations of the efficiency, when the pressure or speed in the hydraulic circuit was changed and compared them in graphs to see the increase or decrease in the efficiency value.
Moreover, a prediction at 400 bar was provided, which was a pressure value out of the measured area of intensifiers. To achieve satisfying results, we discussed the importance of a selection of the measured samples and their values were inserted at the beginning of the formula derivation. The calculations were also verified by a measurement of two intensifier samples. Measured and calculated values were compared, and the difference was around one percent.
In summary, it is possible to state this program-generating formula for pressure-multiplying efficiency calculations in various parameters is functional and it is possible to apply it in the analysis of hydraulic circuits, the analysis of an intensifier’s efficiency when parameters are changed, or to predict the behaviour at higher pressure values which are not measured in experimental measurements.
In this paper, a derivation of a formula was described. Thanks to the fact that the derivation was based on measured characteristics, it is possible to use this model for other design types of intensifiers or intensifiers manufactured by different manufacturers, because there will be different characteristics due to design differences.
This whole model was created using a program in Matlab, which is compatible with various programs or has a lot of program extensions. Thanks to this, the program could be extended or fused with another model. For example, in a complex hydraulic circuit model, there could be very useful efficiency calculations and they could be combined with the energy balance of the circuit.
Because of the idea of using measured characteristics at the beginning of the formula derivation, maybe this model could be found useful for determining another physical unit which depends on two parameters, such as the pressure and speed in the case of the pressure-multiplying efficiency.
Finally, another reason to use this model is to save time, energy, and resources on measurements and still be able to have accurate data when prototyping or parametrization is being made. With this model, it is possible to search for optimal parameters (maximum efficiency parameters) and use it for dimensioning hydraulic circuits, including this intensifier.
