1. Introduction
Development of building energy simulation through BIM
Buildings consume about 40% of energy globally and generate 30% of global CO
2 emissions. These figures increase as a result of rapid urbanization [
1,
2], increasing greenhouse effects, and global warming [
3]. Therefore, efficient energy use in buildings is crucial to reducing energy costs and environmental impacts, and enhancing the competitiveness of building construction [
4,
5,
6].
Energy consumption in buildings, directly and indirectly, impacts the lifespan of buildings [
7]. Improving energy efficiency in building construction has become a priority in the design criteria of building construction [
8]. Factors affecting the energy consumption model in a building include the type of construction, the building location and climate characteristics, construction materials, and surface factors [
9]. Establishing energy-efficient buildings requires interdisciplinary research in many stages of the project life cycle, specifically in the design, construction, and operation stages [
10]. Experts have used Building Information Modeling to simulate and calculate energy models in buildings [
11].
The BIM model in the construction industry (AEC) is based on digital 3D models that are used throughout the lifecycle of a construction project, including design, construction, and operation, and has been the focus of many studies, resulting in the high efficiency in construction projects [
12]. BIM aids in the establishment, exchange, and sharing of information about the project by digitizing it. In particular, 6D BIM is a development step that integrates energy parameters within and outside the building. Architects often use 6D BIM to calculate energy indicators, achieving an optimal energy design for the project. However, research on 6D BIM and building energy models worldwide and in Vietnam still needs to be completed. The energy simulation process from the BIM environment often encounters data loss errors during data conversion. The energy simulation tools are also complex, requiring users to have advanced programming languages and specialized knowledge in order to utilize them effectively. There needs to be greater analysis of 6D BIM during the initial design process, especially for projects in Vietnam [
11].
The use of BIM in construction management is an inevitable trend in the construction industry today. Many potential areas of research with regard to BIM have been proposed by scientists worldwide, particularly the transition direction in BIM with the integration of the Building Energy Model (BEM) to solve energy simulation problems for practical buildings.
Building Energy Model (BEM)
Currently, most construction projects tend to simulate and evaluate energy consumption before construction to achieve energy-efficient buildings, especially high-rise buildings. The initial energy simulation helps investors save costs during operation and reduce energy consumption in the building, while ensuring that the necessary amenities are provided inside the building [
13]. Using specialized software, energy simulation allows for the prediction of how much energy a building will consume.
Building Energy Modeling is simulated under the input factors of Building Information Modeling, along with weather conditions, the construction location, the thermophysical properties of the materials, and HVAC systems in order to provide energy evaluation values [
14]. A BEM combines BIM input factors with local weather information and uses physical equations to calculate heat loads, the energy system’s response to those loads, and energy use indices, along with related indices such as occupant comfort level and energy cost.
Many different BEM tools can import data files from BIM to perform energy simulations, aiming for the goal of energy-efficient building use [
15]. However, these tools have various limitations and must be appropriately selected for the highest efficiency in each construction stage by different design professionals. There have been numerous studies applying BEM with various tools to address various specialized issues [
16,
17,
18].
Despite some prior research on the BIM-BEM model for energy simulation, there needs to be more emphasis on the design of building surfaces, including window arrangements and shading walls that incorporate new materials appropriate for local conditions. This deficiency is particularly pronounced in Ha Noi City, Vietnam, which is representative of tropical cities that receive copious amounts of solar radiation and experience high temperatures throughout the year [
7,
19]. This gap in the literature motivates the present study, which aims to propose a simulation model that integrates energy optimization strategies and intelligent design proposals for building surfaces and shading walls.
Specifically, this study aims to develop a simulation model that integrates energy optimization proposals for building surfaces using new materials and design options suitable for local conditions, particularly in hot and sunny climates such as Ha Noi City in Vietnam. The model can improve energy efficiency and reduce costs by selecting the optimal surface options. The study will analyze the effectiveness of these options and propose design guidelines for future construction projects. The results of this research will be helpful for architects, engineers, and building owners interested in optimizing energy use and reducing costs in hot and sunny climates.
2. Literature Review
The integration of BIM and BEM provides numerous advantages, such as simplifying data management and enabling automation in energy modeling, enhancing output representation, and facilitating the storage and organization of new building data. Advancements in the interoperability of BIM and BEM would significantly enhance the usability of building performance simulation (BPS) by facilitating the seamless data transfer between the two systems, which would save time and effort, reduce human error, and open BPS to non-specialized professionals [
20]. The literature review in this paper focuses on the integration of BIM and BEM, the building envelope design for efficient energy usage, and the use of energy analysis tools in building design. These methodologies are employed to develop the integrated BIM-BEM simulation system that is presented in this paper.
2.1. The Integration of BIM and BEM
The integration of BIM and BEM can provide numerous advantages throughout various stages of the construction project. During the concept design stage, a simplified thermal zone is sufficient for the rough energy model to evaluate design concepts, such as building orientation, site location, renewable energy sources, and building massing [
21]. Even though assumptions must be made regarding the energy model at this stage, the energy model helps the design team to compare the performance of different design alternatives [
22].
As the design stage progresses, the level of building information becomes more detailed, and BPS assists the design team in optimizing decisions involving HVAC systems, various layouts, construction types, and basic architectural features [
23]. During the design and engineering development finalisation, BPS advances to the parametric analysis of the selected design based on a more comprehensive energy model. Building components have been evaluated through energy simulations available in BIM, transformed into BEM models, and compared against green criteria to make design decisions aimed at reducing energy consumption in buildings [
16]. The main obstacles to this performance-based process, such as lack of time, money, and information, which have historically caused BPS activities and results to lag behind the decision-making timeline, can be eliminated through the successful interoperability between BIM and BEM [
20].
The integration of BIM and BEM can be executed at various levels through a typical workflow consisting of three fundamental stages. First, the BIM model is optimized by eliminating irrelevant data and refining the building geometry, internal loads, and equipment systems within the BIM authoring software [
24]. Secondly, the simplified BIM model is exported into interoperable-friendly formats, such as Industry Foundation Classes (IFC) and Green Building XML (gbXML) [
25]. Lastly, BIM files are imported into the modeler graphical user interfaces (GUIs) of most Building Performance Simulation (BPS) tools, such as DesignBuilder, EnergyPlus, DOE-2, and ApacheSim, which convert building data into usable information by the respective simulation engines [
14].
However, despite the potential benefits of BIM-BEM integration, studies have found that achieving satisfactory synchronization of the two tools remains a significant challenge, and the data flow between the programs is often one-way, meaning that any modifications made in BEM are not reflected in the BIM model [
26]. BIM tools may not provide many options for customization, such as operation schedule or HVAC, but they can still be a useful tool for early design analysis to support decisions regarding building form, mass, orientation, and fenestration, where BIM’s geometry and construction data can accelerate deployment [
20].
As a result, the trend of using BEM energy models in building construction is becoming increasingly popular. Using BEM to analyze buildings’ energy efficiency helps to reduce analysis time, provide reliable energy metrics, and provide a basis for decisions made by architects, engineers, and building managers. The authors propose a novel method for integrating BIM and BEM in this study by using the Autodesk Insight 360 tool. This new, efficient, and user-friendly tool effectively addresses data conversion errors from BIM to BEM.
2.2. Designing the Building Envelope for Energy Efficient Use
The process of designing a building’s envelope holds significant importance in architectural design, showcasing the aesthetic and artistic elements of the structure. This has led to an increased focus on visual calculation methods for selecting building materials that optimize solar energy impact, which has become a growing trend in the professional community [
14]. Analyzing the building envelope in the BEM involves reviewing the geometry, features, relationships, and zoning.
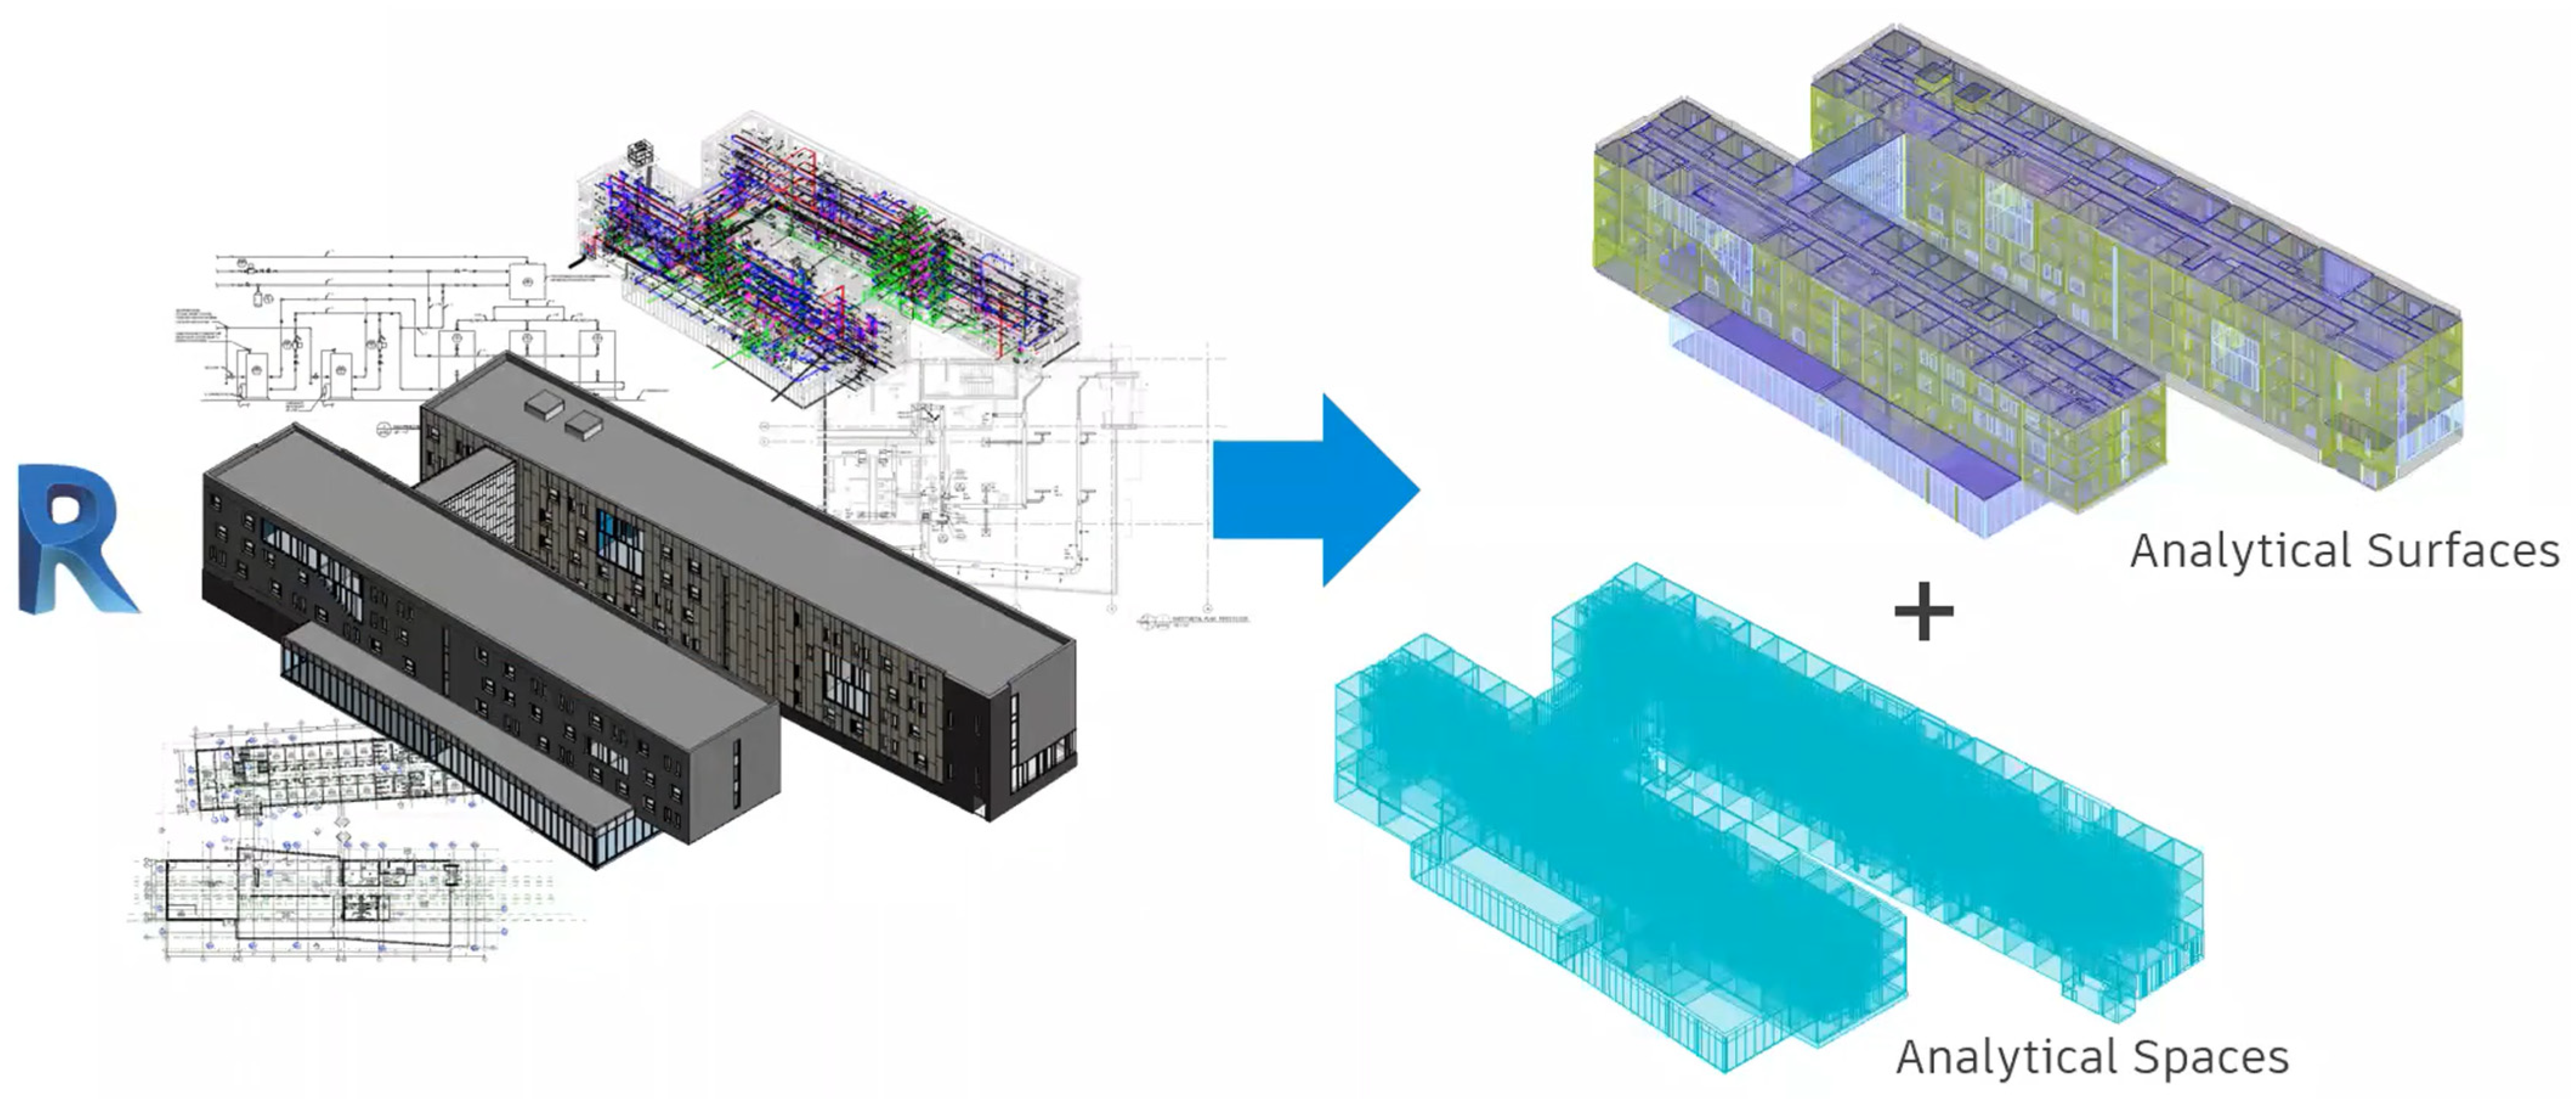
Figure 1 shows a representation of the analysis of the surfaces and shapes in the BEM.
The initial shape of a building in a city is often not flexible, so this mainly depends on planning and architectural criteria. The use of multiple different shapes to choose the best shape for reduced energy use is usually only applied to buildings outside of a city. Therefore, the focus will be on designing the external shell, vertical facade, and wall materials and glass cladding materials [
27]. In addition, the vertical facade design is a top factor related to the quality of the indoor environment of the building. However, the vertical facade also directly relates to the capacity of the ventilation and air conditioning system and the investment cost for this system [
25]. The quality of the vertical facade design and surface cladding of the vertical facade is decisive with regard to the energy costs of the building [
28]. However, the decision-making process to change the design and retrofit buildings for energy-efficient use is still lacking in studies using optimization and energy models [
29]. Some studies focus on changing the structure and orientation of buildings to increase sustainability and energy savings. However, integrated optimization models have not been widely used, especially in evaluating and optimising surface factors (Envelop) [
30].
Most designers today lack concern and adequate resources to evaluate the impact of different materials on the energy consumption and overall flexibility of the facade design of buildings, from the exterior cladding system to the energy use efficiency. Most current simulation tools require a complex manual process with many calculations to achieve optimal design results. The limitations and integrated solutions of simulations in the construction design process have been discussed in numerous studies [
31]. Reducing energy consumption in construction by changing the surface design of buildings and cladding materials has become a research area of great interest to many scientists. In particular, building energy modeling (BEM) is recognized as an effective design tool for making design and investment decisions for construction projects.
Although there have been some studies on BIM-BEM models for simulating energy usage, there are few studies on building surfaces and wall cladding construction using new materials that are suitable for different climate regions that are used to optimize energy efficiency and cost-effectiveness. Therefore, this research aims to develop an energy simulation model combined with intelligent design change proposals to select an optimal surface option for efficient energy usage and reasonable cost. From there, it helps designers and building managers to improve the energy savings of the building through adjustments to certain components of the building facade design.
2.3. Energy Analysis Tools for Efficient Energy Use in Building Design
The building design process requires collaboration among experts from various disciplines from the early stages of the project. All experts can propose innovative solutions in their respective fields and for others as well. All proposed solutions are carefully recorded and evaluated for their impacts on cost, energy, and sustainability. Therefore, optimizing the initial design for efficient energy use in a building is a complex process that requires rigorous analysis and involves many stakeholders.
One of the most important tools for supporting integrated design is Building Energy Modeling [
32]. Essentially, BEM is the process of simulating the entire building operation, including the thermal data of building materials, interior spaces, human activities, lighting systems, equipment systems, and the entire HVAC system.
Several studies have focused on developing information energy models based on building design elements. Energy modeling based on building design data such as geographical location, site geology, the openness of doors and windows, construction materials, building orientation, building shape, and the heat transfer properties of glass has been extensively researched [
17].
The simulation of energy consumption to optimize design in construction has been considered in many studies [
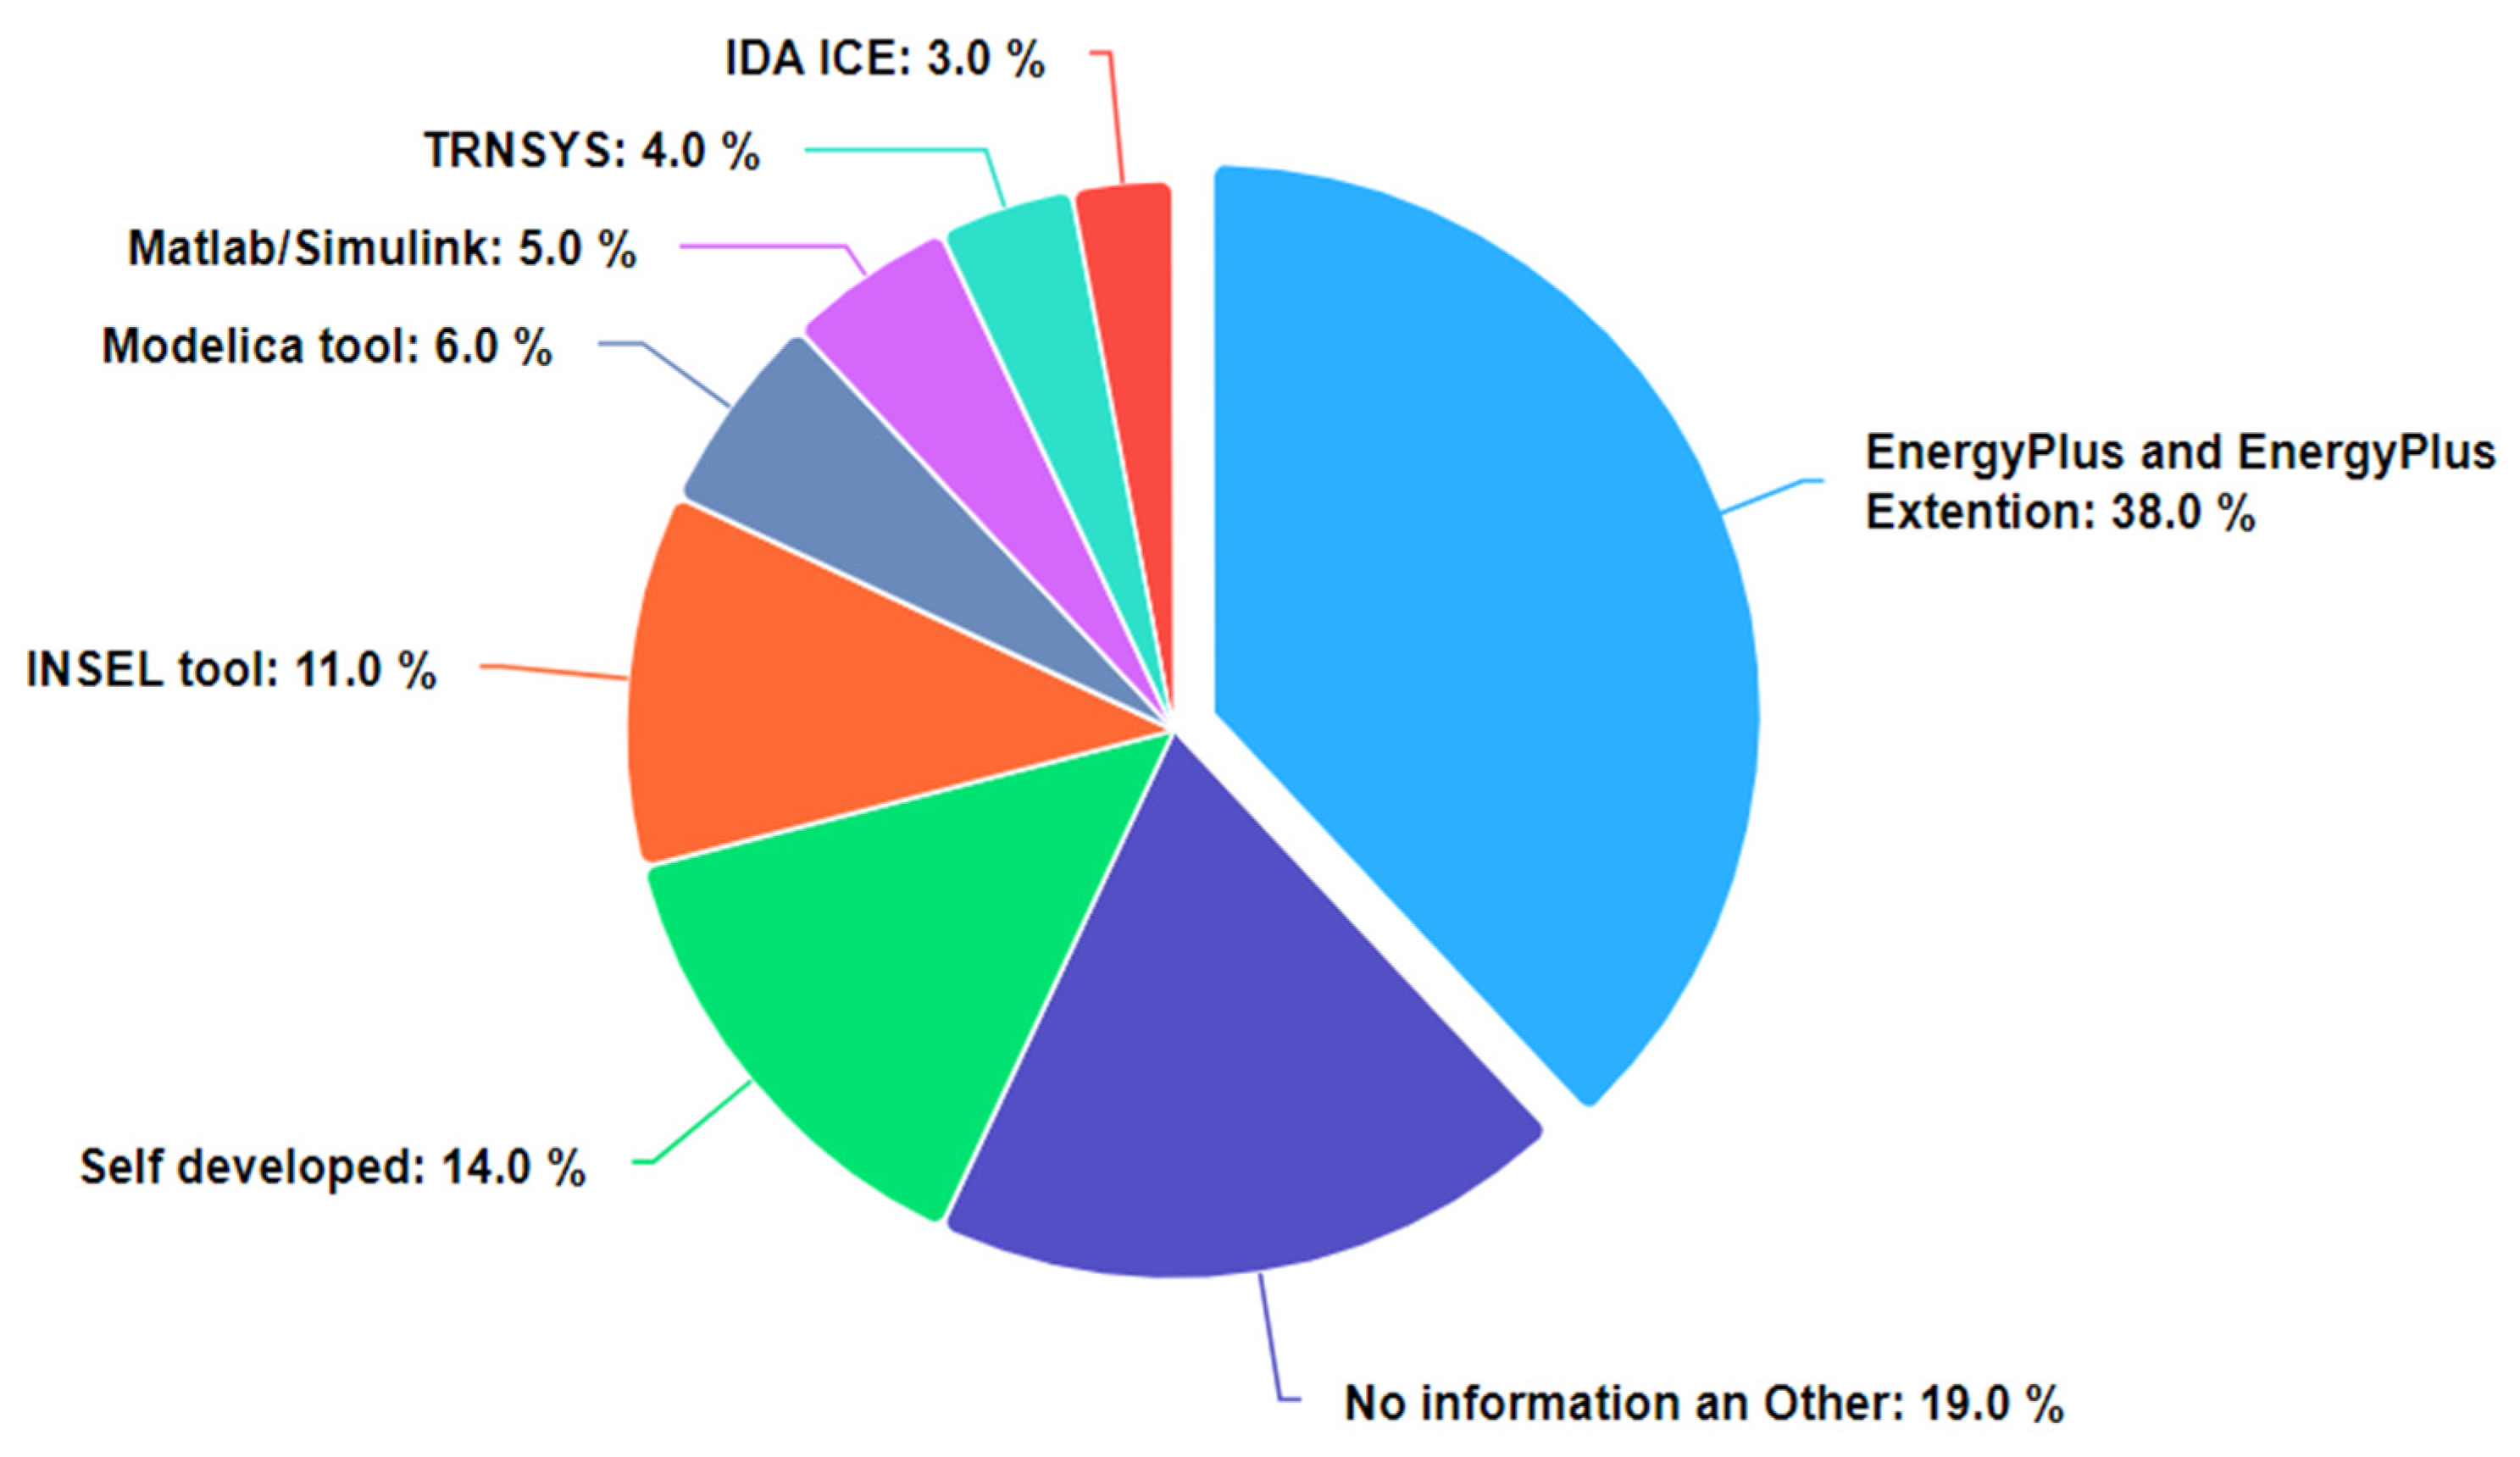
33]. Several energy simulation systems have been developed by software manufacturers to assess the effectiveness of a building, both in terms of overall and detailed performance (
Figure 2). Previous authors have used different simulation languages and tools to simulate energy consumption, such as EnergyPlus [
34], Modelica [
35], and OpenStudio [
36]. However, using these languages and tools poses challenges for non-experts, architects, and engineers, as they require programming and data analysis skills.
Based on the information provided, it can be observed that there are not many studies on energy simulation software developed by Autodesk. The energy simulation software is designed to run on Autodesk Revit and utilizes cloud storage to support users in performing complex energy calculations and designs [
37]. These software programs are believed to be user-friendly and intuitive, and interact directly with BIM models to provide the necessary energy values.
Figure 3 illustrates the development process of energy analysis supporting tools on the Autodesk Revit platform.
One of the strengths of energy simulation software on the Autodesk platform is the highly efficient storage and processing of simulation data quickly, especially when using construction data from BIM to simulate energy. This study proposes using support tools in the Autodesk ecosystem to simulate and analyze the energy of a real project in Vietnam. Through this, a reasonable simulation method can be proposed and promoted for use in real-world projects. In particular, studies utilizing Insight 360 to simulate and analyze building energy consumption still have several limitations. Previous research has often relied on complex and time-consuming simulation tools that require programming knowledge. This study proposes a simplified method for energy simulation by allowing for quick and easy modifications to building designs.
3. Research Methodology
3.1. Simulation Tools in the Study
In this study, various simulation tools were utilized, including Autodesk Revit and two other energy simulation tools: Autodesk Insight and Green Building Studio-GBS. An energy model was created in BIM by the authors based on the initial information, such as the building operation schedule, wall, roof and window material types, and the window opening ratio on different building facades. Through the simulation process on the Autodesk 360 cloud system, these tools were used to identify the most energy-efficient materials and design options.
a. Autodesk Revit software
Autodesk is a pioneering software company and a leader in developing BIM support applications. Among them, Autodesk Revit is powerful software that provides invaluable support for architects and engineers that is built according to the BIM approach to construct a building model with integrated information. It enables designers to realize their ideas through a consistent collaborative model with data on materials and construction components [
38].
Figure 4 represents the steps required to develop BIM models on Revit for energy simulation purposes
In this study, the author used Revit to model the building in architectural model format, including the building’s massing and surrounding elements (such as wall types, doors, windows, roofs, floors, and ceilings). The selected building is a large-scale public building with substantial requirements with regard to managing energy consumption, and the model includes information about the building’s location, weather conditions, building type, and intended use.
b. The energy simulation model and cloud computing of Green Building Studio and Autodesk Insight
Autodesk Green Building Studio is a cloud-hosted energy analysis tool that can help designers, architects, engineers, and energy analysts perform faster energy analyses on multiple building designs, optimizing energy performance through proposals during the design process [
39].
Autodesk Insight 360 is a recently developed energy analysis software by Autodesk (2018) that can support users in simultaneous energy analysis and optimization in a visual and automated way (
Figure 5). Optimizing building energy performance with Insight is fast, reliable, and scalable for improving energy performance by automatically generating energy models or alternative designs based on the original Revit model through analysis steps. The results of optimizing energy performance are visualized and provide early decision-making for energy-saving solutions for the building [
40].
3.2. Technical Calculation Indicators for the Simulation Process
a. Energy Use Intensity (EUI) index
Energy use intensity as shown in Equation (1), and is a metric used to measure a building’s energy efficiency. It is typically calculated as the energy consumed by a building per square foot or square meter of floor area per year. EUI is expressed in energy per unit of floor area per year, such as kWh/sq.m./year. The lower the EUI value, the more efficient the building is in terms of energy usage. EUI is commonly used in building energy benchmarking and rating systems to compare the energy performance of different buildings.
The operation of buildings accounts for a substantial portion of energy consumption, leading to substantial carbon emissions that contribute to global warming. As a result, reducing both EUI and energy costs through the application of BIM technology for energy analysis has become an essential approach [
41]. EUI (kWh/m
2/year) studies have been conducted on most constructed buildings, and all homebuyers or residents must have an energy consumption rating certificate [
42].
This research aims to present a simulation method that enables the assessment of different design strategies to lower energy usage through alterations in design criteria, resulting in the creation of an optimal energy-efficient building model with reduced EUI and energy costs. In developed countries such as the United States and Canada, policymakers publish a list of average EUI indicators related to different types of structures [
43,
44], as shown in
Table 1. Based on this list, designers can evaluate whether their building’s EUI is good or bad compared to similar structures of the same type.
b. U-Value and R-Value of building materials
The U-Value (W/(m2K)) and R-Value (m2K/W) of building materials, as shown in Equations (2) and (3), are important parameters used for energy modeling. Any building material used in a BIM environment must declare these two values to serve the energy modeling process.
The U-Value (Thermal Transmittance) of a product refers to the heat loss through the building components, calculated as the rate of heat loss per square meter of material. When searching for better-performing products, the lower the U-Value, the better the product can prevent heat loss. A lower U-Value means less heat is lost, preventing unwanted heat flow and loss.
The R-Value (Thermal Resistance) represents the thermal resistance of building components, and in contrast to the U-value, the higher the R-value, the better the product performs, meaning that it reduces heat loss (the higher the R-value, the better the insulation). All building factors have a defined R-value, including walls, glass types, roofs, floors, and ceilings. Each layer will have a different R-value, especially in multi-layered walls, which are calculated to determine the overall R-value for energy simulation [
45].
where Ri is the resistance value of the house wall layer or material i. Di is the thickness of the house wall layer or material i. K, also known as Thermal Conductivity (W/mK), is a physical quantity characteristic of the material’s ability to conduct heat. Each type of material has a different K-value.
Efficient energy simulation necessitates carefully selecting and declaring the R-value and U-value coefficients for key building components, including cladding walls, windows, floors, and roofs. Calculating detailed values for each layer of multi-layered materials, such as walls and roofs, is necessary to determine the most accurate U-Value index [
46].
3.3. The Proposed Framework
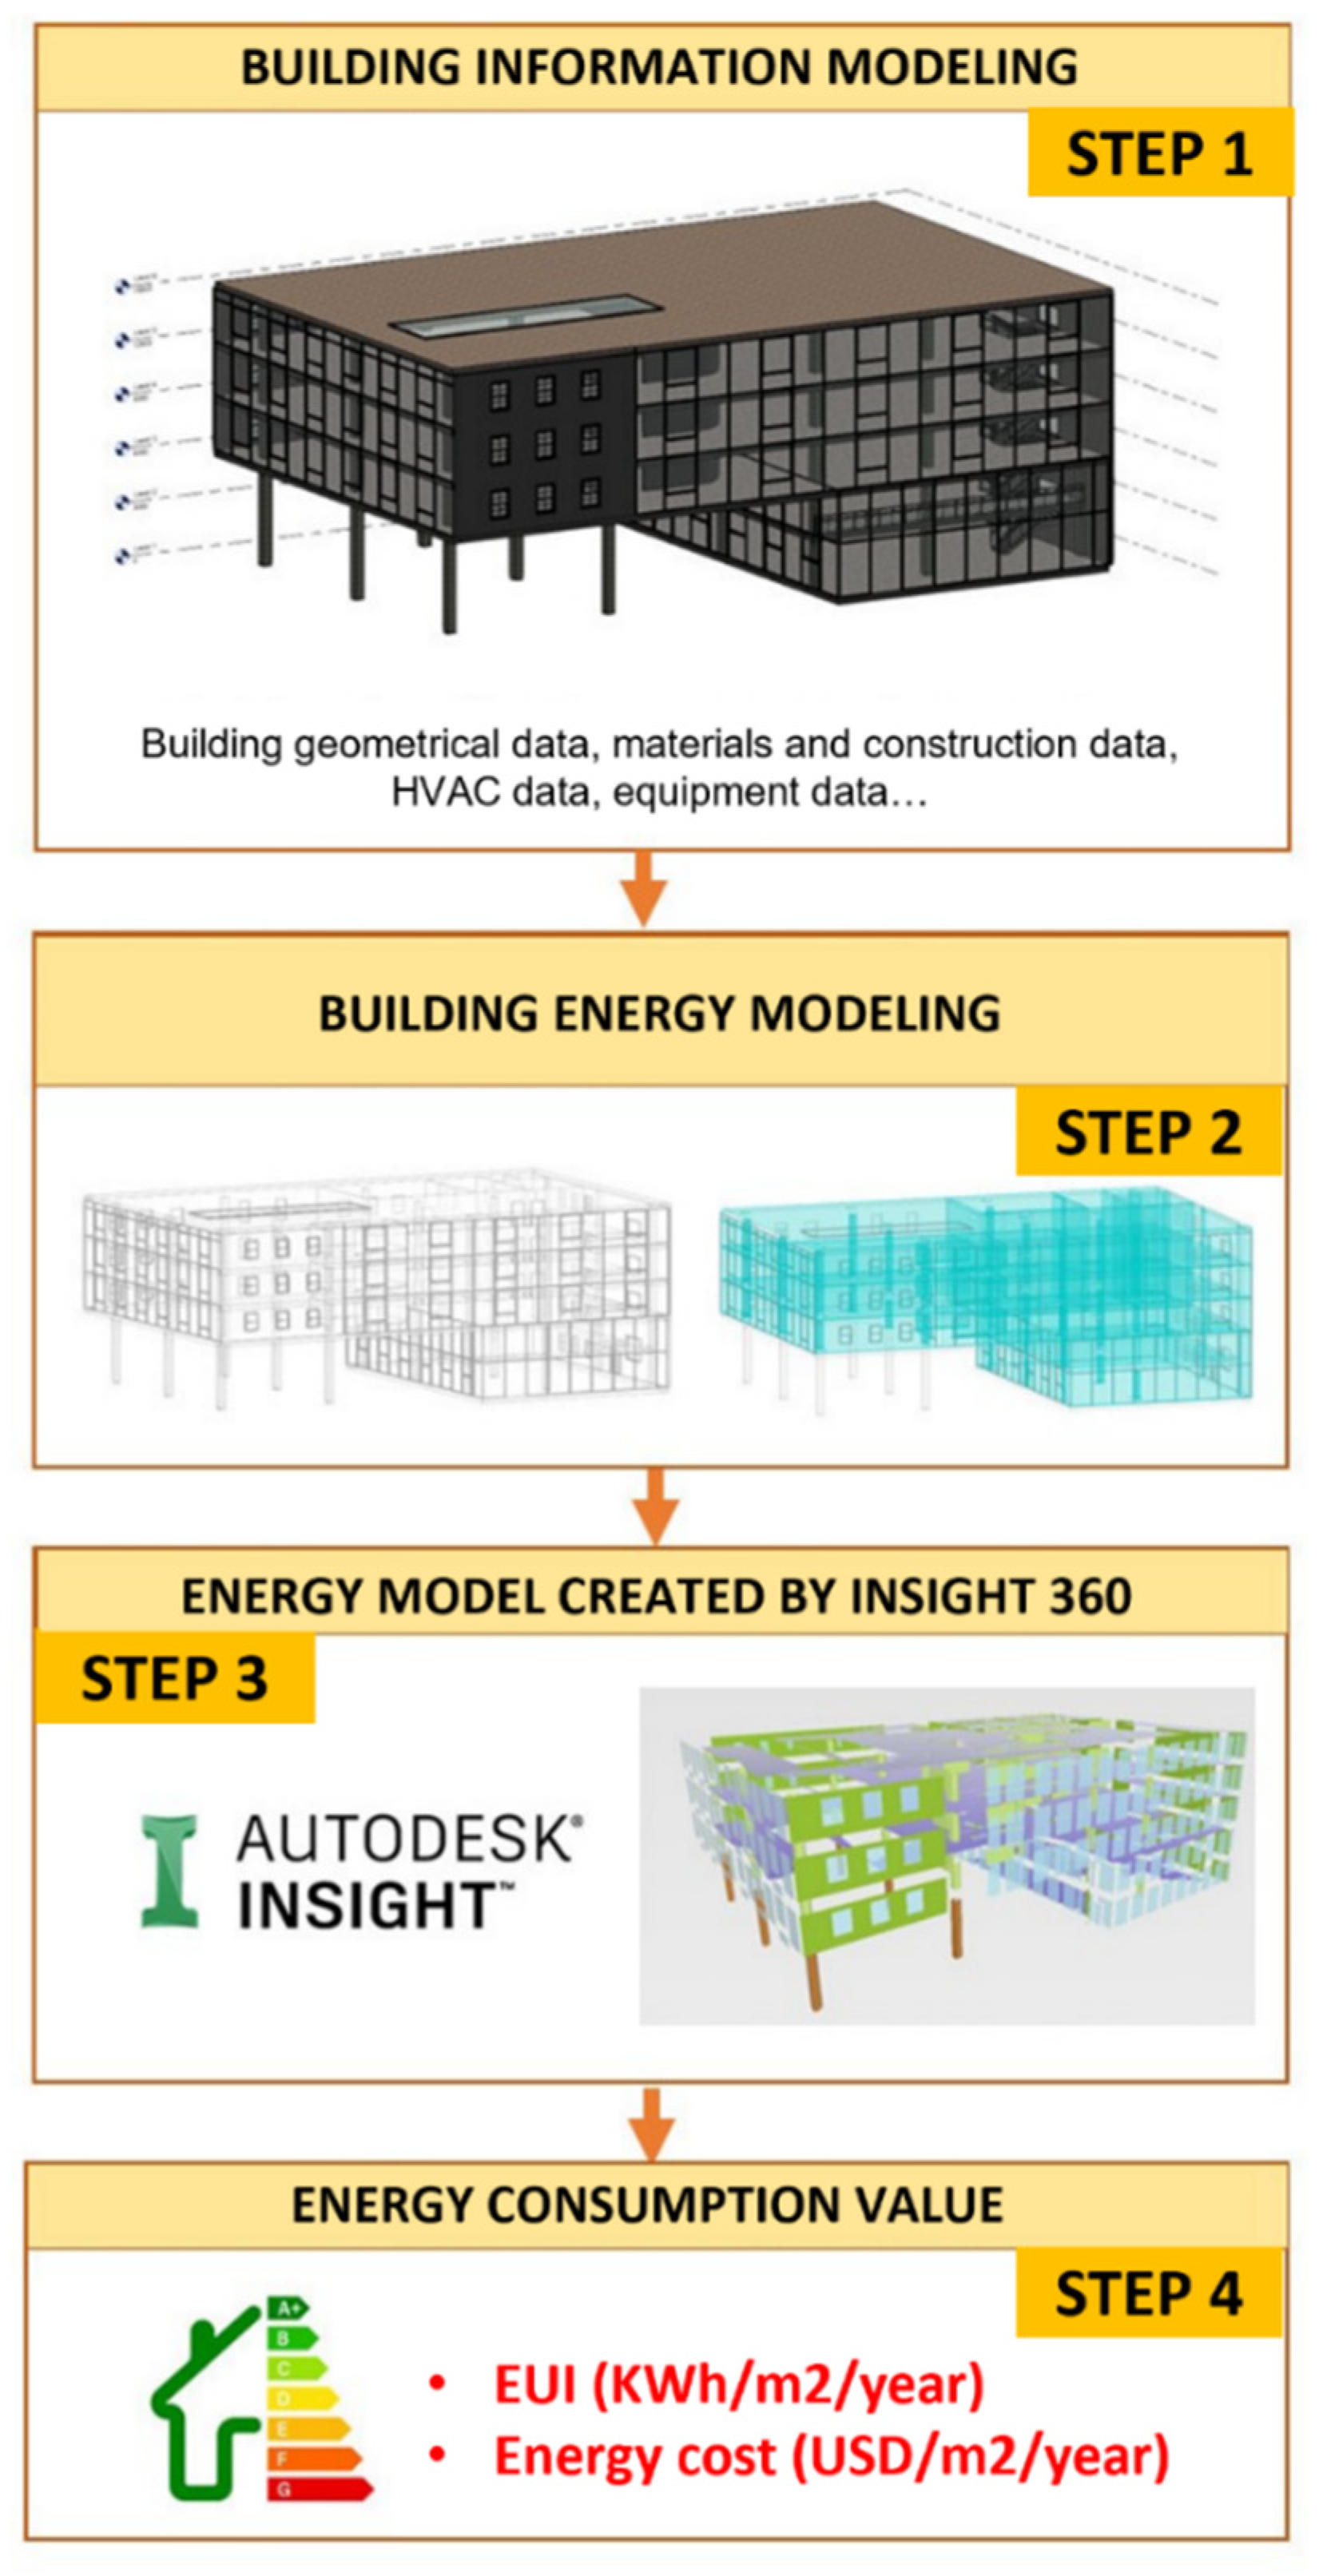
The proposed framework for energy simulation in building projects is based on the BIM platform and several integrated tools, which are executed through four primary steps, as illustrated in
Figure 6.
Step 1: a 3D model of the construction project is initiated through Autodesk Revit software. The project is declared with critical parameters such as primary structure material type, weather and construction location, HVAC system, glass type, building type, and operational time of the project.
Step 2: After the 3D model is built with the blocks and material surfaces declared, the spaces of the project are divided and adjusted, and the support tool is used to transform the 3D model into an energy model with flat surfaces, which is a closed space model. Any gaps and openings that appear need to be adjusted to avoid discrepancies in the energy simulation process in the following steps.
Step 3: the Autodesk Insight support tool is used to simulate and upload energy data to the Autodesk 360 cloud for analysis. The simulation results will be displayed on the Insight interface to allow users to change the design to alter the energy consumption level. The energy model is a geometric chart built on flat surfaces with components being transformed into surfaces along with U-value parameters to calculate the heat loading and energy consumption process. This is a comprehensive 3D model of buildings that can be analyzed and calculated using either online or offline tools. By utilizing this energy model, users can optimize the utilization of building material factors. From the simulated architectural 3D model, the author initiated an energy model in BIM with support tools for energy analysis and energy model setup, with initial settings such as the project’s activity schedule and the HVAC system set to default to the intended use.
Step 4: Based on the results obtained from Step 3, the model is calibrated and simulated to suit various environmental situations on the Cloud platform of the Green Building Studio-GBS and Autodesk Insight tools. Through simulated scenarios on the Cloud, each case corresponds to changes in design elements to provide a suitable Energy Use Intensity (EUI) index for the needs of building designers and managers.
During the simulation of surface design options, the Green Building Studio-GBS tool automatically runs multiple scenarios to provide energy intensity (EUI-kWh/m2/year) and related energy usage costs for each design option. The energy model is then fed into the Autodesk Insight tool to identify building material layers and forecast energy usage for each design option. This simulation process generates charts depicting various design options’ energy use intensity (EUI-kWh/m2/year). The simulation process will identify the best design option with the highest energy efficiency based on the EUI index.
The simulation methodology will be described in detail through case studies to illustrate the steps and results of supporting surface design options to improve building energy efficiency.
4. Optimizing Envelope Design Selection to Enhance Building Energy Efficiency and Cost-Effectiveness with a Case Study
4.1. Introduction to the Selected Building Data for Analysis
This study selects an actual building on which to simulate the BIM environment, and then proceeds to the BEM model to analyze the energy for the building in order to specify the proposed energy simulation process. The selected building is located in Me Tri, Hanoi, Vietnam. The simulated project is the SOS Children’s Village play and learning area, which is sponsored by the United Nations Children’s Fund and is scheduled to begin construction in 2024. The building has a scale that includes three large classrooms, two standard activity rooms, four small classrooms, and 14 other utility rooms.
Table 2 displays the principal building parameters.
As a foreign-invested project, the protect owner has substantial requirements for applying calculation models in the construction process and using energy-efficient materials inside the building. Analyzing and simulating energy consumption in this project is considered necessary to advise architects and owners with regard to the selection of design options and construction materials.
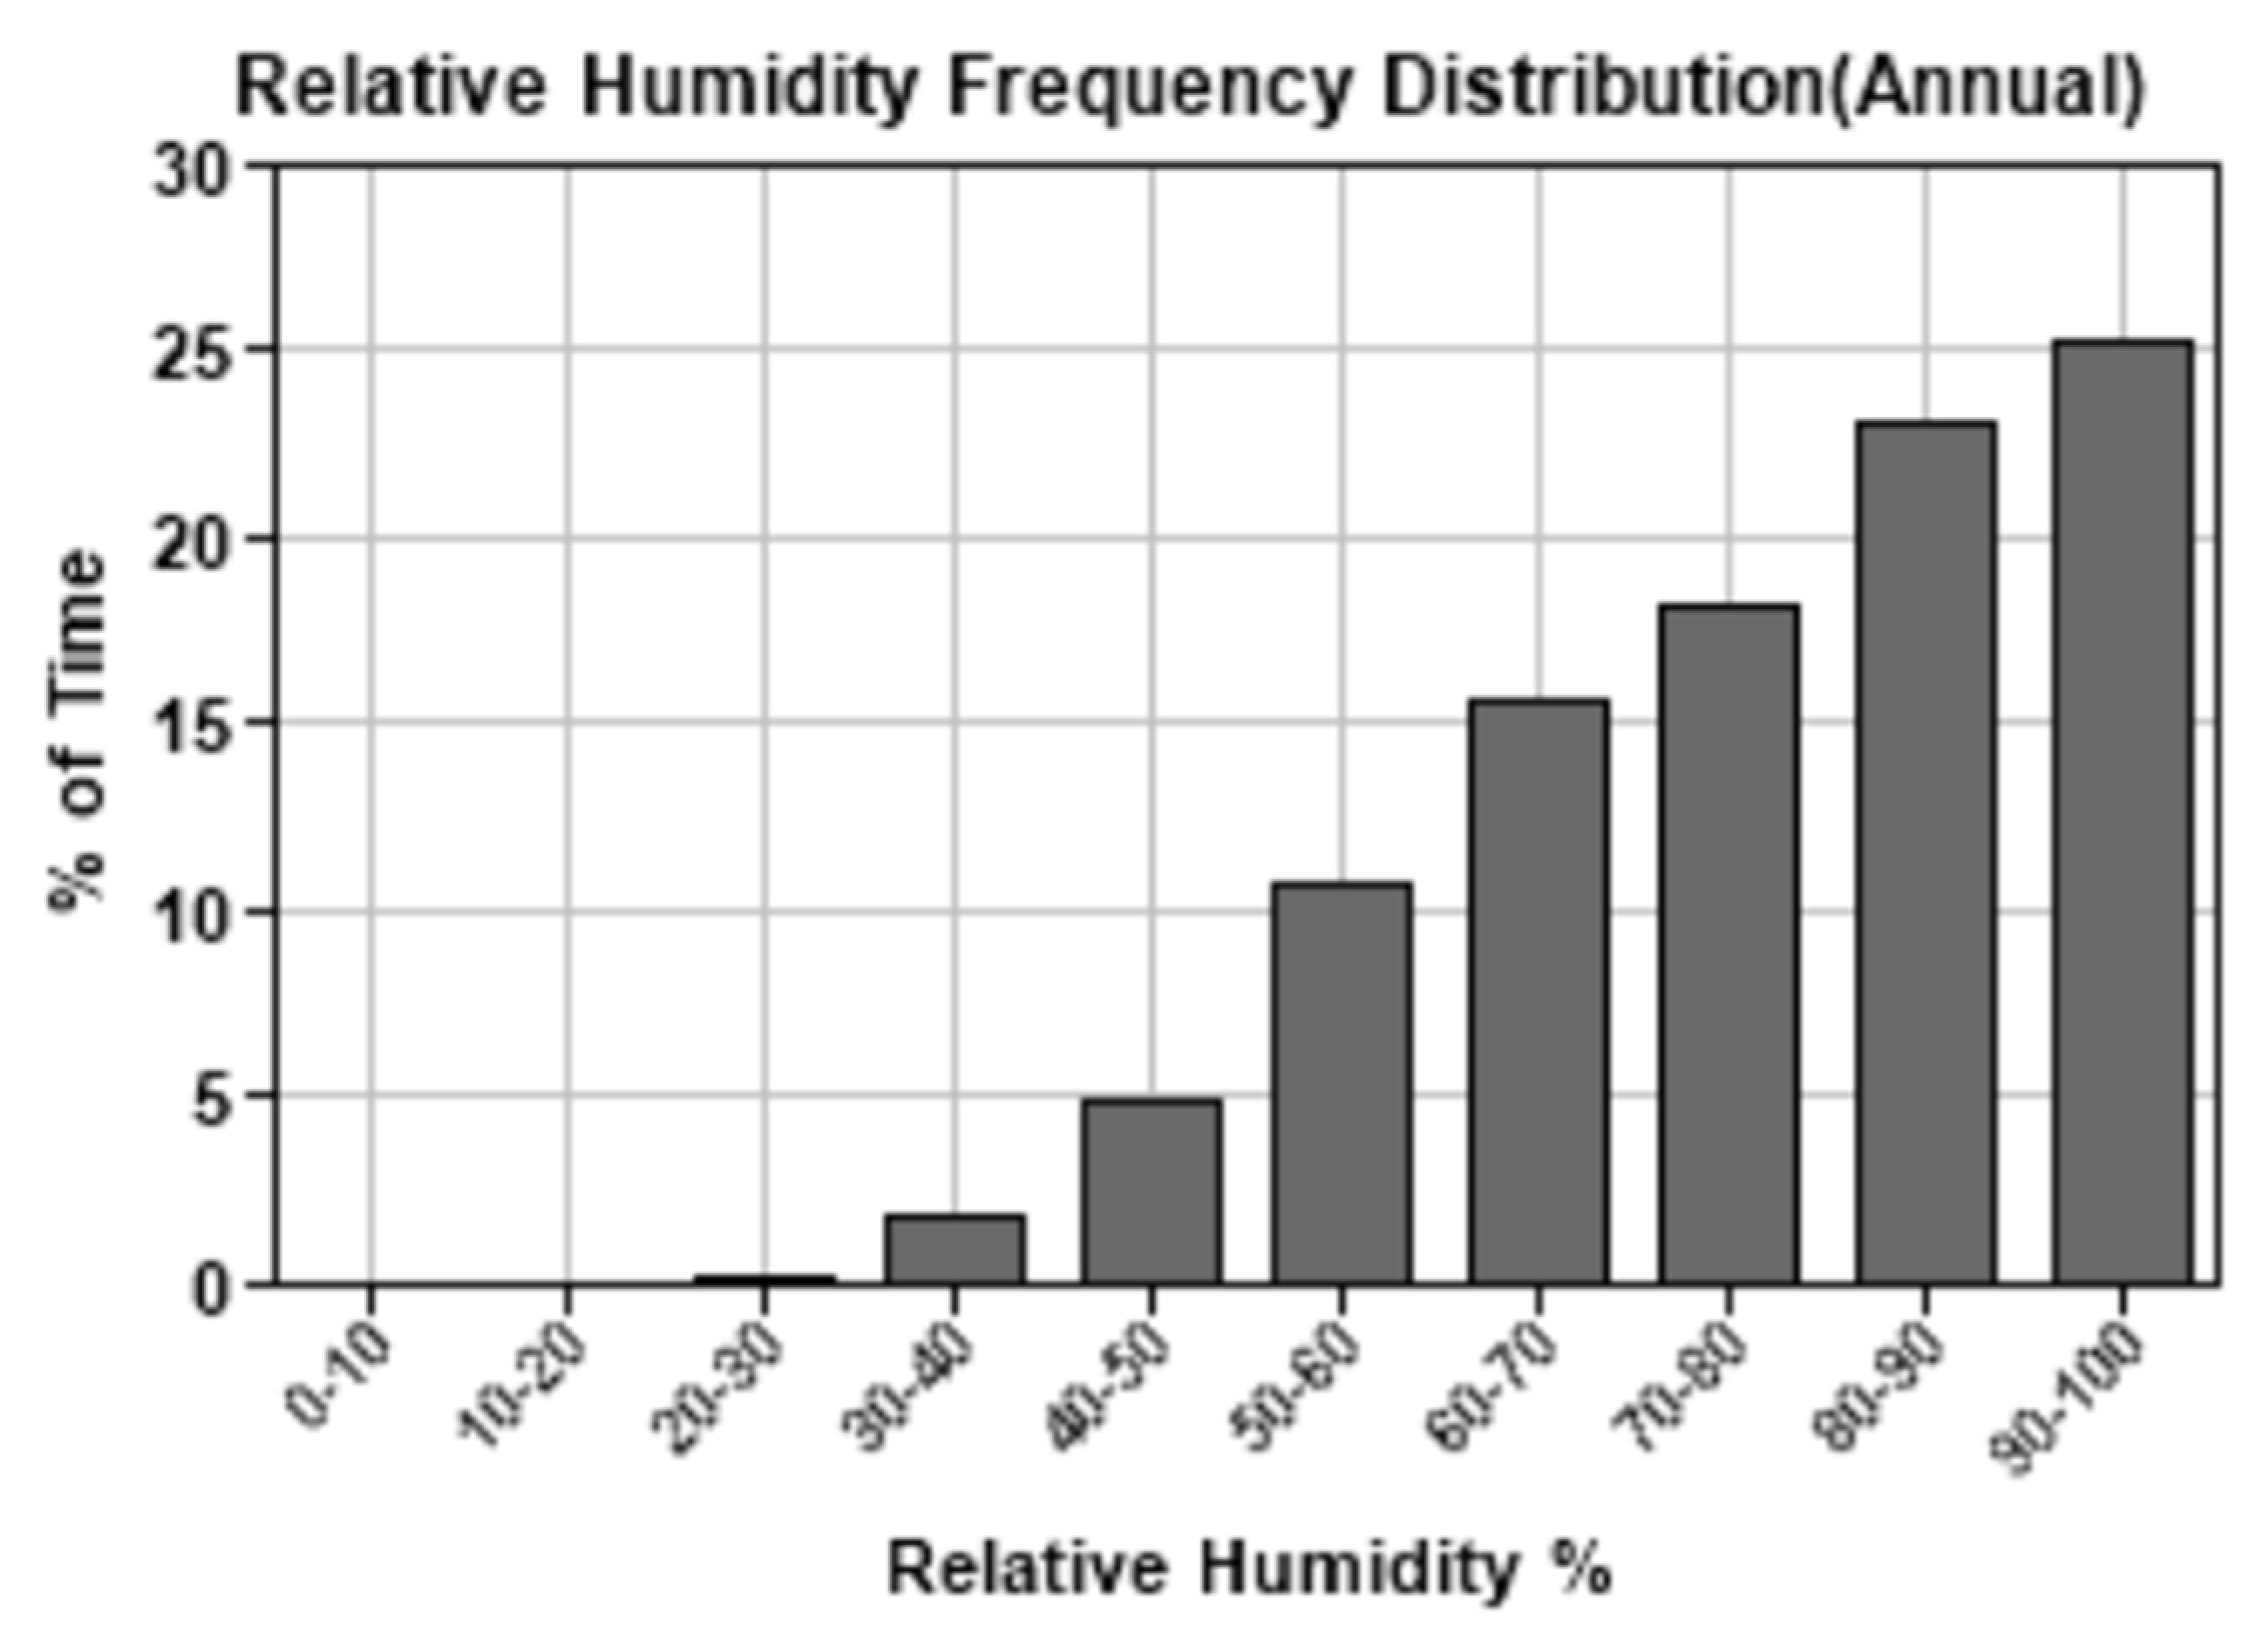
Collecting data on the weather at the construction site is crucial, and is an input factor for the energy simulation model. The authors have selected a nearby weather station with the ID code of 633598, located approximately 6.1 km northwest of the construction site in Hanoi. According to data provided by the local weather station, the month of June experiences the highest temperatures, typically ranging between 33–36 °C. Conversely, December sees the lowest temperatures, with readings typically falling between 7.5–10 °C. The critical weather parameters at the construction site are shown in the charts in
Figure 7,
Figure 8,
Figure 9 and
Figure 10.
4.2. Initiating the 3D Model of the Construction Project
Based on the 2D drawings and data collected on the architectural structure, construction site, weather conditions, and complex HVAC system, the research team used Autodesk Revit software to model the construction project in the architectural model format: building volume and surrounding elements (walls, doors, windows, roof, floor, ceiling).
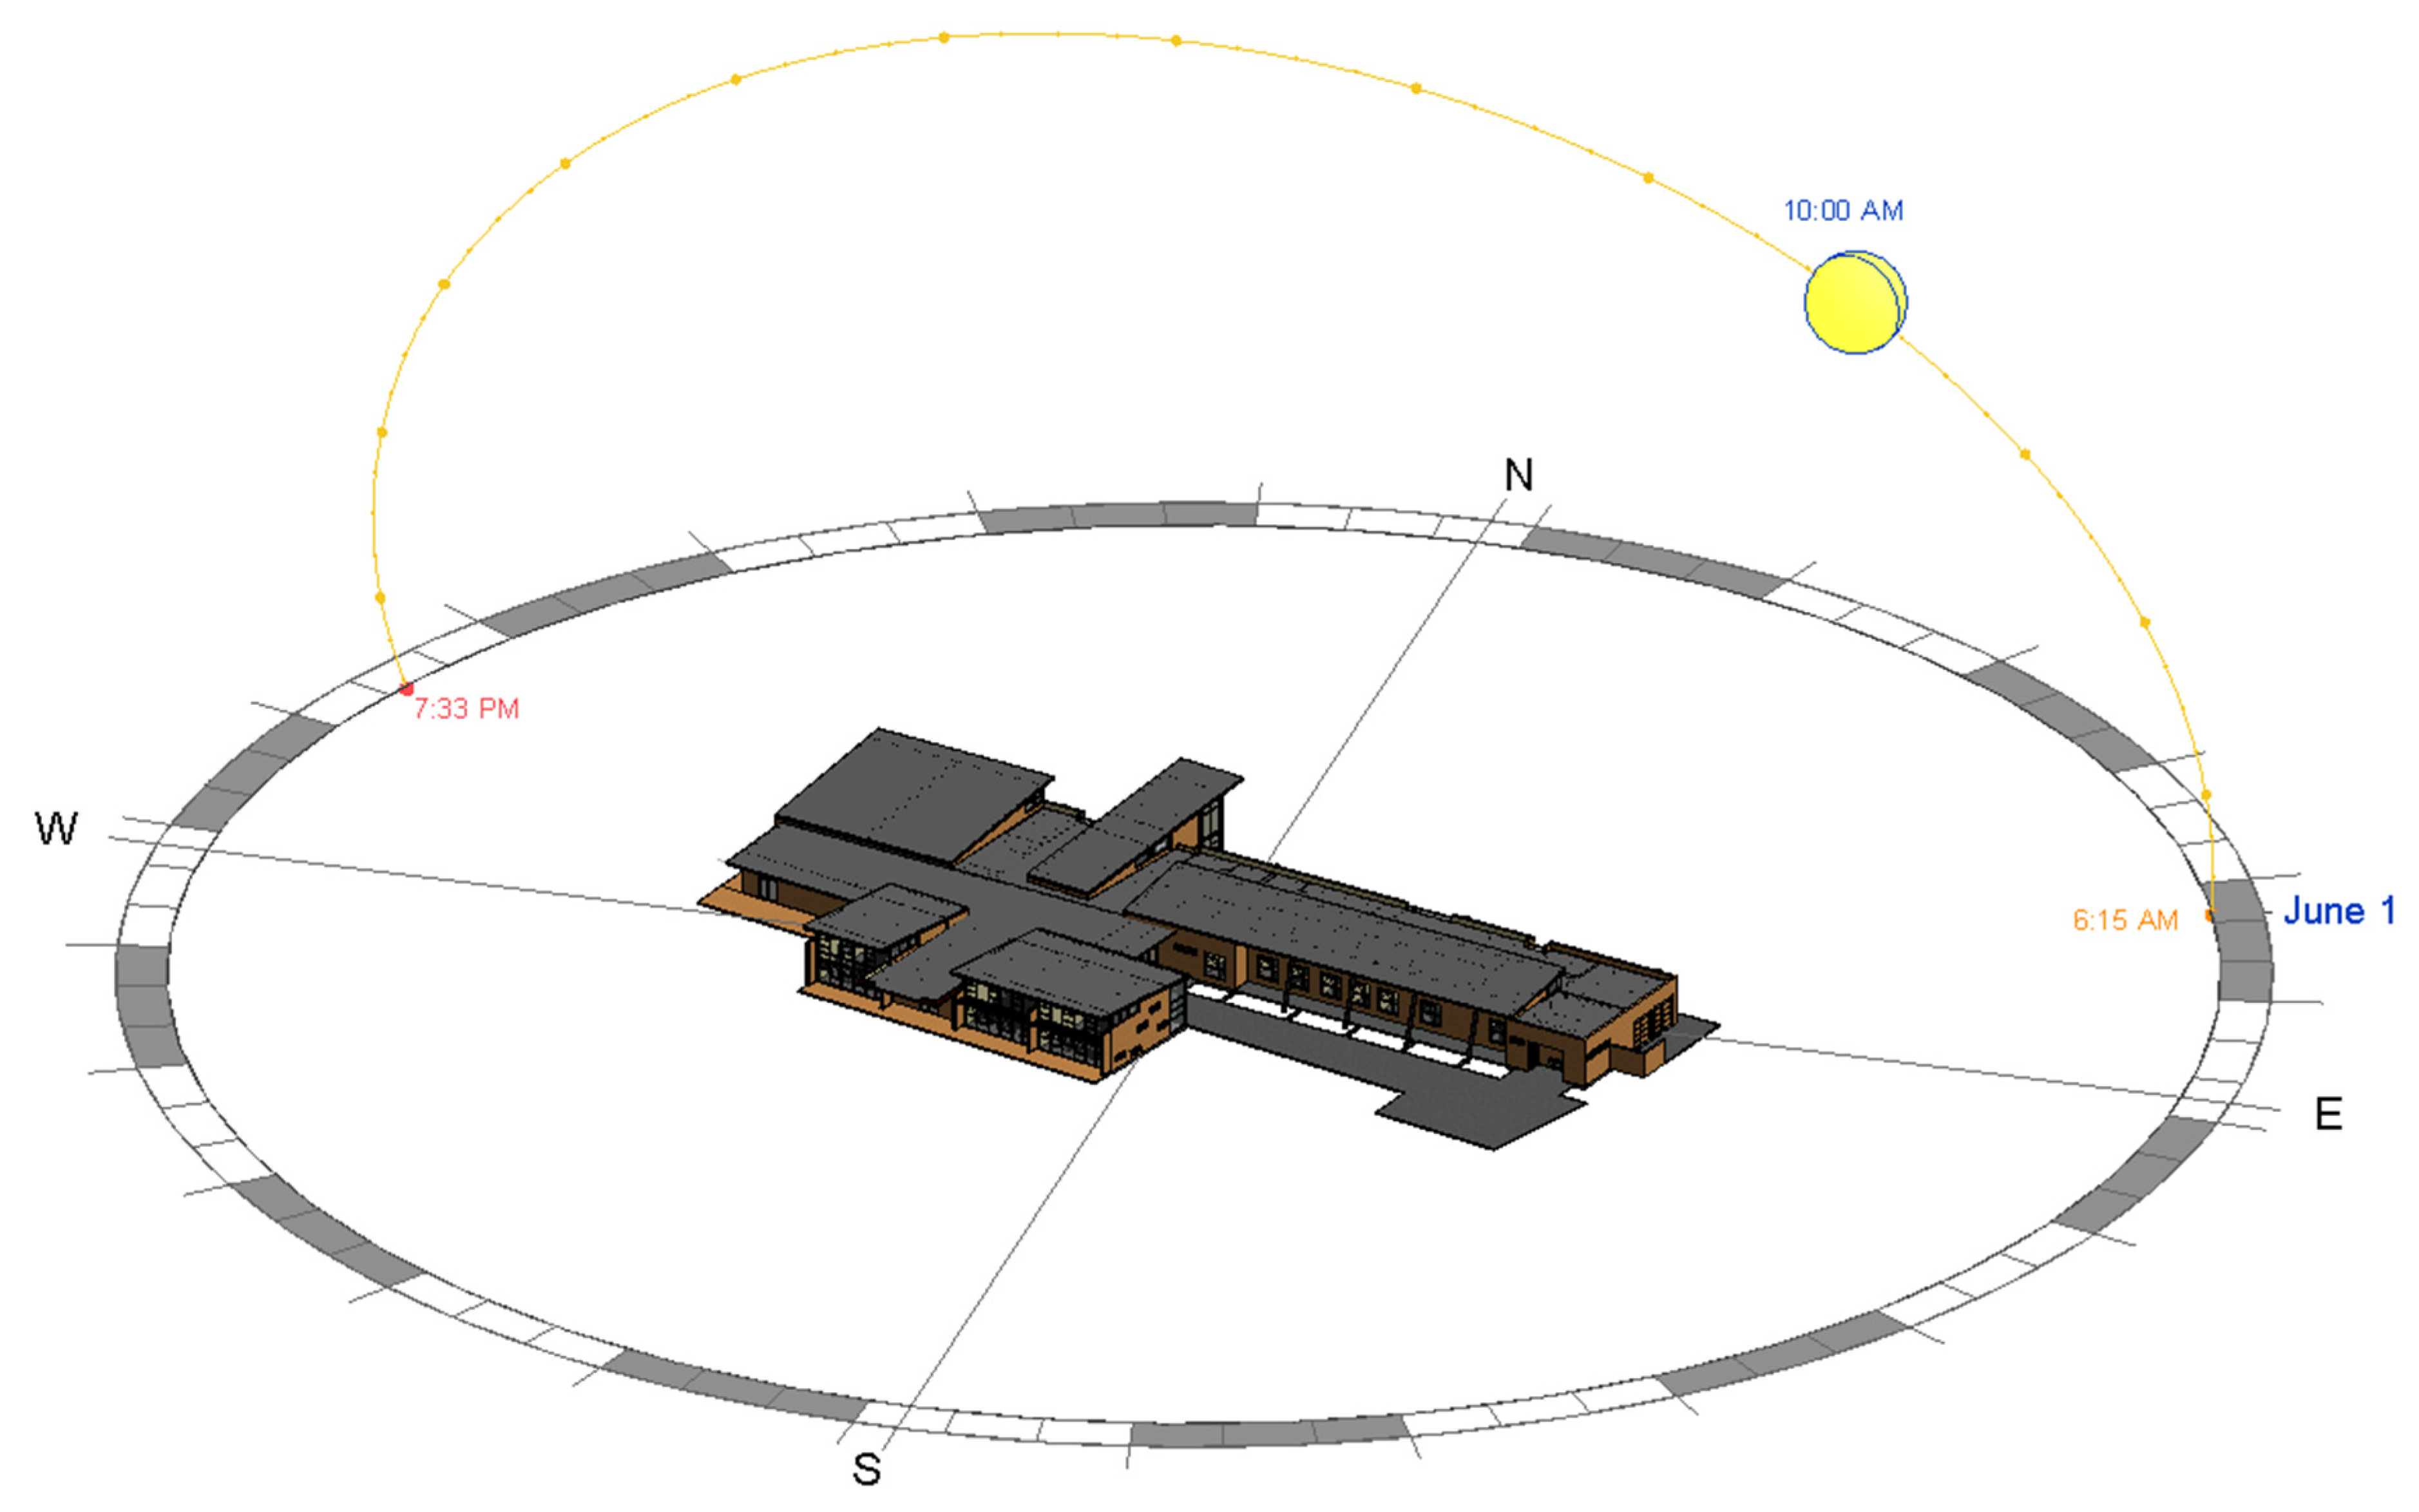
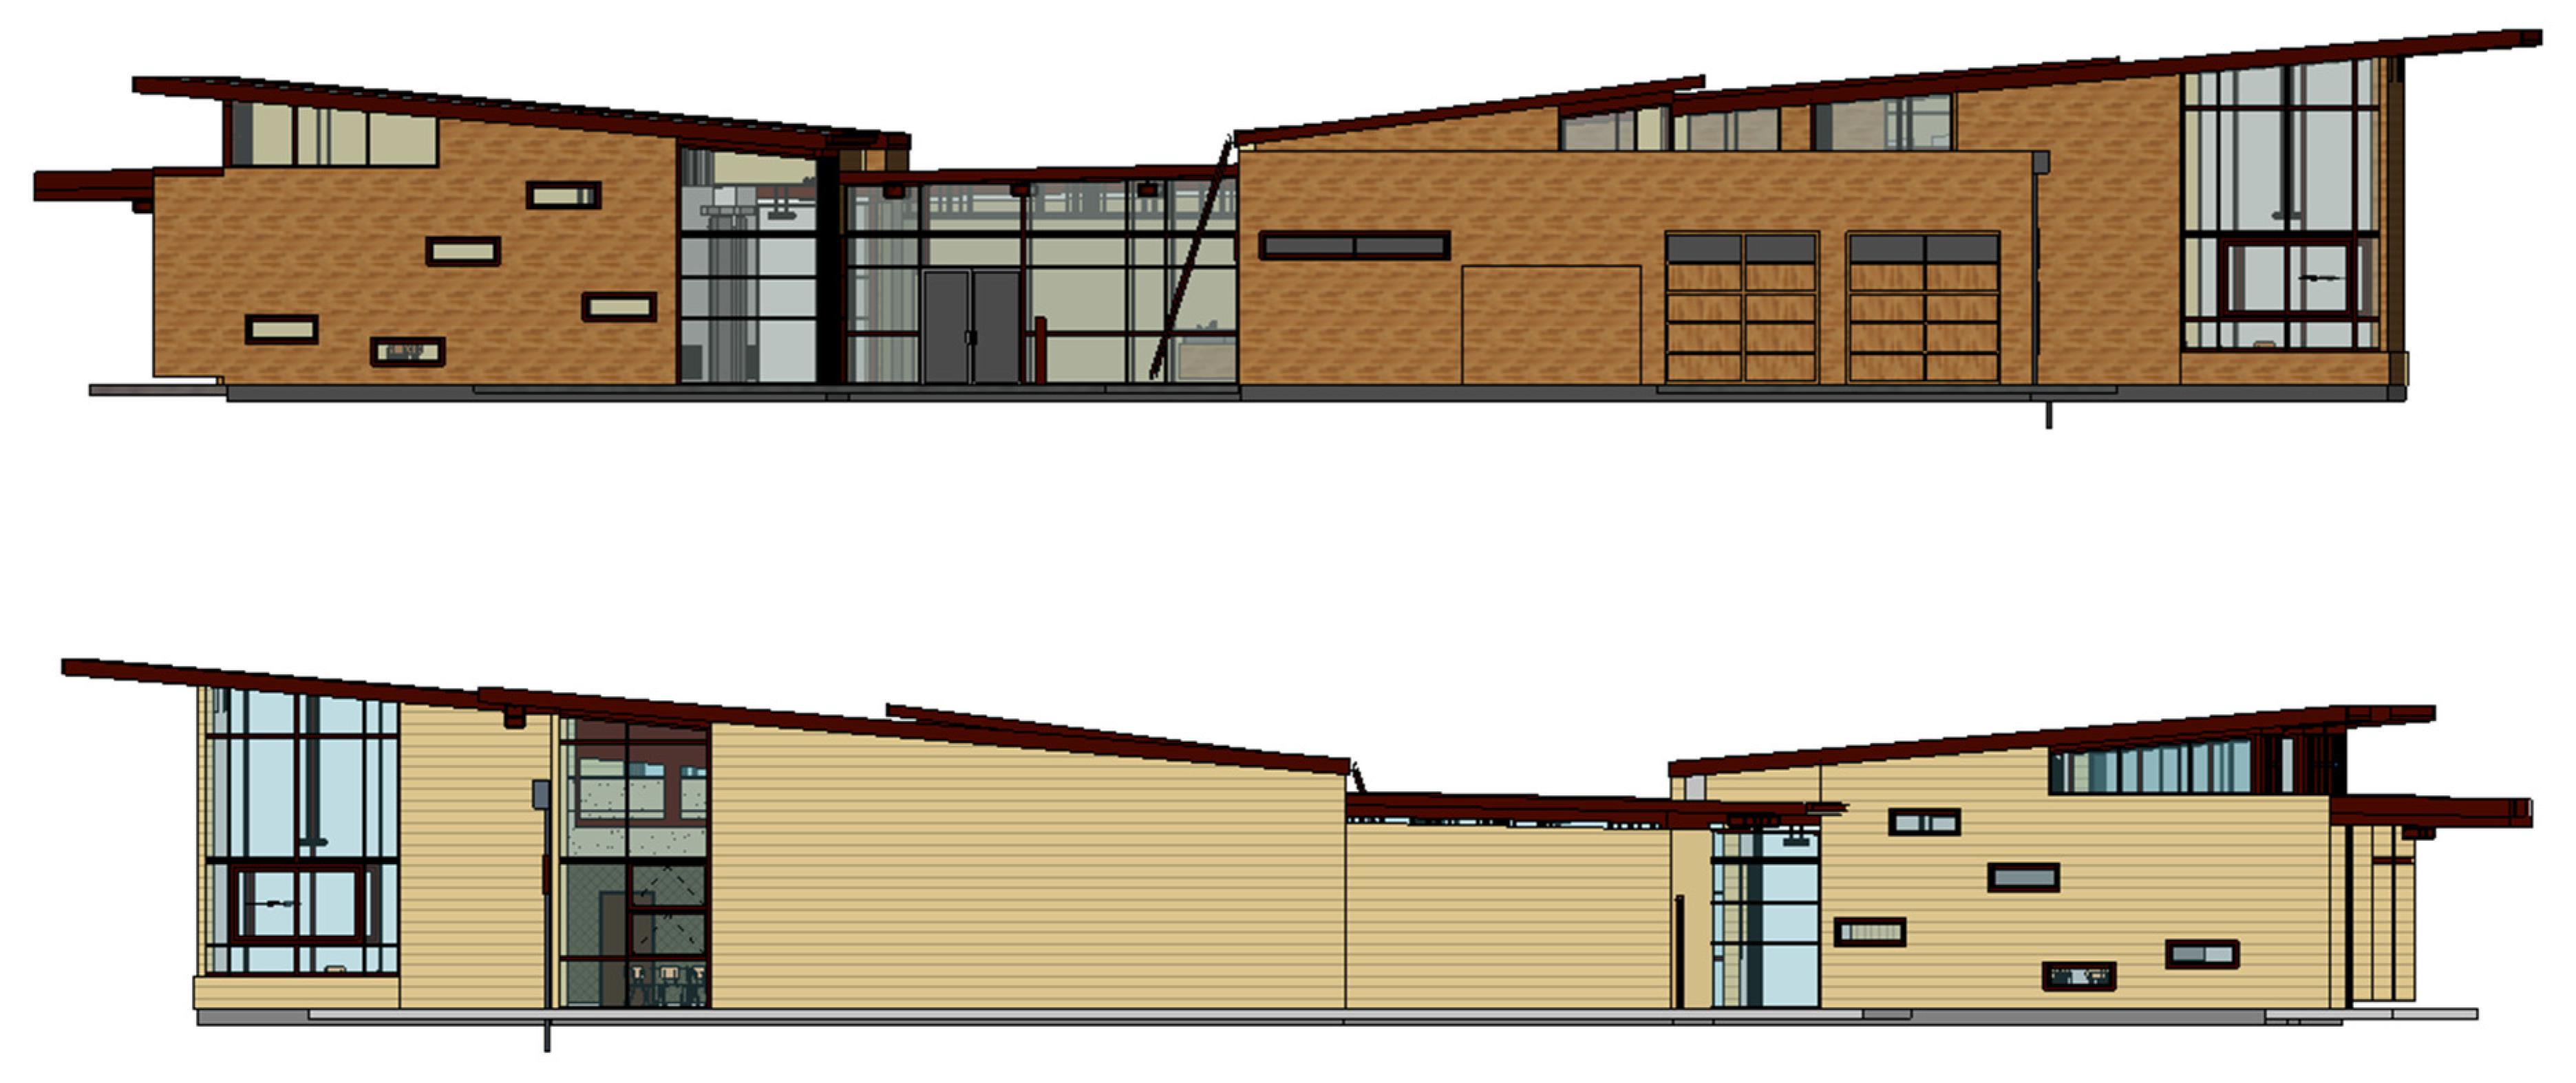
To enable the energy simulation process, the 3D architectural model initiation must meet the specific requirements of the request. The research team had to draw or model the components and structural elements of the project with complex structures to ensure the most effective energy simulation, especially for the interior spaces and the outer envelope surfaces of the construction project (
Figure 11,
Figure 12 and
Figure 13).
The energy model is a geometrical representation employed by building simulation software such as Revit to evaluate optimization. It is a common technique that involves reconstructing buildings in three-dimensional (3D) space, based on declared project data, to calculate and analyze energy indices. Some critical design parameters in the construction and energy modeling process are summarized and presented in
Table 3. In particular, the next stage declares surface elements and main components with correct material types corresponding to different U-values for effective energy simulation.
4.3. Energy Simulation of Green Building Studio and Autodesk Insight
The energy model is a geometric representation constructed using planes that transform building components into surface shapes with U-value parameters to determine the heat load and energy consumption of a building. This modeling technique is widely used to reconstruct buildings in 3D space for analysis and calculation using online and offline tools. By utilizing the energy model, users can optimize the selection of building materials to improve energy efficiency.
From the simulated 3D architectural model, the author initiated an energy model in BIM, including the energy analysis support tools and model setup, with the following initial settings: operating schedule of the construction, HVAC system set to default for classroom use, and the declaration of operation time as well as the calculation of other indexes as required (
Table 4).
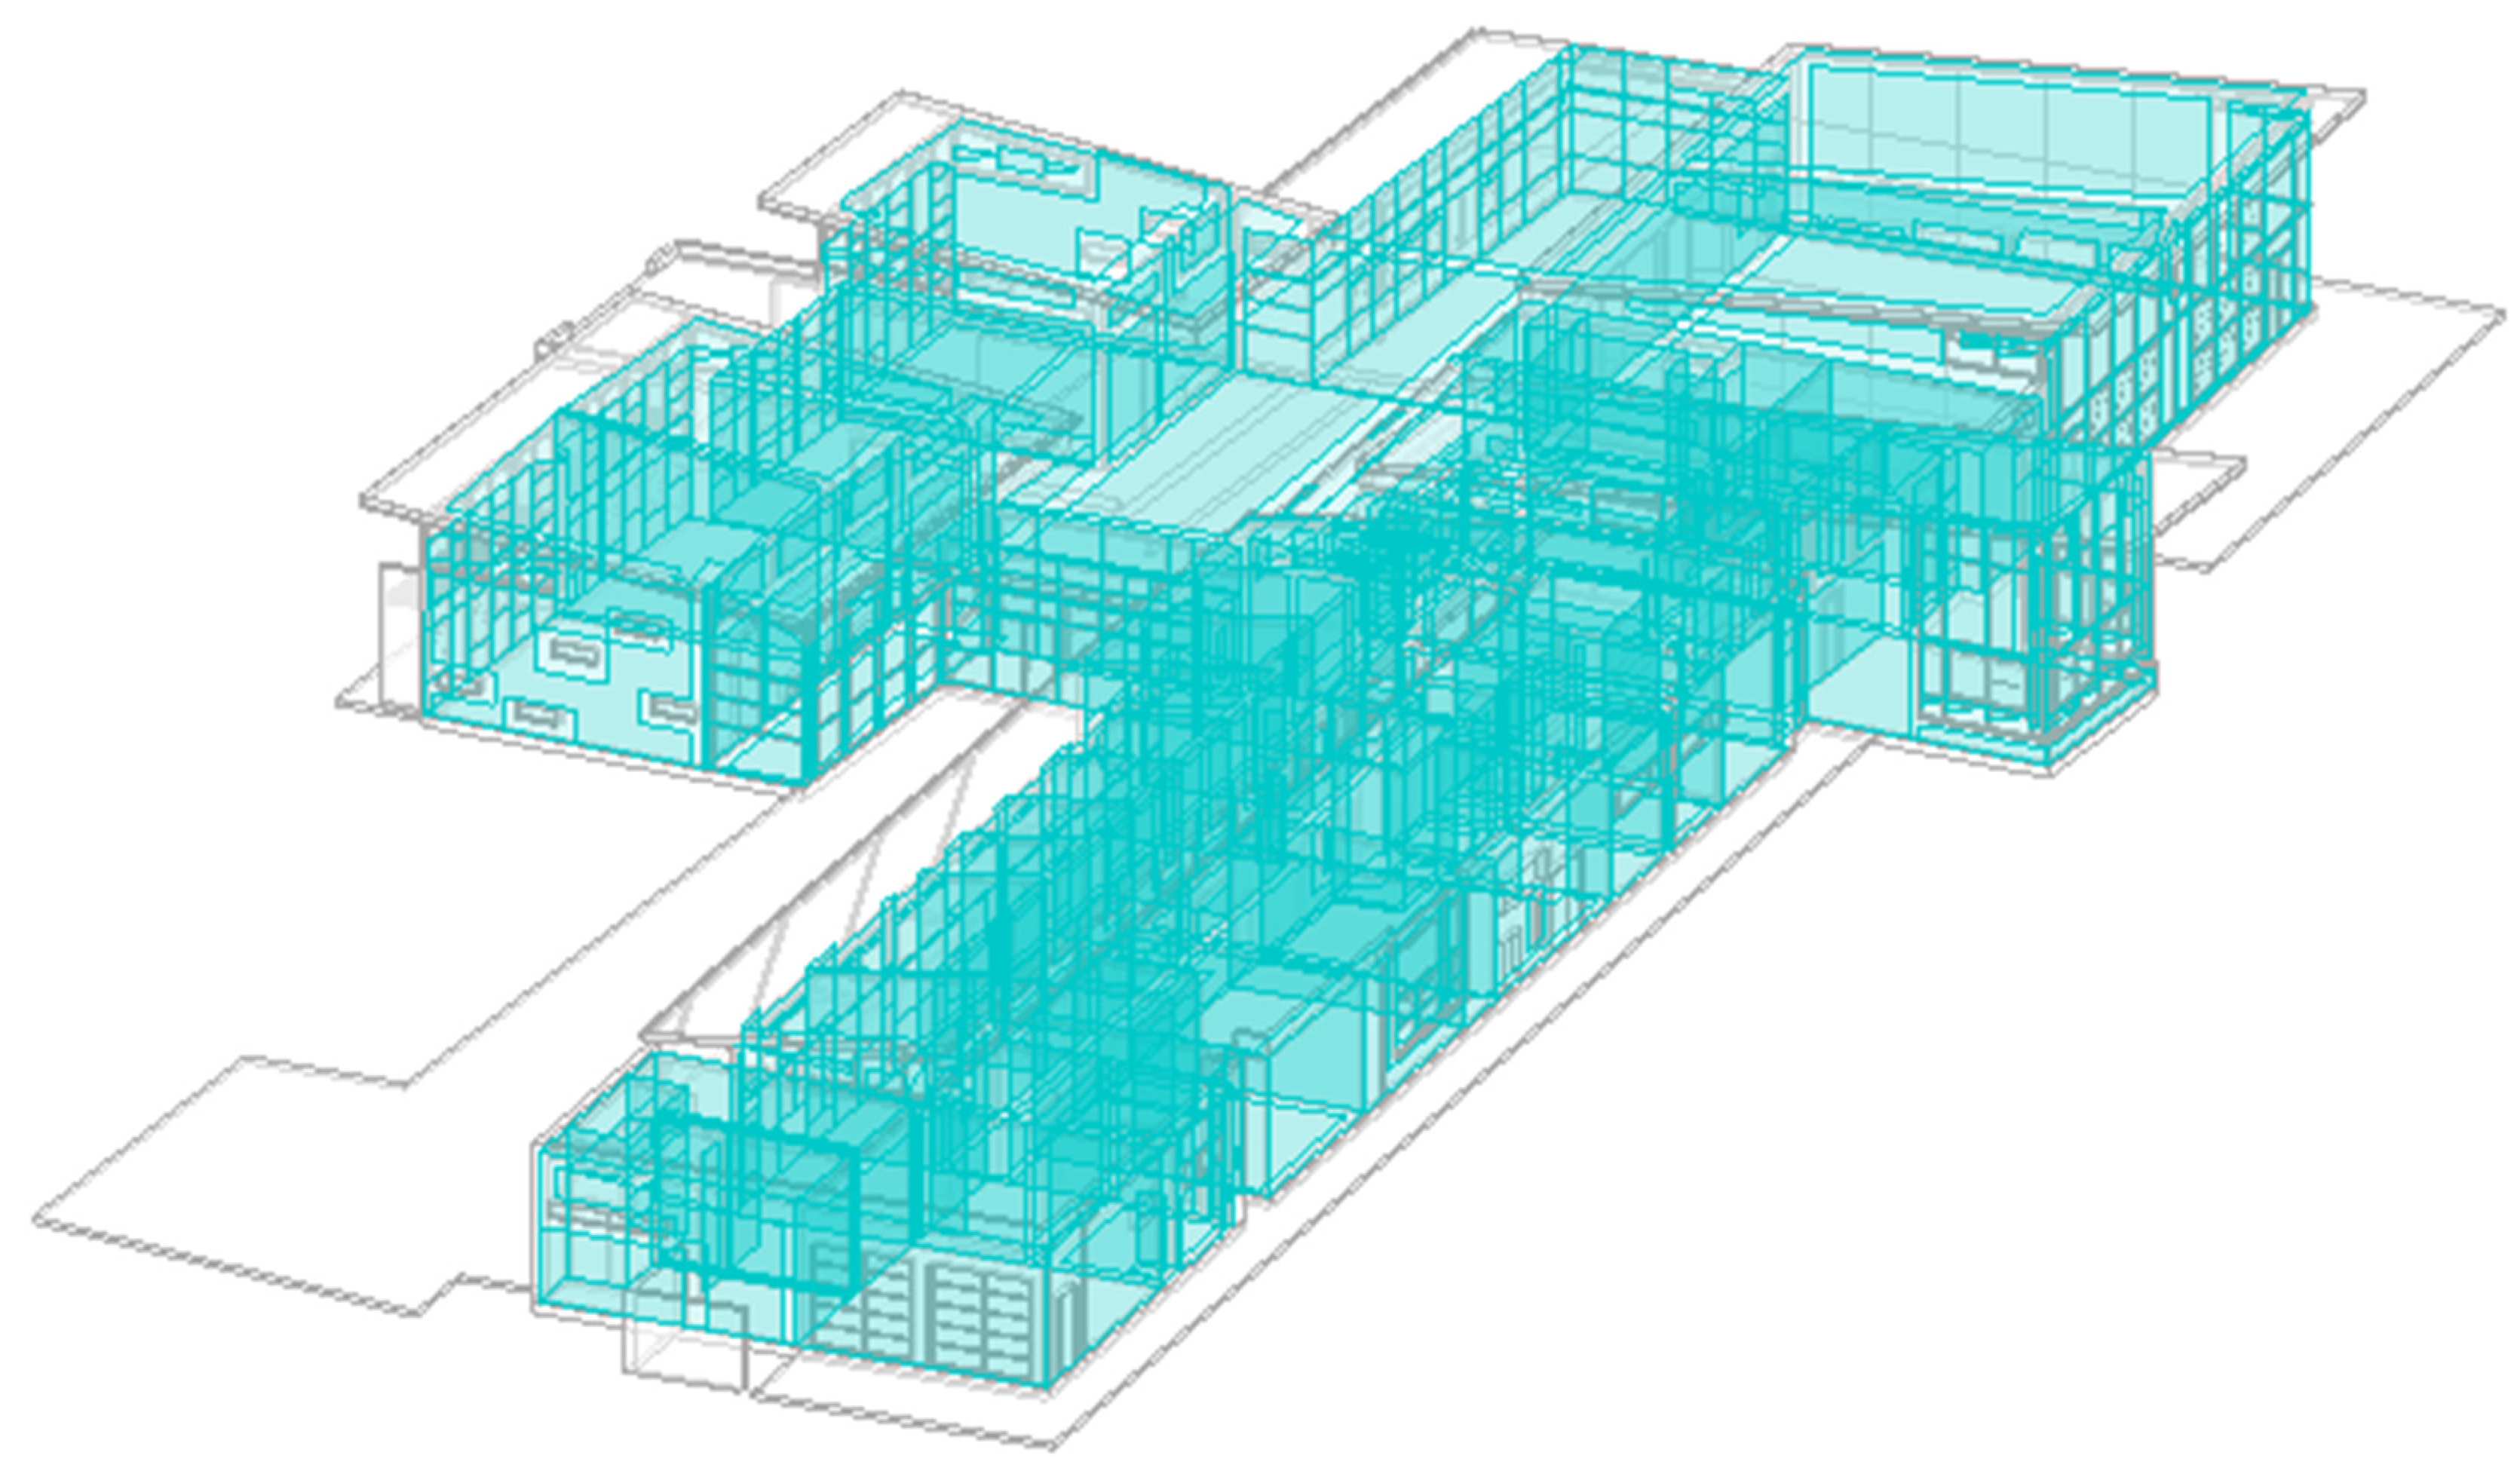
After entering the necessary energy parameters, the Simulation Energy feature in Revit is used to create the BEM energy model. When the simulation is complete, the energy model will be exported to a gbXML file and uploaded to the Autodesk Cloud. This output data will be used as an input for the GBS and Autodesk Insight 360 tools to continue the energy analysis process (
Figure 14).
As mentioned, the energy model analysis is created from the Room Bounding elements in the Revit model. The result is a simplified model consisting of surfaces similar to a SketchUp model (
Figure 14). By selecting the surfaces and adjusting the 3D Energy Model view’s display options, designers can ensure that there are no anomalies before starting the simulation [
40]. To ensure the best energy simulation process, the surfaces must be adjusted after transformation to ensure that there are not too many gaps on the energy-intensive surface which could cause energy loss and leakage during the simulation (
Figure 15).
Studies have suggested that users should only use the “Use Conceptual Masses and Building Elements” or “Use Building Elements” feature to run the simulation most efficiently, particularly with regard to declaring and setting the parameters before running the simulation. The “Use Conceptual Masses” feature is no longer recommended for energy simulation processes. To simulate effectively, a combination method (Use Conceptual Masses and Building Elements) should be sufficient when running simulations in case some material layers are not fully declared (
Figure 16).
4.4. Simulating Design Options for the Construction Surface
During this step, the GBS tool will automatically execute 247 simulations to generate the energy intensity (EUI-kWh/m
2/year) and the related energy usage costs for each modification made to the design option. The energy model in
Figure 14 is also imported into the Autodesk Insight tool to extract material layers and propose design options with predicted energy indexes (
Figure 17). The simulation tool also outputs charts of energy use intensity (EUI-kWh/m
2/year) for simulated options with various alternative replacements. In particular, it identifies the best design option corresponding to the highest efficiency EUI index. Around the world, many countries calculate EUI (kWh/m
2/year) and require it as an energy evaluation certificate for all home buyers or construction managers [
44].
The author will focus on analyzing the major factors affecting the EUI index of the construction on the Autodesk Insight tool to select an ideal case with the most reasonable energy indexes. In this project, the study proposed changes and simulated energy with regard to four main factors: Building Orientation (BO), East-facing Window to Wall Ratio (WWR-East), Window Glass Type (WG), and Wall Insulation Type (WC). The default parameters proposed in Autodesk Insight are described in
Table 5 and
Figure 18.
In addition to the primary wall types in the initial BIM design model, we use various other types, such as Uninsulated, R13 Metal, R13 Wood, 14-inch ICF, 12.25-inch SIP, and R38 Wood, where (1) Uninsulated: An uninsulated wall is a basic construction wall without any insulation layer added. Uninsulated walls do not effectively prevent heat transfer, leading to heat loss and increased energy costs. (2) R13 Metal: This is a thermally insulated wall with a metal frame using insulating materials with an R13 insulation value. The R-value is a unit of measurement for the insulating effectiveness of a material. R13 is a typical value in the construction industry, providing a relatively good level of thermal insulation. (3) R13 Wood: This is a thermally insulated wall with a wooden frame, using insulating materials with an R13 insulation value. Similar to R13 Metal, the wall frame is made of wood. (4) 14-inch ICF (Insulated Concrete Forms): This is a reinforced concrete wall that includes insulating materials, with a thickness of 14 inches. ICF is a popular construction system that combines insulation and reinforced concrete to create a high-strength and thermal performance wall. (5) 12.25-inch SIP (Structural Insulated Panels): This is a wall constructed with structural insulating panels with a thickness of 12.25 inches. SIPs are panels consisting of an insulating core material (usually foam) sandwiched between two layers of rigid material, such as plywood or foam board. They provide good thermal performance and minimize heat loss. (6) R38 Wood: This is a thermally insulated wall with a wooden frame that uses insulating materials with an R38 insulation value. The R38 value indicates a higher insulating performance compared to R13, helping to reduce heat loss and save energy.
For window glass, in addition to the initial BIM design model types, we use many different ones, such as SgI Clr, DbI LoE, DbI Clr, and Trp LoE, where (1) Trp LoE (Triple Low-Emissivity): A triple-pane glass with low-emissivity properties. Low-E glass is coated with a thin metallic layer that reduces heat transfer and energy loss. Triple-pane Low-E glass has better thermal and sound insulation performance than regular glass. (2) DbI Clr (Double Insulated Clear): A double-pane glass without a Low-E coating that is transparent. This glass has better thermal and sound insulation performance than single-pane glass, but is less effective than double-pane glass with a Low-E coating. (3) DbI LoE (Double Insulated Low-Emissivity): A double-pane glass with low-emissivity properties. This glass has a metallic coating that reduces heat transfer and energy loss. Double-pane Low-E glass has better thermal and sound insulation performance than regular double-pane glass. (4) SgI Clr (Single Insulated Clear): A transparent single-pane glass without a Low-E coating. This is the simplest type of glass, with the lowest thermal and sound insulation performance among the types of glass mentioned.
First, it can be observed that adjusting certain design aspects, such as orientation and wall type in this case, impacts the overall performance, specifically in changing the EUI index during simulation (
Figure 19).
Figure 19 shows that factors such as orientation, wall material type, glass type, and window-to-wall ratio affect the EUI during simulation. For each distinct design scenario, the variation of EUI values was recorded and presented in four charts, as illustrated in
Figure 19. These factors include (a) Orientation: The orientation of a building affects how it receives sunlight and wind. Choosing an appropriate orientation (e.g., a 90-degree rotation) helps to reduce energy consumption for lighting and cooling, while maximizing the use of natural light and wind. As a result, the EUI is improved. (b) Wall material type: Construction materials influence the insulation and thermal retention capabilities of a building. Materials with good insulation properties (e.g., 14-inch ICF walls) help reduce energy consumption for heating and cooling systems, thus lowering the EUI. (c) Glass type: Glass is an essential factor in controlling the temperature and natural light of a building. Using an appropriate glass type with good insulation, absorption, and reflection of sunlight (e.g., Trp LoE) helps reduce energy consumption for lighting and air conditioning, resulting in a lower EUI. (d) Window-to-wall ratio: The window-to-wall ratio affects the amount of natural light and interior temperature of a building. A reasonable window-to-wall ratio (e.g., 15%) helps to utilize natural light, reduce energy consumption for lighting, and control indoor temperature, thus reducing the energy demand for cooling and heating systems and lowering the EUI. Combining these factors appropriately will help improve the EUI of a building, save energy, protect the environment, and reduce the energy costs for the building.
4.5. Results Analysis and Optimal Selection of Building Envelope Options
The author conducted a systematic variation of each variable to determine the EUI and cost of the model depicted in
Figure 19. From the simulation results (as shown in
Table 6,
Table 7,
Table 8 and
Table 9) corresponding to each design variation, the author identified the average EUI indices, from which the scheme with the cost of energy usage and the lowest EUI was selected. Furthermore, this finding was combined with the other options of the remaining variables to suggest the most feasible building envelope design with the cost of energy usage and the lowest EUI to the designers.
The parameters of the baseline and optimized cases are presented in bold formatting. The collected data shows that changing the type of the enveloping wall plays a crucial role in the design when aiming for energy efficiency for the selected building. This change also results in the lowest simulated energy cost.
Furthermore, based on the simulated data from the four design factors, the author proposed a combination of the four factors with the best simulated values. To evaluate the effectiveness of the proposed model, the authors calculated and compared it with the energy value of the initial design option (
Table 10). The presented energy indicators show that the building achieves energy savings when implementing the proposed design option according to the energy model.
Figure 20 presents the results of the EUI reduction and energy cost for various design scenarios, including Building Orientation, Window-to-Wall Ratio (WWR)-East, Glass type for window, and Wall Type. A comparison between the EUI and energy cost of the baseline and integrated solution is also included. Regarding the change in building orientation, the EUI value decreased by 9.06% compared to the baseline design by rotating the building 90 degrees. Regarding the WWR-East, selecting WWR-East = 15% resulted in a 12.57% reduction in EUI compared to the baseline design. Changing the type of glass for the building to Trp LoE also reduced the EUI value by 12.29%. For the wall type, choosing 14-inch insulated concrete form (ICF) walls was most effective in reducing EUI, with a reduction of 11.98% compared to the baseline design. Moreover, combining these optimal design factors to create an integrated solution resulted in a significant reduction in EUI compared to the baseline design, with a reduced rate of 39.47%. This is a critical outcome in proposing building design changes to achieve energy-efficient construction.
Two primary parameters are required to compute the energy values: the electricity unit price of USD 0.072 per kWh (based on the current rate in Vietnam) and the total floor area of the construction, which measures 1490 m
2. Therefore, compared to the base case, the proposed solution can save USD 16,136 per year, equivalent to 201,150 kWh/year (
Figure 20). Based on the calculation and simulation results, the proposed solution from the BIM-BEM model analysis will be the basis for managers and architects to reference and make decisions for building designs that aim to save energy and reduce operating costs.
5. Conclusions
This study has addressed the issue of converting building information models from BIM to energy model BEM to analyze and select the construction surface options that focus on using energy efficiently. By employing the BIM environment, the study was able to develop an energy model of an actual public building and determine the EUI and annual energy expenses for various scenarios. The system alters design and construction factors to minimize EUI and energy consumption. To achieve energy-efficient construction, the study employs simulations to calculate energy indices for different building design options, such as wall cladding materials, glazing materials, and window-to-wall ratios. Building and simulating BIM and BEM for new wall types will contribute to the promotion of the design process to evaluate energy as a basis for architects and managers to choose smart and efficient materials to use. By using appropriate materials suitable for the climatic conditions of Ha Noi City in Vietnam, the proposed system can change the design and construction process to reduce energy intensity and usage costs in the building.
The proposed model will benefit engineers in general and architects in particular with regard to the design, consulting, and evaluation of the energy consumption level of construction and the environmental impact level. Furthermore, applying the proposed model to simulate an actual construction is very important in evaluating energy use in an existing building, thereby proposing the renovation of a structure to a brighter, more energy-saving one.
This study focused on the energy simulation of a building during the initial design phase of a project. Evaluating the effectiveness of the model compared to reality can only be carried out once the building has entered the operational phase. In future research, verifying the accuracy of optimal design solutions for energy-efficient building performance compared to real-world conditions requires an examination of design details and an inspection after the building is constructed. Consequently, the actual energy consumption can be monitored and compared to the simulation’s expected energy performance. This step helps validate the optimization process and identify discrepancies between the design and actual performance. However, this requires additional physical equipment, time, and implementation costs. In subsequent research, the author will use actual building energy measurement devices to assess the error between the Building Energy Modeling (BEM) and real-world building usage conditions. This will allow for the selection of effective energy solutions during the building’s operational phase.
In addition, the authors plan to propose an integrated model of BIM, BEM, and AI algorithms to optimize various types of building envelopes by considering energy performance, cost, and different sustainability goals, particularly those related to environmental and social expert assessments. This research will contribute to the promotion of sustainable and energy-efficient construction practices, which are critical in addressing global environmental challenges.
