1. Introduction
The discovery and use of fossil fuels can be viewed as the main foundation of humankind’s prosperity, growth, and well-being [
1]. Coal, oil, and gas have been in the center of the industrialized world since the early 1800s and they constitute the main driving force of economic and social growth in the world [
2]. Fossil fuels are still used to cover most of the world’s energy needs and this usage is expected to increase more in the future, due to the expected increase in the global population and the new, energy-intense way of life [
3].
The disadvantages that emerge from the usage of fossil fuels are many and significant. Fossil fuels are primarily responsible for enormous greenhouse gas emissions into the atmosphere, and they contribute on a great level to global warming, something that could be proven catastrophic for the environment as well as for human health, life, and civilization as we know it [
4]. In addition, fossil fuels are finite, and some scientists believe that they might reach their peak soon [
1]. Their depletion means that the world should not rely on them anymore and, instead, turn to alternative sources.
All the disadvantages that come as a result from the use and combustion of fossil fuels make it obvious that the world should focus on alternative energy sources, or other energy saving methods and measures for the mitigation of GHG emissions [
5]. A transition to renewable energy sources for the satisfaction of our energy needs is considered to be essential to address climate change and achieve the target of limiting the global average temperature increase under 2 °C. Despite the fact that the usage of renewables has increased over past years, fossil fuels still cover around 80% of global energy demands, leading to an urgent need of change in future energy policies [
6].
To achieve a successful full transition to clean energy sources, it is important that energy R&D is promoted on a global level and that innovation, investment, and deployment policies and strategies regarding energy storage technologies are evolved and adopted by policy makers [
7]. Cities, which are the biggest energy consumer, should be a part of that transition, promoting a cleaner urban energy system that will lead to cleaner cities [
8]. In addition, the transition requires political support and efficient governance, as well as market designs and financial incentives [
9]. This transition, unlike other energy transitions that have happened in the past around the world, will have to occur rapidly to successfully tackle climate change. Even though it is supported that this transition is unlikely to happen within the next few decades, governments should promote and support such policies, while international agreements concerning the issue should be implemented [
10]. The COVID-19 pandemic that had an important impact on the global economy, has also widened the uncertainty of energy transition [
11].
Currently, the world highly depends on fossil fuels. This means that certain features are configured, while they provide stability regarding technological artefacts and scientific knowledge, market structures, practices, and regulatory frameworks [
12]. Based on that, a few experts argue that a transition to renewable energy sources would disturb the balance that fossil fuels have provided, and it would challenge the status quo. It is often believed that renewables might not be able to meet the global energy demand, because of their lower energy density, or that society and politicians will not adopt the best scientifically proven alternative that is available. Some experts argue that the implementation of Carbon Capture and Storage (CCS) is the best solution for CO
2 emissions mitigation and sustenance of the fossil fuels use at the same time [
13], but it is found to be a more expensive and riskier alternative to renewables, while not being carbon neutral [
9]. In the literature, some studies have focused on the social and political impacts of renewables [
14], on their impact on social welfare [
15], as well as on their impact on local development [
16]. However, after taking both positive and negative impacts into consideration, most scientists believe that the transition to renewable energy sources is beneficial and is viewed as the best solution, in order to promote sustainability and energy security.
Energy poverty is another energy-related topic that is well-discussed in the recent literature. It refers to a situation where households do not have access to the necessary energy services, which are vital for the satisfaction of basic human needs [
17]. A household can be characterized as energy poor when it is lacking sufficient, affordable, and safe energy services [
18], something that is not observed in developing countries only; an important number of European households were found to be “fuel poor”, especially during the period of the global financial crisis [
19].
The linkages between the different types of energy sources and energy poverty, as well as between energy transition and energy poverty, have not been examined extensively in the existing literature. It is, however, a topic that should be addressed and the studies that focus on this matter could be used as a tool by policy makers for the successful implementation of energy-related strategies and policies, which have been in the center of many global initiatives for sustainability. For instance, the 7th Sustainable Development Goal proposed by the United Nations, referring to providing access to affordable and sustainable energy services for all, includes both the topics of energy poverty and energy transition to more sustainable sources [
20]. This study aims to contribute and expand the existing knowledge on the topic, examining the relationship between energy poverty conditions in 28 European countries for the years 2004–2019 and energy consumption coming from fossil fuels and renewables in households, using an advanced econometric methodology.
2. Literature Review
A significant number of studies in the current literature have been focusing on the topic of energy poverty. A review of the problem of energy poverty has been presented by Halkos and Gkampoura; the authors included in their review various definitions that have been given to energy poverty in the literature, as well as the impact that energy poverty has on human health, on the society, the economy, and the environment. In addition, various energy poverty drivers are identified, including household characteristics and other socioeconomic and environmental factors. The authors also analyzed the different approaches to measuring energy poverty and presented the situation currently occurring in different parts of the world regarding the problem. Various actions that could assist in tackling energy poverty are also presented in the review [
21].
The main approaches of measuring energy poverty that have been suggested in the literature include the expenditure approach, where metrics are compared to certain thresholds, and the consensual approach, where various indicators that are based on surveys can be used, while composite measurements can also be created [
22]. The Multidimensional Energy Poverty Index (MEPI), developed by Nussbaumer et al. [
23] is one of these composite indexes, which takes into account the multidimensional nature that energy poverty has, and it was used to estimate energy poverty for certain African countries. Based on the same index, energy poverty was calculated for certain Latin American countries by Santillán et al. [
24].
When it comes to European countries, the European Union Statistics on Income and Living Conditions (EU-SILC) provide measures and data that can be used to calculate energy poverty, including the indicators for measuring energy poverty that are suggested in the literature: (i) inability to keep home adequately warm, (ii) arrears on utility bills and (iii) presence of leak, damp, or rot in the dwelling. These data was used by Thomson and Snell [
25], who estimated fuel poverty for 25 European countries, by proposing a methodology of four different scenarios, where a different weight was assigned to each indicator. Based on this methodology, Halkos and Gkampoura [
26] in their research also created four different scenarios with different weights, in order to evaluate energy poverty conditions in 28 European countries for the period 2004–2019, while identifying the drivers of energy poverty conditions and the impact that the economic crisis had on them.
A stochastic frontier analysis approach was used by Rodriguez-Alvarez et al. [
27] to identify the determinants of energy poverty in 30 European countries for the years 2005–2018. The three previously mentioned indicators were also used by Bollino and Botti [
19], who combined them with two additional variables, developing the Energy Poverty Multidimensional Index (EMPI) to capture and evaluate energy poverty for 2012 and 2014 in Europe.
In the current literature, a few studies have examined the relationship between renewables and energy poverty, as well as between energy transition and energy poverty. Most of these studies support that a transition from fossil fuels to renewable energy sources will have a positive impact on energy poverty, helping towards its eradication. However, it is also argued in a few studies that energy transition could have negative results on energy poverty-related problems, unless certain measures are being implemented to minimize their damage.
More specifically, Mastropietro [
28] analyzed the effect that renewable energy sources for electricity might have on energy poverty. The author argued that the costs required to support renewables’ technologies are often transferred to the consumers as surcharges, something that could lead to more intense energy poverty issues. It is suggested that measures, such as state finance or finance through the auctions for emission allowances should be implemented, in order to minimize the social cost that will follow after energy transition.
Specific guidelines that should be followed in order to eliminate the problem of energy poverty by using renewable energy sources and, more specifically, solar energy, were presented by Pagliaro and Meneguzzo [
29]. The authors argue that energy poverty will be reduced if renewables are adopted for energy generation and they make specific suggestions to policy makers, such as: view energy poverty within its local social and economic context, get advice from energy managers with knowledge regarding new technologies in the sector and their socioeconomic impacts, make the community engage and be interested in the matter, and establish public institutions concerning renewables, with the target of providing education on the topic and strategies for a successful energy transition. These guidelines, according to the authors, will facilitate the transition process and will lead to environmental and socioeconomic benefits.
The linkages between energy transition and socioeconomic inequalities in Europe have also been explored in Bouzarovski and Tirado Herrero’s [
30] research, who emphasize the spatial and temporal variations in energy poverty’s incidence. The authors found that there are significant regional inequalities concerning the drivers of energy poverty and the exposure of the countries to them, meaning that energy poverty is a problem presented in a variety of social strata. They also pointed out that energy poverty has increased in the EU since 2007 in general, even though energy transition does not have an extreme impact on these inequalities, according to the authors’ results. Further investigation concerning the risks that result from energy transition is strongly suggested.
The case of the UK was studied by Hiteva [
31], who examined the potential impact that energy transition might have on fuel poverty. The author took into consideration the conditions of energy transition and the costs, risks, and financial liabilities in the industry of renewable energy, that could have a negative effect on energy poverty. The case of the UK was analyzed and then compared with Bulgaria, the country with the biggest percentages of people living in energy poverty conditions in Europe. The author suggested that the issue of fuel poverty should be addressed throughout the whole renewable electricity production chain and not just at the consumption end and highlighted the need of implementing policies for fuel poverty alleviation throughout this chain.
The effect that energy poverty has on several development outcomes was analyzed by Adom et al. [
32], while taking into consideration the influence of green energy transition. The findings highlight that a transition to green energy could potentially reduce vulnerability and provide partial resilience regarding energy poverty shocks, while it could also facilitate the improvement of several development outcomes, including GDP per capita, poverty, and income inequality.
Based on these studies found in the current literature, it can be observed that the results regarding energy poverty and different energy sources linkages, as well as energy poverty and energy transition linkages vary, especially when focusing on different world regions. Even though the topic is discussed in the recent literature, it is significantly important to further examine this relationship. This study examines the linkages between energy consumption coming from fossil fuels and renewable sources and energy poverty indicators for 28 European countries, using an in-depth econometric methodology, that is presented in
Section 3. To the best of our knowledge, this methodology has not been used in any similar studies, while examining European countries and using recent data at the same time. In addition, a comparative analysis of energy poverty and energy transition conditions in three European countries is conducted, in order to better understand the progress of three countries with different socioeconomic and environmental conditions on these topics.
3. Methodology
For the analysis, data were collected for the three indicators that are considered to be the key elements of energy poverty, according to the current literature (
Table 1: Indicators 1–3). In addition, data were collected regarding GDP per capita, final energy consumption in households per capita, as well as final energy consumption in households by fuel (
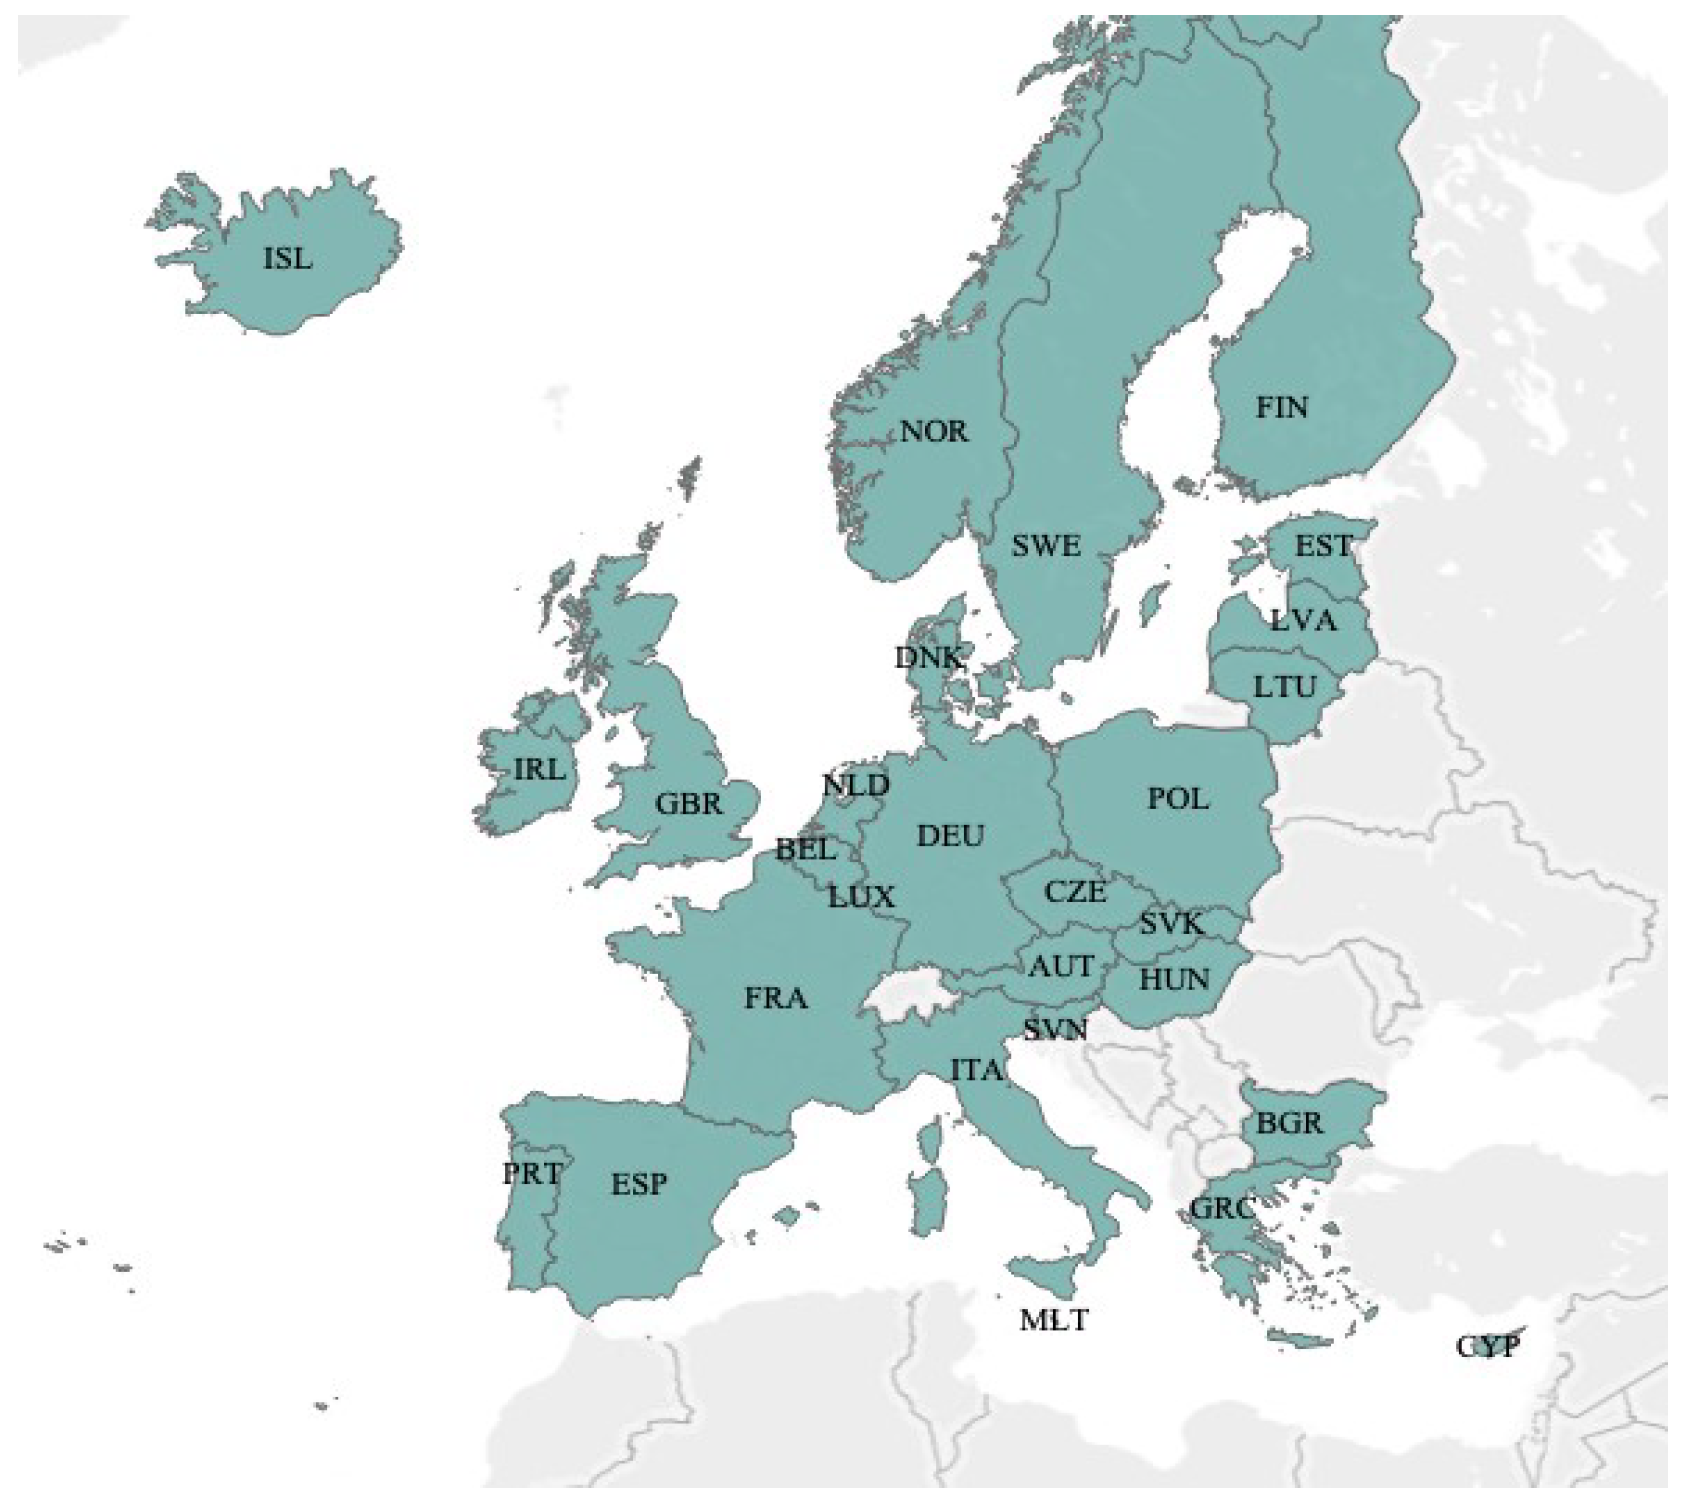
Table 1: Indicators 4–6). These last two databases were combined, in order to create two new indicators: FFpc, which stands for fossil fuels (oil and petroleum products, natural gas and solid fossil fuels) final energy consumption in households per capita, and RESpc, which stands for renewables and biofuels final energy consumption in households per capita. All data were retrieved from Eurostat’s database, for the period 2004–2019 and for 28 European countries (
Figure 1). Statistical packages EViews and Stata were used for the analysis.
The linkages that exist between energy poverty and fossil fuels and renewable energy consumption are examined, taking into consideration panel data for the years 2004–2019. After the use of Box–Cox specifications that compare linear and logarithmic forms, three different regression models are formulated, where Indicators 1, 2, and 3 (
Table 1) are considered as dependent variables, and GDP per capita, fossil fuels final energy consumption per capita, and renewables and biofuels final energy consumption per capita are considered as independent variables. The proposed model is:
In this regression model, GDPpc stands for GDP per capita, FFpc stands for fossil fuels final energy consumption in households per capita, and RESpc stands for renewables and biofuels final energy consumption in households per capita. Additionally, J equals to numbers 1–3, indicating the three different indicators that are used as dependent variables.
For the models’ estimations, Fixed (FE) and Random (RE) Effects methods are used, depending on how ai is handled: either as fixed predefined numbers or as random expulsions from a particular distribution [
26,
37,
38,
39]. In the case of Fixed Effects, where the cross-section specific components are viewed as fixed parameters, then the model becomes:
In the case of Random Effects, which can be used in cases were N individuals are drawn from a large population randomly, the following apply:
with the
μis being independent of the v
its, as are the
Xits of the
μis and
vits for all
I and
t [
40]. Inconsistency is checked in the RE estimate with Hausman tests, which determine whether the FE or RE model should be used.
In addition, Generalized Method of Moments (GMM) is used, in terms of orthogonal deviations, in order to capture the models’ dynamic nature. As Arellano and Bond have stated [
41], in orthogonal deviations, each observation is indicated as a deviation from the average of the sample’s future observations. Each deviation is weighted to standardize the variance:
The (
Ti − q) equations for individual units
i are:
where
δ is a parameter vector that includes
αk,
β, and
λ,
wi is a data matrix that includes the endogenous variables’ time series, the interpretive variables
x and the time dummies, and
di is a (
Ti − q) × 1 vector of ones.
Various problems might occur in panel data analyses; this is why several econometric tests are performed before the regression analysis. One of these problems is the correlation of the variables in the dataset. Pesaran’s cross-section dependence test allows us to check if the timeseries are cross-sectional independent. In cases of cross-sectional dependence, OLS Dummy estimator (FEM) allowing for individual fixed effects with Driscoll-Kraay standard errors (in Fixed Effects models) can correct the variance–covariance matrix while, in Random Effects models, Breusch-Pagan LM test for individual effects and robust standard errors are applied.
Unit root tests are also performed, in cases where cross-section dependence is confirmed. Dickey-Fuller and Augmented Dickey-Fuller tests can be performed in panel data, with the issue of homogeneity in the autoregressive parameter. In addition, Westerlund tests are performed for panel cointegration, based on the significance of the error correction term in the error correction model. Four tests that check for panel cointegration are proposed: the Gt and Ga statistics, testing for the null hypothesis of no cointegration of all cross-sectional units. The rejection of the hypothesis implies cointegration for at least one unit. The Pt and Pa statistics also test the null hypothesis of no cointegration and their rejection implies cointegration for the panel in total [
26,
37,
38,
39].
4. Results
The descriptive statistics of the indicators used in the analysis (
Section 3), are presented in this section. The highest percentages of people that were unable to keep their home adequately warm were observed in Bulgaria for various years, while high percentages were also observed in Portugal as well. The lowest percentages were found in Luxembourg and Norway. Greece presented the highest percentages of people facing arrears on utility bills, while high percentages were also found in Bulgaria. In contrast, the lowest percentages were found in Luxembourg and the Netherlands. Poland presented the highest percentages of people living in dwellings with leak, damp, or rot, while high percentages were also observed in Latvia and Cyprus. The lowest percentages were found in Finland for most years.
GDP per capita was also included in the analysis, expressed in purchasing power standards. The highest levels of GDP per capita were found in Luxembourg for most years, while the lowest levels were observed in Bulgaria. In addition, the highest levels of fossil fuels final energy consumption in households per capita were found in Luxembourg for most years, while the lowest levels were found in Iceland. Similarly, the highest levels of renewables and biofuels final energy consumption in households per capita were found in Latvia, while zero levels were observed in Malta for various years.
Table 2 presents the descriptive statistics of the variables used in our analysis.
To check for cross-section dependence, a Pesaran test is performed. All results reject the null hypothesis, indicating the existence of cross-section dependence, suggesting thus, the use of Driscoll-Kraay standard errors for the static regression models, in order to correct the variance–covariance matrix (
Table 3).
Fisher-ADF and Fisher-PP unit root tests are performed, which suggest that the examined variables are I(1), with stationarity evidence in first differences (
Table 4).
Westerlund tests are performed to test for panel cointegration. The results suggest that the Gt and Ga statistics reject the null hypothesis in most cases, implying cointegration for at least one unit. In addition, the Pt and Pa statistics reject the null hypothesis in every case, implying cointegration for the whole panel (
Table 5).
Six regression models were formulated, where each one of the three main variables that are considered to be core elements of energy poverty are used as dependent variables. In the static models, fixed effects model specifications are used, based on the results of the Hausman tests, with FE Driscoll-Kraay standard errors, based on the results of the Pesaran CD tests.
The results indicate that GDP per capita is negatively linked to each one of the three studied variables, in both static and dynamic models. This confirms the fact that economic growth can improve the conditions of energy poverty, since an increase in GDP per capita would lead to a decrease in the percentages of energy poverty factors, as well as that a financial crisis can significantly impact energy poverty conditions. These findings can be supported by other similar studies in the literature [
26,
27].
Fossil fuels final energy consumption in households per capita is inversely linked in both static and dynamic models to two out of the three indicators, indicating that an increase in the consumption of energy derived from fossil fuels can improve energy poverty conditions. Thus, it is proven that the increased use of fossil fuels per capita, which implies higher energy consumption, leads to better conditions regarding energy poverty in households. In the case of inability to keep the home adequately warm, the static model also indicates that the use of fossil fuels in energy consumption can improve these conditions; in contrast, the dynamic model indicates the opposite, implying a static rather than a dynamic influence of fossil fuels usage in such analyses.
Renewables and biofuels final energy consumption in households per capita is found to be a driver of arrears on utility bills, indicating that in the studied time period, higher levels of renewables’ use led to difficulties in paying utility bills on time. These findings can also be supported by studies in the literature, where it has been argued that sometimes the costs to support renewables’ technologies are transferred to consumers [
28], leading therefore to higher electricity prices [
26] and explaining, thus, the existence of arrears on utility bills.
In contrast, energy consumption produced from renewables is linked to an inverse relationship to the presence of leaks, damp, and rot in dwellings, according to both static and dynamic model. This indicates that an increase in renewable energy consumption per capita can improve these conditions in households. At the same time, a similar relationship is observed between renewable energy consumption and inability to keep the home adequately warm, according to the dynamic model, indicating that higher levels of renewable energy consumption per capita, would improve people’s ability to keep their houses adequately warm. In the static model, renewables final energy consumption in households per capita is statistically insignificant (
Table 6).
The lag of the dependent variables in the dynamic models are autoregressive-distributed lag specifications, that end up as an AD (1,0) formulation, showing the adjustment to equilibrium values.
Table 7 presents the adjustment coefficients of each dynamic model, the discrepancy that is eliminated in a year between the actual and desired values and the periods that are required for the adjustment.
Wald tests of joint significance, as well as Sargan tests of over-identifying restrictions, are asymptotically distributed as χ2 variables. Sargan statistics imply evidence of serially uncorrelated errors, since the null hypothesis of over-identifying restrictions is not rejected. AR(1) and AR(2) tests for first and second order serial autocorrelation do not reject the hypothesis of no autocorrelation.
5. Case Studies: Sweden, Germany, and Greece
Three countries, with different socioeconomic and environmental conditions, were chosen and their policies and progress on energy transition as well as their energy poverty-related conditions are analyzed, compared, and discussed in this section. The chosen countries were Sweden, Germany, and Greece. The three European countries were selected due to their different characteristics and the different socioeconomic, environmental, climatic and energy conditions existing in each one of them.
Sweden is a country in Northern Europe that is characterized by its proactivity on environmental issues and its climate consensus [
42]. The country has been characterized as a global leader when it comes to low-carbon economy and has followed a successful path towards energy transition [
43]. Sweden’s energy needs are covered mainly by hydropower and biomass and the country’s geography with moving waters and a big percentage of forest coverage is assisting that, despite the cold climate that requires a high amount of energy for heating [
44].
The Swedish energy policies, which aim to promote sustainability, are based on energy policies set by the EU. The EU targets refer to reducing energy consumption by 32.5%, to provide at least 32% of energy consumption from renewable sources and provide at least 14% of energy consumption in the transport sector from renewable sources. Specifically for the Swedish targets, the country has aimed to achieve by 2030, 50% more efficient energy consumption, compared to 2005. In addition, the country’s goal is to cover 100% of its electricity needs from renewable energy sources, by 2040 [
45].
Germany is a country in Central Europe and has a highly industrialized economy that has been promoting an ambitious plan of energy transition over the past years [
46]. The country aims to promote an economy that is low carbon, sustainable, and energy efficient and has achieved a significant growth when it comes to renewable power generation capacity, actively promoting the transition to renewable energy [
47].
Since 2010, Germany has initiated and promoted a plan for a more efficient energy system that is based mainly on renewable energy sources, called
Energiewende. More specifically,
Energiewende’s targets include the provision of 50% of electricity supply by renewable energy sources and coal’s phase-out by 2038 [
48]. Data shows that two thirds of Germany’s power generation could be covered from renewables by 2030, while solar energy and wind energy could cover half of that proportion [
47]. However, and despite the progress that has been made, the evidence shows that the country is struggling to meet its targets, mainly due to the uneven progress that exists across sectors and challenges, especially in transportation and heating. At the moment, Germany uses fossil fuels at a high degree to cover its energy needs and coal is the largest source of power generation, although it is planned to be phased out by 2038 [
49].
Greece is a country in South-eastern Europe that is also implementing reforms in the energy sector in order to foster decarbonization and promote a just energy transition. More specifically, the country aims to achieve a reduction in its greenhouse gas emissions by more than 56%, by 2030 (compared to 2005 levels), aiming to achieve by 2050 a climate neutral economy. However, at the moment, fossil fuels are the primary energy supplier in the country [
50].
As stated in the National Energy and Climate Plan 2021–2030, Greece aims to increase the share of renewables to 31% by 2030, in order to contribute to the achievement of the EU target, that aims to increase the share of renewables to at least 32% by 2030. In addition, the country aims to reduce the use of lignite that is used for power generation, and to shut down by 2028 the lignite-fired plants, while ensuring energy security and promoting energy efficiency [
51].
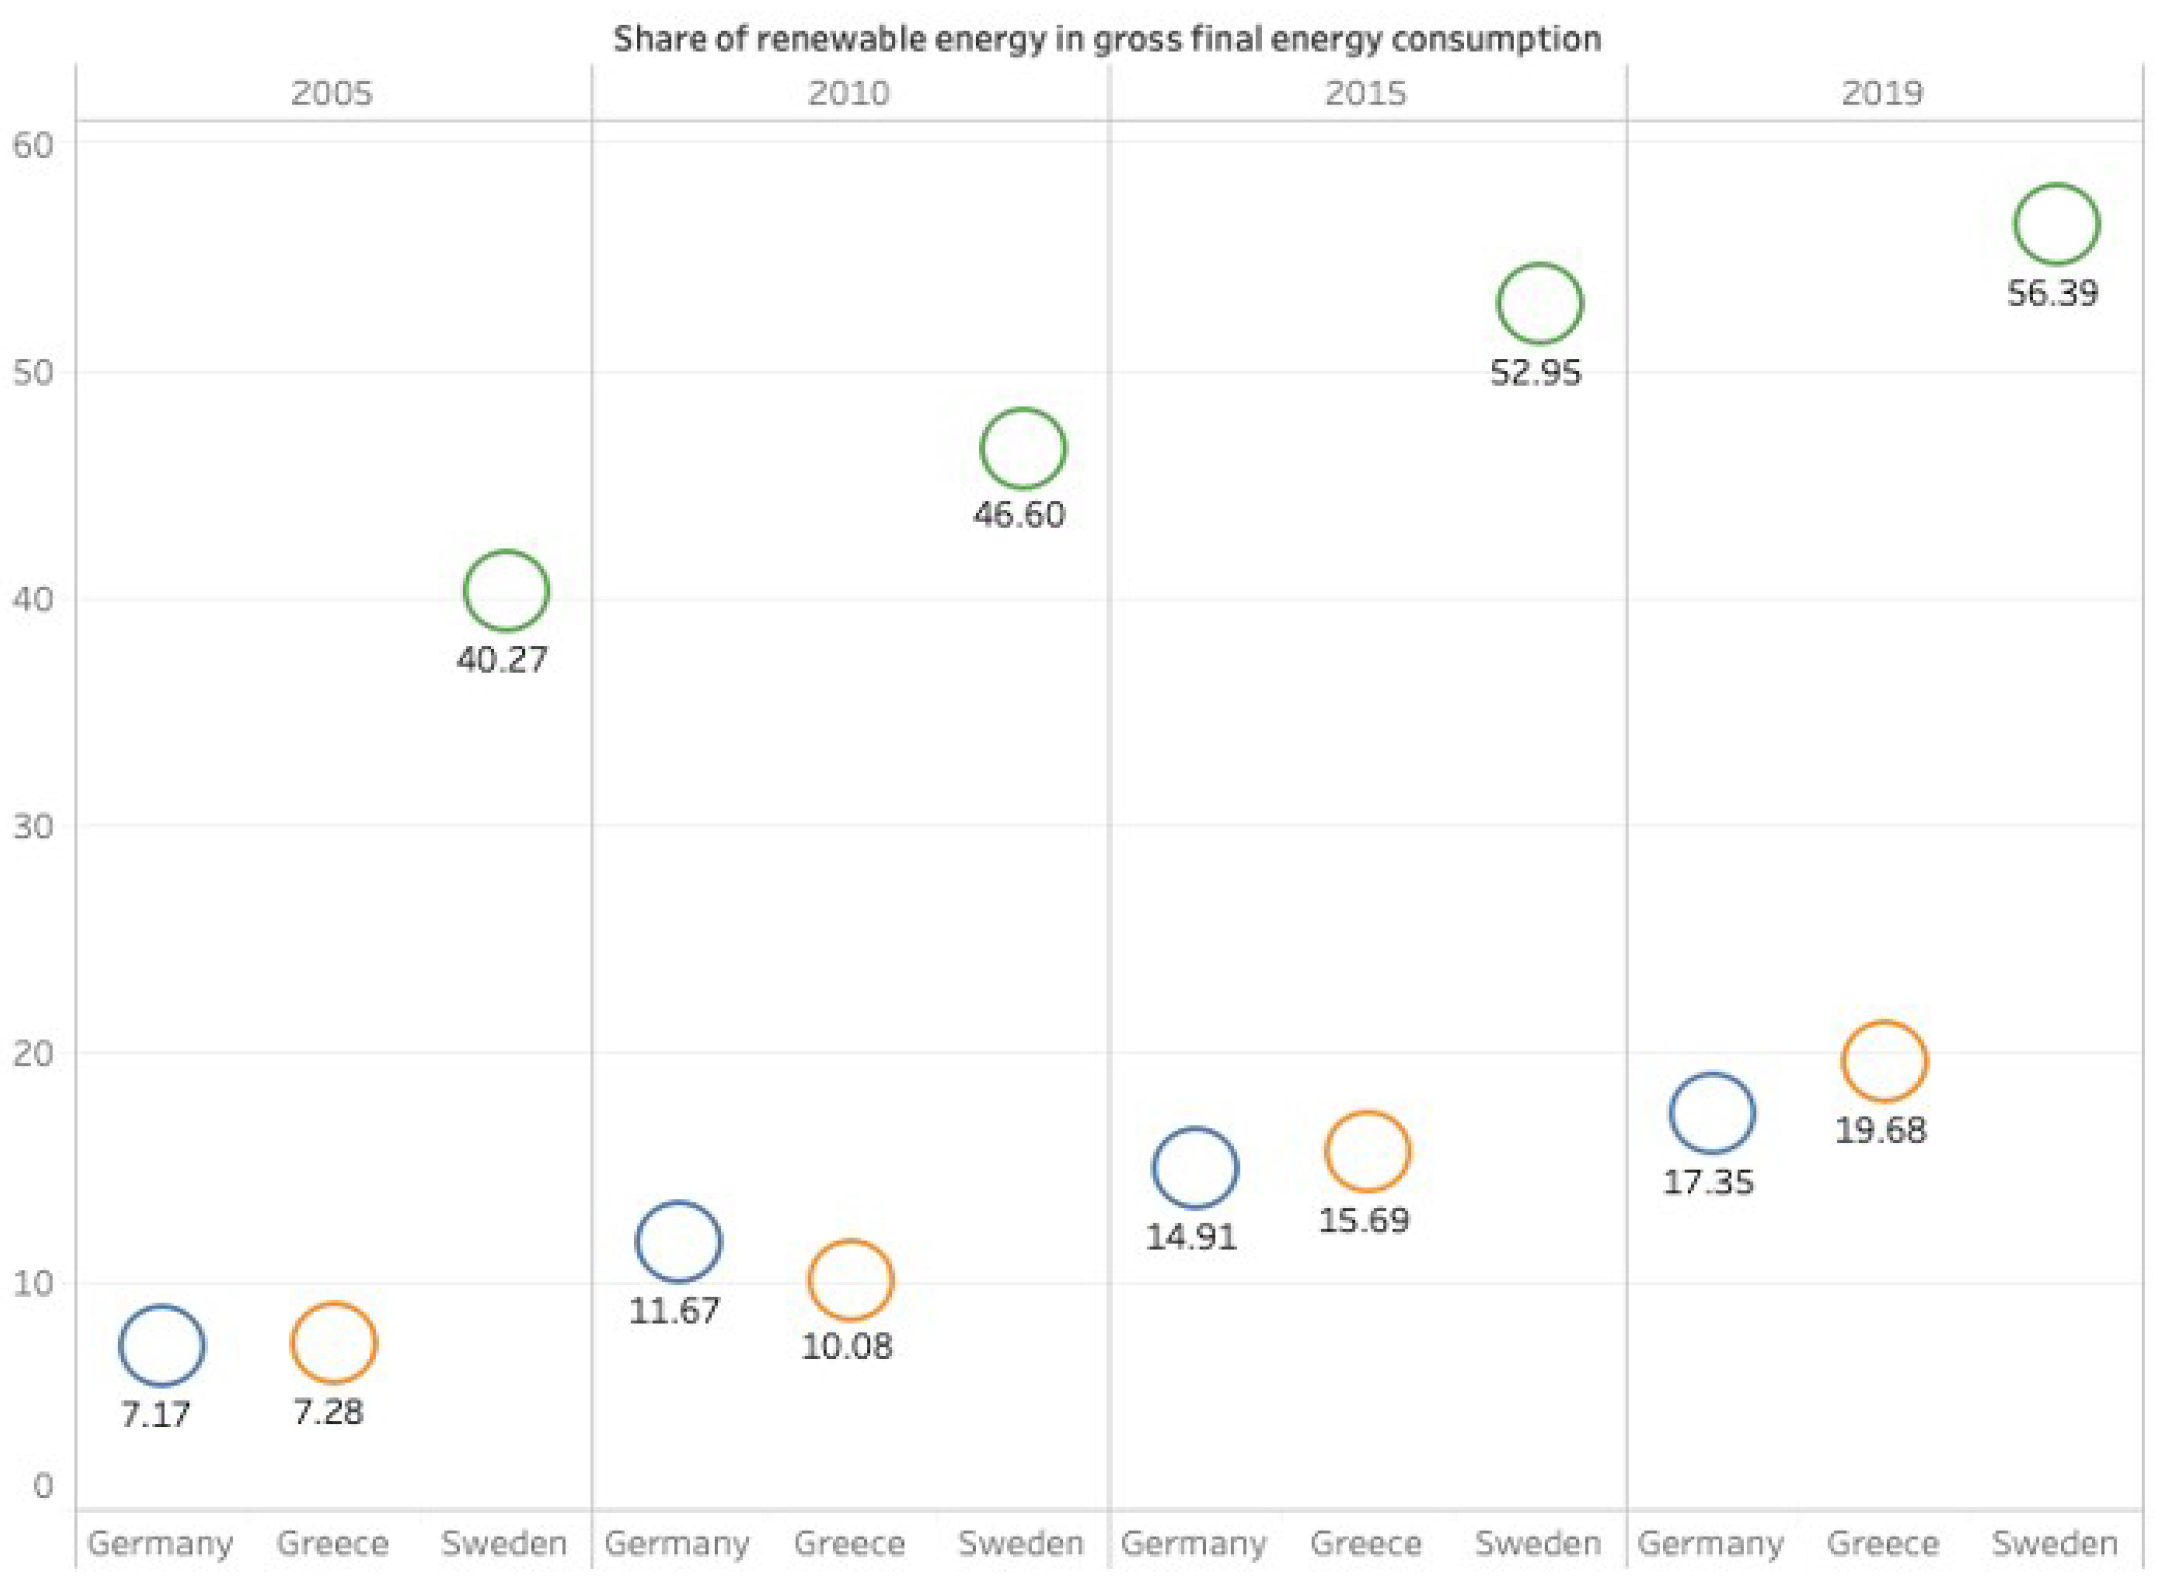
From this evidence, it is obvious that Sweden is in the lead when it comes to energy transition policies and promotion, while Greece is comparatively slower in the process of decarbonization, promoting less ambitious policies. This can also be observed by the provided data. As seen in
Figure 2, among the three studied countries, Sweden has the biggest share of renewable energy in gross final energy consumption, reaching 56.39% in 2019. The country has achieved the target of reaching 49% by 2020, towards Europe 2020 target, which aimed to increase the share of renewable energy in gross final energy consumption in the EU to 20% by 2020. In Greece, the share of renewable energy reached 19.68% in 2019, and the country has also achieved the target of reaching 18% by 2020. In Germany, the same share was estimated at 17.35% in 2019 and the country was very close in achieving the target of 18% by 2020 [
52].
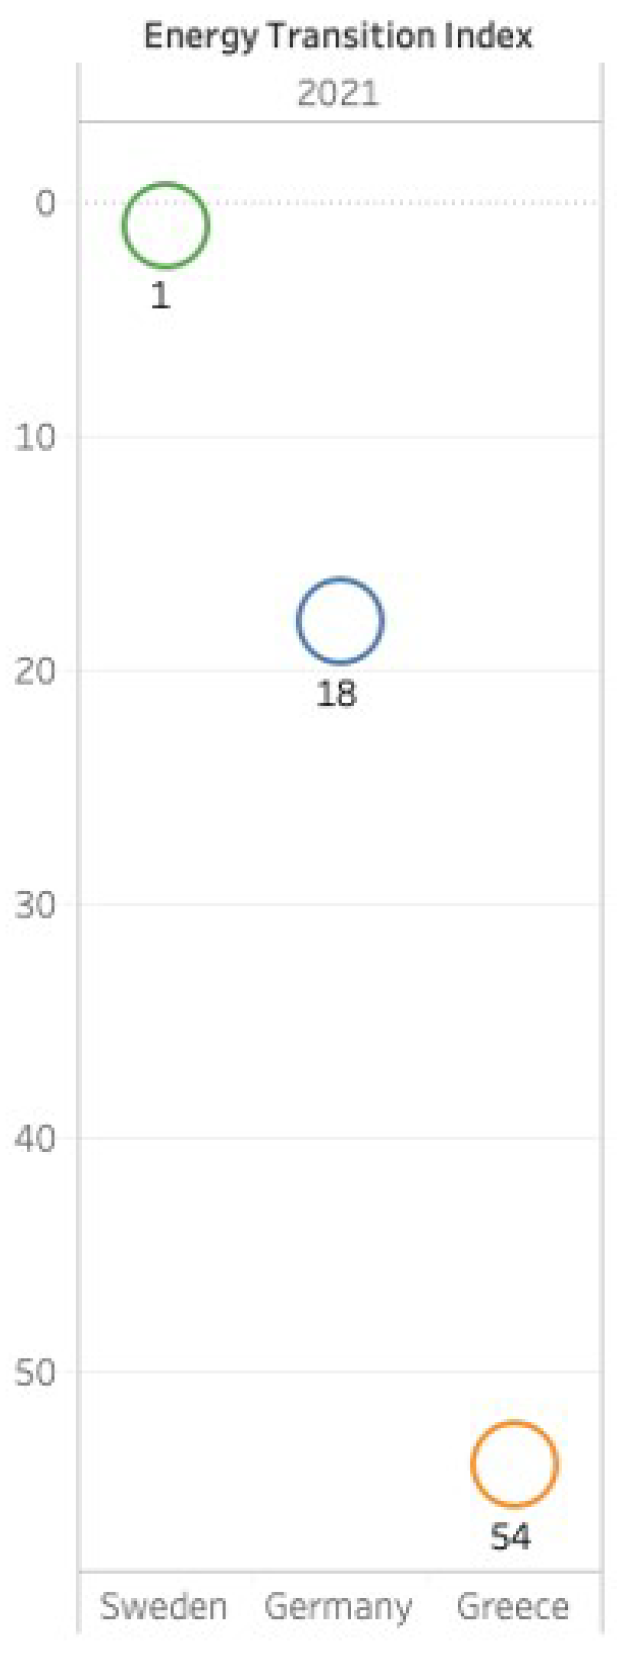
The Energy Transition Index takes into consideration the performance of the current energy system as well as the enabling environment for energy transition and aims to reflect the relationships and dependencies that exist between the energy system transformation and various factors (economic, social, political, regulatory) that determine whether a country is ready for transition. According to the Energy Transition Index 2021, and as seen in
Figure 3, Sweden is the global leader, ranking in the first place, while Germany is found in the 18th place and Greece in the 54th [
53]. These rankings highlight once more the differences on energy transition potential and progress that exist among the selected countries and the necessity of efforts required to move towards sustainability in each one of them.
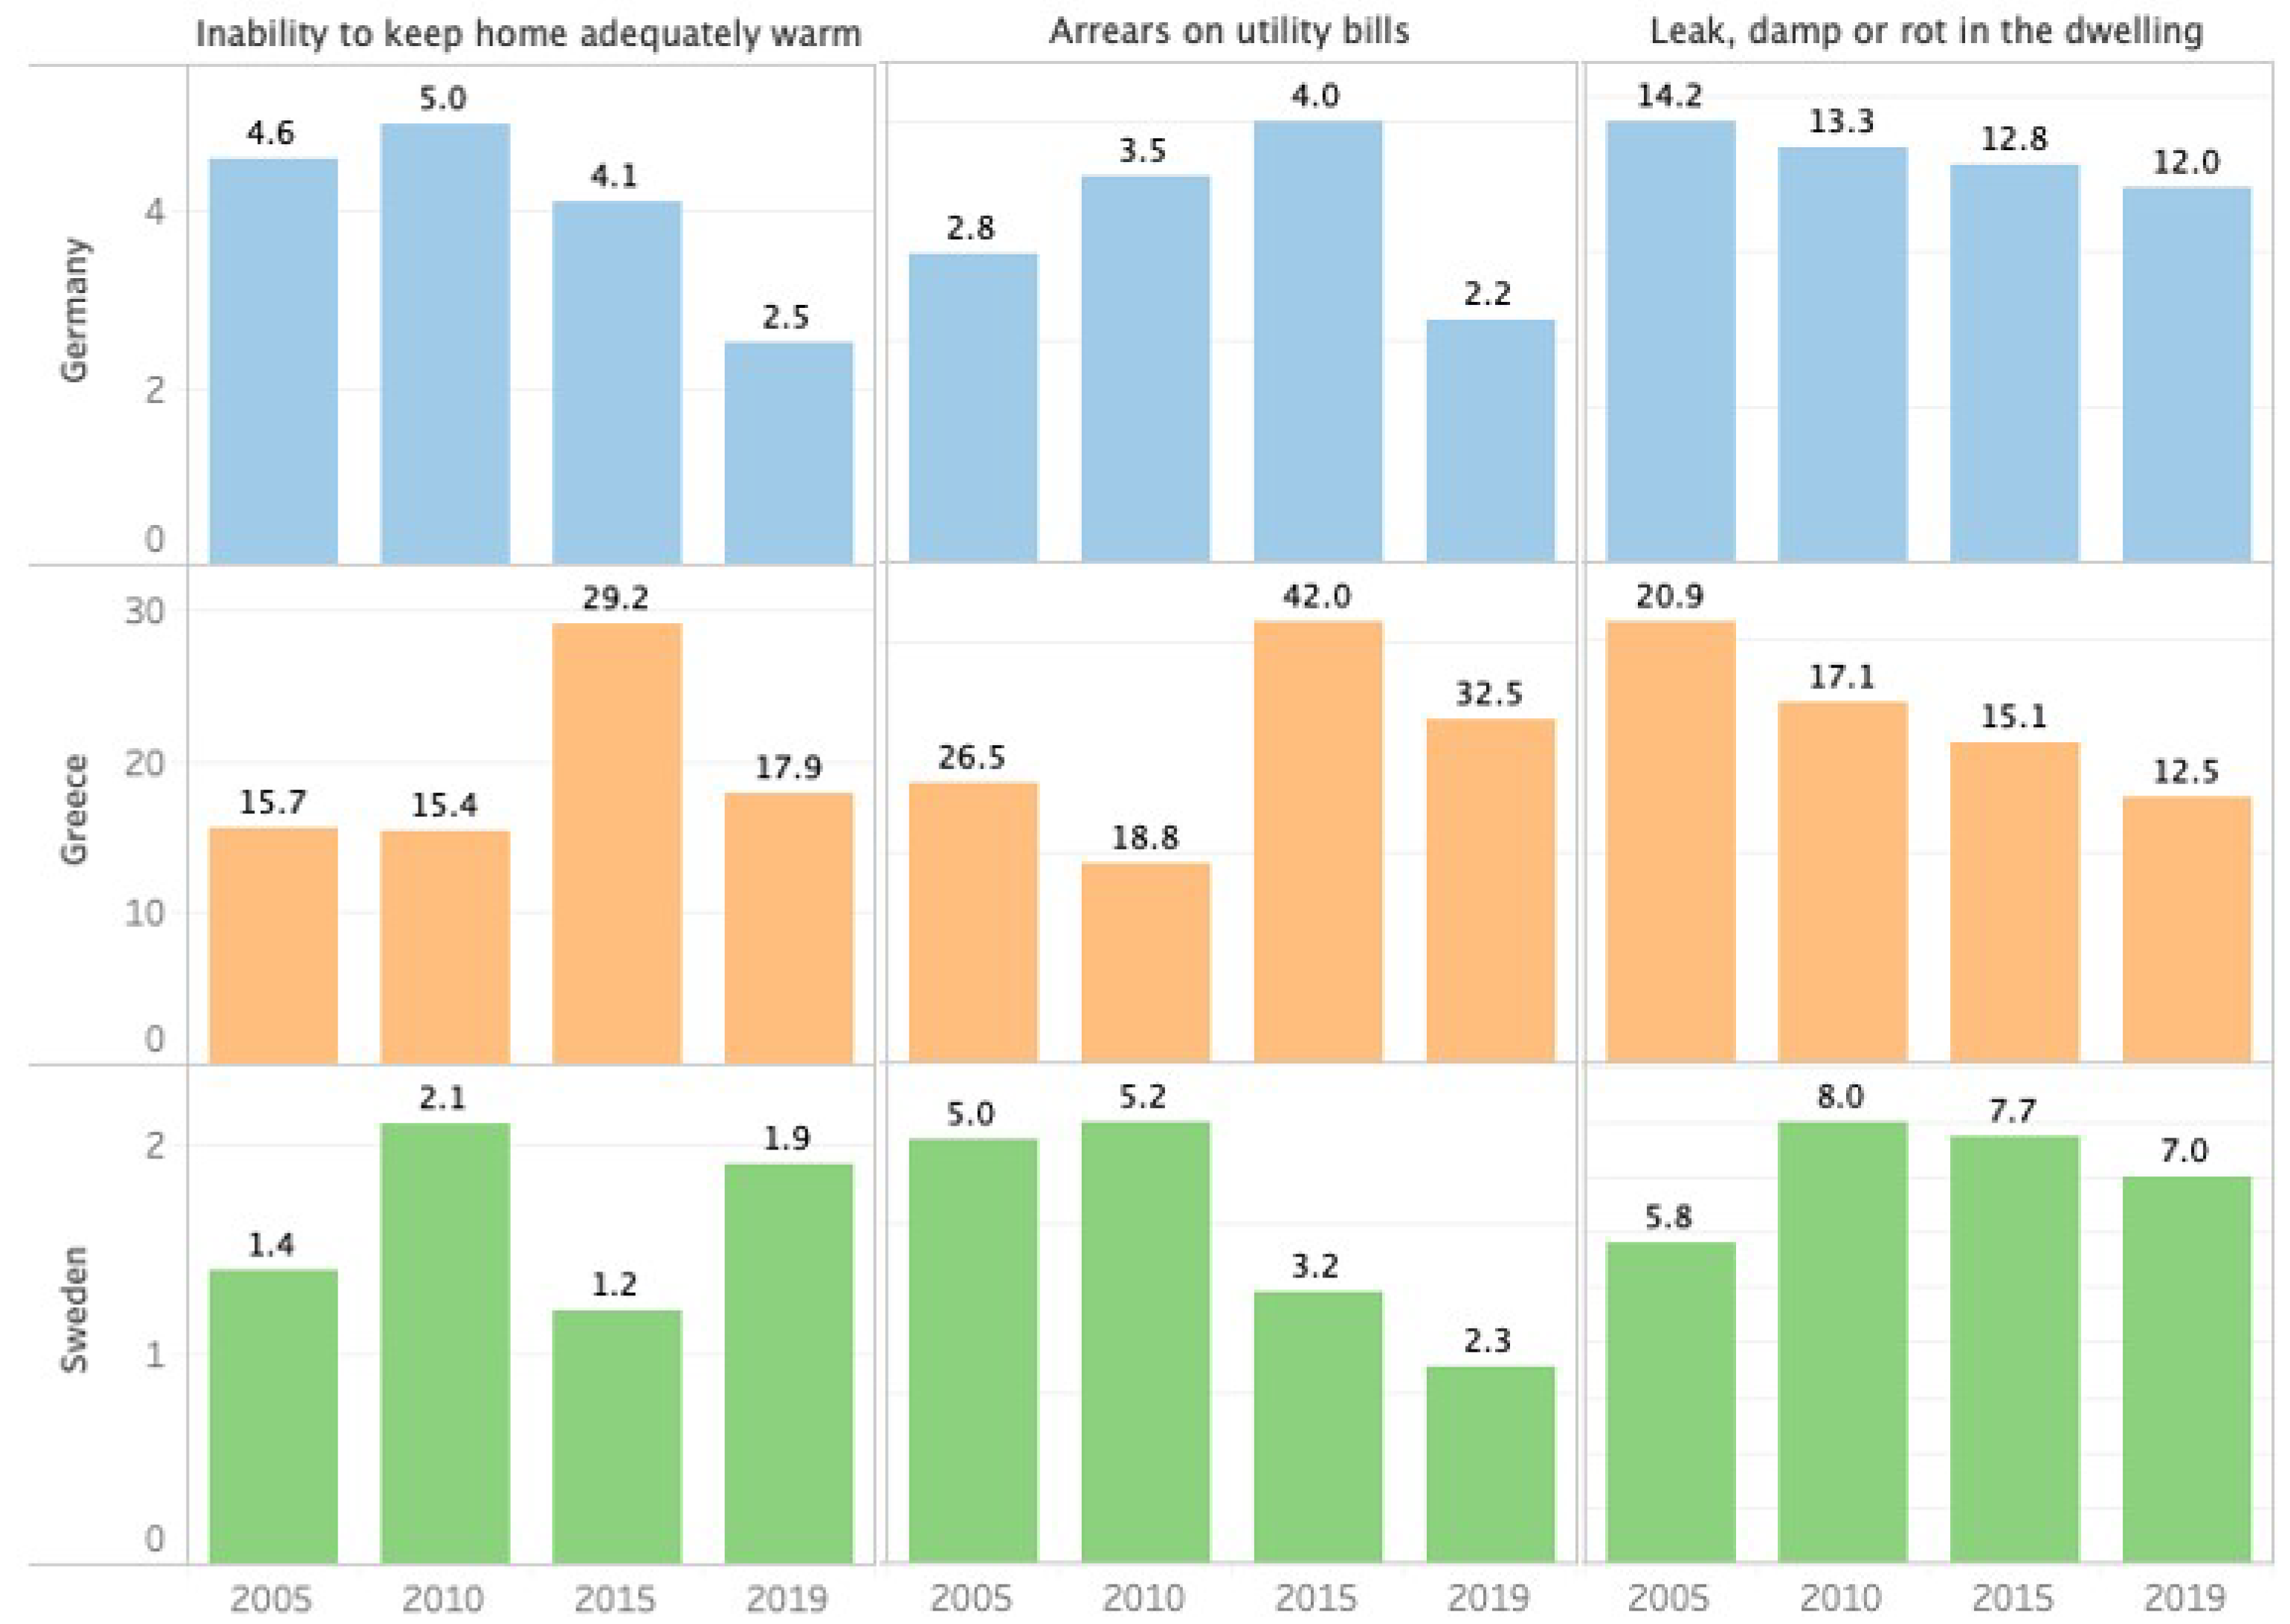
After the comparative analysis of the energy transition progress and policies promoted in each one of the studied countries, an overview of the energy poverty situation and the policies regarding energy poverty is also presented. As seen in
Figure 4, Greece was the country with the highest percentages of people living under energy poverty conditions among the three examined countries, according to Eurostat data. In contrast, low percentages were observed in Germany and Sweden for all three indicators; these countries perform better compared to the EU average on the specific indicators, while Greece has a significantly lower performance compared to the EU average.
The data presented here for the three selected countries can also be compared to the findings from the analysis presented in
Section 4. More specifically, we have found that an increasing GDP per capita can improve energy poverty conditions and, if we look closely at the data of the selected countries, we can see that in periods when GDP per capita was increasing in the studied countries, energy poverty levels were lower. Similarly, the results regarding the effect of renewable energy consumption per capita can also be validated, since we can observe that in most periods of higher levels of renewables final energy consumption in households per capita, higher percentages of households facing arrears on utility bills were also observed. However, it is important to further research each country’s social, economic, and environmental conditions and active policies, in order to better understand the differences in energy poverty conditions and promote targeted and more effective policies and strategies.
According to the EU Energy Poverty Observatory, both Germany [
54] and Greece [
55] have an active research community, concerning the field of energy poverty, while the research in Sweden does not specifically focus on energy poverty, but on other energy-related fields, such as energy transition and efficiency [
56].
Based on this evidence, it can be observed that Greece and Germany have developed and promoted various policies to lower energy poverty levels, while Sweden has not been actively addressing the problem, due to the already low levels that are observed in the country. Instead, Sweden is focusing on energy transition and renewable energy sources and has set ambitious goals. Germany and Greece have also been promoting energy transition policies, but their energy needs are still mainly covered by fossil fuels.
6. Conclusions
At the moment, the world depends highly on fossil fuels, despite their disadvantages and their impact on the environment. Energy transition and the use of renewable energy sources has been promoted a lot more in the past few years and a lot of countries have made significant progress to that end. However, the impact that energy transition and the use of renewable sources could have on the problem of energy poverty should be continuously studied and addressed.
This study contributes to the existing literature and expands the knowledge on the topic, focusing on assessing the impact that fossil fuels and renewables usage had on energy poverty conditions in 28 European countries during the time period 2004–2019. The necessary data were extracted from the Eurostat database and an in-depth econometric methodology was followed which, to the best of our knowledge, has not been used in similar studies. The findings suggest that GDP per capita and fossil fuels final energy consumption in households per capita are linked to an inverse relationship to energy poverty conditions. In addition, the results indicate that an increase in renewables and biofuels final energy consumption in households per capita led to an increase in the percentage of people facing arrears on utility bills, while it led to a decrease in the percentage of people that cannot keep their home adequately warm, and of the percentage of population living in a dwelling with a leaking roof, damp walls, floors or foundation, or rot in window frames or floor.
These results highlight the fact that higher fossil fuels usage per capita can improve energy poverty conditions, while also highlighting the assistance that a higher level of renewables usage per capita can provide in certain energy poverty conditions. Attention should be given, though, on the mitigation of the impact that renewables’ usage can have on arrears on utility bills. Government and policy makers should be aware of this relationship and develop strategies that promote energy transition while protecting energy consumers. More specifically, there should be given extra attention in not transferring the costs of renewables to consumers [
28] and in promoting policies that assist households pay their bills on time, while also ensuring that the mitigation of fossil fuels usage will not have an impact on system’s stability [
12], leading to other social or economic problems.
Additionally, three case studies were examined and the conditions in three European countries with different socioeconomic and environmental characteristics (Sweden, Germany, and Greece) were presented and compared. The evidence shows that Germany and Greece have focused on energy poverty mitigation while Sweden, which manages to keep its energy poverty levels significantly low, promotes more ambitious strategies regarding energy transition. Between the examined countries, Greece is the one with the highest energy poverty levels while Sweden is the one with the highest share of renewable energy in gross final energy consumption.
This comparison can be useful for policy makers, since it highlights the differences that exist among European countries in these fields and the importance to promote and implement targeted policies in each country, based on their progress and needs. Outside Europe, and when it comes to developing countries, policy makers should take into consideration other studies in the literature to support effective renewable energy development, focusing on market guarantee, lowering the costs of licensing for renewable projects, raising public consciousness, and increasing R&D, among others [
57]. In general, the role that cities and communities play in ecological and energy transition should be examined and taken into consideration by policy makers, when promoting relevant strategies [
58], while it would also be useful to explore the impact that subsidies towards green resources can have in supporting energy transition [
59] and, subsequently, how these could impact energy poverty conditions in certain countries and regions. Finally, the impact of the COVID-19 pandemic on environmental matters and on renewable energy should be taken into consideration when promoting strategies for specific countries or regions, assessing the impact that the pandemic had on energy markets [
60].
While the results of this study highlight the linkages that exist between energy coming from different sources and energy poverty conditions and can be proven helpful for governments and policy makers, future research on this relationship is strongly suggested. More specifically, extensive research targeted to specific countries or regions is essential, examining not only the current situation and the current linkages, but also the tailored policies and strategies that should be promoted for achieving a successful energy transition while ensuring energy security, minimizing energy poverty levels, and progressing on the targets of the 7th Sustainable Development Goal at the same time.


