Abstract
The health monitoring technology of transmission towers based on vibration data had become a research hotspot. At present, vibration data mainly relied on sensors installed on the tower, which was time-consuming and laborious. Nevertheless, the ROI computer vision method could achieve long-distance, multi-point, and non-contact monitoring, which offers a new possibility for the structure-safety identification of power transmission towers. However, transmission towers are generally located in the field environment, and the background is complicated, resulting in the ROI key point method for vibration data acquisition encountering various types of noise. Thus, the key point in practice was clearing the noise and reducing the impact of noise on identification accuracy. The subpixel corner method was used to detect a minor error with the research object of pixel sets. The dilation + erosion method could reduce image noise. Under white noise with a variance of 0.05, the dilation + erosion could reduce average error (Emae) and mean square error (Emse) by 27% and 23% and increase percentages of data with absolute error less than 5 mm and 10 mm in the total number of data (σ5 and σ10) by 8% and 4.3%, respectively, which was compared to median filter + sharpen. The histogram equalization method was used to balance background lighting conditions and reduce identification errors from non-uniform illumination. Emae and Emse were reduced by 92% and 99%, and σ5 and σ10 were increased by 5 and 3 times, respectively, and the identification time was cut by 62% with the histogram equalization method. Under white noise with a variance of 0.15 or lower, the three methods combined increased the numerical stability of Emae, Emse, σ5, and σ10, which indicated that the combination of the three methods could improve the anti-noise performance, robustness, and identification accuracy of the ROI computer vision method for transmission tower displacement identification.
1. Introduction
According to the statistics in the National Electricity Reliability Report 2021 released by the National Energy Administration, the length of transmission line circuits of 220 kV and above nationwide was 814,000 km as of 2021, with an average annual growth of 35,000 km in the past three years. According to the calculation of 2.3 transmission towers per kilometer of transmission lines by 2021, the total number of 220 kV and above towers in service nationwide was about 1.87 million. The transmission towers built in the early stage are already in end-of-life or overdue service. Assessing the health of in-service transmission towers had become a research hotspot. The traditional transmission tower health monitoring method was to collect vibration data through sensors installed on transmission towers, which were detected by a data acquisition and analysis system on the ground [1,2,3]. The traditional method had many problems in data collection, such as damage to the transmission tower during the installation of sensors and the risk of falling and electrocution for the installer. Meanwhile, this method was not convenient for operation and maintenance, and the sensors need to be replaced regularly, which was time-consuming and labor-intensive. Therefore, it is necessary to urgently address the selection of a non-destructive and rapid tower health inspection method that could evaluate the existing towers, which could save monitoring costs based on the operational safety of transmission lines in the meantime.
The method of structural displacement detection based on computer vision had the advantage of long-distance, multi-point, and contactless monitoring [4,5]. In the field of crack identification and monitoring [6,7,8], the features of concrete, geological, and other surface cracks were identified by monocular or binocular cameras, and data analysis was performed using compressive sensing, deep learning, finite element, and other methods to carry out structural health inspection research, which had excellent benefits. The ROI (region of interest) method is based on computer vision monitoring, which could achieve long-distance transmission tower structural displacement monitoring without targets. This method took the inner contour of the transmission tower structure as the ROI, combined the SUZUKI contour tracking algorithm [9] and the Harris corner point detection algorithm [10] to extract and track the key points, and then obtained the displacement changes of the key points of the transmission tower. However, the actual transmission tower was located in a harsh environment with complex backgrounds such as clouds, trees, houses, and non-uniform illumination caused by different sunlight irradiation angles that would affect the recognition accuracy of the method. Thus, it was the key to reducing the impact of noise on recognition accuracy and whether the method could be successfully applied in practice.
In the field of image noise removal, the frequently used methods were the subpixel corner point method [11], median filtering [12,13], Gaussian filtering [14], sharpening [15], expansion and erosion [16], deep learning [17], histogram equalization [18,19,20,21], etc. Among these methods, the median filtering method was the most commonly used, including single-threshold, double-threshold, adaptive thresholding, and other algorithms, which could achieve better noise-removal effects in Gaussian noise and pretzel noise cooperating with the image sharpening method. The sharpening method was mainly based on component replacement, multi-resolution analysis, variational optimization, and deep learning, as well as other methods, which were fast and simple to implement but prone to aberration, distortion, and other problems. The deep learning method was an emerging noise-removal technology with better results. However, it was based on neural network training, which required more computational power and took a longer time, so it could not be widely used. Obviously, various noise-removal methods had shortcomings and could not be well combined with ROI target-free computer vision monitoring methods. Therefore, finding a noise-removal method that could effectively improve the robustness, computational speed, and generality was very valuable, and the method could achieve long-distance transmission tower structure displacement monitoring.
Image noise-removal methods were mostly carried out using a single method, which can achieve better results under specific noise conditions. However, the noise environment was often complicated in reality, because of which using a single method could not meet the detection accuracy requirements. The subpixel corner point method could reduce the pseudo corner point recognition error. The expansion and erosion method was suitable for many image processing fields, such as noise removal and edge detection, which was based on convolution operation. The histogram equalization method was more applied in the fields of fog removal and noise reduction under low-light conditions; this method was effective for grayscale image processing. This study analyzed the advantages of a subpixel corner point, expansion + erosion, and histogram equalization methods and discussed the effect of the combined use of multiple noise-reduction methods on the noise immunity performance of ROI computer vision monitoring methods under comprehensive noise conditions, which aimed to improve the recognition accuracy of transmission tower structure displacement monitoring in noisy environments.
2. ROI Key Point Method
The ROI key point method was a scale-free computer vision recognition method, based on the internal contour characteristics of transmission tower structure for displacement monitoring. The main steps of the ROI key point method include ROI extraction, key point detection, coordinate conversion, etc.
2.1. Extraction of the Region of Interest
Firstly, image pre-processing was carried out, which included grayscale and binarization. The grayscale conversion method [22] is shown in Equation (1), and the binarization used the OTUS algorithm, whose expression is shown in Equation (2).
where B, G, and R denote the color intensity of the blue, green, and red pixels.
where p1 denotes the probability that the gray level is greater than k, mG denotes the global mean, and m denotes the cumulative mean.
Identify the contours of binary images to calculate the center of gravity position, perimeter, area, and tightness of all contours, which used the SUZUKI identical contour tracking algorithm (Figure 1).
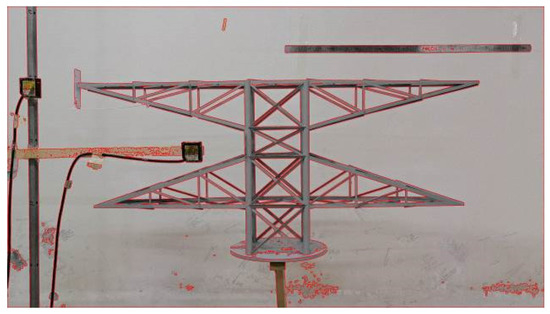
Figure 1.
Result of contour identification.
The N-nearest neighbor minimum energy search method was adopted to extract the contour region of interest, which was used to calculate the difference with the previous frame as the energy Ei by taking the position of the gravity center of the inner contour Pi, area Ai, and tightness Ti as geometric features, as shown in Equation (3). The contour with the minimum energy was the ROI contour.
where α, β, γ denote the weights of the contour’s position, the weights of size, and the weights of tightness.
2.2. Corner Detection
The Harris corner detection algorithm was used for corner detection, and the corner detection results are shown in Figure 2.

Figure 2.
Results of corner detection.
2.3. Coordinate Conversion
The pixel difference d was calculated frame by frame according to the difference in the position of the key corner pixels. The coordinate conversion was performed by calculating the scale factor R between the pixels and the actual length based on the known structure size D, as shown in Equation (4).
where R is the scale factor, d is the pixel difference, and D is the actual distance.
3. Research on Image Denoising Method
3.1. Experimental Design
A model of a transmission tower pedestal was constructed with a laser sensor, model HL-G112-A-C5, mounted on the side of the model (Figure 3). The vibration displacement of the model was monitored at a frequency of 1000 Hz, which would be used as a comparison group. Meanwhile, a camera was placed in front of the model to capture the vibration video, with a recording frequency of 60 fps and a resolution of 4096 × 2160. Adopt the ROI key point method for displacement monitoring, and the selected experimental samples were HS-33 (normal) and HS-42 (non-uniform illumination). The artificial noise was white noise with a mean value μ of 0, and the variance σ was selected according to the noise magnitude.
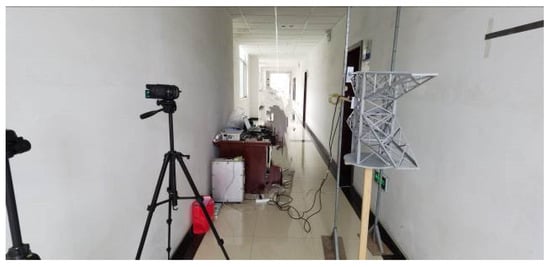
Figure 3.
Experimental scene.
3.2. Main Sources of Errors
(1) Pseudo corner point error
When applying the ROI key point method displacement to monitor the sample HS-33, results were obtained as shown in Figure 4; furthermore, the tiny bumps that appeared at certain locations in the figure were analyzed. Intercepting the corner point detection results of this location and adjacent frames, the following problems were found.
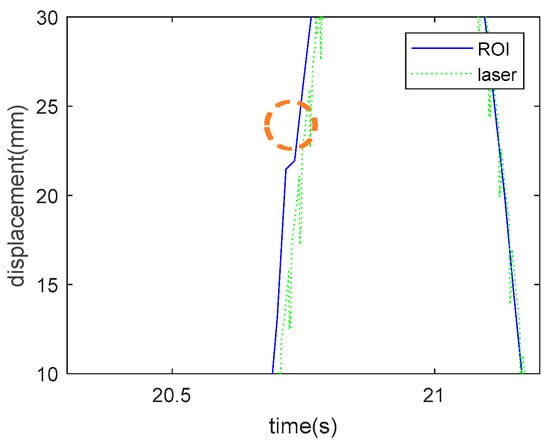
Figure 4.
Location of error (orange circle).
① Noise appears near the key corner points at this location, as shown in Figure 5a, which can lead to detection errors.
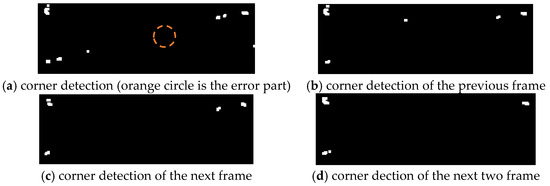
Figure 5.
Results of corner detection in different images.
② As shown in Figure 5b–d, the key corner point is near a collection of pixels, and there is a pixel difference in different images. Therefore, taking the position of the rightmost pixel as the recognition corner point will generate 1- to 2-pixel errors.
(2) Non-Uniform Illumination Error
In the real environment, transmission towers were often subjected to non-uniform light intensity. To better simulate the real environment and study the influence of lighting conditions on the displacement recognition accuracy of the ROI key point method, this study selected the asymmetric lighting experimental sample HS-42 as the research object for contour recognition and applies the white noise of σ = 0.05 to intervene it.
As shown in Figure 6b,c, under the non-uniform illumination conditions, the contour recognition results were irregular, mismatched with the actual contour edges, and some contours were lost. When the white noise of σ = 0.05 is applied, the contour recognition results were even more unsatisfactory. It could be seen that the influence of non-uniform illumination on the accuracy of contour recognition cannot be ignored.
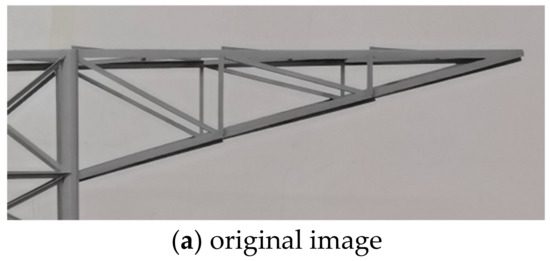
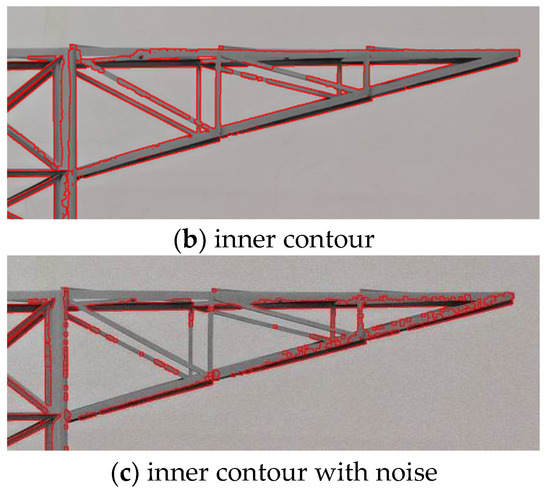
Figure 6.
Results of inner contour identification under uneven lighting.
As shown in Figure 7, under the condition of the applied white noise of σ = 0.05, the displacement analysis curve and the laser measurement curve showed a large difference. The average error reaches 46 mm, and the mean square error reaches 1786 mm. Thus, the recognition error increased substantially in the presence of both noise and non-uniform illumination.
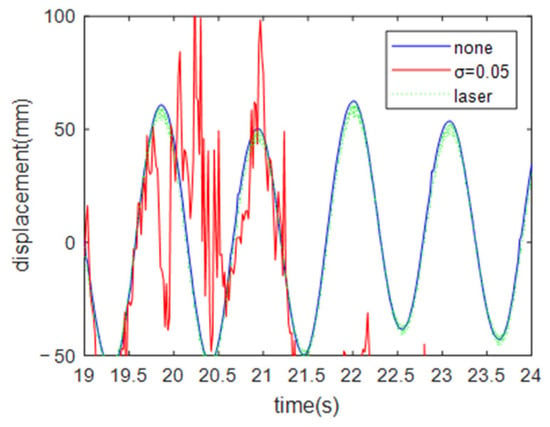
Figure 7.
Displacement identification results under white noise of σ = 0.05.
3.3. Subpixel Corner Point Detection
In order to solve the pseudo corner point error problem, the neighborhood concatenation and subpixel corner point detection [8] methods were chosen. Neighborhood concatenation was to link the pixels adjacent to the corner points of the previous frame to form a pixel set. Subpixel corner point detection calculates the subpixel point that minimizes the squared sum of the distances of all pixels in the pixel set based on the least squares theory, which was used for the displacement calculation of corner points.
where E denotes the sum of the squares of the distances between pixels and valid corner points in the pixel set, ki denotes the weights, and si denotes the square of the distances between pixels and valid corner points.
Applying the subpixel corner point detection method to the pixel set avoided the selection of pseudo corner points as key points, which effectively reduced the pixel error and improved the measurement accuracy.
3.4. Histogram Equalization
The histogram equalization method was used to balance the background lighting conditions, which could reduce the recognition errors caused by non-uniform lighting conditions. The histogram was a function of the image’s gray level, which was defined as shown below.
where rk is the k-level gray value, nk is the number of pixels with a gray value of rk, and n is the total number of pixels.
In the case of non-uniform illumination, the grayscale values of different edges of the image exhibited large differences. Then, because the binarization method was based on grayscale values, edge information would be lost, and the result of contour recognition would be inaccurate.
Histogram equalization was to correct the image histogram to a uniform function by transforming the function T, as shown in Equation (7), which converts pixels with the gray level of rk in the original image to pixels with a gray level of sk in the new image by the cumulative distribution function. Histogram equalization equalizes the gray value of the whole image while retaining the local gray difference, which strengthened the image edges and enhanced the contour recognition accuracy.
The comparison of the grayscale image before and after histogram equalization was shown in Figure 8, and the comparison of the binary image is shown in Figure 9. It could be seen that the overall uniformity of the grayscale image was better and that the edge details were more obvious after the histogram equalization process. The binary image before processing was non-uniform to the left and right, and there were a large number of missing edges. After histogram equalization, the edges of the binary image were obvious and prominent, which was beneficial to contour recognition in the later stage.

Figure 8.
Comparation of grayscale images before and after histogram equalization method. (a) Grayscale image before the histogram equalization method. (b) Grayscale image after the histogram equalization method.

Figure 9.
Comparation of binary images before and after histogram equalization method. (a) binary image before the histogram equalization method. (b) binary image after histogram equalization method.
To quantitatively analyze the influence of the noise-removal method on the displacement recognition results, four error indicators were selected for analysis, which was the average error (Emae), the mean square error (Emse), and the percentage of data with absolute error less than 5 mm and 10 mm compared to the total number of data (σ5 and σ10). The error indicators were calculated as shown below.
where uv denotes the displacement calculated by the ROI key point method, and ul denotes the displacement by laser ranging.
The results of the error analysis are shown in Table 1. Under the no-noise condition, the histogram equalization method reduced Emae and Emse by 10% and 13%, respectively, but the difference between σ5 and σ10 was not significant. Under the noise ofthe σ = 0.05 condition, Emae and Emse were reduced by 92% and 99%, respectively, and σ5 and σ10 were improved by five times and three times, respectively. Consequently, the use of the histogram equalization method could largely reduce the error, eliminate the influence of noise, and improve the accuracy of displacement monitoring.

Table 1.
Error indicators (histogram equalization).
Under the no-noise condition, the recognition errors were 0.14 s/frame and 0.16 s/frame before and after using the histogram equalization method, and the difference between them was not significant. Under the white noise condition, with σ = 0.05 imposed, the recognition time was reduced from 0.84 s/frame to 0.32 s/frame by using the histogram equalization method, which was 62% lower. Obviously, the histogram equalization method could effectively improve the calculation speed.
Generally, due to non-uniform illumination, noise, and other factors, the process of transmission tower displacement monitoring would generate a large number of pseudo contours and pseudo corner points, resulting in slowing down the calculation speed. Nevertheless, the histogram equalization method effectively avoided or reduced the generation of pseudo contours and pseudo corner points and improved the calculation efficiency.
3.5. Expansion + Erosion
We compared the applicability of two methods, expansion + erosion, and median filtering + sharpening, in the application of the ROI key point method for displacement monitoring, using the original video and the video with the addition of white noise as the research object. Expansion and erosion were a pair of operations that were usually used together. The principle was the addition and subtraction of vectors, and the operations are shown in Equations (10) and (11).
The results of the Harris corner point detection of the transmission tower were subjected to expansion + corrosion operation. Under the original video conditions, the transmission tower model background was a wall, which is relatively single and less noisy. The effects before and after the expansion + corrosion treatment are shown in Figure 10a,b. Compared with the median filtering + sharpening method, the noise was significantly reduced by applying the expansion + erosion method, and the contour corner points in the region of interest were more obvious, as shown in Figure 11a.
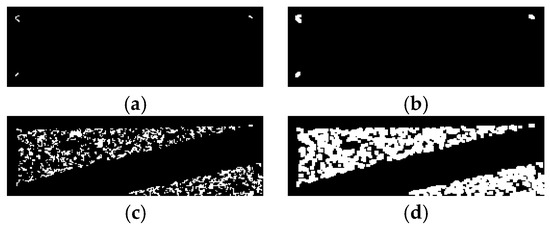
Figure 10.
Results of corner detection before and after dilation and erosion. (a) corner detection before dilation and erosion, no noise. (b) corner detection after dilation and erosion, no noise. (c) corner detection before dilation and erosion, σ = 0.05. (d) corner detection after dilation and erosion, σ = 0.05.
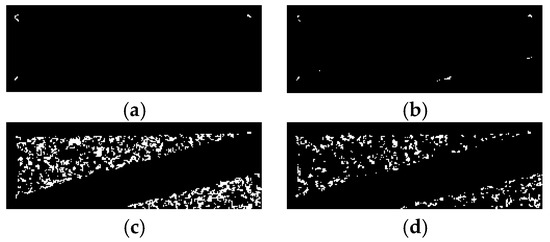
Figure 11.
Results of corner detection before and after median filtering and sharpening. (a) corner detection before median filtering and sharpening, no noise. (b) corner detection after median filtering and sharpening, no noise. (c) corner detection before median filtering and sharpening, σ = 0.05. (d) corner detection after median filtering & sharpening, σ = 0.05.
Under the condition of white noise with mean μ = 0 and variance σ = 0.05 applied to the image, the corner points, processed by the expansion + erosion method, were more clearly as shown in Figure 10c,d. The corner points processed by the median filtering + sharpening method had the situation that the contour corner points in the region of interest were mistakenly deleted, and the error was larger, as shown in Figure 11b.
Four error indicators Emae, Emse, σ5, and σ10, were selected for the quantitative analysis of the identification before and after treatment with the expansion + corrosion method.
As shown in Table 2, the expansion + corrosion method had certain advantages over the median filtering + sharpening method in both the conditions of no noise and applied white noise of σ = 0.05. Especially under the increased-noise condition, the error indices Emae and Emse were reduced by 27% and 23%, and σ5 and σ10 were improved by 8% and 4.3%, respectively. It could be seen that the expansion + erosion method was more effective in noise removal when using the ROI key point method for transmission tower structure displacement monitoring.

Table 2.
Error indicators (dilation and erosion).
4. Combined Application of Noise-Resistance Methods
Combined subpixel corner point, expansion + corrosion, and histogram equalization methods to increase the recognition accuracy of the ROI computer vision transmission tower structure displacement monitoring method. To verify its performance, the experimental sample HS-42 with asymmetric illumination was studied, and white noise of σ = 0.05, σ = 0.1, σ = 0.15, and σ = 0.2 were applied sequentially, and the video recognition results were compared and analyzed.
A deep convolutional neural network approach (CNN) was used for noise immunity comparison. The training device parameters were i7-12700H (2.30 GHz), 32 GB RAM, and GeForce RTX 3060 (6 GB) graphics card. The network model was a VGG residual model with 28 network layers and 64 convolutional kernels, and the optimizer was the stochastic gradient descent method (SGD), and the activation function is Leaky ReLU. A total of 1000 images were selected for each noise; the image resolution was 3840 × 2160; the images were segmented by 128 × 128 pixels, and the edge part was filled with 0, resulting in a total of 1,224,000 samples, of which 80% were taken as the training set and 20% as the test set for network parameter training, 300 rounds of training, with a training time of about 108 h and an accuracy of 94.2%.
As shown in Figure 12, when the condition of asymmetric illumination and white noise less than σ = 0.15 was applied, the displacement analysis curve of the combined noise-resistance method fit well with the laser measurement curve, which could better reflect the actual displacement situation and had better noise immunity and robustness. Under the condition of white noise of σ = 0.2, the displacement analysis curve of the combined noise-resistance method had a large difference from the laser measurement curve.
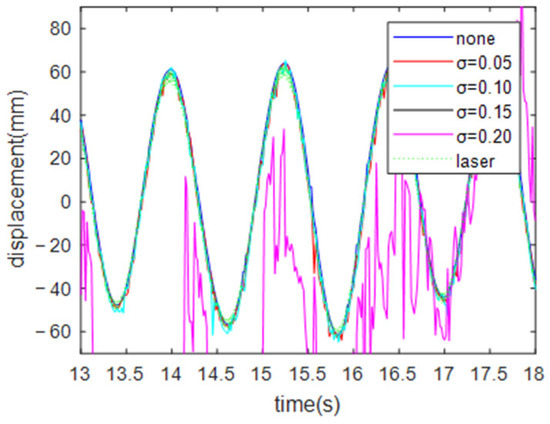
Figure 12.
Comparison of displacement identification results under different white noise.
The results of the quantitative analysis are shown in Table 3. With the increase in noise intensity, Emae and Emse of the combined noise-resistance method gradually increased, and σ5 and σ10 gradually decreased. Under the condition of white noise with a variance less than 0.15, the variation of error indicators was small, and the accuracy of displacement monitoring results could be guaranteed; compared with the CNN method, the error metrics were not significantly different. Still, the CNN method required a longer time for network training using dedicated equipment, which must remove the noise from the whole sample before performing displacement recognition. Thus, the CNN method could not display the results promptly, and the time parameters are not included in Table 3.

Table 3.
Error indicators (performance).
However, the error increased substantially, and the monitoring accuracy decreased when the white noise variance reached 0.2, which was due to the large amount of interference noise superimposed near the corner points, and the real corner points would be mistakenly deleted when the combined noise-resistance method was used. However, the use of the CNN method could avoid such problems.
5. Conclusions
In this study, a computer vision monitoring method based on the region of interest (ROI) was implemented for target-free and long-range transmission tower structure displacement monitoring. Meanwhile, the noise-removal characteristics of a subpixel corner point, expansion + corrosion, and histogram equalization methods were analyzed, and a combined noise-resistance method was proposed, which had the following advantages through experiments and results analysis.
(1) The subpixel corner point method could reduce the recognition error caused by pseudo corner points. The expansion + erosion method could improve the accuracy of displacement recognition. The histogram equalization method could effectively reduce the displacement recognition error caused by uneven illumination and improve recognition accuracy.
(2) The combined noise-resistance method had better recognition accuracy, better noise immunity, and robustness in the complex noise environments of asymmetric illumination superimposed on white noise, which also had higher applicability in the use of the ROI key point method for transmission towers based on computer vision.
Author Contributions
Conceptualization, K.Z. and C.S.; methodology, K.Z.; software, J.L.; validation, Y.L.; formal analysis, K.Z.; investigation, K.Z.; resources, K.Z.; data curation, K.Z.; writing—original draft preparation, K.Z. and L.Z.; writing—review and editing, L.Z.; visualization, K.Z.; supervision, Y.L.; project administration, K.Z. All authors have read and agreed to the published version of the manuscript.
Funding
This research received no external funding.
Data Availability Statement
Not applicable.
Conflicts of Interest
The authors declare no conflict of interest.
References
- Fei, Q.; Zhou, H.; Han, X.; Wang, J. Structural health monitoring ori ented stability and dynamic analysis of a long-span transmission tower-line system. Eng. Fail. Anal. 2012, 20, 80–87. [Google Scholar] [CrossRef]
- Cao, S. Damage Analysis of Transmission Tower Based on Structural Health Monitoring System. Master’s Thesis, North China Electric Power University (Beijing), Beijing, China, 2016. [Google Scholar]
- Zhang, S. Identification and Application of Vibration Displacement Response of Transmission Tower Structure Based on Central Frame Difference Method. Master’s Thesis, Northeast Forestry University, Harbin, China, 2021. [Google Scholar]
- Ye, X.W.; Dong, C.Z.; Liu, T. A Review of Machine Vision-Based Structural Health Monitoring, Methodologies and Applications. J. Sens. 2016, 2016, 7103039. [Google Scholar] [CrossRef]
- Sabato, A.; Niezrecki, C.; Fortino, G. Wireless MEMS-Based Accelerometer Sensor Boards for Structural Vibration Monitoring, A Review. IEEE Sens. J. 2017, 17, 226–235. [Google Scholar] [CrossRef]
- Kim, H.; Sim, S.H.; Spencer, B.F. Automated concrete crack evaluation using stereo vision with two different focal lengths. Autom. Constr. 2022, 135, 104136. [Google Scholar] [CrossRef]
- Huang, Y.; Zhang, H.; Li, H.; Wu, S. Recovering compressed images for automatic crack segmentation using generative models. Mech. Syst. Signal Process. 2021, 146, 107061. [Google Scholar] [CrossRef]
- Wang, F.; Liu, Y. A mechanism-based simulation algorithm for crack propagation in non-uniform geomaterials. Comput. Geotech. 2022, 151, 104994. [Google Scholar] [CrossRef]
- Satoshi, S.; Keiichi, A.B. Topological structural analysis of digitized binary images by border following. Comput. Vis. Graph. Image Process. 1985, 30, 32–46. [Google Scholar]
- Gueguen, L.; Pesaresi, M. Multi scale Harris corner detector based on Differential Morphological Decomposition. Pattern Recognit. Lett. 2011, 32, 1714–1719. [Google Scholar] [CrossRef]
- Ming, Y.; Huang, Y.; Liu, G. Simulation of Video Image Subpixel Corner Detection Based on Iterative Correction. Comput. Simul. 2021, 38, 450–453. [Google Scholar]
- Qi, X. Application Research on Uncertain Information for Image Noise Processing. Ph.D. Thesis, Shandong University, Jinan, China, 2018. [Google Scholar]
- Yan, H.; Deng, X. Application of median filter in digital image denoising. Comput. Era 2020, 2, 47–49. [Google Scholar]
- Zhao, B.; Zhang, L.; Pan, Z.; Wang, R.; Guo, Y. Comparation of OpenCV-based Image Filtering Methods. China Comput. Commun. 2020, 32, 78–80. [Google Scholar]
- Liu, Q. Research on Denoising, Sharping and Color Enhancement about Digital Image Enhancement. Ph.D. Thesis, Zhejiang University, Hangzhou, China, 2016. [Google Scholar]
- Deng, Z.; Huang, Y. Fast algorithm of dilation and erosion for binary image. Comput. Eng. Appl. 2017, 53, 207–211. [Google Scholar]
- Tian, Q. Research on Image Denoising Based on Deep Learning. Master’s Thesis, Changchun University of Science and Technology, Changchun, China, 2021. [Google Scholar]
- Chen, Y. Gray Image Histogram Equalization Processing Research. Master’s Thesis, Anhui University, Hefei, China, 2014. [Google Scholar]
- Zhang, C. Image Denoising Research under Extremely Low Light Scenes. Master’s Thesis, Zhejiang University, Hangzhou, China, 2020. [Google Scholar]
- Bi, X.; Qiu, Y.; Xiao, B.; Li, W.; Ma, J. Histogram Equalization Detection Based on Statistical Features in Digital Image. Chin. J. Comput. 2021, 44, 292–303. [Google Scholar]
- Li, Z.; Che, W.; Qian, M.; Xu, X. An Improved Image Defogging Algorithm Based on Histogram Equalization. Henan Sci. 2021, 39, 1–6. [Google Scholar]
- Huang, W.; Hu, X. An Improved Calibration Algorithm of Monocular Camera Based on Zhang’s Plane Calibration Method. Navig. Control 2019, 18, 105–111. [Google Scholar]
Disclaimer/Publisher’s Note: The statements, opinions and data contained in all publications are solely those of the individual author(s) and contributor(s) and not of MDPI and/or the editor(s). MDPI and/or the editor(s) disclaim responsibility for any injury to people or property resulting from any ideas, methods, instructions or products referred to in the content. |
© 2023 by the authors. Licensee MDPI, Basel, Switzerland. This article is an open access article distributed under the terms and conditions of the Creative Commons Attribution (CC BY) license (https://creativecommons.org/licenses/by/4.0/).